extending the capacity of the power grid - cir strategy
TRANSCRIPT

Part of the portfolio
Extending the capacity of the Power Grid
5th Annual Smart Grids & Cleanpower 2013 Conference 5 June 2013 Cambridge
www.cir-strategy.com/events/cleanpower
Martin Ansell Chairman & CEO: Fault Current Limited

Part of the portfolio
The challenge
• Renewable energy targets
• Utility’s statutory responsibility
• Preserve quality of supply • Minimize disruptive impact
• Connection constraints
• Grid design limits • Costly upgrades • Unnecessarily replace network assets
• Renewable energy schemes: financial viability

Part of the portfolio
Power Grid complexity

Part of the portfolio
Generation dynamic
Analysis of renewables growth to 2020 Restricted – Commercial AEA/ED45872/Issue 1
6 AEA
Central estimate Table 2.1: Breakdown of UK renewable energy production 2005 – 2009 and forward projection to 2020 - central estimate Central projectionEnergy production (GWh) 2005 2006 2007 2008 2009 2010-12 2013-14 2015-16 2017-18 2019-20ElectricityOnshore wind 3,196 3,904 4,928 6,670 7,483 13,159 19,545 26,641 31,844 35,156Technology: Offshore Wind 656 932 1,239 1,833 2,109 11,191 18,396 27,594 39,858 56,721Biomass electricity 3,891 4,157 4,301 4,211 4,487 8,354 18,049 22,577 26,353 27,245Electricity from MSW and C&I waste 2,041 2,043 2,043 2,369 2,369 3,723 4,468 4,765 4,765 4,765Landfill Gas 4,477 4,688 4,931 4,973 5,170 5,311 5,147 4,818 4,490 4,205Solar PV 8 11 13 17 20 24 29 41 62 107Tidal stream 0 0 0 0 3 6 14 98 603 1,079Hydropower 4,865 4,910 4,943 5,282 5,357 5,478 5,575 5,672 5,769 5,867Wave power 1 1 1 1 1 2 5 31 189 485Deep Geothermal electricity (CHP) 0 0 0 0 0 0 74 74 74 74HeatSolar Thermal 370 457 566 704 880 1,171 1,417 1,715 2,075 2,510Air Source Heat Pumps 0 0 0 111 244 795 2,090 4,326 8,169 14,753Ground Source Heat Pumps 0 0 0 489 1,162 841 2,183 4,988 7,868 10,813Biomass boilers (heat) 5,178 5,629 6,181 6,914 7,607 8,827 10,985 14,082 17,498 23,387Energy from waste - heat 829 617 574 543 444 839 1,144 1,543 1,958 2,349Biomass district heating 112 225 345 492 619 1,728 2,908 4,133 6,056 8,126Biogas injection into gas grid 0 0 0 0 0 560 1,734 3,227 4,646 5,937Deep geothermal heat (with CHP) 9 9 9 9 9 9 596 596 587 587TransportFirst generation biofuels 822 2,216 4,303 9,903 12,105 19,145 25,812 29,454 34,363 39,272Second generation biofuels 0 0 0 0 0 0 0 0 0 0Biomethane to transport 0 0 0 0 0 0 96 267 480 676Electric Cars 0 0 0 0 2 31 72 132 245 544
Totals 26,456 29,798 34,377 44,522 50,072 81,192 120,339 156,774 197,953 244,658
Annual output at the end of the stated year/period
Figure 2.2: Breakdown of UK renewable energy production 2005 – 2009 and forward projection to 2020 - central estimate
0
50,000
100,000
150,000
200,000
250,000
2005 2006 2007 2008 2009 2010 2011 2012 2013 2014 2015 2016 2017 2018 2019 2020
Ren
ewab
le E
nerg
y Pr
oduc
tion
(GW
h)Historic and projected energy production to 2020 - central estimate
Electric Cars
Biomethane to transport
Second generation biofuels
First generation biofuels
Deep geothermal heat
Biogas injection into gas grid
Biomass district heating
Energy from waste - heat
Biomass boilers (heat)
Ground Source Heat Pumps
Air Source Heat Pumps
Solar Thermal
Wave power
Hydropower
Tidal stream
Solar PV
Landfill Gas
Electricity from waste
Biomass electricity
Offshore Wind
Onshore wind
*Analysis of Renewables Growth to 2020: AEA Technology report to DECC

Part of the portfolio
What is a fault?
A fault is any abnormal (unplanned for) flow of electric current
• Power systems are designed to accommodate a maximum fault current
• Circuit breakers and protection systems isolate faults, limiting loss of service and network equipment damage
• Addition of new power sources changes a power system’s characteristics
• increasing the maximum fault current, beyond the system design limits

Part of the portfolio
Fault Current Limiter
A FCL limits the maximum level of a fault current when a fault occurs….allowing the existing power system protection
equipment to safely isolate the fault
)DXOW�&XUUHQW�/LPLWHUV
6XSHUFRQGXFWLQJ�6ROLG�VWDWH�3RZHU�(TXLSPHQW
Office of Electricity Delivery and Energy Reliability
www.oe.energy.gov
Office of Electricity Delivery and Energy Reliability, OE-1 U.S. Department of Energy – 1000 Independence Avenue, SW – Washington, DC 20585
Plugging America Into the Future of Power
WHAT ARE FCLS?A fault is an unintentional short circuit, or partial short-circuit, in an electric circuit. A variety of factors such as lightning, downed power lines, or crossed power lines cause faults. During a fault, excessive current—called fault current— flows through the electrical system often resulting in a failure of one section of that system by causing a tripped circuit breaker or a blown fuse. A fault current limiter (FCL) limits the amount of current flow-ing through the system and allows for the continual, uninterrupted operation of the electrical system, similar to the way surge protectors limit damaging currents to house-hold devices. Currently, two broad categories of FCL technologies exist: high-temperature superconducting and solid-state.
WHY DO WE NEED FCLS?The need for FCLs is driven by rising system fault current levels as energy demand increases and more distributed generation and clean energy sources, such as wind and solar, are added to an already overburdened system. Currently, explosive fault-limiting fuses are utilized to limit fault current, but they require a service call to replace the fuse after it blows and they are only available for voltages below 35 kV. Series reactors are also used but they have constant high reactive losses, are bulky, and contribute to grid voltage drops. FCLs overcome these weaknesses. Additionally, rising fault current levels increase the need for larger and often costly high imped-ance transformers. However, in contrast to these transform-ers, FCLs operate with little to no impedance during normal operation which allows for a more stable system.
WHAT ARE THE BENEFITS TO UTILITIES?FCLs offer numerous benefits to electric utilities. For in-stance, utilities spend millions of dollars each year to main-tain and protect the grid from potentially destructive fault currents. These large currents can damage or degrade circuit breakers and other expensive T&D system components. Utilities can reduce or eliminate these replacement costs by installing FCLs. Other benefits include:
� Enhanced system safety, stability, and efficiency of the power delivery systems
� Reduced or eliminated wide-area blackouts, reduced localized disruptions, and increased recovery time when disruptions do occur
� Reduced maintenance costs by protecting expensive downstream T&D system equipment from constant electrical surges that degrade equipment and require costly replacement
� Improved system reliability when renewables and DG are added to the electric grid
� Elimination of split buses and opening bus-tie breakers
� Reduced voltage dips caused by high resistive system components
� Single to multiple shot (fault) protection plus automatic resetting
Phone: 202-586-1411
'XULQJ�D�JURXQG�IDXOW��DQ�)&/�VDIHO\�PLWLJDWHV�WKH�H[FHVV�HQHUJ\�WKDW�ZRXOG�QRUPDOO\�HIIHFW�XWLOLW\�WUDQVPLVVLRQ�DQG�GLVWULEXWLRQ�HTXLSPHQW��SUHYHQWLQJ�GDPDJH�
TYPES OF FAULT CURRENT LIMITERS
� High-temperature superconducting (HTS) FCLs use superconducting-based material and reduce fault currents by introducing a larger-than-normal impedance into the path of the fault current.
� Solid-state FCLs use high-speed solid-state switching devices to rapidly insert an energy absorbing impedance into the circuit to limit the fault current.
FCLs are a supporting technology in the Smart Grid.
Transparent
Active
Part of the portfolio
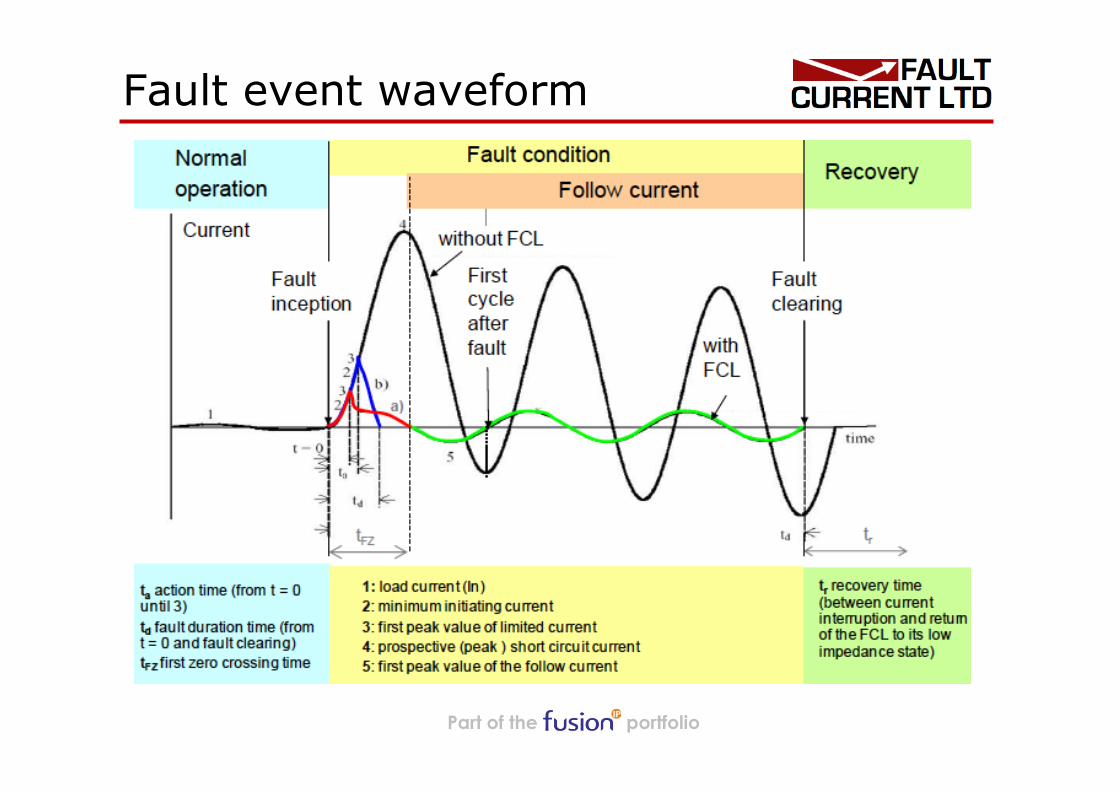
Fault event waveform

Part of the portfolio
Fault limiting methods

Part of the portfolio
FCL technologies Superconductors FC Limited
Current dependent inductor
No Cryostat
Low heating losses
Passive system
Cryogenic = Operational Cost Passive Autonomous
System
No Overheads Electronic control = Operational Cost
Power supplies = Operational Cost
DC bias Ferromagnetic
DC bias keeps core in
saturation
Variable impedance
Heating losses
DC Magnet

Part of the portfolio
Applications & benefits
• Network ‘Meshing”: Improving network reliability
• Bus coupling: Increasing operational flexibility
• Employing lower rated equipment: Reducing network impedance
• Reducing voltage sags: Improve power quality
• Power generation feeders: Enabling renewable energy connection
• Defer capital expenditure: Extending useful life of existing network assets

Part of the portfolio
Market potential • FCLs identified as ‘technology most
likely to realise significant value from public sector innovation support’*
• UK Deployment estimates* • 296 – 406 units by 2020 • 1182 – 1625 units by 2050
• More than 21 SCFCL trials across the globe • UK, Germany, China, Japan, Korea,
Spain, USA…..
*Reference: Technology Innovation Needs Assessment: August 2012
Part of the portfolio
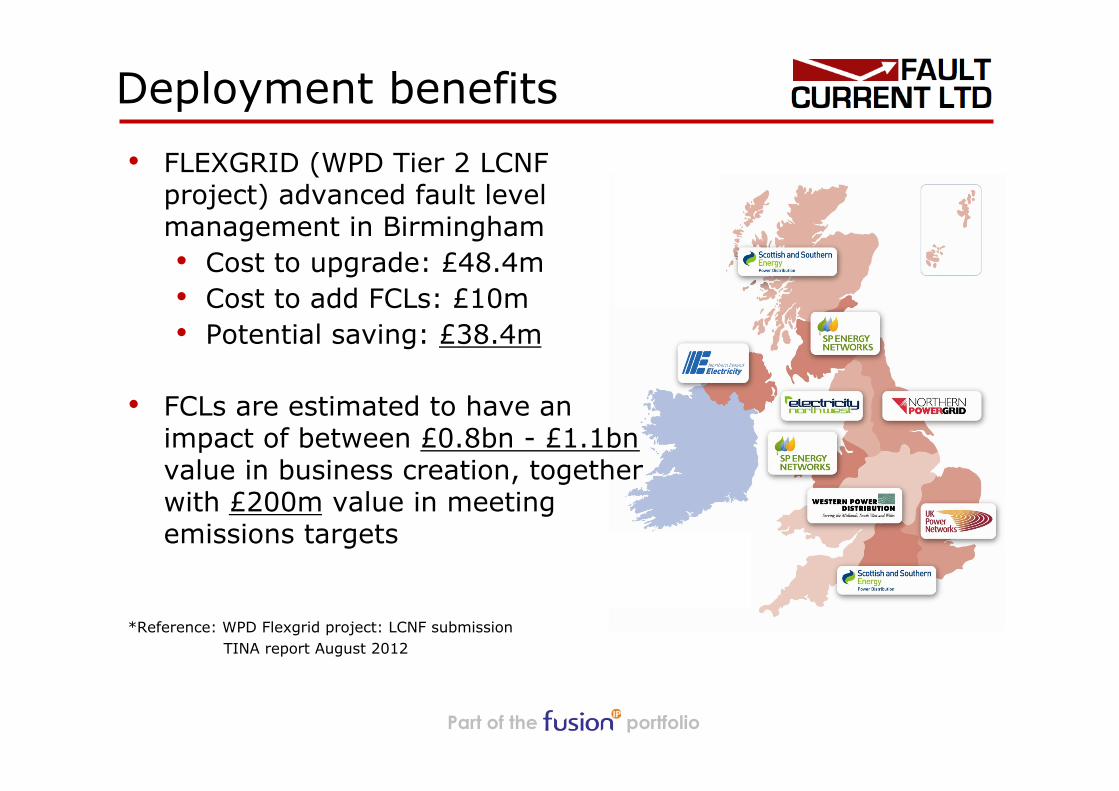
Deployment benefits • FLEXGRID (WPD Tier 2 LCNF
project) advanced fault level management in Birmingham • Cost to upgrade: £48.4m • Cost to add FCLs: £10m • Potential saving: £38.4m
• FCLs are estimated to have an
impact of between £0.8bn - £1.1bn value in business creation, together with £200m value in meeting emissions targets
*Reference: WPD Flexgrid project: LCNF submission TINA report August 2012

Part of the portfolio
Fit & Forget ‘Ideal’ Fault Current Limiter characteristics
ü Lower Capital Costs: compared with replacing network assets
ü Quick to install: single phase foot-print ü Performance criteria met (reliability & longevity) ü Negligible operations & maintenance costs ü No unusual health & safety issues ü Fail-safe

Part of the portfolio
Next generation FCL
Fault Current Limited
• Spin-off from Cardiff University (Wolfson Centre for
Magnetics):novel concept meets all ‘ideal’ criteria
• Backed by Fusion IP & IP Group
• DECC grant award to build demonstrator
• UK based manufacturing partners

Part of the portfolio
Extending the capacity of the Power Grid

Part of the portfolio
References
• WPD FLEXGRID project: LCNF Tier 2 submission
• Technology Innovation Needs Assessment (TINA): August
2012
• Analysis of Renewables Growth to 2020: AEA Technology
• Application and Feasibility of Fault Current Limiters in Power
Systems: CIGRE WG A3.23 – June 2012

Part of the portfolio
Extending the capacity of the Power Grid