extension and alarm analysis of neural...
TRANSCRIPT
EXTENSION AND ALARM ANALYSIS OF NEURAL NETWORK PREDICTION OF SEPARATION DISTANCE
IN AMASS SAFETY LOGIC
BY: NATTAVUDE THIRATHON
SUPERVISOR: DR. AMAR GUPTA
CO-DIRECTOR, PRODUCTIVITY FROM INFORMATION TECHNOLOGY INITIATIVE SLOAN SCHOOL OF MANAGEMENT
MAY 23, 2003
ADVANCED UNDERGRADUATE PROJECT
DEPARTMENT OF ELECTRICAL ENGINEERING AND COMPUTER SCIENCE
MASSACHUSETTS INSTITUTE OF TECHNOLOGY CAMBRIDGE MA 02139

i
ABSTRACT The Airport Movement Area Safety System (AMASS), currently deployed at major airports around the U.S., monitors aircrafts movement and predicts possible incursion. The incursion prediction involves linear prediction of separation distances between a pair of aircrafts. A careful safety algorithm uses this prediction, airport configuration, and other environment factors, to determine if incursion is likely and to warn air traffic controllers to perform corrective measures. However, the linear prediction is inaccurate, and thus the safety algorithm generates too many false alarms. We investigate the uses of neural network as an estimation tool in place of the linear prediction. Previous work has shown that estimation of separation distances at ten seconds in the future by a neural network is more accurate than the existing linear prediction. This paper investigate the possibility of using neural networks to shorten the lead time, the time since the system gives alarming message until the time incursion occurs. A new neural network is optimized to estimate separation distances at 5, 10, 15, 20, 25, and 30 seconds in the future. The results show that, although the neural network significantly reduces the number of false alarms, it does not alarm in real alarm situation. This is an unacceptable condition as the cost of not detecting real incursion involves hundreds of human lives. The current development of using neural networks to estimate the positions of an aircraft instead of separation distances is more promising and is also discussed.

ii
TABLE OF CONTENTS 1. INTRODUCTION............................................................................................................................... 1 2. BACKGROUND ................................................................................................................................. 1
2.1. AMASS OPERATIONS .................................................................................................................. 1 2.2. NEURAL NETWORKS .................................................................................................................... 2 2.3. PREVIOUS WORK.......................................................................................................................... 4
3. DESIGN CRITERIA .......................................................................................................................... 5 3.1. NEURAL NETWORK TOPOLOGY.................................................................................................... 5 3.2. PERFORMANCE METRICS.............................................................................................................. 5
4. PROCEDURES................................................................................................................................... 6 4.1. DATA EXTRACTION ...................................................................................................................... 6 4.2. TRAINING OF NEURAL NETWORK................................................................................................. 8
5. RESULTS AND DISCUSSION ......................................................................................................... 8 5.1. PERFORMANCE EVALUATION OF NEURAL NETWORK PREDICTION............................................... 8 5.2. ALARMS ANALYSIS ...................................................................................................................... 9
6. CURRENT DEVELOPMENT – POSITION PREDICTION....................................................... 11 7. CONCLUSION ................................................................................................................................. 12 REFERENCES ........................................................................................................................................... 13 APPENDIX 1: NNOUTPUT.TXT FORMAT.......................................................................................... 14 APPENDIX 2: MATLAB CODES............................................................................................................ 16
iii
LIST OF FIGURES Figure 1: AMASS System [1]............................................................................................. 2 Figure 2: Artificial Neuron [2][3] ....................................................................................... 3 Figure 3: Layers of Artificial Neurons [2][3] ..................................................................... 3 Figure 4: Topology of Neural Network in the Previous Phase........................................... 4 Figure 5: New Neural Network Topology .......................................................................... 5 Figure 6: Extraction of Aircraft-pair Coordinate in Events ................................................ 7 Figure 7: Extraction of Neural Network Input-Output from Aircraft-pair Coordinates ..... 7 Figure 8: Lander-behind-lander Event at 02:35:15 Aug 21, 2001.................................... 10 Figure 9: Prediction for Lander-behind-lander Event at 02:35:15 Aug 21, 2001............. 10

iv
LIST OF TABLES Table 1: Numbers of Extracted Data Set ............................................................................ 7 Table 2: Neural Network Prediction Error.......................................................................... 8 Table 3: Detection and False Alarm Probability of Linear Prediction ............................... 9 Table 4: Detection and False Alarm Probability of Neural Network ................................. 9 Table 5: Linear and Neural Network Prediction at 02:35:31, Aug 21, 2001.................... 11 Table 6: NNOUTPUT.TXT Format ................................................................................. 14

1
1. INTRODUCTION The Airport Movement Area Safety System (AMASS) is an airport ground safety system currently operating at major airports around the U.S. It was developed by Northrop Grumman Norden Systems (NGNS) and Dimensions International (DI) under contract with the Federal Aviation Administration (FAA). AMASS includes radar systems, processor units, and interface with air traffic controllers. Its operation is to monitor aircrafts in the vicinity of airport. The radar systems detect aircrafts and feeds into the processor unit with aircraft data. Among these data are the aircraft positions, velocities, and accelerations, which are processed to predict possible aircrafts incursion. The incursion alarm is shown to the air traffic controllers, who direct pilots to perform corrective measures.
The current version of AMASS generates many alarms, most of which are false alarms – not a real threat. False alarms are sometimes called nuisance alarms as they distract the air traffic controller from the real alarms. The prediction of alarm situation in AMASS involves linear prediction of separation distances between two aircrafts. This linear prediction is not accurate. It does not take in to account the behavior of pilots or the characteristics of the aircrafts. Researchers at Volpe National Transportation Systems Center and Massachusetts Institute of Technology discovered that neural networks potentially work better than linear prediction and hence reduce the number of false alarms.
In the previous phase of the project, we accomplished in using neural network to predict separation distances at ten seconds in the future. The neural network predictions are more accurate than the existing linear prediction. This document explains the extension of this neural network. The new neural network is capable of predicting separation distances at 5, 10, 15, 20, 25 and 30 seconds in the future. However, after analyses of alarm situations, this neural network lacks capability of predicting real alarms. This contingency leads to current development on position prediction as opposed to separation distance prediction.
2. BACKGROUND
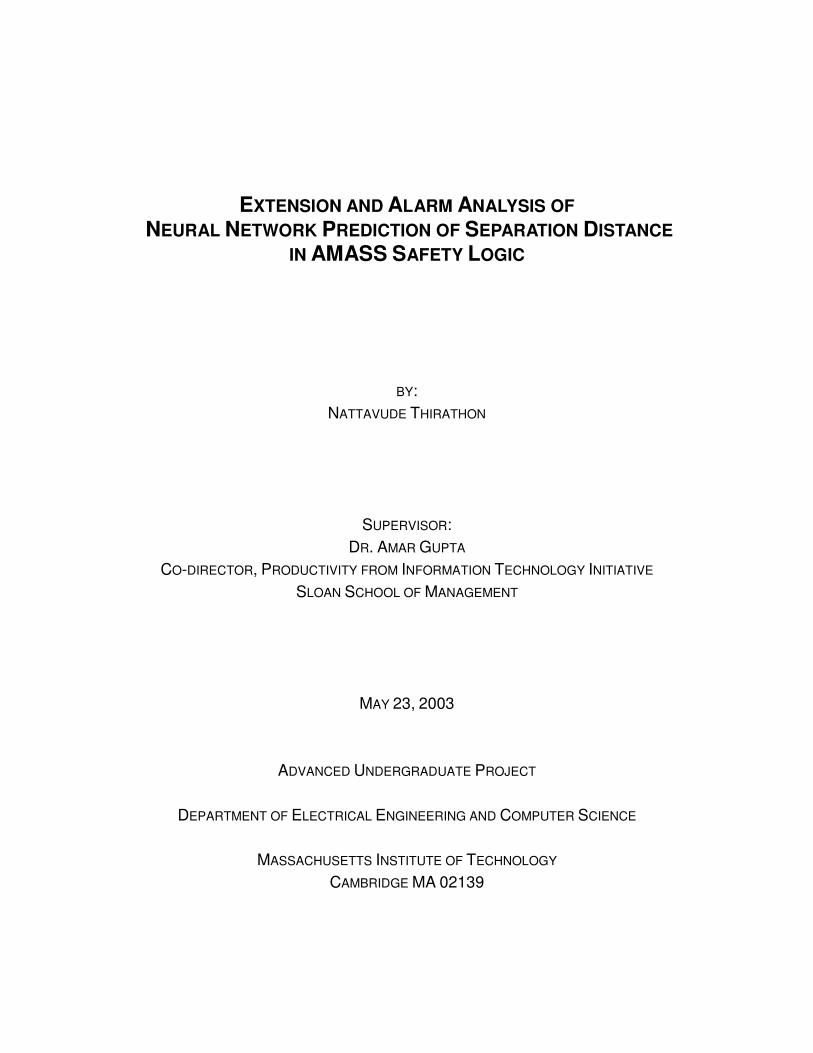
2.1. AMASS Operations AMASS system composes of several modules as shown in Figure 1. Airport Surface Detection Equipment radar (ASDE-3), Airport Surface Radar (ASR-9), and Automated Terminal Radar System (ARTS, not shown), monitor the position data of aircrafts. ASDE-3 monitors aircrafts in shorter ranges, mostly when aircrafts are on grounded, landing, and taking off. ASR-9 and ARTS monitor in wider range and feed data into Terminal Automation Interface Unit (TAIU) providing AMASS with airborne target information. AMASS cabinet presents to the controller graphical aircrafts information and text alerts and depicted in upper right corner of Figure 1.
2
Figure 1: AMASS System �[1]
The AMASS cabinet also uses aircrafts positions data to predict possible incursion. Positions data of all aircrafts are filtered by a safety algorithm which pairs up any two aircrafts that may involve in incursion. The current and past positions of each pair of aircrafts then are used to predict future separation distances between the two aircrafts. This predicted separation distances, past data, weather data, and airport configuration, are then passed through a safety cell to determine whether incursion is likely and to generate alarms.
2.2. Neural Networks Artificial neural networks or neural networks (NN) model the behaviors of biological nervous system. An NN consists of a collection of neural network nodes that are analogous to biological neurons. These nodes are interconnected with weighted connections that are analogous to synapses. Figure 2 illustrates a neural network node or neuron. The input x0 to xn are weighted by weighted interconnections w0 to wn and are fed into the processing element. The processing element usually sums the weighted inputs and processes such sum through some transfer functions to get the output. The output of the node may be fed as an input to another neuron or may be the output of the neural network.

3
Figure 2: Artificial Neuron �[2]�[3]
A neural network system consists of several layers of neurons as depicted in Figure 3. There are at least two layers – input layer and output layer. The neurons in input layer receive input from external environment and pass on to the hidden layers. The processing continues down the layers until the output layer is reached. The neurons in output layer then give out the output to the external environment. The interconnections between layers are usually all-to-all connections between each neuron in adjacent layers. In other words, each and all nodes in the previous layers are connected to all nodes in the next layer through weighted connections.
Figure 3: Layers of Artificial Neurons �[2]�[3]
Biological neurons systems exhibit learning by adjustment of synaptic connections between neurons. Neural networks model this learning behavior by similar fashion. Before a neural network is put to use, it is trained on a representative input-output data. Training algorithms feed these data into NN and adjust the interconnections properly. The quality of the trained neural network significantly depends on the quality of training data. The neural network generally performs well on the input data that are similar to those it is trained for. However, a good neural network must not be over fit, performing well only for training data. It must be generalized enough to perform well on similar but unseen data.
4
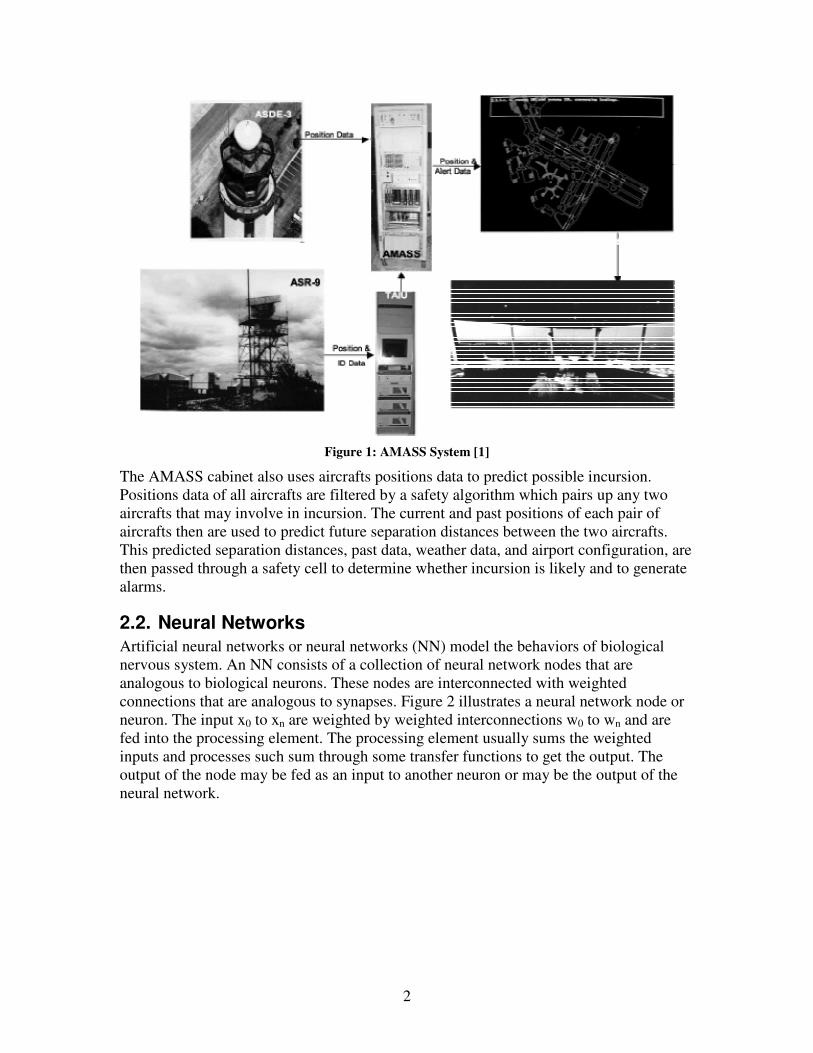
2.3. Previous Work The previous phase of this project has successfully modeled and trained neural networks to estimate separation distance between two aircrafts at 10 seconds in the future. Several topologies were explored. Figure 4 shows the topology of the final neural network. The inputs are the separation distances and separation velocities (changes in separation distances) at current time and four seconds in the past. The output of the network is estimated separation distances at 10 seconds in the future. The model parameters of this neural network are as follow �[1]:
• Network type: feed-forward backpropagation • Training algorithm: resilient backpropagation • Performance function: mean square error • Number of input nodes: 10 • Number of hidden nodes: 10 • Transfer function of hidden nodes: pure linear • Number of output nodes: 1
Figure 4: Topology of Neural Network in the Previous Phase
The neural network above has been verified to give better estimates of separation distances than the linear prediction �[1]. This is an accomplishment of our intermediate goal of verifying that neural network is a potentially better substitute for linear prediction. Our ultimate goal is, however, to increase the lead time of alarms before the real incursion and to decrease the false alarm rate. In order to investigate the possible increase in lead time, we need to extend the neural network to give out estimates of separation distances further into the future.
5
3. DESIGN CRITERIA
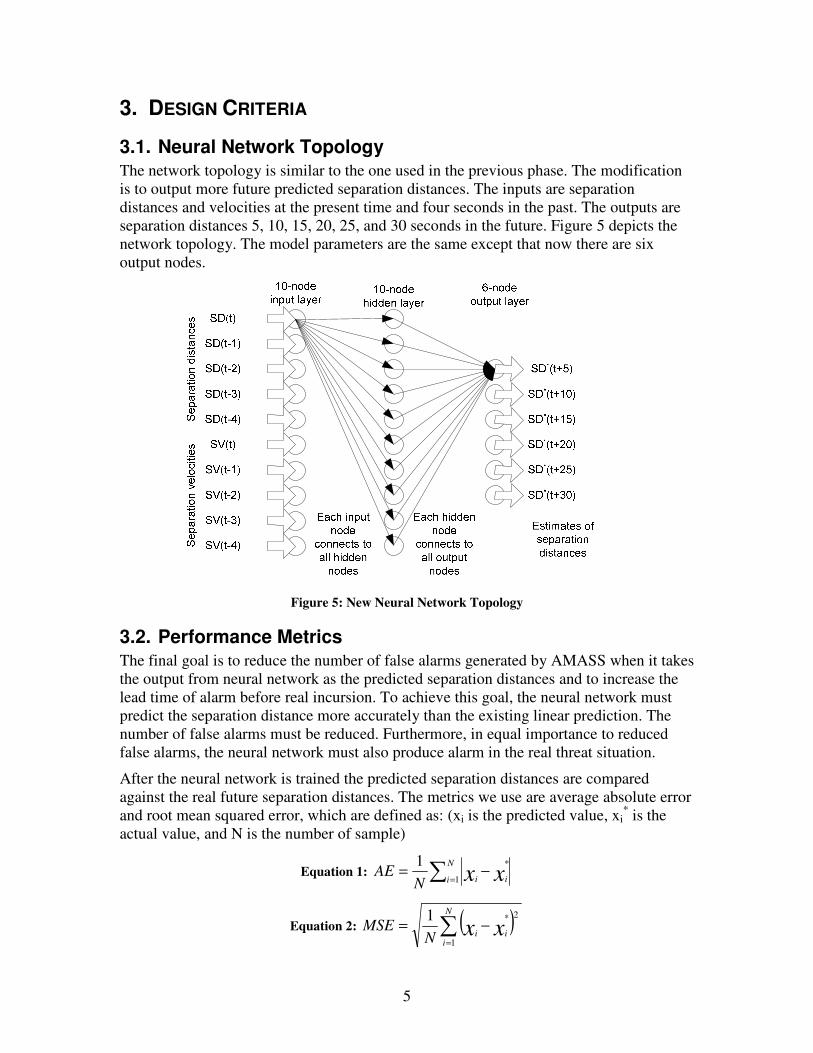
3.1. Neural Network Topology The network topology is similar to the one used in the previous phase. The modification is to output more future predicted separation distances. The inputs are separation distances and velocities at the present time and four seconds in the past. The outputs are separation distances 5, 10, 15, 20, 25, and 30 seconds in the future. Figure 5 depicts the network topology. The model parameters are the same except that now there are six output nodes.
Figure 5: New Neural Network Topology
3.2. Performance Metrics The final goal is to reduce the number of false alarms generated by AMASS when it takes the output from neural network as the predicted separation distances and to increase the lead time of alarm before real incursion. To achieve this goal, the neural network must predict the separation distance more accurately than the existing linear prediction. The number of false alarms must be reduced. Furthermore, in equal importance to reduced false alarms, the neural network must also produce alarm in the real threat situation.
After the neural network is trained the predicted separation distances are compared against the real future separation distances. The metrics we use are average absolute error and root mean squared error, which are defined as: (xi is the predicted value, xi
* is the actual value, and N is the number of sample)
Equation 1: � =−= N
i ii xxNAE
1
*1
Equation 2: ( )�=
−=N
iii xxN
MSE1
2*1

6
The configuration of the neural network is then saved and put into AMASS program. AMASS simulation of log files are performed again. The output from AMASS program contains information about alarms from both neural network and linear prediction. We count the number of events that each method gives alarms and compare using detection theory performance metrics – conditional detection probability and conditional false alarm probability �[4] defined as:
• Let E be all events • Let H1 be the valid alarm events and H0 be no-threat events. Note that H0 and H1
are disjoint and the union of the two equals to E. • Let A be the events that alarms are generated. • Then the detection and false alarm probability are defined as:
Equation 3: Detection Probability 1
1
HHA
Pd
∩=
Equation 4: False Alarm Probability 0
0
HHA
Pf
∩=
Generally, we would like high detection probability and low false alarm probability. However, this is not always possible as the two are usually related. The false alarms cost the air traffic controllers annoyance and distraction while the detection of real alarms are necessary to avoid loss of lives and property. We aim at reducing the false alarm probability while keeping detection probability as close to one as possible.
4. PROCEDURES All work in data extraction, neural network training, and performance evaluation are done in Matlab. The data that we use are from Chicago O’Hare International Airport (ORD).
4.1. Data Extraction The neural network must be trained by appropriate data in order to optimize its performance on unseen data. AMASS monitors all aircrafts in the airport but predicts separation distances only for certain pairs of aircrafts that meet its criteria, which is not obvious to us. Therefore, all the data the neural network will be trained on are only from these situations. AMASS records these situation in NNOUTPUT.TXT. The format of this file is given in Appendix 1: NNOUTPUT.TXT Format.
Figure 6 depicts the data extraction process. Matlab script extractFirstCordsv9.m extracts the coordinates of a pair of aircrafts at the moment AMASS starts prediction from NNOUTPUT.TXT. These coordinates are used to find the respective aircrafts data from the log file. A log file is first converted to a Matlab three-dimensional matrix by bigmat.m. Since the log file contains data of additional planes that we are not interested in, findEvent.m looks up the 3-d matrix by the first coordinate and finds respective aircraft ID. Then, extractEvent.m uses this aircraft ID to extract aircraft data from 10 seconds in the past to 50 seconds into the future from the log file. The results from extractEvent.m are coordinates of two aircrafts for some duration. The whole -10 to 50

7
seconds duration may not be achieved for some short events. getHistory.m expedites this process and concatenates all the events from a log file into single matrix.
Figure 6: Extraction of Aircraft-pair Coordinate in Events
All events from extractEvent.m are further converted to input-output for neural network. The input to the neural network is five seconds of separation distances and separations velocities, and the outputs are separation distance for 5, 10, 15, 20, 25, and 30 seconds in the future. A time window of 35 seconds slides through an event, collect aircrafts positions, and calculate separation distances. The separation distances at t-4, t-3,…, t are the inputs of the neural network, and separation distances at t+5, t+10,…, t+30 are the outputs. Figure 7 depicts the input-output extraction.
Figure 7: Extraction of Neural Network Input-Output from Aircraft-pair Coordinates
Input-output sets are divided into three groups of data: training, validation, and testing data sets. Training data sets are used to train the neural network. Validation data sets are also used in training. The purpose of validation set is to prevent neural network from being over-trained – perform especially well on the training data but fail on unseen data. Lastly, the testing data sets are used for performance evaluation. The ratio of numbers of input-output sets for training : validation : testing is roughly 50% : 25% : 25%. getTrainData_6out.m performs this extraction.
Using nine days of data – August 15 to 23, 2001 – from ORD, we extracted the numbers of data sets as shown in Table 1.
Table 1: Numbers of Extracted Data Set
Data Set Number of Input-Output Sets Training 6080 Validation 3006 Testing 3040

8
4.2. Training of Neural Network The training and validation data sets are used to train the neural network by the following commands: >> % Trin and Trout are training input-output data sets >> % Vin and Vout are validation input-output data sets >> % Neural network has 10 hidden nodes >> % Hidden and output layers transfer functions are pure linear >> % Training algorithm in Resilient Back Propagation >> net=newff(minmax(Trin),[10,1],{‘purelin’,’purelin’},’trainrp’); >> net.trainParam.show=10; % update training progress frequently >> net.trainParm.epochs=10000; % maximum epochs >> V.P=Vin; V.T=Vout; % validate data set >> net=train(net,Trin,Trout,[],[],V); % train the neural network
The trained network “net” is converted into a neural network description file for AMASS. AMASS is then ready to use this trained neural network to simulate its operations. We rerun AMASS with the newly trained network on four days of log data and collect new NNOUTPUT.TXT for comparative analysis between trained neural network and linear prediction.
5. RESULTS AND DISCUSSION
5.1. Performance Evaluation of Neural Network Prediction The testing data sets are immediately used to evaluate the performance of the neural network. These data sets are different from the training and validation sets, so they will test how the neural network fair on unseen data. We simulate the neural network using testing input data set by: >> % Tein and Teout are testing input-output data sets >> simout = sim(net,Tein); >> % compare between simout and Teout
The comparisons between simout and Teout are in term of average absolute error and root mean square error as defined earlier. Table 2 shows the errors for each of the six outputs from neural network.
Table 2: Neural Network Prediction Error
Seconds in the Future
Average Absolute Error (feet)
Root Mean Square Error (feet)
5 179.8 232.4 10 292.9 418.2 15 485.0 683.5 20 706.4 994.9 25 945.4 1321 30 1163 1622
9
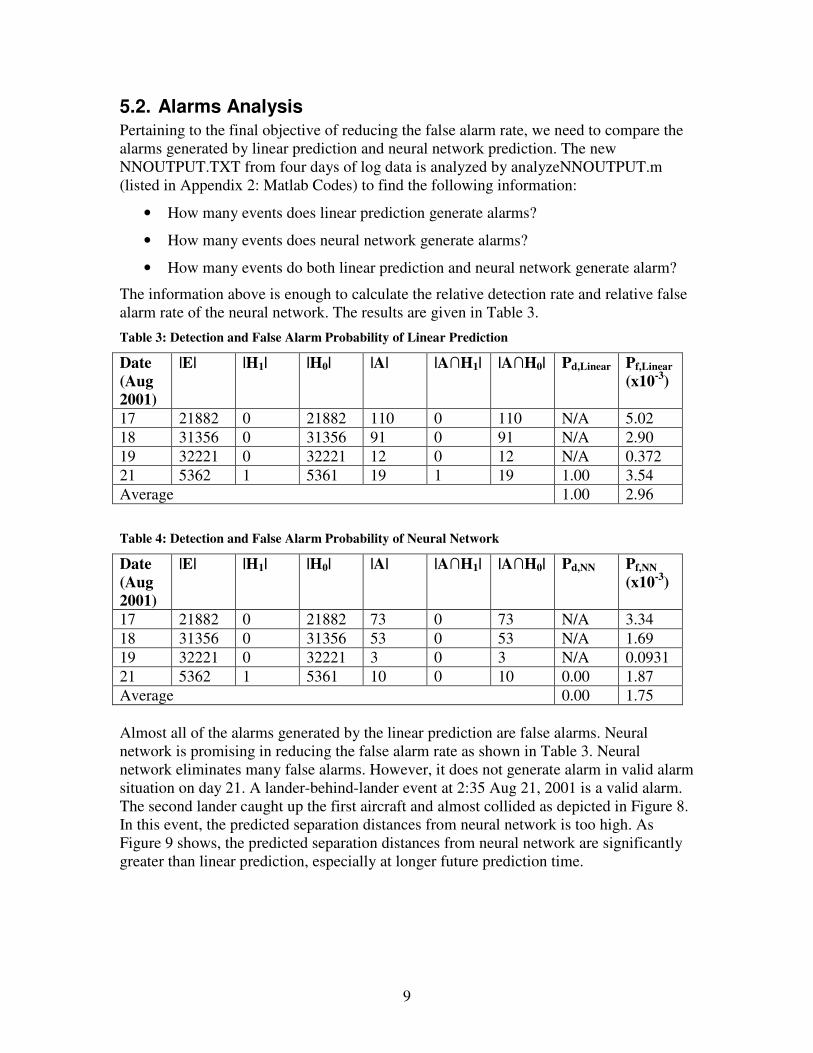
5.2. Alarms Analysis Pertaining to the final objective of reducing the false alarm rate, we need to compare the alarms generated by linear prediction and neural network prediction. The new NNOUTPUT.TXT from four days of log data is analyzed by analyzeNNOUTPUT.m (listed in Appendix 2: Matlab Codes) to find the following information:
• How many events does linear prediction generate alarms?
• How many events does neural network generate alarms?
• How many events do both linear prediction and neural network generate alarm?
The information above is enough to calculate the relative detection rate and relative false alarm rate of the neural network. The results are given in Table 3.
Table 3: Detection and False Alarm Probability of Linear Prediction
Date (Aug 2001)
|E| |H1| |H0| |A| |A�H1| |A�H0| Pd,Linear Pf,Linear (x10-3)
17 21882 0 21882 110 0 110 N/A 5.02 18 31356 0 31356 91 0 91 N/A 2.90 19 32221 0 32221 12 0 12 N/A 0.372 21 5362 1 5361 19 1 19 1.00 3.54 Average 1.00 2.96
Table 4: Detection and False Alarm Probability of Neural Network
Date (Aug 2001)
|E| |H1| |H0| |A| |A�H1| |A�H0| Pd,NN Pf,NN (x10-3)
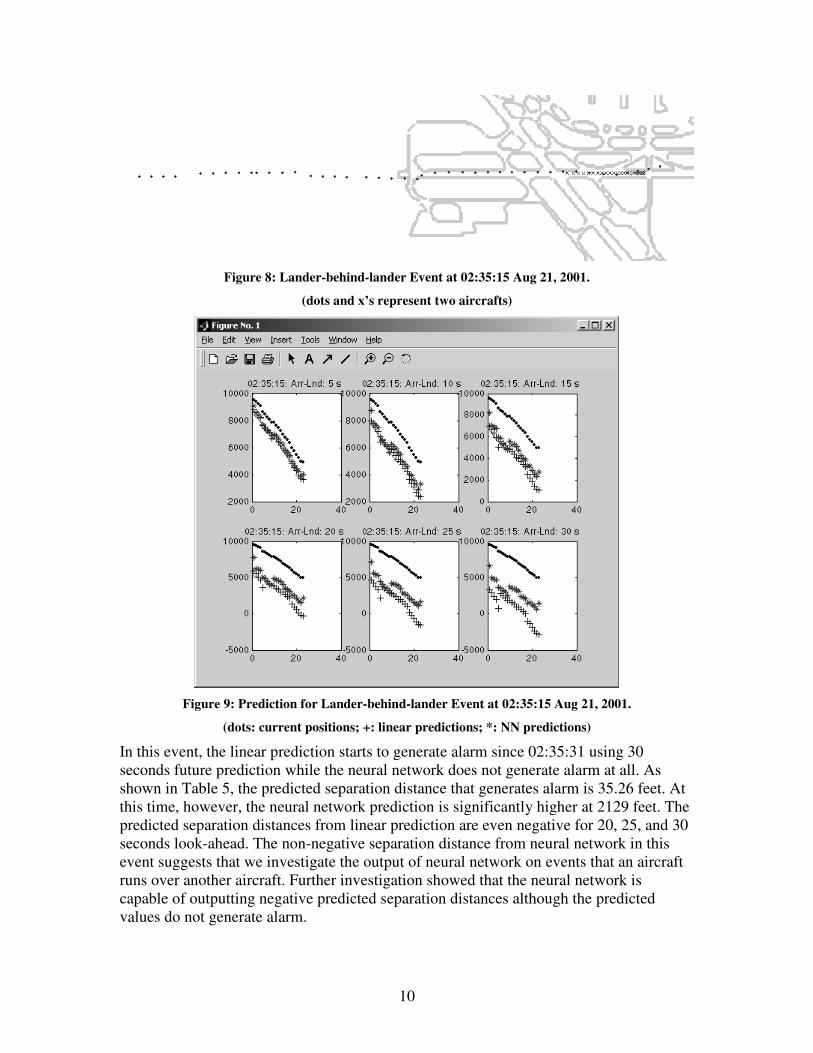
17 21882 0 21882 73 0 73 N/A 3.34 18 31356 0 31356 53 0 53 N/A 1.69 19 32221 0 32221 3 0 3 N/A 0.0931 21 5362 1 5361 10 0 10 0.00 1.87 Average 0.00 1.75 Almost all of the alarms generated by the linear prediction are false alarms. Neural network is promising in reducing the false alarm rate as shown in Table 3. Neural network eliminates many false alarms. However, it does not generate alarm in valid alarm situation on day 21. A lander-behind-lander event at 2:35 Aug 21, 2001 is a valid alarm. The second lander caught up the first aircraft and almost collided as depicted in Figure 8. In this event, the predicted separation distances from neural network is too high. As Figure 9 shows, the predicted separation distances from neural network are significantly greater than linear prediction, especially at longer future prediction time.
10
Figure 8: Lander-behind-lander Event at 02:35:15 Aug 21, 2001.
(dots and x’s represent two aircrafts)
Figure 9: Prediction for Lander-behind-lander Event at 02:35:15 Aug 21, 2001.
(dots: current positions; +: linear predictions; *: NN predictions)
In this event, the linear prediction starts to generate alarm since 02:35:31 using 30 seconds future prediction while the neural network does not generate alarm at all. As shown in Table 5, the predicted separation distance that generates alarm is 35.26 feet. At this time, however, the neural network prediction is significantly higher at 2129 feet. The predicted separation distances from linear prediction are even negative for 20, 25, and 30 seconds look-ahead. The non-negative separation distance from neural network in this event suggests that we investigate the output of neural network on events that an aircraft runs over another aircraft. Further investigation showed that the neural network is capable of outputting negative predicted separation distances although the predicted values do not generate alarm.

11
Table 5: Linear and Neural Network Prediction at 02:35:31, Aug 21, 2001.
Future Time (seconds) 5 10 15 20 25 30 Linear Prediction 5306.5 4252.3 3198 2143.8 1089.5 35.26 NN Prediction 5411.6 4557.2 3820.8 3114.3 2612.2 2129 As the cost of failure to alarm in a real threat situation is much greater than the cost of ignoring false alarms, we aimed that the neural network alarms must include all valid alarms. The inconsistency we found for the 02:35:15 event cannot be compromised and suggests that a subtle change must be done to the neural network topology.
6. CURRENT DEVELOPMENT – POSITION PREDICTION The performance of neural network depends on the data that we train it on. The failure in the real alarm event at 02:35:31 Aug 21, 2001, suggests that there are not enough training data for similar situations. As accidents relating aircrafts in airport vicinity are rare, we do not have much data for valid alarm situations to train. To accommodate this absence of representative data, we propose a neural network that predicts future position of aircraft instead of separation distances between a pair of aircraft. There are significantly more data for each track of aircraft path than data on aircraft-pairs that AMASS predicts separation distances as given in NNOUTPUT.TXT. Currently we are investigating several approaches in position prediction.
Position-predicting neural network is advantageous to separation distances-predicting neural network for the following reasons
• More relevant training data: The failure in separation distances prediction in real alarm situations roots from the limited available data on real alarm situations. Incursions are unfavorable, so pilots and air traffic controllers work efficiently to avoid any possible incursions. While the training data of separation distance predicting neural network come from only the events that AMASS predicts i.e. those recorded in NNOUTPUT.TXT, the training data for position-predicting neural network can come from all events.
• Overcome issues in “negative” separation distances: In an event that an aircraft runs over another aircraft, the linear prediction gives out negative values (see Figure 9). Since there are not enough similar events, the neural network performs badly on run-over events. The position-predicting neural network concerns only one aircraft, and it does not have any provision for separation distances. The estimate of future separation distances can be readily calculated from estimated future position by trigonometry. If we are able to train neural network to accurately model an aircraft behavior, the resulting future separation distances are likely to be more accurate in generating alarms.
Currently, we are investigating on configuration of the position-predicting neural network. These configurations include:
• Inputs: 1. Position (x, y) of an aircraft
12
2. Position (x, y) and velocity (vx, vy) of an aircraft 3. Velocity (vx, vy) of an aircraft
• Outputs: 1. Predicted position (x, y) of an aircraft at 5, 10, 15, 20, 25, and 30 seconds
in the future 2. Predicted changes in position of an aircraft. For example: �x30 is defined
x(t+30) – x(t). The predicted future x-position at 30 seconds in the future is then x(t)+ �x30.
• Transfer function: Currently, the investigation is only on pure linear transfer function.
• Training algorithm: Currently, the investigation is only on resilient backpropagation training algorithm.
In addition, we are investigating on different training data set. The performance of the neural network significantly depends on the relevance of training data. Therefore we need to filter the training data so that different characteristics of data are present in appropriate ratio. Investigation of log file shows that the majority of data are for low-speed aircrafts – those taxiing or stopping. Since the high-speed aircrafts are the one that involve in incursions, we experiment on filtering out some of the low-speed data. There are currently three filtering methods:
1. No filtering: all data are included. 2. Take all of the high-speed data, 50% of low-speed data, and none of the aircrafts
that are not in motion. 3. Take all of the high-speed data, none of no-motion data, and a proportion of
taxiing data that makes taxiing data 50% of total training data. All of the above dimensions are being investigated. The configuration of neural network and filtering of training data that yield the most accurate prediction of position will be selected to be trained on larger data sets. Later, integration into AMASS system will reveal the performance of position-predicting neural network in generating alarms.
7. CONCLUSION Neural networks are capable of predicting future separation distances more accurately than linear prediction being used in AMASS. The extension of making neural network predict separation distances further in the future considerably reduces the number of false alarms. However, the lack of representative real incursion data makes the neural network performs unacceptably for real incursion. No alarm is produced, and many lives are in danger. This leads us to a new approach in using neural network to estimate the future positions of aircrafts. Since the training data for position-predicting neural network are not limited to the aircraft-pairs that AMASS predicts separation distances, it is more likely that his neural network will closely model the behaviors of aircrafts. After the position-predicting neural network is optimized, alarm analyses will be done in similar manners, after which the true performances of this neural network will be apparent.

13
REFERENCES [1] “Neural Network-based Modeling and Simulation for the Optimization of AMASS Safety Logic v4.0”. Massachusetts Institute of Technology. 2003.
[2] Data & Analysis Center for Software, "Artificial Neural Networks Technology", 1992 (http://hem.hj.se/ ~de96klda/NeuralNetworks.htm, printed November 1998.
[3] Avelino J. Gonzalez and Douglas D. Dankel, "The Engineering of Knowledge-based Systems", 1993 Prentice-Hall Inc. ISBN 0-13-334293-X.
[4] Wornell G., Willsky A., and Shapiro J., “Stochastic Processes, Detection, and Estimation”, 6.432 Course Notes. Massachusetts Institute of Technology. 2002.
14
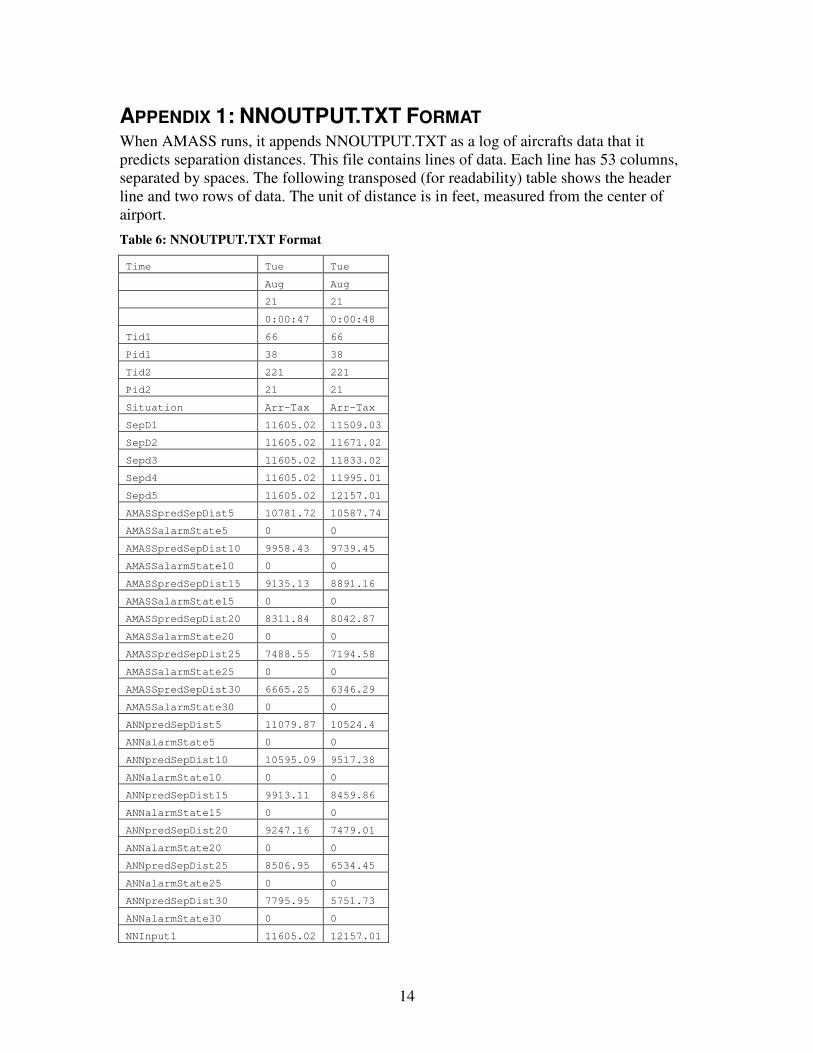
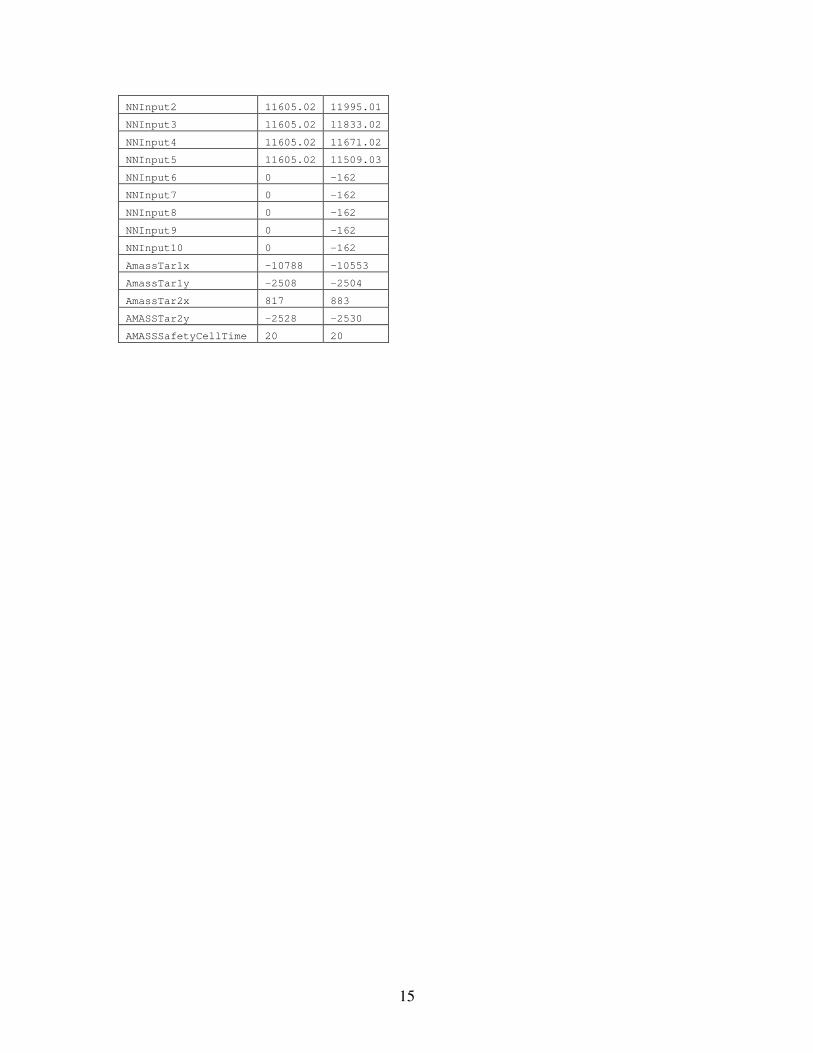
APPENDIX 1: NNOUTPUT.TXT FORMAT When AMASS runs, it appends NNOUTPUT.TXT as a log of aircrafts data that it predicts separation distances. This file contains lines of data. Each line has 53 columns, separated by spaces. The following transposed (for readability) table shows the header line and two rows of data. The unit of distance is in feet, measured from the center of airport.
Table 6: NNOUTPUT.TXT Format
Time Tue Tue
Aug Aug
21 21
0:00:47 0:00:48
Tid1 66 66
Pid1 38 38
Tid2 221 221
Pid2 21 21
Situation Arr-Tax Arr-Tax
SepD1 11605.02 11509.03
SepD2 11605.02 11671.02
Sepd3 11605.02 11833.02
Sepd4 11605.02 11995.01
Sepd5 11605.02 12157.01
AMASSpredSepDist5 10781.72 10587.74
AMASSalarmState5 0 0
AMASSpredSepDist10 9958.43 9739.45
AMASSalarmState10 0 0
AMASSpredSepDist15 9135.13 8891.16
AMASSalarmState15 0 0
AMASSpredSepDist20 8311.84 8042.87
AMASSalarmState20 0 0
AMASSpredSepDist25 7488.55 7194.58
AMASSalarmState25 0 0
AMASSpredSepDist30 6665.25 6346.29
AMASSalarmState30 0 0
ANNpredSepDist5 11079.87 10524.4
ANNalarmState5 0 0
ANNpredSepDist10 10595.09 9517.38
ANNalarmState10 0 0
ANNpredSepDist15 9913.11 8459.86
ANNalarmState15 0 0
ANNpredSepDist20 9247.16 7479.01
ANNalarmState20 0 0
ANNpredSepDist25 8506.95 6534.45
ANNalarmState25 0 0
ANNpredSepDist30 7795.95 5751.73
ANNalarmState30 0 0
NNInput1 11605.02 12157.01
15
NNInput2 11605.02 11995.01
NNInput3 11605.02 11833.02
NNInput4 11605.02 11671.02
NNInput5 11605.02 11509.03
NNInput6 0 -162
NNInput7 0 -162
NNInput8 0 -162
NNInput9 0 -162
NNInput10 0 -162
AmassTar1x -10788 -10553
AmassTar1y -2508 -2504
AmassTar2x 817 883
AMASSTar2y -2528 -2530
AMASSSafetyCellTime 20 20
16
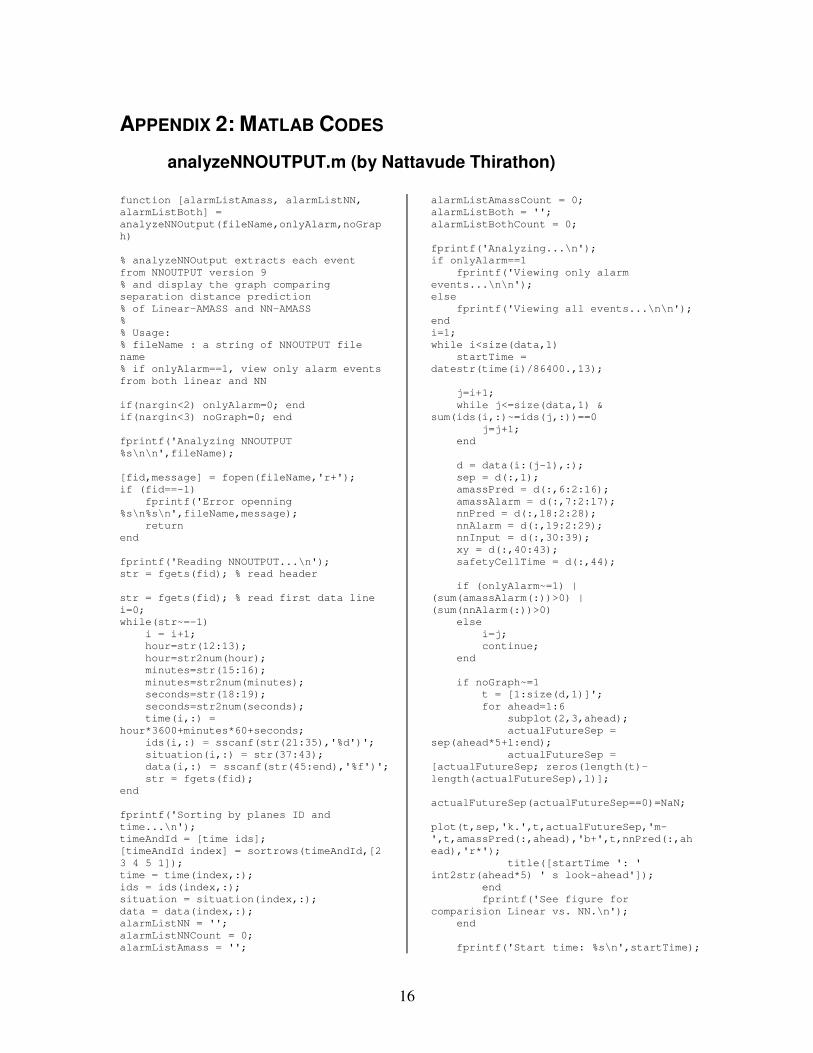
APPENDIX 2: MATLAB CODES
analyzeNNOUTPUT.m (by Nattavude Thirathon) function [alarmListAmass, alarmListNN, alarmListBoth] = analyzeNNOutput(fileName,onlyAlarm,noGraph) % analyzeNNOutput extracts each event from NNOUTPUT version 9 % and display the graph comparing separation distance prediction % of Linear-AMASS and NN-AMASS % % Usage: % fileName : a string of NNOUTPUT file name % if onlyAlarm==1, view only alarm events from both linear and NN if(nargin<2) onlyAlarm=0; end if(nargin<3) noGraph=0; end fprintf('Analyzing NNOUTPUT %s\n\n',fileName); [fid,message] = fopen(fileName,'r+'); if (fid==-1) fprintf('Error openning %s\n%s\n',fileName,message); return end fprintf('Reading NNOUTPUT...\n'); str = fgets(fid); % read header str = fgets(fid); % read first data line i=0; while(str~=-1) i = i+1; hour=str(12:13); hour=str2num(hour); minutes=str(15:16); minutes=str2num(minutes); seconds=str(18:19); seconds=str2num(seconds); time(i,:) = hour*3600+minutes*60+seconds; ids(i,:) = sscanf(str(21:35),'%d')'; situation(i,:) = str(37:43); data(i,:) = sscanf(str(45:end),'%f')'; str = fgets(fid); end fprintf('Sorting by planes ID and time...\n'); timeAndId = [time ids]; [timeAndId index] = sortrows(timeAndId,[2 3 4 5 1]); time = time(index,:); ids = ids(index,:); situation = situation(index,:); data = data(index,:); alarmListNN = ''; alarmListNNCount = 0; alarmListAmass = '';
alarmListAmassCount = 0; alarmListBoth = ''; alarmListBothCount = 0; fprintf('Analyzing...\n'); if onlyAlarm==1 fprintf('Viewing only alarm events...\n\n'); else fprintf('Viewing all events...\n\n'); end i=1; while i<size(data,1) startTime = datestr(time(i)/86400.,13); j=i+1; while j<=size(data,1) & sum(ids(i,:)~=ids(j,:))==0 j=j+1; end d = data(i:(j-1),:); sep = d(:,1); amassPred = d(:,6:2:16); amassAlarm = d(:,7:2:17); nnPred = d(:,18:2:28); nnAlarm = d(:,19:2:29); nnInput = d(:,30:39); xy = d(:,40:43); safetyCellTime = d(:,44); if (onlyAlarm~=1) | (sum(amassAlarm(:))>0) | (sum(nnAlarm(:))>0) else i=j; continue; end if noGraph~=1 t = [1:size(d,1)]'; for ahead=1:6 subplot(2,3,ahead); actualFutureSep = sep(ahead*5+1:end); actualFutureSep = [actualFutureSep; zeros(length(t)-length(actualFutureSep),1)]; actualFutureSep(actualFutureSep==0)=NaN; plot(t,sep,'k.',t,actualFutureSep,'m-',t,amassPred(:,ahead),'b+',t,nnPred(:,ahead),'r*'); title([startTime ': ' int2str(ahead*5) ' s look-ahead']); end fprintf('See figure for comparision Linear vs. NN.\n'); end fprintf('Start time: %s\n',startTime);

17
fprintf('Event duration: %d seconds\n',length(t)); fprintf('Situation (initially): %s\n',situation(i,:)); fprintf('TID1 = %5d PID2 = %5d\n',ids(i,1),ids(i,2)); fprintf('TID2 = %5d PID2 = %5d\n',ids(i,3),ids(i,4)); if sum(amassAlarm(:))>0 fprintf('AMASS ALERT!!!\n'); alarmListAmassCount = alarmListAmassCount + 1; alarmListAmass(alarmListAmassCount,:) = startTime; if sum(nnAlarm(:))>0 alarmListBothCount = alarmListBothCount + 1; alarmListBoth(alarmListBothCount,:) = startTime; end end if sum(nnAlarm(:))>0 fprintf('NN ALERT!!!\n'); alarmListNNCount = alarmListNNCount + 1; alarmListNN(alarmListNNCount,:) = startTime; end if noGraph~=1 keyIn = input('\nEnter to continue, "q" to quit, "d" to debug, "m" for movie:','s'); if keyIn=='q' break; elseif keyIn=='d' fprintf('Entering debug mode. Type "return" to exit debug mode.\n'); keyboard; elseif keyIn=='m' figure; airportmovie('ord3.png',xy(:,1:2),xy(:,3:4)); pause; end end i=j; end %%%%%%%%%%%%%%%%%%%%%%%%%%%%%%%%%%%% %% The version below doesn't know that AMASS may look at more than one pairs at a time, %% so lines in NNOUTPUT.TXT may interleave pairs.
%% Corrected version above sort entries by planes id. %% However, the output of the corrected version is not timely. return; while(str~=-1) time = str(1:19); ids = sscanf(str(21:35),'%d'); situation = str(37:43); data = sscanf(str(45:end),'%f')'; %nextIds = ids; while (str~=-1) % && (sum(nextIds~=ids)==0) str=fgets(fid); nextIds = sscanf(str(21:35),'%d'); if sum(nextIds~=ids)>0 break; end % next event data = [data; sscanf(str(45:end),'%f')']; end % plot data % test data(:,1:5); sep = data(:,1); amassPred = data(:,6:2:16); amassAlarm = data(:,7:2:17); nnPred = data(:,18:2:28); nnAlarm = data(:,19:2:29); nnInput = data(:,30:39); xy = data(:,40:43); safetyCellTime = data(:,44); t = [1:size(data,1)]'; for i=1:6 subplot(2,3,i); actualFutureSep = sep(i*5+1:end); actualFutureSep = [actualFutureSep; zeros(length(t)-length(actualFutureSep),1)]; actualFutureSep(actualFutureSep==0)=NaN; plot(t,actualFutureSep,'-',t,amassPred(:,i),'+',t,nnPred(:,i),'*'); end fprintf('See figure for comparision Linear vs. NN.\n'); fprintf('Start time: %s\n',time); fprintf('Event duration: %d seconds\n',length(t)); fprintf('Situation (initially): %s\n',situation); fprintf('TID1 = %d\n',ids(1)); fprintf('PID1 = %d\n',ids(2)); fprintf('TID2 = %d\n',ids(3)); fprintf('PID2 = %d\n',ids(4)); fprintf('\nPress any key to view next event...\n\n'); pause; end