external assessments in special cases - imfiii contents acknowledgment v overview vii 1....
TRANSCRIPT

I n t e r n a t I o n a l M o n e t a r y F u n d
Strategy, Policy, and Review Department
External Assessments in Special Cases
A Staff Team Led by Anna Ter-Martirosyan

Strategy, Policy, and Review Department
External Assessments in Special Cases
A Staff Team Led by Anna Ter-Martirosyan
I N T E R N A T I O N A L M O N E T A R Y F U N D

© 2014 International Monetary Fund
Cataloging-in-Publication Data Joint Bank-Fund Library
External assessments in special cases [electronic resource] / a staff team led by Anna Ter-Martirosyan. – Washington, D.C. : International Monetary Fund, c2014. 1 online resource.
Includes bibliographical references. ISBN 978-1-47557-640-5
1. Foreign exchange rates. I. Ter-Martirosyan, Anna. II. International Monetary Fund.
HG3851.E98 2014eb
Disclaimer: The views expressed in this book are those of the authors and should not be reported as or attributed to the International Monetary Fund, its Executive Board, or the governments of any of its member countries.
Please send orders to: International Monetary Fund, Publication Services
P.O. Box 92780, Washington, DC 20090, U.S.A. Tel.: (202) 623-7430 Fax: (202) 623-7201
E-mail: [email protected] Internet: www.elibrary.imf.org
www.imfbookstore.org

iii
Contents
Acknowledgment v
Overview vii
1. Introduction 1
2. Survey of External Assessments 5
Adjustments in Special Cases 6
3. External Assessments for Non-EBA Countries 12
The Toolkit 12Alternative Indicators 13
4. External Assessments for Special Cases 16
Using the Toolkit to Deal with Special Cases 16
5. Data Issues 19
Supplemental Current Account Measures 19Separating the Foreign-Owned Resource Sector 20
6. Conclusions 22
References 49
Figures
Figure 1. Use of CGER Methodologies Across Country Groups 6Figure 2. Threshold Charts 8Figure 3. Characteristics of Countries with Concentrated Sources of
External Income 8Figure 4. Example of Competitiveness Template 14Figure 5. Case Study: Separating Foreign-Owned Resource Sector 21Figure A4.1. Exchange Rate Misalignment Estimates Under the MB and ERER
Approaches, Customized (vertical axis) vs. Benchmark Model (horizontal axis) 39
Figure A4.2. Parameter Sensitivity Analysis Under MB Approach 40Figure A4.3. Parameter Sensitivity Analysis Under ERER Approach 41Figure A5.1. Financial Centers 43Figure A5.2. Cumulative Current Account Balance and Changes in NFA 44Figure A6.1. Separating a Foreign-Owned Resource Sector 47
iv
CONTENTS
Boxes
Box 1. The Pilot External Sector Report and External Balances Assessment 2
Tables
Table 1. Comparison of Bottom Line Exchange Rate Assessment in Article IV Reports 6
Table 2. Characteristics of Countries with Concentrated Sources of External Income 9
Table 3. Average Directional Difference in Exchange Rate Misalignment Estimates 10
Table 4. Average Directional Difference of Estimated Exchange Rate Gaps 18Table A3.1. Ghana: Current Account Projections and Benchmark under
Alternative Methodologies 31Table A4.1. Macroeconomic Balance Approach, Panel Regression Model
Estimation Results 37Table A4.2. Equilibrium Real Exchange Rate Approach, Panel Regression
Model Estimation Results 38Table A5.1. Financial Center Defi nition Methodology 42Table A5.2. Exchange Rate Gap Estimates for Financial Centers 45Table A6.1. Comparison of Current Account Norms: Overall vs. Domestic
Economy 47
Appendixes
Appendix 1. Recent Developments in IMF Surveillance 25Appendix 2. Country Groups 27Appendix 3. Survey of Exchange Rate Assessments 29Appendix 4. The Expanded Toolkit: Analytical Framework
and Empirical Results 35Appendix 5. Financial Centers 42Appendix 6. Illustrative Example of Separation of Foreign-Owned
Resource Sector 46

v
Acknowledgment
This Departmental Paper was prepared by a staff team from the IMF’s Strategy, Policy, and Review Department, led by Anna Ter-Martirosyan, and including Sally Chen, Lawrence Dwight, Mwanza Nkusu, Mehdi Raissi, Francis Vitek, and Ashleigh Watson, under the general guidance of Vikram Haksar.

This page intentionally left blank

vii
Overview
IMF staff has recently developed new methods for multilaterally consistent external sector and exchange rate assessments. In particular, the pilot External Balances Assessment (EBA) methodology provides estimates for current account and exchange gaps for a group of advanced and emerging market economies. These estimates have been used as inputs into external assessments for 29 large economies in the 2013 Pilot External Sector Reports (ESR).
While the new methods are a signifi cant step forward, several issues arise in implementation. First, EBA applies to 49 economies, but the IMF membership consists of 188 countries. Thus, other approaches must be applied to conduct external assessments for countries not participating in EBA. Second, countries not included in EBA often have very concentrated sources of foreign income (e.g., commodity exports), unlike most countries in the EBA sample. Country desks often make allowances for such country-specifi c circumstances, which can introduce other types of errors, including questions of potential overfi tting, unequal treatment, and multilateral inconsistency. Third, measurement issues can affect external gap estimates. These issues will be discussed in this paper, along with alternative tools and approaches to inform such assessments.
Practices and Issues
• Assessment methods for non-EBA countries. Country teams often use the older Consultative Group on Exchange Rate (CGER) methods to generate quantitative estimates for exchange rate gaps. But these rely on an older theoretical framework, and estimates of the impact of explanatory variables and implementation can vary across teams.
• Assessments in special cases. Teams often modify CGER methods to account for special circumstances. This paper examines such modifi cations for countries with concentrated sources of external income. Common modifi cations include the addition of explanatory variables, changes in sample periods or the countries included in a panel, and/or modifying the underlying exchange rate model. However, teams must balance the potential errors arising from omitting relevant variables with the potential errors arising from using selective subsamples or alternative specifi cations.

EXTERNAL ASSESSMENTS IN SPECIAL CASES
viii
• Measurement issues. Estimates of external gaps may be affected by distortions in the attribution of investment income (e.g., for fi nancial centers). In other cases, data limitations may complicate exchange rate analysis.
Tools and Approaches
• Exchange rate assessment toolkit. This paper presents an internal toolkit that extends CGER-type methods to a wide panel of countries, pending further development of the EBA methodology and extension of the sample. This helps in providing more up-to-date coeffi cient estimates, allowing for special country circumstances while preserving multilateral consistency. This toolkit is also adjustable and can accommodate country-specifi c characteristics.
• External indicators template. Refl ecting the need to supplement model-based assessments with alternative approaches, this paper also describes a template for the comparison of various external indicators across countries.
• Framework for analysis of a capital-intensive, foreign-owned sector. If a country has a resource sector that is largely foreign-owned, fl ows related to the resource sector are likely to dominate external fl ows, revenues, and output. This may lead to diffi culties assessing the health of the non–resource-oriented economy. Data limitations often complicate analysis. In such cases, distinguishing transactions with the foreign-owned sector may have implications for policy advice.

1
Introduction
CHAPTER
1
Exchange rate analysis has been at the core of IMF surveillance. The Articles of Agreement state that the IMF is, among others: “to promote exchange stability, to maintain orderly exchange arrangements among members, and to avoid competitive exchange depreciation.” In addition, under the Articles, the IMF is required to “oversee the international monetary system in order to ensure its effective operation, and . . . oversee the compliance of each member with its obligations.” In this regard, the IMF established an interdepartmental Consultative Group on Exchange Rates (CGER), which began assessing the exchange rates of the G-7 countries in 1997. Over time, country coverage of CGER was expanded and a broader methodology for exchange rate assessments was developed based on three pillars: (1) the macrobalance (MB) approach, which estimates deviations relative to a current account (CA) norm; (2) the equilibrium real exchange rate (ERER) approach, which estimates deviations from an exchange rate norm; and (3) the external sustainability (ES) approach, which estimates deviations from a sustainable CA balance. For a considerable time, the CGER methodology was a standard tool in assessing external conditions for many members of the IMF (see Lee and others, 2008).
Recently, the IMF introduced a more comprehensive approach to external assessments. The 2011 Triennial Surveillance Review (TSR) found that members were dissatisfi ed with the IMF’s assessments of external stability and exchange rates (see Appendix 1). Members rated IMF analysis on exchange rates lower than other components of IMF surveillance and expressed concern regarding uniformity of approach across countries and staff ’s ability to adequately account for country-specifi c circumstances. Following the 2011 TSR, the Managing Director proposed further work on integrating external assessments with evaluation of a country’s policy mix and broadening the range of external indicators. Starting from 2012, the IMF issued the annual External Sector Report (ESR), which draws on

EXTERNAL ASSESSMENTS IN SPECIAL CASES
2
Box 1 . The Pilot External Sector Report and External Balances Assessment
The Pilot External Sector Report (ESR), fi rst published in July 2012, aimed to enhance the effectiveness of IMF surveillance of external imbalances. The ESR broadened external surveillance beyond exchange rates to assess current account (CA) balances, capital fl ows, capital fl ow measures, reserve adequacy, and external assets/liabilities. The report combined multilateral and bilateral perspectives and provided a multilaterally consistent analysis of the external positions of 28 large economies and the euro area. The report also aimed to ensure that assessments were candid and evenhanded, with the same methods applied to all countries. Recognizing that no model can provide fully perfect information, the report brought to bear in-depth knowledge from country teams to identify factors, including country-specifi c factors, not captured by the models. The Pilot ESR also drew on the new EBA methodology (see below) to analyze “policy gaps” for the fi rst time, differentiating between those arising from domestic versus external policies, and recommended appropriate policy responses to address external imbalances. The ESR exercise was repeated in 2013.
The Pilot External Balance Assessment (EBA) approach, under ongoing development by the IMF Research Department, was part of the assessment of CAs and real exchange rates in the Pilot ESRs of 2012 and 2013. The EBA builds on and improves the previously developed Consultative Group on Exchange Rates (CGER) methods ( Occasional Paper 261 ) and covers approximately 50 advanced and emerging market economies. Improvements relative to CGER include steps to strip out the infl uence of cyclical factors and include a greater range of explanatory variables (chosen on the basis of economic theory). Most fundamentally, EBA methods go beyond CGER by estimating the impact of a country’s actual policies (including fi scal policy, monetary policy, capital controls, and reserve accumulation, along with proxies for social protection and fi nancial policies) on its CA and real exchange rate, and the contributions of possible deviations of policies from desirable settings (“policy gaps”). EBA also identifi es whether the policies of the home country or others are the source of an imbalance.
the new External Balances Assessment (EBA) and other inputs to derive a multilaterally consistent assessment of external positions for 29 of the IMF’s largest members and the euro area (Box 1). 1
1 The Pilot External Sector Report and External Balances Assessment methodology is available via the Internet: http://www.imf.org/external/np/spr/2013/esr/.

Introduction
3
Notwithstanding the development of cross-country tools to deepen external assessments, country-specifi c characteristics still loom large in many cases. EBA applies to 49 of the IMF’s membership of 188 countries. Countries outside the EBA generally rely on older approaches, such as those developed under the auspices of the CGER. In addition, some countries have special characteristics not fully accounted for by these standard approaches. As a result, staff uses a variety of methods and models, making assessments less consistent and more diffi cult to compare across countries.
The most common “special” characteristic is the concentration of external income in one or more sectors. In such cases, a country’s external balance is dominated by income from, for example, commodities, tourism, fi nancial services, aid fl ows, or remittances. This often limits the applicability of standard methods for exchange rate assessment. For example, EBA methods take special account of oil and natural gas balances but not of other commodity exports or services (and the EBA exercise does not include economies most specialized in energy production). Similarly, many countries have large aid or remittance infl ows, while fi nancial centers often have CA surpluses in excess of those predicted by existing models. Moreover, many of these countries are smaller and/or lower income and are outside of the coverage of the CGER and EBA exercises.
The EBA methodology incorporates a number of structural differences among economies, allowing them to respond differently to shocks, by using interacted variables. The sensitivities of CAs and exchange rates to a number of their determinants thus vary according to the size of the economy, whether it has reserve currency status, the size and structure of its trade, the degree of capital account openness, and for energy exporters, and the size of energy reserves. However, the coverage of the EBA exercise, like the CGER exercise before it, generally does not include the “special case” countries considered in this paper.
IMF staff is assessing how to extend innovations of the EBA approach to the rest of the IMF membership, either by including more countries in the EBA exercise or by applying aspects of the EBA approach to other analyses. Data availability may be a constraint in some cases. The larger issue is whether countries now outside of the EBA exercise are very different structurally and whether a model could be constructed that would suffi ciently allow for such differences. (An analysis presented later in this paper, though based on the CGER rather than EBA framework, sheds some light on this question.)
Box 1. (concluded)
EXTERNAL ASSESSMENTS IN SPECIAL CASES
4
Teams have addressed this situation by introducing country-specifi c adjustments to the standard methodology. Exclusion of special characteristics from exchange rate assessments could bias estimates of CA or exchange rate gaps. Hence, in many cases, IMF country teams have used their best judgment to account for special factors. These adjustments generally take the form of (1) adding other variables that may be relevant in special cases (e.g., aid fl ows), (2) estimating regression models with data for a subset of countries (e.g., tourism exporters), and/or (3) changing the specifi cation of the regression models. These can improve the fi t of models and be better linked to countries’ economic structures. However, such adjustments also raise questions regarding accuracy, multilateral consistency, and evenhandedness.
This paper reviews different approaches to external assessments for countries with special circumstances and presents some tools that could be used to complement judgments. The paper surveys adjustments made by staff for members with special circumstances and discusses conceptual issues and empirical results in these cases. Various tools are presented that could be used by desks to complement their judgment on the external assessment. Finally, the paper considers data issues whose analysis could assist in external assessments, particularly with regard to foreign ownership and capital intensive industries whose profi ts are largely repatriated.
This study is motivated by a review of country experiences and is not intended to provide prescriptive guidance. After closely examining exchange rate assessments and encountering a wide variety of methodologies and models used, one lesson is that no one-size-fi ts-all approach is applicable in all circumstances. Judgment will need to be applied in the choice of methods and assessment of the external sector in both regular and special cases alike.

5
Survey of External Assessments
Staff reports still exhibit wide variation in their approaches to external assessments, particularly for countries not included in multilateral exercises. While about 50 major advanced and emerging market economies are included in the CGER and EBA exercises, representing more than 90 percent of global output, other member countries are not covered by these multilateral exercises. A survey of 88 staff reports reviewed the methods used by country teams in recent Article IV Reports and compared them to the three standard CGER methods—the MB, ERER, and ES approaches. Additional indicators used as complements were also examined in this process (see Appendix 3). 2
The use of CGER methods and other indicators has become standard in bilateral surveillance for the many smaller countries outside the sample of the EBA ( Table 1 ). Only fi ve reports did not use CGER or adjusted CGER methods, due to data limitations. Three-quarters of the reports used all three CGER-type approaches, 20 percent used two, and all but fi ve used at least one. 3 Nearly three-quarters of the reports used adjusted CGER methods (i.e., customized CGER methods to account for special characteristics). 4 Adjustments were most prevalent for nonrenewable commodity exporters and tourism-dependent economies ( Figure 1 ). Other indicators included
2 Most of the 88 countries surveyed are not a part of the approximately 50 countries covered by the EBA exercise. 3 Lee and others (2008, pp. 2 and 19) suggest that the three approaches are intended to be complementary to one another in exchange rate assessments. They also indicate that taken together and combined with additional country-specific information, the three approaches can help researchers reach an informed judgment about medium-term real exchange rate (RER) and current account (CA) balances. 4 In several cases, details on either the “standard” CGER methodologies used, such as the relevant regression updates applied, or the type of customization added, are not provided. In other cases, use of CGER methodologies simply means that coefficients from regressions in Lee and others (2008) have been applied to medium-term fundamentals for a non-CGER country.
CHAPTER
2

EXTERNAL ASSESSMENTS IN SPECIAL CASES
6
purchasing power parity, unit labor costs, reserves, and competitiveness measures. Some indicators were specifi c to the economy under study (e.g., the market share of tourist arrivals).
Adjustments in Special Cases
IMF staff has developed a variety of adjustments to standard methodologies taking into account special country circumstances. The survey suggests that the most common adjustments relate to countries with concentrated sources of external income (i.e., commodity exports, tourism, fi nancial services,
Table 1 . Comparison of Bottom Line Exchange Rate Assessment in Article IV Reports (Percent of the reports surveyed)
Overvalued Equilibrium Undervalued Undefined All
CGER methods (83 reports) 31.8 56.8 6.8 0.0 95.5 Of which: Adjusted CGER methods
(65 reports)23.9 43.2 5.7 0.0 72.7
Other methods (5 reports) 2.3 0.0 0.0 2.3 4.5Total 34.1 56.8 6.8 2.3 100.0
Source: IMF staff calculations. Note: CGER = Consultative Group on Exchange Rates. Definitions: CGER methods are used in the staff ’s formal CGER exercise or by country teams that apply the same methods and coefficients to countries not in the multilateral exercise. Adjusted CGER methods refer to use of a CGER-type method but customized with different explanatory variables and/or coefficients derived from subsamples rather than CGER. Other methods refer to non-CGER methods.
Figure 1 . Use of CGER Methodologies Across Country Groups 1
8582
88
40
724
13
60
0%
20%
40%
60%
80%
100%
Com_NR Aid/rem. Tourism Fin. Cent
Num
ber o
f rep
orts
0
5
10
15
20
25
30
Com_NR Aid/rem. Tourism Fin. Cent
Num
ber o
f rep
orts
OneTwoAll three
With customiza�on No customiza�on
Source: IMF staff calculations.1 Com_NR, com_R, Aid/rem, fin. centstand for non-renewable commodities, renewable commodities, aid and/or remittances, and financial centers, respectively.

Survey of External Assessments
7
aid fl ows, and remittances). These modifi cations are often underpinned by specifi c analytical methods. This section surveys recent staff reports concentrating on external assessment methodologies for these groups of countries.
We examine external assessments for countries with concentrated foreign income arising from fi ve broad sources: nonrenewable commodity exports, tourism, fi nancial services, foreign aid, and remittances. 5 Using the quantitative criteria described in Appendix 2, more than 80 economies accounting for just over 10 percent of world output fall into one of these categories. About half of them are small states, but only a few—mainly fi nancial centers—are included in CGER.
Countries in these groups tend to differ in their external outcomes, suggesting that they may have distinct structural characteristics of relevance to their external assessments ( Figures 2 and 3 , and Table 2 ). Exporters of nonrenewable commodities have relatively high positive CA and fi scal surpluses. Exporters of fi nancial services tend to have high CA surpluses, sizable positive net foreign assets (NFA) positions, and high gross fi nancial assets and liabilities. Exporters of tourism services often have chronically high CA defi cits and debt levels. Finally, recipients of aid and remittances tend to have higher-than-average CA defi cits.
The specifi c characteristics used to justify adjustments vary across country groups. The following observations apply to each of the major country groups:
• Exporters of nonrenewable commodities (including oil): Studies highlight the importance of the exhaustible nature of exportable resources and the need to ensure intergenerational equity. This results in countries saving some of their earnings with a corresponding increase in the CA balance. On the other hand, a recent stream of studies also takes into account optimal investment decisions, arguing that for commodity exporters with constrained external borrowing, it could be optimal to use resource income to fund real investment expenditure and thus have smaller CA surpluses. 6 A simple model-based framework—accounting for optimal consumption and investment behavior and structural characteristics of resource-rich developing countries—is being used by some IMF country teams as a complementary tool to produce CA norms.
5 The definition of groups is based on quantitative criteria defined in Appendix 2. 6 Araujo and others (2012), Berg and others (2012), and IMF 2012a, 2012b.

EXTERNAL ASSESSMENTS IN SPECIAL CASES
8
Figure 3 . Characteristics of Countries with Concentrated Sources of External Income 1
ATG
BHSBRBBLZCPV
CYP
DMA
FJI
GRD
JAMLBNMDV
MUSWSM
SYC
KNALCAVCT
VUT
–25
–15
–5
5
15
25
35
45
0 10 20 30 40 50 60 70 80 90 100Curr
ent a
ccou
nt b
alan
ce (%
GDP
)
Popula�on (millions)
Exporters of Tourism Services: Popula�on and CurrentAccount Balance
AFG
BTN
BDI
CPV
COMDJIERI
GMB
GNB
KIR
LSO
LBR
MWIMLI
MRT MOZ
WSMSLE SLB
TZA
TLS
VUT
MUS
ALB
HTIJOR
LBNMDA
TJK
30
20
10
0
10
20
30
40
0 5000 10000 15000 20000 25000 30000Curr
ent a
ccou
nt b
alan
ce (%
GDP
)
Per capita income ($)
Aid and Remi�ance Countries: Income and CurrentAccount Balance
B
RT
S
Sources: IMF, World Economic Outlook database; World Bank, World Development Indicators; and IMF staff estimates.1 Tourism services contries are in red; all other are in blue. Aid and Remittance countries are in red and green, respectively; all others are in blue.
Figure 2 . Threshold Charts (All figures in percent unless noted otherwise)
0
10
20
30
40
50
60
70
80
0 20 40 60 80 100 120
Com
mod
ity e
xpor
ts t
o ou
tput
Commodity exports to total exports
Threshold = 15%
Thre
shol
d =
25%
Exporters of Non-Renewable Commodi�es
0
10
20
30
40
50
60
0 20 40 60 80 100
Tour
ism se
rvic
es to
out
put
Threshold = 15%
Tourism export to total exports
Thre
shol
d =
25%
Exporters of Tourism Services
–1
0
1
2
3
4
–1 0 1 2 3 4 5 6 7Expo
rts o
f fina
ncia
l ser
vice
sto
out
put
Threshold = 1%
Export of financial services to total exports
Thre
shol
d =
1%
Exporters of Financial Services
0
10
20
30
40
50
60
70
0 10 20 30 40 50 60 70
Aid
reci
pien
ts to
out
put
Remi�ances to output
Threshold = 15%
Thre
shol
d =
15%
Recipients of Aid and Remi�ances
Sources: IMF, World Economic Outlook database; World Bank, World Development Indicators; and IMF staff estimates.Note: In the lower right-hand side, the chart combines groups for recipients of aid and recipients of remittances. The threshold for recipients of remittances is the vertical line; the threshold for aid recipients is the horizontal line. Thus, the five countries in the upper right-hand quadrant are those that below to both aid and remittance-recipient groups.

Survey of External Assessments
9
• Tourism-dependent economies : The fi nancing of tourism-related infrastructure can attract sizeable capital fl ows, notably foreign direct investment (FDI), which lowers the CA balance due to the large import content of FDI. 7
• Financial centers : These countries tend to have high CA balances. This may in part be due to accounting issues in measuring investment income and/or the build-up of precautionary balances to insure against volatility in large gross asset and liability positions.
• Aid- and/or remittance-dependent economies tend to have lower CA balances (see Figure 3 ). Aid infl ows may induce capital-intensive investment. Remittances can weaken the CA if they boost domestic demand to the point of raising domestic costs and reducing the competitiveness of the domestic economy. Nonetheless, the evidence for weakening of the CA through aid/remittances-induced RER appreciation is weak (Berg and others, 2007; Mongardini and Rayner, 2009). 8
Adjustments usually consist of modifying the panel country sample, explanatory variables, and/or econometric methodology. For example,
Table 2 . Characteristics of Countries with Concentrated Sources of External Income Nominal
GDP Average (billions of
USD)
Per Capita Income (USD)
Population (millions)
CAB (in percent of GDP)
Fiscal Balance
(in percent of GDP) NFA
Exporters of non-renewable comm.
117.7 10,003 22.3 7.1 4.5 –15.2
Exporters of financial services 256.4 29,027 7.0 –0.5 –2.6 33.6Exporters of tourism services 4.8 8,404 0.6 –13.3 –4.6 –92.0Recipients of remittances 7.7 2,540 3.6 –6.7 –2.8 –65.0Recipients of aid 3.1 1,090 6.2 –7.4 –1.0 –53.4All countries 340.1 10,719 37.5 0.1 –1.0 –30.5
Sources: IMF, World Economic Outlook database; World Bank, World Development Indicators; and IMF staff estimates.
7 Pineda, Cashin, and Sun (2009, p. 18) elaborate on this issue in the context of exchange rate assessment for countries of the Eastern Caribbean Currency Union. 8 As regards possible RER appreciation associated with remittances, while Chami and others (2008) find that higher remittance receipts tend to appreciate the RER, Barajas and others (2010) suggest standard Dutch disease effects of remittances are substantially weakened or even overturned depending on factors such as the degree of openness of the economy, the share of tradable goods in consumption, and the countercyclicality of remittances. Their panel-based econometric analysis indicates that ERER appreciation in response to sustained remittance flows tends to be quantitatively small.
EXTERNAL ASSESSMENTS IN SPECIAL CASES
10
Pineda, Cashin, and Sun (2009); Beidas-Strom and Cashin (2011); Aydin (2010); and Vitek (2009) modify the sample or explanatory variables for the MB or ERER approaches. Bems and de Carvalho Filho (2009, 2011) modify the methodology of the ES approach to ensure intergenerational equity, while Chudik and Mongardini (2007) and Mongardini and Rayner (2009) modify the ERER approach using different cointegration techniques in estimating the relationship between the real effective exchange rate (REER) and its fundamental determinants. For some staff reports, the nature of a modifi cation was not explained clearly in the text.
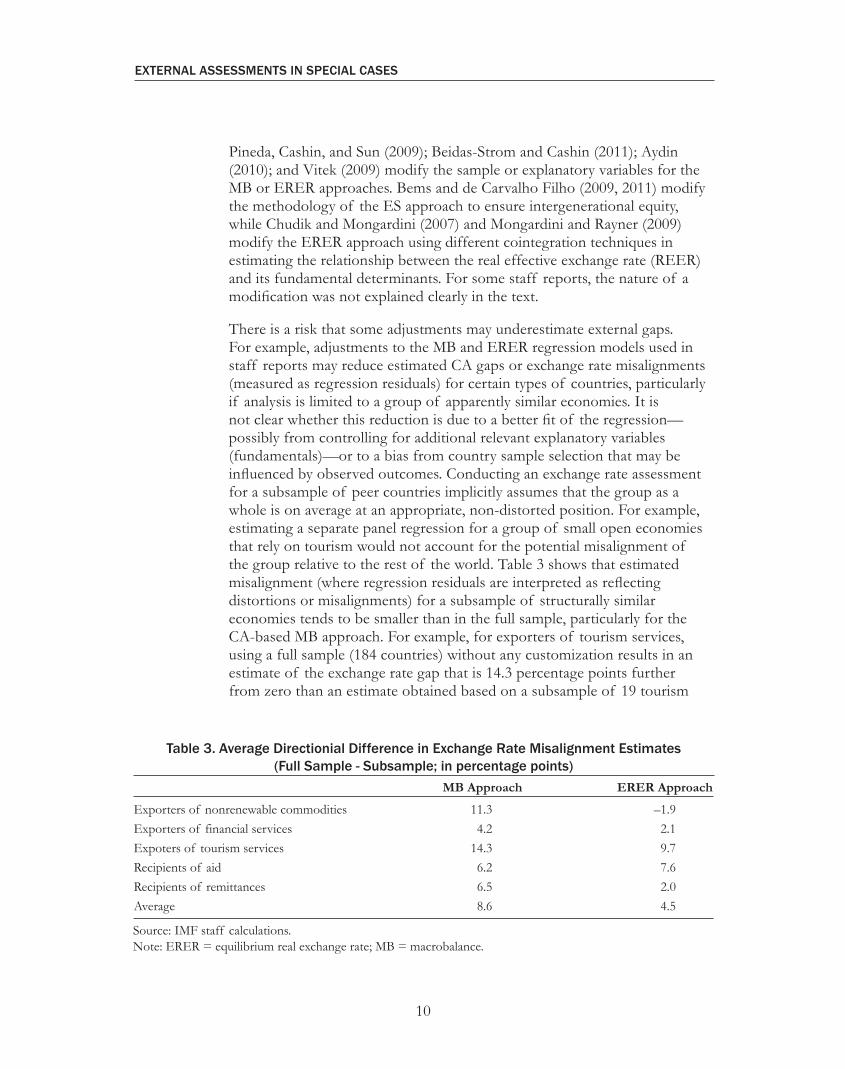
There is a risk that some adjustments may underestimate external gaps. For example, adjustments to the MB and ERER regression models used in staff reports may reduce estimated CA gaps or exchange rate misalignments (measured as regression residuals) for certain types of countries, particularly if analysis is limited to a group of apparently similar economies. It is not clear whether this reduction is due to a better fi t of the regression—possibly from controlling for additional relevant explanatory variables (fundamentals)—or to a bias from country sample selection that may be infl uenced by observed outcomes. Conducting an exchange rate assessment for a subsample of peer countries implicitly assumes that the group as a whole is on average at an appropriate, non-distorted position. For example, estimating a separate panel regression for a group of small open economies that rely on tourism would not account for the potential misalignment of the group relative to the rest of the world. Table 3 shows that estimated misalignment (where regression residuals are interpreted as refl ecting distortions or misalignments) for a subsample of structurally similar economies tends to be smaller than in the full sample, particularly for the CA-based MB approach. For example, for exporters of tourism services, using a full sample (184 countries) without any customization results in an estimate of the exchange rate gap that is 14.3 percentage points further from zero than an estimate obtained based on a subsample of 19 tourism
Table 3. Average Directionial Difference in Exchange Rate Misalignment Estimates (Full Sample - Subsample; in percentage points)
MB Approach ERER Approach
Exporters of nonrenewable commodities 11.3 –1.9Exporters of financial services 4.2 2.1Expoters of tourism services 14.3 9.7Recipients of aid 6.2 7.6Recipients of remittances 6.5 2.0Average 8.6 4.5
Source: IMF staff calculations.Note: ERER = equilibrium real exchange rate; MB = macrobalance.

Survey of External Assessments
11
exporters. As will be discussed further, there are risks from both over- and underadjustments of the standard approaches. 9
Overall, the survey suggests that sound assessments are characterized by broad coverage and transparency. External assessments involve judgment. They can be strengthened through transparent analysis and the use of a broad set of inputs.
• Transparency: Where there have been changes to CGER methodologies or adjustments to correct for one-off factors, data measurement biases, or any other factor relevant to a country’s external assessment, disclosure of the adjustments, their economic rationale, and their implications for the assessment constitutes best practice. If country teams prefer to carry out customized methodologies, it would be useful to provide a clear discussion on how the assessment may differ from the standard methods. 10
• Coverage: Good practice includes moving beyond quantitative point estimates of external gaps and considering broader indicators such as capital fl ows, reserve adequacy, foreign exchange intervention, capital controls, and external assets and liabilities. Relevant structural indicators of competitiveness also help broaden exchange rate assessments, particularly for countries with severe data limitations. Also, acknowledging that estimates are subject to a range of uncertainties seems appropriate. These uncertainties stem not only from the econometric methodologies but also from the value of some fundamentals. For oil exporters for instance, historical regressions cannot capture the changing nature of prospective reserves.
9 “Average Directional Difference” measures the extent to which exchange rate misalignment estimates may be understated (shifted toward zero) for different groups. Specifically, staff estimated the exchange rate misalignment gaps (REER minus equilibrium REER) for the full sample (184 countries), as well as for different subsamples, and subtracted the latter from the former to measure the potential bias if the full sample results were assumed to be accurate while taking into account the sign of the misalignment estimates (positive or negative). 10 Some useful examples include Hong Kong SAR and Switzerland, where staff reports contained discussions on exchange rate assessments and comparisons across methodologies.

12
External Assessments for Non-EBA Countries
This section discusses extensions of standard exchange rate assessment methodologies to countries outside of the CGER and EBA samples. These extensions are available to staff on the IMF’s internal website . It also offers some illustrative methodologies that allow accounting for structural heterogeneity across country groups in a multilaterally consistent way.
The Toolkit
The survey results indicate a wide variety of exchange rate assessment methods, particularly for countries outside of the CGER and EBA samples. For some groups of countries, staff has developed customized methodologies, taking into account country-specifi c characteristics, but others continue to apply the coeffi cients estimated from older regressions using earlier sample periods that did not include the country whose CA or RER is being assessed.
An internal toolkit has been developed to facilitate multilaterally consistent exchange rate analysis for countries not included in the CGER and EBA sample. 11 This toolkit consists of an annual panel data set and econometric programs that implement variants of the CGER and EBA analytical approaches (MB, ERER, and ES). The associated panel regression models span the 184 economies covered by the World Economic Outlook database from 1973 to present. The toolkit is designed to complement the analysis conducted by CGER by applying the same analytical approaches to a larger set of economies, including low-income countries (LICs). For each analytical approach, exchange rate misalignment estimates are reported together with a
11 The toolkit, documented in Vitek (2009), consists of documentation, data, program, and output files that implement the PPP, MB, ERER, and ES approaches.
CHAPTER
3

External Assessments for Non-EBA Countries
13
variety of intermediate results, including panel regression model coeffi cient estimates and multilateral consistency adjustments. Given the expanded country coverage of the toolkit, it includes measures of aid and remittance infl ows for emerging and developing economies. Note that the application of the CGER methodology, and the CGER-based toolkit described in this paper, generally does not take account of the role of policy distortions, which has been a key focus of EBA. That important issue and its resolution is, however, largely distinct from the country heterogeneity issues that are the focus of this paper. 12
Alternative Indicators
For many economies, structural differences, in addition to data limitations, hinder the application of CGER and EBA approaches. An important factor underlying the choice of countries included in the samples for the EBA and CGER exercises was the need to parsimoniously model economies whose structures were not very dissimilar, in contrast with the special cases considered here. Moreover, for some countries (mostly developing countries and small states), gaps in standard cross-country databases are also a constraint. This also constrains the direct implementation of the toolkit’s regression models, though these gaps can be partially fi lled by using proxy variables in some cases or excluding minor trading partners in the computation of aggregates.
When quantitative estimation is constrained, assessments can be supported by qualitative indicators of competitiveness and external stability. This is in line with the TSR’s recommendation that external assessments go beyond exchange rates to incorporate a broader range of indicators. For countries with poor data quality, undergoing rapid structural change, and/or having very unique structural characteristics, alternative indicators can provide complementary information. As noted in the discussion on survey results, many teams already include alternative indicators in external assessments. Some of the indicators are broadly similar across the groups, while others are more group specifi c.
Staff has created a template that can generate relevant indicators for each country group to supplement and broaden exchange rate assessments ( Figure 4 ). The template consists of two components: a competitiveness scorecard and panel charts for assessing external stability. The competitiveness
12 In particular, the use of a fiscal balance regressor in the CGER’s MB approach risks distorting current account gaps in cases where fiscal policy is inappropriate. This shortcoming could be addressed by applying an EBA-like fiscal policy gap treatment, in which the current account norm is calculated based on a desirable fiscal balance, which may differ from the actual fiscal policy setting and remains an avenue for further extensions.

EXTERNAL ASSESSMENTS IN SPECIAL CASES
14
Figure 4 . Example of Competitiveness Template
Tourism-dependent EconomiesSt. Ki�s and Nevis
Compe��veness Scorecard
OverallInternalTerms ofTrade
CPI-REER TouristArrivalShare
Non-OilExportVolume
Non-OilExportMarketShare
InternetUsers(per 100people)
Price forGasoline(US$ perliter)
Price forDieselFuel (US$per liter)
DoingBusinessIndicator(ranking)
Corrup�onPercep�onIndex
Values –6.0 3.0 –0.1% 5.2 0.0% 76 95Deciles 4 6 8 7 7 1 6 2Group (5) (9) (9) (4) (5) (1) (9) (7)
Note: Indicators of rela�ve price and external sector are changes over the last five years. Score among same group is shownin parenthesis. Panels for External Stability
Source: IMF staff calcula�ons.
Rela�ve Price External Sector Costs Ins�tu�on
0
40
80
120
160
200
2001 02 03 04 05 06 07 08 09 10 11 12
St. Ki�s and Nevis All countriesSame group
ITT (2005 = 100)
–240
–220
–200
–180
–160
–140
–120
2000 01 02 03 04 05 06 07 08 09 10
St. Ki�s and Nevis
Net Financial Asset Posi�on (percent of GDP)
0
10
20
30
40
2000 01 02 03 04 05 06 07 08 09 10 11
Reserves-St. Ki�s and Nevis Reserves-all countries20% of M23 months of importsSTD
Reserves (percent of GDP)
0
20
40
60
80
100
120
140
2000 01 02 03 04 05 06 07 08 09
St. Ki�s and Nevis All CountriesSame group
Tourist Arrivals (2005 = 100)
90
95
100
105
110
115
120
2000 01 02 03 04 05 06 07 08 09 10 11
St. Ki�s and Nevis All countriesSame group
CPI-REER (2005 = 100)
–40
–30
–20
–10
0
10
20
30
2000 01 02 03 04 05 06 07 08 09 10 11
Current and Financial Accounts (percent of GDP)
CAB-St. Ki�s and Nevis CAB-same group
FDI inflow-St. Ki�s and NevisFDI inflow-same group
Sources: IMF, International Financial Statistics and World Economic Outlook databases; World Bank, World Economic Development Indicators; and IMF staff calculations.Note: CPI = consumer price index; ITT = Internal Terms of Trade; REER = real effective exchange rate.
External Assessments for Non-EBA Countries
15
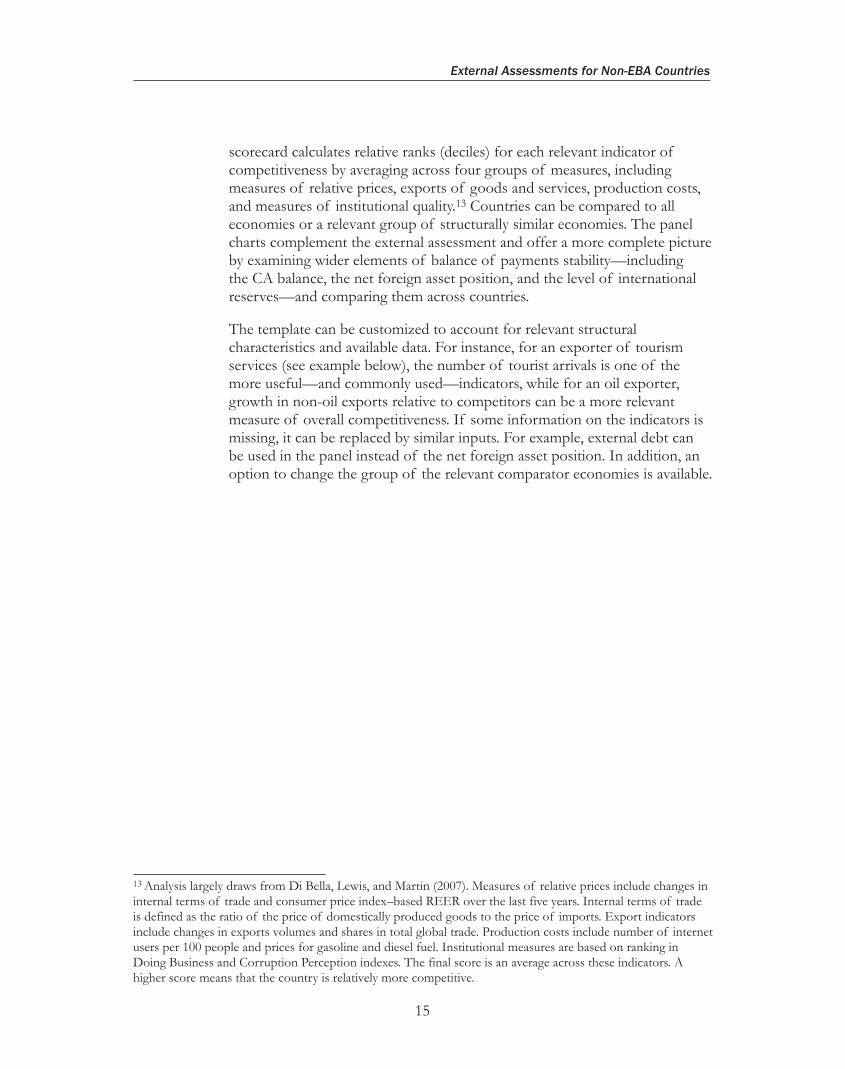
scorecard calculates relative ranks (deciles) for each relevant indicator of competitiveness by averaging across four groups of measures, including measures of relative prices, exports of goods and services, production costs, and measures of institutional quality. 13 Countries can be compared to all economies or a relevant group of structurally similar economies. The panel charts complement the external assessment and offer a more complete picture by examining wider elements of balance of payments stability—including the CA balance, the net foreign asset position, and the level of international reserves—and comparing them across countries.
The template can be customized to account for relevant structural characteristics and available data. For instance, for an exporter of tourism services (see example below), the number of tourist arrivals is one of the more useful—and commonly used—indicators, while for an oil exporter, growth in non-oil exports relative to competitors can be a more relevant measure of overall competitiveness. If some information on the indicators is missing, it can be replaced by similar inputs. For example, external debt can be used in the panel instead of the net foreign asset position. In addition, an option to change the group of the relevant comparator economies is available.
13 Analysis largely draws from Di Bella, Lewis, and Martin (2007). Measures of relative prices include changes in internal terms of trade and consumer price index–based REER over the last five years. Internal terms of trade is defined as the ratio of the price of domestically produced goods to the price of imports. Export indicators include changes in exports volumes and shares in total global trade. Production costs include number of internet users per 100 people and prices for gasoline and diesel fuel. Institutional measures are based on ranking in Doing Business and Corruption Perception indexes. The final score is an average across these indicators. A higher score means that the country is relatively more competitive.

16
External Assessments for Special Cases
Using the Toolkit to Deal with Special Cases
Staff is developing an extension to the toolkit that takes into account differences across country groups with concentrated sources of external income. 14 To illustrate the issues and the potential applications of the toolkit, we have conducted an exercise that begins with the CGER regression specifi cations and systematically examines possible differences in slope or intercept values and fi nally selects one modifi ed regression specifi cation. Results from this exercise (which are further discussed in Annex 4) suggest the value of modeling—in some manner—that allows for structural differences, particularly in special case countries. The exercise suggests signifi cant differences in a number of slope coeffi cients (though none in intercepts): 15
• Nonrenewable commodity exporters: The slope coeffi cients on the fi scal balance (in the MB regression) and on the terms of trade and government consumption (in the ERER regression) are higher for nonrenewable commodity exporters (see Tables 1 and 2 in Appendix 4). This is not surprising because the fi scal balance in commodity-exporting countries is dominated by swings in oil revenues and hence strongly correlated with the CA, which is also dominated by such swings. Furthermore, given that their exports are less diversifi ed, commodity-exporting countries are exposed to large terms of trade fl uctuations that can induce large business cycle fl uctuations, passing them through to domestic prices and the RER. Finally, fi scal transfers from oil revenues to
14 There are a number of other potential extensions of the toolkit (e.g., dividing countries into groups with and without capital market access) that could be implemented following a similar methodology. 15 Explanations for differences in these slope coefficients could be more complex than those provided. This exercise explores the empirical justification for and exchange rate assessment implications of accounting for such differences.
CHAPTER
4
External Assessments for Special Cases
17
the domestic economy in oil-exporting countries tend to raise domestic prices and appreciate the RER. These results are consistent with the fi ndings of Bems and de Carvalho Filho (2009) for oil exporters.
• Aid-dependent economies: The slope coeffi cients on the oil trade balance and aid infl ows in the MB regression are higher for aid-dependent economies. This likely refl ects their high vulnerability to terms of trade fl uctuations and high sensitivity to aid infl ows, given the limited scope for intertemporal consumption smoothing due to low savings and credit constraints (see Table 1 in Appendix 4). The sign of the coeffi cient on aid infl ows generally depends on whether infl ows are offi cial grants included in the CA or loans that are excluded. 16
• Financial centers: In the MB regression, the slope coeffi cient on relative income is higher for fi nancial centers, possibly a result of high earnings.
• Remittance-dependent economies: Evidence indicates that the slope coeffi cient on relative productivity in the ERER regression is higher for remittance-dependent economies. Remittances may support a higher relative price of nontraded goods than relative productivity alone would imply, raising domestic prices and appreciating the RER (see Appendix 4).
This exercise illustrates that allowing for differences across country groups can have implications for exchange rate assessments. Table 4 shows that when slope coeffi cients are not allowed to differ across country groups, the regression residuals may be larger, suggesting that MB- and ERER-based estimates may overstate the exchange rate gap. 17 For example, the average estimated exchange rate gaps for nonrenewable commodity exporters, under both the MB and ERER approaches, are about 6 percentage points further from zero in the absence of slope heterogeneity. For other special cases, the impact of allowing slope heterogeneity is smaller on average. As such, while this exercise is only illustrative and does not summarize all possible methods or outcomes, it does suggest that some form of customization may be appropriate, particularly if linked to economic theory and done within a multilaterally consistent framework that covers a large set of countries. Of course, other approaches to allowing for country heterogeneity can also be
16 Our measure of aid does not distinguish between official grants and loans. To the extent that these foreign aid inflows are official grants and are included in the current account, they may raise the current account surplus and estimated norm. However, to the extent that aid inflows take the form of loans, they may provide financing for a significant increase in the current account deficit, reducing the estimated current account norm. 17 Table 3 reports the average potential directional bias of exchange rate gaps. However, there are significant cross-country differences in directional bias estimates for different countries in our special groups. See Annex 4, Figure 1.

EXTERNAL ASSESSMENTS IN SPECIAL CASES
18
considered, including approaches that seek to directly measure countries’ structural differences. 18
However, there is a trade-off between allowing for country differences when modeling exchange rates, and with sample selection. Table 3 suggests that restricting the sample to a limited number of structurally similar countries may understate the magnitude of misalignment. By contrast, in Table 4 we see that not allowing coeffi cients to vary across structurally different economies may increase somewhat the residuals and thus overstate the magnitude of misalignment. The question of which issue is more meaningful comes down to understanding the nature of the effect evidently common to the country subsample. If the origin of that common effect is an undesirable distortion, then the focus on a subsample clearly weakens the analysis by understating gaps. If instead restricting the sample serves as a simple but effective way of controlling for omitted common structural factors appropriately infl uencing the CA and exchange rate, it may serve to enhance the assessment. Ideally, one would prefer to work with a wide country sample and to measure and model the omitted structural characteristics directly, if feasible, or otherwise to employ a dummy variable for the country group in question. In any event, given these considerations, adjustments to regression models must be accompanied by plausible hypothesis and grounded in economic theory.
Table 4 . Average Directional Difference of Estimated Exchange Rate Gaps (Full sample, with no customization minus Full sample, with customization,
in percentage points)
MB (REER) ERER (REER)
Exporters of nonrenewable commodities 5.8 5.6Exporters of financial services 1.7 2.6Expoters of tourism services 1.1 2.5Recipients of aid 2.5 1.9Recipients of remittances 0.5 0.7Average (Customized groups) 0.9 2.7Average (All other countries) 2.3 0.1
Source: IMF staff calculations.Note: ERER = equilibrium real exchange rate; MB = macrobalance; REER = real effective exchange rate.
18 A further extension may include continuous interaction terms rather than binary dummies (e.g., the terms of trade regressor could be interacted with the size of a country’s net oil exports, rather than a dummy for being a net oil exporter). This is the customization approach used by the EBA methodology (see Box 1).

19
Data Issues
Supplemental Current Account Measures
Many economies with concentrated external fl ows have large foreign ownership in either the natural resource or fi nancial sectors. These foreign-owned sectors generate substantial external fl ows that can in some cases dwarf fl ows from domestic sectors. This is particularly relevant for countries that export fi nancial services or have large participation of multinational companies with foreign ownership (e.g., in the resource sector or [for small islands] the tourism sector). Moreover, the net trade or capital fl ows associated with these particular sectors may be primarily driven by factors outside the country (e.g., by fi nancial sector market conditions, or trade policy of major trade partners), which could complicate the estimation of exchange rate elasticities and thus affect the country’s exchange rate assessment.
Under standard accounting treatments, CA statistics could distort estimates of external wealth accumulation in some circumstances. The issue centers around the difference between the location where the external income stream is generated and the ultimate ownership of this income stream. The accounting treatments are complicated. A clear case arises in the context of FDI. To the extent that profi ts of a multinational corporation’s foreign subsidiaries are retained in the host country where the subsidiary is located, this will tend to push the host’s measured CA above the corresponding change in its actual net external wealth, as this income in principle adds to the wealth of the nonresident owners of the company. Other distortions can be introduced into the accounting of fl ows of remitted earnings on direct and portfolio investment when the ownership structure of the involved entities is complex and distributed across many jurisdictions.
These issues can best be illustrated by a specifi c example. For instance, income earned by Swiss subsidiaries located outside of Switzerland is counted as income to Swiss residents in keeping with standard practice. However, data from the
CHAPTER
5

EXTERNAL ASSESSMENTS IN SPECIAL CASES
20
Swiss National Bank suggests that there is a signifi cant non-Swiss––and dispersed––ownership of these subsidiaries. Indeed, the Swiss National Bank’s analysis suggests that this measurement issue could add roughly 3½ percent of GDP per year to Switzerland’s measured CA surplus (Mancini-Griffoli and Stoffels, forthcoming). More broadly, a measure that adjusts for fl ows according to foreign and domestic ownership shares of relevant corporations would give a better picture of the country’s domestic wealth accumulation and hence external position. Staff work in this area includes adjustments to CA measures for Switzerland (see the 2012 Article IV report) and Mancini-Griffoli and Stoffels (forthcoming).
Correctly addressing income streams in the balance of payments can be a challenge if data is incomplete. As some countries only report aggregated data on total investment income without a breakdown of functional categories––direct investment versus portfolio investment––or by instrument––income from equity or reinvested earnings––it is diffi cult to know how much reinvested earnings are included in the CA estimates. Unfortunately, detailed data are not always available, hindering external assessments and making cross-country comparisons diffi cult. 19
Separating the Foreign-Owned Resource Sector
In an economy where the foreign-owned resource sector is not well integrated with the rest of the economy, it may also be useful to obtain additional data. If a country has a natural resource sector that is largely foreign owned, fl ows related to the resource sector dominate external fl ows, royalties account for a considerable share of revenues, and output depends on commodity production. Fluctuations in output and fl ows due to commodity price movements can overshadow trends in other sectors, leading to diffi culties in assessing the health of the non–resource-oriented economy. In such cases, it may be useful to consider all transactions with the foreign-owned sector on an aggregate net basis to get a clearer picture of the competitiveness of the domestic economy. ( Figure 5 ). Assuming the availability of relevant data, Appendix 6 shows an illustrative example of such a separation for a resource-rich economy.
• Economic activity: The domestic component includes all non–resource-related activities, public revenues, private wages, and profi ts accrued by domestic agents in the resource sector.
19 The ongoing efforts of the IMF’s Statistics Department to develop consistent comparable official data for offshore financial centers should help in this regard.

Data Issues
21
• External balance: Commodity exports and related capital imports, as well as income payments to foreign investors in the resource sector, are separated from the CA balance. Resource-related fi scal revenue is treated as remittances/grants accrued by the domestic non-resource sectors.
The results of the case study show that assessments for the overall economy and the adjusted domestic sector can be quite different and diverge through time, suggesting notable differences in policy advice. In the illustrative example in Appendix 6, the assessment based on underlying fundamentals of the overall economy points to an exchange rate undervaluation, while analysis for the adjusted economy suggests an overvaluation. This analysis also fl ags a possibly inconsistent projection for non-resource sector output growth, which could be diffi cult to achieve given an external competitiveness issue.
This type of analysis requires signifi cant data and may not always be possible. While the example was initially based on actual data for one resource-rich economy, strong assumptions were made to separate fl ows, particularly for resource-related imports, FDI, and income fl ows. Similar studies would require enhanced data provision by members.
Figure 5 . Case Study: Separating Foreign-Owned Resource Sector
Foreign-OwnedResourceSectorRest of the
economy(adjustedeconomy)
External inflows
Externalou�lows
External inflows
Externalou�lows
Resource-relatedou�lows
Resource-relatedinflows
Reso
urce
l tax
rev.
-Resource ExportRevenues-Resource-relatedincome flows
Labo
r for
reso
urce
sect
or
Foreign-Owned
ResourceSector
Rest of theeconomy(non-oil)
-Resource-relatedimports-Dividends/Incomepayments-Services
Rela
ted
serv
ices
Source: IMF staff calculations.

22
Conclusions
The methods of exchange rate assessments in staff reports vary substantially across countries, often refl ecting special characteristics. For economies not included in the EBA and CGER samples, IMF country teams often adjust their methodologies to refl ect country-specifi c circumstances. Such adjustments include (1) adding relevant omitted variables, (2) using coeffi cient estimates based on a subset of similar countries, or (3) changing regression model specifi cations.
Given these results, staff need to consider the trade-offs between applying standard methods and accounting for specifi c traits. Standard methods were developed for major advanced and emerging economies. While adjustments may be theoretically warranted to account for country-specifi c characteristics, excessive customization can lead to multilateral inconsistency and statistical overfi tting, potentially understating CA or exchange rate gaps. Estimation based on subsamples implicitly assumes that the group is not misaligned with respect to the rest of the world. This suggests that with customized methodologies, it would be helpful to provide a clear discussion on how the assessment may differ from the standard methods.
An internally developed exchange rate assessment toolkit can facilitate customized external assessments in a multilaterally consistent way. The toolkit allows users to account for heterogeneity across groups of structurally similar countries within a global panel regression framework. One of the customizations that can be done using the toolkit includes different slope coeffi cients for groups of countries with concentrated sources of external fl ows that can be allowed for by adding interaction terms to the regressions. A template to analyze other information that may help in assessing the external position of countries with concentrated sources of external income is also presented.
CHAPTER
6

Conclusions
23
Additional data could help in enhancing external sector and exchange rate analysis for countries with concentrated external fl ows. Such work could include:
• Correcting for distortions related to investment income, and
• Focusing more specifi cally on domestic competitiveness by netting out fl ows to large foreign-owned sectors.
Staff intends to continue to work on refi ning these tools in the context of the EBA approach to external assessment. Issues discussed in this paper will remain relevant for the foreseeable future. With further progress of EBA methodologies, there will be interest in adapting these methods for countries outside of the EBA sample. Many questions raised in this paper with respect to customizations of CGER methods would remain largely relevant for those cases.

This page intentionally left blank
25
Appendix 1 . Recent Developments in IMF Surveillance
Recent Reviews
The IMF released its latest Triennial Surveillance Review (TSR) in September 2011 and a Review of Progress on Implementation in December 2012. The reports drew lessons from the IMF’s failure to foresee many of the problems that precipitated the global economic and fi nancial crisis, and recommended steps to improve surveillance with respect to:
• Interconnections. The TSR found the IMF could better leverage its universal membership to monitor cross-country developments and provide an integrated view of global stability.
• Risk assessment. The TSR found that IMF risk analysis required greater depth, especially for systemic and tail risks. To address this issue, the IMF has improved the integration of country and global risk assessments, analysis of transmission channels, and its policy advice.
• Financial stability. The TSR argued for deeper examination of the links between fi nancial systems and the macro economy, both within and across countries. The IMF adopted a Financial Surveillance Strategy in October 2012 to improve the IMF’s understanding of fi nancial connections, boost fi nancial expertise, and close data gaps.
• Traction. The 2011 TSR recommended the IMF improve its traction with members by providing high-quality analysis, boosting coverage of macrocritical social issues, and improving the quality, candor, and evenhandedness of its advice.
External Assessments
On external assessments, the 2011 TSR acknowledged that considerable advances have been made. It noted that staff reports are more consistent in their use of exchange rate methods, especially CGER analysis, and in having a bottom line assessment. Exchange rate assessments were broadly consistent across countries and over time. However, the 2011 TSR also identifi ed a number of issues:
• Narrow focus: Staff reports often focused on exchange rates, without paying suffi cient attention to risks arising from the capital and fi nancial accounts.
Appendix

26
• Integration: Staff reports did not suffi ciently integrate external stability in the discussion of the overall policy mix.
• Consistency and evenhandedness: In a few cases, leeway in methodology gave rise to inconsistencies in exchange rate assessments.
• Transparency: Staff reports generally did not provide suffi cient detail on assumptions or methods. The exchange rate analysis often appeared to come from a black box, raising questions about reliability.
The 2011 TSR recommended the IMF:
• Adopt a broader perspective on external stability—going beyond exchange rates to consider CA balances, capital fl ows, foreign exchange intervention, and external balance sheets;
• Better integrate external issues with the assessment of the overall policy mix (for example, understanding how exchange rate policy interacts with fi scal and monetary policies); and
• Increase the transparency and consistency of external assessments.
To meet these goals, the IMF introduced a new methodology for external assessments, the pilot External Balances Assessment, and a pilot External Sector Report (see Box 1).
EXTERNAL ASSESSMENTS IN SPECIAL CASES

27
Appendix 2 . Country Groups
The following groups of economies are identifi ed as having distinct structural characteristics commonly thought to infl uence exchange rate assessments. 20
Exporters of non-renewable commodities (the ratio of exports of non-renewable commodities to output exceeds 15 percent and the ratio of exports of non-renewable commodities to total exports exceeds 25 percent; covers 14 percent of economies): Algeria, Angola, Azerbaijan, Bahrain, Brunei, Congo Republic, Gabon, Guinea, Iran, Iraq, Kazakhstan, Kuwait, Liberia, Libya, Mauritania, Mongolia, Nigeria, Norway, Oman, Papua New Guinea, Russia, Saudi Arabia, Trinidad and Tobago, Turkmenistan, Venezuela, Zambia.
Exporters of fi nancial services (the ratio of exports of fi nancial services to output exceeds 1 percent and the ratio of exports of fi nancial services to total exports exceeds 1 percent; covers 8 percent of economies): Bahrain, Barbados, Belgium, Cyprus, Hong Kong SAR, Ireland, Lebanon, Luxembourg, Maldives, Malta, Panama, Singapore, Switzerland, United Kingdom, Vanuatu.
Exporters of tourism services (the ratio of exports of tourism services to output exceeds 15 percent and the ratio of exports of tourism services to total exports exceeds 25 percent; covers 10 percent of economies): Antigua and Barbuda, Bahamas, Barbados, Belize, Cape Verde, Cyprus, Dominica, Fiji, Grenada, Jamaica, Lebanon, Maldives, Mauritius, Samoa, Seychelles, St. Kitts and Nevis, St. Lucia, St. Vincent and the Grenadines, Vanuatu.
Recipients of aid (the ratio of receipts of aid to output exceeds 15 percent; covers 14 percent of economies): Afghanistan, Bhutan, Bosnia and Herzegovina, Burundi, Cape Verde, Comoros, Djibouti, Eritrea, Gambia, Guinea-Bissau, Kiribati, Lesotho, Liberia, Malawi, Mali, Mauritania,
20 The country classification criteria are distinct from those used in other policy analyses in the IMF, but they give rise to comparable compositions of country groups where relevant. The thresholds chosen for each group are generally one-and-a-half standard deviations from the 1973–2010 sample means. Except for a few cases, countries classified as exporters of nonrenewable commodities based on these thresholds generally overlap with those in the group of fuel exporters or that of exporters of nonfuel primary commodities in the World Economic Outlook , even though the World Economic Outlook criterion for a country to be classified as exporter of a particular commodity or commodity group is that the country should have earned an annual average of more than 50 percent of its exports from that commodity or commodity group during the past five years. For the group of remittance-dependent economies, the threshold of 15 percent of GDP is above that of 10 percent of GDP used in the revised guidelines for debt sustainability analysis in low-income countries.
Appendix

28
Mozambique, Rwanda, Samoa, São Tomé and Príncipe, Sierra Leone, Solomon Islands, Tanzania, Timor-Leste, Tonga, Vanuatu.
Recipients of remittances (the ratio of receipts of remittances to output exceeds 15 percent; covers 6 percent of economies): Albania, Bosnia and Herzegovina, Cape Verde, Haiti, Jordan, Lebanon, Lesotho, Moldova, Samoa, Tajikistan, Tonga.
EXTERNAL ASSESSMENTS IN SPECIAL CASES

29
Appendix 3 . Survey of Exchange Rate Assessments
Nearly 95 percent of the 88 reviewed reports for countries with special characteristics use CGER or adjusted methods for exchange rate assessments. This appendix provides more details on typical customizations across special groups. We discuss how customization has been done, how it is likely to affect the assessment, and what lessons can be learnt going forward.
Customization Across Special Country Groups: How Has It Been Done?
Exporters of Non-renewable Commodities
All three CGER-based approaches have been subject to customization.
MB approach . Customization is done at two stages: the CA regressions and the elasticity of the CA to the REER.
• CA regressions: Several studies suggest that standard CGER regressions fail to capture specifi cities of oil-exporting countries such as the effects of oil wealth and the degree of maturity in oil production (Morsy, 2009) or the need to ensure intergenerational equity as oil reserves are exhaustible (Bems and de Carvalho Filho, 2009). Accordingly, the set of fundamental determinants of the CA is expanded to include oil wealth and the degree of maturity of oil production (Beidas-Strom and Cashin, 2011; Morsy, 2009; and Thomas, Jun Il, and Aslam, 2008). Also, the non-oil fi scal balance is considered to be the most relevant fi scal variable to separate the effects of oil revenues and fi scal policy on the CA (Beidas-Strom and Cashin, 2011; Bems and de Carvalho Filho, 2009; and Thomas, Jun Il, and Aslam, 2008). Thomas, Jun Il, and Aslam (2008) focus on the sustainability of the non-oil CA.
• Derivation of the elasticity of the CA to the REER: For oil exporters, the GDP shares of oil and non-oil exports, as well as the elasticities of non-oil exports and imports relative to the REER are specifi cally taken into account in the computation of the CA elasticity to the REER as elaborated in Bems and de Carvalho Filho (2009).
• Examples of customized CA regression-based REER assessments in Article IVs :
° For oil-exporting countries in the Middle Eastern and Central Asia Department, the CA regressions in Bems and de Carvalho Filho (2009), based on a sample of 24 oil-/gas-exporting countries, are used for the MB approach whereas the ES approach relies on income
Appendix

30
allocation rules discussed in Bems and de Carvalho Filho (2009; see reports for Algeria, Bahrain, Kuwait, Oman, Saudi Arabia).
° For Mongolia, which exports both coal and nonfuel mining products, the nonfuel mining products are considered as part of the oil balance in the MB approach (IMF, 2011, p. 12).
ERER approach . The customized regressions use a set of explanatory variables that do not necessarily match CGER’s. In particular, two frameworks are used:
• A multivariate relationship usually between the REER and the following three regressors: relative government consumption, relative productivity, and terms of trade. Additional regressors include openness and investment income.
• Bivariate relationship between the REER and real oil prices using high-frequency data (Bahrain, Kuwait, Oman, Saudi Arabia).
ES approach . Customization involves change of methodology. Unlike the CGER’s ES approach, which aims at fi nding a CA that stabilizes the net foreign assets (NFAs) at a given benchmark, the customized ES approach for countries exporting exhaustible resources aims to derive a path for future NFA that satisfi es a rule for the intertemporal allocation of income derived from non-renewable resources. Three allocation rules are used: constant real annuity, constant real per capita annuity, and constant annuity as a share of GDP. Besides Middle Eastern and Central Asia Department countries, the modifi ed ES has been used for Norway, Gabon, and the Republic of Congo.
Framework. IMF staff has also produced policy and working papers containing a framework for analysis of CAs for resource-rich developing countries (RRDCs). 21 The framework has been applied to Azerbaijan, Ghana, Turkmenistan, and the Central African Economic and Monetary Community (the latter two are ongoing). Previous frameworks based on the consumption-smoothing permanent income hypothesis (PIH) can be inadequate to study the CA dynamics in capital-scarce RRDCs, as they do not account for investment decisions. The alternative framework, in contrast, is based on a model-based approach with optimal private and public investment decisions and several frictions that capture pervasive features in RRDCs, including absorptive capacity constraints, ineffi ciencies in investment, and borrowing constraints that can be relaxed with natural resources windfalls. By relaxing these borrowing constraints and providing a key fi nancing source for public investment in RRDCs, temporary resource revenues might then be associated with lower CA balances than those suggested by PIH-based frameworks.
21 See IMF (2012a); and Araujo and others (2013).
EXTERNAL ASSESSMENTS IN SPECIAL CASES
Appendix
31
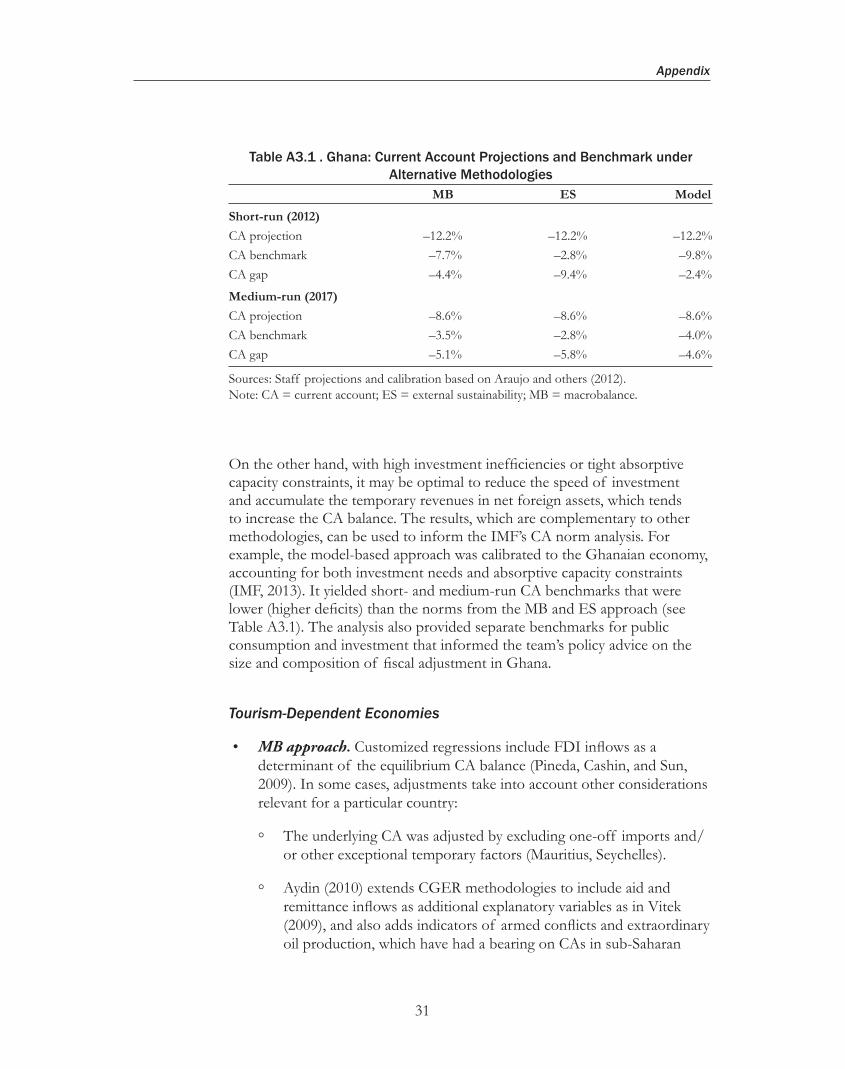
On the other hand, with high investment ineffi ciencies or tight absorptive capacity constraints, it may be optimal to reduce the speed of investment and accumulate the temporary revenues in net foreign assets, which tends to increase the CA balance. The results, which are complementary to other methodologies, can be used to inform the IMF’s CA norm analysis. For example, the model-based approach was calibrated to the Ghanaian economy, accounting for both investment needs and absorptive capacity constraints (IMF, 2013). It yielded short- and medium-run CA benchmarks that were lower (higher defi cits) than the norms from the MB and ES approach (see Table A3.1). The analysis also provided separate benchmarks for public consumption and investment that informed the team’s policy advice on the size and composition of fi scal adjustment in Ghana.
Tourism-Dependent Economies
• MB approach . Customized regressions include FDI infl ows as a determinant of the equilibrium CA balance (Pineda, Cashin, and Sun, 2009). In some cases, adjustments take into account other considerations relevant for a particular country:
° The underlying CA was adjusted by excluding one-off imports and/or other exceptional temporary factors (Mauritius, Seychelles).
° Aydin (2010) extends CGER methodologies to include aid and remittance infl ows as additional explanatory variables as in Vitek (2009), and also adds indicators of armed confl icts and extraordinary oil production, which have had a bearing on CAs in sub-Saharan
Table A 3.1 . Ghana: Current Account Projections and Benchmark under Alternative Methodologies
MB ES Model
Short-run (2012)
CA projection –12.2% –12.2% –12.2%CA benchmark –7.7% –2.8% –9.8%CA gap –4.4% –9.4% –2.4%
Medium-run (2017)
CA projection –8.6% –8.6% –8.6%CA benchmark –3.5% –2.8% –4.0%CA gap –5.1% –5.8% –4.6%
Sources: Staff projections and calibration based on Araujo and others (2012). Note: CA = current account; ES = external sustainability; MB = macrobalance.

32
Africa. These results have been used to assess the exchange rate for Cape Verde, a tourism-dependent country, and other sub-Saharan Africa countries.
• ES approach . Customized to take into account capital account transfers including grants, which are assumed to be zero in the standard CGER approach, although they can be an important fi nancing source (e.g., St. Kitts and Nevis); assumptions made on foreign assets and liabilities to derive a range of NFA benchmarks due to the diffi culty of having precise NFA estimates (Seychelles). For some countries (St. Lucia, St. Kitts and Nevis), the assessment is based on the IMF’s external debt sustainability assessment in the absence of net international investment position data.
Aid/Remittance-dependent Countries
For aid- or remittance-dependent countries, exchange rate assessments are based mostly on regressions that augment the set of standard CGER explanatory variables with aid and/or remittances. The regressions in Vitek (2009) are widely used. In some reports, the methodology is amended by using cointegration-based analyses such as the ones discussed in Chudik and Mongardini (2007) and Mongardini and Rayner (2009). The reports for Malawi refer to Mongardini and Rayner (2009).
Financial Centers
Most external assessments for fi nancial centers do not make adjustments. Exceptions are the 2011 and 2012 staff reports for Hong Kong SAR and Switzerland. The Hong Kong SAR reports estimate CA and exchange rate gaps using various subsamples. These eliminate the gaps found in the standard CGER exercise. The Switzerland reports reduce the estimated CA surplus to account for investment income attributed to Swiss residents that actually accrues to nonresident owners of the subsidiaries of Swiss multinationals. This reduces, but does not eliminate, the estimated positive CA gap and undervaluation.
How Is Customization Likely to Change the Results vs. Standard CGER and Why?
Customization can be used to explain developments that might otherwise raise concerns. The direction in which the results change compared with what they would have been under standard CGER are specifi c to country groups and to country-specifi c developments.
EXTERNAL ASSESSMENTS IN SPECIAL CASES

Appendix
33
• For oil exporters or exporters of other non-renewable commodities, customization could cater to the issue of sustainability from the perspective of depletion of resources as discussed in Bems and de Carvalho Filho (2009). It can also take into account the need to develop the productive capacity of capital-scarce LICs that have abundant natural resources while ensuring that adequate buffers are maintained to deal with the volatility of natural resource revenues (Araujo and others, 2013; Berg and others, 2012; Collier, van der Ploeg, and Venables, 2010). Against this background, country-specifi c circumstances can be used to explain:
° Large CA surpluses for an extended period of time to allow for the accumulation of NFA needed to smooth consumption when income falls as a result of the depletion of resources.
° A strengthening of the REER in case of an increase in the real world price of the export commodity, more so in the context of the bivariate relationship between the REER and commodity prices. The question of whether such appreciation is desirable arises.
° Weaker CA balances in resource-rich LICs that use windfalls from commodity exports for investing domestically in physical productive capacity, which in turn may result in lower external savings for a period of time.
• For aid-dependent or tourism-dependent economies, customization may justify large absorption and the ensuing weakening of the CA balance. Aid fl ows are aimed at fi nancing public investment projects or the development of human capital. Berg and others (2010) developed a dynamic small open economy model that features key structural characteristics of LICs and discussed how spending and absorption of aid fl ows affect the RER and the CA. Calibrated numerical simulations of their model suggest that a policy mix that results in full spending and absorption of aid can give rise to temporary RER appreciations and also to medium-term positive effects on output through higher public capital. FDI in tourism-dependent economies is meant to fi nance spending on identifi ed private sector projects in the tourism sector. Against this background, both aid fl ows and inward FDI fl ows are consistent with a weakening of the CA balance.
• For remittance-dependent economies, taking a long-term perspective that considers remittances as exhaustible may highlight the need to save some of the remittances thereby justifying a relatively stronger CA. The use of some rule akin to the PIH, as is the case for oil-producing countries, can help indicate an optimal intertemporal allocation of
34
temporary income that promotes generation of a steady stream of income over time. This customization was used in the 2011 Article IV consultation with the Philippines.
Lessons
The following practices help improve the transparency of external rate assessments and yield better informed judgments:
• Provide information on the customization.
• Document steps actually performed to arrive at an estimate of the REER misalignment, including whether multiyear averages or annual values of the explanatory variables are used and the time horizon used to compute the CA norm or the equilibrium REER.
• Document the contribution of each variable to the CA norm or “equilibrium” REER to inform the discussion of policies that would help correct the misalignment, if any.
• Exclude large one-off factors from the CA level whose appropriateness is being assessed.
• Present other indicators of competitiveness. These can be structural (cost of doing business) or economic indicators of export competitiveness such as market shares or growth of nontraditional exports.
Some practices may undermine the reliability of ER assessments and should be avoided if possible:
• Apply coeffi cients from older regressions, in particular if the regressions did not include the country whose CA or REER is being assessed. To the extent that the coeffi cients are time-varying, relying on older regressions’ coeffi cients may bias ER assessments.
• Rely on one empirical methodology and/or overlooking structural indicators of competitiveness that may have a greater bearing on CA dynamics than the ER, in particular for LICs.
• Use of non-transparent derivations of CGER or CGER-like estimates.
• Basing ER assessments on a very limited sample of countries.
EXTERNAL ASSESSMENTS IN SPECIAL CASES

35
Appendix 4 . The Expanded Toolkit: Analytical Framework and Empirical Results
This appendix aims to provide some guidance to teams working on countries with a concentrated foreign exchange income stream in their customization endeavors for empirical assessments. These countries tend to rely more on various types of customization for CGER-type models due to their idiosyncratic characteristics. In this context, we present a simple exchange rate assessment framework with similar explanatory variables to CGER, and test for slope and intercept heterogeneity across these groups of countries. We try to account for special features of these economies (by augmenting regressions with additional interaction terms) and to provide tools for country desks as a starting point in their exchange rate customization analysis. We already emphasized that using small samples with only a limited number of countries may lead to underestimation of exchange rate gaps. However, we try to explain that desks could potentially benefi t from a theory-linked customization effort if conducted within a large sample of countries using interaction terms.
We test for slope and intercept heterogeneity under the MB and ERER approaches. We use a general-to-specifi c model selection approach where we augment all of the explanatory variables in the panel regression models with interaction terms corresponding to each special group (Columns 2–4 of Table A4.1 and Columns 2–3 of Table A4.2 ) and test down (in a few stages) among nine additional explanatory variables in each group (including group fi xed effects). At each stage, we eliminate the coeffi cient that is most out of line with theoretical sign restrictions or is most statistically insignifi cant. This sequence of tests is terminated when all the variables that remain in each group are signifi cant and have the correct sign. As an example, the intercept for the group of tourism-dependent countries in the MB regression is retained while all slope coeffi cients are eliminated. Having retained only a handful of coeffi cients out of these additional interaction terms (in Columns 2–4 of Table A4.1 and Columns 2–3 of Table A4.2 ) in different groups, we test whether they would remain statistically signifi cant when embedded in the general panel specifi cation (this is the specifi c-to-general model selection stage tabulated in the last column of Tables A4.1 and A4.2 ). 22 Under this scheme, all additional interaction terms for aid recipients, exporters of nonrenewable commodities, fi nancial centers, and remittance recipients remain signifi cant, but the intercept-interaction term for tourism exporters gets eliminated.
22 See Hendry (1995, Chapter 9) for further details on this data-based model selection methodology.
Appendix

36
This slope/intercept hypothesis testing procedure yields little evidence of intercept heterogeneity across the identifi ed country groups but some evidence of slope coeffi cient heterogeneity. There is little empirical evidence that intercepts differ for our special groups of countries under the MB approach, relative to the benchmark model (tourism-dependent economies are a possible exception). For each special group of countries, however, at least one slope coeffi cient was found to differ signifi cantly relative to the benchmark model (Column 1 in Tables A4.1 and A4.2 ), except for renewable commodity exporters and tourism-dependent economies (see Tables A4.1 and A4.2 ).
Allowing for slope heterogeneity across these special country groups has economically signifi cant implications for exchange rate assessments. Figure A4.1 depicts the scatter plots of exchange rate misalignment estimates derived under the MB and ERER approaches using the benchmark (Column 1 in Tables A4.1 and A4.2 ) versus customized (last Column of Tables A4.1 and A4.2 ) models. The results indicate a directional bias away from zero of the benchmark model relative to the customized model, as the slope of the best fi t line is always less than unity. Directional bias measures the extent to which exchange rate misalignment estimates may be under- or overstated for different groups. Specifi cally, staff estimated the exchange rate misalignment gaps (REER minus equilibrium REER) for the full-sample without customization as well as with interaction dummies, and subtracted the latter from the former to measure the bias while taking into account the sign of the misalignment estimates (positive or negative). The results indicate that the benchmark model may overestimate the extent of exchange rate misalignment compared with the extended toolkit (with interaction terms), as the extended model accounts for special characteristics of different groups. 23
These results are relatively robust to sizable changes in the coverage of our special country groups. We verify the robustness of our empirical results to economically signifi cant perturbations in the quantitative thresholds applied to the structural indicator variables used to identify our special country groups (see Appendix 2 for benchmark country groups). In particular, we consider perturbations in these thresholds that are required to change the number of countries in each group by plus or minus 20 percent. Overall, the coeffi cient estimates and the exchange rate gaps are not very sensitive to such perturbations.
The parameter estimates under the MB and ERER approaches are also robust to outliers. Figures A4.2 and A4.3 show the estimated coeffi cients of the panel data models under the MB and ERER approaches for different samples (after dropping individual countries from the sample of 184 countries one at a
23 Similar model selection procedures can be followed for other groupings (e.g., based on the level of economic development, or access to market financing) by country desks.
EXTERNAL ASSESSMENTS IN SPECIAL CASES

Table A4.1 . Macroeconomic Balance Approach, Panel Regression Model Estimation Results
BenchmarkAid
Recipients
Exporters of Nonrenewable Commodities
Financial Centers
Tourism-dependent Countries
Final Model
C –0.003(0.008)
–0.008(0.009)
–0.005(0.009)
–0.001(0.009)
0.005(0.008)
–0.006(0.009)
C for exporters of tourism services –0.083***(0.018)
Old age dependency –0.021(0.094)
–0.031(0.090)
0.003(0.091)
–0.022(0.094)
–0.127(0.089)
–0.010(0.089)
Population growth –0.512(0.365)
–0.549(0.382)
–0.304(0.382)
–0.495(0.364)
–0.601*(0.352)
–0.326(0.392)
Relative income 0.005(0.006)
–0.001(0.006)
0.005(0.006)
0.006(0.006)
0.011**(0.005)
0.000(0.006)
Relative income for exporters of financial services
0.025***(0.010)
0.027**(0.012)
Output growth –0.990**(0.347)
–1.097***(0.337)
–0.825*(0.304)
–1.001***(0.345)
–0.988***(0.335)
–0.944***(0.292)
Oil trade balance 0.212***(0.054)
0.200***(0.053)
0.161**(0.058)
0.213***(0.053)
0.198***(0.053)
0.152***(0.057)
Oil trade balance for recipients of aid
0.631**(0.308)
0.589**(0.302)
Fiscal balance 0.304**(0.135)
0.347***(0.134)
0.117(0.142)
0.278**(0.134)
0.230*(0.132)
0.137(0.134)
Fiscal balance for exporters of nonrenewable commodities
0.559**(0.238)
0.541**(0.231)
NFA 0.031***(0.010)
0.030***(0.009)
0.030***(0.009)
0.031***(0.010)
0.029***(0.009)
0.030***(0.009)
Grant/aid –0.019(0.071)
–0.300*(0.182)
–0.033(0.067)
–0.017(0.070)
–0.016(0.075)
–0.301*(0.180)
Grant/aid for recipients of aid –0.386***(0.160)
0.370**(0.160)
Adjusted R-squared 0.393 0.382 0.444 0.397 0.422 0.436Number of instruments 9 11 10 10 10 13
Source: IMF staff calculations. Note: Symbols ***, **, and * denote significance at 1%, 5%, and 10%, respectively.

38
Table A4.2 . Equilibrium Real Exchange Rate Approach, Panel Regression Model Estimation Results
Benchmark
Exporters of Non-
renewable Commodities
Remmitance Recipients Final Model
C 0.095* (0.051)
0.105***(0.043)
0.105**(0.047)
0.115***(0.040)
Terms of trade 0.219**(0.103)
0.112(0.080)
0.227**(0.102)
0.121(0.080)
Terms of trade for exporters of non renewable commodities
0.397**(0.193)
0.396**(0.192)
Relative productivity 0.176(0.163)
0.141(0.133)
0.162(0.167)
0.126(0.135)
Relative productivity for recipients of remittances
0.367*(0.240)
0.393*(0.209)
Relative government consumption 2.319***(0.715)
1.412***(0.416)
2.317***(0.716)
1.407***(0.417)
Relative government consumption exporters of nonrenewable commodities
10.547***(2.531)
10.575***(2.543)
Aid flows 0.152(0.652)
0.141(0.558)
0.782(0.722)
0.816(0.695)
Remittance flows 0.092(0.300)
0.087(0.281)
0.198(0.295)
0.202(0.280)
Adjusted R-squared 0.421 0.307 0.421 0.306Observations 1951 1951 1951 1951
Source: IMF staff calculations. Note: Symbols ***, **, and * denote significance at 1%, 5%, and 10%, respectively.
time), as well as the 95 percent confi dence intervals (the two horizontal lines). The estimated coeffi cients are robust to dropping individual economies from the sample ( Figures A4.2 and A4.3 ) one by one. That is, the estimation results are not driven by any particular country in the sample.
EXTERNAL ASSESSMENTS IN SPECIAL CASES

Appendix
39
Figure A4.1 . Exchange Rate Misalignment Estimates Under the MB and ERER Approaches, Customized (vertical axis) vs. Benchmark Model (horizontal axis)
y = 0.793 x –2.8175R² = 0.8422
–80.0
–60.0
–40.0
–20.0
0.0
20.0
40.0
60.0
80.0
–80.0 –60.0 –40.0 –20.0 0.0 20.0 40.0 60.0 80.0
Exporters of NonrenewableCommodi�es (MB Approach)
fi�ed line
y = 0.933x + 1.4934R² = 0.9739
–60.0
–40.0
–20.0
0.0
20.0
40.0
60.0
–60.0 –40.0 –20.0 0.0 20.0 40.0 60.0
Tourism-Dependent Countries(MB Approach)
y = 0.7171x + 9.5397R² = 0.2366
–80.0
–60.0
–40.0
–20.0
0.0
20.0
40.0
60.0
80.0
–80.0 –60.0 –40.0 –20.0 0.0 20.0 40.0 60.0 80.0
Aid-Dependent Countries(MB Approach)
y = 0.9534 x –2.3172R² = 0.9608
–30.0
–20.0
–10.0
0.0
10.0
20.0
30.0
–30.0 –20.0 –10.0 0.0 10.0 20.0 30.0
Financial Centers(MB Approach)
y = 0.8098 x –12.918R² = 0.6669–100.0
–80.0–60.0–40.0–20.0
0.020.040.060.080.0
100.0
–100.0 –50.0 0.0 50.0 100.0
Exporters of NonrenewableCommodi�es (ERER Approach)
y = 0.6753 x –8.1221R² = 0.5863
–25.0–20.0–15.0–10.0
–5.00.05.0
10.015.020.025.0
–25.0 –15.0 –5.0 5.0 15.0 25.0
Remmitance-Dependent Countries(ERER Approach)
Source: IMF staff calculations.

EXTER
NA
L AS
SES
SM
ENTS
IN S
PEC
IAL C
AS
ES
40
Figure A4.2 . Parameter Sensitivity Analysis Under MB Approach
–.02
–.008
–.1
.01–.2
–.1
.0
.1
.02
.03
.04
.05
.06
.0
.1
.2
.3
.4
.5
.6
.7
–2.0
.10
.15
.20
.25
.30
.35
–1.6
–1.2
–0.8
–0.4
0.0
–.004.000.004.008.012.016.020
–.3 –1.6
–1.2
–0.8
–0.4
0.4
0.0
–.2
–.1
.0
.1
.2
25 50 75 100
Intercept Old Age Dependency Popula�on Growth
Rela�ve Income
Fiscal Balance NFA Grant/Aid
Output Growth Oil Trade Balance
125 150 175 25 50 75 100 125 150 175 25 50 75 100 125 150 175
25 50 75 100 125 150 175 25 50 75 100 125 150 175 25 50 75 100 125 150 175
25 50 75 100 125 150 175 25 50 75 100 125 150 175 25 50 75 100 125 150 175
–.01
.00
.01
.02
Source: IMF staff calculations. Note: The horizontal axis lists 184 countries in the sample, and the vertical axis shows the estimated coefficients for different samples (each missing one country at a time).
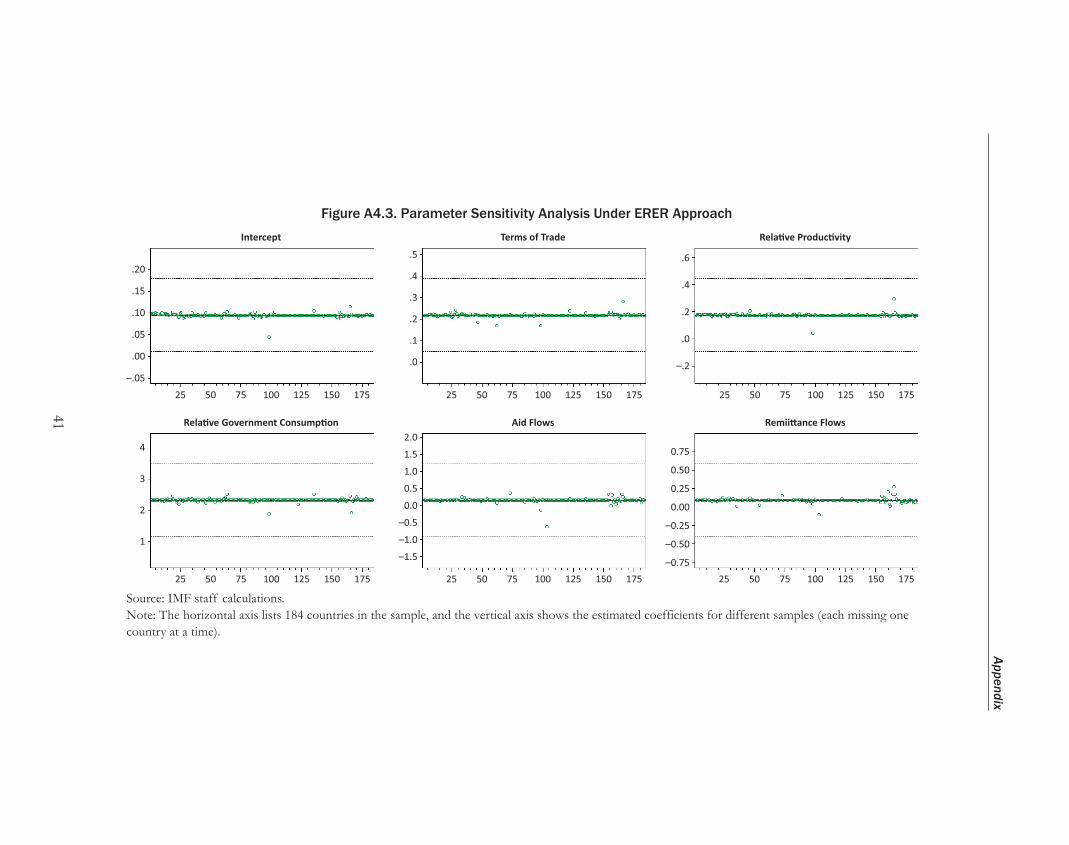
Appendix
41
Figure A4.3 . Parameter Sensitivity Analysis Under ERER Approach
–.05
1–1.5 –0.75
–0.50
–0.25
0.25
0.50
0.75
0.00
–1.0
–0.5
0.0
0.5
1.0
1.5
2.0
2
3
4
–.2
.0
.2
.4
.6
.0
.1
.2
.3
.4
.5
25 50
Intercept
Rela�ve Government Consump�on Aid Flows Remii�ance Flows
Terms of Trade Rela�ve Produc�vity
75 100 125 150 175 25 50 75 100 125 150 175 25 50 75 100 125 150 175
25 50 75 100 125 150 175 25 50 75 100 125 150 175 25 50 75 100 125 150 175
.00
.05
.10
.20
.15
Source: IMF staff calculations. Note: The horizontal axis lists 184 countries in the sample, and the vertical axis shows the estimated coefficients for different samples (each missing one country at a time).

EXTERNAL ASSESSMENTS IN SPECIAL CASES
42
Appendix 5. Financial Centers
Financial centers are generally characterized by large fi nancial services exports, FDI and investment fl ows, and/or net foreign assets ( Table A5.1 ). 24 Primarily as a result of their sizable positive NFA positions and relatively high investment income, fi nancial centers often have large CA surpluses ( Figure A5.1 ). These assets, and their associated fl ows, can signifi cantly affect exchange rates as well as external stability. Several fi nancial centers—Belgium, Hong Kong SAR, Singapore, Switzerland, the United Kingdom—meet all criteria outlined below. Others, particularly small island fi nancial centers, are characterized by the size of external assets and fi nancial service exports rather than FDI and investment fl ows. Lane and Milesi-Ferretti (2010) argue that small island fi nancial centers are mostly “pure intermediaries” of fi nancial fl ows, servicing large economies nearby.
24 Financial centers can also be defined along two lines: small “offshore financial centers,” as defined by the IMF, and the 25 systemically important financial centers identified by the Financial Stability Board.
Table A5.1 . Financial Center Definition Methodology
1 2 3
FDI outflows and direct investment income inflows (1990–2010 averages as %GDP) > Weighted avg:
External assets > 350% of GDP
(Financial Service Exports: Exports)
> 1% and (Financial Service Exports:
Output) > 1%
Bahrain BahrainBarbados Barbados
Belgium Belgium BelgiumCyprus Cyprus
Hong Kong SAR Hong Kong SAR Hong Kong SARIreland IrelandLebanon LebanonLuxembourg LuxembourgMalta Malta
PanamaNetherlands NetherlandsSingapore Singapore SingaporeSwedenSwitzerland Switzerland SwitzerlandUnited Kingdom United Kingdom United Kingdom
Vanuatu
Source: IMF staff estimates; data as of 2010.

Appendix
43
Country teams adjusted external assessments for fi nancial centers in only a few cases. Of the 13 countries listed under Column 2 in Table A5.1 , 2 had adjusted external assessments: Hong Kong SAR and Switzerland. In Hong Kong SAR’s case, the 2011 and 2012 Article IV reports included: (1) standard estimates from CGER, (2) panel regression estimates for 55 countries and for 6 fi nancial centers from the IMF country team, (3) panel estimates from the Hong Kong SAR Monetary Authority, and (4) documentation of the different methodologies. There was a wide range of estimates, and the report noted that “ongoing structural changes” and Hong Kong SAR’s status as a fi nancial center makes it “diffi cult to draw a defi nitive conclusion on the presence of misalignment” with estimates spanning both sides of zero. In Switzerland’s case, the 2011 and 2012 Article IV reports noted that both the SNB and staff have adjusted Switzerland’s CA surplus downwards to account for mismeasured investment income.
Accounting treatments could potentially distort the degree of domestic wealth accumulation. Balance of payments accounting treats profi ts of subsidiaries abroad as accruing to the home country of the multinational, even though the subsidiaries may have foreign owners. The Swiss National Bank estimates that this effect increases Switzerland’s CA by roughly 3.5 percent of GDP per year (Mancini-Griffoli and Sotffels, forthcoming). To address this problem, it would be necessary to have information on the foreign and domestic ownership shares of multinational subsidiaries, some of which can be obtained from standard data providers (e.g., Bloomberg, L.P.) (Mancini-Griffoli and Sotffels, forthcoming).
Figure A5.1 . Financial Centers
–30
–25
–20
–15
–10
–5
0
5
10
15
20
–300 –200 –100 0 100 200 300
Curr
ent a
ccou
nt b
alan
ce (%
GDP
)
NFA (% of GDP)
Financial CentersAverage, 1980–2011
Singapore
Barbados
SwitzerlandBahrain
BelgiumLuxembourg
Hong Kong SAR
Sources: World Economic Outlook database; and IMF staff calculations.

EXTERNAL ASSESSMENTS IN SPECIAL CASES
44
Foreign assets and liabilities may be more important for exchange rate determination for fi nancial centers. 25 Mancini-Griffoli and Stoffels (forthcoming) argue that the way in which CAs are measured—where retained earnings of publicly held domestic companies accrue entirely to the companies’ domestic shareholders—could distort the estimate of domestic wealth accumulation, affecting small, open economies such as fi nancial centers. 26 Foreign assets and liabilities, which refl ect valuation changes, may provide a more accurate assessment of external positions. Others argue that CAs and changes in net foreign assets will generally converge over the long run (Obstfeld, 2012). Empirically, not all fi nancial centers show the same directional effect ( Figure A5.2 ). On average, changes in NFA for fi nancial centers tend to be more positive than CA fl ows, though a few countries—Ireland, Luxembourg, Switzerland, Vanuatu—are exceptions. No matter the direction of the effect, the sizable differences between CAs and changes in net foreign assets from year to year suggest that foreign assets and liabilities may be an important consideration for exchange rate determination. At the minimum, comparing CA balances against changes in foreign assets may be useful to gauge the degree to which CA balances may be distorted.
Another reason for considering a country’s external position is that gross assets and liabilities affect risks. Gross assets and liabilities are typically
Figure A5.2 . Cumulative Current Account Balance and Changes in NFA (1991 to 2010 average)
–15%
–10%
–5%
0%
5%
10%
15%
20%
25%
Bahr
ain
Belgi
um
Cypr
usHo
ng K
ong
Irelan
dLu
xem
bour
g
Malt
a
Pana
ma
Singa
pore
Switz
erlan
dUn
ited
King
dom
Vanu
atu
% o
f GDP
Source: IMF, External Wealth of Nations database (an updated and extended version of the Lane and Milesi-Ferreti, 2007, dataset).
25 Indeed, the issue that NFAs may be as relevant for external sector assessments is valid beyond financial centers, including countries with large official reserves. 26 There are of course, conceptual arguments for current statistical methodologies tallying current account balances. Please reference IMF’s Balance of Payments and International Investment Position Manual for more information.
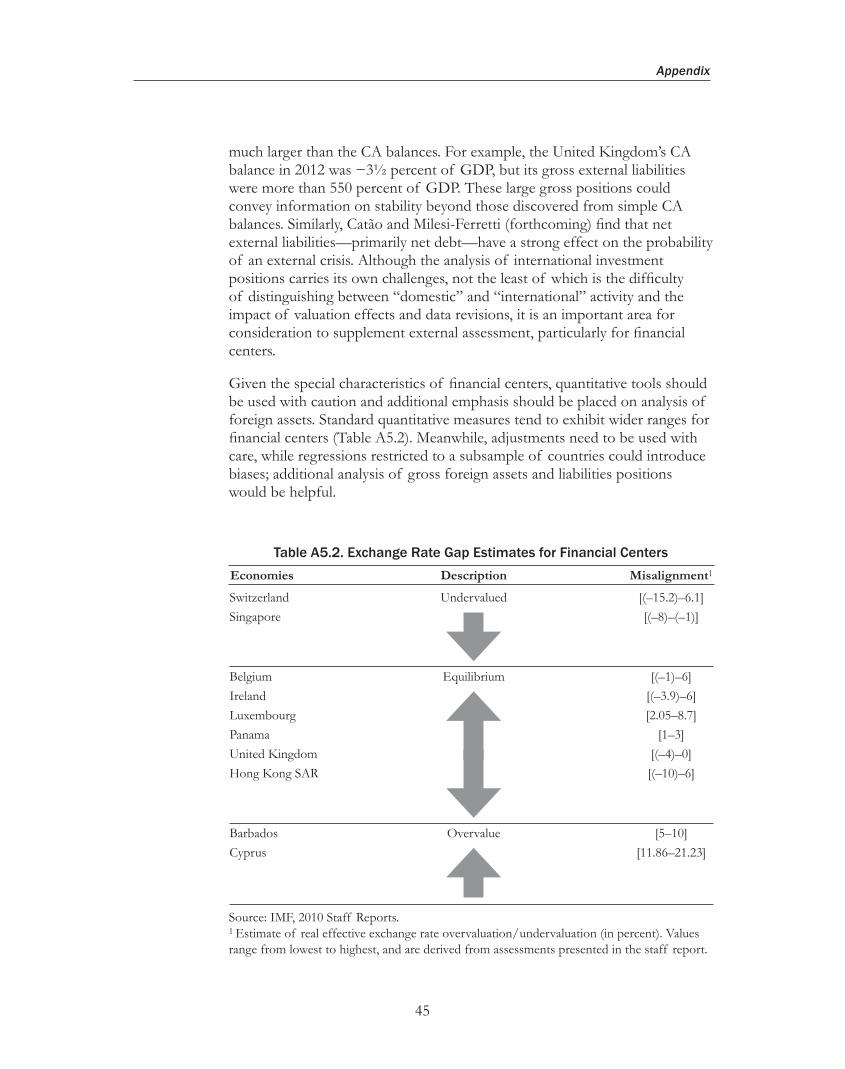
Appendix
45
much larger than the CA balances. For example, the United Kingdom’s CA balance in 2012 was −3½ percent of GDP, but its gross external liabilities were more than 550 percent of GDP. These large gross positions could convey information on stability beyond those discovered from simple CA balances. Similarly, Catão and Milesi-Ferretti (forthcoming) fi nd that net external liabilities—primarily net debt—have a strong effect on the probability of an external crisis. Although the analysis of international investment positions carries its own challenges, not the least of which is the diffi culty of distinguishing between “domestic” and “international” activity and the impact of valuation effects and data revisions, it is an important area for consideration to supplement external assessment, particularly for fi nancial centers.
Given the special characteristics of fi nancial centers, quantitative tools should be used with caution and additional emphasis should be placed on analysis of foreign assets. Standard quantitative measures tend to exhibit wider ranges for fi nancial centers ( Table A5.2 ). Meanwhile, adjustments need to be used with care, while regressions restricted to a subsample of countries could introduce biases; additional analysis of gross foreign assets and liabilities positions would be helpful.
Table A5.2 . Exchange Rate Gap Estimates for Financial Centers
Economies Description Misalignment1
Switzerland Undervalued [(–15.2)–6.1]Singapore [(–8)–(–1)]
Belgium Equilibrium [(–1)–6]Ireland [(–3.9)–6]Luxembourg [2.05–8.7]Panama [1–3]United Kingdom [(–4)–0]Hong Kong SAR [(–10)–6]
Barbados Overvalue [5–10]Cyprus [11.86–21.23]
Source: IMF, 2010 Staff Reports. 1 Estimate of real effective exchange rate overvaluation/ undervaluation (in percent). Values range from lowest to highest, and are derived from assessments presented in the staff report.

46
EXTERNAL ASSESSMENTS IN SPECIAL CASES
Appendix 6. Illustrative Example of Separation of Foreign-Owned Resource Sector
This illustrative example separates the domestic economy from the foreign-owned resource sector. It is based on aggregate data for a nonrenewable commodity exporter and assumptions regarding the composition of external fl ows, particularly related to resource sector imports, income, and services. It then estimates the CA norm for the adjusted economy using the CGER MB approach. The results suggest the potential for Dutch disease more starkly than might be observed by concentrating on the aggregate economy.
The separation is carried out for output, the fi scal balance, and the CA balance:
• Output: The adjusted economy is defi ned as the overall economy excluding the value added of the resource sector. Ideally, domestic labor wages and other inputs would be included in the adjusted economy.
• Fiscal balance: The fi scal balance of the adjusted economy excludes resource revenues and royalties. Instead, these are treated as remittances in the external account of the adjusted domestic economy.
• CA balance: Receipts from commodity exports, corresponding capital imports, and income payments to external investors are treated as part of the “foreign resource–related balance.” 27 The adjusted CA balance for the domestic economy is calculated as the CA balance of total economy less the foreign resource-related balance.
The CA norm is then estimated for the adjusted domestic economy. This requires re-estimating the MB panel using relevant variables for the adjusted domestic sector instead of the aggregate economy. We assume that (1) the economy is relatively small and would not signifi cantly affect results for others countries in the panel, and (2) while the income of the foreign-owned sector should be treated as distributed to nonresidents, this income is small relative to foreign income.
Estimation results show signifi cant divergence between the assessments for the overall economy and the adjusted domestic sector, implying important differences in policy advice. A comparison of MB estimates for the aggregate economy and the domestic non-resource sector, based on adjusted output and fi scal and CA balances, is presented below.
27 As the detailed data for these flows is not available for all years, it was assumed that income payments account for 40 percent of resource export revenues and that resource-related imports amount to 40 percent of FDI inflows, steadily declining through time as the sector matures and requires less capital investment.

47
Appendix
Table A6.1 . Comparison of Current Account Norms: Overall vs. Domestic Economy
Overall Economy Adjusted Economy
CA Norm Underlying CA CA Gap CA Norm Underlying CA CA Gap
2011 4.9 7.6 2.7 −4.7 −10.6 −5.92012 5.1 6.6 1.5 −8.8 −12.3 −3.52013 4.8 5.6 0.7 −9.8 −10.4 −0.62014 3.7 4.0 0.3 −10.4 −7.8 2.52015 3.1 3.3 0.2 −9.4 −5.8 3.62016 2.4 2.8 0.4 −7.2 −4.2 3.02017 2.0 2.9 0.9 −7.0 −2.8 4.2
Source: IMF staff calculations.
Figure A6.1 . Separating a Foreign-Owned Resource Sector
0
5
10
15
20
25
3020
00 01 02 03 04 05 06 07 08 09 10 11 12 13 14 15 16 17
Adjusted economyResource sector
GDP Growth Rate (percent)
–25–20–15–10
–505
1015
2000 01 02 03 04 05 06 07 08 09 10 11 12 13 14 15 16 17
Adjusted economyOverall balance
Fiscal Balance (percent of GDP)
–40
–20
0
20
40
60
80
100
2000 01 02 03 04 05 06 07 08 09 10 11 12 13 14 15 16 17
Income ou�lows Resource-related importsTransporta�on
Resource exportsBalance
Foreign Resource-Related Balance ($mln)
–60–50–40–30–20–10
01020
2000 01 02 03 04 05 06 07 08 09 10 11 12 13 14 15 16 17
Adjusted CAB CAB Adjusted CAB+remi�ances
Current Account Balance (percent of GDP)
Source: IMF staff calculations.

48
EXTERNAL ASSESSMENTS IN SPECIAL CASES
Separating the balances for the domestic sector not only provides insight into domestic policy gaps but can also serve as a consistency check for projections. Some of the results are intuitive: the CA gap is negative and signifi cant for the adjusted domestic economy from 2011 to 2013, pointing to overvaluation and possible Dutch disease. However, the projections assume buoyant output growth in the medium term, which appears implausible given low competiveness levels. The CA gap is expected to change its sign in 2013 or 2014 and widen further leading to the undervaluation over the medium term.

49
References
Araujo, J., B. Li, M. Poplaswki, Ribeiro, L.-F. Zanna, 2013, “Current Account Norms in Natural Resource Rich and Capital Scarce Economies,” IMF Working Paper 13/80 (Washington: International Monetary Fund).
Aydin, Burcu, 2010, “Exchange Rate Assessment for Sub-Saharan Economies,” IMF Working Paper 10/162 (Washington: International Monetary Fund).
Barajas, Adolpho, R. Chami, D. Hakura, and P. Montiel, 2010, “Workers’ Remittances and the Equilibrium Real Exchange Rate: Theory and Evidence,” IMF Working Paper 10/287 (Washington: International Monetary Fund).
Beidas-Strom, Samya, and Paul Cashin, 2011, “Are Middle Eastern Current Account Balances Excessive,” IMF Working Paper 11/195 (Washington: International Monetary Fund).
Bems, R., and I. de Carvalho Filho, 2009, “Exchange Rate Assessments: Methodologies for Oil Exporting Countries,” IMF Working Paper 09/281 (Washington: International Monetary Fund).
———, 2011, “The Current Account and Precautionary Savings for Exporters of Exhaustible Resources,” Journal of International Economics, Vol. 84, No. 1, pp. 48–64.
Berg, A., Shekhar, A., Hussain, M., Roache, S., Mirzoev, T., and A. Mahone, 2007, “The Macroeconomics of Scaling Up Aid—Lessons from Recent Experiences,” IMF Occasional Paper No. 253 (Washington: International Monetary Fund).
Berg, A., J. Gottschalk, R. Portillo, and L. F. Zanna, 2010, “The Macroeconomics of Medium-Term Aid Scaling-up Scenarios,” IMF Working Paper 10/160 (Washington: International Monetary Fund).
Berg, A., R. Portillo, Shu-Chun S. Yang, and L. F. Zanna, 2012, “Public Investment in Resource-abundant Developing Countries,” IMF Working Paper 12/274 (Washington: International Monetary Fund).
Catão, Luis A.V., and Gian Maria Milesi-Ferretti, 2012, “External Liabilities and Crisis Risk,” forthcoming.
Chami, Ralph, A. Barajas, T. Cosimano, C. Fullenkamp, M. Gapen, and P. Montiel, 2008, “Macroeconomic Consequences of Remittances,” IMF Occasional Paper No. 259 (Washington: International Monetary Fund).
References

50
Chudik, Alexander, and Mongardini, Joannes, 2007, “In Search of Equilibrium: Estimating Equilibrium Real Exchange Rates in Sub-Saharan African Countries,” IMF Working Paper 07/90 (Washington: International Monetary Fund).
Collier, P., F, van der Ploeg, and A. J. Venables., 2010, “Managing Resources Revenues in Developing Economies,” Staff Papers , Palgrave Macmillan, Vol. 57(1), pp. 84–118 (Washington: International Monetary Fund).
Di Bella, Gabriel, Mark Lewis, and Aurelie Martin, 2007, “Assessing Competitiveness and Real Exchange Rate Misalignment in Low Income Countries,” IMF Working Paper 07/201 (Washington: International Monetary Fund).
International Monetary Fund, 2011, “Mongolia: 2011 Article IV Consultation,” IMF Country Report 11/76 (Washington).
———, 2012a, “Macroeconomic Policy Frameworks for Resource-Rich Developing Countries,” IMF Policy Paper (Washington, August).
———, 2012b, “Macroeconomic Policy Frameworks for Resource-Rich Developing Countries—Analytic Frameworks and Applications” (Washington).
———, 2013, “Ghana: 2013 Article IV Consultation,” IMF Country Report 13/187 (Washington).
Hendry, D. F., 1995, Dynamic Econometrics , Oxford: Oxford University Press.
Lane, Philip R., and Gian Maria Milesi-Ferretti, 2007, “The External Wealth of Nations Mark II: Revised and Extended Estimates of Foreign Assets and Liabilities, 1970–2004,” Journal of International Economics , Vol. 73, pp. 223–250.
Lee, J., G. Milesi-Ferretti, J. Ostry, A. Prati, and L. Ricci, 2008, “Exchange Rate Assessments: CGER Methodologies,” IMF Occasional Paper 261 (Washington: International Monetary Fund).
Mancini-Griffoli, Tommaso, and Nicolas Stoffels, “Adjusting the Current Account to Better Capture Wealth Accumulation,” SNB Working Paper (forthcoming).
Mongardini, Joannes, and Rayner, Brett, 2009, “Grants, Remittances and the Equilibrium Real Exchange Rate in Sub-Saharan African Countries,” IMF Working Paper 09/75 (Washington: International Monetary Fund).
Morsy, H., 2009, “Current Account Determinants for Oil-Exporting Countries,” IMF Working Paper 09/28 (Washington: International Monetary Fund).
EXTERNAL ASSESSMENTS IN SPECIAL CASES

References
51
Obstfeld, Maurice, 2012, “Does the Current Account Still Matter?” NBER Working Paper 17877 (Cambridge: National Bureau of Economic Research).
Pineda, Emilio, Paul Cashin, and Yan Sun, 2009, “Assessing Exchange Rate Competitiveness in the Eastern Caribbean Currency Union,” IMF Working Paper 09/78 (Washington: International Monetary Fund).
Thomas, Alun, Kim Jun Il, and Aqib Aslam, 2008, “Equilibrium Non-oil Current Account Assessment for Oil-producing Countries,” IMF Working Paper 08/198 (Washington: International Monetary Fund).
Vitek, Francis, 2009, “Exchange Rate Assessment Tools for Advanced, Emerging, and Developing Economies,” Unpublished Manuscript (Washington: International Monetary Fund).

External Assessments in Special Cases