external audit requirements of banking systems …web.unbc.ca/~kumarp/c1.pdf2 analysis of external...
TRANSCRIPT

1
External Audit Requirements of Banking Systems around the World
Hemantha Herath * and Pranesh Kumar**
* Assistant Professor, Business Program, University of Northern British Columbia, 3333 University Way, Prince George, British Columbia, Canada V2N 4Z9; Tel (250) 960-6459; email: [email protected]. ** Associate Professor, Mathematics, University of Northern British Columbia, 3333 University Way, Prince George, British Columbia, Canada V2N 4Z9; Tel (250) 960-6671; email: [email protected].

2
Analysis of External Audit Requirements of Banking Systems around the World
Abstract: There is growing complexity of banking activities worldwide. Due to the nature of risk, dependency on information technology and different jurisdiction in which banks operate, it is important to investigate the nature of auditing requirements of banks. In this paper, we study the external auditing requirements of banking systems around the world using the data of 107 countries from a worldwide survey. Our analysis indicates that there is a direct relationship between banking powers and (a) development status, (b) income based country groupings, and also between government ownership and income-based groupings. However, the association between government ownership and development status is not significant. A direct relationship is also observed between the certified audit requirements of banks and (a) developed, (b) emerging market and (c) offshore country groupings, while it is not found to be significant when the countries are grouped on the basis of income levels. There is no evidence of significant association between monitoring and control of audits on (a) development status and (b) income levels. Similarly, no significant association is observed between the overall audit requirements and (a) development status and (b) income based groupings.
Keywords: Bank Audit, Supervision and Regulations, Global Banking Systems

3
1. Introduction.
With the growing complexity of banking worldwide and the special requirements of bank audits due to the nature of risk, dependency on information technology and different jurisdiction in which banks operate, it is important to investigate the nature of auditing requirements around the world. A recently issued bank audit Exposure Draft by the International Federation of Accountants sets out the auditor’s role with respect to bank audits and considers special reporting relationships between auditors, bank supervisory and other regulatory authorities. This harmonization of audit practices is aimed at enhancing the quality of bank audit reports worldwide.
A recent survey of commercial banks around the world by Barth, Caprio, and Levin (2001b) provides a new database on bank regulation and supervision in 107 countries. The survey include twelve parts, with 175 questions, covering the following aspects of a country’s banking system: entry into banking; ownership; capital; banking activities; external auditing requirements; internal management/ organizational requirements; liquidity and diversification requirements; depositor (savings) protection schemes; provisioning requirements; accounting/information disclosure requirements; discipline/problem institutions/exit, and supervision. The authors provide ways in which the variables may be grouped and aggregated to enable more meaningful characterization of a country’s banking system. Barth, Caprio, and Levin (2001 a, c) describe differences in the variables when countries are grouped according to income level or by geographic region. They further analyze the basic statistics and correlation among key variables such as banking activities, ownership, moral hazard index, private monitoring index, official supervisory power and prompt corrective action.
In this paper we expand upon their work to study the external auditing requirements of banking systems around the world using the data of 107 countries. More specifically, we perform contingency analysis to study the association between key variables related to external audit, banking activities, ownership with income based and development status based groupings. In addition, we analyze the interrelationships among external auditing requirements, banking activities and ownership and investigate the association of these variables with income level and development status based country groupings to characterize external auditing practices in banks around the world. The statistical analysis includes descriptive statistics, correlation and regression analysis. A semantic model of the research issue that we investigate is presented in Figure 1.

4
Association between Variables and Country Groupings
Relationships Among Variables
Figure 1: Semantic model of the research issue
2. Definition of Variables.
The variables with respect to banking activities and ownership are defined using the same groupings as per Barth, Capirio and Levin, 2001b. As regard to the external auditing requirement, we alternatively group these variables under the three headings; Certified Audit Required, Monitoring and Control of Audit by Supervisory Agencies, Overall External Audit Requirement. The definition of variables and relevant question response categories are presented below.
Banking activities
External Auditing Requirement
Government Ownership
DEVELOPMENT STATUS Developed Emerging Offshore
INCOME LEVEL High Income Upper Middle Income Lower Middle Income Lower Income
Banking Activities
External Auditing
Requirements
Government Ownership
DEVELOPMENT STATUS Developed Emerging Offshore
INCOME LEVEL High Income Upper Middle Income Lower Middle Income Lower Income

5
2.1 Bank Activity Regulatory Variables The range of activities that banks are allowed to be engaged and whether banks are allowed to mix commerce with banking functions are likely to affect the performance of the banking industry sector ( Barth, Dopico, Nolle and Wilcox, 2001). The three regulatory variables that affect activities that a bank can engage in are securities, insurance, and real estate activities. • Securities: What is the level of regulatory restrictiveness for bank participation in
securities activities? • Insurance: What is the level of regulatory restrictiveness for bank participation in
insurance activities? • Real estate: What is the level of regulatory restrictiveness for bank participation in
real-estate activities? Using the responses for the above survey questions the regulatory restrictiveness is
quantified based on a composite scale that range from 1 through 4, with the larger number representing greater restrictiveness. The values for 1 through 4 as follows: • Unrestricted (value =1): A full range of activities in the given category can be
conducted directly in the bank. • Permitted (value = 2): A full range of activities can be conducted, but all or some
must be conducted in subsidiaries • Restricted (value = 3): Less than full range of activities can be conducted in the bank
or subsidiary • Prohibited (value = 4): The activity cannot be conducted in either the bank or
subsidiary Another measure of mixing banking and commerce is considered by quantify the
regulatory restrctiveness of the variable on a scale of 1 to 4. The variable and the scale 1 through 4 are defined as follows: Banks owning non-financial firms: How much can a bank mix commerce with its banking activities though the ownership of non-financial firms? Japan and US have high legal barries to mixing banking and commerce. What is the level of regulatory restrictiveness for bank ownership of non-financial firms? • Unrestricted (value =1): A bank may own 100% of the equity in any non-financial
firm • Permitted (value = 2): A bank may own 100% of the equity in a non-financial firm,
but the ownership is limited based on a bank’s equity capital • Restricted (value = 3): A bank can only acquire less than 100% of the equity in a non-
financial firm • Prohibited (value = 4): A bank may not acquire any equity investment in a non-
financial firm We use two variables to measure the regulatory restrictiveness on banking activities
as in Barth, Capirio and Levin, 2001b. The variables are constructed as follows.
6
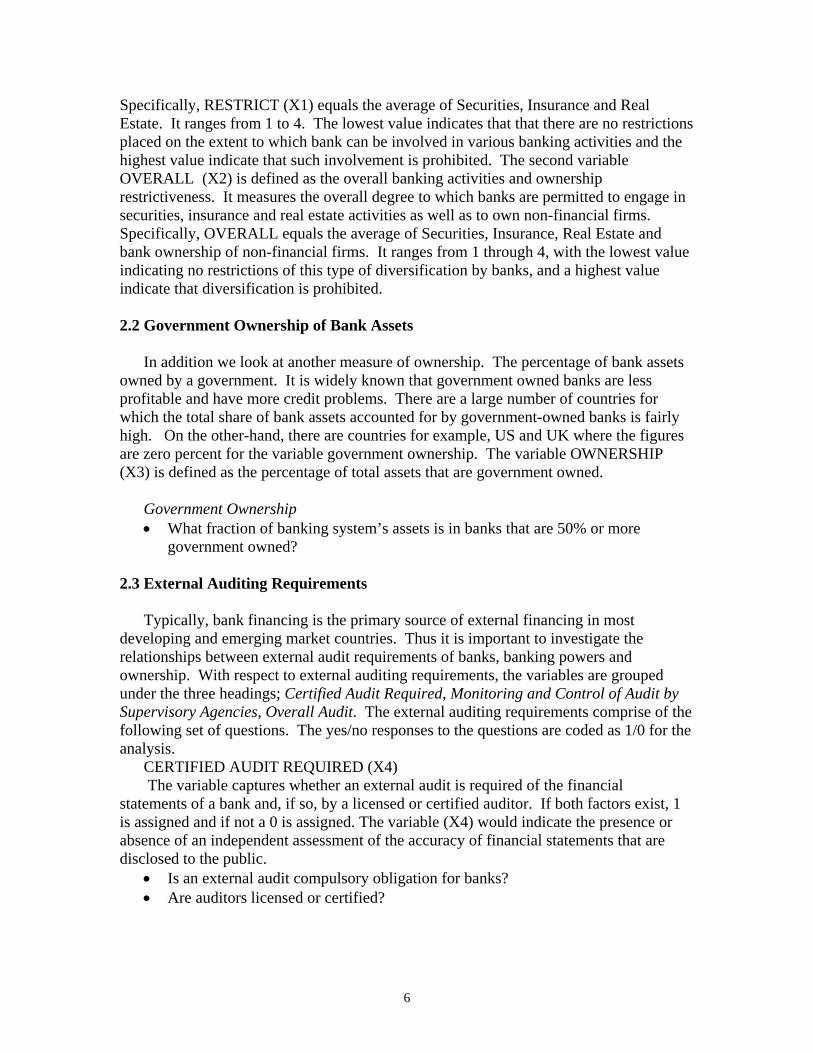
Specifically, RESTRICT (X1) equals the average of Securities, Insurance and Real Estate. It ranges from 1 to 4. The lowest value indicates that that there are no restrictions placed on the extent to which bank can be involved in various banking activities and the highest value indicate that such involvement is prohibited. The second variable OVERALL (X2) is defined as the overall banking activities and ownership restrictiveness. It measures the overall degree to which banks are permitted to engage in securities, insurance and real estate activities as well as to own non-financial firms. Specifically, OVERALL equals the average of Securities, Insurance, Real Estate and bank ownership of non-financial firms. It ranges from 1 through 4, with the lowest value indicating no restrictions of this type of diversification by banks, and a highest value indicate that diversification is prohibited. 2.2 Government Ownership of Bank Assets
In addition we look at another measure of ownership. The percentage of bank assets owned by a government. It is widely known that government owned banks are less profitable and have more credit problems. There are a large number of countries for which the total share of bank assets accounted for by government-owned banks is fairly high. On the other-hand, there are countries for example, US and UK where the figures are zero percent for the variable government ownership. The variable OWNERSHIP (X3) is defined as the percentage of total assets that are government owned.
Government Ownership • What fraction of banking system’s assets is in banks that are 50% or more
government owned?
2.3 External Auditing Requirements
Typically, bank financing is the primary source of external financing in most developing and emerging market countries. Thus it is important to investigate the relationships between external audit requirements of banks, banking powers and ownership. With respect to external auditing requirements, the variables are grouped under the three headings; Certified Audit Required, Monitoring and Control of Audit by Supervisory Agencies, Overall Audit. The external auditing requirements comprise of the following set of questions. The yes/no responses to the questions are coded as 1/0 for the analysis.
CERTIFIED AUDIT REQUIRED (X4) The variable captures whether an external audit is required of the financial
statements of a bank and, if so, by a licensed or certified auditor. If both factors exist, 1 is assigned and if not a 0 is assigned. The variable (X4) would indicate the presence or absence of an independent assessment of the accuracy of financial statements that are disclosed to the public.
• Is an external audit compulsory obligation for banks? • Are auditors licensed or certified?

7
MONITORING AND CONTROL OF AUDITS (X5) Once a bank is operating with in the regulatory environment it is subject to
monitoring and control by various supervisory action. Here, we specifically look at the monitoring and control issues through external audit related supervisory actions. The variable is based upon yes/no responses to the following six questions. This variable indicates whether supervisors have the authority to take specific actions to prevent and correct problems, which is an important component of a bank’s operational risk management. The values range from 1 through 6, with the lowest indicating low monitoring and controlling power by supervisors and highest indicate greater monitoring and control.
• Are specific requirements for the extent or nature of the audit spelled out? • Do supervisors get a copy of the auditor’s report? • Does the supervisory agency have the right to meet with external auditors to
discuss their report without the approval of the bank? • Are auditors required by law to communicate directly to the supervisory agency
any presumed involvement of bank directors or senior managers in illicit activities, fraud, or insider abuse?
• Can supervisors take legal action against external auditors for negligence? • Has action been taken against an auditor in the last five years? OVERALL AUDIT (X6)
We combine two variables CERTIFIED AUDIT REQUIRED (X4), MONITORING, AND CONTROL OF AUDITS (X5) to construct the OVERALL AUDIT (X6) variable. This variable indicates whether qualified auditors perform external audits and if so, the level of monitoring and control imposed by audits and supervisory action. The values are based on the average of yes or no responses to the eight questions. A lowest value of 0 indicates poor quality of an external audit and lower audit control and monitoring by supervisors, where as a high of 1 indicate highest overall quality. 3. Association Between Ownership, Audit Requirements, Banking Activities and
Development and Income Level Groupings
We performed contingency analysis to study the association between key variables related to external audit, banking activities, ownership with the income and development status based groupings. The null hypothesis under test is that the two variables in the row and column of the contingency table are independent, versus the alternative hypothesis that they are not independent. In order to test the hypothesis, the test statistic used is χ2= Σ[(O-E)2/E], with degrees of freedom df = (r-1)*(c-1), where O is the observed cell frequency and E is the expected cell frequency given by E = (Row Total)*(Column Total)/(Grand Total), r = the number of levels of the row variable and c = the number of levels of the column variable. To measure the degree of association, we compute the Karl Pearson's contingency coefficient given by

8
where n = the total observations. The values of C lie between 0, and 1, and a C equal zero indicates that the two variables are not associated at all. The results are summarized below with details provided in Tables 1, 2 and 2.1 in Appendix. Country groups based on development status and the regulatory restrictions on bank activities
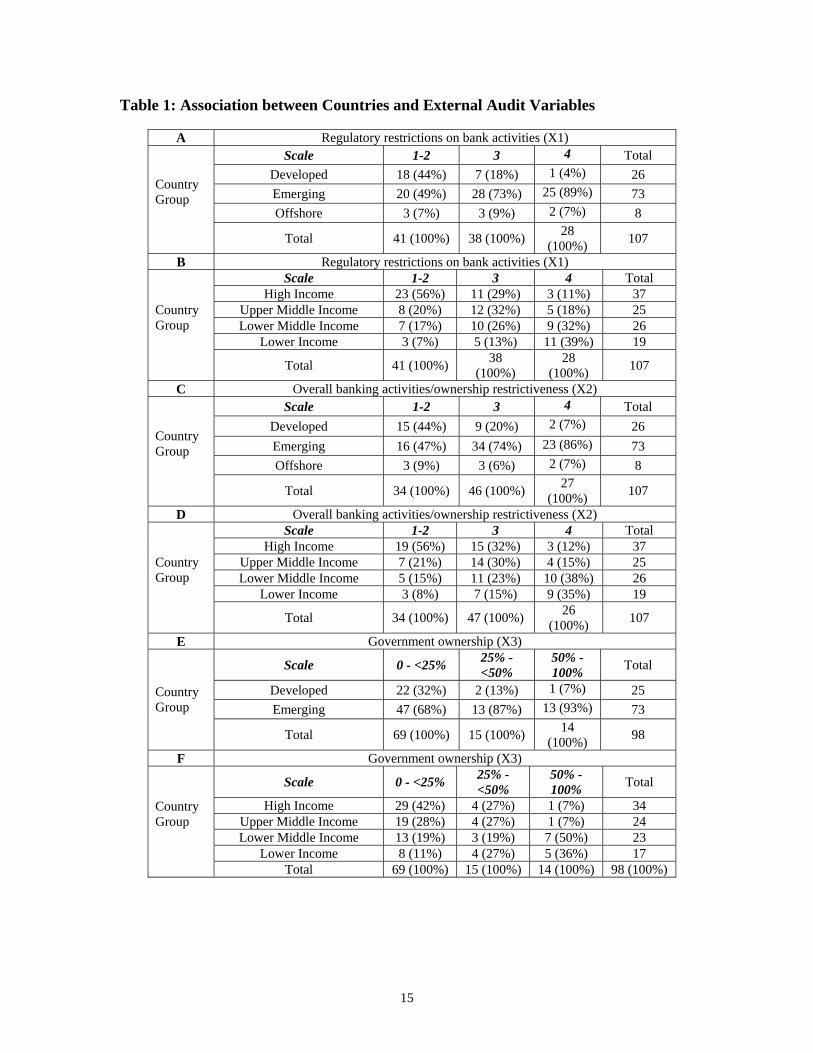
The two-way representation of the three levels of country grouping based on the development status, developed, emerging, offshore and three levels of the values for the RESTRICT variable (i.e., 1-2, 3, 4) are presented in Table 1.A. The values for level 1 and 2 were grouped together since some cells had zero frequencies. The results indicate that of the 28 countries where the bank and subsidiary activities are prohibited emerging countries constituted 89%. For restricted bank and subsidiary activities out of 38 countries 73% belong to emerging countries. The p-value of the test statistic χ2 (= 16.25, df =4) is 0.0027 which is significant at 5% level. The contingency coefficient C is found to be 0.1415. Therefore, there is strong evidence (see Table 2) to conclude the existence of higher association between development status of the countries and the regulatory restrictiveness (in terms of activities that a bank can engage in - securities, insurance, real assets and ownership) on banking activities. Country groupings based on income level and the regulatory restrictions on bank activities
The four levels of country grouping based on the income level (high, upper middle, lower middle, and lower) and three levels of the values for the RESTRICT variable (i.e., 1-2, 3, 4) are presented in Table 1.B. Our analysis indicates that of the 41 countries where bank and subsidiary activities are unrestricted/permitted 56% belong to the high-income group. Further, consistent with the above observation for restricted bank and subsidiary activities, out of 28 countries 71% belong to lower middle and lower income countries. The p-value of the test statistic χ2 (=24.10, df =6) is 0.00049 which is significant at 5% level. The contingency coefficient C is found to be 0.2035. Therefore, there is strong evidence (see Table 2) to conclude the existence of higher association between income level of the countries and regulatory restrictiveness on banking activities. Country groups based on development status and overall banking activities/ownership restrictiveness
The three levels of country grouping based on the development status, developed, emerging, offshore and three levels of the values for the OVERALL variable (i.e., 1-2, 3, 4) are presented in Table 1.C. For the overall variable where both bank activities and bank ownership of non-financial firms is restricted, out of 27 countries 86% belong to emerging markets. This is consistent with the finding for the restrict variable. The p-value of the test statistic χ2 (= 12.82, df =4) is 0.012 which is significant at 5% level. The
n
nC 2
2
1 χ
χ
+=
9
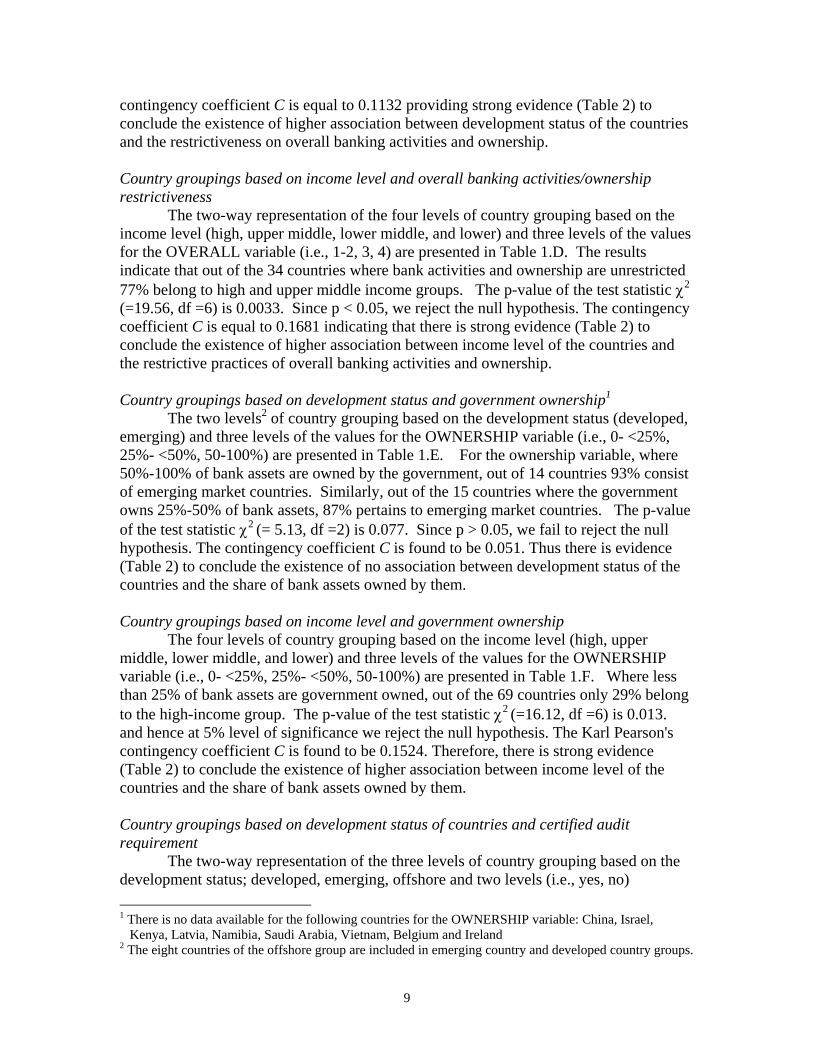
contingency coefficient C is equal to 0.1132 providing strong evidence (Table 2) to conclude the existence of higher association between development status of the countries and the restrictiveness on overall banking activities and ownership. Country groupings based on income level and overall banking activities/ownership restrictiveness
The two-way representation of the four levels of country grouping based on the income level (high, upper middle, lower middle, and lower) and three levels of the values for the OVERALL variable (i.e., 1-2, 3, 4) are presented in Table 1.D. The results indicate that out of the 34 countries where bank activities and ownership are unrestricted 77% belong to high and upper middle income groups. The p-value of the test statistic χ2
(=19.56, df =6) is 0.0033. Since p < 0.05, we reject the null hypothesis. The contingency coefficient C is equal to 0.1681 indicating that there is strong evidence (Table 2) to conclude the existence of higher association between income level of the countries and the restrictive practices of overall banking activities and ownership. Country groupings based on development status and government ownership1
The two levels2 of country grouping based on the development status (developed, emerging) and three levels of the values for the OWNERSHIP variable (i.e., 0- <25%, 25%- <50%, 50-100%) are presented in Table 1.E. For the ownership variable, where 50%-100% of bank assets are owned by the government, out of 14 countries 93% consist of emerging market countries. Similarly, out of the 15 countries where the government owns 25%-50% of bank assets, 87% pertains to emerging market countries. The p-value of the test statistic χ2 (= 5.13, df =2) is 0.077. Since p > 0.05, we fail to reject the null hypothesis. The contingency coefficient C is found to be 0.051. Thus there is evidence (Table 2) to conclude the existence of no association between development status of the countries and the share of bank assets owned by them. Country groupings based on income level and government ownership
The four levels of country grouping based on the income level (high, upper middle, lower middle, and lower) and three levels of the values for the OWNERSHIP variable (i.e., 0- <25%, 25%- <50%, 50-100%) are presented in Table 1.F. Where less than 25% of bank assets are government owned, out of the 69 countries only 29% belong to the high-income group. The p-value of the test statistic χ2 (=16.12, df =6) is 0.013. and hence at 5% level of significance we reject the null hypothesis. The Karl Pearson's contingency coefficient C is found to be 0.1524. Therefore, there is strong evidence (Table 2) to conclude the existence of higher association between income level of the countries and the share of bank assets owned by them. Country groupings based on development status of countries and certified audit requirement
The two-way representation of the three levels of country grouping based on the development status; developed, emerging, offshore and two levels (i.e., yes, no) 1 There is no data available for the following countries for the OWNERSHIP variable: China, Israel, Kenya, Latvia, Namibia, Saudi Arabia, Vietnam, Belgium and Ireland 2 The eight countries of the offshore group are included in emerging country and developed country groups.

10
responses of CERTIFIED AUDIT REQUIRED variable are presented in Table 1.G. In the absence of an independent assessment of financial statements by a qualified auditor, out of the 99 countries 68% belongs to emerging markets. The p-value of the test statistic χ2 (= 19.12, df =2) is 0.0000 and we reject the null hypothesis at 5% level of significance. The contingency coefficient C is 0.1646 providing strong evidence (Table 2) to conclude the existence of higher association between development status of the countries and the certified external audit requirement. Country groupings based on income level and certified audit requirement
The two-way representation of the four levels of country grouping based on the income level (high, upper middle, lower middle, and lower) and the two levels (i.e., yes, no) responses of CERTIFIED AUDIT REQUIRED variable are presented in Table 1.H. For the certified audit variable, in the absence of an independent assessment of a bank’s financial statements out of the 99 countries only 34% belong to high-income group countries. The p-value of the test statistic χ2 (=0.71, df =3) is 0.8695. Since p > 0.05, we fail to reject the null hypothesis at 5% level of significance. The contingency coefficient C is found to be 0.0066. Therefore, there is evidence (Table 2) to conclude that there is no association between income level of the countries and the certified external audit requirement. Country groupings based on development status of countries and monitoring and control
The three levels of country grouping based on the development status; developed, emerging, offshore and three levels of responses (i.e., 0 –2, 3-4, 5-6) for the MONITORING AND CONTROL variable are presented in Table 1.I. When the monitoring and control power by supervisors is low, out of 25 countries, 72% belong to emerging markets. The p-value of the test statistic χ2 (= 6.91, df =4) is 0.1407 which indicate is not significant at 5% level. The contingency coefficient C is 0.06259 indicating there is evidence (Table 2) to conclude no association between development status of the countries and the monitoring and control of external audits by supervisory actions. Country groupings based on income level and monitoring and control
The two-way representation of the four levels of country grouping based on the income level (high, upper middle, lower middle, and lower) and three levels of responses (i.e., 0 –2, 3-4, 5-6) for the MONITORING AND CONTROL variable are presented in Table 1.J. Where the monitoring and control power by supervisors is medium, out of 49 countries, only 38% belong to the high-income group. The p-value of the test statistic χ2
(=2.80, df =6) is 0.834 and at 5% we fail to reject the null hypothesis. The contingency coefficient C is found to be 0.0258. Therefore, there is evidence (Table 2) to conclude none existence of any association between income level of the countries and the monitoring and control of external audits by supervisory actions. Country groupings based on development status of countries and overall audit
The three levels of country grouping based on the development status; developed, emerging, offshore and three levels of values for the OVERALL AUDIT variable (i.e., 0 - 0.50, 0.50 – 0.75, 0.75 – 1) are presented in Table 1.K. When the overall audit quality

11
is poor, out of 27 countries, 11% belong to developed countries. The p-value of the test statistic χ2 (= 5.84, df =4) is 0.2117. Since p > 0.05, we fail to reject the null hypothesis. The contingency coefficient C is found to be 0.0531 indicating there is evidence to conclude no association between development status of the countries and the overall audit indicating whether an external audit is performed by qualified auditors and if so, the monitoring and control of audits by supervisors. Country groupings based on income level and overall audit
The two-way representation of the four levels of country grouping based on the income level (high, upper middle, lower middle, and lower) and three levels of values for the OVERALL AUDIT variable (i.e., 0 - 0.50, 0.50 – 0.75, 0.75 – 1) are presented in Table 1.L. When the overall audit quality is medium, out of 48 countries 42% belong to the high-income group. The p-value of the test statistic χ2 (=4.53, df =6) is 0.6049 and we fail to reject the null hypothesis at 5% significance level. The contingency coefficient C is found to be 0.415. Therefore, there is evidence Table 2) to conclude none existence of any association between income level of the countries and the overall audit indicating whether an external audit is performed by qualified auditors and if so, the monitoring and control of audits by supervisors. 4. Interrelationships Among Bank Activities, Government Ownership and
External Audit Requirements
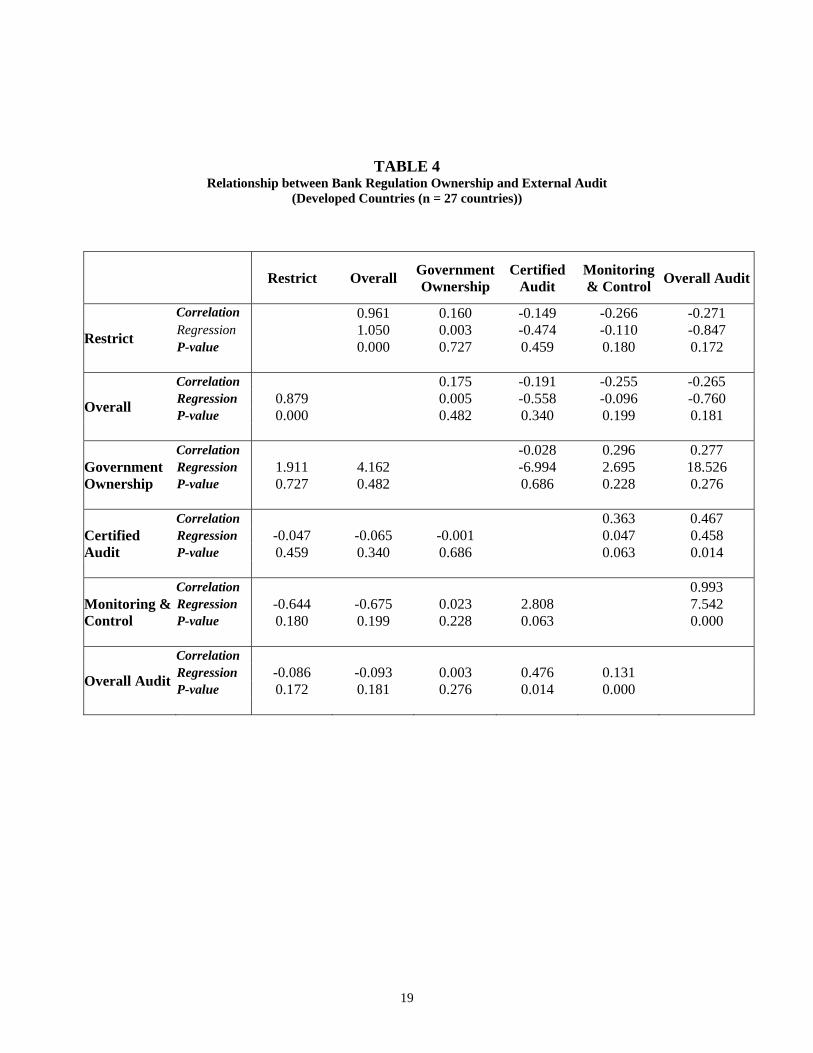
In order to analyze the key variables related to auditing practices we use the data for the 107 countries. For various groupings based on income levels and development status, we obtain descriptive statistics, perform correlation and regression analysis. The results are presented in Tables 2 through Table 9 in Appendix. Restrictiveness and Ownership
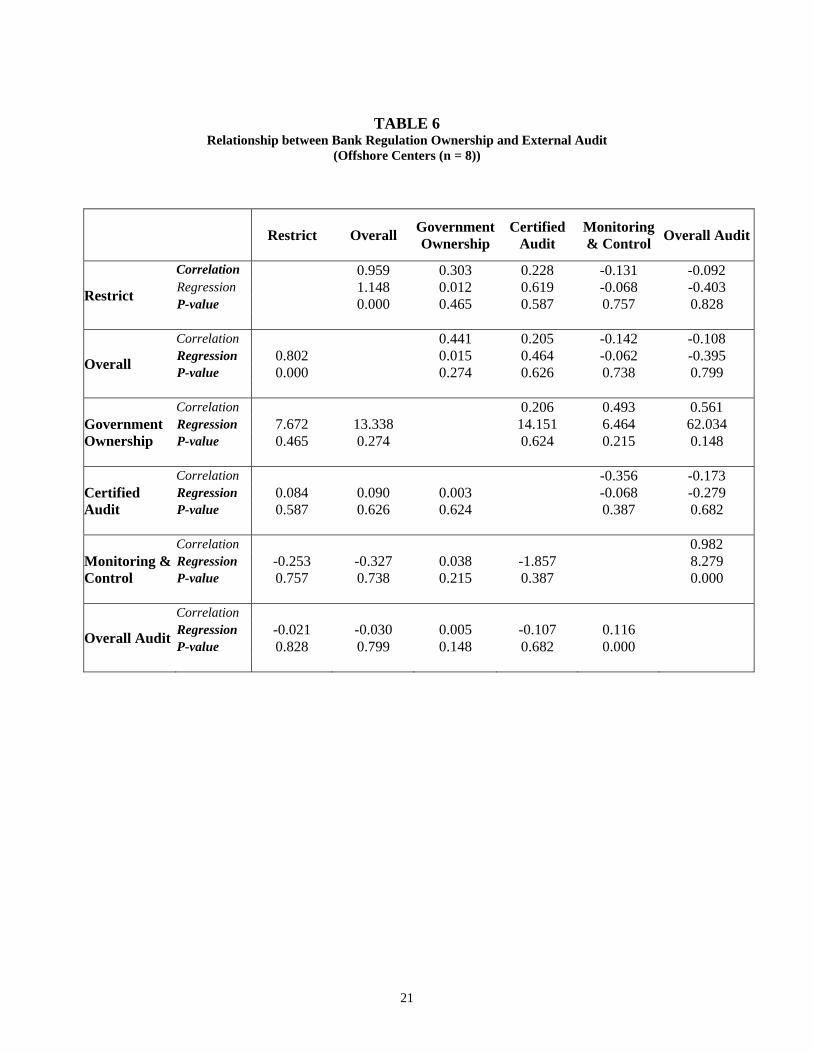
For all 107 countries, emerging market and low income group countries the relationship between restrictions on banking activities and government ownership of bank assets are found to be direct and significant. In case of other groupings such as developed, offshore, high income, upper middle and lower middle the relationships are direct but not significant. When all the 107 countries are considered, the relationship between overall banking activities and government ownership is found to be direct and significant. However, for all other groupings it is positive but not significant. Restrictiveness and External Audit
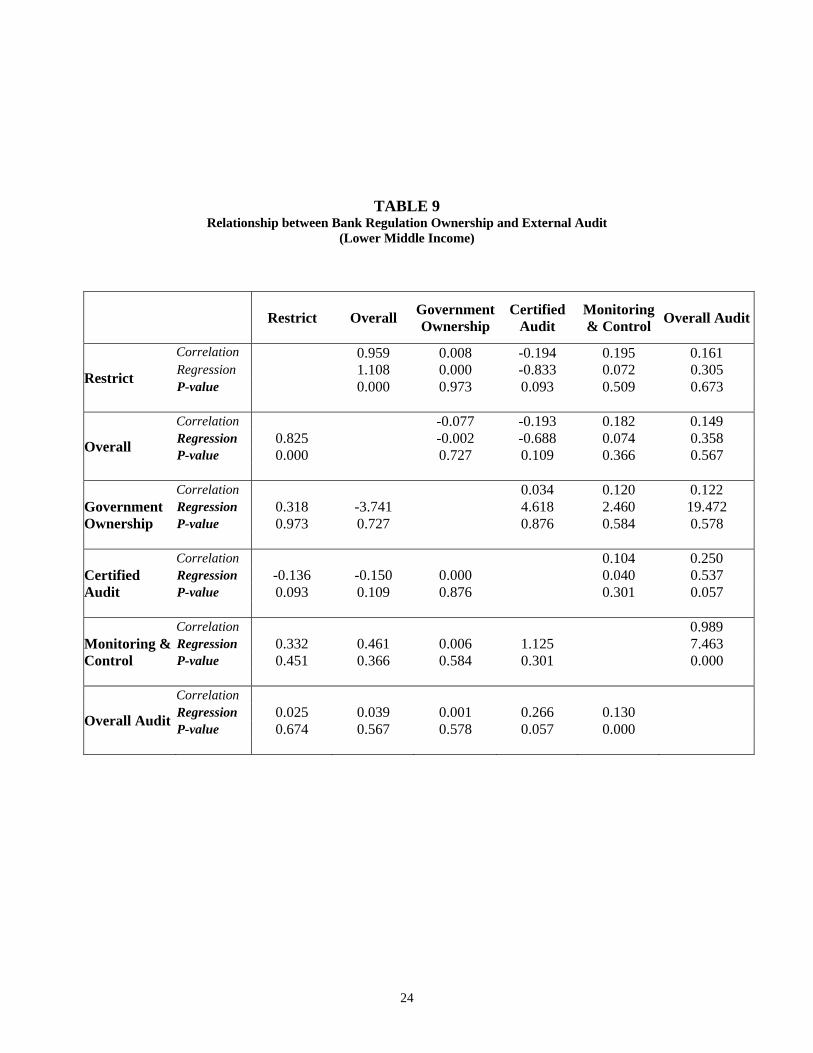
The relationship between restrictions on bank activities and certified audit is indirect and significant only for lower middle income group countries. For other groupings including the full set of 107 countries, it is found to be indirect and not significant. The relationship between restrictions on bank activities and monitoring/control is found to be indirect and significant for the full data set of 107 countries and emerging market countries. The relationship between bank activity restrictions and overall audit requirements is found to be indirect and significant for the full set of 107 countries, emerging market and high-income group countries. The analysis of the relationship between overall banking activities with monitoring/control

12
and overall audit indicate indirect but significant relationship for the full set of data, emerging market countries and high-income group countries. Ownership and Audit Requirements
There is no significant relationship found between government ownership with certified audit, monitoring/control and overall audit for all different groupings of countries. 5. Concluding Remarks
The range of activities that banks are allowed to be engaged in and the ownership relationships are likely to affect the performance of the banking industry sector. Our analysis indicates that there is significant association between banking powers with development status and income based country groupings. Also, our results indicate a high level of association between the composite index of banking powers and a bank’s ability to mix commerce and banking activities and country groupings based on development status and income.
It is widely recognized, as evident from previous studies that the likelihood of poor profitability and credit problems is higher for government owned banks. Our findings reveal that the association between government ownership and the country groupings based on income level is significant. However, the association between government ownership and country groupings based on development status is not significant.
In case of emerging markets and developing countries, bank financing is the primary source of external funding as capital markets are less developed. Although, the use of financial statements by the investment community may tend to be lower in these countries, it is nevertheless important that proper external audits and banks monitoring and controls are performed. Our research findings indicate a significance association between the certified audit requirements of banks and the country groupings categorized as developed, emerging market and offshore. However, the association is not significant when the countries are grouped on the basis of income levels.
The monitoring and control of audits indicate whether supervisors have the authority to take action to prevent and correct problems. Our results show no such evidence of a significant association between monitoring and control of audits and country groupings based on development status and income levels. Similarly, when we considered the external audit requirements of banks, there is no significant association between the overall audit requirements and country groupings based on development status and income.
The interrelationships among baking activities, banking powers combined with ability to mix banking and commerce, government ownership and external auditing requirements are found to be: • direct and significant between restrictions on banking activities and government
ownership for the full set of 107 countries, emerging market and low income group countries

13
• direct and significant between restrictions on banking activities combined with mixing banking and commerce and government ownership for the full set of 107 countries
• indirect and significant between restrictions on banking activities combined with certified audit for lower middle income group countries
• indirect and significant for restrictions on banking activities and monitoring and control for full set of 107 countries and emerging market countries
• indirect and significant for overall audit and bank activities for full set of 107 countries, emerging market and high income group countries
• indirect and significant for overall banking activities with monitoring and control and also with overall audit for the full set of 107 countries, emerging market and high income group countries
• not significant for all the other cases Acknowledgements: The authors are extremely grateful to James R. Barth and session participants of the Pacific Basin Finance, Economics and Accounting (PBFEA) 2002 Conference, Singapore for their comments and suggestions on the earlier draft. References Barth, J.R., G. Caprio Jr., and R. Levine. (2001a). “Banking Systems Around the Globe:
Do Regulations and Ownership Affect Performance and Stability?” in Frederic S. Mishkin, Editor: Prudential Supervision: What Works and What Doesn’t, University of Chicago Press, 2001.
Barth, J.R., G. Caprio Jr., and R. Levine (2001b). “The Regulation and Supervision of Bank Around the World: A New Database,” in Robert E. Litan and Richard Herring, Editors, Integrating EmergingMarket Countries into the Global Financial System, Brookings-Wharton Papers on Financial Services, Brookings Institution Press.
Barth, J.R., G. Caprio Jr., and R. Levine (2001c). “Bank Regulation and Supervision: What Works Best,” World Bank Policy Research Working Paper, August”
Barth, J. R., L. G. Dopico, D.E. Nolle, and J.W. Wilcox (2001). “Bank Safety and Soundness and the Structure of Bank Supervision: A Cross-Country Analysis,” paper presented at the 2001 FMA Annual Meeting, Toronto, Canada, October 18
Barth, J.R. (1991). The Great Savings and Loan Debacle, The AEI Press: Washington, D.C.
Choi, S. J. and A. T. Guzman (1998). “Portable Reciprocity: Rethinking the International Reach of Securities Regulation,” California Law Review, Vol. 81.
Di Noia, C. and G. Di Giorgio (1999). “Should Banking Supervision and Monetary Policy Tasks be Given to Different Agencies?” International Finance, vol. 2:3, 361-378.

14
Furst, K., W.W. Lang, and D.E. Nolle (2001). “Internet Banking in the U.S.: Landscape, Prospects, and Industry Implications,” Journal of Financial Transformation 2 (July): 45-52.
Giddy, I.H. (1994). “Who Should Be the Banking Supervisors,” Paper presented at the Seminar on Current Legal Issues Affecting Central Banks, IMF, May 10, 1994.
Kane, E.J. (1996). “De Jure Interstate Banking: Why Only Now?” Journal of Money, Credit, and Banking, Vol. 28.
Wall, L.D. and R.A. Eisenbeis (2000). “Financial Regulatory Structure and the Resolution of Conflicting Goals,” Journal of Financial Services Research 17(1), 223-245.
15
Table 1: Association between Countries and External Audit Variables
A Regulatory restrictions on bank activities (X1) Scale 1-2 3 4 Total
Developed 18 (44%) 7 (18%) 1 (4%) 26 Emerging 20 (49%) 28 (73%) 25 (89%) 73 Offshore 3 (7%) 3 (9%) 2 (7%) 8
Country Group
Total 41 (100%) 38 (100%) 28 (100%) 107
B Regulatory restrictions on bank activities (X1) Scale 1-2 3 4 Total
High Income 23 (56%) 11 (29%) 3 (11%) 37 Upper Middle Income 8 (20%) 12 (32%) 5 (18%) 25 Lower Middle Income 7 (17%) 10 (26%) 9 (32%) 26
Lower Income 3 (7%) 5 (13%) 11 (39%) 19
Country Group
Total 41 (100%) 38 (100%)
28 (100%) 107
C Overall banking activities/ownership restrictiveness (X2) Scale 1-2 3 4 Total
Developed 15 (44%) 9 (20%) 2 (7%) 26 Emerging 16 (47%) 34 (74%) 23 (86%) 73 Offshore 3 (9%) 3 (6%) 2 (7%) 8
Country Group
Total 34 (100%) 46 (100%) 27 (100%) 107
D Overall banking activities/ownership restrictiveness (X2) Scale 1-2 3 4 Total
High Income 19 (56%) 15 (32%) 3 (12%) 37 Upper Middle Income 7 (21%) 14 (30%) 4 (15%) 25 Lower Middle Income 5 (15%) 11 (23%) 10 (38%) 26
Lower Income 3 (8%) 7 (15%) 9 (35%) 19
Country Group
Total 34 (100%) 47 (100%) 26 (100%) 107
E Government ownership (X3)
Scale 0 - <25% 25% -<50%
50% - 100% Total
Developed 22 (32%) 2 (13%) 1 (7%) 25 Emerging 47 (68%) 13 (87%) 13 (93%) 73
Country Group
Total 69 (100%) 15 (100%) 14 (100%) 98
F Government ownership (X3)
Scale 0 - <25% 25% -<50%
50% - 100% Total
High Income 29 (42%) 4 (27%) 1 (7%) 34 Upper Middle Income 19 (28%) 4 (27%) 1 (7%) 24 Lower Middle Income 13 (19%) 3 (19%) 7 (50%) 23
Lower Income 8 (11%) 4 (27%) 5 (36%) 17
Country Group
Total 69 (100%) 15 (100%) 14 (100%) 98 (100%)

16
Table 1 (con’t): Association between Countries and External Audit Variables
G Certified audit (X4) Scale 0 1 Total
Developed 25 (25%) 1 (12%) 26 Emerging 67 (68%) 6 (76%) 73 Offshore 7 (7%) 1 (12%) 8
Country Group
Total 99 (100%) 8 (100%) 107 H Certified audit (X4)
Scale 0 1 Total High Income 34 (34%) 3 (38%) 37
Upper Middle Income 24 (24%) 1 (12%) 25 Lower Middle Income 24 (24%) 2 (25%) 26
Lower Income 17 (18%) 2 (25%) 19
Country Group
Total 99 (100%) 8 (100%) 107
I Monitoring and Control (X5) Scale 0-2 3-4 5-6 Total
Developed 3 (12%) 15 (31%) 8 (24%) 26 Emerging 18 (72%) 33 (67%) 22 (67%) 73 Offshore 4 (16%) 1 (2%) 3 (9%) 8
Country Group
Total 25 (100%) 49 (100%) 33 (100%) 107 J Monitoring and Control (X5)
Scale 0-2 3-4 5-6 Total High Income 8 (32%) 19 (38%) 10 (30%) 37
Upper Middle Income 5 (20%) 10 (20%) 10 (30%) 25 Lower Middle Income 6 (24%) 11 (25%) 9 (27%) 26
Lower Income 6 (24%) 9 (17%) 4 (13%) 19
Country Group
Total 25 (100%) 49 (100%) 33 (100%) 107 K Certified audit/monitoring and control (X6)
Scale 0 – 0.50 0.50-0.75 0.75-1 Total Developed 3 (11%) 15 (31%) 8 (25%) 26 Emerging 20 (74%) 31 (65%) 22 (69%) 73 Offshore 4 (15%) 2 (4%) 2 (6%) 8
Country Group
Total 27 (100%) 48 (100%) 32 (100%) 107 L Certified audit/monitoring and control (X6)
Scale 0 – 0.50 0.50-0.75 0.75-1 Total High Income 8 (30%) 20 (42%) 9 (28%) 37
Upper Middle Income 5 (18%) 10 (21%) 10 (31%) 25 Lower Middle Income 7 (26%) 10 (21%) 9 (28%) 26
Lower Income 7 (26%) 8 (16%) 4 (13%) 19
Country Group
Total 27 (100%) 48 (100%) 32 (100%) 107

17
TABLE 2
Relationship between External Audit Variables and Country Development and Income Status.
Country Group Bank
Activity Restriction
Overall Banking
Activities/ OwnershipRestriction
GovernmentOwnership
Certified Audit
Monitoring & Control
Certified Audit/
Monitoring & Control
Developed S SS NS S NS NS Emerging S SS NS S NS NS Offshore S SS - S NS NS
High Income S S SS NS NS NS
Upper Middle Income S S SS NS NS NS Lower Middle Income S S SS NS NS NS
Lower Income S S SS NS NS NS S - Significant at 1% level SS- Significant at 5% level NS- Not significant at 5% level
TABLE 2.1 Relationship between variables
Relationship Full data
set Developed countries
Emerging market
Off-shore
High income
Upper middle income
Lower middle
Low income
X1 vs. X3 S S S X1 vs. X5 S S S X1 vs. X6 S S S X2 vs. X3 S X2 vs. X5 S S S X2 vs. X6 S S S X4 vs. X5 S X1 vs. X4 S

18
TABLE 3 Relationship between Bank Regulation Ownership and External Audit
(Full data set of 107 Countries)
Restrict Overall GovernmentOwnership
Certified Audit
Monitoring & Control Overall Audit
Correlation 0.96 0.28 -0.04 -0.22 -0.22 Regression 1.115 0.009 -0.227 -0.114 -0.885 Restrict P-value 0.000 0.005 0.425 0.028 0.024
Correlation 0.25 -0.06 -0.22 -0.22
Regression 0.819 0.007 -0.252 -0.099 -0.784 Overall P-value 0.000 0.012 0.302 0.026 0.019 Correlation 0.05 -0.01 -0.01
Regression 8.466 8.856 4.553 -0.133 -0.730 Government Ownership P-value 0.005 0.012 0.619 0.937 0.954 Correlation 0.14 0.34
Regression -0.027 -0.040 0.001 0.031 0.494 Certified Audit P-value 0.425 0.302 0.619 0.082 0.000 Correlation 0.98
Regression -0.397 -0.469 -0.001 0.917 7.391 Monitoring & Control P-value 0.028 0.026 0.937 0.082 0.000 Correlation
Regression -0.054 -0.065 0.000 0.255 0.130 Overall Audit P-value 0.024 0.019 0.954 0.000 0.000
19
TABLE 4 Relationship between Bank Regulation Ownership and External Audit
(Developed Countries (n = 27 countries))
Restrict Overall GovernmentOwnership
Certified Audit
Monitoring & Control Overall Audit
Correlation 0.961 0.160 -0.149 -0.266 -0.271 Regression 1.050 0.003 -0.474 -0.110 -0.847 Restrict P-value 0.000 0.727 0.459 0.180 0.172
Correlation 0.175 -0.191 -0.255 -0.265
Regression 0.879 0.005 -0.558 -0.096 -0.760 Overall P-value 0.000 0.482 0.340 0.199 0.181 Correlation -0.028 0.296 0.277
Regression 1.911 4.162 -6.994 2.695 18.526 Government Ownership P-value 0.727 0.482 0.686 0.228 0.276 Correlation 0.363 0.467
Regression -0.047 -0.065 -0.001 0.047 0.458 Certified Audit P-value 0.459 0.340 0.686 0.063 0.014 Correlation 0.993
Regression -0.644 -0.675 0.023 2.808 7.542 Monitoring & Control P-value 0.180 0.199 0.228 0.063 0.000 Correlation
Regression -0.086 -0.093 0.003 0.476 0.131 Overall Audit P-value 0.172 0.181 0.276 0.014 0.000

20
TABLE 5 Relationship between Bank Regulation Ownership and External Audit
(Emerging Markets)
Restrict Overall GovernmentOwnership
Certified Audit
Monitoring & Control Overall Audit
Correlation 0.942 0.226 0.030 -0.214 -0.201 Regression 1.108 0.006 -0.059 -0.102 -0.750 Restrict P-value 0.000 0.054 0.834 0.068 0.073
Correlation 0.177 0.008 -0.216 -0.209
Regression 0.797 0.004 -0.096 -0.088 -0.668 Overall P-value 0.000 0.135 0.687 0.061 0.060 Correlation 0.095 -0.066 -0.053
Regression 7.901 7.213 8.358 -1.170 -7.032 Government Ownership P-value 0.054 0.135 0.425 0.577 0.658 Correlation 0.089 0.305
Regression -0.010 -0.022 0.001 0.025 0.500 Certified Audit P-value 0.834 0.687 0.425 0.276 0.003 Correlation 0.973
Regression -0.416 -0.502 -0.004 0.616 7.346 Monitoring & Control P-value 0.068 0.061 0.577 0.276 0.000 Correlation
Regression -0.054 -0.067 0.000 0.220 0.129 Overall Audit P-value 0.073 0.060 0.658 0.003 0.000
21
TABLE 6
Relationship between Bank Regulation Ownership and External Audit (Offshore Centers (n = 8))
Restrict Overall GovernmentOwnership
Certified Audit
Monitoring & Control Overall Audit
Correlation 0.959 0.303 0.228 -0.131 -0.092 Regression 1.148 0.012 0.619 -0.068 -0.403 Restrict P-value 0.000 0.465 0.587 0.757 0.828
Correlation 0.441 0.205 -0.142 -0.108
Regression 0.802 0.015 0.464 -0.062 -0.395 Overall P-value 0.000 0.274 0.626 0.738 0.799 Correlation 0.206 0.493 0.561
Regression 7.672 13.338 14.151 6.464 62.034 Government Ownership P-value 0.465 0.274 0.624 0.215 0.148 Correlation -0.356 -0.173
Regression 0.084 0.090 0.003 -0.068 -0.279 Certified Audit P-value 0.587 0.626 0.624 0.387 0.682 Correlation 0.982
Regression -0.253 -0.327 0.038 -1.857 8.279 Monitoring & Control P-value 0.757 0.738 0.215 0.387 0.000 Correlation
Regression -0.021 -0.030 0.005 -0.107 0.116 Overall Audit P-value 0.828 0.799 0.148 0.682 0.000

22
TABLE 7 Relationship between Bank Regulation Ownership and External Audit
(High Income)
Restrict Overall GovernmentOwnership
Certified Audit
Monitoring & Control Overall Audit
Correlation 0.960 0.140 -0.195 -0.381 -0.408 Regression 1.103 0.006 -0.435 -0.201 -1.542 Restrict P-value 0.000 0.429 0.326 0.016 0.011
Correlation 0.223 -0.218 -0.363 -0.398
Regression 0.046 0.008 -0.434 -0.171 -1.336 Overall P-value 0.000 0.206 0.261 0.019 0.012 Correlation -0.183 0.131 0.049
Regression 3.263 5.940 -10.647 1.530 4.131 Government Ownership P-value 0.429 0.206 0.301 0.460 0.785 Correlation 0.202 0.427
Regression -0.063 -0.083 -0.003 0.038 0.592 Certified Audit P-value 0.326 0.261 0.301 0.244 0.010 Correlation 0.968
Regression -0.775 -0.865 0.011 1.010 7.088 Monitoring & Control P-value 0.016 0.019 0.460 0.244 0.000 Correlation
Regression -0.111 -0.126 0.001 0.293 0.133 Overall Audit P-value 0.011 0.012 0.785 0.010 0.000

23
TABLE 8
Relationship between Bank Regulation Ownership and External Audit (Upper Middle Income)
Restrict Overall GovernmentOwnership
Certified Audit
Monitoring & Control Overall Audit
Correlation 0.915 -0.196 0.197 -0.307 -0.265 Regression 1.018 -0.007 0.542 -0.116 -0.757 Restrict P-value 0.000 0.358 0.341 0.157 0.227
Correlation -0.211 0.201 -0.343 -0.298
Regression 0.820 -0.007 0.500 -0.112 -0.736 Overall P-value 0.000 0.322 0.327 0.125 0.189 Correlation 0.174 0.027 0.050
Regression -5.555 -6.696 13.417 0.302 4.314 Government Ownership P-value 0.358 0.322 0.416 0.902 0.817 Correlation 0.276 0.403
Regression 0.073 0.084 0.002 0.041 0.448 Certified Audit P-value 0.341 0.327 0.416 0.177 0.045 Correlation 0.991
Regression -0.737 -0.885 0.002 1.917 7.552 Monitoring & Control P-value 0.157 0.125 0.902 0.177 0.000 Correlation
Regression -0.083 -0.100 0.001 0.365 0.130 Overall Audit P-value 0.227 0.189 0.817 0.045 0.000
24
TABLE 9 Relationship between Bank Regulation Ownership and External Audit
(Lower Middle Income)
Restrict Overall GovernmentOwnership
Certified Audit
Monitoring & Control Overall Audit
Correlation 0.959 0.008 -0.194 0.195 0.161 Regression 1.108 0.000 -0.833 0.072 0.305 Restrict P-value 0.000 0.973 0.093 0.509 0.673
Correlation -0.077 -0.193 0.182 0.149
Regression 0.825 -0.002 -0.688 0.074 0.358 Overall P-value 0.000 0.727 0.109 0.366 0.567 Correlation 0.034 0.120 0.122
Regression 0.318 -3.741 4.618 2.460 19.472 Government Ownership P-value 0.973 0.727 0.876 0.584 0.578 Correlation 0.104 0.250
Regression -0.136 -0.150 0.000 0.040 0.537 Certified Audit P-value 0.093 0.109 0.876 0.301 0.057 Correlation 0.989
Regression 0.332 0.461 0.006 1.125 7.463 Monitoring & Control P-value 0.451 0.366 0.584 0.301 0.000 Correlation
Regression 0.025 0.039 0.001 0.266 0.130 Overall Audit P-value 0.674 0.567 0.578 0.057 0.000

25
TABLE 10 Relationship between Bank Regulation Ownership and External Audit
(Lower Income)
Restrict Overall GovernmentOwnership
Certified Audit
Monitoring & Control Overall Audit
Correlation 0.931 0.430 0.150 -0.309 -0.274 Regression 1.138 0.013 0.412 -0.141 -0.965 Restrict P-value 0.000 0.085 0.494 0.238 0.307
Correlation 0.287 0.077 -0.289 -0.269
Regression 0.750 0.007 0.162 -0.130 -0.959 Overall P-value 0.000 0.264 0.742 0.177 0.208 Correlation 0.359 -0.214 -0.134
Regression 13.676 11.150 27.041 -3.518 -17.506 Government Ownership P-value 0.085 0.264 0.157 0.410 0.607 Correlation -0.066 0.151
Regression 0.068 0.040 0.005 -0.006 0.267 Certified Audit P-value 0.494 0.742 0.157 0.905 0.490 Correlation 0.977
Regression -0.575 -0.804 -0.013 -0.147 7.733 Monitoring & Control P-value 0.238 0.177 0.410 0.905 0.000 Correlation
Regression -0.063 -0.096 -0.001 0.107 0.124 Overall Audit P-value 0.307 0.208 0.607 0.490 0.000