external quality review york state department of health office of quality and patient safety...
TRANSCRIPT

NEW YORK STATE DEPARTMENT OF HEALTH
OFFICE OF QUALITY AND PATIENT SAFETY
EXTERNAL QUALITY REVIEW
TECHNICAL REPORT FOR:
AFFINITY HEALTH PLAN, INC.
Reporting Year 2015
Published April 2017

Affinity Health Plan, Inc. | Reporting Year 2015 Technical Report i
Table of Contents
I. About This Report ..................................................................................................................................1
II. MCO Corporate Profile ...........................................................................................................................2
III. Enrollment and Provider Network ...........................................................................................................3
ENROLLMENT .....................................................................................................................................................3
PROVIDER NETWORK .........................................................................................................................................6
PRIMARY CARE AND OB/GYN ACCESS AND AVAILABILITY SURVEY—2015 ........................................................9
IV. Utilization ............................................................................................................................................ 10
ENCOUNTER DATA .......................................................................................................................................... 10
HEALTH SCREENINGS....................................................................................................................................... 11
QARR USE OF SERVICES MEASURES ................................................................................................................ 12
V. Quality Indicators ................................................................................................................................. 13
VALIDATION OF PERFORMANCE MEASURES .................................................................................................. 13
SUMMARY OF HEDIS® 2016 INFORMATION SYSTEM AUDIT™ ....................................................................... 13
QARR ACCESS TO/AVAILABILITY OF CARE MEASURES .................................................................................... 17
NYSDOH-CALCULATED QARR PRENATAL CARE MEASURES ............................................................................ 18
MEMBER SATISFACTION.................................................................................................................................. 19
QUALITY PERFORMANCE MATRIX ANALYSIS—2015 MEASUREMENT YEAR ................................................... 20
NYSDOH QUALITY INCENTIVE .......................................................................................................................... 22
PERFORMANCE IMPROVEMENT PROJECT ...................................................................................................... 24
HEALTH DISPARITIES ....................................................................................................................................... 25
VI. Health Information Technology ............................................................................................................ 26
VII. Deficiencies and Appeals ...................................................................................................................... 29
COMPLIANCE WITH NYS STRUCTURE AND OPERATION STANDARDS............................................................. 29
EXTERNAL APPEALS ......................................................................................................................................... 33
VIII. Financial Data ...................................................................................................................................... 34
IX. Strengths and Opportunities for Improvement ...................................................................................... 36
X. Appendix ............................................................................................................................................. 47
REFERENCES .................................................................................................................................................... 47

Affinity Health Plan, Inc. | Reporting Year 2015 Technical Report ii
List of Tables
Table 1: Medicaid Enrollment—2013-2015 ...............................................................................................................3
Table 2: Enrollment: Other Product Lines—2013-2015 .............................................................................................3
Table 3: Medicaid Membership Age and Gender Distribution—December 2015 .....................................................4
Table 4: Medicaid Providers by Specialty—2015 (4th Quarter) ..................................................................................6
Table 5: Ratio of Enrollees to Medicaid Providers—2015 (4th Quarter) ....................................................................7
Table 6: Medicaid PCPs with an Open Panel—2013-2015 (4th Quarter) ....................................................................7
Table 7: HEDIS®/QARR Board Certification Rates—2013-2015 .................................................................................8
Table 8: Medicaid Encounter Data—2013-2015 ..................................................................................................... 10
Table 9: Health Screenings—2013-2015 ................................................................................................................. 11
Table 10: QARR Use of Services—2013-2015 .......................................................................................................... 12
Table 11: QARR MCO Performance Rates—2013-2015 .......................................................................................... 15
Table 12: QARR Access to/Availability of Care Measures—2013-2015 .................................................................. 17
Table 13: QARR Prenatal Care Measures—2012-2014 ........................................................................................... 18
Table 14: CAHPS®—2011, 2013, and 2015 .............................................................................................................. 19
Table 15: Quality Performance Matrix—2015 Measurement Year ........................................................................ 21
Table 16: Quality Incentive Points Earned—2013-2015 ......................................................................................... 22
Table 17: Quality Incentive Measures and Points Earned—2015 ........................................................................... 23
Table 18: Performance Improvement Project—2015-2016 .................................................................................... 24
Table 19: MCO Use of Health Information Technology—2015 Survey of NYS MCOs ............................................. 27
Table 20: Focused Review Types ............................................................................................................................. 30
Table 21: Summary of Citations .............................................................................................................................. 31
Table 22: External Appeals—2013-2015 ................................................................................................................. 33
Table 23: Selected Financial Ratios—2014-2015 .................................................................................................... 34

Affinity Health Plan, Inc. | Reporting Year 2015 Technical Report iii
List of Figures
Figure 1: Enrollment Trends—All Product Lines.........................................................................................................3
Figure 2: Medicaid Enrollees by Age—December 2015 .............................................................................................4
Figure 3: Medicaid Enrollees by Aid Category—December 2015 ..............................................................................5
Figure 4a: Assets to Net Worth and Current Ratio .................................................................................................. 35
Figure 4b: Medical Loss Ratio and Administrative Ratio ......................................................................................... 35

Affinity Health Plan, Inc. | Reporting Year 2015 Technical Report iv
Acronyms Used in This Report
ALOS: Average Length of Stay AO: Area Office CHP: Child Health Plus COM (C): Commercial DBA: Doing Business As DSS: Data Submission System EQR: External Quality Review EQRO: External Quality Review Organization F/A: Failed Audit FAR: Final Audit Report FFS: Fee For Service FHP: Family Health Plus FTE: Full Time Equivalent HCS: Health Commerce System HEDIS: Health Effectiveness Data and
Information Set HIE: Health Information Exchange HIT: Health Information Technology HMO: Health Maintenance Organization HPN: Health Provider Network MCO: Managed Care Organization MED (M): Medicaid MMC: Medicaid Managed Care MMCOR: Medicaid Managed Care Operating
Report N: Denominator N/A: Not Available NCQA: National Committee for Quality
Assurance NP: Not Provided NR: Not Reported NV: Not Valid NYC: New York City NYCRR: New York Code Rules and Regulations NYSDOH: New York State Department of Health
OB/GYN: Obstetrician/Gynecologist OPMC: Office of Professional Medical Conduct OP: Optimal Practitioner Contact OQPS: Office of Quality and Patient Safety PCP: Primary Care Practitioner/Provider PIP: Performance Improvement Project PNDS: Provider Network Data System POC: Plan of Corrective Action PMPY: Per Member Per Year PTMY: Per Thousand Member Years PHSP: Prepaid Health Services Plans PQI: Prevention Quality Indicator Q1: First Quarter (Jan. – March) Q2: Second Quarter (Apr. – June) Q3: Third Quarter (July – Sept.) Q4: Fourth Quarter (Oct. – Dec.) QARR: Quality Assurance Reporting
Requirements R: Rotated ROS: Rest of State RY: Reporting Year SN: Safety Net SOD: Statement of Deficiency SS: Small Sample (Less than 30) SSI: Supplemental Security Income SWA: Statewide Average TANF: Temporary Aid to Needy Families TR: Technical Report UR: Utilization Review

Affinity Health Plan, Inc. | Reporting Year 2015 Technical Report 1
I. About This Report
New York State (NYS) is dedicated to providing and maintaining the highest quality of care for enrollees in managed health care plans. The New York State Department of Health’s (NYSDOH) Office of Quality and Patient Safety (OQPS) employs an ongoing strategy to improve the quality of care provided to plan enrollees, to ensure the accountability of these plans, and to maintain the continuity of care to the public.
The technical reports are individualized reports on the Managed Care Organizations (MCOs) certified to provide Medicaid coverage in NYS. In accordance with federal requirements, these reports summarize the results of the 2015 External Quality Review (EQR) to evaluate access to, timeliness of, and quality of care provided to NYS Medicaid beneficiaries. Mandatory EQR-related activities (as per Federal Regulation 42 CFR §438.358) reported include validation of performance improvement projects (PIPs), validation of MCO-reported and NYSDOH-calculated performance measures, and review for MCO compliance with NYSDOH structure and operation standards. Optional EQR-related activities (as per Federal Regulation 42 CFR §438.358) reported include administration of a consumer survey of quality of care (CAHPS®) by an NCQA-certified survey vendor and technical assistance by the NYS EQRO to MCOs regarding PIPs and reporting performance measures. Other data incorporated to provide additional background on the MCOs include the following: health plan corporate structure, enrollment data, provider network information, encounter data summaries, PQI/compliance/ satisfaction/quality points and incentive, deficiencies and appeals summaries, and financial data.
These reports are organized into the following domains: Corporate Profile, Enrollment and Provider Network, Utilization, Quality Indicators, Health Information Technology, Deficiencies and Appeals, and Financial Data. Although the reports focus primarily on Medicaid data, selected sections of these reports also include data from the MCOs’ Child Health Plus (CHP) and Commercial product lines. For some measures, including QARR 2016 (MY 2015) aggregate rates are used, which represent the population of various product lines. These measures are noted as such. Additionally, when available and appropriate, the MCOs’ data are compared with statewide benchmarks. Unless otherwise noted, when benchmarks are utilized for rates other than HEDIS®/QARR or CAHPS®, comparative statements are based on differences determined by standard deviations: a difference of one standard deviation is used to determine rates that are higher or lower than the statewide average.
Section IX provides an assessment of the MCO’s strengths and opportunities for improvement in the areas of accessibility, timeliness, and quality of services. For areas in which the MCO has opportunities for improvement, recommendations for improving the quality of the MCO’s health care services are provided. To achieve full compliance with federal regulations, this section also includes an assessment of the degree to which the MCO has effectively addressed the recommendations for quality improvement made by the NYS EQRO in the previous year’s EQR report. The MCO was given the opportunity to describe current and proposed interventions that address areas of concern, as well as an opportunity to explain areas that the MCO did not feel were within its ability to improve. The response by the MCO is appended to this section of the report.
In an effort to provide the most consistent presentation of this varied information, the technical report is prepared based on data for the most current calendar year available. Where trending is desirable, data for prior calendar years may also be included. This report includes data for Reporting Year 2015.

Affinity Health Plan, Inc. | Reporting Year 2015 Technical Report 2
II. MCO Corporate Profile
Affinity Health Plan, Inc. (Affinity), formerly known as The Bronx Health Plan, is a regional, not-for-profit prepaid health services plan (PHSP). In January 2002, The Bronx Health Plan merged with Genesis Health Plan and the corporate name was changed to Affinity Health Plan. Affinity services Medicaid (MCD), Health and Recovery Plan (HARP), and Child Health Plus (CHP) populations. The following report presents plan-specific information for the Medicaid line of business and selected information for the CHP product line.
Plan ID: 2010186 DOH Area Office: MARO Corporate Status: PHSP Tax Status: Not-for-profit Medicaid Managed Care Start Date: October 9, 1986 Product Line(s): Medicaid (MCD), Health and Recovery Plan (HARP), and Child Health Plus (CHP) Contact Information: Metro Center Atrium
1776 Eastchester Road Bronx, NY 10461
NCQA Accreditation as of 02/15/17: Did not apply Medicaid Dental benefit Status: Mandatory Benefit
Participating Counties and Products
Bronx: MCD CHP Kings: MCD CHP Nassau: MCD CHP New York: MCD CHP Orange: MCD CHP Queens: MCD CHP Richmond: MCD CHP Rockland: MCD CHP Suffolk: MCD CHP Westchester: MCD CHP
Affinity Health Plan, Inc. | Reporting Year 2015 Technical Report 3
III. Enrollment and Provider Network
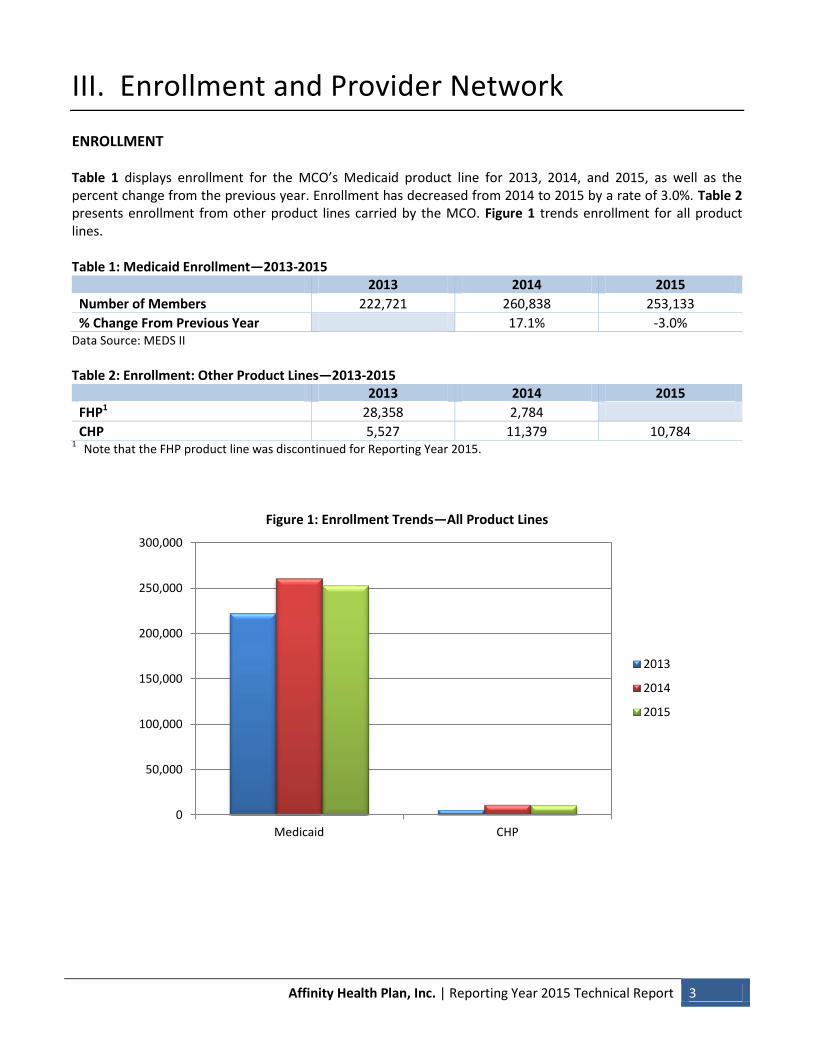
ENROLLMENT Table 1 displays enrollment for the MCO’s Medicaid product line for 2013, 2014, and 2015, as well as the percent change from the previous year. Enrollment has decreased from 2014 to 2015 by a rate of 3.0%. Table 2 presents enrollment from other product lines carried by the MCO. Figure 1 trends enrollment for all product lines. Table 1: Medicaid Enrollment—2013-2015
2013 2014 2015
Number of Members 222,721 260,838 253,133
% Change From Previous Year 17.1% -3.0% Data Source: MEDS II
Table 2: Enrollment: Other Product Lines—2013-2015
2013 2014 2015
FHP1 28,358 2,784
CHP 5,527 11,379 10,784 1 Note that the FHP product line was discontinued for Reporting Year 2015.
Figure 1: Enrollment Trends—All Product Lines
0
50,000
100,000
150,000
200,000
250,000
300,000
Medicaid CHP
2013
2014
2015

Affinity Health Plan, Inc. | Reporting Year 2015 Technical Report 4
Table 3 and Figure 2 display a breakdown of the MCO’s enrollment by age and gender as of December 31, 2015, for the Medicaid product line. The table also indicates whether the MCO’s rate is above (indicated by ▲) or below (indicated by ▼) the statewide average. Table 3: Medicaid Membership Age and Gender Distribution—December 2015
Age in Years Male Female Total MCO
Distribution Statewide Under 1 3,632 3,386 7,018 2.8% 2.9%
1-4 11,959 11,750 23,709 9.4% 9.6%
5-14 25,750 24,337 50,087 19.8% 21.4%
15-19 11,267 11,210 22,477 8.9% 9.0%
20-44 35,058 55,483 90,541 35.8% 35.3%
45-64 24,281 30,978 55,259 21.8% 20.4%
65 and Over 1,411 2,631 4,042 1.6% 1.5%
Total 113,358 139,775 253,133 Under 20 52,608 50,683 103,291 40.8% 42.9%
Females 15-64 97,671 38.6% ▲ 36.5%
Figure 2: Medicaid Enrollees by Age—December 2015
0%
5%
10%
15%
20%
25%
30%
35%
40%
<1 1-4 5-14 15-19 20-44 45-64 65+
Affinity
Statewide

Affinity Health Plan, Inc. | Reporting Year 2015 Technical Report 5
A breakdown of MCO membership by aid category, as reported by the NYSDOH for December 31, 2015, is shown in Figure 3.
Figure 3: Medicaid Enrollees by Aid Category—December 2015
TANF: Temporary Aid to Needy Families SN: Safety Net SSI: Supplemental Security Income UNAS: Unassigned
63.5%
27.9%
8.0%
0.6%
Affinity
65.2%
27.0%
7.0%
0.6%
Statewide

Affinity Health Plan, Inc. | Reporting Year 2015 Technical Report 6
PROVIDER NETWORK Table 4 shows the percentages of various provider types in the MCO’s Medicaid product line for the fourth quarter of 2015 in comparison to the statewide rates. For this table, rates above the statewide average are indicated by ▲, and rates below the statewide average are indicate by ▼. Table 4: Medicaid Providers by Specialty—2015 (4th Quarter)
Specialty Number % of Total MCO Panel % Statewide Primary Care Providers 4,606 16.0% ▼ 20.0%
Pediatrics 1,343 4.7% 4.7%
Family Practice 920 3.2% 4.0%
Internal Medicine 1,924 6.7% 8.3%
Other PCPs 419 1.5% 2.9%
OB/GYN Specialty1 1,596 5.5% 4.7%
Behavioral Health 6,737 23.4% 20.0%
Other Specialties 13,417 46.6% 45.8%
Non-PCP Nurse Practitioners 1,780 6.2% 7.7%
Dentistry 649 2.3% 1.8%
Total 28,785 Data Source: HCS 1 Includes OB/GYN specialists, certified nurse midwives, and OB/GYN nurse practitioners.

Affinity Health Plan, Inc. | Reporting Year 2015 Technical Report 7
Table 5 displays the ratio of enrollees to providers, as well as the number of Full Time Equivalents (FTEs), and the ratio of enrollees to FTEs for the fourth quarter of 2015. Statewide data are also included. For this table, rates above the 90th percentile are indicated by ▲, while rates below the 10th percentile are indicated by ▼. Note that a higher percentile indicates fewer providers per enrollee. Table 5: Ratio of Enrollees to Medicaid Providers—2015 (4th Quarter)
Affinity Statewide
Specialty Type
Ratio of Enrollees to
Providers
Total Number of
FTEs
Ratio of Enrollees to
FTEs
Median Ratio of Enrollees to Providers1
Total Number of
FTEs
Median Ratio of Enrollees
to FTEs Medicaid Primary Care Providers 55:1 3,946 64:1 100:1 42,807 104:1
Pediatrics (Under age 20) 77:1 150:1
OB/GYN (Females age 15-64) 61:1 110:1
Behavioral Health 38:1 89:1
Data Source: Derived ratios calculated from MEDS II enrollment data and HCS provider data. 1 The statewide median was used for this table, as opposed to an average, to control for substantial variability due to outliers.
The number of Medicaid PCPs with an “Open Panel” is presented in Table 6 for the fourth quarters of 2013 through 2015. Panels are considered “open” if a provider has less than 1,500 Medicaid members. For this table, rates above the statewide average are indicated by ▲, while rates below the statewide average are indicated by ▼. Table 6: Medicaid PCPs with an Open Panel—2013-2015 (4th Quarter)
2013 2014 2015
Affinity Statewide Affinity Statewide Affinity Statewide
Number % of
Providers % of
Providers Number % of
Providers % of
Providers Number % of
Providers % of
Providers Medicaid Providers with Open Panel 3,932 100.0% 88.8% 4,418 100.0% 87.6% 4,564 100.0% 86.1%
Data Source: HCS

Affinity Health Plan, Inc. | Reporting Year 2015 Technical Report 8
Table 7 displays HEDIS®/QARR Board Certification rates for 2013 through 2015 of providers in the MCO’s network in comparison to the statewide averages. The table also indicates whether the MCO’s rate was above (indicated by ▲) or below (indicated by ▼) the statewide average. Table 7: HEDIS®/QARR Board Certification Rates—2013-2015
2013 2014 2015
Provider Type Affinity Statewide Average Affinity
Statewide Average Affinity
Statewide Average
Medicaid/CHP Family Medicine 78% 78% 78% 77% 69% ▼ 77%
Internal Medicine 79% 78% 78% 77% 69% ▼ 76%
Pediatricians 78% 80% 77% 80% 71% ▼ 79%
OB/GYN FA 78% 69% ▼ 75% 64% ▼ 76%
Geriatricians FA 69% 52% ▼ 64% 77% ▲ 63%
Other Physician Specialists 75% ▼ 78% 70% ▼ 76% 77% 76% FA: Failed Audit

Affinity Health Plan, Inc. | Reporting Year 2015 Technical Report 9
PRIMARY CARE AND OB/GYN ACCESS AND AVAILABILITY SURVEY—2015 On behalf of the NYSDOH’s Division of Health Plan Contracting and Oversight, the NYS EQRO conducts the Medicaid Managed Care Access and Availability Survey to assess the compliance of network providers in NYS MCOs with appointment timeframe requirements as per the NYS Medicaid/Family Health Plus Managed Care Contract. The survey evaluates the availability of routine and non-urgent “sick” office hour appointments with primary care physicians, including OB/GYNs, as well as the availability of after hours access. The timeliness standard for routine office hour appointments with PCPs and OB/GYNs is within 28 days of the enrollee’s request, while non-urgent “sick” office hour appointments with PCPs and OB/GYNs must be scheduled within 72 hours (excluding weekends and holidays) as clinically indicated. Prenatal appointments with OB/GYN providers within the 2nd trimester must be given within 14 days, while 3rd trimester appointments must be given within 7 days. After hours access is considered compliant if a “live voice” representing the named provider is reached or if the named provider’s beeper number is reached. Note: At the time of publication of this report, the Access and Availability Survey was in progress. The results of the 2016 Access and Availability Survey will be published in the RY 2016 Technical Reports.

Affinity Health Plan, Inc. | Reporting Year 2015 Technical Report 10
IV. Utilization
This section of the report explores utilization of the MCO’s services by examining encounter and health screening data, as well as QARR Use of Services rates.
ENCOUNTER DATA Table 8 displays selected Medicaid encounter data for 2013 through 2015. The MCO’s rates for these periods are also compared to the statewide averages. For this table, rates above the statewide average are indicated by ▲, while rates below the statewide average are indicate by ▼. Table 8: Medicaid Encounter Data—2013-2015
Encounters (PMPY)
2013 2014 2015
Affinity Statewide Average Affinity
Statewide Average Affinity
Statewide Average
PCPs and OB/GYNs 3.63 ▼ 4.45 3.34 ▼ 4.36 3.50 4.12
Specialty 2.11 1.90 2.29 1.94 2.45 ▲ 1.92
Emergency Room 0.57 0.60 0.75 ▼ 2.11 0.53 0.54
Inpatient Admissions 0.14 0.14 0.14 0.15 0.14 0.14
Dental 0.72 ▼ 1.00 0.74 ▼ 1.03 0.84 0.99 Data Source: MEDS II PMPY: Per Member Per Year

Affinity Health Plan, Inc. | Reporting Year 2015 Technical Report 11
HEALTH SCREENINGS In accordance with 13.6(a)(ii) of the Medicaid Managed Care and Family Health Plus Model Contract, MCOs must make reasonable efforts to contact new enrollees within 30 days of enrollment either in person, by telephone, or by mail, and conduct a brief health screening to assess special health care needs (e.g., prenatal care or behavioral health services), as well as language and communication needs. MCOs are required to submit a quarterly report to the NYSDOH showing the percentage of new enrollees for which the MCO was able to complete health screenings. Table 9 summarizes the percentage of Medicaid enrollees receiving health screenings within 30 days of enrollment from 2013 through 2015, in addition to displaying the statewide averages for these years. For this table, rates above the statewide average are indicated by ▲, and rates below the statewide average are indicated by ▼. Table 9: Health Screenings—2013-2015
2013 2014 2015
Affinity SWA Affinity SWA Affinity SWA Medicaid Enrollee Health Screenings 16.4% 25.3% 17.7% 15.1% 13.7% 14.9%

Affinity Health Plan, Inc. | Reporting Year 2015 Technical Report 12
QARR USE OF SERVICES MEASURES For this domain of measures, performance is assessed by indicating whether the MCO’s rates reached the 90th or 10th percentiles. Table 10 lists the Use of Services rates for the selected product lines for 2013 through 2015. The table displays whether the MCO’s rate was higher than 90% of all rates for that measure (indicated by ▲) or whether the MCO’s rate was lower than 90% of all rates for that measure (indicated by ▼). Table 10: QARR Use of Services—2013-2015
Medicaid/CHP
Measure 2013 2014 2015 2015
Statewide Average Outpatient Utilization (PTMY) Visits 3,953 ▼ NV 5,024 5,398
ER Visits 582 NV 544 554 Inpatient ALOS Medicine 4.2 NV 4.3 4.1
Surgery 8.1 ▲ NV 7.2 6.2
Maternity 3.2 ▲ NV 3.1 ▲ 2.8
Total 4.4 NV 4.4 4.1 Inpatient Utilization (PTMY) Medicine Cases 48 NV 34 36
Surgery Cases 13 NV 13 15
Maternity Cases 43 NV 34 32
Total Cases 92 NV 71 75 PTMY: Per Thousand Member Years ALOS: Average Length of Stay. These rates are measured in days. NV: Not valid. The MCO submitted invalid data for the Reporting Year.

Affinity Health Plan, Inc. | Reporting Year 2015 Technical Report 13
V. Quality Indicators
To measure the quality of care provided by the MCOs, the State prepares and reviews a number of reports on a variety of quality indicators. This section is a summary of findings from these reports, including HEDIS®/QARR 2016 audit findings, as well as results of quality improvement studies, enrollee surveys, and MCO Performance Improvement Projects (PIPs).
VALIDATION OF PERFORMANCE MEASURES Performance measures are reported and validated using several methodologies. MCOs submitted member- and provider-level data for several measures to the NYSDOH. The NYS EQRO audited all member- and provider-level data for internal consistency. Several performance measures are calculated by the NYSDOH, with source code validated by the NYS EQRO. Finally, MCOs report a subset of HEDIS® measures to the NYSDOH annually, along with several NYS-specific measures. MCO-reported performance measures were validated as per HEDIS® 2016 Compliance Audit™ specifications developed by the National Committee for Quality Assurance (NCQA). Since measurement year (MY) 2013, the methodology for reporting performance rates was modified. Previously, Medicaid and Child Health Plus (CHP) were reported separately; however, for QARR 2016 (MY 2015), rates for these populations were combined, following HEDIS® methodology (summing numerators and denominators from each population). Trend analysis has been applied over the time period, as the effect of combining the CHP and Medicaid populations was determined to be negligible through an analysis of historical QARR data. The results of each MCO’s HEDIS® Compliance Audit™ are summarized in its Final Audit Report (FAR).
SUMMARY OF HEDIS® 2016 INFORMATION SYSTEM AUDIT™ As part of the HEDIS® 2016 Compliance Audit™, auditors assessed the MCO’s compliance with NCQA standards in the six designated information system categories, as follows:
1. Sound Coding Methods for Medical Data 2. Data Capture, Transfer, and Entry—Medical Data 3. Data Capture, Transfer, and Entry—Membership Data 4. Data Capture, Transfer, and Entry—Practitioner Data 5. Data Integration Required to Meet the Demands of Accurate HEDIS® Reporting 6. Control Procedures that Support HEDIS® Reporting and Integrity
In addition, two HEDIS®-related documentation categories were assessed:
1. Documentation 2. Outsourced or Delegated HEDIS® Reporting Functions
The NYS EQRO provided technical assistance to MCOs throughout the performance measure reporting process in the following forms: 1) introductory and technical workshops prior to the audit, 2) readiness reviews for new MCOs, 3) serving as a liaison between the MCOs and NCQA to clarify questions regarding measure specifications, 4) preparation of and technical support for the Data Submission System (DSS) used to submit data to the NYSDOH, and 5) clarifications to MCO questions regarding the submission of member- and provider-level data, as well as general questions regarding the audit process. The HEDIS® Final Audit Report for Affinity indicated that the MCO demonstrated compliance in most areas of Information Systems and all areas of measures required for successful HEDIS®/QARR reporting. The MCO was

Affinity Health Plan, Inc. | Reporting Year 2015 Technical Report 14
deemed Partially Compliant with IS 4.0 Medical Record Review Processes—Training, Sampling, Abstraction, and Oversight and IS 7.0 Data Integration—Accurate HEDIS® Reporting, Control Procedures That Support HEDIS® Reporting Integrity. The MCO was able to report most measures for its Medicaid product line. Affinity experienced issues with medical record retrieval, causing the MCO to be unable to report rates for several measures. As stated in the FAR, the MCO should increase their over-read process on abstracted medical record data to ensure accuracy, as well as conduct Inter-Rater Reliability early in the HEDIS® process to identify and address any issues. Additionally, it is recommended in the FAR that the MCO develop a process to ensure that the medical record review process to ensure that the medical record review process is started earlier and monitoring reports are used to access the status of the medical record process. The MCO used NCQA-certified software to produce its HEDIS® measures. Supplemental databases were used to capture additional data, as well. These databases were validated and determined to be HEDIS®-compliant by the auditors. Affinity passed Medical Record Review for the five measures validated, as well as for Exclusions. Table 11 displays QARR performance rates for Measurement Years 2013, 2014, and 2015, as well as the statewide averages (SWAs). The table indicates whether the MCO’s rate was statistically better than the SWA (indicated by ▲) or whether the MCO’s rate was statistically worse than the SWA (indicated by ▼).
Table Notes for Table 11 R:
NR:
NP:
FY:
SS:
Rotated measure.
Not reported.
Dental benefit not provided.
First-Year Measure, MCO-specific rates not reported.
Sample size too small to report (less than 30 members) but included in the statewide average.

Affinity Health Plan, Inc. | Reporting Year 2015 Technical Report 15
Table 11: QARR MCO Performance Rates—2013-2015 Medicaid/CHP
Measure 2013 2014 2015 2015 SWA Follow-up Care for Children on ADHD Meds—Continue 58 76 60 67
Follow-up Care for Children on ADHD Meds—Initial 50 ▼ 65 ▲ 52 ▼ 58
Adolescents—Alcohol and Other Drug Use 73 R NV 68
Adolescents—Depression 66 R NV 60
Adolescents—Sexual Activity 70 R NV 65
Adolescents—Tobacco Use 77 R NV 74
Adolescent Immunization—Combo 75 R 75 74
Adolescent Immunization—HPV 31 18 ▼ 35 31
Adult BMI Assessment 87 R NV 90
Flu Shot for Adults (Ages 18-64) 43 R 45 40
Advising Smokers to Quit 79 R 68 80
Follow-up After Hospitalization for Mental Illness—30 Days 69 ▼ 62 ▼ 71 ▼ 79
Follow-up After Hospitalization for Mental Illness—7 Days 55 ▼ 40 ▼ 53 ▼ 65
Antidepressant Medication Management—Continue 35 37 35 37
Antidepressant Medication Management—Acute Phase 50 52 49 52
Drug Therapy for Rheumatoid Arthritis 77 80 79 81
Asthma Medication Ratio (Ages 19-64) 60 58 ▲ 53 54
Asthma Medication Ratio (Ages 5-18) 70 69 ▲ 58 ▼ 62
Use of Imaging Studies for Low Back Pain 77 77 76 76
Persistence of Beta-Blocker Treatment After a Heart Attack 74 ▼ 88 85 86
Avoidance of Antibiotics for Adults with Acute Bronchitis 27 29 33 30
Chlamydia Screening (Ages 16-24) 76 ▲ 75 ▲ 76 ▲ 73
Colon Cancer Screening 66 ▲ R 63 61
Dental Visit (Ages 19-21) 42 ▼ 32 ▼ 37 ▼ 44
Annual Dental Visits (Ages 2-18) 61 45 ▼ 52 ▼ 60
Diabetes BP Controlled (<140/90 mm Hg) 70 R NV 68
Diabetes HbA1c below 8% 55 R NV 57
Diabetes Eye Exam 57 ▼ R 50 ▼ 63
Diabetes Nephropathy Monitor 81 R 93 93
Diabetes HbA1c Test 86 ▼ R 85 ▼ 91
NV: Not valid. The MCO reported invalid data.

Affinity Health Plan, Inc. | Reporting Year 2015 Technical Report 16
Table 11: QARR MCO Performance Rates—2013-2015 (continued) Medicaid/CHP
Measure 2013 2014 2015 2015 SWA HIV—Engaged in Care 82 85 ▲ NV 82
HIV—Syphilis Screening 69 69 ▼ NV 74
HIV—Viral Load Monitoring 68 68 NV 71
Childhood Immunization—Combo 3 76 R 79 ▲ 75
Lead Testing 87 R 89 87
Breast Cancer Screening 71 70 69 ▼ 71
Smoking Cessation Medications 52 R 49 59
Medical Management for People with Asthma 50% (Ages 19-64) 68 65 71 ▲ 68
Medical Management for People with Asthma 50% (Ages 5-18) 54 48 57 ▲ 53
Smoking Cessation Strategies 47 R 44 51
Monitor Patients on Persistent Medications—Combined 89 ▼ 90 ▼ 90 ▼ 92
Pharmacotherapy Management for COPD—Bronchodilator 87 88 87 88
Pharmacotherapy Management for COPD—Corticosteroid 73 72 76 75
Testing for Pharyngitis 82 ▼ 90 84 ▼ 88
Diabetes Monitoring for Schizophrenia 69 ▼ 72 76 80
Diabetes Screen for Schizophrenia or Bipolar Disorder on Antipsychotic Meds 75 ▼ 77 ▼ 81 82
Antipsychotic Meds for Schizophrenia 67 ▲ 64 66 ▲ 61
Spirometry Testing for COPD 49 49 51 56
Treatment for Upper Respiratory Infection 92 94 ▲ 95 ▲ 94
Well-Child Visits—First 15 Months 70 69 ▲ 72 ▲ 65
Well-Child Visits—3 to 6 Years 83 84 80 ▼ 84
Well-Care Visits for Adolescents 61 ▼ 64 61 ▼ 65
Children BMI 76 R NV 77
Children Counseling for Nutrition 79 R NV 80
Children Counseling for Physical Activity 73 ▲ R NV 72
NV: Not valid. The MCO reported invalid data.

Affinity Health Plan, Inc. | Reporting Year 2015 Technical Report 17
QARR ACCESS TO/AVAILABILITY OF CARE MEASURES The QARR Access to/Availability of Care measures examine the percentages of children and adults who access certain services, including PCPs or preventive services, prenatal and postpartum care, and dental services for selected product lines. Table 12 displays the Access to/Availability of Care measures for Measurement Years 2013 through 2015. The table indicates whether the MCO’s rate was higher than 90% of all MCOs for that measure (indicated by ▲) or whether the MCO’s rate was lower than 90% of MCOs for that measure (indicated by ▼). Table 12: QARR Access to/Availability of Care Measures—2013-2015
Medicaid/CHP
Measure 2013 2014 2015 2015 SWA Children and Adolescents’ Access to PCPs (CAP) 12-24 Months 96% ▼ 95% ▼ 95% ▼ 95%
25 Months-6 Years 93% ▼ 93% ▼ 91% ▼ 94%
7-11 Years 96% ▼ 96% ▼ 95% ▼ 97%
12-19 Years 92% ▼ 93% ▼ 92% ▼ 94% Adults’ Access to Preventive/Ambulatory Services (AAP) 20-44 Years 83% ▼ 82% ▼ 81% ▼ 83%
45-64 Years 89% ▼ 89% ▼ 88% ▼ 90%
65+ Years 87% ▼ 87% ▼ 87% ▼ 90% Access to Other Services Timeliness of Prenatal Care R 89% NV 88%
Postpartum Care R 66% NV 70%
Annual Dental Visit1 59% ▼ 44% ▼ 51% ▼ 59% R: Rotated measure NV: Not valid. The MCO submitted invalid data. 1 For the Annual Dental Visit measure, the Medicaid age group is 2-21 years, while the Child Health Plus age group is 2-18 years.

Affinity Health Plan, Inc. | Reporting Year 2015 Technical Report 18
NYSDOH-CALCULATED QARR PRENATAL CARE MEASURES Certain QARR prenatal care measures are calculated by the NYSDOH using birth data submitted by the MCOs, as well as from NYSDOH’s Vital Statistics Birth File. Since some health events, such as low birth weight births and cesarean deliveries, do not occur randomly across all MCOs, risk adjustment is used to remove or reduce the effects of confounding factors that may influence an MCO’s rate. Table 13 presents prenatal care rates calculated by the NYSDOH for QARR 2012 through 2014. In addition, the table indicates if the MCO’s rate was significantly better than the average (indicated by ▲) or whether the MCO’s rate was significantly worse than the average (indicated by ▼). Table 13: QARR Prenatal Care Measures—2012-2014
2012 2013 2014
Measure Affinity NYS/ROS Average Affinity
NYS/ROS Average Affinity
NYS/ROS Average
NYC Risk-Adjusted Low Birth Weight1 5% 6% 6% 6% 6% 6%
Prenatal Care in the First Trimester 72% 73% 71% ▼ 75% 69% ▼ 75%
Risk-Adjusted Primary Cesarean Delivery1 16% 16% 17% 16% 14% 15%
Vaginal Birth After Cesarean 15% 17% 13% ▼ 19% 13% 18% ROS Risk-Adjusted Low Birth Weight1 8% 7% 8% 7% 8% 7%
Prenatal Care in the First Trimester 69% 71% 72% 72% 71% 74%
Risk-Adjusted Primary Cesarean Delivery1 16% 15% 16% 15% 15% 13%
Vaginal Birth After Cesarean 11% 11% 8% 12% 11% 13% 1 A low rate is desirable for this measure.
NYC: New York City ROS: Rest of State

Affinity Health Plan, Inc. | Reporting Year 2015 Technical Report 19
MEMBER SATISFACTION In 2015, the CAHPS® survey for Medicaid enrollees was conducted on behalf of the NYSDOH by an NCQA-certified survey vendor. Table 14 displays the question category, the MCO’s rates, and statewide averages for Measurement Years 2011, 2013, and 2015. The table also indicates whether the MCO’s rate was significantly better than the statewide average (SWA) (indicated by ▲) or whether the MCO’s rate was significantly worse than the SWA (indicated by ▼). Table 14: CAHPS®—2011, 2013, and 2015
2011 2013 2015
Measure Affinity Statewide Average Affinity
Statewide Average Affinity
Statewide Average
Medicaid Flu Shots for Adults Ages 18-641 43 44 45 40
Advising Smokers to Quit 71 78 79 78 68 80
Getting Care Needed2 74 75 77 78 78 79
Satisfaction with Provider Communication2 90 87 89 89 92 91
Coordination of Care2 67 68 81 78 84 80
Customer Service2 79 81 85 82 90 ▲ 84
Collaborative Decision Making2 64 ▲ 58 49 48 78 79
Rating of Healthcare 69 67 70 71 73 75
Rating of Health Plan—High Users 75 73 78 77 78 77
Getting Care Quickly2 76 76 75 78 81 80
Rating of Counseling/Treatment 63 59 63 61 79 ▲ 64
Overall Rating of Health Plan 71 71 75 76 77 76
Rating of Personal Doctor2 77 73 78 78 83 80
Rating of Specialist 74 69 76 76 76 80
Getting Needed Counseling/Treatment 72 71 66 70 86 ▲ 74
Recommend Plan to Family/Friends 91 91 91 92 92 93
Wellness Discussion 60 55 68 71 69 68 1 Prior to 2013, this measure was reported for adults age 50-64 years.
2 These indicators are composite measures.

Affinity Health Plan, Inc. | Reporting Year 2015 Technical Report 20
QUALITY PERFORMANCE MATRIX ANALYSIS—2015 MEASUREMENT YEAR Table 15 displays the Quality Performance Matrix, which predominantly summarizes Effectiveness of Care measures, though it also contains select Use of Services and Access to/Availability of Care measures reported annually in the New York State Managed Care Plan Performance Report. Fifty-eight measures were selected for the 2015 Measurement Year (MY) Quality Performance Matrix, which included combined measures for the Medicaid and CHP product lines. The matrix diagrams the MCO’s performance in relation to its previous year’s quality rates and also compares its rates to those of other Medicaid Managed Care Organizations through a percentile ranking. For the MY 2012 Quality Performance Matrix, the NYSDOH made modifications in order to focus on those measures in need of the most improvement statewide. For previous measurement years, the cell category (A-F) was determined by the year-over-year trend of the measure (vertical axis) and by any significant difference from the statewide average (horizontal axis). For the 2012 MY, the matrix was reformatted to maintain the year-over-year evaluation on the vertical axis, but to evaluate the MCO’s performance based on a percentile ranking on the horizontal axis. The new percentile ranking was partitioned into three categories: 0-49th percentile, 50th-89th percentile, and 90th-100th percentile. The 2012 matrix included only those measures for which the 2011 Medicaid statewide average was less than a predetermined benchmark; however, for MY 2015, additional measures were included to provide MCOs with a broader overview of quality performance, and further assist MCOs in identifying and prioritizing quality improvement. With the issuance of the 2008 MY Matrix, the NYSDOH modified its MCO requirements for follow-up action. In previous years, MCOs were required to develop root cause analyses and plans of action for all measures reported in the D and F categories of the matrix. Starting with the 2008 MY Matrix, MCOs were required to follow-up on no more than three measures from the D and F categories of the matrix. However, if an MCO had more than three measures reported in the F category, the MCO was required to submit root causes analyses and plans of action on all measures reported in the F category. For the MY 2015 Matrix, this requirement was modified, requiring the MCO to submit a maximum of three root cause analyses and plans of action, regardless of the number of measures reported in the F category. Beginning with MY 2008, if an MCO has fewer than three measures reported in the F category, the remaining measures must be selected from the D category for a total of three measures. If the MCO has no measures in the D and F categories, the MCO is not required to follow up.

Affinity Health Plan, Inc. | Reporting Year 2015 Technical Report 21
Table 15: Quality Performance Matrix—2015 Measurement Year
Percentile Ranking Trend* 0 to 49% 50% to 89% 90 to 100%
C Follow-Up After Hospitalization for Mental Illness—
7 Days
B Adolescent Immunization—HPV
A
No Change
D Advising Smokers to Quit Annual Dental Visits (Ages 2-18) Annual Monitoring for Patients on Persistent
Medications—ACE Inhibitors/ARBs Annual Monitoring for Patients on Persistent
Medications—Digoxin Annual Monitoring for Patients on Persistent
Medications—Diuretics Antidepressant Medication Management—Acute
Phase Antidepressant Medication Management—
Continuation Phase Discussing Smoking Cessation Strategies Monitoring Diabetes—Received All Tests Persistence of Beta-Blocker Treatment after a
Heart Attack Tobacco Cessation—Medication Discussion
C Adolescent Immunization—Combo Avoidance of Antibiotics Therapy in Adults with Acute
Bronchitis Breast Cancer Screening Cervical Cancer Screening Childhood Immunization Status (Combo 3) Chlamydia Screening (Ages 16-20) Chlamydia Screening (Ages 21-24) Colon Cancer Screening Diabetes Monitoring for Diabetes and Schizophrenia Medical Mgmt for People with Asthma 75% (Ages 5-64) Use of Imaging Studies for Low Back Pain Use of Spirometry Testing in the Assessment of COPD Well Care Visits—First 15 Months (5+ Visits)
B Adherence to Antipsychotic Medications for
Individuals with Schizophrenia Medical Mgmt for People with Asthma 50%
(Ages 5-64)
F Appropriate Testing for Pharyngitis Follow-Up Care for Children Prescribed ADHD
Medication—Initiation Phase Well Care Visits—3
rd, 4
th, 5
th, & 6
th Year of Life
D Follow-Up Care for Children Prescribed ADHD
Medication—Continuation Phase
C

Affinity Health Plan, Inc. | Reporting Year 2015 Technical Report 22
NYSDOH QUALITY INCENTIVE The percentage of the potential financial incentive that an MCO receives is based on quality of care, consumer satisfaction, and compliance. Points earned are derived from an algorithm that considers QARR 2016 (MY 2015) rates in comparison to statewide percentiles, the most recent Medicaid CAHPS® scores, and compliance information from MY 2013 and MY 2014. The total score, based out of 150 possible points, determines what percentage of the available premium increase the MCO qualifies for. For 2015, there were five tiers of incentive awards that could be achieved by MCOs based on the results. Table 16 displays the points the MCO earned from 2013 to 2015, as well as the percentage of the financial incentive that these points generated based on the previous measurement year’s data. Table 17 displays the measures that were used to calculate the 2015 incentive, as well as the points the MCO earned for each measure. Table 16: Quality Incentive Points Earned—2013-2015
2013 2014 2015
Affinity Statewide Average Affinity
Statewide Average Affinity
Statewide Average
Total Points (150 Possible Points) 54.4 80.8 81 73.8 56.6 75.2
PQI Points (20 Possible Points) 3.5 6.9 0 6.9 0 6.9
Compliance Points (-20 Possible Points) -6 -5.4 -6 -4 -10 -3.6
Satisfaction Points (30 Possible Points) 15 15.9 15 16.3 20 20
Quality Points1
(100 Possible Points) 42 63.4 72 54.5 46.6 56
Financial Incentive Award Designation2 0% 50% Tier 4
1 Quality Points presented here are normalized.
2 For Reporting Year 2015, the incentive award designation was changed from a percentile ranking to a tier ranking. The highest performing tier level is Tier 1, while the
lowest performing tier level is Tier 5.

Affinity Health Plan, Inc. | Reporting Year 2015 Technical Report 23
Table 17: Quality Incentive Measures and Points Earned—2015 Measure MCO Points PQI 0.0
Adult Composite PQI (10 points) 0.0
Pediatric Composite PDI (10 points) 0.0 Compliance -10.0
MMCOR -4.0 MEDS 0.0
QARR 0.0
Access/Availability 0.0
Provider Directory -2.0
Member Services -2.0 Satisfaction (10 points each) 20.0
Rating of Health Plan 5.0
Getting Care Needed 5.0
Customer Service 10.0 Quality (3.03 points each, except where noted) 28.8
Adult BMI Assessment 0.0
Adherence to Antipsychotic Medications for Individuals with Schizophrenia 3.03
Antidepressant Medication Management 0.0
Annual Monitoring for Patients on Persistent Medications 0.0 Appropriate Testing for Pharyngitis 0.0
Avoidance of Antibiotics Therapy in Adults with Acute Bronchitis 2.27
Breast Cancer Screening 1.52
Cervical Cancer Screening 1.52
Chlamydia Screening 1.52 Childhood Immunization Status (Combo 3) 1.52
Colorectal Cancer Screening 2.27
Comprehensive Care for People Living with HIV/AIDS—Engaged in Care 0.0
Comprehensive Diabetes Care—Received All Tests 0.0
Comprehensive Diabetes Care—HbA1C Control < 8.0% 0.0 Controlling High Blood Pressure 0.0
Diabetes Monitoring for People with Diabetes and Schizophrenia 1.52
Flu Shot for Adults (CAHPS) 2.27
Follow Up After Hospitalization for Mental Illness Within 7 Days 0.0
Follow Up for Children Newly Prescribed ADHD Medication 0.0
Human Papillomavirus Vaccination for Female Adolescents 1.52 Immunizations for Adolescents 1.52
Medical Assistance with Tobacco Cessation (CAHPS) 0.0
Medication Management for People with Asthma (Ages 5-64) 3.03
Persistence of Beta-Blocker Treatment After a Heart Attack 0.0
Use of Imaging Studies for Low Back Pain 1.52 Use of Spirometry Testing in the Assessment and Diagnosis of COPD 1.52
Weight Assessment and Counseling for Children and Adolescents 0.0
Annual Dental Visit (Ages 2-18) 0.0
Frequency of Ongoing Prenatal Care (81% and more) 0.0
Timeliness of Prenatal Care 0.0 Postpartum Care 0.0
Well Child Visits in the First 15 Months—Five or more visits 2.27
Well Child Visits in the 3rd, 4th, 5th and 6th Year 0.0 Total Normalized Quality Points
1 46.6
Total Points Earned 56.6 MMCOR: Medicaid Managed Care Operating Report MEDS: Medicaid Encounter Data Set 1 Quality Points were normalized before being added to the total points earned. The points each MCO earned for each quality measure
were aggregated and converted to normalized quality points. Quality points were normalized in order to control for a difference in base points, as not every MCO could earn points for each measure due to small sample sizes (less than 30 members).

Affinity Health Plan, Inc. | Reporting Year 2015 Technical Report 24
PERFORMANCE IMPROVEMENT PROJECT Each MCO is required by the Medicaid Health Maintenance Organization contract to conduct at least one Performance Improvement Project (PIP) each year. A PIP is a methodology for facilitating MCO- and provider-based improvement in quality of care. PIPs place emphasis on evaluating the success of interventions to improve quality of care. Through these projects, MCOs and providers determine what processes need to be improved and how they should improve. The NYS EQRO provided technical assistance to MCOs throughout the PIP process in the following forms: 1) review of the MCO’s Project Proposal prior to the start of the PIP; 2) quarterly teleconferences with the MCO for progress updates and problem-solving; 3) feedback on methodology, data collection tools, and implementation of interventions; and 4) feedback on drafts of the MCO’s final report. In addition, the NYS EQRO validated the MCO’s PIP by reviewing the project topic, aim statement, performance indicators, study population, sampling methods (if sampling was used), data collection procedures, data analysis, and interpretation of project results, as well as assessing the MCO’s improvement strategies, the likelihood that the reported improvement is “real” improvement, and whether the MCO is likely to be able to sustain its documented improvement. Validation teams met quarterly to review any issues that could potentially impact the credibility of PIP results, thus ensuring consistency among validation teams. The validation process concluded with a summary of the strengths and opportunities for improvement in the conduct of the PIP, including any validation findings that indicated the credibility of the PIP results was at risk. Affinity’s 2015-2016 PIP topic is “Increasing Tobacco Cessation Activities Among Affinity Health Plan’s Medicaid Population”. During 2015, the MCO implemented the following interventions:
Scripted telephone interviews with physicians, educators, administrators, etc.
Analysis of existing screening and treatment processes at target sites and discussion of strategies for improvement.
Provide a list to sites of specific codes used when submitting claims for tobacco cessation interventions.
Assist providers in identifying appropriate methods of disseminating educational resources on the risks of tobacco use, as well as information on cessation behavioral techniques, and a description of Affinity’s cessation benefits.
Create a list of cessation programs specific to each geographic community and distribute to providers.
Partner with the NYS Tobacco Control Program’s Health System Contractors to assist sites with analysis of current smoking cessation processes, including but not limited to: system changes, medical record documentation, coding, use of screening tools, and referrals to the NYS QuitLine.
Notify primary care providers by email/fax about members referred to the QuitLine. Table 18 presents a summary of Affinity’s 2015-2016 PIP. Table 18: Performance Improvement Project—2015-2016 Results not shown, as 2015 was the first phase of the MCO’s two-year PIP. Results will be included in the 2016 EQRO Technical Report.
Affinity Health Plan, Inc. | Reporting Year 2015 Technical Report 25
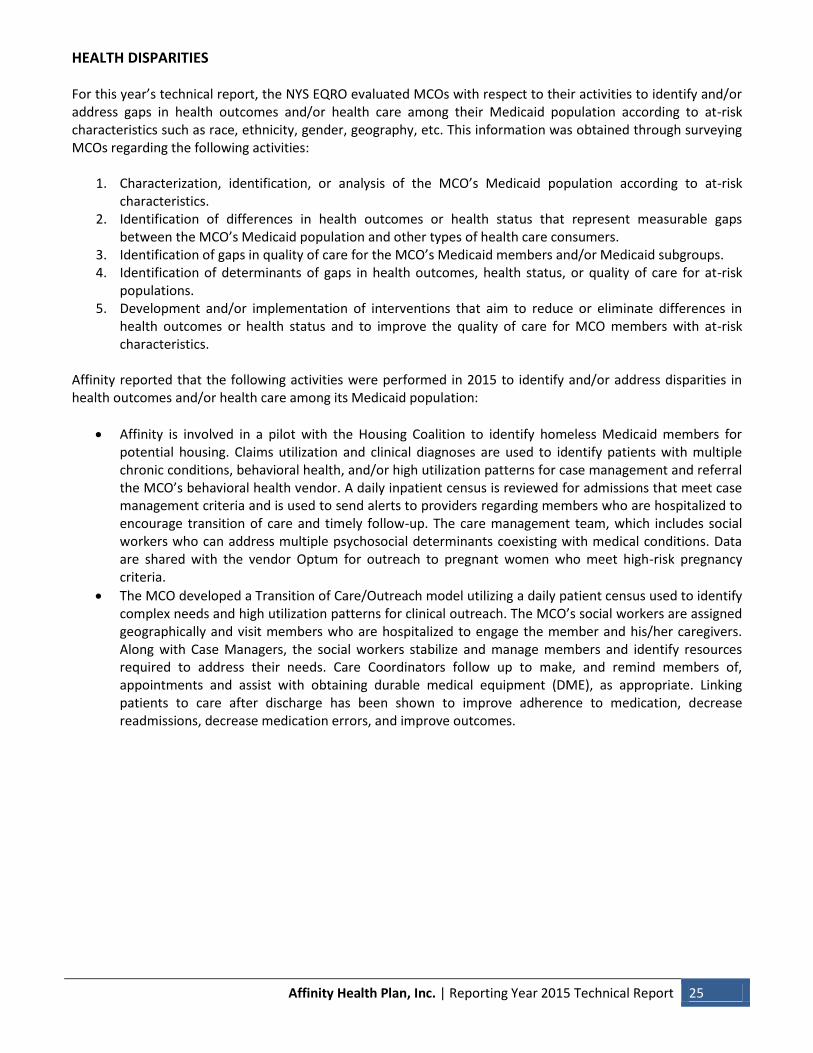
HEALTH DISPARITIES For this year’s technical report, the NYS EQRO evaluated MCOs with respect to their activities to identify and/or address gaps in health outcomes and/or health care among their Medicaid population according to at-risk characteristics such as race, ethnicity, gender, geography, etc. This information was obtained through surveying MCOs regarding the following activities:
1. Characterization, identification, or analysis of the MCO’s Medicaid population according to at-risk characteristics.
2. Identification of differences in health outcomes or health status that represent measurable gaps between the MCO’s Medicaid population and other types of health care consumers.
3. Identification of gaps in quality of care for the MCO’s Medicaid members and/or Medicaid subgroups. 4. Identification of determinants of gaps in health outcomes, health status, or quality of care for at-risk
populations. 5. Development and/or implementation of interventions that aim to reduce or eliminate differences in
health outcomes or health status and to improve the quality of care for MCO members with at-risk characteristics.
Affinity reported that the following activities were performed in 2015 to identify and/or address disparities in health outcomes and/or health care among its Medicaid population:
Affinity is involved in a pilot with the Housing Coalition to identify homeless Medicaid members for potential housing. Claims utilization and clinical diagnoses are used to identify patients with multiple chronic conditions, behavioral health, and/or high utilization patterns for case management and referral the MCO’s behavioral health vendor. A daily inpatient census is reviewed for admissions that meet case management criteria and is used to send alerts to providers regarding members who are hospitalized to encourage transition of care and timely follow-up. The care management team, which includes social workers who can address multiple psychosocial determinants coexisting with medical conditions. Data are shared with the vendor Optum for outreach to pregnant women who meet high-risk pregnancy criteria.
The MCO developed a Transition of Care/Outreach model utilizing a daily patient census used to identify complex needs and high utilization patterns for clinical outreach. The MCO’s social workers are assigned geographically and visit members who are hospitalized to engage the member and his/her caregivers. Along with Case Managers, the social workers stabilize and manage members and identify resources required to address their needs. Care Coordinators follow up to make, and remind members of, appointments and assist with obtaining durable medical equipment (DME), as appropriate. Linking patients to care after discharge has been shown to improve adherence to medication, decrease readmissions, decrease medication errors, and improve outcomes.

Affinity Health Plan, Inc. | Reporting Year 2015 Technical Report 26
VI. Health Information Technology
According to the US Department of Health & Human Services, health information technology (HIT) allows comprehensive management of medical information and its secure exchange between health care consumers and providers. Broad use of HIT will improve health care quality, prevent medical errors, reduce health care costs, increase administrative efficiencies, decrease paperwork, and expand access to affordable health care. In 2015, the NYS EQRO surveyed Medicaid MCOs regarding the use of HIT to improve the care of its Medicaid members. Specifically, MCOs were asked to report on:
Secure electronic transfer of Health Insurance Portability and Accountability Act (HIPAA) protected information to patients and/or providers and support staff
Use of telecommunications technologies
Use of Electronic Health Records (EHR)
Use of electronic internal registries
Use of clinical risk group (CRG) or similar software
Secure electronic transfer of member data between the MCO, its vendors, and network providers
Electronic communication with providers
Electronic communication with members
Participation in a Regional Health Information Organization (RHIO) or Health Information Exchange (HIE)1
Participation in State, Federal, or privately funded HIT initiatives
Participation in a medical home pilot or program
Future plans to implement HIT Table 19 displays the statewide results of the HIT survey. Of the fifteen MCOs who responded to the survey, 100% utilized secure electronic transfer of member data between the MCO, its vendors, and/or network providers. Additionally, 100% of MCOs utilized electronic communication with providers and secure electronic transfer of PHI to patients and/or providers. Some of the other forms of HIT utilized by the majority of MCOs (93%) include telecommunications technologies, Electronic Health Records (EHR), and use of clinical risk group (CRG) or similar software. In addition, 93% of MCOs reported future plans to implement HIT.
1 Regional Health Information Organizations/Health Information Exchanges are organizations that exist to enable
interoperable health information exchange through governance and collaboration with an overall mission to improve health care quality and safety, and reduce costs.

Affinity Health Plan, Inc. | Reporting Year 2015 Technical Report 27
Table 19: MCO Use of Health Information Technology—2015 Survey of NYS MCOs
Health Information Technology % of MCOs
Reporting Use Secure electronic transfer of member data between the Plan, its vendors and/or network providers 100%
Electronic communication with providers 100%
Secure electronic transfer of protected health information to patients and/or providers 100%
Future plans to implement HIT 93%
Use of clinical risk group (CRG) or similar software 93%
Use of telecommunications technologies 93%
Use of Electronic Health Records (EHR) 93%
Electronic communication with members 53%
Participation in a Regional Health Information Organization (RHIO) or Health Information Exchange (HIE) 53%
Participation in a medical home pilot or program 47%
Use of electronic internal registries 47%
Participation in State, Federal or privately funded HIT initiatives 27%

Affinity Health Plan, Inc. | Reporting Year 2015 Technical Report 28
Affinity has indicated that it performs the following HIT-related activities:
Secure electronic transfer of protected health information to patients and/or providers: Via secure file transfer or encrypted email, as well as secure provider and member portals.
Use of telecommunications technologies: The member portal allows members to view health information, as well as access claims,
eligibility, PCPs, and benefits-related information.
Use of Electronic Health Records (EHR): Use of secure EHR connection to transmit data for QARR reporting.
Use of electronic internal registries: NYSIIS and NYC—CIR to obtain immunization data.
Use of clinical risk group (CRG) or similar software: Use of 3M/Treo to calculate clinical risk groups and member-level risk scores.
Secure electronic transfer of member data between the MCO, its vendors, and/or network providers: Via secure file transfer (secure FTP) with vendors and providers
Electronic communication with providers: Via email, FTP, and secure transfer over the provider portal.
Electronic communication with members: Via the member portal and secure email.
Participation in a Regional Health Information Organization (RHIO) or Health Information Exchange (HIE):
As part of an initiative with the Housing Coalition, partners with the Bronx RHIO on a pilot project focused on housing for homeless individuals with high medical expenses and utilization.
Participation in any State, Federal, or privately funded initiatives: Participates in SHIN-NY.
Future plans to implement HIT: The MCO continues to look for electronic information exchange opportunities, and is
considering partnering with an EHR vendor to gain access to CCD for use during HEDIS®/QARR. Affinity is working with the Primary Care Association (PCA)—CHCANYS to share claims
information, which will assist the PCA, and Federally Qualified Health Centers, in obtaining clinical information from primary care providers.

Affinity Health Plan, Inc. | Reporting Year 2015 Technical Report 29
VII. Deficiencies and Appeals
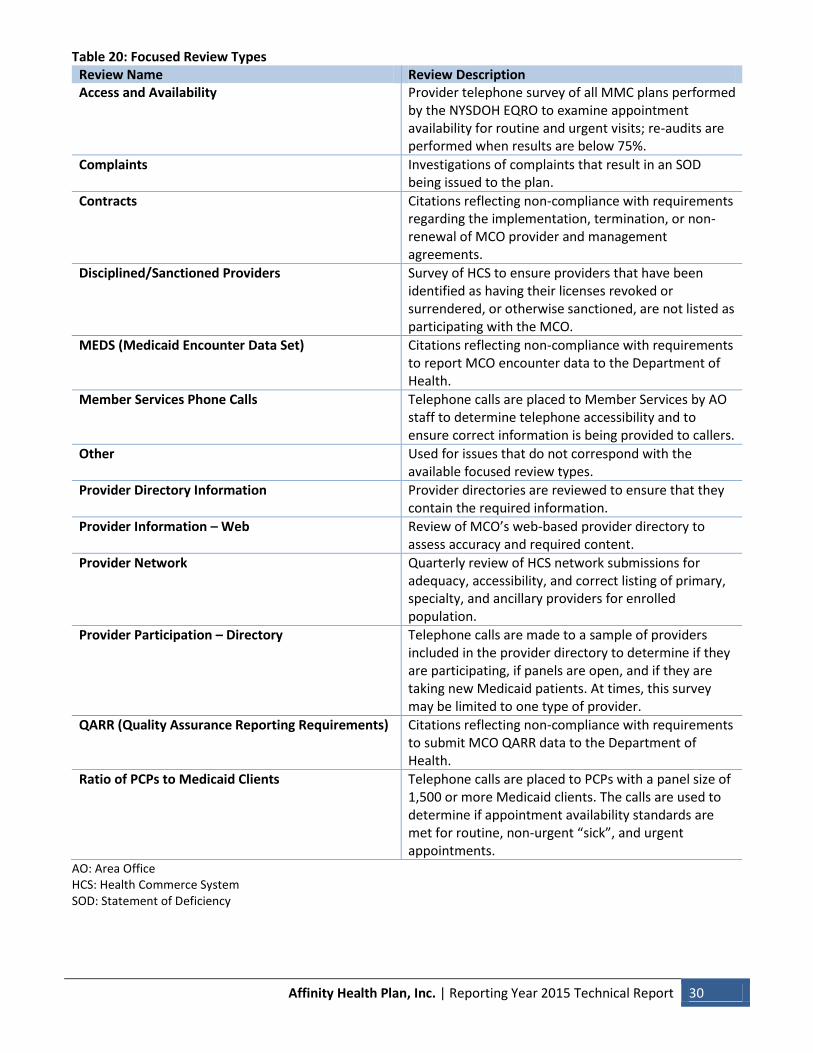
COMPLIANCE WITH NYS STRUCTURE AND OPERATION STANDARDS This section of the report examines deficiencies identified by the NYSDOH in operational and focused surveys, as well as external appeals, as part of the EQRO’s evaluation of the MCO’s compliance with State structure and operation standards. Compliance with NYS Structure and Operation Standards To assess the compliance of an MCO with Article 44 of the Public Health Law and Part 98 of the New York Code of Rules and Regulations (NYCRR), the NYSDOH conducts a full monitoring review of the MCO’s compliance with structure and operation standards once every two years. These standards are reflected in the 14 categories in Table 21. ”Deficiencies” represent a failure to comply with these standards. Each deficiency can result in multiple “citations” to reflect each standard with which the MCO is not in compliance. The full monitoring review consists of an operational survey. The on-site component includes review of the following: policy and procedures, executed contracts and credentialing files of randomly selected providers, adverse determination utilization review files, complaints and grievances files, meeting minutes, and other documentation. Staff interviews are also conducted. These reviews are conducted using two standardized tools, the “Medicaid Managed Care Contract Surveillance Tool” and the “Review Tool and Protocol for MCO Operational Surveys”. The NYSDOH retains the option to deem compliance with standards for credentialing/ recredentialing, quality assurance/improvement, and medical record review. The Monitoring Review Report documents any data obtained and deficiencies cited in the survey tools. Any statements of deficiencies (SODs) are submitted to the MCO after the monitoring review, and the MCO is required to respond with a plan of corrective action (POC). POCs must be submitted to the NYSDOH for acceptance. In some cases, revisions may be necessary and MCOs are required to resubmit. Ultimately, all MCOs with SODs must have a POC that is accepted by the NYSDOH. During the alternate years when the full review is not conducted, the NYSDOH reviews any modified documentation and follows up with the MCO to ensure that all deficiencies or issues from the operational survey have been remedied. In addition to the full operational survey conducted every two years, the NYSDOH also conducts several focused reviews as part of the monitoring of structure and operation standards. The focused review types are summarized in Table 20. MCOs are also required to submit POCs in response to deficiencies identified in any of these reviews. Table 21 reflects the total number of citations for the most current operational survey of the MCO, which ended in 2015, as well as from the focused reviews conducted in 2015. This table reflects the findings from reviews of the MCO as a whole and deficiencies are not differentiated by product line. It is important to note that the number of deficiencies and the number of citations may differ, since each deficiency can have multiple citations. Affinity was in compliance with 10 of 14 categories. The categories in which Affinity was not compliant were Disclosure (1 citation), Organization and Management (5 citations), Quality Assurance (1 citation), and Service Delivery Network (6 citations).
Affinity Health Plan, Inc. | Reporting Year 2015 Technical Report 30
Table 20: Focused Review Types Review Name Review Description Access and Availability Provider telephone survey of all MMC plans performed
by the NYSDOH EQRO to examine appointment availability for routine and urgent visits; re-audits are performed when results are below 75%.
Complaints Investigations of complaints that result in an SOD being issued to the plan.
Contracts Citations reflecting non-compliance with requirements regarding the implementation, termination, or non-renewal of MCO provider and management agreements.
Disciplined/Sanctioned Providers Survey of HCS to ensure providers that have been identified as having their licenses revoked or surrendered, or otherwise sanctioned, are not listed as participating with the MCO.
MEDS (Medicaid Encounter Data Set) Citations reflecting non-compliance with requirements to report MCO encounter data to the Department of Health.
Member Services Phone Calls Telephone calls are placed to Member Services by AO staff to determine telephone accessibility and to ensure correct information is being provided to callers.
Other Used for issues that do not correspond with the available focused review types.
Provider Directory Information Provider directories are reviewed to ensure that they contain the required information.
Provider Information – Web Review of MCO’s web-based provider directory to assess accuracy and required content.
Provider Network Quarterly review of HCS network submissions for adequacy, accessibility, and correct listing of primary, specialty, and ancillary providers for enrolled population.
Provider Participation – Directory Telephone calls are made to a sample of providers included in the provider directory to determine if they are participating, if panels are open, and if they are taking new Medicaid patients. At times, this survey may be limited to one type of provider.
QARR (Quality Assurance Reporting Requirements) Citations reflecting non-compliance with requirements to submit MCO QARR data to the Department of Health.
Ratio of PCPs to Medicaid Clients Telephone calls are placed to PCPs with a panel size of 1,500 or more Medicaid clients. The calls are used to determine if appointment availability standards are met for routine, non-urgent “sick”, and urgent appointments.
AO: Area Office HCS: Health Commerce System SOD: Statement of Deficiency

Affinity Health Plan, Inc. | Reporting Year 2015 Technical Report 31
Table 21: Summary of Citations
Category
Review Type/Name ( indicates
focused review) Citations Complaints and Grievances 0
Credentialing 0
Disclosure 1 The Plan failed to ensure that the requested utilization review information was sent within 3 weeks. A secret shopper requested that a description of the Plan utilization review policies be mailed to them. The requested information did not arrive within the required timeframe.
Member Services Phone
Calls
Family Planning 0
HIV 0
Management Information Systems 0
Medicaid Contract 0
Medical Records 0
Member Services 0
Organization and Management 5 The Plan failed to renew its management services agreement with DentaQuest of New York, LLC prior to its expiration on May 31, 2015. The Plan continued to delegate management functions to DentaQuest in violation of DOH regulations.
Contracts
The Plan failed to ensure adequate provider access to members during a telephone survey of 120 randomly selected PCPs and OB/GYNs included in the provider directory. Specifically, 36 providers surveyed could not be confirmed as participating with the Plan, therefore limiting access to care.
Provider Participation—
Directory
The governing authority failed to ensure that deficiencies identified during the previous surveys were fully remedied.
Provider Participation—
Directory
The Plan executed a management services agreement with Landmark Healthcare, Inc. without evidence of prior approval from the Department. Furthermore, the Plan subsequently amended the management contract three times without evidence of prior approval from the Department. (2 citations)
Contracts
Prenatal Care 0
Quality Assurance 1 The Plan did not ensure implementation of the previous Plan of Correction for Member Services 2013 resurvey dated 3/18/15.
Member Services Phone
Calls
Service Delivery Network 6 The Plan failed to ensure that the physician information included in the printed provider directory was 75% accurate. Specifically, information for24 physicians included in the survey sample was determined to be inaccurate. (2 citations)
Provider Participation—
Directory
The Plan failed to ensure adequate provider access to members during a telephone survey of 120 randomly Provider Participation—

Affinity Health Plan, Inc. | Reporting Year 2015 Technical Report 32
Category
Review Type/Name ( indicates
focused review) Citations selected PCPs and OB/GYNs included in the provider directory. Specifically, 36 providers surveyed could not be confirmed as participating with the Plan, therefore limiting access to care.
Directory
Directory information issues remain unresolved for 3 of 34 providers with previously identified inaccuracies during the 2013 Phase 2 survey. (3 citations)
Provider Participation—
Directory
Utilization Review 0 TOTAL 13
Note: No operational survey was conducted for the MCO in 2015.

Affinity Health Plan, Inc. | Reporting Year 2015 Technical Report 33
EXTERNAL APPEALS Table 22 displays external appeals for 2013 to 2015 for the Medicaid and CHP product lines. This table reflects absolute numbers, and is not weighted by MCO enrollment. Table 22: External Appeals—2013-2015
2013 2014 2015 Medicaid Overturned 38 26 77
Overturned in Part 7 5 10
Upheld 147 113 145
Medicaid Total 192 144 232 CHP Overturned 1 0 0
Overturned in Part 0 0 0
Upheld 0 0 3
CHP Total 1 0 3

Affinity Health Plan, Inc. | Reporting Year 2015 Technical Report 34
VIII. Financial Data
The financial summary is based on data reported in each MCO’s 2014 and 2015 Medicaid Managed Care Operating Report (MMCOR). The data contained in the MMCOR reflect the MCO’s Medicaid line of business only. The data are not audited and are reported on an accrual basis; thus, total expenses are impacted by an MCO’s estimate of services that have been incurred by MCO members but have not been billed to the MCO. The following is a list of the ratios displayed in Table 23 and their definitions:
1. Assets to Net Worth: Reflects the relationship of assets to net worth. For example, an MCO with an asset to net worth ratio of 3.0 indicates the MCO has $3 of assets for every $1 of net worth. The formula is total assets divided by net worth. Assets and net worth are the net of intangible assets.
2. Premium Surplus Ratio: Indicates what percentage of premium dollars goes towards surplus. This ratio is calculated by dividing premium income by total premium revenue. It indicates whether an MCO is generating sufficient revenue from its premiums to cover medical and administrative expenses.
3. Medical Loss Ratio: Indicates what percentage of premium dollars is spent on medical costs. This ratio is calculated by dividing total medical costs by total premium revenue.
4. Administrative Ratio: Indicates what percentage of premium dollars is spent on administrative costs. This ratio is calculated by dividing total administrative costs by total premium revenue.
5. Current Ratio: Reflects to what degree current assets cover current liabilities. The formula is current assets divided by current liabilities.
Table 23: Selected Financial Ratios—2014-2015
2014 2015
Affinity SWA Affinity SWA Profitability Assets to Net Worth = (Total Assets-Intangibles)/ (Net Worth-Intangibles) 3.21 2.09 3.65 2.14
Premium Surplus Ratio = Premium Income/ Revenue Income 2.5% -12.3% 0.1% 0.0%
Medical Loss Ratio = Medical Expenses/ Premium Revenue 90.7% 101.5% 90.2% 90.6%
Administrative Ratio = Admin. Expenses/ Premium Revenue 2.1% 7.3% 11.2% 10.0% Liquidity Current Ratio = Current Assets/Current Liabilities 1.5 2.1 1.4 2.1

Affinity Health Plan, Inc. | Reporting Year 2015 Technical Report 35
Figure 4a: Assets to Net Worth and Current Ratio
Figure 4b: Medical Loss Ratio and Administrative Ratio
0.0
0.5
1.0
1.5
2.0
2.5
3.0
3.5
4.0
2014 2015
Assets to Net Worth
Current Ratio
0%
10%
20%
30%
40%
50%
60%
70%
80%
90%
100%
2014 2015
Medical Loss Ratio
Administrative Ratio

Affinity Health Plan, Inc. | Reporting Year 2015 Technical Report 36
IX. Strengths and Opportunities for Improvement2
This section summarizes the accessibility, timeliness, and quality of services provided by the MCO to Medicaid and Child Health Plus recipients based on data presented in the previous sections of this report. The MCO’s strengths in each of these areas are noted, as well as opportunities for improvement. Recommendations for enhancing the quality of health care are also provided based on the opportunities for improvement noted. An assessment of the degree to which the MCO has effectively addressed the recommendations for quality improvement made by the NYS EQRO in the previous year’s EQR report is also included in this section. The MCO’s response to the previous year’s recommendations, wherein the MCO was given the opportunity to describe current and proposed interventions that address areas of concern, as well as an opportunity to explain areas that the MCO did not feel were within its ability to improve, is appended to this section of the report. Strengths
The MCO reported an above average rate for the HEDIS®/QARR Board Certification measure for Geriatricians.
In regard to overall HEDIS®/QARR performance, the MCO has reported an above average rate for at least three consecutive reporting years for the Chlamydia Screening (Ages 16-24) measure. Additional measures for which the MCO reported above average rates include Childhood Immunization Status (Combo 3), Medical Management for People with Asthma 50% of Days Covered (Ages 19-64), Medical Management for People with Asthma 50% of Days Covered (Ages 5-18), Adherence to Antipsychotic Medications for Individuals with Schizophrenia, Appropriate Treatment for Upper Respiratory Infection, and Well-Child Visits—First 15 Months.
The MCO performed well in regard to member satisfaction. The MCO’s rates were above the statewide average for the following CAHPS® measures: Customer Service, Rating of Counseling/Treatment, and Getting Needed Counseling/Treatment.
Opportunities for Improvement
The 2016 HEDIS® Final Audit Report prepared for Affinity indicated that the MCO was not fully compliant with the standards IS 4.0 Medical Record Review Processes—Training, Sampling, Abstraction, and Oversight and IS 7.0 Data Integration—Accurate HEDIS® Reporting, Control Procedures That Support HEDIS® Reporting Integrity, causing the MCO to be unable to report several measures.
Affinity earned PQI, compliance, satisfaction, and quality points that qualified the MCO for the Tier 4 financial incentive award designation.
The MCO continues to demonstrate an opportunity for improvement in regard to its provider network. The MCO’s rates were below the statewide average for the HEDIS®/QARR Board Certification measure for Family Medicine, Internal Medicine, Pediatricians, and OB/GYN. (Note: board certification was an opportunity for improvement in the previous year’s report.)
The MCO continues to demonstrate an opportunity for improvement in regard to overall HEDIS®/QARR performance, as evidenced by below average rates for at least three consecutive reporting years for the following measures: Follow-Up After Hospitalization for Mental Illness—30 Days, Follow-Up After Hospitalization for Mental Illness—7 Days, Dental Visit (Ages 19-21), and Annual Monitoring for Patients on Persistent Medications—Combined Rate. Additional measures for which the MCO’s rates were reported below the statewide average include Follow-Up Care for Children Prescribed ADHD
2 This section of the report emphasizes the maintenance of current good practices and the development of additional
practices resulting in improved processes and outcomes, and thus refers to “Strengths” and “Opportunities for Improvement” rather than “Strengths” and “Weaknesses” as indicated in federal regulations.

Affinity Health Plan, Inc. | Reporting Year 2015 Technical Report 37
Medication—Initiation Phase, Asthma Medication Ratio (Ages 5-18), Annual Dental Visits (Ages 2-18), Diabetes Eye Exam, Diabetes HbA1c Test, Breast Cancer Screening, Appropriate Testing for Pharyngitis, Well-Child Visits—3 to 6 Year Olds, and Well-Care Visits for Adolescents. (Note: Follow-Up After Hospitalization for Mental Illness—30 Days, Follow-Up After Hospitalization for Mental Illness—7 Days, Dental Visit (Ages 19-21), and Annual Monitoring for Patients on Persistent Medications—Combined Rate were opportunities for improvement in the previous year’s report.)
In regard to access to primary care, the MCO continues to demonstrate an opportunity for improvement. The MCO has reported rates below the 10th percentile for at least three consecutive reporting years for all age groups of the Children and Adolescents’ Access to PCPs and Adults’ Access to Preventive/Ambulatory Services measures. (Note: children and adults’ access to primary care was an opportunity for improvement in the previous year’s report.)
The MCO continues to demonstrate an opportunity for improvement in regard to compliance with NYS structure and operation standards. The MCO received thirteen focused review citations related to Disclosure, Organization and Management, Quality Assurance, and Service Delivery Network. (Note: compliance with NYS structure and operation standards was an opportunity for improvement in the previous year’s report.)
Recommendations
The MCO should work to resolve the issues noted in the 2016 HEDIS® Final Audit Report to ensure that all measure rates can be validated and reported.
As the MCO continues to struggle with certain HEDIS®/QARR measures, specifically those related to follow-up care for mental illness and access to primary and preventive care, the MCO should conduct a thorough root cause analysis for each measure to identify barriers members face when accessing care in order to develop and implement targeted interventions. [Repeat recommendation.]
The MCO should continue to work to address issues noted in the focused review surveys. Specifically, the MCO should focus on correct execution of contracts with providers and vendors, and should also work to ensure the information included in the provider directories is complete and accurate. [Repeat recommendation.]
Response to Previous Year’s Recommendations
2014 Recommendation: To ensure that members receive appropriate care, and that the MCO continues to receive a percentage of the available financial incentive, the MCO should work to improve poorly performing HEDIS®/QARR and CAHPS® measures. The MCO should continuously evaluate the effectiveness of current initiatives and modify them as needed. [Repeat recommendation.] MCO Response: To ensure our members receive appropriate care as defined by HEDIS®/QARR and CAHPS® measures, Affinity recognizes that improving HEDIS®/QARR and CAHPS® performance requires a concerted effort among many Affinity internal stakeholders, as well as collaboration with our members and our provider partners. To that end, Affinity has taken the following steps to continuously monitor, evaluate, and improve performance.
CAHPS® Workgroup comprised of Network Development, Quality Management, Vendor Management, Medical Management, & Customer Service staff, as well as Product Owners. Recommendations from the CAHPS® Workgroup will be implemented during the Second and Third Quarter, 2017. For example, during the 3Q 2017, Affinity will implement flags that alert frontline staff (e.g., Member Service Representatives, Case Managers, etc.) of gaps in care for Members who call the Plan. During that phone contact, the representative will educate the member on the importance of preventive and/or follow-up care specific to the Gap(s) in Care, related member incentives (as applicable), and offer to make

Affinity Health Plan, Inc. | Reporting Year 2015 Technical Report 38
appointments for the member. Affinity will also utilize the digital boards in its Community Service Centers to stream information regarding preventive and follow-up care. Our Customer Service Center staff will assist in making appointments for members.
During the 1Q 2017, Affinity launched a Member Advisory Council for direct Member feedback and consult. During these council meetings, the members noted that they would like additional information regarding finding dental providers, understanding their dental coverage, understanding authorizations, and how to recertify for their medical benefits.
Affinity significantly expanded its Provider Quality Incentive Program to include the following: o Incentive programs now include all of Affinity’s lines of business—Medicaid, Child Health
Plus, HARP, the Essential Plan, and the Qualified Health Plan.
o In 2014, Affinity incentivized 9 HEDIS®/QARR-related measures; as of 2017, the Plan now offers incentives for 12 pediatric measures and 22 adult measures including Well Visits, Medication Management for Asthma, Diabetes Care, Cancer Screenings, Utilization of PHQ9 to Monitor Depression Symptoms, Appropriate Testing for Children with Pharyngitis, Prenatal & Postpartum Care, etc.
Affinity issues monthly provider report cards and gaps in care reports. The Report Cards give providers insight into their current measure rates and identify the members they need to outreach to for preventive and follow-up care. Customized reporting (e.g., filtering by line of business, measure, site, provider, member, etc.) was implemented during the 2Q 2017.
Affinity recognized that administrative data is very important for achieving our HEDIS®/QARR measures and have taken an integrated approach with the Information Technology team at Affinity to support quality reporting initiatives needed monthly in order to achieve improved quality scores. Affinity increased provider participation in submitting routine supplemental data files throughout the year to ensure completeness of member experience and utilization by capturing data generally found in charts and not reportable through claims (e.g., blood pressure, BMI, lab results, historical claims data, etc.). Further, Affinity requested our contracted laboratories to provide monthly data on HEDIS®/QARR measures, reducing the work that the Quality management (“QM”) staff has to do to chase charts, review laboratory portals, or request supplemental data. In addition, Affinity worked with our PBM to assist in identifying members that are not refilling their medications according to recommendations so that we can offer case management services and appropriate outreach.
In addition, the QM team and Information Technology team has regular data validation of the claims received from our internal systems and from our vendors to ensure that all data is captured for uploading into our NCQA-certified quality reporting software. We learned that this was not a systematic process, and in the last quarter of 2016, the monitoring was initiated. This collaboration has been initiated already resulting in:
Improved controls and monitoring of data inputs through routine data quality review.
Aligned technical functions with appropriate IT departments.
Focused the QM staff on quality specific data analytics and performance measurement.
CAHPS® Workgroup

Affinity Health Plan, Inc. | Reporting Year 2015 Technical Report 39
Implemented February 2017 and convenes monthly throughout the year, the CAHPS® workgroup reviews and evaluates Plan-specific CAHPS® results and performance indicators and develops specific initiatives designed to reduce/remove barriers to member satisfaction and to improve access to appropriate care. Examples of initiatives that have been earmarked for implementation during Q3 & Q4 of 2017 are as follows:
Providing Customer Service and Case Management staff access and visibility into member gaps-in-care reports—Q3, Update Monthly
Providing member gaps-in-care reports to Health Home providers and vendor partners (e.g., Dental, Vision, Behavioral Health, Pharmacy)—Q3, Updated Quarterly
The CAHPS® Workgroup is co-chaired by the Senior Vice President (“SVP”)—Operations and Chief Medical Officer.
CAHPS® Provider Sub-workgroup
Implements in February 2017 and convened through April 2017, the provider-focused CAHPS® sub-workgroup met to develop CAHPS®/HOS educational materials that can be delivered through our provider partners throughout the year. Further, it focuses on the CAHPS® domains that speak directly to patient experience with their providers.
o Educational Flyers/Posters Explaining the Importance of CAHPS®/HOS—Q2, Delivered to, and made available through, participating PCP offices.
The CAHPS® Provider Sub-workgroup is facilitated by the Vice President (“VP”)-Operations, Quality & Risk Management.
Member Advisory Council
1. Implemented Q1 2017 and will occur semi-annually; feedback from the Member Advisory Council will be reported up to the CAHPS® Workgroup to implement as appropriate.
2. The Member Advisory Council is chaired by the SVP—Operations.
Provider and Member Quality Incentive Program The 2017 Quality Incentive Program measurements were finalized in Q1 2017; internal provider
relations and quality management staff will complete training on program changes and enhancements (April 2017); training for primary care providers to be delivered via webinar in late April 2017.
The Provider Quality Incentive Program is overseen by the SVP—Operations and SVP—Primary Care Strategy.
Affinity’s 2017 Member Incentives continue to include services such as breast cancer screenings, prenatal/postpartum, and asthma care, which were in place at the time of Affinity’s 2013 EQR response. Affinity is currently evaluating the effectiveness of our program, including the possibility of engaging a vendor to administer the program on our behalf.
Provider Report Cards/Gaps-In-Care Reports
The report card and gaps-in-care reports serve as a tool that providers can use to monitor performance on key HEDIS®/QARR measures as well as Quality Incentive Program in progress.
The report cards/gaps-in-care reports layout and reporting requirements were enhanced in December 2016, development completed in January 2017. Report cards/gaps-in-care reports will be delivered monthly to participating primary care providers beginning in Q2 2017 once the program enhancement training has been provided.
The report cards/gaps-in-care report process is overseen by the VP—Operations, Quality & Risk Management.

Affinity Health Plan, Inc. | Reporting Year 2015 Technical Report 40
Enhanced Data Integration and Controls
Beginning in Q4 2016 and continuing throughout 2017, the following data quality, integrity, and completeness activities listed below demonstrate the increased controls and oversight Affinity has applied/will apply to data used for quality reporting:
o Q4 2016—Automated load of supplemental data feeds from Laboratory vendors into the corporate data warehouse.
o Q4 2016—Load of supplemental data feeds from providers into the corporate data warehouse.
o Q1 2017—Monthly and quarterly validation of vendor data volumes within the data warehouse against vendors’ administrative systems.
o Q2 2017—Identify and address common provider (including vendor providers) miscoding of services that are reportable through HEDIS®/QARR.
o Q4 2017—Identify and address high volume providers with low encounter submission rates.
Affinity leadership is most concerned with ensuring that members receive appropriate care, and that the MCO continues to receive a percentage of the available financial incentive each year. As indicated in this Reporting Year 2014 External Quality Review, Affinity has had this as a repeat recommendation based on the fact that the Plan received a percentage of the quality financial incentives in only 2 of the 3 years included in this review. Affinity would be remise in not reflecting that our 2015 HEDIS®/QARR measure year results in a Quality Action Plan filed in September 2016 with the NYS Department of Health Office of Quality and Patient Safety when Affinity had several non-validated measures, which will impact on the financial incentive for quality beginning April 2017. The measures described in this response are all focused on Affinity returning to receiving annual financial quality incentive at the 50% level or better. Affinity recognizes that returning to the 50% level may require more than one HEDIS®/QARR year and will require the following ongoing steps:
Improving integration of QM and IT to monitor and validate regular reporting of claims to enable the two years of reporting data to be maintained and analyzed.
Improving the year-end quality data so that the Chart Chase list for HYRBID measures is at a more manageable volume.
Sharing monthly report cards and gaps in care reports with our provider network to assist Affinity in improving scores.
Utilizing our provider and member advisory committees to identify areas that would benefit from focused improvement.
Quarterly reporting of our HEDIS®/QARR efforts internally to Affinity departments, to the Clinical Advisory Committee, and the Board of Directors QM and Medical Management Committee is a must to keep all attention on this important initiative to serve our members.
Affinity’s leadership recognizes that remediation of the issues that have previously affected the accuracy of Affinity’s reported rates including data integrity and mapping, medical coding, and medical record collection strategies must be priority for us to achieve improvement in our HEDIS®/QARR results with all measures at least at the State-reported rate with ultimately Affinity again receiving a 50% financial quality award in the upcoming years. Affinity’s Quality Management analytics team monitors providers’ progress, month over month, relative to gaps in care. When unfavorable trends are identified, both Quality Management and Provider Services staff prioritize site visits (based on the number of gaps in care) and conduct provider outreach

Affinity Health Plan, Inc. | Reporting Year 2015 Technical Report 41
for any providers who do not demonstrate a downward trend in terms of the number of members and/or measures appearing on subsequent gaps in care reports. In addition, Affinity slated Q2 2017 for an improved provider portal where information on monthly report cards, gaps in care, and educational material including posted recorded webinars offered as training to our provider network will be readily available. Affinity’s CAHPS® Workgroup is charged with addressing areas of opportunity identified in the Department of Health’s CAHPS® survey released in February 2017. Affinity also partners with SPH Analytics to conduct CAHPS® surveys in the first half of every year to continually gauge members’ satisfaction. When the results of this survey are released in June 2017, the Plan will incorporate any opportunities identified into the CAHPS® Workgroup’s 2017 work plan. Additionally, key quality performance indicators are reported out in the following venues:
Monthly—HEDIS®/QARR Benchmarking Reports (Q4 2016 ): monthly snapshot of Plan progress on HEDIS®/QARR measures for the current year compared to internally developed benchmarks, Statewide Average, and previous year’s HEDIS®/QARR reported rates.
Quarterly—Quality Workgroup Meeting (Feb. 2017, May 2017, Aug. 2017, Nov. 2017): quarterly report out of key quality performance indicators directly relating to HEDIS®/QARR performance, CAHPS® strategy development and implementation, as well as progress on performance/quality improvement projects.
Quarterly—Board Quality & Medical Management Committee (Feb. 2017, July 2017, Oct. 2017, Dec. 2017): quarterly meeting for Affinity Board members and key Affinity executive leadership to provide oversight and governance of Affinity’s corporate quality assurance program activities and progress.
In Affinity’s 2014 EQR response, the Plan shared provider-specific interventions which include a PCP Incentive Program, provider report cared, and gaps in care reports. Further, Affinity shared member-specific interventions relative to prenatal/postpartum care, breast cancer screenings, and asthma. These efforts continue and they have been enhanced to increase their effectiveness, as reflected above. Since that time, Affinity has implemented the following to augment those efforts: In 2015, Affinity implemented a Strategic Alliance Partners model with 30 provider groups that provide care for over 35% of our members. The Strategic Alliance Partners model has increased Plan/provider collaboration with regard to quality improvement initiatives. The ongoing dialogue with PCPs generated information on practice patterns, member and physician barriers to care, and best practices. The Strategic Alliance Partners are also key partners with regard to focused clinical initiatives such as our asthma, prenatal care, and smoking cessation performance improvement projects. In addition, a Provider Advisory Group consisting of community physicians was established in 2015, and continues to meet with Affinity leadership on a quarterly basis to share information. This group develops strategies to maximize available resources to improve health outcomes for Affinity members.
2014 Recommendation: As the MCO continues to struggle with improving access to primary care, the MCO should work to achieve the 75% compliance threshold for the Primary Care Access and Availability Survey. [Repeat recommendation.] MCO Response: We understand the Department’s concern regarding the results of the survey. To demonstrate our own due diligence, Affinity implemented a comprehensive internal plan of correction
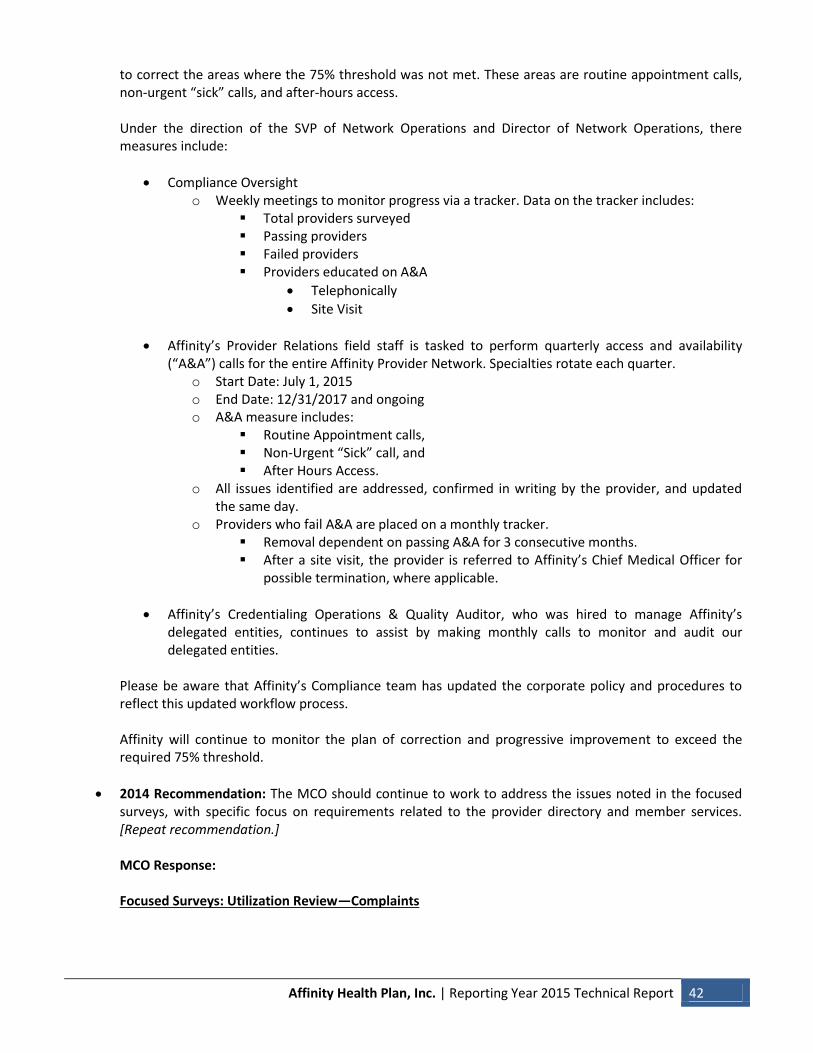
Affinity Health Plan, Inc. | Reporting Year 2015 Technical Report 42
to correct the areas where the 75% threshold was not met. These areas are routine appointment calls, non-urgent “sick” calls, and after-hours access. Under the direction of the SVP of Network Operations and Director of Network Operations, there measures include:
Compliance Oversight o Weekly meetings to monitor progress via a tracker. Data on the tracker includes:
Total providers surveyed Passing providers Failed providers Providers educated on A&A
Telephonically
Site Visit
Affinity’s Provider Relations field staff is tasked to perform quarterly access and availability (“A&A”) calls for the entire Affinity Provider Network. Specialties rotate each quarter.
o Start Date: July 1, 2015 o End Date: 12/31/2017 and ongoing o A&A measure includes:
Routine Appointment calls, Non-Urgent “Sick” call, and After Hours Access.
o All issues identified are addressed, confirmed in writing by the provider, and updated the same day.
o Providers who fail A&A are placed on a monthly tracker. Removal dependent on passing A&A for 3 consecutive months. After a site visit, the provider is referred to Affinity’s Chief Medical Officer for
possible termination, where applicable.
Affinity’s Credentialing Operations & Quality Auditor, who was hired to manage Affinity’s delegated entities, continues to assist by making monthly calls to monitor and audit our delegated entities.
Please be aware that Affinity’s Compliance team has updated the corporate policy and procedures to reflect this updated workflow process. Affinity will continue to monitor the plan of correction and progressive improvement to exceed the required 75% threshold.
2014 Recommendation: The MCO should continue to work to address the issues noted in the focused surveys, with specific focus on requirements related to the provider directory and member services. [Repeat recommendation.] MCO Response: Focused Surveys: Utilization Review—Complaints

Affinity Health Plan, Inc. | Reporting Year 2015 Technical Report 43
Incoming calls to the Customer Service department about clinical criteria are considered to be extremely important and require Customer Service staff to initiate the following process detailed below to ensure that the member receives the necessary information. These calls usually mean the member needs information pertaining to a medical procedure and/or requires education about the utilization Review and/or authorization process. This process was implemented in 2015 after the findings from the focused surveys were shared with Affinity leadership:
1. Member/Provider calls about a clinical criteria request. (i.e. Gastric Bypass) 2. Customer Service Representative (CSR) documents specific criteria request in our core system. 3. Includes Name, address, and telephone number, and records whether the information
requested should be transmitted mail, fax, or email. 4. The CSR records the request using the appropriate subject, request material and category;
clinical criteria in Facets. 5. The CSR sends the request to their supervisor and copies management via email for follow up. 6. The Supervisor forwards request sent to the Medical Management Department manager/
supervisor. 7. Medical Management manager or supervisor receives request, prints the criteria, and sends the
requested information to the member/provider via mail or their preferred method of delivery. 8. The request must be completed within three weeks of the date the request is made. However,
Customer Service has established an internal strategy to follow up on these clinical criteria requests within 24 hours.
9. Medical Management manager/supervisor sends the copy of the mailed clinical criteria to the supervisor as a confirmation that the material has been mailed.
10. The CS supervisor saves the letter in the Customer Service Shared drive database.
In 2016, the Director of Customer Service initiated these additional steps:
Topic Email Blast—an informative email is sent to the staff informing them of new Medicaid Redesign Initiatives (MRTs), the effective date, summary of benefits changes, and frequently asked questions.
Test Your Knowledge Email—An email is sent to the Customer Service staff to obtain feedback related to the MRTs and identify individuals who require additional training. This serves as a measurement tool for the department.
Benefit Grid (Q&A Reference Sheet)—A reference grid was created for the CS staff to utilize as a quick guide when encountering clinical criteria calls. This grid also assists in providing the most updated and accurate information.
Internal Audit Calls—All supervisors are required to conduct internal audit calls utilizing questions surrounding new benefits, MRTs, or processes by conducting a general call in the Main toll free number. When a response if not verbatim or correct, corrective or disciplinary action is taken by the supervisor to assist the CSR to achieve improvement. The CSR may need to attend formal Human Resources training if more than one audit finds additional areas of concern. These reviews become part of the performance review of the CSR staff.
Affinity has found that the integration between Customer Service and Medical Management has enabled members/providers to receive the requested information in a timelier manner. Focused Surveys: Disclosure: Complaints, Member Services Phone Calls Disclosure: Complaints and Member Services Phone Calls:

Affinity Health Plan, Inc. | Reporting Year 2015 Technical Report 44
The Customer Service department continues to review all concerns suggesting that a staff member incorrectly communicated with a member or provider. The department records all calls, and when a concern is raised, the leadership reviews the specific call recording. Any concern raised by a member or provider that can be resolved by the Customer Service department within 24 hours is documented with the resolution and closed internally. In addition, every month, the Customer Service department includes quality review of at least 5 calls on each of the call center staff members. The Customer Service department works closely with the Human Resources and business owners of the various products to ensure that the Customer Service Representative staff is up to date with the information one each of our lines of business—Medicaid, Child Health Plus, HARP. (In 2016, the Essential Plan requirements were included in the training as a new Line of Business.) There is, minimally, an annual update for all staff about changes/modifications in each line of business. The Customer Service leadership continually monitors their data to determine improvements needed—such as additional translation services, more bilingual staff, and appropriate call hours. The continuous monitoring and feedback of information to staff is important to the overall improvement efforts of the department with the objective of supporting our members with timely and accurate information to assist them in getting the care they need. The Customer Service team is responsible for sending any form of dissatisfaction or concern about quality of care from the member or member’s representative that cannot be resolved in 24 hours to the Grievance and Appeals (G&A) department for review and resolution. The Customer Service Representative (CSR) gathers all the details related to the matter and documents notes in the core system including who, what, where, when, and why. Everything stated by the caller is documented clearly. If the issue has to do with a provider, the CSR documents the provider’s name, address, telephone number, and NPI or Provider ID as well. After all needed information is appropriately documented, the CSR routes the information to notes to A&G for follow up. Both departments, Customer Service and Grievance and Appeals, collaborate to bring timely resolution to member/providers concerns to ensure that Affinity is addressing their issues appropriately. In addition, improving the knowledge of the Customer Service leadership around the technology capabilities of the phone system is important to improving our ability to serve our members and reduce manual efforts whenever possible. It is anticipated that upgrades will be fully implemented and training completed for the Customer Service leadership by end of 2Q 2017. Expanding call center functionality to the other departments receiving inbound calls will be completed by year end 2017. The SVP of Operations meets regularly with the Director of Customer Service and reviews the monthly data on call center operations. In addition, a workgroup focused on challenges being experienced by the Customer Service department to improve efficiency and quality has been chartered for 2Q 2017. This group will have focused objectives and identified measures that will be regularly reported to the executive leadership of Affinity Health Plan in 2017 with the overarching goal to improve efficiency, member and provider satisfaction. Maintaining well informed staff that are able to communicate accurate information with our membership is an area requiring continuous review and one that Affinity recognizes. Regular staff education and monitoring is a process that Affinity is committed to in order to better serve our

Affinity Health Plan, Inc. | Reporting Year 2015 Technical Report 45
members. Since 2013, Affinity has added the following new initiatives in support of improving communication and ensuring compliance with Disclosure:
Initiated a Member Advisory Council with planned meetings twice per year in 2017 in three locations to best reach membership in our 10 counties.
Initiated a “Contact Us” section on the Affinity website for ease.
Established the 2017 Work Group focused on improving call center efficiency and functionality.
Scheduled biannual meetings with our phone vendor to better understand our technological resources to serve our membership and to incorporate self-service functionality where appropriate.
Focused Surveys: Organization Management, Quality Assurance, Provider Participation—Directory In 2014, comprehensive efforts to scrub our entire network were accomplished by outside vendors. These efforts led to several hundred corrections to our core data platform system. We hired one full time employee to continue provider verification calls on a monthly basis, and one full time employee dedicated to monitor our delegated entities. This effort had such a great impact on continuous data correction and integrity that we hired 5 additional full time employees and created a team strictly dedicated to the accuracy of our provider directory. The scope of their work included:
Confirmation of all accurate data demographics to include all participating locations and LOBs
Ensure providers are compliant with Access and Availability standards as outlined in our Medicaid Model Contract.
To demonstrate our own due diligence to correct previous provider directory problems, Affinity implemented a comprehensive internal plan of correction to resolve these issues:
Implementation of quarterly reconciliations with our delegated entities.
Re-training of staff members responsible for maintaining accurate directory information on the protocols for identifying and correcting data issues.
Development of a Provider Data Integrity Taskforce (PDIT) for our delegated credentialing provider entities to review guidelines for the accurate intake of provide data demographics. These guidelines will address the requirements for submitting data, data specifications, requirements for data validation, timeframes for receiving and completing updates, and quarterly reconciliations of existing provider data.
Development of a data query that compares provider data in our directory with that of provider data submitted on claim submissions to identify inconsistencies. Query ran monthly.
In 2015 and prospectively, in an effort to achieve continuous improvement and to demonstrate our own due diligence, Affinity implemented and continues to implement a comprehensive internal plan of correction to correct the areas where the provider did not pass the survey. We have also set up internal goals to exceed our current overall compliance rate of 77.5% and 80% for the online directory. These areas are:
o Provider not accepting new patients, o Provider with changes to specialty, and o Provider not participating in Health Plan

Affinity Health Plan, Inc. | Reporting Year 2015 Technical Report 46
Under the direction of the SVP of Network Operations and Director of Network Operations, these measures include:
Compliance Oversight o Weekly meetings to monitor progress via tracker. Data on tracker includes:
Total Providers Surveyed Passing Providers Failed Providers Providers Educated on provider directory
Telephonically
Site Visit
Hiring of additional full-time employees dedicated to conduct internal audits for the entire network. Their roles and responsibilities are strictly dedicated to ensure the accuracy of the Plan’s provider directory.
o Start Date: July 1, 2015 o End Date: 12/31/2017 and ongoing o Directory Audit measures include:
Ensure Providers’ demographic information is correct Provider’s specialty reflects accurately in our directory Provider is reachable at the phone number and the office hours provided
o All issues identified are addressed, confirmed in writing by the provider, and updated the same day.
o Providers who fail the provider directory audit are placed on a monthly tracker. Removal dependent on passing the directory audit for 3 consecutive months. After site visit, provider is referred to Affinity’s Chief Medical Officer for possible
termination where applicable.
Affinity’s Credentialing Operations & Quality Auditor, who was hired to manage Affinity’s delegated entities, continues to assist by making monthly calls to monitor and audit our delegated entities.
Quarterly roster reconciliations with our delegated entities have been implemented, as well. On the first Monday of each Quarter, our Provider Data Maintenance Specialists send the Provider roster to delegated entities and complete a 30-day reconciliation to ensure the data received from our delegated entities is updated accurately in our provider directory.
Affinity remains committed to producing a robust and compliant provider directory. Affinity will continue to monitor the progress and improvement or our provider directory to exceed the required 75% threshold.
Affinity Health Plan, Inc. | Reporting Year 2015 Technical Report 47
X. Appendix
REFERENCES
A. Corporate Profile
Updated Corporate Profile information provided by the NYSDOH
NYSDOH OMC DataLink Reports
Managed Care Plan Directory
NCQA Accreditation website, http://hprc.ncqa.org/index.asp
B. Enrollment/Provider Network 1. Enrollment/Disenrollment
NYSDOH OMC Membership Data, 2013-2015
Enrollment by Age and Sex Report as of December 2015
Enrollment Status by Aid Category and County as of December 2015
Auto Assignment Data, 2013-2015
Auto Assignment Quality Algorithm Scores, 2013-2015
Enrollment Status Report, 2015 2. Provider Network
Providers Statewide by Specialty, Medicaid Managed Care in New York State Provider Network File Summary, December 2015
Total Number of FTEs by Managed Care Plans, December 31, 2015
NYSDOH OMC Primary Care Providers Open and Closed Panels by Plans, Provider Network Data as of December 31, 2015
QARR Measurement Year, 2013-2015
C. Utilization 1. Encounter Data
MMC Encounter Data System, 2013-2015 2. QARR Use of Services
QARR Measurement Year, 2013-2015
D. Quality Indicators 1. Summary of HEDIS® Information Systems AuditTM Findings
2016 Final Audit Report prepared by the MCO’s Certified HEDIS® Auditors 2. QARR Data
Performance Category Analysis, Quality Performance Matrix (2015 Measurement Year)
QARR Measurement Year, 2013-2015 3. CAHPS® 2015 Data
QARR Measurement Year, 2015 4. Quality/Satisfaction Points and Incentive
Quality/Satisfaction Points and Incentive, 2013-2015 5. Performance Improvement Project
2015-2016 PIP Report 6. Health Disparities
NYSDOH Health Disparities Survey, 2015

Affinity Health Plan, Inc. | Reporting Year 2015 Technical Report 48
E. Health Information Technology
NYSDOH Health Information Technology Survey, 2015
F. Deficiencies and Appeals 1. Summary of Deficiencies
MMC Operational Deficiencies by Plan/Category, 2015
Focus Deficiencies by Plan/Survey Type/Category, 2015 2. Appeals
MMC External Appeals Data, 2015
G. Financial Data
Medicaid Managed Care Operations Report, 2015