externality of multinational companies in bonded …
TRANSCRIPT

Customs Research and Application Journal Vol. 2 No. 1 2020
1 | P a g e
EXTERNALITY OF MULTINATIONAL COMPANIES IN BONDED ZONE TO
LOCAL COMPANY PRODUCTIVITY IN INDONESIA
Setiyono Nugroho1, Prani Sastiono2
1 Program Pascasarjana Ilmu Ekonomi, Fakultas Ekonomi dan Bisnis, Universitas
Indonesia, Depok, 16424 2 Program Pascasarjana Ilmu Ekonomi, Fakultas Ekonomi dan Bisnis, Universitas
Indonesia, Depok, 16424
Email:[email protected]
ARTICLE INFORMATION
Received date
[08-05-2020]
Revision
[10-06-2020]
Accepted date
[22-06-2020]
ABSTRACT:
Multinational Companies (MNC) in the Bonded Zone (BZ) obtain tax incentives and are
required to export their product. Those differences allegedly led to the difference in
externalities. This paper discussed the indirect impact of MNC on the productivity of local
firms in Indonesia with a measure of productivity using Total Factor Productivity (TFP).
Furthermore, this thesis seeks to measure the difference impact between MNC which
operated on BZ and MNC which operated outside the BZ. Using the tax report data
period 2011-2015, the estimation result shows that the presence of MNC brings positive
externalities to local firm productivity, and MNC which operated on BZ have bigger
externalities than MNC which operated outside BZ.
Keywords: Externalities, Multinational Companies, Bonded Zone, Total Factor Productivity

Customs Research and Application Journal Vol. 2 No. 1 2020
2 | P a g e
INTRODUCTION
The trade war between the US and China continues to this day with no signs of
ending (picture 1). Because of the trade war, the US and China are trying to find markets
to replace export destinations, one of which is Indonesia. This caused the depressed trade
balance in Indonesia. During 2019 Indonesia's trade balance was a deficit of US $ 2.55
billion (Indonesian Customs, January 2020). Pressure on the import and export sector
also contributed to slowing economic growth.
Picture 1. Trade War Us China
Source: Summary of various electronic media
The World Bank suggests that to resolve the above problems, not by limiting
imports but by increasing investment. Because reducing the volume of trade will also
result in a decline in economic growth (World Bank, September 2019).
Picture 2. Indonesia Economic Growth Prediction Source: Global economic risk and implications for Indonesia (World Bank 2019)

Customs Research and Application Journal Vol. 2 No. 1 2020
3 | P a g e
One source of investment is foreign investment, one of them is through the
establishment of multinational companies (MNC). It can increase economic growth,
absorb labor forces, and increase exports. Zee, Stotsky, & Ley, (2002) said that several
mechanisms to attract MNCs were to provide tax incentives, one of the incentives that
could be provided was export-oriented incentives. One of the export-oriented incentive
schemes given by the Indonesian government to attract MNCs is the Bonded Zone.
According to Minister of Finance Regulation (PMK) number 131 /PMK.04/2018
concerning the fourth amendment to PMK number 147/PMK.04/2011 concerning
Bonded Zone. In Bonded Zones, companies obtain tax exemptions on imported raw
materials and imported capital goods, but their products must be exported. Indonesia has
experienced a significant increase in investment over the past 15 years with the Bonded
Zone scheme, from 148 companies in 2002 to 1575 companies in 2017 (Indonesian
Customs, January 2019). The last study of the impact of Foreign Direct Investment (FDI)
on the Indonesian economy was conducted by Sjöholm, (1999) who showed that FDI was
important for the economic growth of countries in east and southeast Asia, especially
Indonesia. The calculation of the direct impact of companies operating on Bonded Zone
has been carried out by the Indonesian Customs with the result that companies in Bonded
Zone contribute 61 trillion rupiahs to the GRDP or around 16% of the total GRDP and
absorb 400,000 workers.
Blomstrom & Kokko, (1997), B. J. Aitken & Harrison, (1999) said that MNCs in
their activities also carry an indirect impact. One of them is when transferring technology
to local companies. The technology transfer can occur directly, that is when the MNC
opens cooperation with local companies, the MNC will teach the technology it carries or
occurs indirectly when local companies copy products and technologies brought by MNC.
Caves, (1974) said that technological progress will have a positive impact on a company's
productivity. It is expected that the productivity of local companies can increase, with the
transfer of technology from MNC. Based on this, MNC can bring positive externalities
to the productivity of local companies. On the other hand, B. Aitken, Hanson, & Harrison,
(1997) also said that the presence of MNC also brings increased competition for local
companies, both competition for resources, raw materials, human capital, and market
competition. If the competition is too strong, local companies will experience an increase
in production costs, making it difficult for local companies to develop and will instead

Customs Research and Application Journal Vol. 2 No. 1 2020
4 | P a g e
exit the market or negative externalities. The results of empirical research on the presence
of MNCs on the productivity of local companies in various countries show different
effects, several studies found positive externalities on the presence of MNCs such as Liu,
(2008) in China, while Waldkirch & Ofosu, (2010) found MNCs had no effect what is
the productivity of local companies in Ghana.
Empirical research on the impact of the presence of MNCs on the productivity of
local companies in Indonesia still shows different results, Matthias Arnold & Javorcik,
(2009) found that most MNCs entering Indonesia had a Total Factor Productivity (TFP)
lower by 6% from the average TFP local companies in Indonesia that are bigger and more
mature in age. Suyanto et al., (2009) found that MNC productivity was higher than local
companies but the study was only in the drug and chemical sector, they also found that
MNC brought positive externalities to the productivity of local companies. Aitken,
Hanson, & Harrison, (1997) say the difference is due to the mutual attraction between the
positive impact caused by transfer technology and the negative impact caused by the
competition effect. Depending on which is stronger the impact will give different results.
Differences in the impact of externalities according to Crespo and Fontoura (2007) can
be influenced by various factors such as absorptive capacity, technological gap, and
regional effect.
Next is the impact of Bonded Zone, MNCs operating in it obtain tax exemptions on
raw materials and capital goods used, provided that their production proceeds for export,
while MNCs that operate outside the Bonded Zone do not get tax exemptions and are not
required to export their products. Companies operating in the export market are more
productive than companies that only operate in the local market (Sharma & Mishra,
2012). The difference is thought to affect the productivity and the impact of externalities
between MNCs operating in Bonded Zone compared to those operating outside the
Bonded Zone. The impact due to export obligations and the competition effect of MNCs
operating in the Bonded Zone will be different from MNCs outside the Bonded Zone. To
prove this opinion, Abraham, Konings, & Slootmaekers, (2010) compared the impact of
FDI externalities operating within the SEZ (Special Economic Zone) with FDI outside
the SEZ in China. They found the externality of FDI on the SEZ to be almost the same as
the FDI operating outside the SEZ, so it recommended for the Chinese government to
reconsider the existence of the SEZ.

Customs Research and Application Journal Vol. 2 No. 1 2020
5 | P a g e
Bonded Zone in Indonesia is spread in various cities in 8 provinces, unlike the SEZ
in China which only exists in 6 cities in 3 provinces. Similarly, the technological
conditions of manufacturing companies in China, which have advanced, the technology
of the manufacturing industry in Indonesia is still developing. Because of these two
different things, there is a suspicion that the externalities of MNC on Bonded Zone in
Indonesia will be different from FDI externalities on SEZ in China. Based on this
description, this research will recalculate the impact of MNC externalities in Indonesia.
This study also distinguishes externalities between MNCs operating on Bonded Zone and
those operating outside Bonded Zone by using a microdata analysis unit in the form of a
2011-2015 corporate annual tax report.
LITERATURE REVIEW AND HYPOTHESIS DEVELOPMENT
MNC is a company that works in at least 2 countries intending to increase profits.
According to John H. Dunning, (1988), there are several reasons companies invest in
other countries. Among others are:
a. Market Seeker
b. Efficiency seeker
c. Ownership and location advantages seeker
d. Resource seeker
Furthermore, as a guarantee of profitability, Görg et al., (2010) said that MNC
requires more advanced technology compared to local companies in the investment
destination country. By bringing more advanced technology, MNCs can be more
productive than the destination country's local companies to ensure the goal of increasing
profits can be achieved. With this assumption, local companies will obtain technology
transfer both directly and indirectly in the presence of MNC.
Blomstrom & Kokko, (1998) share how MNC transfers technology (Technology
Transfer Channel) to local companies as follows:
a. Direct technology transfer
MNC directly influences technology through subsidiaries and subcontracts with local
companies. By getting local companies to participate in the production chain, MNC
will directly transfer technology.
Customs Research and Application Journal Vol. 2 No. 1 2020
6 | P a g e
b. Indirect technology transfer
As stated by Blomstrom & Kokko, (1998), Horizontal Spillover occurs when MNC
activities influence local companies through the Demonstration Effect, Human
Capital Effect, and Competition Effect.
The presence of MNC not only gives positive externalities but also brings negative
externalities. That is due to several things as follows:
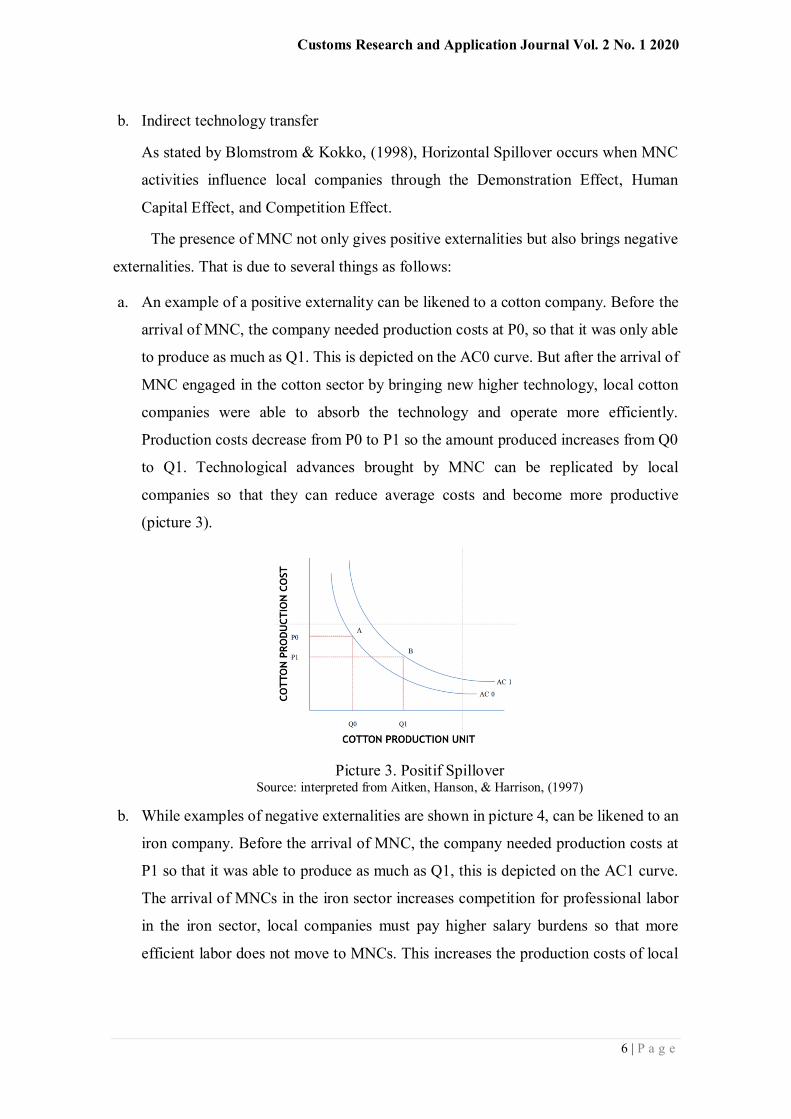
a. An example of a positive externality can be likened to a cotton company. Before the
arrival of MNC, the company needed production costs at P0, so that it was only able
to produce as much as Q1. This is depicted on the AC0 curve. But after the arrival of
MNC engaged in the cotton sector by bringing new higher technology, local cotton
companies were able to absorb the technology and operate more efficiently.
Production costs decrease from P0 to P1 so the amount produced increases from Q0
to Q1. Technological advances brought by MNC can be replicated by local
companies so that they can reduce average costs and become more productive
(picture 3).
Picture 3. Positif Spillover Source: interpreted from Aitken, Hanson, & Harrison, (1997)
b. While examples of negative externalities are shown in picture 4, can be likened to an
iron company. Before the arrival of MNC, the company needed production costs at
P1 so that it was able to produce as much as Q1, this is depicted on the AC1 curve.
The arrival of MNCs in the iron sector increases competition for professional labor
in the iron sector, local companies must pay higher salary burdens so that more
efficient labor does not move to MNCs. This increases the production costs of local

Customs Research and Application Journal Vol. 2 No. 1 2020
7 | P a g e
companies from P1 to P2 and decreases the productivity of local companies from Q1
to Q2.
Picture 4. Negatif Spillover
Source: interpreted from Aitken, Hanson, & Harrison, (1997)
c. The arrival of MNC in the cotton sector has a positive impact because it increases
the productivity of local cotton producers, while the presence of MNC in the iron
sector has a negative impact because it increases the costs of raw materials and labor,
thereby reducing the productivity of local iron producers. With this illustration, Total
Factor Productivity on cotton production and iron production is the most appropriate
instrument used to measure the presence of MNC externalities or not and which is
more dominant, whether the positive effects of technological learning or the negative
effects of competition are more dominating (picture 5).
Picture 5. Production Possibility Frontier
Source: interpreted from Aitken, Hanson, & Harrison, (1997)
Crespo & Fontoura, (2007) said that externalities are influenced by various factors
such as absorptive capacity, technological gap, and regional effect. Technology
differences that are too small make local companies not get new technology, while
Iron Sector
Cotton Sector

Customs Research and Application Journal Vol. 2 No. 1 2020
8 | P a g e
differences that are too large make it difficult for local companies to emulate. Based on
regional boundaries, the farther away from local companies and MNCs are, the smaller
the impact of externalities. This is due to the higher transportation costs (Girma 2003).
So that in general the biggest MNC impact only occurs to local companies that are in the
same region with the MNC.
MNCs on Bonded Zone are permitted to work with local companies through
subcontracting schemes, as well as there are no restrictions on employee recruitment to
Bonded Zone, so MNCs on Bonded Zone can provide positive spillovers to companies in
the same sector or horizontal spillover. Because MNCs operating in Bonded Zone obtain
import tax exemptions on raw materials and capital goods used, they work more
efficiently and productively. Amiti & Konings, (2016), Mayende, (2013) and Halpern,
Koren, & Szeidl, (2015) have proven that companies that obtain tariff reductions taxes on
the purchase of intermediate goods and capital goods, work becomes more efficient and
more productive.
Lu, (2010) and Sharma, (2017) say that companies operating in the export market
are also more productive than companies that only operate in the local market. MNCs in
Bonden Zone can allocate funds to adopt better new technologies with tax incentives, for
example investing in more sophisticated machines and more productive human resources.
MNCs that are in Bonden Zone are more productive, have higher technology, and have
better export market access compared to MNCs that are outside of Bonden Zone,
indirectly will create higher positive externalities. The MNC competition effect in the
Bonden Zone will be lower than the MNC in the Bonden Zone and make negative
externalities lower with export obligations and local sales limits.
Research conducted by Abraham et al., (2010) in China measures the externality
impact of the presence of MNCs in the Special Economic Zone (SEZ), they found that
MNCs on SEZ in China carry almost the same externalities as MNCs outside of SEZ. So
with these results, Abraham, Konings, & Slootmaekers, (2010) suggested that the Chinese
government consider the tax incentives provided through the Special Economic Zone
(SEZ) scheme. In Indonesia, it is suspected that there is a difference in technology
difference between MNCs in China and local companies in China compared to MNCs in
Indonesia with local companies in Indonesia, as well as the location and distribution of

Customs Research and Application Journal Vol. 2 No. 1 2020
9 | P a g e
Chinese SEZs and Bonded Zone in Indonesia, so it is necessary to calculate the impact of
MNC externalities on Bonded Zone in Indonesia.
So, the hypotheses to be tested in this study are as follows :
a. That MNC is more productive than local companies and has positive externalities:
i. H0: MNC has the same TFP from a local company, 𝛾1 = 0. H1: MNC has a TFP
greater than a local company, 𝛾1> 0.
ii. H0: MNC does not have an externality to the local company's TFP, 𝛿1= 0. H_1:
MNC has a positive externality towards the local company's TFP, 𝛿1> 0
b. That MNCs that carry out export activities are more productive than MNCs that do
not export and have greater externalities:
i. H0: MNC which conducts export and import activities has the same TFP from
MNC which only operates in the local market, 𝛾2 = 0. H1: MNC which conducts
export and import activities has a TFP greater than MNC which only operates in
the local market, 𝛾2> 0.
ii. H0: MNC which does export activities has the same externality as MNC which
does not export, 𝛿2= 0. H1: MNC that does export activities has a greater
externality than MNC that does not export, 𝛿2> 0.
c. That MNCs carrying out export activities at Bonded Zone is more productive than
MNCs outside Bonded Zone and have greater externalities:
i. H0: MNC which is in Bonded Zone has a TFP the same from MNC which carries
out export activities, 𝛾3 = 0. H1: MNC which is in Bonded Zone has a TFP
greater than MNC which carries out export activities, 𝛾3 > 0.
ii. H0: MNCs in the Bonded Zone has the same TFP from MNCs that carry out
export activities, 𝛿3 = 0. H1: MNCs in Bonded Zone have greater externalities
than MNCs outside the bonded zone, 𝛿3 > 0.
RESEARCH METHODS
To find out the impact of MNC on local companies, Abraham et al., (2010)
measured the productivity growth of local companies at the location of the MNC. The
variable used to measure productivity is Total Factor Productivity (TFP). The dependent

Customs Research and Application Journal Vol. 2 No. 1 2020
10 | P a g e
variable in this study is Total Factor Productivity (TFP) or company productivity. The
approach commonly used to estimate productivity is through the company's production
function as follows:
𝑌𝑖𝑡 = A𝑖𝑡 (𝐿𝑖𝑡𝛽𝑙
𝐾𝑖𝑡𝛽𝑘
)
............................................................................................................................................ (1)
where Y is output, L is labor, and K is Capital, while A is the measure of a company's
technical progress (i) in period (t). By taking the natural logarithm of the above equation,
we find:
ln(𝑌𝑖𝑡) = 𝛽0 + α 𝑙𝑛 𝐿𝑖𝑡 + 𝛽 𝑙𝑛 𝐾𝑖𝑡 +
𝜗𝑖𝑡 .......................................................................................................... (2)
Or
ln(𝑌𝑖𝑡) = ln(𝐴)𝑖𝑡 + α ln 𝐿𝑖𝑡 +
𝛽 𝑙𝑛 𝐾𝑖𝑡 .............................................................................................................(3)
So
ln(𝐴)𝑖𝑡 = 𝛽0 +
𝜗𝑖𝑡 ............................................................................................................................................(4)
The estimation method above is considered vulnerable to bias, the production input
of a company is influenced by company characteristics, and the company's reaction in the
face of external shock. De Loecker, (2007) said when positive shock production occurs,
for example when holding overtime. will cause upward bias in K, then when there is a
negative shock to production, for example, workers on strike will make the capital
coefficient downward biased. So the calculation of TFP using ordinary OLS will be
biased and inconsistent. To overcome this problem, it is recommended for simultaneous
models with instrument variables that are not affected by shock, in this case, what is
suggested by is an investment in the previous year, because an investment is determined
one period earlier so that it is not affected by simultaneous bias.
𝐼𝑛𝑣𝑖𝑡 =
𝑓𝑡 (𝜔𝑖𝑡 , 𝐾𝑖𝑡) ......................................................................................................................................
.....(5)
In the use of investment variables, the problem is that there is often no investment
growth between years so Levinsohn & Petrin (2003) cannot be calculated. Another
variable that is suggested is to use Intermediate Input where the input demand of a
company is a function of the capital owned by the company and its progress technology.
The first is to add raw materials to the production function so that they become:

Customs Research and Application Journal Vol. 2 No. 1 2020
11 | P a g e
𝑌𝑖𝑡 = A𝑖𝑡 (𝐿𝑖𝑡𝛽𝑙
𝐾𝑖𝑡𝛽𝑘
𝑀𝑖𝑡𝛽𝑚
)
....................................................................................................................................(6)
then by taking the natural logarithm so it becomes:
ln(𝑌𝑖𝑡) = 𝛽0 + 𝛽𝑙 𝑙𝑛 𝐿𝑖𝑡 + 𝛽𝑘 𝑙𝑛 𝐾𝑖𝑡 + 𝛽𝑚 𝑙𝑛 𝑚𝑖𝑡 +
𝜗𝑖𝑡 ..................................................................................(7)
where 𝛽0 is productivity differences between companies and 𝜗𝑖𝑡 is the total of
unobservable technological progress, management progress, and error. So that it can be
broken down again into:
ln(𝑌𝑖𝑡) = 𝛽0 + 𝛽𝑙 𝑙𝑛 𝐿𝑖𝑡 + 𝛽𝑘 𝑙𝑛 𝐾𝑖𝑡 + 𝛽𝑚 𝑙𝑛 𝑚𝑖𝑡 + 𝜔𝑖𝑡 +
휀𝑖𝑡 ........................................................................ (8)
because the input is influenced by the capital owned by the company and its
technological progress, then
𝑚𝑖𝑡 =
𝑔𝑡 (𝜔𝑖𝑡 , 𝐾𝑖𝑡) ......................................................................................................................................
......(9)
because strictly monotonicity, then
𝜔𝑖𝑡 =
𝑔𝑡−1( 𝑚𝑖𝑡 , 𝐾𝑖𝑡) ...................................................................................................................................
.....(10)
𝜔𝑖𝑡 =
𝑠𝑡( 𝑚𝑖𝑡 , 𝐾𝑖𝑡) ......................................................................................................................................
.....(11)
then to overcome the simultaneous bias problem, add (9) to (8) so that it becomes
𝑦𝑖𝑡 = 𝛽𝑙𝑙𝑖𝑡 + 𝑠𝑡(𝑚𝑖𝑡 , 𝑘𝑖𝑡) +
휀𝑖𝑡 .......................................................................................................................(12)
where
𝑠𝑡(𝑚𝑖𝑡 , 𝑘𝑖𝑡) = 𝛽0 + 𝛽𝑘 𝑙𝑛 𝐾𝑖𝑡 + 𝛽𝑚𝑚𝑖𝑡 +
𝜔𝑖𝑡( 𝑚𝑖𝑡 , 𝐾𝑖𝑡)...............................................................................(13)
by using the Generalized Method of Moment (GMM, Levinsohn & Petrin, (2003) we can
obtain 𝛽𝑙 on the first estimate and coefficients 𝛽𝑘 and 𝛽𝑚 the second stage estimation.
After measuring productivity, then we measure the presence of MNC in an area
where local companies are located. To measure the presence of MNC in an area, this
study uses the marketshare model proposed by B. Aitken et al., (1997). Marketsharemnc
as an illustration of the presence of MNC in each province of each sector is all MNC
company output divided by total company output.

Customs Research and Application Journal Vol. 2 No. 1 2020
12 | P a g e
𝑀𝑎𝑟𝑘𝑒𝑡𝑠ℎ𝑎𝑟𝑒𝑚𝑛𝑐𝑗 =∑ 𝑑𝑢𝑚𝑚𝑦𝑚𝑛𝑐𝑖𝑗𝑡𝑖 .𝑜𝑢𝑡𝑝𝑢𝑡𝑖𝑗𝑡
∑ 𝑂𝑢𝑡𝑝𝑢𝑡𝑖𝑗𝑡𝑖 ...............................................................................................(14)
To prove the existence of MNC to bring externalities to local company productivity,
a model that is adapted from the research conducted is used by Abraham et al., (2010).
Abraham et al., (2010) included the MNC presence variable in the form of
Marketsharemnc for work productivity growth as illustrated by ln (TFP). The first is to
make the local company TFP as the main variable and use the market sharemnc as the
control variable.
𝑙𝑛(𝑇𝐹𝑃)𝑖𝑡
= 𝛿0 + 𝛿1 𝑀𝑎𝑟𝑘𝑒𝑡𝑠ℎ𝑎𝑟𝑒𝑚𝑛𝑐𝑗𝑡 + 𝛾1 𝑑𝑢𝑚𝑚𝑦𝑚𝑛𝑐
𝑖+ 𝑑𝑝 + 𝑑𝑗 + 𝑑𝑡 +
휀𝑖𝑡 .................................. (15)
Next is the existence of proving the suspicion that MNCs which do export are more
productive so that they provide greater positive externalities than MNCs that do not
export. By separating MNCs from exporting and those not using dummyexporters and
interacting with marketshare.
𝑙𝑛(𝑇𝐹𝑃)𝑖𝑡
= 𝛿0 + 𝛿1 𝑀𝑎𝑟𝑘𝑒𝑡𝑠ℎ𝑎𝑟𝑒𝑚𝑛𝑐𝑗𝑡 + 𝛿2 𝑀𝑎𝑟𝑘𝑒𝑡𝑠ℎ𝑎𝑟𝑒𝑚𝑛𝑐𝑗𝑡 𝑥 𝑑𝑢𝑚𝑚𝑦𝑒𝑘𝑠𝑝𝑜𝑟𝑡𝑖𝑟𝑖𝑡
+
𝛾1 𝑑𝑢𝑚𝑚𝑦𝑚𝑛𝑐
𝑖+ 𝛾
2 𝑑𝑢𝑚𝑚𝑦𝑒𝑘𝑠𝑝𝑜𝑟𝑡𝑖𝑟
𝑖+ 𝑑𝑝 + 𝑑𝑗 + 𝑑𝑡 +
휀𝑖𝑡 .................................................................(16)
Last is to prove the suspicion that MNCs operating on Bonded Zone are more
productive so that they provide greater positive externalities than MNCs outside of
Bonded Zone. By separating MNCs using dummykb and interacting with marketshare.
𝑙𝑛(𝑇𝐹𝑃)𝑖𝑗
= 𝛿0 + 𝛿1 𝑀𝑎𝑟𝑘𝑒𝑡𝑠ℎ𝑎𝑟𝑒𝑚𝑛𝑐𝑗𝑡 + 𝛿2𝑀𝑎𝑟𝑘𝑒𝑡𝑠ℎ𝑎𝑟𝑒𝑚𝑛𝑐𝑗𝑡 𝑥 𝑑𝑢𝑚𝑚𝑦𝑒𝑘𝑠𝑝𝑜𝑟𝑡𝑖𝑟𝑖𝑡
+
𝛿3𝑀𝑎𝑟𝑘𝑒𝑡𝑠ℎ𝑎𝑟𝑒𝑚𝑛𝑐𝑗𝑡 𝑥 𝑑𝑢𝑚𝑚𝑦𝐾𝐵𝑖𝑡
+ 𝛾1 𝑑𝑢𝑚𝑚𝑦𝑚𝑛𝑐
𝑖+ 𝛾
2 𝑑𝑢𝑚𝑚𝑦𝑒𝑘𝑠𝑝𝑜𝑟𝑡𝑖𝑟
𝑖+ 𝛾
3 𝑑𝑢𝑚𝑚𝑦𝑘𝑏
𝑖+
𝛿4𝑙𝑛𝑑𝑖𝑝𝑎 + 𝛿5 𝑙𝑛𝑗𝑙𝑛 + 𝑑𝑝 + 𝑑𝑗 + 𝑑𝑡 +
휀𝑖𝑡 .................................................................................................. (17)
while the control used in this measurement is the role of government in increasing public
goods which is described by the amount of government expenditure and road conditions
as a control (Girma 2003), the next control is the technological similarity and regional
effects of Crespo & Fontoura, (2007). By using provincial dummy to distinguish regional
effects and business sector dummy to distinguish technological similarities.
The data used are company data reported to the Directorate General of Taxes on the
Special Reports Tax Form 8A-I. In the Y variable which is the company's output the total
net sales data is used, the K variable uses the value of land and buildings, the L variable
Customs Research and Application Journal Vol. 2 No. 1 2020
13 | P a g e
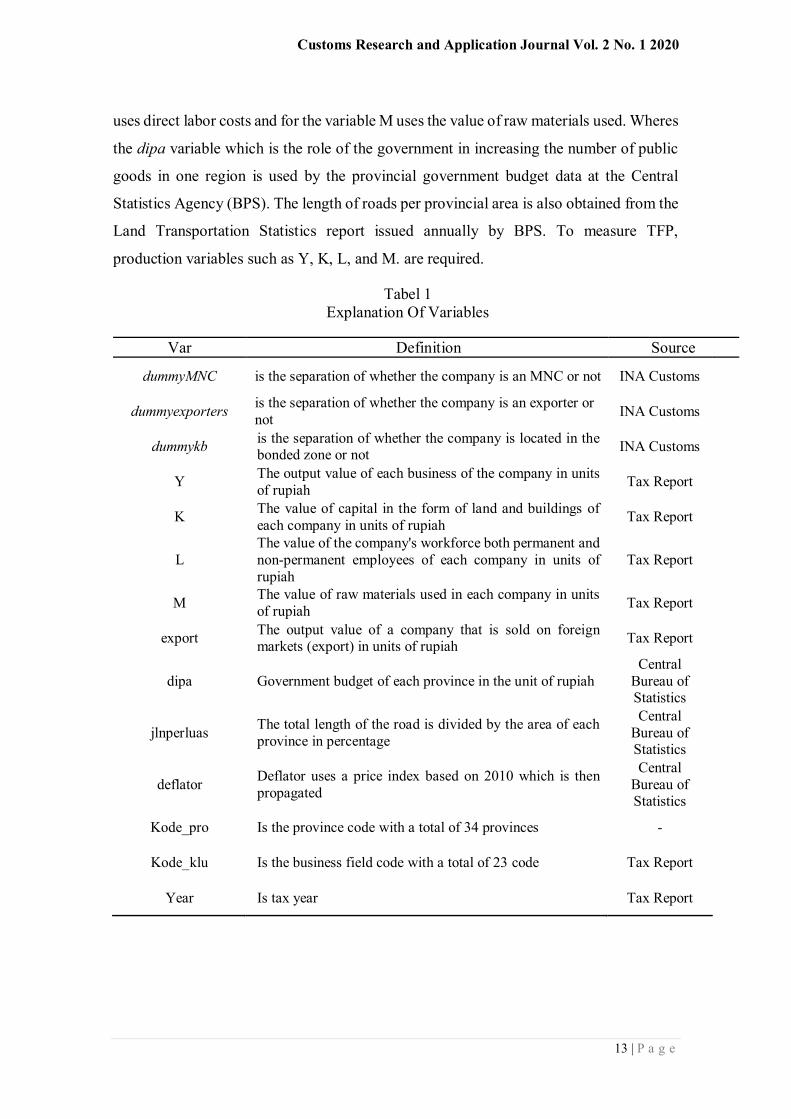
uses direct labor costs and for the variable M uses the value of raw materials used. Wheres
the dipa variable which is the role of the government in increasing the number of public
goods in one region is used by the provincial government budget data at the Central
Statistics Agency (BPS). The length of roads per provincial area is also obtained from the
Land Transportation Statistics report issued annually by BPS. To measure TFP,
production variables such as Y, K, L, and M. are required.
Tabel 1
Explanation Of Variables
Var Definition Source
dummyMNC is the separation of whether the company is an MNC or not INA Customs
dummyexporters is the separation of whether the company is an exporter or
not INA Customs
dummykb is the separation of whether the company is located in the bonded zone or not
INA Customs
Y The output value of each business of the company in units
of rupiah Tax Report
K The value of capital in the form of land and buildings of
each company in units of rupiah Tax Report
L
The value of the company's workforce both permanent and
non-permanent employees of each company in units of
rupiah
Tax Report
M The value of raw materials used in each company in units
of rupiah Tax Report
export The output value of a company that is sold on foreign markets (export) in units of rupiah
Tax Report
dipa Government budget of each province in the unit of rupiah
Central
Bureau of Statistics
jlnperluas The total length of the road is divided by the area of each
province in percentage
Central
Bureau of Statistics
deflator Deflator uses a price index based on 2010 which is then
propagated
Central
Bureau of Statistics
Kode_pro Is the province code with a total of 34 provinces -
Kode_klu Is the business field code with a total of 23 code Tax Report
Year Is tax year Tax Report

Customs Research and Application Journal Vol. 2 No. 1 2020
14 | P a g e
ANALYSIS AND DISCUSSION
The data we have consisted of 6,079 companies with 30,395 observations. Our
panel data is included in the balanced panel. The problem is that there is an inequality
that is too high on the road variable because there are values below 1% and above 99%
where the smallest value is in the provinces of Papua and North Kalimantan compared
with the largest value in the province of DKI Jakarta. But given that there are MNCs in
the province which were the main objective of the study, the data was not deleted. While
the division according to the business category of the company is divided into 34 (thirty-
four) business field.
Tabel 2
Statistic Descriptif
Var Obs Unit Mean Std.Dev Min Max
Y 12002 M Rp 217,0 1,270 0 51,000
K 17695 M Rp 63,3 364 0 16,000
L 12002 M Rp 9,3 30 0 830
M 12002 M Rp 140,0 923 0 39,000
Exp 15705 M Rp 24,4 333 0 16,000
dipa 17695 M Rp 19,8 14 0 53
jln 17695 % 158% 234% 0% 686%
Source: processed form the Directorate General of Taxes, 2011-2015.
As a basis for research, first calculate TFP according to the method used by (Levinsohn
& Petrin, 2003).
Picture 6. TFP_LP Source: Stata Output
As per picture 6, it is found that MNCs are more productive than local companies
and MNC exporters are far more productive than MNCs in general while MNCs that
-
1,00
2,00
3,00
4,00
5,00
6,00
7,00
8,00
9,00
10,00
2011 2012 2013 2014 2015
TFP
Ke
l Pe
rsh
(jt
ru
pia
h)
Lokal Non Eks Non KB FDI Non Eks Non KB Lokal Eks Non KB
FDI Eks Non KB Lokal Eks KB FDI Eks KB

Customs Research and Application Journal Vol. 2 No. 1 2020
15 | P a g e
operate on Bonded Zone is more productive than MNCs that only operate on local
markets but are less productive than MNCs outside of Bonded Zone that export.
Next, we look at the relationship between Marketsharemnc and lnTFP of local companies.
Picture 7. Growth In Ln(TFP) Compared To Marketsharemnc
Source: Stata Output.
From picture 7, it was found that the marketshare of the CNC company had a
positive impact on the LN (TFP) of local companies when it was below 0.5 but after the
above 0.5 market markets had a negative effect.
Tabel 3
Estimation Result
(1) (2) (3) (4) (5)
VARIABLES lnTFP lnTFP lnTFP lnTFP lnTFP
Marketsharemnc 0.85*** 1.06*** 1.04*** 1.03*** 1.03***
(0.10) (0.13) (0.13) (0.13) (0.13)
Marketsharemnc* dummyeksp
-0.40*** -0.44*** -0.44*** -0.44***
(0.12) (0.12) (0.12) (0.12)
Marketsharemnc*dumykb 0.62** 0.61** 0.61**
(0.31) (0.31) (0.31)
dummymnc 0.086* -0.26*** -0.25*** -0.25*** -0.25***
(0.04) (0.04) (0.04) (0.04) (0.04)
dummyeksp 1.03*** 1.03*** 1.03*** 1.03***
(0.03) (0.03) (0.03) (0.03)
dummykb -0.12 -0.12 -0.12
(0.11) (0.11) (0.11)
lndipa 0.36 0.39*
(0.22) (0.23) jlnperluas -0.13
(0.35)
Constant 13.60*** 13.38*** 13.39*** 7.95** 7.63**
(0.1) (0.1) (0.1) (3.32) (3.42)
Observations 11,53 11,53 11,53 11,53 11,53
R-squared 0.18 0.28 0.28 0.28 0.28 standard error value, * p<0,10, ** p<0,05, *** p<0,01.
Source: Stata Output
-
2,00
4,00
6,00
8,00
10,00
12,00
14,00
16,00
18,00
- 0,20 0,40 0,60 0,80 1,00 1,20
ln(T
FP)
Pe
rusa
haa
n L
oka
l
Marketsharemnc

Customs Research and Application Journal Vol. 2 No. 1 2020
16 | P a g e
The estimation results in table 3 show that MNCs are more productive by 0.0868%
than local companies. Then after separating between MNCs that export and those that do
not export, it is found that MNCs that export is more productive. The last is to separate
MNCs in Bonded Zone with MNCs outside Bonded Zone, the results show that MNCs
operating in Bonded Zone are more productive than MNCs that only operate in the local
market, but not more productive than MNCs that export outside Bonded Zone. In
estimating the impact of Marketsharemnc on the productivity of local companies, it was
found that the presence of MNCs on the domestic market had a positive impact on the
productivity of local companies. Where every 1% increase in Marketharemnc impacts
0.85% increase in productivity of local companies. But even though it is more productive,
the externalities between MNCs that do export activities are even lower than MNCs that
do not export. Every 1% increase in Marketshare MNC which exports has a 0.62%
increase in productivity of local companies. This is allegedly due to the technology gap
that is too high so that local companies do not have a positive impact on technology
transfer. (Image 1). While the MNC externalities in the Bonded Zone showed the highest
results, where every 1% increase in Marketshare MNC in the Bonded Zone had a 1.20%
impact.
These findings are following the hypothesis proposed as follows:
a. That MNC in Indonesia is more productive than local companies and has positive
externalities. This is different from the findings of Matthias Arnold & Javorcik
(2009) and completes the research by Suyanto et al., (2009).
b. That MNCs that carry out export activities are more productive than MNCs that do
not export and have greater externalities. These findings are consistent with the
findings of Lu, (2010) and Sharma, (2017).
c. That MNCs carrying out export activities at Bonded Zone is more productive than
MNCs outside Bonded Zone and have greater externalities. This is different from
research conducted by Abraham et al., (2010) in China.
d. The role of the government in providing public goods has a positive impact on
company productivity. Every 1% increase in dipa will increase company productivity
by 0.39%. The addition of roads did not have a significant impact on the company's

Customs Research and Application Journal Vol. 2 No. 1 2020
17 | P a g e
productivity growth. This occurs due to data with values below 1% and above 99%
in the provinces of Papua and North Kalimantan and DKI Jakarta.
All industrial sectors received positive externalities, it was found that the highest
positive externalities were found in the cigarette industry while the lowest external
impacts were on the handicraft industry which could not be classified (Table 3).
Tabel 4
Externalities By Business Field Group
Business Field Group Externalities
Industri rokok 0.862***
Industri pengolahaan minyak 0.502**
Industri Besi Baja 0.243***
Industri pengolahan kayu -0.942***
Industri percetakan -0.815*** Kerajinan YTDL -0.954***
Source: Stata Output
Furthermore, on the impact by province (Table 4), it was found that
the province that received the most positive externalities was Bengkulu province, while
the province with the lowest externality was Papua.
Tabel 5
Externalities By Province
Province Externalities
Bengkulu 1.849***
Jambi 1.584*** Kalimantan Selatan 1.514***
Maluku -0.0110 Nusa Tenggara -1.445**
Papua -1.559* Source: Stata Output
As for Bonded Zone, the data held only includes data on bonded zones in 8
provinces and 14 KLU. Bonded Zone that has the highest positive externality is in the
province of Jakarta, then the one that gives the lowest externality is in the province of
Bali (Table 6). This is alleged because local companies in Jakarta have the lowest
technology gap, so they can easily imitate the technology brought by MNC. While for
Bali is suspected because many MNC's in Bali give stronger competitive impact on local
companies than technology transfer.

Customs Research and Application Journal Vol. 2 No. 1 2020
18 | P a g e
Tabel 6
Externalities MNC In Bonded Zone By Province
Province Name Eksternalitas
DKI Jakarta 1.311***
Sumatera Selatan 1.101***
Jawa Timur 0.225
Bali 0 Source: Stata Output
The impact of externalities by business field group (Table 7), it was found that
MNC gave the highest externality to Bonded Zone MNCs operating in the food
processing sector. This is thought to be because the food market is large enough so that
the impact of competition arising from food MNCs is very low. Then for the lowest
externalities in the handicraft sector (manufacturing medical equipment, music
equipment, etc.), this is alleged because the industry has a very specific technology so
that local companies find it difficult to imitate the technology brought by the MNC.
Tabel 7
Externalities MNC By Business Field Group
Business Field Group Externalities
Industri pengolahan makanan 0
Industri pengolahan Kayu -0.942***
Kerajinan YTDL -0.954*** Source: Stata Output
Finally, on annual growth, although it is found to be positive, the impact of MNC
externalities always decreases every year (table 8). This shows that every year the MNC
that brings high technology is decreasing while the MNC that brings competition is
increasing.
Tabel 8
MNC Externalities By Year
Year Externalities
2012.year 0.0146 2013.year 0.217**
2014.year 0.111
2015.year -0.185* Source: Stata Output

Customs Research and Application Journal Vol. 2 No. 1 2020
19 | P a g e
CONCLUSION AND POLICY RECOMMENDATIONS
This study measures the impact of MNC externalities on the productivity of local
companies. Furthermore, this study also measured the differences in externalities of
MNCs operating in Bonded Zone and those operating outside of Bonded Zone. An
externality is measured by the growth of local company TFP with the market share of
MNC. Estimation results indicate a positive externality on the arrival of MNC on the local
company TFP. But although overall MNCs bring positive externalities to the productivity
of local companies, MNCs operating on Bonded Zone have a greater externality impact
than MNCs that operate outside Bonded Zone.
The results of this study have implications for the determination of government
program policies to attract foreign investment in the form of tax incentives in this case
that Bonded Zone is following its original purpose. Some of the policies that can be taken
from the above research are as follows
1. To ensure MNC continues to increase its productivity, the government can provide
several incentives such as:
a. Tax ease of research and development.
b. Workforce training cooperation between the government and companies.
2. To ensure externalities occur to local companies, the government needs to ensure a
positive relationship exists between MNCs and local companies such as :
a. The difference in tax incentives when an MNC engages in subcontracting with
a local company
b. The difference in stimulus in the use of domestic raw materials is a certain
percentage
Bonded zones are good instruments for governments to attract MNC. The most
important thing is to continue to measure and maintain the intensity of MNC's spillover
and competition effect on local companies. The government needs to map the location of
provinces and industries that experience negative externalities and make appropriate
policies to increase their positive externalities.

Customs Research and Application Journal Vol. 2 No. 1 2020
20 | P a g e
REFERENCES
Abraham, F., Konings, J., & Slootmaekers, V. (2010). FDI spillovers in the Chinese
manufacturing sector. Economics of Transition, 18(1), 143–182.
https://doi.org/10.1111/j.1468-0351.2009.00370.x
Aitken, B., Hanson, G., & Harrison, A. (1997). Spillovers, foreign investment, and
export behavior. Journal of International Economics, 43, 103–132.
https://doi.org/10.1016/S0022-1996(96)01464-X
Aitken, B. J., & Harrison, A. E. (1999). Do domestic firms benefit from a direct foreign
investment? Evidence from Venezuela. American Economic Review, 89(3), 605–
618. https://doi.org/10.1257/aer.89.3.605
Amiti, B. M., & Konings, J. (2016). American Economic Association Trade
Liberalization, Intermediate Inputs, and Productivity : Evidence from Indonesia
Author ( s ): Mary Amiti and Jozef Konings Source : The American Economic
Review, Vol. 97, No . 5 ( Dec ., 2007 ), pp. 1611-1638 Publ, 97(5), 1611–1638.
Blomstrom, M., & Kokko, A. (1998). Multinational Corporations and Spillovers.
Journal of Economic Surveys, 12(3), 247–277. https://doi.org/10.1111/1467-
6419.00056
Caves, R. E. (1974). Multinational Firms, Competition, and Productivity in Host-Country
Markets. Economica Volume 41 Issue 162 1974, 41(162), 176–193.
https://doi.org/10.2307/2553765
Crespo, N., & Fontoura, M. P. (2007). Determinant Factors of FDI Spillovers - What
Do We Know? World Development, 35(3), 410–425.
https://doi.org/10.1016/j.worlddev.2006.04.001
Das, S. (1987). Externalities, and technology transfer through multinational corporations.
Journal of International Economics, 22, 171–182.
De Loecker, J. (2007). Do exports generate higher productivity? Evidence from
Slovenia. Journal of International Economics, 73(1), 69–98.
https://doi.org/10.1016/j.jinteco.2007.03.003
Dunning, J. H. (1988). The theory of international production. The International Trade
Journal, 3(1), 21–66. https://doi.org/10.1080/08853908808523656
Flôres, R. G., Fontoura, M. P., & Santos, R. G. (2007). Foreign direct investment
spillovers in Portugal: Additional lessons from a country study. European Journal
of Development Research, 19(3), 372–390.
https://doi.org/10.1080/09578810701507126
Girma, S., & Gong, Y. (2008). FDI, linkages, and the efficiency of state-owned
enterprises in China. Journal of Development Studies, 44(5), 728–749.
https://doi.org/10.1080/00220380802009233
Girma, S., Kneller, R., & Pisu, M. (2007). Do exporters have anything to learn from
foreign multinationals? European Economic Review, 51(4), 993–1010.
https://doi.org/10.1016/j.euroecorev.2006.07.003
Görg, H., & Greenaway, D. (2004). Much ado about nothing? Do domestic firms benefit
from the foreign direct investment? World Bank Research Observer, 19(2), 171–

Customs Research and Application Journal Vol. 2 No. 1 2020
21 | P a g e
197. https://doi.org/10.1093/wbro/lkh019
Görg, H., Greenaway, D., Keller, W., Yeaple, S., Kim, S., Aitken, B., … Kokko, A.
(2010). FDI Spillovers and Time since Foreign Entry. World Development, 43(1),
62–74. https://doi.org/10.1016/0305-750X(83)90016-5
Halpern, L., Koren, M., & Szeidl, A. (2015). Imported inputs and productivity.
American Economic Review, 105(12), 3660–3703.
https://doi.org/10.1257/aer.20150443
Levinsohn, J., & Petrin, A. (2003). Estimating Production Functions Using Inputs to
Control for Unobservables Estimating Production Functions Using Inputs to Control
for Unobservables. Review of Economic Studies, 70(70), 317–341.
https://doi.org/10.1111/1467-937X.00246
Liu, Z. (2008). Foreign direct investment and technology spillovers: Theory and
evidence. Journal of Development Economics, 85(1–2), 176–193.
https://doi.org/10.1016/j.jdeveco.2006.07.001
Lu, D. (2010). Exceptional Exporter Performance? Evidence from Chinese
Manufacturing Firms. Working Papers. Retrieved from
http://www.gsb.stanford.edu/FACSEMINARS/events/economics/documents/econ_
01_11_Lu.pdf
Madani, D. (1999). A Review of the Role and Impact of Export Processing Zones,
(August). https://doi.org/10.1596/1813-9450-2238
Markusen, J. R., & Trofimenko, N. (2009). Teaching locals new tricks: Foreign experts
as a channel of knowledge transfers. Journal of Development Economics, 88(1),
120–131. https://doi.org/10.1016/j.jdeveco.2008.02.002
Matthias Arnold, J., & Javorcik, B. S. (2009). Gifted kids or pushy parents? Foreign
direct investment and plant productivity in Indonesia. Journal of International
Economics, 79(1), 42–53. https://doi.org/10.1016/j.jinteco.2009.05.004
Mayende, S. (2013). The Effects of Tax Incentives on Firm Performance: Evidence from
Uganda. Journal of Politics and Law, 6(4), 95–107.
https://doi.org/10.5539/jpl.v6n4p95
Sharma, C. (2017). Exporting, access to foreign technology, and firms' performance:
Searching the link in Indian manufacturing. Quarterly Review of Economics and
Finance. https://doi.org/10.1016/j.qref.2017.11.015
Sharma, C., & Mishra, R. K. (2012). Export participation and productivity performance
of firms in the Indian transport manufacturing. Journal of Manufacturing
Technology Management, 23(3), 351–369.
https://doi.org/10.1108/17410381211217416
Sharma, C., & Mishra, R. K. (2015). International trade and performance of firms:
Unraveling export, import, and productivity puzzle. Quarterly Review of Economics
and Finance, 57, 61–74. https://doi.org/10.1016/j.qref.2015.02.001
Sjöholm, F. (1999). Productivity Growth in Indonesia: The Role of Regional
Characteristics and Direct Foreign Investment. Economic Development and Cultural
Change, 47(3), 559–584. https://doi.org/10.1086/452419

Customs Research and Application Journal Vol. 2 No. 1 2020
22 | P a g e
Suyanto, Salim, R. A., & Bloch, H. (2009). Does Foreign Direct Investment Lead to
Productivity Spillovers? Firm-Level Evidence from Indonesia. World Development,
37(12), 1861–1876. https://doi.org/10.1016/j.worlddev.2009.05.009
Waldkirch, A., & Ofosu, A. (2010). Foreign Presence, Spillovers, and Productivity:
Evidence from Ghana. World Development, 38(8), 1114–1126.
https://doi.org/10.1016/j.worlddev.2009.12.020
World Bank. (2019). Global economic risk and implications for Indonesia