extraction and spectrophotometric determination of ... file/volume 16 no 1/16-23-...
TRANSCRIPT

ISSN-1996-918X
Pak. J. Anal. Environ. Chem. Vol. 16, No. 1 (2015) 16 – 23
Extraction and Spectrophotometric Determination of Molybdenum with o-Hydroxythiophenols and
Aromatic Amines
A. Z. Zalov, N. A. Verdizade and A. B. Hadjieva1 Department of Analytical Chemistry, Azerbaijan State Pedagogical University, 34 Gadzhibekova St., Baku 1000, Azerbaijan
Received 16 April 2015, Revised 22 May 2015, Accepted 26 May 2015
-------------------------------------------------------------------------------------------------------------------------------------------- Abstract The interaction of molybdenum (VI) with o-hydroxythiophenol derivatives (HTPDs) and aromatic amines (AAs) was studied. The following three HTPDs, which contain different halogen atoms at position 5, were used: 2-hydroxy-5-chlorothiophenol(HCTP), 2-hydroxy-5-bromothiophenol (HBTP), 2-hydroxy-5-iodothiophenol (HITP)]. The examined AAs were aniline (An), N-methylaniline (mAn) and N,N-dimethylaniline (dAn). The obtained ternary complexes have a composition of 1:2:2 {Mo(V):HBTP:AA}.Optimal conditions for their liquid-liquid extraction (LLE) were found: organic solvent (chloroform), pH (4-6), concentration of the reagents ((1.3-1.5)10–3moldm–3 (HTPD) and (1.2-1.5)10–3moldm–3 (AA)) and extraction time(colour develops almost immediately after the reagents addition). The absorbance of the extracts is stable for at least 48 hours. The optimum shaking time is 10 min.). Under the optimal conditions, the complexes have absorption maxima (max) at 515-538 nm and molar absorptivities (max) between 3.1104dm3mol–1 cm–1. The degrees of extraction were 98.4%. The results suggested that linear relationships exist between the spectral characteristics (max or max) and some fundamental properties of the halogen substituent in the HTPD (atomic mass and electronegativity). The effect of foreign ions on the LLE-spectrophotometric determination of molybdenum was examined and two sensitive, selective and precise procedures for molybdenum determination were proposed. The relative standard deviations for Mo content of (3-5)10–4 % were 4% (HCTP-An procedure) and 3% (HBTP-An procedure). Keywords: Molybdenum(V); Solvent extraction; Ternary complex; Soil analysis; Plant analysis;
Linear relationship -------------------------------------------------------------------------------------------------------------------------------------------- Introduction Molybdenum has been recognized as an essential trace element for plants, animals and humans. In plants, molybdenum has a key function in the fixation of the atmospheric nitrogen [1]. In mammals, it is important for the activity of the enzymes xantine oxidase, sulphite oxidase, and aldehyde oxidase. Beneficial effects of molybdenum on patients with sulphite sensitivity and asthma have been observed. It has also been stated that molybdenum reduces the incidence of
dental caries [2]. On the other hand, molybdenum can be toxic at high concentrations [3,4].In humans, it increases the lability of blood pressure, disturbs the cholesterol transport and causes bone deformation. Effects of acute molybdenum toxicity include diarrhoea, anaemia and gout. Chronic occupational exposure has been associated with weakness, fatigue, lack of appetite, anorexia, joint pain and tremor [2].
*Corresponding Author Email: [email protected]

Pak. J. Anal. Environ. Chem. Vol. 16, No. 1 (2015)
17
Despite its relative rarity in the Earth’s crust (estimated abundance in the range 0.05-40 mg kg–1 with a meanvalueof 1.5 mg kg–1) [5,6], geochemical anomalies leading to molybdenum deficiencies in plants are not common [7,8] and are mostly of concern for leguminous crops. Molybdenum fertilization is often based on visual deficiency symptoms and/or history of crop rotation [8]. However, in order to assess the need for fertilization and the molybdenum dosage it is preferable to use analytical methods [5,6].
Recently, several techniques have been
used for molybdenum determination: UV-Vis spectrophotometry, inductively coupled plasma mass spectrometry (ICP-MS), flame atomic absorption spectrophotometry (FAAS), electrothermal atomic absorption spectrometry (ETAAS), adsorptive anodic stripping voltammetry, and inductively coupled plasma optical emission spectrophotometry (ICP-OES) [9-15]. The methods involving spectrophotometry are rather popular due to their simplicity, inexpensive instrumentation and easy automation. In many cases, they are based on ion-association reaction between heavy organic cations and anionic complexes of Mo(V,VI) with thiocyanate or organic reagents containing hydroxyl groups in ortho-position to each other [15-24].
Sulfur-containing analogues of the
aforementioned catecholic reagents have been in our research interests for a long time because of their analytical potential and possibilities of obtaining new ternary complexes with desired properties [25-29].
In the present paper, we report results from
liquid-liquid extraction-spectrophotometric experiments on 9 different systems, each of which containing Mo(VI), a o-hydroxythiophenol derivative (HTPD) [2-hydroxy-5-chlorothiophenol (HCTP), 2-hydroxy-5-bromothiophenol (HBTP), and 2-hydroxy-5-iodothiophenol (HITP)], and an aromatic amine (AA) [aniline (An), N-methylaniline (mAn), N,N-dimethylaniline (dAn)]. We propose new procedures for determining molybdenum in soils and plants, and show that linear relationships exist between the spectral characteristics of the ternary complexes (absorption maximum and molar absorptivity) and
some fundamental properties of the halogen atom included in the HTPDs (atomic mass and electronegativity).
Materials and Methods Reagents and instrumentation
A stock solution of Mo(VI) (1 dm3) was
prepared by dissolving 1.8402 g of (NH4)6Mo7O24∙4H2O (Sigma-Aldrich, 99.98%) in distilled water. The solution was standardized gravimetrically. Working solutions (0.1 mg cm–3) were prepared daily by appropriate dilution of the stock solution.
HTPDs were synthesized according to the
procedure [30]; their purity was verified by paper chromatography and melting point determination. AAs were products of Sigma-Aldrich (98-99% purity). Chloroform solutions (0.01 moldm–3) of HTPDs and AAs were used.
A masking solution (1 dm3), containing 75
g of citric acid and 150 g of ascorbic acid, was prepared weekly and stored in a refrigerator [31]. A second masking solution was prepared from KI (w=20%).
To create the optimum acidity, 0.1
moldm-3 solutions of HCl or NaOH were used. The absorbance of the extracts was
measured using a KFK-2 photocolorimeter (USSR), a SF-26 spectrophotometer (USSR), and a Camspec M508 spectrophotometer (UK), equipped with 5 and 10 mm path-length cells. pH of aqueous phase was measured using an I-120.2 potentiometer with a glass electrode. Muffle furnace was used for dissolution of the samples. Procedure for determining the optimum conditions
Aliquots of Mo(VI) solution, HTPD
solution (up to 2.5 cm3) and AA solution (up to 2.5 cm3) were transferred in a 50 cm3 calibrated tubewith ground-glass stopper. pH of the aqueous phase was adjusted in the interval 3.5-7.9 by adding a small amount of HCl or NaOH solution. The volume of the aqueous phase was increased with water to 20 cm3 and the volume of the organic
Pak. J. Anal. Environ. Chem. Vol. 16, No. 1 (2015)
18
phase was set to be 5 cm3. The tube was closed with the stopper and shaken for a fixed time (up to 15 min). After separation of the layers, a portion of the organic extract was transferred into a cell and the absorbance was read against organic solvent or simultaneously prepared blank sample. Procedure for molybdenum determination
An aliquot containing molybdenum (no more than 90 g when HTPD=HCTP or 85 g when HTPD=HBTP) was placed in a calibrated tube. Chloroform solutions of HTPD (0.7 cm3) and An (0.7 cm3) were added and the organic phase was adjusted to 5 cm3 with chloroform. The volume and pH of the aqueous phase were adjusted to 20 cm3 and 5.3-5.8, respectively. The tube was closed with a stopper and after 10 minutes of shaking a portion of the organic extract was transferred through a filter paper into a cell. The absorbance was read at max (535 nm when HTPD=HCTP or 530 nm when HTPD=HBTP) against a simultaneously prepared blank sample. The molybdenum content was found from a calibration graph. Soil sample preparation for analysis
A soil sample (15 g) soil sample collected
from depths of 155 cm was subjected to available molybdenum extraction procedure [31, 32] with an oxalate buffer of pH 3.3. Then the procedure [31] was followed: an aliquot of the obtained soil extract (50-100 cm3) was placed in a quartz beaker and evaporated to dryness on a hot plate. For dehydration of the residue and partial sublimation of the oxalates, the beaker was left on the plate for 30 more minutes. The beaker was transferred in a cold muffle furnace. The temperature was raised to 500 °C and held for 1 hour. After cooling 2 cm3 of perchloric acid were added for complete destruction of the organic matter. The content was heated to near dryness on a hot plate and the beaker was placed again in the muffle furnace. The temperature was raised to 500 °C and held for 15-20 minutes. The residue was cooled and then dissolved in 25 cm3 of 14% hydrochloric acid under heating. Masking solutions were added (4 cm3 of the citric acid – ascorbic acid solution and 2 cm3 of the KI solution) and the resulting solution was filtered into a 100-cm3separatory funnel.
Aliquots of thus obtained filtrate were used to determine the molybdenum content.
Plant sample preparation for analysis
10 g of the powdered plant material (seeds of pea) were soaked in 50 cm3 of 96% ethanol for 24 h. The sample was dried and carefully carbonized in a quartz beaker on a hot plate. The beaker was placed into a cold muffle furnace and its temperature was slowly increased (at a rate of 100 °C per hour) up to 450°C. The sample was dry-ashed for 10-15 h. The obtained gray ash was cooled and moistened with a few drops of nitric acid (1:1). Then the ash was heated to dryness on a water bath and placed into the muffle furnace. The temperature was raised to 300°C and held for 30 minutes. This cycle was repeated several times until white ash was obtained. Then, several drops of bidistilled water and 2 cm3 of perchloric acid were added. The beaker was heated on a hot plate until smoking ceased and transferred in a cold muffle furnace. The temperature was raised to 500 °C and held for 15 minutes. After cooling, 25 cm3 of 14% hydrochloric acid were added and the beaker was kept in a boiling water bath for 10-20 min. The obtained solution was quantitatively transferred to a volumetric flask of 50 cm3.31 Masking solutions were added (4 cm3 of the citric acid – ascorbic acid solution and 2 cm3 of the KI solution) and the flask was filled to the mark with bidistilled water. Results and Discussion Studies on the oxidation state of molybdenum
It is known that HTPDs have reducing properties in acidic medium [26,28,33]. Previous investigations with Mo(VI)-HCTP and Mo(V)-HCTP [26] suggested that only Mo(V) forms stable complexes with this reagent. To elucidate the oxidation state of molybdenum in the presence of other HTPDs (HBTP and HITP), we conducted two series of experiments. In the first series we used Mo(VI), while in the second series we used Mo(V) obtained by addition of a supplementary reducing agent (SnCI2 or KI). The comparison of the obtained spectra showed that max Mo(VI)-TPHHD=max Mo(V)-TPHHD. This fact can be regarded as an indication [26,34] that Mo(VI) is reduced to Mo(V) by the reagent itself during the complex formation.
Pak. J. Anal. Environ. Chem. Vol. 16, No. 1 (2015)
19
Charge of the complexes
The charge of the Mo(V)-HTPD binary complexes was determined by electromigration and ion-exchange. Experiments on electromigration in a U-shaped tube and on sorption on EDE-10P anion exchanger demonstrated the anionic nature of the complexes. Under the experimental conditions, these red binary complexes were insoluble in nonpolar organic solvents. However, when AAs were introduced the formation of electroneutral chloroform extractable ternary complexes was observed.
Choice of organic solvent
The following organic solvents were tested
for the extraction of the ternary complexes: chloroform, dichloroethane, carbon tetrachloride, benzene, toluene, diethyl ether and n-butanol. Chloroform was found to be the most effective in terms of degree of extraction (R%) and rapid equilibration. As can be seen from (Table 1), chloroform provides R 98.4%. At that, the nature of AA does not appreciably affect the extraction. Table 1. Characteristics of the extraction-chromogenic systems Mo(V)-HTPD-AA-water-chloroform. Analytical characteristics
Reagents An mAn dAn
HCTP 4.8-6.3 4.5-5.8 4.2-5.3 HBTP 4.4-6.1 4.3-6.0 4.0-5.5
Optimum pH interval
HITP 4.1-5.9 4,1-5.7 3.7-5.5 HCTP 98.4 98.5 98.7 HBTP 98.6 98.6 98.7
Degree of extraction / %
HITP 98.8 98.6 98.5 HCTP 535 537 538 HBTP 530 533 536
max/ nm
HITP 527 530 534 HCTP 3.7 3.9 4.2 HBTP 3.4 3.6 3.8
10–4 / dm3mol–1 cm–1
HITP 3.2 3.3 3.6 HCTP 0.2-18 0.2-19 0.2-20 HBTP 0.2-17 0.2-18 0.2-19
Working range / g cm–3
HITP 0.2-16 0.2-17 0.2-18 Influence of pH
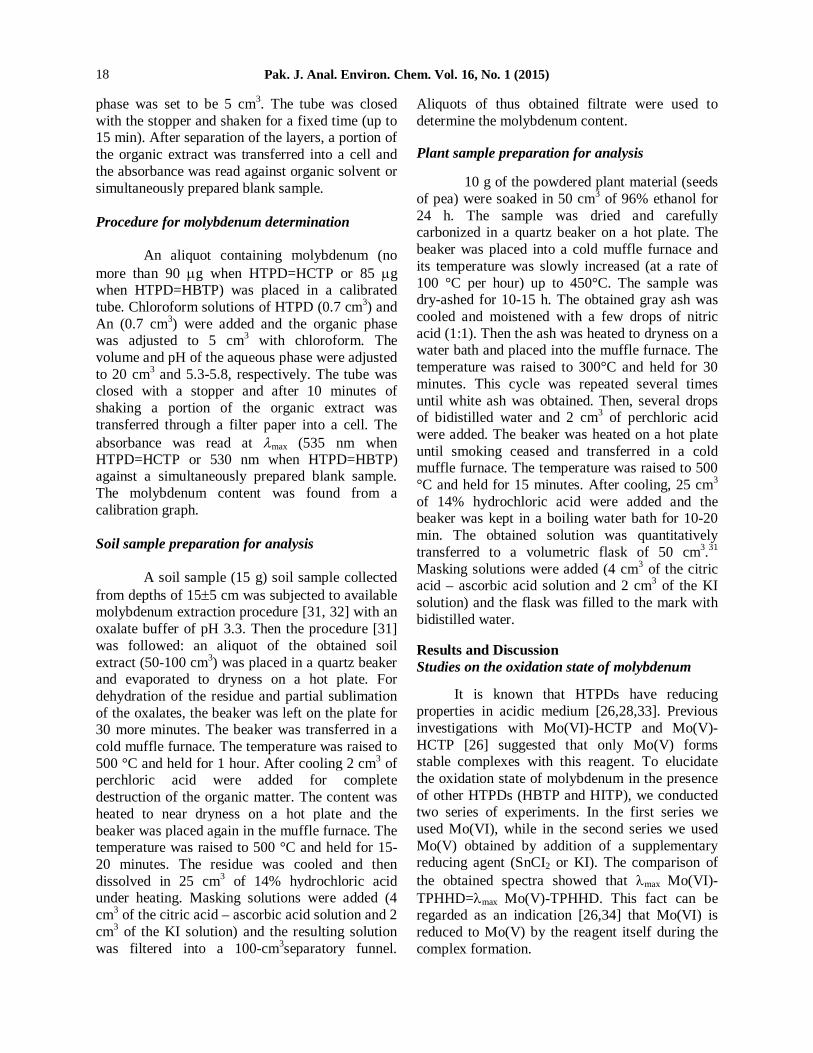
Fig. 1 represents the influence of pH on the
absorbance of the Mo(V)-HTPD-An extracts. The optimum pH ranges are wide enough to ensure
stable and reproducible results without using buffer solutions. The course of all pH curves supports the assumption that only one complex is formed in each of the extraction systems. The optimum pH intervals are listed in (Table-1). At higher pH values, the efficiency of the extraction is impaired, which relates to the lower degree of AA protonation. At lower pH values, the extraction is also impaired most probably due to decrease of the concentration of the anionic HTPDs forms.
Figure 1. Absorbance of the ternary Mo(V)-HTPD-An complexes vs. pH of the aqueous phase. (1) HTPD=HCTP; (2) HTPD=HBTP; (3) HTPD=HITP. cМо(V)=4.1610–5moldm–3, cHTPD =cAn=1.410–3
moldm–3, ℓ= 0.5 sm Absorption maxima, reagents concentrations, molar absorptivities and effect of time
The absorption maxima (max) of the ternary Mo(V)-HTPD-AA complexes lie in the range of 527-538 nm (Table 1). All colour reactions are very contrast since the initial solutions are colourless (max HTPDs = 275-280 nm). Complete extraction is achieved at reagent concentrations not lower than (1.3-1.5)10–3moldm–3 (HTPD) and (1.2-1.5)10–3moldm–3 (AA). Mo(V) concentration ranges in which the Beer’s law is obeyed are listed in (Table 1). The calculated molar absorptivities (max) belong to the interval (3.2-4.2)104 dm3mol–
1 cm–1. Colour develops almost immediately after the reagents addition. The absorbance of the extracts is stable for at least 48 hours. The optimum shaking time is 10 min.

Pak. J. Anal. Environ. Chem. Vol. 16, No. 1 (2015)
20
Stoichiometry of the ternary complexes The molar ratios of the components of the
ternary complexes were established by the equilibrium shift method [35] and the method of Asmus [36] The results show a complex composition of 1:2:2 (Mo(V):HTPD:AA). Using the Nazarenko’s method [37] we found that the molybdenum complexation form is MoO(OH)2+. Hence, the complexes can be regarded as ion associates between doubly charged anionic chelates [MoVO(OH)(HTPD2–)2]2– and two protonated AA species:
(AAH+)2[MoO(OH)(HTPD)2].
Effect of foreign ions and masking reagents
The influence of foreign ions and reagents on the extraction-spectrophotometric determination of molybdenum with HCTP+An and HBTP + Anwas examined in details. It was found that great excesses of alkali, alkali earth, and rare earth cations do not interfere with determination. The same was valid for anions, such as F–, Cl–, Br–, SO3
2–, SO42– and C2O4
2–. Table 2. Influence of foreign ions on the determination of molybdenum (50 g) with HCTPa and An. Foreign ion (FI)
FI-to-Mo ratio
Masking agent
Mo found / g
RSDb / %
Al(III) 100 – 50.0 1.5
Bi(III) 40 – 49.5 4.5
Co(II) 55 – 50.4 4.2
Cr(VI) 70 – 49.6 2.3
Cu(II) 25 KI 50.0 2.1
Fe(III) 50 Ascorbic acid 50.4 4.2
Hg(II) 35 Na2S2O3 49.8 2.4
Nb(V) 45 Oxalic acid 50.2 1.5
Ni(II) 50 Citric acid 50.0 1.5
Ta(V) 45 Ascorbic acid 49.7 2.3
Ti(IV) 20 Ascorbic acid 49.6 2.3
V(IV) 40 – 50.0 1.5
W(VI) 40 Citric acid 50.3 4.2
Zr(IV) 70 – 49.6 2.3
aStatistically undistinguished results were obtained by using HBTP at the mentioned FI-to-Mo ratios bRelative standard deviation based on three determinations
Serious interferences were observed from small amounts (less than 200 g) of Fe(III), Ti(IV), Cu(II), Nb(V), Ta(V), Hg(II) and W(VI). Тhe interfering influence of these ionscan be eliminated by using various masking agents (Table 2). For the sake of convenience, we used only two masking solutions in our further analytical work: 1) ascorbic acid + citric acid solution; and 2) KI solution. Calibration graphs, analytical characteristics and application
Table 3 summarizes the calibration
characteristics obtained with HCTP+An and HBTP+An. The procedures with these reagents were applied to the determination of molybdenum in samples of soil and pea. The accuracy of the results was checked by two independent methods [31]. The results are listed in (Table 4). Table 3. Analytical characteristics for the extraction-chromogenic systems Mo-HCTP-An-water-chloroform and Mo-HBTP-An water-chloroform.
Parameter Mo-HCTP-An
Mo-HBTP-An
Linear calibration range / g cm–3
up to 4.5 up to 4.3
Slope Standard deviation / Aµg–1 cm3
0.3830.004 0.3510.03
Intercept Standard deviation/A
0.0070.011 0.0070.008
Correlation coefficient (9 standards used)
0.9994 0.9997
Limit of detection (LOD) / ng cm–3
15a 12a
Limit of quantification (LOQ) / ng cm–3
50a 40a
Sandell’s sensitivity / ng cm–2 2.61 2.85
aDefined as 3/a (LOD) or 10/a (LOQ), where a is the slope of the calibration plot Table 4. Molybdenum content in soil and pea samples determined by different methods (N=3, P=95%).
Molybdenum content in soil
Molybdenum content in pea
Method
10-4 / %
RSD / %
10-4 / %
RSD / %
HCTP-An method
2.93 4.0 4.95 4.0 Present methods HBTP-An
method 2.86 3.0 5.03 3.0
Dithiol method [31] 2.97 5.0 5.02 5.0
Thiocyanate method [31] 2.96 5.0 5.03 5.0
Pak. J. Anal. Environ. Chem. Vol. 16, No. 1 (2015)
21
Some linear relationships involving the spectral characteristics of the ternary complexes
The nature of the substituents and the
molecular mass of the associating ions are important factors in the chemistry of ion-association [20,38]. Linear relationships have been described between the molecular mass of a particular class of cationic ion-association reagents [20,38] and some parameters, such as constant of association [38], temperature of decomposition [39], constant of extraction and molar absorptivity [40].
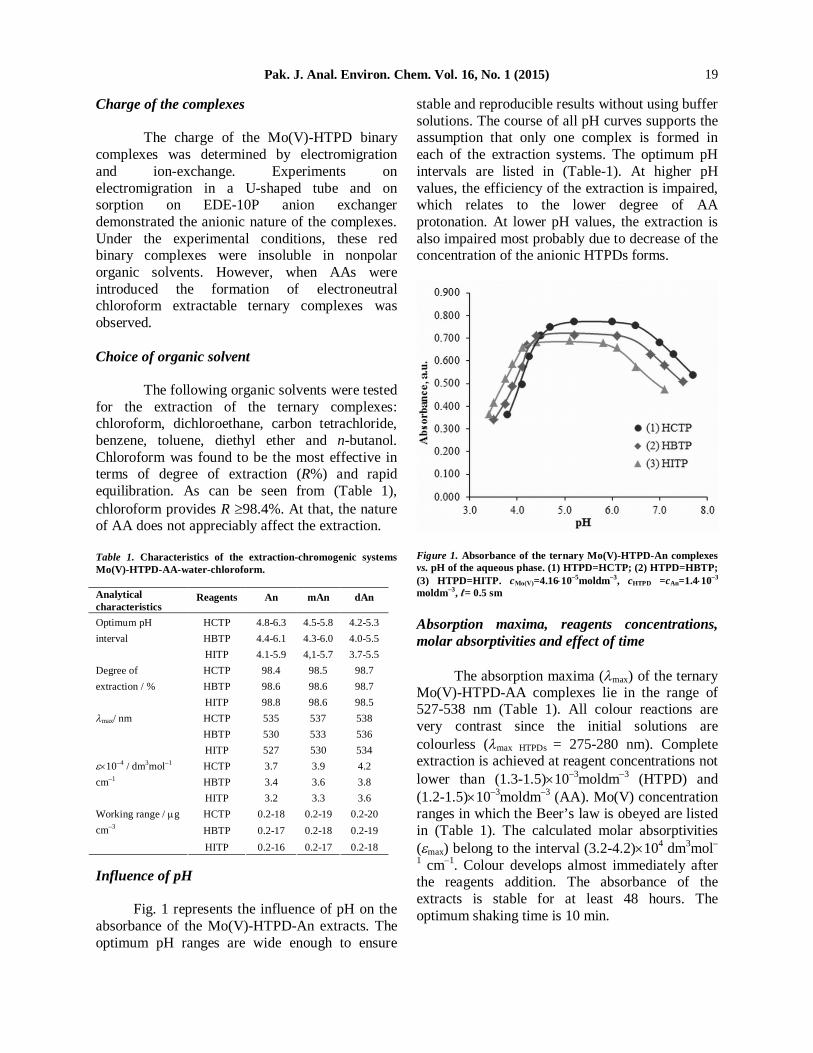
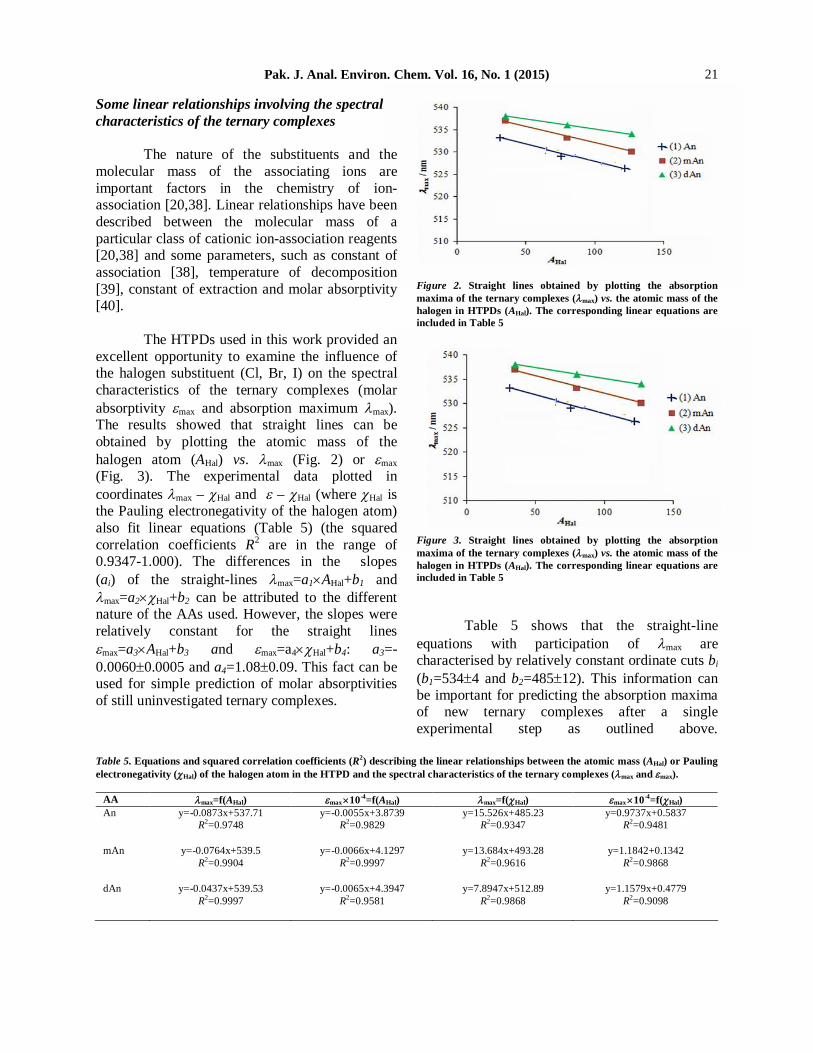
The HTPDs used in this work provided an
excellent opportunity to examine the influence of the halogen substituent (Cl, Br, I) on the spectral characteristics of the ternary complexes (molar absorptivity max and absorption maximum max). The results showed that straight lines can be obtained by plotting the atomic mass of the halogen atom (AHal) vs. max (Fig. 2) or max (Fig. 3). The experimental data plotted in coordinates max – Hal and – Hal (where Hal is the Pauling electronegativity of the halogen atom) also fit linear equations (Table 5) (the squared correlation coefficients R2 are in the range of 0.9347-1.000). The differences in the slopes (ai) of the straight-lines max=a1AHal+b1 and max=a2Hal+b2 can be attributed to the different nature of the AAs used. However, the slopes were relatively constant for the straight lines max=a3AHal+b3 and max=a4Hal+b4: a3=-0.00600.0005 and a4=1.080.09. This fact can be used for simple prediction of molar absorptivities of still uninvestigated ternary complexes.
Figure 2. Straight lines obtained by plotting the absorption maxima of the ternary complexes (max) vs. the atomic mass of the halogen in HTPDs (AHal). The corresponding linear equations are included in Table 5 Figure 3. Straight lines obtained by plotting the absorption maxima of the ternary complexes (max) vs. the atomic mass of the halogen in HTPDs (AHal). The corresponding linear equations are included in Table 5
Table 5 shows that the straight-line
equations with participation of max are characterised by relatively constant ordinate cuts bi (b1=5344 and b2=48512). This information can be important for predicting the absorption maxima of new ternary complexes after a single experimental step as outlined above.
Table 5. Equations and squared correlation coefficients (R2) describing the linear relationships between the atomic mass (AHal) or Pauling electronegativity (Hal) of the halogen atom in the HTPD and the spectral characteristics of the ternary complexes (max and max).
AA max=f(AHal) max 10-4=f(AHal) max=f(Hal) max 10-4=f(Hal) An y=-0.0873x+537.71
R2=0.9748 y=-0.0055x+3.8739
R2=0.9829 y=15.526x+485.23
R2=0.9347 y=0.9737x+0.5837
R2=0.9481
mAn y=-0.0764x+539.5 R2=0.9904
y=-0.0066x+4.1297 R2=0.9997
y=13.684x+493.28 R2=0.9616
y=1.1842+0.1342 R2=0.9868
dAn y=-0.0437x+539.53 R2=0.9997
y=-0.0065x+4.3947 R2=0.9581
y=7.8947x+512.89 R2=0.9868
y=1.1579x+0.4779 R2=0.9098

Pak. J. Anal. Environ. Chem. Vol. 16, No. 1 (2015)
22
Conclusions
Molybdenum(VI) forms well chloroform-extractable ternary complexes with HTPDs and AAs which can be used liquid-liquid extraction-spectrophotometric determination of molybdenum. The complexes have a composition of 1:2:2 (Mo:HTPD:AA) and can be regarded as ion associates between doubly charged anionic chelates of Mo(V) and protonated AA species: (AAH+)2[MoO(OH)(HTPD)2]. The collected information about the spectral characteristics (absorption maximum max and molar absorptivity max) of the complexes makes it possible to conclude that linear relationships exist between some fundamental properties of the halogen substituent in the HTPD (atomic mass AHal and electronegativity Hal) and max or max: i) The higher the atomic mass, the lower max or max; ii) The higher the electronegativity Hal, the higher the max or max. The established constancy of the slopes or ordinate cuts of the obtained straight-line equations can facilitate the prediction of the mentioned spectral characteristics of new uninvestigated complexes of the same class.
References 1. U. C. Gupta, Molybdenum in Agriculture,
Cambridge University Press, Cambridge, UK, (1997).
2. P. L. Smedley, D. M. Cooper, D. J. Lapworth and E. L. Ander, Molybdenum in British drinking water: a review of sources and occurrence and a reconnaissance survey of concentrations, British Geological Survey Open Report, OR/08/051, (2008).
3. B. Momčilović, Arh. Hig. Rada Toksikol. 50 (1999) 289.
4. M. Anke, M. Seifert, W. Arnhold, S. Anke, and U. Schäfer, Acta Aliment. 39 (2010) 12.
5. A. K. Das, R. Chakraborty, M. L. Cervera and M. de la Guardia, Talanta 71(2007) 987.
6. A. Kabata-Pendias, Trace elements in soils and plants (4th edition), CRC press, Boca Raton, USA, (2011) 190.
7. A. N. Kaiser, K. L. Gridley, J. N. Brady, T. Phillips and S. D. Tyerman, Ann. Bot. 96 (2005) 745.
8. U. C. Gupta and G. M. Hettiarachchi, Boron, Molybdenum, and Selenium, in Soil sampling and methods of analysis (2nd edition), M. R. Carter, E. G. Gregorich (Eds.) Boca Raton, USA, (2007) 99.
9. D. Kostova, J. Anal.Chem. 66 (2011) 384. 10. P. Deng, J. Fei, J. Zhang and Y. Feng, Food
Chem. 124 (2011) 1231. 11. N. Khan, I. S. Jeong, I. M. Hwang, J. S.
Kim, S. H. Choi, E. Y. Nho, J. Y. Choi, B.-M. Kwak, J.-H. Ahn, T. Yoon and K. S. Kim, Food Chem.141 (2013) 3566.
12. R. Gürkan, Ü. Aksoy, H. İ. Ulusoy and M. Akçay, J. Food Compos. Anal. 32 (2013) 74.
13. A. I. Mansouri, D. Afzali and F. Ganjavi, Int. J. Environ. Anal. Chem. 94 (2013) 247.
14. C. Bazán, R. Gil, P. Smichowski and P. Pacheco, Microchem. J. 117(2014) 40.
15. R. Dass, J. K. Kapoor and S. Gambhir, Turk. J. Chem. 38 (2014) 328.
16. H. Filik, E. Tütem and R. Apak, Anal. Chim. Acta 505 (2004) 77.
17. A. Dimitrov, V. Lekova, K. Gavazov, B. Boyanov, Cent. Eur. J. Chem. 3 (2005) 747.
18. K. Pyrzynska, Anal. Chim. Acta 590 (2007) 40.
19. A. Dimitrov, V. Lekova, K. Gavazov and B. Boyanov, J. Anal. Chem. 62 (2007) 122.
20. K. B. Gavazov, A. N. Dimitrov and V. D. Lekova, Russ. Chem. Rev. 76 (2007) 169.
21. M. Kamburova and D. Kostova, Chemija 19 (2008) 13.
22. K. Shrivas, K. Agrawal and N. Harmukh, J. Hazard. Mat.161 (2009) 325.
23. S. Abdessalam, A. M. Nabieva, M. Nabiev and B. Hamada, Azerbaijan J. Chem. 4 (2009) 158.
24. S. Abdessalam, G. G. Ramazanova, Z. O. Gahramanova, A. L. Shabanov and M. Nabiev, Kimya Problemleri 4 (2010) 668.
25. N. Verdizade, T. I. Amrakhov, K. A. Kuliev and A. Z. Zalov, Zh. Anal. Khim. 52 (1997) 1042.
26. N. A. Verdizade, A. Z. Zalov, K. A. Kuliev, T. A. Amrakhov and V. M. Samedova, J. Anal. Chem. 55 (2000) 331.
27. A. Zalov, N. A. Verdizade and U. B. Abaskulieva, Izv. Vyssh.Uchebn. Zaved. Ser. Khim. Khim. Tekhnol. 55 (2012) 23.
28. A. Z. Zalov and N. A. Verdizade, J. Anal. Chem. 68 (2013) 212.
Pak. J. Anal. Environ. Chem. Vol. 16, No. 1 (2015)
23
29. A. Z. Zalov and K. B. Gavazov, Chem. J. 4 (2014) 20.
30. A. M. Kuliev, S. R. Aliev and F. N. Mamedov, M. Movsumzade, Zh. Org. Khim. 12 (1976) 426.
31. V. G. Mineev, Praktikum po agrokhimii (2nd ed.), Izd. Mosk. Gos. Univ., Moskow, Russia, (2001).
32. J. L. Grigg, New Zealand J. Sci. Tech. 34 (1953) 405.
33. A. Z. Zalov and K. B. Gavazov, Nauch. Tr. Plovdiv Univ. Khim. (2014), in press
34. L. Sommer and M. Bartusek, Folia Fac. Sci. Nat. UJEP Brno Chem. 7 (1966) 1.
35. M. I. Bulatov and I. P. Kalinkin, Prakticheskoe rukovodstvo po fotokolorim-etricheskim i spektrofotometricheskim metodam analiza, Khimiya, Leningrad, USSR, (1986).
36. E. Asmus, Fresenius' J. Anal. Chem. 178 (1960) 104.
37. V. A. Nazarenko and E. A. Biryuk, Zh. Anal. Khim. 22 (1967) 57.
38. A. Alexandrov, Z. Simeonova and M. Kamburova, Bulg. Chem. Commun. 23 (1990) 542.
39. K. B. Gavazov, V. Lekova, B. Boyanov and A. Dimitrov, J. Therm. Anal. Cal.96 (2009) 249.
40. K. B. Gavazov, T. S. Stefanova and G. K. Toncheva, J. Advanc. Chem. 10 (2014) 2491.