extraction of lipid and gamma-oryzanol from rice bran
TRANSCRIPT
EXTRACTION OF LIPID AND GAMMA-ORYZANOL
FROM RICE BRAN
Phan Van Man
A Thesis Submitted in Partial Fulfillment of the Requirements for the
Degree of Doctor of Philosophy in Mechanical
and Process System Engineering
Suranaree University of Technology
Academic Year 2018

การสกดัลพิดิและแกมมา-โอไรซานอลจากร าข้าว
นายแฟน แวน แมน
วทิยานิพนธ์นีเ้ป็นส่วนหน่ึงของการศึกษาตามหลกัสูตรปริญญาวศิวกรรมศาสตรดุษฎีบัณฑิต สาขาวชิาวศิวกรรมเคร่ืองกลและระบบกระบวนการ
มหาวทิยาลัยเทคโนโลยสุีรนารี ปีการศึกษา 2561

V
ACKNOWLEDGEMENTS
The thesis could not have been finished without the support of the Suranaree
University of Technology scholarship “Provision of 2016 Postgraduate Scholarships
for Foreign Students”. The author would like to express his sincerest to Suranaree
University of Technology for these financial supports.
The author would like to sincerely thank to his academic supervisors, Assist
Prof. Dr. Tiraporn Junyusen and Assist Prof. Dr. Pansa Liplap, for their encouragement,
guidance, and available advices. Their advices on both researches as well on his career
have been priceless.
A special thanks to all of his committee members Assoc. Prof. Dr. Loc Thai
Nguyen of the School of Environment, Resources and Development (SERD), Asian
Institute of Technology, Assist Prof. Dr. Supakit Sayasoonthorn of the department of
Farm Mechanics, Kasetsart University, Assist Prof. Dr. Tawarat Treeamnuk of the
School of Agricultural Engineering, and Dr. Thanawit Kulrattanarak of the School of
Food Technology, Suranaree University of Technology for their available comments
and suggestions during his proposal and thesis defenses. Thanks are also extended to
Assist Prof. Dr. Payungsak Junyusen, Head of the School of Agricultural Engineering,
for his support during this research.
The author also would like to thank the staffs and instructors at The
Agricultural and Food Engineering School and Center of Scientific and Technological
Equipment for granting access to their HPLC, GC-FID, LC-MS, FE-SEM, and DSC
analytical laboratory and also providing necessary technical advice, chemicals and
VI
consumables required for the analysis work of this research. The author is particularly
grateful to all his lab mates and his friends at Suranaree University of Technology for
their useful help during the study. Appreciation also extended to Miss. Piraporn
Sombutsuwan, Dr. Kornkanok Aryusuk at King Mongkut’s University of Technology
Thonburi, Thailand for their kind help and suggestions.
Last but not least, the author must express his gratitude to his family,
especially his parents for their sacrifices. He wishes to thank his brothers and sisters
for their tremendous encouragement, support, and love during this endeavor.
Phan Van Man
VII
CONTENTS
Page
ABSTRACT (THAI) ................................................................................................... I
ABSTRACT (ENGLISH) ......................................................................................... III
ACKNOWLEDGEMENT .......................................................................................... V
CONTENTS ........................................................................................................... VII
LIST OF TABLES ................................................................................................. XIII
LIST OF FIGURES ............................................................................................. XVII
LIST OF ABBREVIATIONS................................................................................. XXI
CHAPTER
I INTRODUCTION ......................................................................... 1
1.1 Rationale of the study ............................................................. 1
1.2 Research objectives................................................................. 4
1.3 Research hypotheses ............................................................... 4
1.4 Scope and limitation of the study ............................................ 5
1.5 Expected results ...................................................................... 5
1.6 References .............................................................................. 6
II LITERATURE REVIEW ............................................................ 12
2.1 Rice bran and rice bran production ........................................ 12
2.2 Rice and rice bran structure ................................................... 14
2.3 Rice bran oil composition ..................................................... 17
2.4 Rice bran oil processing ........................................................ 21
VIII
CONTENTS (Continued)
Page
2.4.1 Rice bran oil extraction.............................................. 21
2.4.2 Degumming............................................................... 21
2.4.3 Neutralization ............................................................ 22
2.4.4 Bleaching and deodorization...................................... 24
2.5 Rice bran soapstock, extraction and isolation gamma-
from rice bran soapstock ....................................................... 25
2.5.1 Rice bran soapstock compositions ............................. 25
2.5.2 Gamma-oryzanol and biological effects ..................... 26
2.5.3 Extraction, purification and quantification ................. 28
2.6 Ultrasonic and application..................................................... 33
2.7 References ............................................................................ 41
III EFFECT OF ULTRASONICATION AND THERMAL
COOKING PRE-TREATMENTS ON THE RECOVERY
AND QUALITY OF COLD PRESS EXTRACTED RICE
BRAN OIL ................................................................................... 54
3.1 Abstract ................................................................................ 54
3.2 Introduction .......................................................................... 55
3.3 Objectives ............................................................................. 57
3.4 Materials and methods .......................................................... 57
3.4.1 Materials ................................................................... 57
3.4.2 Methods .................................................................... 57
IX
CONTENTS (Continued)
Page
3.4.3 Statistical analysis ..................................................... 60
3.4.4 Experimental site ....................................................... 61
3.5 Results and Discussions ........................................................ 61
3.5.1 Oil recovery .............................................................. 61
3.5.2 Physiochemical properties ......................................... 63
3.5.3 Phytochemical properties ........................................... 69
3.5.4 GC-FID for fatty acid profile ..................................... 70
3.5.5 Microstructural analysis ............................................ 71
3.6 Conclusion ............................................................................ 72
3.7 References ............................................................................ 78
IV RESPONSE SURFACE METHODOLOGY OPTIMIZATION
OF CHEMICAL NEUTRALIZATION PARAMETERS
FOR ENHANCED RICE BRAN OIL RECOVERY
AND QUALITY ........................................................................... 84
4.1 Abstract ................................................................................ 84
4.2 Introduction .......................................................................... 85
4.3 Objectives ............................................................................. 86
4.4 Materials and methods .......................................................... 87
4.4.1 Materials ................................................................... 87
4.4.2 Experimental methods ............................................... 87
4.4.3 Experimental design for neutralization....................... 88

X
CONTENTS (Continued)
Page
4.4.4 Analytical methods .................................................... 90
4.4.5 Statistical analysis ..................................................... 93
4.4.6 Experimental site ....................................................... 94
4.5 Results and Discussions ........................................................ 94
4.5.1 Evaluation of progress for neutralization ................... 94
4.5.2 Effect of neutralization parameters on oil
recovery .................................................................... 99
4.5.3 Effect of neutralization parameters on FFA .............. 100
4.5.4 Effect of neutralization parameters on oryzanol ....... 101
4.5.5 Optimization of neutralization parameters and
model validation ...................................................... 101
4.5.6 Physiochemical properties and fatty acid profile ...... 102
4.6 Conclusion .......................................................................... 104
4.7 References .......................................................................... 111
V OPTIMIZATION OF PROCESS PARAMETERS AND
KINETIC MODEL OF ULTRASOUND ASSISTED
SOLVENT GAMMA-ORYZANOL FROM DRIED RICE
BRAN SOAPSTOCK ................................................................. 118
5.1 Abstract .............................................................................. 118
5.2 Introduction ........................................................................ 119
5.3 Objectives ........................................................................... 122
XI
CONTENTS (Continued)
Page
5.4 Materials and methods ........................................................ 122
5.4.1 Materials ................................................................. 122
5.4.2 Experimental methods ............................................. 122
5.4.3 Analytical methods .................................................. 127
5.5 Results and Discussions ...................................................... 129
5.5.1 Mixed solvent extraction ......................................... 129
5.5.2 Evaluation of regression for gamma- oryzanol
extraction ................................................................ 130
5.5.3 Effect of process variables on gamma-oryzanol
recovery .................................................................. 133
5.5.4 Optimization of the extraction process ..................... 134
5.5.5 Rice bran soapstock microstructure ......................... 135
5.5.6 Kinetic of UASE process ......................................... 138
5.6 Conclusion .......................................................................... 143
5.7 References .......................................................................... 143
VI ISOLATION AND CHARACTERIZATION OF GAMMA-
ORYZANOL ISOLATED FROM DRIED RICE BRAN
OIL SOAPSTOCK .................................................................... 149
6.1 Abstract .............................................................................. 149
6.2 Introduction ........................................................................ 150
6.3 Objectives ........................................................................... 152

XII
CONTENTS (Continued)
Page
6.4 Materials and methods ........................................................ 152
6.4.1 Materials ................................................................. 152
6.4.2 Experimental methods ............................................. 153
6.4.3 Analytical methods .................................................. 154
6.4.4 Other analytical methods ......................................... 156
6.4.5 Statistical analysis ................................................... 156
6.5 Results and Discussions ...................................................... 156
6.5.1 First step crystallization ........................................... 156
6.5.2 Second crystallization .............................................. 159
6.5.3 The physiochemical properties of oryzanol .............. 168
6.6 Conclusion .......................................................................... 169
6.7 References .......................................................................... 175
VII OVERALL CONCLUSION ....................................................... 179
APPENDIX............................................................................................. 183
CURRICULUM VITAE ......................................................................... 186
XIII
LIST OF TABLES
Table Page
2.1 Anthocyanin content from different sources ................................................... 19
2.2 Composition of selected vegetable oils .......................................................... 20
2.3 List of ultrasound assisted extraction studies from the literature on
various food components ............................................................................... 37
2.4 Comparison of traditional and recent extraction techniques............................ 39
3.1 The rice bran oil recovery from different extraction methods and
conditions ...................................................................................................... 66
3.2 Physicochemical properties of the rice bran oils under different
extraction methods and conditions ................................................................. 67
3.3 Color of the rice bran oil under different extraction methods and
conditions ...................................................................................................... 73
3.4 Gamma-oryzanol content of rice bran oils under different extraction
process .......................................................................................................... 74
3.5 Fatty acid compositions (%) of rice bran oils extracted by HE, CE, UCE,
CCE .............................................................................................................. 75
4.1 Experimental levels of the three independent variables .................................. 89
4.2 Experimental and predicted oil recovery (Y1), FFA level (Y2), and gamma-
oryzanol of neutralized rice bran oil (NRBO) (Y3) under variable NaOH
concentrations (°Be, X1), temperature (°C, X2), and time (min, X3)................ 91

XIV
LIST OF TABLES (Continued)
Table Page
4.3a ANOVA results of the response surface quadratic model on the recovery
of neutralized rice bran oil ............................................................................. 66
4.3b ANOVA results of the response surface quadratic model on FFA of
neutralized rice bran oil ................................................................................. 96
4.3c ANOVA results of the response surface quadratic model on gamma-
oryzanol of neutralized rice bran oil ............................................................... 97
4.4 Regression coefficients and p-values for the recovery of neutralized rice
bran oil after backward elimination ................................................................ 97
4.5 Regression coefficients and p-values for FFA in neutralized rice bran oil
after backward elimination ............................................................................ 98
4.6 Regression coefficients and p-values for gamma-oryzanol in neutralized
rice bran oil after backward elimination ......................................................... 98
4.7 Fatty acid profile and physicochemical properties of crude rice bran oil
(CRBO), degummed rice bran oil (DRBO), and neutralized rice bran oil
(NRBO) ....................................................................................................... 106
5.1 Extraction parameters (independent variables) of the face-centered
central composite design (FCCD) ................................................................ 124
5.2 Experimental and predicted gamma-oryzanol recovery under variable
ultrasound powers (X1), extraction temperatures (X2), and sonication
times (X3) .................................................................................................... 126

XV
LIST OF TABLES (Continued)
Table Page
5.3 Effect of ethanol concentration in the MEE on gamma oryzanol
extraction from dried rice bran soapstock ..................................................... 130
5.4 ANOVA results of the response surface quadratic model on gamma-
oryzanol recovery ........................................................................................ 132
5.5 Regression coefficients and p-values for gamma-oryzanol recovery
after backward elimination .......................................................................... 132
5.6 Model validation for maximum gamma-oryzanol recovery given the
optimal UASE condition .............................................................................. 135
5.7 Kinetic parameters of gamma-oryzanol recovery from the DRBS for different
ultrasound powers and extraction temperatures
ultrasound powers and extraction temperatures ............................................ 140
6.1 Effect of solvent mixture composition on gamma-oryzanol recovery ........... 161
6.2 Model validation for maximum gamma-oryzanol recovery given the
optimal UASE condition .............................................................................. 162
6.3 Effect of temperature on gamma-oryzanol recovery on the first
crystallization .............................................................................................. 163
6.4 Effect of process time on gamma-oryzanol recovery in the first
crystallization .............................................................................................. 164
6.5 Effect of temperature process on gamma-oryzanol recovery on the
second crystallization .................................................................................. 166
XVI
LIST OF TABLES (Continued)
Table Page
6.6 Effect of crystallization time on gamma-oryzanol recovery on the
second crystallization .................................................................................. 167
6.7 The properties of gamma-oryzanol standard and gamma-oryzanol
isolated from rice bran soapstock ................................................................. 175

XVII
LIST OF FIGURES
Figure Page
2.1 Comparison of annual world production of rice paddy (a) and rice
bran oil (b) from different countries in 2016 .................................................. 13
2.2 Longitudinal section of the rice grain and distribution and illustration
of starch and non-starch lipids ....................................................................... 16
2.3 Microstructure of the outer layers of rice kernel showing the locations
of lipis (cross-testa layer) and lipid aleuron layer ........................................... 16
2.4 Rice bran oil production: crude oil extraction and refining ............................. 23
2.5 Molecular structures of several oryzanols present in rice bran oil. Each
oryzanol is an ester of ferulic acid (4-hydroxy-3-methoxy cinnamic acid)
with a sterol or triterpenol .............................................................................. 27
2.6 Procedure for gamma-oryzanol isolate from soap rice bran ............................ 31
2.7 Range of sound frequencies ........................................................................... 33
2.8 A sonic horn, or sonotrode, immersed in a liquid for sonication ..................... 34
2.9 Simulated radius time curves at 140 kHz for (a) a dissolving bubble
(initial radius 0.1μm and acoustic pressure 500 kPa), (b) a bubble in
repetitive transient cavitation (initial radius 0.5μm and acoustic
pressure 250 kPa), and (c) a bubble in transient cavitation (initial
radius 5μm and acoustic pressure 500 kPa) .................................................... 34
2.10 The movement of bubbles toward a solid surface acting as a pressure
antinode within an acoustic standing wave pattern ......................................... 36

XVIII
LIST OF FIGURES (Continued)
Figure Page
2.11 The generation free radical by ultrasound ...................................................... 36
3.1 SEM images (1000x) of: (a) native rice bran (RB), (b) HE-treated RB,
(c) ultrasonic pre-treated (2.25 W/g, 10min) RB, (d) ultrasonic pre-
treated (6.75 W/g, 10min) RB, (e) ultrasonic pre-treated (2.25 W/g,
25min) RB, (f) ultrasonic pre-treated (6.75 W/g, 25min) RB, (g)
ultrasonic pre-treated (2.25 W/g, 40min) RB, (h) ultrasonic pre-treated ......... 77
4.1 Response surface plots of interaction between: (A) NaOH concentration
(X1) and temperature (X2); (B) NaOH concentration (X1) and time (X3);
(C) temperature (X2) and time (X3) on the neutralized rice bran oil yield ..... 108
4.2 Response surface plots of interaction between: (A) NaOH concentration
(X1) and temperature (X2); (B) NaOH concentration (X1) and time (X3);
(C) temperature (X2) and time (X3) on the FFA of neutralized rice bran
oil ................................................................................................................ 109
4.3 Response surface plots of interaction between: (A) NaOH concentration
(X1) and temperature (X2); (B) temperature (X2) and time (X3); (C)
NaOH concentration (X1) and time (X3) on the gamma-oryzanol content
of neutralized rice bran oil ........................................................................... 110

XIX
LIST OF FIGURES (Continued)
Figure Page
5.1 The response surface plots of the effects of ultrasound power,
extraction temperature, and sonication time on gamma oryzanol
recovery: (A) fixed sonication time at 15min; (B) extraction
temperature at 45°C; and (C) fixed ultrasound power at 2.5W/g................... 136
5.2 HPLC chromatograms of gamma oryzanol ((1) cycloartenyl ferulate,
(2) 24-methylene cycloartanyl ferulate, (3) campesteryl ferulate, and
(4) β-sitosteryl ferulate): (A) standard and (B) recovered gamma
oryzanol from DRBS ................................................................................... 137
5.3 SEM images of: (A) untreated and (B) UASE treated DRBS ....................... 137
5.4 Gamma oryzanol concentration at a given sonication time (Ct): (A)
extraction temperature at 45°C, (B) ultrasound power at 2.5 W/g ................. 141
5.5 Extraction rate reciprocal (t/Ct) of gamma oryzanol recovery from the
DRBS at different sonication time (t): (A) extraction temperature at 45°C,
(B) ultrasound power at 2.5 W/g .................................................................. 142
6.1 FESEM images and particle size histogram of gamma-oryzanol isolated
from ORF: (A) 0°C, (B) 5°C, (C) 10°C, (D) 15°C, and (E) 20°C ................. 171
6.2 FESEM images and particle size histogram of gamma-oryzanol isolated
from ORF: (A) 1 hour, (B) 6 hours, (C) 10 hours, (D) 15 hours, and (E)
standard ....................................................................................................... 172

XX
LIST OF FIGURES (Continued)
Figure Page
6.3 HPLC chromatogram showing retention times of gamma-oryzanol
analogues at 325nm (A:gamma-oryzanol standard; and B: gamma-
oryzanol isolated from ORF): (a) cycloartenyl ferulate; (b) 24
methylene cycloartanyl ferulate; (c) campesteryl ferulate; (d) β-
sitosteryl ferulate. Numbers on HPLC peaks represent elution times
(min) ........................................................................................................... 173
6.4 MS/MS spectra of gamma-oryzanol isolated: cycloartenyl ferulate
(A), 24-methylenecycloartanyl ferulate (B), campesteryl ferulate (C),
and β-sitosteryl ferulate (D) ......................................................................... 174
LIST OF ABBREVIATIONS
ANOVA = Analysis of variance
AOAC = Association of Official Analytical Chemists
AOCS = American Oil Chemists’ Society
AV = Acid value
CRBO = Crude rice bran oil
DMI = Dry matter intake
DRBS = Dried rice bran soap stock
DSC = Differential scanning calorimetry
EAE = Enzymatic assisted extraction
EE = Either extract
FAME = Fatty acid methyl esters
FAO = Food and Agriculture Organization
FAs = Fatty acids
FCCD = A face-centered composite design
FESEM = Field emission Scanning electron microscope
FFAs = Free fatty acids
g = gram
GC-FID = Gas chromatography-flammable ion detector
GC-MS = Gas chromatography-mass spectrometry
HDL = High-density lipoprotein cholesterol
IPA = Isopropanol
XXI
LIST OF ABBREVIATIONS (continued)
IV = Iodine value
L = Liters
LDL = Low-density lipoprotein cholesterol
LC-MS = Liquid chromatography–mass spectrometry (LC-MS)
LP = Liquid phase
MAE = Microwave assisted extraction
MASE = Microwave-assisted solvent extraction
MEE = Mixture of ethyl acetate and ethanol
mg = Milligram
mL = Milliliters
mmol = Mill mole
ORF = Oryzanol rich fraction
PC = Phosphatidyl-choline
PE = Phosphatidyl-ethanolamine
PEF = Pulsed electric field
PI = Phosphatidyl-inositol
PLE = Pressurized liquid extraction
PP = Phosphorus value
PSD = Particle size distribution
PV = Peroxide value
SE = Soxhlet extraction
SEM = Scanning electron microscope
XXII
LIST OF ABBREVIATIONS (continued)
SFE = Supercritical fluid extraction
SP = Saponification value
SC-CO2 = CO2 supercritical
TLC = Thin layer chromatography
UAE = Ultrasound assisted extraction
RBO = Rice bran oil
RSM = Response surface methodology
CHAPTER I
INTRODUCTION
1.1 Rationale of the study
Rice bran is known as a sub-product from rice milling, mainly used as an
animal feed. Rice bran is a good source and inexpensive, and high essential fatty acids
(FAs) (Rukmini and Raghuram ,1991). The major fatty acid in oil rice bran included
oleic (40-46%), linoleic (30-35%) and palmitic (19-22%), respectively (Luh, 1991;
and Prasad, 2006). They play an important role in our daily diet which give us energy
and help in the absorption of fat-soluble vitamins like A, D, E and K. It is also
required for maintaining a healthy balance between high-density lipoprotein (HDL)
cholesterol and low-density lipoprotein (LDL) cholesterol, and decreasing platelet
aggregation (Sharma and Rukmini, 1986; Ghosh, 2007).
In addition, rice bran oil is evaluated as one of the important edible oil
contained high antioxidant compounds such as gamma-oryzanol, tocopherols, and
tocotrienols. In these components, gamma-oryzanol attracts a lot of researches due to
the strongest antioxidant and exhibited the highest concentration in rice bran (Joshi et
al., 2016; Thanonkaew et al., 2012). Gamma-oryzanol is associated with a decrease in
plasma cholesterol, serum cholesterol, and cholesterol absorption and platelet
aggregation. Gamma-oryzanol has also been used to treat post-hyperlipidemia
syndrome, disorders of menopause and to increase the muscle mass. However,
extraction and refining of crude rice bran oil have some special features compared
with other vegetable oils (Ahmad Nayik et al., 2015; De and Patel, 2010), which
2
affected to the oil quality and quantity, especially, the presence of fatty acid profile
and gamma-oryzanol in rice bran.
In extraction, extrusion/pressing and solvent extraction (SE) with pure solvent
a r e two popular conventional production methods of rice bran oil (Carrín and
Crapiste, 2008; Sayasoonthorn et al., 2012). The extrusion/pressing techniques suffer
from low oil extractability although the extracted oil products are of high quality (i.e.,
high oxidative stability, high gamma-oryzanol, and high unsaturated fatty acids) .
Meanwhile, the SE method is time-consuming and requires relatively large quantities
of environmentally-hostile chemical solvents and low quality, despite the
comparatively higher oil extractability. Today, the advanced extraction methods (i.e.,
the supercritical fluid extraction (SFE), microwave-assisted extraction (MAE), pulsed
electric field (PEF) , and enzymatic-assisted extraction (EAE)) have been considered
and possessed several advantages over the conventional extraction methods, including
the short extraction time, low solvent volumes, and high oil extractability (Bjorklund
2000). Nevertheless, these methods still have drawbacks that limit their
commercialization potential include high cost operation (MAE, PEF) (Bjorklund,
2000; Zhang et al., 2008), restricted for food process due to high pressure stresses and
high thermal (PEF) (Kumar et al., 2015), unsuitable for thermally labile compounds
(MAE) (Bjorklund, 2000; Zhang et al., 2011) and lack of knowledge to implement in
industry (EAE) (Bjorklund, 2000; Zhang et al., 2011). To date there exists no research
on the effect of thermal cooking or ultrasonic pre-treatment combined with cold press
extraction on the extractability and quality of rice bran oil.
Rice bran oil refining contained some special features due to crude rice bran
oil contents huge phospholipids, soap, and high free fatty acids (FFAs). Refining rice

3
bran oil can be carried out physically or chemically but the latter being the most
common. Physical refining process requires a good-quality raw material used (De and
Bhattacharyya, 1998) but commercial rice bran contains high free fatty acid (FFA).
Thus, physical refining is unsuitable for rice bran oil refining. The chemical refining
comprises the degumming, neutralization, and deodorization (Gunstone, 2002). Hoed
et al. (2006) reported that chemical neutralization is more effective in reducing the
FFA compared to the physical neutralization. However, this process may affect oil
recovery and phytochemicals such as tocopherols, tocotrienols, and gamma-oryzanol.
In the chemical refining process, soap and waxes can absorb some neutralized lipid
(5-30%), tocotrienols and tocopherols (10-45%) and gamma-oryzanol (93.0 to 94.6%)
(Akiya, 1962; Das et al., 1998; Patel and Naik, 2004).
Rice bran soapstock, a by-product from chemical neutralization, is an
abundant material, which contains high gamma-oryzanol. From the beneficial effects
of gamma-oryzanol on human health, the global interest has been increased in
isolation gamma-oryzanol from rice bran soapstock. Until now, there are no simple
extraction and isolation methods enabling a fast with the high yield and high pure
gamma-oryzanol. Those studies need a lot of steps and contain several tedious steps.
Therefore, this study investigates the effects of ultrasonic and thermal cooking
pre-treatments combined with cold press extraction on the recovery and quality
(oxidative stability, gamma-oryzanol, and unsaturated fatty acids) of rice bran oil. The
optimization conditions of chemical neutralization were conducted to increase oil
recovery and preserve high refined rice bran oil quality. Additionally, isolation
gamma-oryzanol from rice bran soapstock by solvent mixtures under low temperature
was also investigated to replace the advanced technique method.
4
1.2 Research Objectives
1.2.1 To investigate the effects of different extraction methods to recovery
and the quality of rice bran oil (i.e., gamma-oryzanol, FFA, PV, IV, and UFAs)
(Chapter III).
1.2.2 To determine the optimal conditions of chemical neutralization of rice
bran oil by using the response surface methodology (RSM) (Chapter IV).
1.2.3 To evaluate the effects of mixture solvent (ethanol and ethyl acetate)
for extraction gamma-oryzanol rich fraction (ORF) from rice bran soapstock. Finding
the optimal extraction conditions and kinetic extraction for extraction ORF from rice
bran soapstock under ultrasound assisted solvent extraction (Chapter V).
1.2.4 To study the effects of the crystallization conditions (i.e., low
temperature, the ratio of solvent and ORF, and crystallization time) on the recovery
and purity of gamma-oryzanol (Chapter VI).
1.3 Research hypotheses
1.3.1 In the extraction process, ultrasonic and thermal cooking pretreatment
has a strong impact on rice bran tissue and soapstock. Rice bran cell and soapstock
fragmentation dramatically increase surface areas, thus the mass transfer rate of target
compounds increased.
1.3.2 The response surface methodology was a useful statistical method to
evaluate the effect of variable neutralization parameters on the recovery of RBO and
the quality of oil.
1.3.3 Gamma-oryzanol absorbed into soapstock is easy to dissolve in ethyl
acetate and ethanol. Under ultrasound assisted solvent extraction, it may have higher
5
efficiency and greater advantage than the traditional solvent extraction in gamma-
oryzanol.
1.3.4 During gamma-oryzanol crystallization process, the crystallization
parameters such as low temperature, the solvent to samples ratio, and binary solvent
mixture are considered to crystal growth and aggregation of crystals.
1.4 Scope and limitation of this study
1.4.1 Rice bran of jasmine variety from Korat Rice Mill factory in Thailand’s
northeastern province of Nakhon Ratchasima were used in this study. Experiments
were conducted under laboratory.
1.4.2 The cold press machine was used in the lab with low productivity. The
isolation of gamma-oryzanol from soapstock needed more processing stages and toxic
chemicals.
1.5 Expected results
1.5.1 Ultrasonic and thermal pretreatment combined cold press extraction
could increase oil extractability and preserve the quality of crude rice bran oil.
1.5.2 It is estimated the effects of neutralization parameters (i.e., NaOH
solution concentration, process temperature, and process time) to the FFA content and
the oil quality presenting in response surface methodology (RSM) model.
1.5.3 Ultrasound-assisted solvent extraction and kinetic model extraction
could be used to describe the effect of process variables on the ORF extraction from
rice bran soapstock.
1.5.4 The effects of crystallization conditions (i.e., temperature, storage time,
and solvent to solid ratio) to the gamma-oryzanol recovery and purity successfully
6
experimented. By applying the knowledge from present study, the producers can
guarantee the quality gamma-oryzanol powder and the value-added food products.
1.6 References
Ahmad Nayik, G., Majid, I., Gull, A., and Muzaffar, K. (2015). Rice bran oil, the
Future Edible Oil of India: A mini Review. J. Amer. O. Chem. Society. 3(4):
4-6.
Akiya, T. (1962). Components of Unsaponifiable Matter of Rice Bran Oil. Agr. and
Bio. Chem. 26(3): 180-186.
Bjorklund, C. S. E. and E. J. (2000). Analytical-scale microwave-assisted extraction.
J. Chromatogr. A. 902: 227-235.
Carrín, M. E. and Crapiste, G. H. (2008). Mathematical modeling of vegetable oil-
solvent extraction in a multistage horizontal extractor. J. Food Eng. 85(3):
418-425.
Das, P. K., Chaudhuri, A., Kaimal, T. N. B., and Bhalerao, U. T. (1998). Isolation of
gamma-oryzanol through calcium ion induced precipitation of anionic micellar
aggregates. J. Agr. and Food. Chem. 46(8): 3073-3080.
De, B. K., and Bhattacharyya, D. K. (1998). Physical refining of rice bran oil in
relation to degumming and dewaxing. J. Amer. O. Chem. Society. 75(11):
1683-1686.
De, B. K. and Patel, J. (2010). Effect of different degumming processes and some
nontraditional neutralizing agent on refining of RBO. J. Oleo Sci. 59(3): 121-
125.
De, B. K. and Patel, J. D. (2011). Refining of rice bran oil by neutralization with
calcium hydroxide. European J. Lipid Sci. and Technol. 113(9): 1161-1167.
7
Ghosh, M. (2007). Review on recent trends in rice bran oil processing. J. Amer. O.
Chem. Society. 84(4): 315-324.
Gunstone F .D., Harwood H. L., and Dijkstra A.J., (2007). The Lipids handbook.
CRC press, Taylor and Francis group. 181p.
Hoed, V. Van, Depaemelaere, G., Ayala, J. V. V., Santiwattana, P., Verhe, R., and
Greyt, W. De. (2006). Influence of chemical refining on the major and minor
components of rice bran oil. J. Amer. Oil Chem. Society. 83(4): 315-321.
Jegannathan, K. R. and Nielsen, P. H. (2013). Environmental assessment of enzyme
use in industrial production-a literature review. J. Cleaner Prod. 42: 228-240.
Joshi, M., Kaur, R., Kanwar, P., Dhiman, G., Sharma, G., Lata, S., Mishra, T. (2016).
To evaluate antioxidant activity of gamma–oryzanol extracted from rice bran
oil. Int. J. Life Sc. And Pharma. Research. 6(3): 17-25.
Kasim, N. S., Tsai, T. H., Gunawan, S., and Ju, Y. H. (2009). Biodiesel production
from rice bran oil and supercritical methanol. Bio. Technol. 100(8): 2399-
2403.
Kumar, Y., Patel, K. K., and Kumar, V. (2015). Pulsed Electric Field Processing in
Food Technology. J. Eng. Studies and Technical Approach. 1(2): 6-17.
Lerma-García, M. J., Herrero-Martínez, J. M., Simó-Alfonso, E. F., Mendonça, C. R.
B., and Ramis-Ramos, G. (2009). Composition, industrial processing and
applications of rice bran gamma-oryzanol. Food Chem. 115(2): 389-404.
Luh, B. S. (1991). Overview and prospects of rice bran production. In: Rice Production
Volume I. Luh, B. S., and Te-Tzu Chang (eds). Springer Science and Bussines
media, NY. p. 3754-3789
Patel, M., and Naik, S. N. (2004). Gamma-oryzanol from rice bran oil - A review.
8
Food Sci. and Technol. 63(7): 569-578.
Prasad, R. B. N. (2006). Refining of rice bran oil. Springer science. 18: 275-279.
Rukmini, C., and Raghuram, T. C. (1991). Nutritional and biochemical aspects of the
hypolipidemic action of rice bran oil: a review. J. Amer. College of Nutri.
10(6): 593-601.
Sayasoonthorn, S., Kaewrueng, S., and Patharasathapornkul, P. (2012). Rice Bran Oil
Extraction by Screw Press Method: Optimum Operating Settings, Oil
Extraction Level and Press Cake Appearance. Rice science 19(1): 75-78.
Sharma, R. D., and Rukmini, C. (1986). Rice bran oil and hypocholesterolemia in
rats. Lipids. 21(11): 715-717.
Soares, J. F., Dal Prá, V., De Souza, M., Lunelli, F. C., Abaide, E., Da Silva, J. R. F.,
Mazutti, M. A. (2016). Extraction of rice bran oil using supercritical CO2 and
compressed liquefied petroleum gas. Int. Society and Food Eng. 170: 58-63.
Thanonkaew, A., Wongyai, S., McClements, D. J., and Decker, E. A. (2012). Effect
of stabilization of rice bran by domestic heating on mechanical extraction
yield, quality, and antioxidant properties of cold-pressed rice bran oil (Oryza
saltiva L.). Food Sci. and Technol. 48(2): 231-236.
Zbinden, M. D. A., Sturm, B. S. M., Nord, R. D., Carey, W. J., Moore, D., Shinogle,
H., and Stagg-Williams, S. M. (2013). Pulsed electric field (PEF) as an
intensification pretreatment for greener solvent lipid extraction from
microalgae. Biotech. and Bio. 110(6): 1605-1615.
Ahmad Nayik, G., Majid, I., Gull, A., and Muzaffar, K. (2015). Rice bran oil, the
Future Edible Oil of India: A mini Review. J. Amer. O. Chem. Society. 3(4):
4-6.

9
Akiya, T. (1962). Components of Unsaponifiable Matter of Rice Bran Oil. Agr. and
Bio. Chem. 26(3): 180-186.
Bjorklund, C. S. E. and E. J. (2000). Analytical-scale microwave-assisted extraction.
J. Chromatogr. A. 902: 227-235.
Carrín, M. E. and Crapiste, G. H. (2008). Mathematical modeling of vegetable oil-
solvent extraction in a multistage horizontal extractor. J. Food Eng. 85(3):
418-425.
Das, P. K., Chaudhuri, A., Kaimal, T. N. B., and Bhalerao, U. T. (1998). Isolation of
gamma-oryzanol through calcium ion induced precipitation of anionic micellar
aggregates. J. Agr. and Food. Chem. 46(8): 3073-3080.
De, B. K., and Bhattacharyya, D. K. (1998). Physical refining of rice bran oil in
relation to degumming and dewaxing. J. Amer. O. Chem. Society. 75(11):
1683-1686.
De, B. K. and Patel, J. (2010). Effect of different degumming processes and some
nontraditional neutralizing agent on refining of RBO. J. Oleo Sci. 59(3): 121-
125.
De, B. K. and Patel, J. D. (2011). Refining of rice bran oil by neutralization with
calcium hydroxide. European J. Lipid Sci. and Technol. 113(9): 1161-1167.
Ghosh, M. (2007). Review on recent trends in rice bran oil processing. J. Amer. O.
Chem. Society. 84(4): 315-324.
Gunstone F .D., Harwood H. L., and Dijkstra A.J., (2007). The Lipids handbook.
CRC press, Taylor and Francis group. 181p.
Hoed, V. Van, Depaemelaere, G., Ayala, J. V. V., Santiwattana, P., Verhe, R., and
Greyt, W. De. (2006). Influence of chemical refining on the major and minor
10
components of rice bran oil. J. Amer. Oil Chem. Society. 83(4): 315-321.
Jegannathan, K. R. and Nielsen, P. H. (2013). Environmental assessment of enzyme
use in industrial production-a literature review. J. Cleaner Prod. 42: 228-240.
Joshi, M., Kaur, R., Kanwar, P., Dhiman, G., Sharma, G., Lata, S., Mishra, T. (2016).
To evaluate antioxidant activity of gamma–oryzanol extracted from rice bran
oil. Int. J. Life Sc. And Pharma. Research. 6(3): 17-25.
Kasim, N. S., Tsai, T. H., Gunawan, S., and Ju, Y. H. (2009). Biodiesel production
from rice bran oil and supercritical methanol. Bio. Technol. 100(8): 2399-
2403.
Kumar, Y., Patel, K. K., and Kumar, V. (2015). Pulsed Electric Field Processing in
Food Technology. J. Eng. Studies and Technical Approach. 1(2): 6-17.
Lerma-García, M. J., Herrero-Martínez, J. M., Simó-Alfonso, E. F., Mendonça, C. R.
B., and Ramis-Ramos, G. (2009). Composition, industrial processing and
applications of rice bran gamma-oryzanol. Food Chem. 115(2): 389-404.
Luh, B. S. (1991). Overview and prospects of rice bran production. In: Rice Production
Volume I. Luh, B. S., and Te-Tzu Chang (eds). Springer Science and Bussines
media, NY. p. 3754-3789
Patel, M., and Naik, S. N. (2004). Gamma-oryzanol from rice bran oil - A review.
Food Sci. and Technol. 63(7): 569-578.
Prasad, R. B. N. (2006). Refining of rice bran oil. Springer science. 18: 275-279.
Rukmini, C., and Raghuram, T. C. (1991). Nutritional and biochemical aspects of the
hypolipidemic action of rice bran oil: a review. J. Amer. College of Nutri.
10(6): 593-601.
Sayasoonthorn, S., Kaewrueng, S., and Patharasathapornkul, P. (2012). Rice Bran Oil

11
Extraction by Screw Press Method: Optimum Operating Settings, Oil
Extraction Level and Press Cake Appearance. Rice science 19(1): 75-78.
Sharma, R. D., and Rukmini, C. (1986). Rice bran oil and hypocholesterolemia in
rats. Lipids. 21(11): 715-717.
Soares, J. F., Dal Prá, V., De Souza, M., Lunelli, F. C., Abaide, E., Da Silva, J. R. F.,
Mazutti, M. A. (2016). Extraction of rice bran oil using supercritical CO2 and
compressed liquefied petroleum gas. Int. Society and Food Eng. 170: 58-63.
Thanonkaew, A., Wongyai, S., McClements, D. J., and Decker, E. A. (2012). Effect
of stabilization of rice bran by domestic heating on mechanical extraction
yield, quality, and antioxidant properties of cold-pressed rice bran oil (Oryza
saltiva L.). Food Sci. and Technol. 48(2): 231-236.
Zbinden, M. D. A., Sturm, B. S. M., Nord, R. D., Carey, W. J., Moore, D., Shinogle,
H., and Stagg-Williams, S. M. (2013). Pulsed electric field (PEF) as an
intensification pretreatment for greener solvent lipid extraction from
microalgae. Biotech. and Bio. 110(6): 1605-1615.
Zhang, H. F., Yang, X. H., and Wang, Y. (2011). Microwave assisted extraction of
secondary metabolites from plants: Current status and future directions.
Trends in Food Sci. and Technol. 22(12): 672-688.
Zhang, Z. S., Wang, L. J., Li, D., Jiao, S. S., Chen, X. D., and Mao, Z. H. (2008).
Ultrasound-assisted extraction of oil from flaxseed. Seperation and
Purification Technol. 62(1): 192-198.
Zigoneanu, I. G., Williams, L., Xu, Z., and Sabliov, C. M. (2008). Determination of
antioxidant components in rice bran oil extracted by microwave-assisted
method. Bio. Technol. 99(11): 4910-4918.

12
CHAPTER II
LITERATURE REVIEW
2.1 Rice and rice bran production
Rice is the seed of the grass species Oryza sativa (Asian rice) or Oryza
glaberrima (African rice) (Casmir, 2003). Rice is a major cereal crop cultivated
globally, and is one of the staple foods for human consumption, especially in East and
South East Asia, where it supports nearly half of the world population. Rice is one of
five grains that has the highest production in the whole world. The world production
of the rice paddy in 2015-2016 was 631 million metric tons, and 480.7 million tons of
milled rice (FAOSTAT report, 2016). China, India, Indonesia, Bangladesh, Vietnam,
and Thailand are the most representative country, producing approximately 30%, 22%,
8%, 7%, 6%, 4% of the world rice crop in 2016 (Figure 2.1a).
Rice bran, a byproduct from rice milling, constitutes from 8 to 9%wt of rice
bran and rice germ of 1-2%wt (Singh and Sogi, 2016), with a potential global
production of 48 million tons per year (FAO, 2016: http://www.fao.org). In Thailand,
more than 640,000 ton of defatted rice bran is remained as low-value agro waste
(Donporn et al., 2019). Each year, more than 60% of rice bran is sold cheaply as an
animal feed with a low price, and 40% for human food process. Meanwhile, rice bran
constitutes about 12-23% of rice bran oil and large amounts of varying nutraceuticals
(Saunders, 1985; Nayyar, 1985).
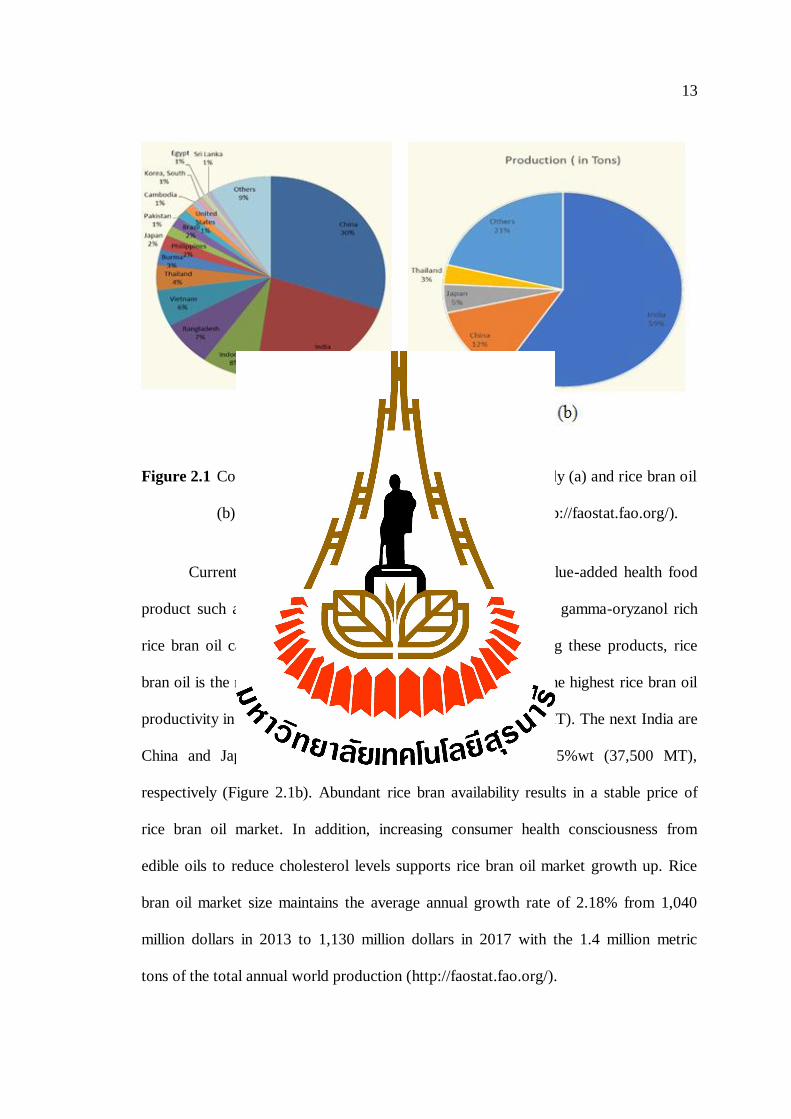
13
Figure 2.1 Comparison of annual world production of rice paddy (a) and rice bran oil
(b) from different countries in 2016 (FAOSTAT: http://faostat.fao.org/).
Currently, there are some markets for rice bran as a value-added health food
product such as rice bran oil product, rice bran oil shortening; gamma-oryzanol rich
rice bran oil capsule tablet or gamma-oryzanol powder. Among these products, rice
bran oil is the most common. India which is the country holds the highest rice bran oil
productivity in the world, nearly 59%wt (820,000 metric tons-MT). The next India are
China and Japan accounted for 12%wt (90,000 MT) and 5%wt (37,500 MT),
respectively (Figure 2.1b). Abundant rice bran availability results in a stable price of
rice bran oil market. In addition, increasing consumer health consciousness from
edible oils to reduce cholesterol levels supports rice bran oil market growth up. Rice
bran oil market size maintains the average annual growth rate of 2.18% from 1,040
million dollars in 2013 to 1,130 million dollars in 2017 with the 1.4 million metric
tons of the total annual world production (http://faostat.fao.org/).

14
Nowadays, ongoing technological innovations along with increasing research
and development (R&D) spending is expected to provide significant opportunities for
gamma oryzanol production. According to Grand View Research, Inc., the
global gamma-oryzanol market demand reached 2.06 billion dollars with 11,520 tons
in 2014 (https://www.grandviewresearch.com) and is expected to reach 18,597.8 tons
by 2022. The product demands are in sports supplements, pharmaceuticals, cosmetics,
and animal feed.
2.2 Rice kernel and rice bran structure
Rice kernel or rice grain (Figure 2.2 and Figure 2.3) is composited of the rice
hull, pericarp, aleurone, germ, and endosperms (Saunders, 1985; Nayyar, 1985). The
hull, which surrounds each whole grain of rice, is generated of cellulose and fibrous
tissues. The hull is to protect the grain during maturation against insect and
microorganism. In rice milling, the hull is removed by friction as the paddy grains pass
between two abrasive surfaces that move at different speeds. Underneath the hulls are
the aleurone layer, germ, and endosperms, which contain valuable nutritional
constituents (i.e., lipids, protein, and some active compounds).
Rice bran included aleurone layer, germ, and some endosperms is the most
abundant but minor product which is produced in the milling rice. Typically, rice
bran contains 15-20% lipid, 12-16% protein, and 34-52% carbohydrate, respectively
(Engelmann et al., 2017; Saunders, 1985; Luh, 1991). These components depend on
the variety, the degree of mature, milling, and storage time (Roy et al., 2011; Luh,
1991). Especially, the high lipid level in raw rice bran makes it susceptible to
oxidation, enhancing to rancidity and an overall deterioration in quality of the rice.

15
The lipid founds in rice bran are caused by two types of deterioration: hydrolytic and
oxidative rancidity (Engelmann et al., 2017; Saunders, 1985).
Lipids in rice bran are divided into two groups involving starch-lipid and non-
starch lipid. Starch-lipid presented in rice bran with a small proportion, whereas, non-
starch lipid predominantly found in organelles called spherosomes, and more widely
as oil bodies (Figure 2.2) (Saunders, 1985). Non-starch lipids are primarily located in
the lipid bodies of rice bran (aleurone layer) and germ (embryo) fractions. The major
compositions of non-starch lipid in rice bran oil are neutral lipids (triacylglycerols),
which comprise 85-90% of body lipids. Triacylglycerols are separated as lipid droplets
because of their hydrophobicity and insolubility in water. These triacylglycerols are
stored in the adipose tissue as lipid droplets and serve as an energy reserve for the
body (Luh et al., 1980; Nantaprapa, 2010).
Oil body has a complex structure and composed of a neutral lipid core
surrounded by a monolayer of phospholipids (PLs), and partially embedded protein.
The major protein surrounding the lipid body is alkaline proteins called oleosins (Tzen
et al., 1993). Oleosins are proteins with low-molecular mass (15-26 kDa), its structure
depending on isoforms and plant species (Mohdaly et al., 2017; Qu et al., 1986).
Oleosins play important roles in biological functions which relate to oil body synthesis
and degradation, act as receptors on the synthesized lipase during germination as well
(Huang, 1996). Oleosins comprise three structural domains including: the first term is
N-terminal domain that consists of 40-60 amino acids; next term is a central
hydrophobic domain flanked by amphipathic N- and C-terminal regions, contents 68-
74 amino acids, and the finally, one serine residue; and an amphipathic C-terminal
domain (33-40 amino acids) (Keddie et al., 1993; Tobergte and Curtis, 2013).

16
Figure 2.2 Longitudinal section of the rice grain and distribution and illustration of
starch and non-starch lipids (Bao, 2012).
Figure 2.3 Microstructure of the outer layers of rice kernel showing the locations of
lipids (cross-testa layer) and lipid aleuron layer (Saunders, 1985).
The single layer of phospholipids (PLs) was esterified with fatty acid via
methyl group linkages (Ye et al., 2016; Liu et al., 2013). Phospholipids (PLs) also
consist of covalently bound phosphate and lipid (storage in the core) which are a major
class of lipid in rice. The major phospholipids in rice bran are phosphatidyl choline
(PC), phosphatidyl ethanolamine (PE), and phosphatidyl inositol (PI) (Liu et al.,
17
2013). Besides, the starch lipids are lipids on the surface of starch granules in
endosperm and are composed mainly of monoacyl lipids. According to Morrison
(1988) the starch lipids represent a relatively small proportion of the total lipids but
they are involved in starch biosynthesis, starch degradation and are likely to affect
starch functionality.
During rice grain development, starch-lipid and non-starch lipid have been
changed (Choudhury and Juliano, 1980; Godber and Juliano, 2004). Non-starch lipids
can be converted to starch lipids through amyloplast membrane, leading to non-starch
lipid reduced in rice bran (Morrison, 1988).
2.3 Rice bran oil composition
The major component of crude rice bran oil is a neutral lipid (Table 2.1). In
comparison with other vegetable oil, crude rice bran oil tends to contain high
phospholipids, unsaponifiable constituents, waxes, and polar lipids (including
glycolipid). Crude rice bran oil differs from other vegetable oils because of its high
levels of non-triglyceride components (mono- and di-glycerides) and free fatty acid
(FFA). High free fatty acid, mono-glycerides, and di-glycerides are associated with
enzymatic hydrolysis (Nantiyakul, 2012). In addition, crude rice bran oil has been
known as high phospholipids (4-5%wt) (Nantiyakul, 2012). The high phospholipids
content in crude rice bran oil is a major problem during processing of the oil.
However, phospholipids can be removed during enzymatic degumming or acid
degumming processes.
The relative amount of unsaponifiable matter in crude rice bran oil is more than
5%wt, including tocopherols (0.04%), tocotrienols (0.07%), gamma-oryzanol (1.0-
2.0%), and other components (2.5-3%). The concentration of unsaponifiable matter
18
depends on various factors such as method extraction (Kumar et al., 2009), rice bran
stabilization (Nantiyakul et al., 2012), and rice growing environment. Gamma-
oryzanol was considered to be an important fraction, along with tocopherols and
tocotrienols in the hypocholesterolemic property of crude rice bran oil. High levels of
gamma-oryzanol, tocopherols, and tocotrienols are important in protection against
oxidation of rice bran oil. This component makes rice bran specialty oil for a niche
market. However, the efficiency and mechanism of antioxidant of the gamma-
oryzanol, tocopherols, and tocotrienols on rice bran oil have not been well reported. In
addition, crude rice bran also is rich in a variety of minerals (phosphorus, calcium,
magnesium, copper, and silicon) and vitamin B (thiamin and niacin) (Huang, 1996;
Nantiyakul, 2012; Kumar, Tiku, and Prakash, 2009). Thiamin and niacin help the body
regulates blood sugar and metabolize carbohydrates, whereas the presence of high
phosphorus, calcium, magnesium, copper, and silicon in crude rice bran affected the
stabilization of rice bran oil.
Table 2.2 compares fatty acid composition of edible rice bran oil to that of
soybean, cottonseed, and peanut oils. It can be seen that unsaturated fatty acids
represent more than 80% of the total fatty acid composition. The fatty acid profile of
edible rice bran oil revealed that the lipid in rice bran contains oleic acid (42%),
linoleic acid (39%), and linolenic acid (1.1%) as unsaturated fatty acids, and palmitic
(15%) and stearic acid (1.5%) as saturated fatty acids (Caskill et al., 1999; Nantiyakul,
2012, CODEX std., 1999). The fatty acid composition of rice bran oil is similar to that
of peanut oil but slightly higher in saturation level than that of soybean oil. The low
linolenic acid content of refined rice bran oil showed that rice bran oil more stable to

19
Table 2.1 Composition of crude rice bran oil (Nantiyakul, 2012).
Components % wt of total oil
1. Saponifiable lipids 95
Neutral lipids 85
Triglycerides 71
Diglycerides 3
Monoglycerides 5
Free fatty acids 2
Waxes 3
Phospholipids 4
Glycolipids 6
2. Unsaponifiable lipids 5.0
Phytosterols 1.8
Campesterol 0.51
Stigmasterol 0.27
β-Sitosterol 0.88
4-Methyl sterols 0.40
Triterpene alcohols 1.2
24-Methylene cycloartanol 0.49
Cycloartenol 0.48
Cycloartanol 0.11
Less polar compounds 0.80
Squalene 0.12
Tocopherols 0.04
Tocotrienols 0.07

20
oxidation than soybean oil. Furthermore, gamma-oryzanol, tocopherols and
tocotrienols in edible rice bran oil are higher than that of peanut oil, cotton, and
soybean. The high gamma-oryzanol, tocopherols, and tocotrienols content in rice bran
oil found more stable oil under deep-fat frying. As Barrera-Arellano et al., 1999 who
documented that gamma-oryzanol, tocopherols, and tocotrienols had a protective
action at high temperature.
Table 2.2 Composition of selected vegetable oils (Caskill et al., 1999; Nantiyakul,
2012, CODEX std., 1999).
Component %
Rice Bran Soybean Cottonseed Peanut
Myristic (14:0) 0.2 0.2 0.80 -
Palmitic (16:0) 15 11 27 8.1
Stearic (18:0) 1.9 3.9 2.0 1.5
Oleic (18:1) 42 23 18 50
Linoleic (18:2) 39 51 50 35
Linolenic (18:3) 1.1 6.8 - -
Arachidic (20:0) 0.5 0.20 0.30 1.1
Behenic (22:0) 0.20 0.10 - 2.1
Tocopherols (ppm) 49-593 9-535 136-674 -
Tocotrienols (ppm) 142-790 ND-103 ND ND
Gamma-oryzanol (%) 1.5-1.8 ND ND ND
* ND- Non-detectable

21
2.4 Rice bran oil processing
2.4.1 Rice bran oil extraction
Today, industrial extraction of rice bran oil is a complex and multistep
process and has some special features compared with other vegetable oils. The rice
bran oil process can be separated into two parts including extraction crude oil and
refining (Figure 2.4). Rice bran is first stabilized to inactivate any lipolytic enzymes
and to facilitate pellet formation. The formation pellet increases solvent penetration
rate or increases the surface area contact between the screw pressing and material in a
mechanical oil expeller press leading to increase oil yield. According to Noppawat et
al. (2015), mechanical pressed rice bran oil extraction resulted below 50% of oil
recovery compared to soxhlet extraction. Meanwhile, hexane is the industrial favorite
for rice bran because of its efficiency (98-99% yield under 4-6 hours extraction) and
availability (Capellini et al., 2017; Proctor and Bowen, 1996).
2.4.2 Degumming
Phospholipids in crude rice bran divided into two groups included non-
hydratable and hydratable gum. It can be removed by adding water or acid phosphoric
into oil, called water or acid degumming. Water degumming is unable to remove non-
hydratable in crude rice bran oil and considerable amounts of neutral oil are lost. By
contrast, phosphoric acid degumming has a significant efficiency in phosphorus
removal but color reaction accelerated, leading to dark-colored refined oil (Rajam et
al., 2005). In addition, approximately 15% of tocopherols and tocotrienols were
removed in the acid degumming process (Ronal and Junsoo Lee., 2004). Thus, the
refined RBO or in preserving its nutritional benefits through an economically viable
process. Another way to remove gum now is by using surface active agents such as
22
sodium oleate, akyl aryl sulfonate (Nash et al., 1984), which had a good efficiency in
reducing phosphorus content in comparison with a conventional method. However,
degummed oil still contains high phosphorus level and its method damaged oil
especially unsaturated fatty acid.
An advanced method for the removal of the hydratable and non-hydratable
phospholipids in crude rice bran oil included enzymatic degumming and super-
degumming was mentioned. In 2007, Gunstone et al. proposed a method of treating
gums by using enzymatic degumming. Phospholipase was used to hydrolyze the ester
bond of the phospholipids at the oil-water interface thereby converting non-hydratable
gums to fully hydratable gums and FFA. Enzymatic degumming using phospholipase
is reported to be successful in reducing the phosphorus content to the level of 5 ppm,
but its economic viability has yet to be established. Nowadays, a super-degumming
method was developed by Unilever, which converted non-hydratable gum into
hydratable form by citric acid for 20 min process. The hydratable gums formed are
allowed to crystallize calcium and magnesium salts, waxes and glycerol. The
phosphorus content in the degummed oil was less than 15 ppm, and these bio-active
compounds (i.e., tocopherols, tocotrienols, and gamma-oryzanol) are stable.
2.4.3 Neutralization
The neutralization stage is aimed at removing the free fatty acids
present in the oil and can be performed via chemical or physical neutralization. In the
physical neutralization, removal of free fatty acids is carried out using a distillation
system, whereas in the chemical neutralization this removal is done by saponification
reactions due to the addition of NaOH solution or KOH solution. In physical
neutralization, the removal of FFA (low volatility fatty acid) requires high temperature
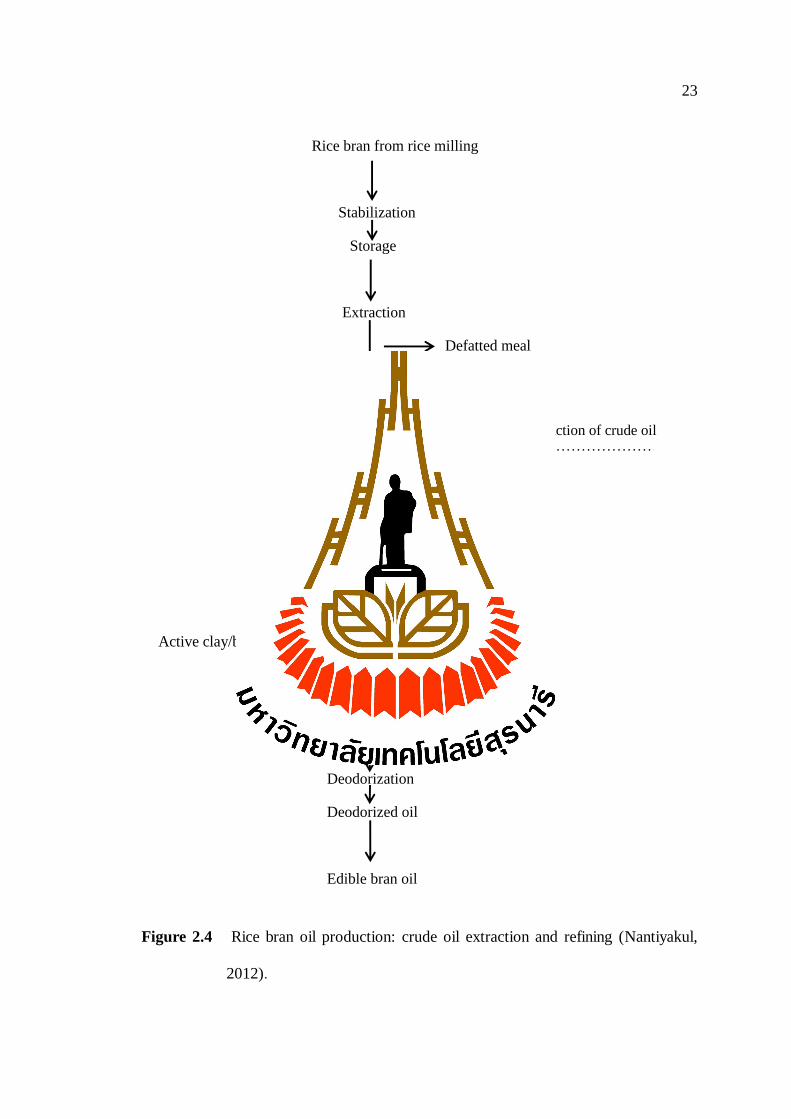
23
Figure 2.4 Rice bran oil production: crude oil extraction and refining (Nantiyakul,
2012).
Extraction of crude oil
Active clay/bleaching earth
Rice bran from rice milling
Stabilization
Storage
Extraction
Defatted meal
Crude rice bran oil
Extraction of crude oil
……………………………………………………………………
Degumming
Degummed oil
Refining
Refined oil
Bleaching
Bleached oil
Winterization
Deodorization
Deodorized oil
Edible bran oil
24
(maximum temperature of 240-250°C), resulting of about 0.1-0.2% FFA content in
neutralized rice bran oil. However, the phosphatides contained higher 15 ppm
(IulianaVintilă, 2009; Antoniassi et al, 1998) and with the presence of iron is the cause
of heat darkening during distillation. In physical neutralization, this process has the
disadvantage of a high cost of implementation at the industrial level and low oxidative
quality of the distillate. Meanwhile, in chemical neutralization, NaOH solution is used
in this procedure to remove FFA and other impurities (i.e., phospholipids,
proteinaceous, and mucilaginous substances).
In chemical neutralization, FFAs are easily removed during the de-acidification
step. Hoed et al. (2006) and Engelmann et al. (2017) reported that chemical
neutralization is more effective in reducing the FFA compared to the physical
neutralization, leading to improving the quality of rice bran oil. However, chemical
neutralization has a major drawback in that it always incurs an oil loss, and nutritional
components are destroyed or removed (Ghosh, 2007). Chemical neutralization
removed 93.0-94.6% gamma-oryzanol, whereas 1.1-1.74% for physical refined
(Akiya, 1962; Das et al., 1998; Patel and Naik, 2004). Tocopherols and tocotrienols
reduced 20-45% of total tocols in the chemical neutralization (Nantiyakul, 2012). In
chemical neutralization, a strong alkalization breaks the ester linkages of sterol or
triterpenol and ferulic (Figure 2.5).
2.4.4 Bleaching and deodorization
Bleaching of rice bran oil is used to remove the pigment chlorophyll,
red pigment content, and metallic salts of fatty acid. Generally, bleaching of rice bran
oil is done after neutralization by using adsorbent (bleaching earth). In the bleaching
process, gum, soap and some oxidations are also absorbed along with pigments

25
(Bahmaei et al., 2005). The bleaching was conducted under high vacuum at a high
temperature of 110-120°C, help to reduce the amounts of oxidation products. At this
temperature decomposes hydro-peroxides and the ion exchange properties of
bleaching earths promote metal removal. Deodorization is to remove the volatile
compounds mainly aldehydes and ketones. A steam distillation process carried out at a
temperature between 200 and 220°C. This step, unfortunately, removes to 60-67% of
tocopherols and tocotrienols (Ko et al., 2008).
2.5 Rice bran soapstock, gamma-oryzanol, extraction and isolation
gamma-oryzanol from rice bran soapstock
2.5.1 Rice bran soapstock compositions
Rice bran soapstock is a byproduct from chemical neutralization
process of rice bran oil production. It is obtained after de-acidification by alkali
treatment of crude rice bran oil. Soapstock consists mainly of water (55-70%wt) and
emulsion of lipids containing water and the dried matter (Gopala Krishna et al., 2001).
Lipid (2-15%) present in soapstock in form of mono-glycerides, diglycerides, and
triglycerides (Narayan et al., 2006). Especially, it was found that triglycerides are
mostly found in soapstock. The amounts of triglycerides in soapstock depend on
process condition in the alkali neutralization step. Triglycerides are soluble in low
polar or non-polar organic solvents (i.e., hexane, isopropanol, chloroform, and ethyl
ether), whereas mono-glycerides and di-glycerides have a lower soluble in these
solvents compared with triglycerides. In addition to lipid loss during neutralization
process, a significant amount of micronutrients especially, gamma-oryzanol is
removed along with soapstock as its sodium salts (15-55g/kg) (Kumar, Tiku, and
Prakash, 2009).
26
Furthermore, rice bran soapstock contents both hydratable and non-hydratable
phospholipid (gums), and their proportion depending on the efficiency of the
degumming step. Waxes and resinous present in rice bran soapstock, consist of two
parts, which are esters of saturated fatty acid and saturated fatty alcohol. In the
neutralization step, waxes and resinous precipitated and formed a stable emulsion in
soapstock. In solvent extraction of gamma-oryzanol from soapstock, gums, waxes and
resinous materials are stable and form micro-emulsion and thereby decrease the rate of
phase separation. These impurities also interfere with gamma-oryzanol by disrupting
crystal growth. Thus, the effect of degumming of rice bran oil is desirable prior to the
alkaline refining step.
2.5.2 Gamma-oryzanol and biological effects of gamma-oryzanol
Gamma-oryzanol is one of the important phytochemicals with high
antioxidant activities as well as other beneficial health properties. Gamma-oryzanol
was the first extracted from rice bran oil to be a single component (Kaneko et al.,
1954). Later it was recognized as a mixture of ferulic acid esterified with phytosterols
or triterpene alcohols, comprises 2% of the crude rice bran oil (Figure 2.5). Gamma-
oryzanol powder is a white or slightly yellow crystalline powder, which is stable at
room temperature. Gamma-oryzanol is soluble in most polar solvents such as acetone,
hexane, chloroform, ethyl acetate, and methylene chloride. It has a melting point in a
range of 110 to 130ºC (Zullaikah, Melwita, and Ju., 2009), and shows the maximum
absorbance of wavelength in 231, 290 and 320nm (Delhi, 2014; Zullaikah, Melwita,
and Ju., 2009).

27
Figure 2.5 Molecular structures of several oryzanols present in rice bran oil. Each
oryzanol is an ester of ferulic acid (4-hydroxy-3-methoxy cinnamic acid)
with a sterol or triterpenol (Bijay Krishna De and Patel, 2011;
Nantiyakul, 2012).
Until now, 10 components of purified gamma-oryzanol were identified by RP-
HPLC with the aid of GC-MS (Nantiyakul, 2012; Xu and Godber, 1999). The main
components of gamma-oryzanol are cycloartenyl ferulate, campesteryl ferulate, and
24-methylenecycloartanyl ferulate that have an important antioxidant activity and help
to reduce plasma cholesterol and low-density lipoprotein (LDL). They occupied more
than 70% of the total weight of gamma-oryzanol (Norton, 1995).
In 1962, gamma-oryzanol was initially introduced in Japan by Oguni et al. for
the treatment of vegetative neurosis. Gamma-oryzanol compounds were marketed for

28
symptoms treatment of gastro-intestinal disorder and sequelae induced by head injury
(Eslami et al., 2014; Tarnagawa et al., 1992). It exhibited several other
pharmacological effects including promotion of skin capillary action (Kamimura et al,
1964) and hyperlipidemia (Tamagawa et al., 1992; Mäkynen et al., 2012). In 1988,
Seethararnaiah and Chandrasekhara studied the effects of gamma-oryzanol in
hypocholesterolemic of rats and found that levels of total free and esterified
cholesterol were significantly reduced in the groups fed gamma-oryzanol as compared
to the control group. Similar results were also reported by Lee et al. (1999) in inhibited
the development of foci of eosinophil-related necrosis. To date, gamma-oryzanol from
rice bran has been popularly marketed as cosmetic, anti-aging supplement, as well as a
sport supplement.
2.5.3 Extraction, purification, and quantification gamma-oryzanol
2.5.3.1 Extraction gamma-oryzanol from rice bran soapstock
Gamma-oryzanol is readily dissolved in non-polar solvent
typically in hexane, chloroform, and heptane. Besides, all components of gamma-
oryzanol contain alcohol group in their ferulate portion, which may also soluble in low
polar solvents such as isopropanol, methanol, ethyl acetate, and acetone. The solvent
strength of extraction may affect the extractability of gamma-oryzanol from rice bran
soapstock. Hexane, petroleum ether, methanol, and dichloromethane are recommended
for gamma-oryzanol extraction from rice bran but not for soapstock due to emulsion
formation and dissolution of the soapstock (Seetharamaiah and Prabhakar, 1986;
Narayan et al., 2006). In 2009, Kumar et al. investigated the extraction of gamma-
oryzanol from dried rice bran soapstock using different solvents assisted
byconventional extraction (i.e., ethyl acetate, ethyl methyl ketone, acetone, and

29
isopropanol). The authors recognized ethyl acetate was most suited for gamma-
oryzanol extraction with 97-99% yield under 6 hours extraction. In 2010,
Kaewboonnum et al. also successfully extracted gamma-oryzanol from rice bran
soapstock with ethyl acetate in soxhlet apparatus. The gamma-oryzanol extractability
achieved about 99% for 4 hours extraction.
Supercritical fluid extraction (SFE) of gamma-oryzanol has received attention
as an alternative to organic solvent extraction. The work on SFE of rice bran soapstock
has been done mainly with respect to extractability and to scale-up operations, of
various unsaponifiable components in rice bran soapstock such as FFA, triglycerol,
and sterols. In 2010, Jesus et al. investigated the recovery of gamma-oryzanol from
rice bran soapstock, using SFE. The highest recovery rate and yield achieved 31.3%
and 3.2%, respectively at a pressure of 30MPa and temperature of 303K. The
limitation of SFE is that the fluctuations in flow rate and pressure cause variations in
results, and equipment and installation are expensive.
2.5.3.2 Purification gamma-oryzanol
After solvent extraction, gamma-oryzanol rich fraction
contains a large number of various lipids and impurities, besides gamma-oryzanol. In
order to purify gamma-oryzanol from interfering lipids in rice bran, a low-pressure
distillation is applied. In 1954, Tsuchiya and Kaneko detected and crystalized gamma-
oryzanol by using sequence procedure, removed FFA, esterified the fats and removed
the fatty acid ester with low-pressure distillation. Kuroda et al. (1977) used a silica gel
column to obtain the gamma-oryzanol fraction from rice bran oil, and hexane was used
to flush the low-pressure column. Because of low resolution in low pressure silica gel
column, gamma-oryzanol only partially purified and an individual component cannot
30
be isolated. Similar results reported by Van Boven et al. (1997), individual
components of gamma-oryzanol could not be isolated because of low resolution in
low-pressure silica gel column.
In 2006, Narayanet et al isolated gamma-oryzanol from rice bran soapstock,
which was subjected to multiphase fractional crystallization steps. The purity of the
gamma-oryzanol obtained at the end of this crystallization process was higher than
98% with a low yield of 1.9%. Gamma-oryzanol recovered from this process has high
purity but unsatisfied yield. To improve gamma-oryzanol recovery, Zullaikah et al.,
(2010) extracted gamma-oryzanol with ethyl acetate and then crystallized with 2 steps.
In the first step of crystallization, the temperature reached -22ᴼC and the second
crystallization step of -60ᴼC. At the end of the second step, gamma-oryzanol crystals
obtained with purity and recovery of 93-95%. Nevertheless, this method performed at
a very low temperature, it was difficult to apply in a simple cooling device.
In 2016, Joshi et al. conducted extraction and isolation gamma-oryzanol with a
solvent mixture of methanol and acetone, and a cool process was used to form a
crystal of gamma-oryzanol. Under the operation conditions, gamma-oryzanol isolated
with a low purity and a high recovery were 33.5% and 93-95%, respectively. At the
same time, Shimizu et al. mentioned that dissolving soap with ethanol, methanol or
isopropanol then precipitated them in the mass extract with sodium dihydrophosphate
or sodium EDTA. This method had efficiency in extraction gamma-oryzanol from
soap but the low purity (Figure 2.6). Gamma-oryzanol recovered from this has low
purity and unsatisfied in a commercial.

31
Figure 2.6 Procedure for gamma-oryzanol isolate from dried soap rice bran
(Shimizu et al. 2016).
Reverse HPLC or thin layer chromatography (TLC) has been proposed in the
purification of gamma-oryzanol (Narayan et al., 2004; Zullaikah et al., 2009). Thin
layer chromatography (TLC) and high performance liquid chromatography (HPLC)
have been populated in the study of gamma-oryzanol. The gamma-oryzanol purity
(95-99%) is higher than low-pressure chromatography (90-95%). Although
chromatographic method (TLC and HPLC) is an effective method to achieve high
purity and recovery of gamma-oryzanol, it is difficult to recover solvent and scale up.
The preparative scale HPLC and TLC are quite similar to analytical HPLC and TLC,
except the size of the column and capability of mobile phase pump. Therefore, the
preparative scale HPLC and TLC are considered to be a very expensive technique,
difficult to be applicable on large scale, and limited to very high added value products
(Ganetsos and Barker, 1993). Otherwise, preparative HPLC results in a high cost per
product unit.
Soapstock
Solution solvent mixture (recovered and reused)
Extractrion of oryzanol
Oryzanol concentration (20-30 percent) purity

32
2.5.3.3 Identification and quantification
The spectrophotometric technique is a simple, practical and
inexpensive technique in determination gamma-oryzanol (Joshi et al., 2016; Bucci et
al., 2003). However, the results are low accurate because the matrix (sample
components) strongly influenced the absorbance reading.
High-performance liquid chromatography (HPLC) has been applied in
the determination of gamma-oryzanol. Usually, four fractions can be obtained
(Xu and Godber, 1999; Rogers et al., 1993). However, some components of gamma-
oryzanol still were not separated individually. This limits the identification and
quantification of each of the components of gamma-oryzanol. Gamma-oryzanol can be
analyzed via liquid chromatography-mass spectrometry (LC-MS). Various
combinations of solvents have been used as the mobile phase of LC-MS and detection
of the compounds can be done with mass spectrometry in the mass to charge ratio of
charged particles. Due to the high sensitivity and selectivity of mass spectrometry as
compared to UV detector, LC-MS is more commonly used in the analysis of gamma-
oryzanol. However, quantification of individual gamma-oryzanol components remains
as a challenge due to lack of commercially available pure reference standards.
Lately, gas chromatography-mass spectrometry (GC-MS) is a convenient
method that is used to identify the structure of the unknown component. From mass
spectrometry, the information of molecular weight and structure were described. Xu
and Godber, (1999) proposed that gamma-oryzanol have to split into small molecular
(triterpine alcohol and ferulic acid) and esterified to reduce the attractive force.
Gamma-oryzanol was saponified in an alkali solution to break down ester bond. The
triterpine alcohol and ferulic acid were to be derivatized to form volatile trimethylsilyl

33
(TMS) ether derivative, and then it can be identified their structure by mass spectrum.
Using this method, ten components of gamma-oryzanol were identified, and three of
these, cycloartenyl ferulate, 24-methylenecycloartanyl ferulate, and campesteryl
ferulate, were major components of gamma-oryzanol. However, the volatilization
temperature in GC column is above 400ºC, which affected to the gamma-oryzanol
structure.
2.6 Ultrasonic and application
Ultrasound is a sound which is at a frequency beyond the range of human
hearing (>20kHz) (Figure 2.7). Ultrasonic devices use transducers to convert electrical
energy to sound energy. Based on the level of intensity, ultrasonic treatment could of
two types; high intensity (also called power ultrasound) or low intensity. The
ultrasound has been utilized for a variety of applications in the food processing
industry and high-intensity ultrasound has been proven to be the preferred method for
cell disruption and extraction (Piyasena et al., 2003; Zenker et al., 2003).
Figure 2.7 Range of sound frequencies (Mason and Lorimer, 2002).
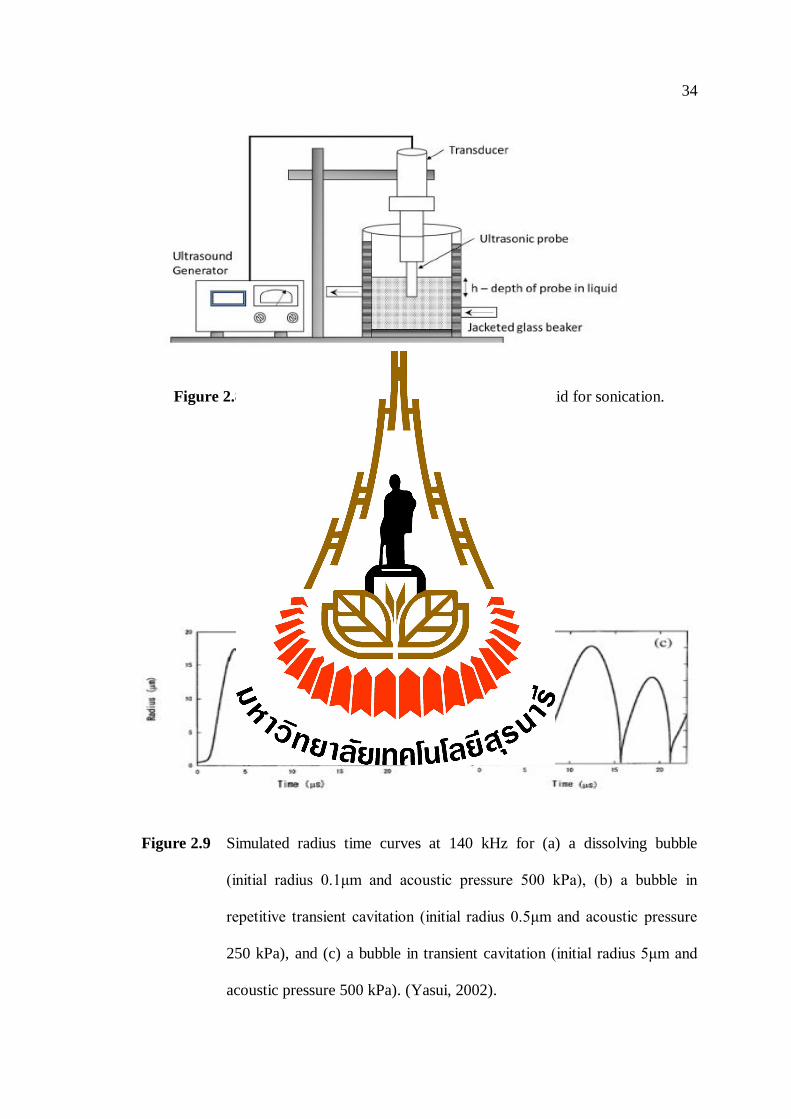
34
Figure 2.8 A sonic horn, or sonotrode, immersed in a liquid for sonication.
Figure 2.9 Simulated radius time curves at 140 kHz for (a) a dissolving bubble
(initial radius 0.1μm and acoustic pressure 500 kPa), (b) a bubble in
repetitive transient cavitation (initial radius 0.5μm and acoustic pressure
250 kPa), and (c) a bubble in transient cavitation (initial radius 5μm and
acoustic pressure 500 kPa). (Yasui, 2002).

35
Ultrasound is transmitted to a fluid typically via a sonic horn, or sonotrode, or
some other form of a sound transducer. The tip of the horn is immersed in the medium
being sonicated (Figure. 2.8) to carry out direct sonication. Direct sonication transfers
sonic energy directly to the fluid being processed and is best for processing slurries of
disrupt cell and extraction.
During sonication, sound waves propagate through a medium by alternating
compression and expansion cycles longitudinally and/or transversely. At the low
pressure, the cavitation microbubbles in the liquid are formed and growth (Figure 2.9).
Under the compression phase, a collapse of cavitation bubbles causes a rapid rise in
local temperature and pressure cavitation bubbles (Hagenson and Doraiswamy, 1998;
Lee et al., 2000; Suslick, 1989; and Zhang et al., 2011). Local temperature and
pressure may rise to 10,000K and 5,000 bar, respectively (Ashokkumar et al., 2008).
The implosion creates a hot spot in the immediate vicinity, where high
temperature and high shear forces work together to bring about the cell disruption of
biological cells in the medium. In addition, shock waves produce acoustic streaming,
or movement of the fluid in the direction of propagation of the sound wave. Acoustic
streaming is caused by the interaction of the sound wave with the molecules of the
fluid. Pressure and heat effects may lead to the generation of free radicals to promote
certain reactions (Kunaver et al., 2010) (Figure 2.12). Suslick and Grinstaff, (1994)
proposed that the superoxide species (HO2•) formed from primary radicals may induce
disulfide cross-linkage between proteins. Similarly, Ashokkumar et al 2008 proposed
that hydroxyl radicals generated during sonication can be used to enhance the degree
of hydroxylation in food materials hence increase the antioxidant activity of foods.
Turbulence enhances mixing and mass transfer at the solid-liquid interface (Figure

36
2.10). Dissipation of acoustic energy may induce motion at the level of molecules,
particularly macromolecules, particles and suspended cells. Erosion of solid material is
promoted.
Figure 2.10 The movement of bubbles toward a solid surface acting as a pressure
antinode within an acoustic standing wave pattern.
Figure 2.11 The generation free radical by ultrasound.
The most common known ultrasound is used in fetal imaging; however, it also
has applications for detecting cancerous growth within the body (Phull and Mason,
1999). Ultrasound in the MHz range is used in the electronics industry to clean
sensitive components such as silicon wafers and disk drive parts without risking the
erosive damage that might occur in the cavitation frequency range. Nowadays, in the
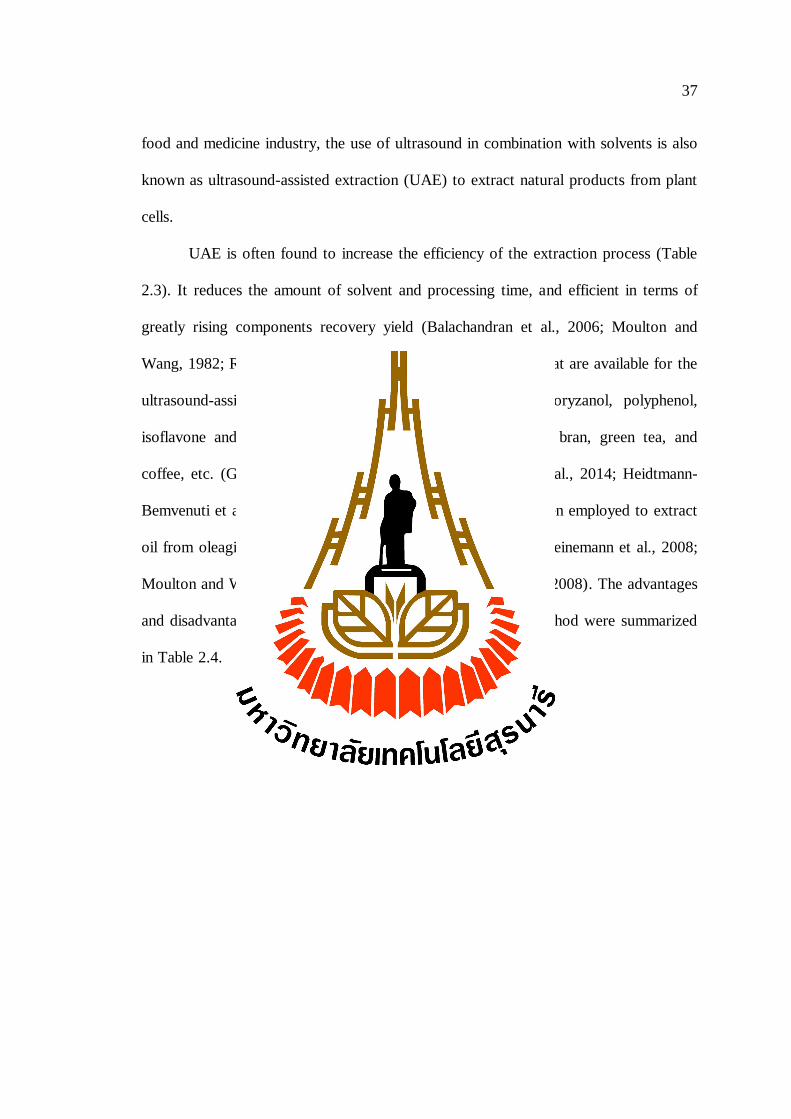
37
food and medicine industry, the use of ultrasound in combination with solvents is also
known as ultrasound-assisted extraction (UAE) to extract natural products from plant
cells.
UAE is often found to increase the efficiency of the extraction process (Table
2.3). It reduces the amount of solvent and processing time, and efficient in terms of
greatly rising components recovery yield (Balachandran et al., 2006; Moulton and
Wang, 1982; Riera et al., 2010). There are numerous reports that are available for the
ultrasound-assisted extraction of nutraceuticals like gamma-oryzanol, polyphenol,
isoflavone and caffeine from different materials such as rice bran, green tea, and
coffee, etc. (Gandhi and Bhatnagar, 2015; Garcia-Noguera et al., 2014; Heidtmann-
Bemvenuti et al., 2012; Pascual et al., 2013). UAE has also been employed to extract
oil from oleaginous crops, soybean, vegetables and seaweed (Heinemann et al., 2008;
Moulton and Wang, 1982; Rostagno et al., 2003; Zhang et al., 2008). The advantages
and disadvantages of UAE compared with other extraction method were summarized
in Table 2.4.
38
Table 2.3 List of ultrasound assisted extraction studies from the literature on various
food components.
1 Riera at al. (2004);
2 Vinatoru et al. (1997);
3 Wu, Lin, and Chau, (2001);
4
Balachandran et al. (2006); 5
Moulton and Wang, (1982); 6
Rostagno et al. (2003); 7
Xia, et al, (2006); 8 Romdhane and Goutine, (2002).
Product Ultrasound Solvent Performance
Olmond oil1
Bath, 20 kHz CO2
supercritical
30% increased yield or
extraction time reduction
Herbal extract2 Stirred bath 20
to 2400 kHz
Water and
ethanol
Up to 34% increased yield
over stirred
Ginseng saponins3 Bath, 38.5 kHz Water, ethanol
and n-butanol
3-fold increase of
extraction rate
Ginger4 Bath CO2
supercritical
30% increased yield or
extraction time reduction
Soy protein5 Continuous, 20
kHz, 3 W per
gram
Alkalize and
Water
52% and 23% increased
yield over equivalent
ultrasonic bath conditions
Soy isoflavones6 Bath, 24 kHz Water and
solvent
Up to 15% increase in
extraction efficiency
Polyphenol, amino
acid, caffeine from
green tea7
Bath, 40 kHz Water Increase yield at 65°C,
compared with 80°C
Pyrethrines from
flower8
Bath, 20 kHz
and 40 kHz
Hexane Increase yield at 40°C,
compared with 66°C

7
Table 2.4 Comparison of traditional and recent extraction techniques.
Microwaves assisted
extraction (MAE)
Microwave-assisted
solvent extraction
(FMASE)
Pressurized liquid
extraction (PLE)
Supercritical fluid
extraction (SFE)
Soxhlet
extraction
(SE)
Ultrasound
assisted
extraction
(UAE)
Advantages
Fast and multiple- extractions
1, 5
Low solvent volumes1
Elevated temperatures1
Low cost2,5
Fast extraction1
Low solvent
volumes1
Low cost2
Fast extraction1
Low solvent volumes1, 5
Elevated temperatures1
No filtration required1
Automatic systems1
Fast extraction1
Minimal solvent
volumes1, 2
Elevated temperatures 1
Automatic systems 1
Concentrated extracts1
Low toxicity2, 5
No filtration1
Simple
method2
Multiple
extractions1, 5
Low cost2, 5
39
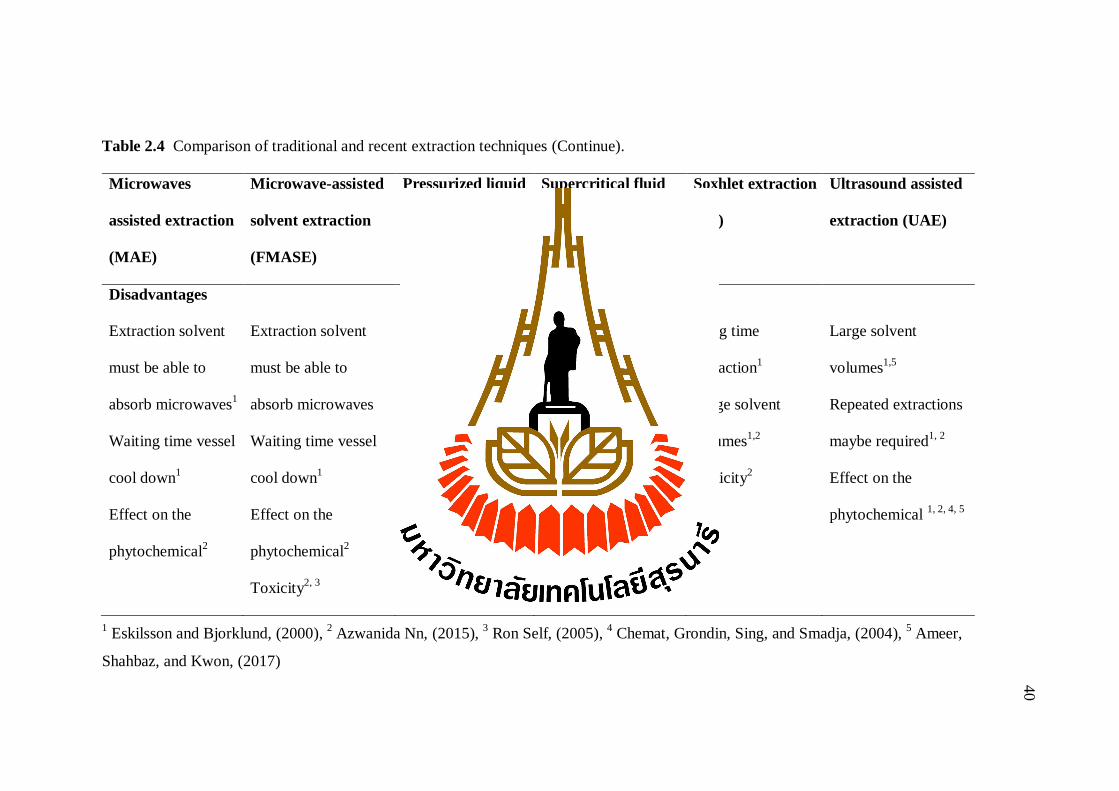
8
Table 2.4 Comparison of traditional and recent extraction techniques (Continue).
Microwaves
assisted extraction
(MAE)
Microwave-assisted
solvent extraction
(FMASE)
Pressurized liquid
extraction (PLE)
Supercritical fluid
extraction (SFE)
Soxhlet extraction
(SE)
Ultrasound assisted
extraction (UAE)
Disadvantages
Extraction solvent
must be able to
absorb microwaves1
Waiting time vessel
cool down1
Effect on the
phytochemical2
Extraction solvent
must be able to
absorb microwaves
Waiting time vessel
cool down1
Effect on the
phytochemical2
Toxicity2, 3
Need clean up step1
Many parameters to
optimize, especially
analyte collection1
High initial cost of
equipment 2, 3
Long time
extraction1
Large solvent
volumes1,2
Toxicity2
Large solvent
volumes1,5
Repeated extractions
maybe required1, 2
Effect on the
phytochemical 1, 2, 4, 5
1 Eskilsson and Bjorklund, (2000),
2 Azwanida Nn, (2015),
3 Ron Self, (2005),
4 Chemat, Grondin, Sing, and Smadja, (2004),
5 Ameer,
Shahbaz, and Kwon, (2017)
40

41
2.7 References
Akiya, T. (1962). Components of Unsaponifiable Matter of Rice Bran Oil. Agri. and
Bio. Chem. 26(3): 180-186.
Amonrat Thanonkaew, Surapote W., David J. M.C, and Eric A.D, (2012). Effect of
stabilization of rice bran by domestic heating on mechanical extraction yield,
quality, and antioxidant properties of cold pressed ricebran oil (Oryza saltiva
L.). Food Sci. and Technol. 48: 231-236.
Ameer, K., Shahbaz, H. M., and Kwon, J. H. (2017). Green Extraction Methods for
Polyphenols from Plant Matrices and Their Byproducts: A Review. Compr.
Reviews in Food Sci. and Food Safety. 16(2): 295-315.
Antoniassi, R., Esteves, W., and De Meirelles, A. J. A. (1998). Pretreatment of corn
oil for physical refining. J. Amer. Oil Chem. Soci. 75(10): 1411-1415.
Ashokkumar, M., Sunartio, D., Kentish, S., Mawson, R., Simons, L., Vilkhu, K., and
Versteeg, C. (2008). Modification of food ingredients by ultrasound to improve
functionality: A preliminary study on a model system. Innov. Food Sci. and
Emer. Technol. 9(2): 155-160.
Bahmaei, M., Sabbaghian, E. S., and Farzadkish, E. (2005). Development of a method
for chlorophyll removal from canola oil using mineral acids. J. Amer. Oil
Chem. Soci. 82(9): 679-684.
Balachandran, S., Kentish, S. E., Mawson, R., and Ashokkumar, M. (2006). Ultrasonic
enhancement of the supercritical extraction from ginger. Ultr. Sonochem. 13
(6): 471-479.
Barrera-Arellano, D., Ruiz-Méndez, V., Márquez Ruiz, G., and Dobarganes, C.
(1999). Loss of tocopherols and formation of degradation compounds in
42
triacylglycerol model systems heated at high temperature. J. Sci. Food and
Agri. 79(13): 1923-1928.
Bucci, R., Magrì, A. D., Magrì, A. L., and Marini, F. (2003). Comparison of three
spectrophotometric methods for the determination of gamma-oryzanol in rice
bran oil. Analy. and Bioanalyt. Chem. 375(8): 1254-1259.
Capellini, M. C., Giacomini, V., Cuevas, M. S., and Rodrigues, C. E. C. (2017). Rice
bran oil extraction using alcoholic solvents: Physicochemical characterization
of oil and protein fraction functionality. Industrial Crops and Products. 103:
133-143.
Casimir C., Akoh, D. B. M. (2003). Food lipid, chemistry, nutrition and
Biotechnology. CRC press. 450p.
Chemat, F., Grondin, I., Sing, A. S. C., and Smadja, J. (2004). Deterioration of edible
oils during food processing by ultrasound. Ultr. Sonochem. 11(1): 13-15.
Choudhury, N. H., and Juliano, B. O. (1980). Effect of amylose content on the lipids
of mature rice grain. Phytochemistry. 19(7): 1385-1389.
Czechowska-Biskup, R., Rokita, B., Lotfy, S., Ulanski, P., and Rosiak, J. M. (2005).
Degradation of chitosan and starch by 360-kHz ultrasound. Carbohydrate
Polymers. 60(2): 175-184.
Das, P. K., Chaudhuri, A., Kaimal, T. N. B., and Bhalerao, U. T. (1998). Isolation of
gamma-oryzanol through Calcium Ion Induced Precipitation of Anionic
Micellar Aggregates. J. Agri. and Food Chem. 46(8): 3073-3080.
De, B. K. and Patel, J. D. (2010). Effect of different degumming processes and some
nontraditional neutralizing agent on refining of RBO. J. Oleo Sci. 59(3): 121-
125.

43
De, B. K., and Patel, J. D. (2011). Refining of rice bran oil by neutralization with
calcium hydroxide. European J. Lipid Sci. and Technol. 113(9): 1161-1167.
Delhi, T. (2014). Gamma-Oryzanol from rice bran oil-A review. Int. Association of
Rice bran Oil. 3(1):1-12.
Domínguez, H., Núñez, M. J., and Lema, J. M. (1994). Enzymatic pretreatment to
enhance oil extraction from fruits and oilseeds: a review. Food Chem. 49(3),
271-286.
Donporn, W., Monthana, W., Somsak T., and Chi, H. (2019). Comparative study on
amount of nutraceuticals in by-products from solvent and cold pressing
methods of rice bran oil processing. J. Food and Drug Analysis. 27(1): 71-82.
Duangkamol R. N, Chitti Th., and Sujitra S. (2016). Pretreatment to increase yield and
antioxidant activity of gamma-oryzanol in rice bran oil. Science Asia. 42(1):
75-82.
Engelmann, J. I., Ramos, L. P., Crexi, V. T., and Morais, M. M. (2017). Degumming
and Neutralization of Rice Bran Oil. J. Food Process Eng. 40(2): 1-10.
Eskilsson, C. S., and Bjorklund, E. (2000). Analytical-scale microwave-assisted
extraction. 902: 227-250.
Eslami, S., Esa, M. N., Marandi, S. M., and Ghasemi, G. Effects of gamma oryzanol
supplementation on anthropometric measurements and muscular strength in
healthy males following chronic resistance training. Indian J Med Res. 139
(6): 857-863.
FAOSTAT, (2016). Comparison of annual world production of rice paddy and rice
bran oil, http://faostat.fao.org.

44
Gandhi, A., and Bhatnagar, N. (2015). Significance of ultrasonic cavitation field
distribution in microcellular foaming of polymers. Cellular Polymers. 34(1):
1-14.
Grand view market, (2016). Gamma-oryzanol market analysis by application (Sports
supplement, cosmetics, pharmaceuticals, animal feed) and segment forecasts to
2022. Grand View Res. 21(5): 1-99.
Garcia-Noguera, J., Oliveira, F. I. P., Weller, C. L., Rodrigues, S., and Fernandes, F.
A. N. (2014). Effect of ultrasonic and osmotic dehydration pre-treatments on
the colour of freeze dried strawberries. J. Food Sci. and Technol. 51(9), 2222-
2227.
Gayas, B. and Kaur, G. (2017). Novel oil extraction methods in food industry : A
review. J. Food Sci. and Technol. 8: 1-11.
Ghosh, M. (2007). Review on recent trends in rice bran oil processing. J. Amer. Oil
Chem. Soci. 84(4): 315-324.
Godber, J. S., and Juliano, B. O. (2004). Rice Lipids. Chem. and Technol. 15(3):
163-190.
Gopala Krishna, A. G., Khatoon, S., Shiela, P. M., Sarmandal, C. V., Indira, T. N., and
Mishra, A. (2001). Effect of refining of crude rice bran oil on the retention of
oryzanol in the refined oil. J. Amer. Oil Chem. Soci. 78(2): 127-131.
Gunstone, F.D. (2011). Occurrence and characterisation of oils and fats. In: Vegetable
Oils in Food Technology. Gunstone, F.D., and Hardwood. J.L., (eds).
Blackwell Publishing, NY. 37-141.
Hagenson, L. C., and Doraiswamy, L. K. (1998). Comparison of the effects of
ultrasound and mechanical agitation on a reacting solid-liquid system.

45
Chemical Engineering Science. 53(1): 131-148.
Hanmoungjai, P., Pyle, D. L., and Niranjan, K. (2001). Enzymatic process for
extracting oil and protein from rice bran. J. Amer. Oil Chem. Soci. 78(8):
817-821.
Heidtmann-Bemvenuti, R., Nora, N. S., and Badiale-Furlong, E. (2012). Extraction of
gamma-oryzanol from rice bran. Ciência E Agrotecnologia. 36(6): 665-673.
Heinemann, R. J. B., Xu, Z., Godber, J. S., and Lanfer-Marquez, U. M. (2008).
Tocopherols, tocotrienols, and gamma-oryzanol contents in Japonica and
Indica subspecies of rice (Oryza sativa L.) cultivated in Brazil. Cereal
Chemistry. 85(2): 243-247.
Hoed, V. Van, Depaemelaere, G., Ayala, J. V. V., Santiwattana, P., Verhe, R., and
Greyt, W. De. (2006). Influence of chemical refining on the major and minor
components of rice bran oil. J. Amer. Oil Chem. Soci. 83(4): 315-321.
Hu, W., Wells, J. H., Shin, T. S., and Godber, J. S. (1996). Comparison of isopropanol
and hexane for extraction of vitamin E and oryzanols from stabilized rice bran.
J. Amer. Oil Chem. Soci. 73(12): 1653-1656.
Huang, H. (1996). Oleosins and oil bodies in seeds and other organs. Plant
Physiology. 110(4): 1055-1061.
Iuliana Vintilă. (2009). Physical-Chemical Mechanism of the Edible Oils Deep
Refining. Sci. Study and Res. 2(5). 179-183.
Jesus, S. P. and Renato Grimaldi, Haiko Hens. (2010). Recovery of gamma-oryzanol
from rice bran oil by-product using supercritical fluid extraction. J. Super.
Fluid. 55: 149-155.

46
Bao, J. (2012). Nutraceutical properties and health benefits of rice
L. Yu, R. Tsao, F. Shahidi (Eds.), Cereals and pulses: Nutraceutical properties
and health benefits, John Wiley & Sons, Inc. 15-250.
Joshi, M., Kaur, R., Kanwar, P., Dhiman, G., Sharma, G., Lata, S., and Mishra, T.
(2016). To evaluate antioxidant activity of gamma-oryzanol extracted from rice
bran oil. Int'. J. Life Sc. and Pharma Research. 6(3): 17-25.
Juliano, P., Temmel, S., Rout, M., Swiergon, P., Mawson, R., and Knoerzer, K.
(2013). Creaming enhancement in a liter scale ultrasonic reactor at selected
transducer configurations and frequencies. Ultr. Sonochem. 20(1): 52-62.
Kaur, N., Chugh, V., and Gupta, A. K. (2012). Essential fatty acids as functional
components of foods- a review. J. Food Sci. and Technol. 51(10): 2289-2303.
Kamimura, M.,Takahashi, S. and Sato, S., (1965). Influence of gamma-oryzanol on
Skin Capillary Circulation. Chemical Abstracts. 62: 57-83.
Ko, S. N., Lee, S. M., and Kim, I. H. (2008). The concentration of tocols from rice
bran oil deodorizer distillate using solvent. European J. Lipid Sci. and
Technol. 110(10): 914-919.
Kumar, R. R., Tiku, P. K., and Prakash, V. (2009). Preferential extractability of γ-
oryzanol from dried soapstock using different solvents. J. Sci. Food and Agr.
89(2): 19-200.
Kumar, S. P. J., Prasad, S. R., Banerjee, R., Agarwal, D. K., Kulkarni, K. S., and
Ramesh, K. V. (2017). Green solvents and technologies for oil extraction from
oilseeds. Chemistry Central Journal. 11(1): 1-7.
Kunaver, M., Medved, S., Čuk, N., Jasiukaityte, E., Poljanšek, I., and Strnad, T.
(2010). Application of liquefied wood as a new particle board adhesive system.
47
Bio. Technol. 101(4): 1361-1368.
Kuriakose S, K. V. (2015). Ultrasound assisted extraction of oil from rice bran: A
response surface methodology approach. J. Food Process. and Technol. 6:
100-121.
Latheef, M. B. (2012). Pulsed ultrasound-assisted solvent extraction of oil from
soybeans and microalgae. ProQuest Dissertations and Theses. 93-102.
Lee, C. G., Seng, C. E., and Liew, K. Y. (2000). Solvent efficiency for oil extraction
from spent bleaching clay. J. Amer. Oil Chem. Soci. 77(11): 1219-1223.
Lee W. J., Lim H. K., Lim J. H., Kim SH, Choi S. H., Lee S. J. (1999). Foci of
eosinophil-related necrosis in the liver: imaging findings and correlation with
eosinophilia. AJR Am J Roentgenol. 72(5): 1255-61.
Li, M., Keddie, J. S., Smith, L. J., Clark, D. C., and Murphy, D. J. (1993). Expression
and characterization of the N-terminal domain of an oleosin protein from
sunflower. J. Bio. Chemi. 268(23): 17504-17512.
Li, Z. J., Yang, F. J., Yang, L., and Zu, Y. G. (2016). Ultrasonic Extraction of oil from
Caesalpinia spinosa (Tara) seeds. J. Chem. 21(1): 1-7.
Liu, L., Waters, D. L. E., Rose, T. J., Bao, J., and King, G. J. (2013). Phospholipids in
rice: Significance in grain quality and health benefits: A review. Food Chem.
139(1-4): 1133-1145.
Luh, B. S. (1991). Overview and prospects of rice bran production. In: Rice Production
Volume I. Luh, B. S., and Te-Tzu Chang (eds). Springer Science and Bussines
media, NY. p. 3754-4
MacLeod. (1960). Lipid metabolism in germanating barley. J. inst.Brew. 67: 182-190.
Mäkynen K, Chitchumroonchokchai C, Adisakwattana S, Failla M, and Ariyapitipun

48
T. Effect of gamma-oryzanol on the bioaccessibility and synthesis of
cholesterol. Eur. Rev Med Pharm. Sci. 16(1): 49-56.
Mason, T. J., and Lorimer, J. P. (2002). Ultrasonic Equipment and Chemical Reactor
Design. Applied Sonochem. 10: 267-293.
Mohdaly, A. A. E., Seliem, K. A. E., and Maher, A. E. (2017). Effect of Refining
Process on the Quality Characteristics of Soybean and Cotton seed Oils. Int. J.
Curr. Microbiol. App. Sci. 6(1): 207-222.
Morrison, W. R. (1988). Lipids in cereal starches: A review. J. Cereal Science. 8(1):
1-15.
Moulton, K. J., and Wang, L. C. (1982). A pilot-plant study of continous ultrasonic
extraction of soybean protein. J. Food Science. 47: 1127-1129.
Nantiyakul, N. (2012). Processing rice bran to yield added-value oil based extracts.
PhD thesis, University of Nottingham. 265p.
Narayan, A. V., Barhate, R. S., and Raghavarao, K. S. M. S. (2006). Extraction and
purification of oryzanol from rice bran oil and rice bran oil soapstock. J.
Amer. Oil Chem. Socie. 83(8): 663-670.
Nash, A. M., Frankel, E. N., and Kwolek, W. F. (1984). Degumming soybean oil from
fresh and damaged beans with surface-active compounds. J. Amer. Oil Chem.
Soci., 61(5): 921-923.
Nin, A. (2015). A Review on the Extraction Methods Use in Medicinal Plants,
Principle, Strength and Limitation. Medicinal and Aromatic Plants. 4(3): 3-8.
Nurul, S. M. D, Dayang, N. A. Z, Kok, S. L., Nozieana K., Yanti, M. M. S., Ida, I. M.
(2018). Crude oil yield and properties of rice bran oil from different varieties as
affected by extraction conditions using Soxhterm method. Arabian J. Sci. and
49
Eng. 43: 6237-6244.
Noppawat, P., Chaiyavat, C., Bhagavathi, S. S., Chalermpong. P. (2015). The
influence of extraction methods on composition and antioxidant properties of
rice bran oil. Food Sci. Technol. 35(3): 493-501.
Omar, M. A. A, and Muhammad, A. A. Z. (2016). Oxidation Stability of Castor Oil in
Solvent Extraction. J. Teknologi (Sciences & Engineering). 78(6): 239-244.
Oguni, C., Sota, K., Takayama,T. and Inagaki, Y. (1962). Clinical effects of gamma-
oryzanol on vegetative neurosis. Clin Gynecol. Obstet. 21(4): 16-57.
Pascual, C. De, S. C. I., Massaretto, I. L., Kawassaki, F., Barros, R. M. C., Noldin, J.
A., and Marquez, U. M. L. (2013). Effects of parboiling, storage and cooking
on the levels of tocopherols, tocotrienols and gamma-oryzanol in brown rice
(Oryza sativa L.). Food Research Int. 50(2): 676-681.
Patel, M., and Naik, S. N. (2004). Gamma-oryzanol from rice bran oil-A review. J. of
Scient. and Ind. Research. 63(7): 569-578.
Pengkumsri, N., Chaiyasut, C., Sivamaruthi, B. S., Saenjum, C., Sirilun, S., Peerajan,
S., Kesika, P. (2015). The influence of extraction methods on composition and
antioxidant properties of rice bran oil. J. Sci. and Technol. (Campinas).
35(3): 493-501.
Pestana-Bauer, V. R., Zambiazi, R. C., Mendonca, C. R. B., Beneito-Cambra, M., and
Ramis-Ramos, G. (2012). gamma-Oryzanol and tocopherol contents in
residues of rice bran oil refining. Food Chem. 134(3): 1479-1483.
Piyasena, P., Mohareb, E., and McKellar, R. C. (2003). Inactivation of microbes using
ultrasound: A review. Int' J. Food Micro. 87(3): 207-216.
Pomeranz, Y. and Chung, O. K. (1983). Lipids in Cereal Products. Academic press,
50
London. 302p.
Proctor, A. and Bowen, D. J. (1996). Ambient-temperature extraction of rice bran oil
with hexane and isopropanol. J. Amer. Oil Chem. Soc. 73(6): 811-813.
Qu, R., Wang, S. M., Lin, Y. H., Vance, V. B., and Huang, H. (1986). Characteristics
and biosynthesis of membrane proteins of lipid bodies in the scutella of maize
(Zea mays L.). The Bio. Journal. 235(1): 57-65.
Riera, E., Blanco, A., García, J., Benedito, J., Mulet, A., Gallego-Juárez, J. A., and
Blasco, M. (2010). High-power ultrasonic system for the enhancement of mass
transfer in supercritical CO2 extraction processes. Ultrasonics. 50(2): 306-309.
Rogers, E. J., Rice, S. M., Nicolosi, R. J., Carpenter, D. R., McClelland, C. A., and
Romanczyk, L. J. J. (1993). Identification and quantitation of gamma-oryzanol
components and simultaneous assessment of tocols in rice bran oil. J. Amer.
Oil Chem. Soci. 70(3): 301-307.
Ronal, E., and Junsoo., L. (2004). Vitamin E, Food chemistry, Composition and
analysis. Marckel Dekker INC. 21: 231-243.
Rostagno, M. A., Palma, M., and Barroso, C. G. (2003). Ultrasound-assisted extraction
of soy isoflavones. J. Chromatography A. 1012(2): 119-128.
Roy, P., Orikasa, T., Okadome, H., Nakamura, N., and Shiina, T. (2011). Processing
conditions, rice properties, health and environment. Int. J. En. Res. and
Public Health. 8(6): 1957-1976.
Samaram, S., Mirhosseini, H., Tan, C. P., and Ghazali, H. M. (2014). Ultrasound-
assisted extraction and solvent extraction of papaya seed oil: Crystallization
and thermal behavior, saturation degree, color and oxidative stability.
Industrial Crops and Products. 52: 702-708.

51
Saunders, R. M. (1985). Rice bran: Composition and potential food uses. Food
Reviews International. 1: 214-228.
Sayre, R. N, Nayyar, D., and S. R. M. (1985). & Extraction and Refining of Edible Oil
from Extrusion. J. Amer. Oil Chem. Soci. 62(6): 1040-1043.
Self, R. (2005). Extraction of Organic Analytes from Foods. J. Amer. Oil Chem.
Soci. 12: 201-245.
Seetharamaiah, G. S., Krishnakantha, T. P., and Chandrasekhara, N. (1990). Influence
of gamma-oryzanol on platelet aggregation in Rats. J. Nutir. Sci. vitamol. 36:
291-297.
Shah, S., Sharma, A., and Gupta, M. N. (2005). Extraction of oil from Jatropha curcas
L. seed kernels by combination of ultrasonication and aqueous enzymatic oil
extraction. Bio. Technol. 96(1): 121-123.
Sharma, A., Khare, S. K., and Gupta, M. N. (2001). Enzyme-assisted aqueous
extraction of rice bran oil. J. Amer. Oil Chem. Soci. 78 (9): 949-951.
Singh, T. P., and Sogi, D. S. (2016). Inhibition of lipase activity in commercial rice
bran of coarse, fine, and superfine cultivars. Cogent Food and Agri. 2(1): 1-9.
Suslick. (1989). Ultrasound: Its chemical, physical, and biological effects. In:
Biological Effect of Ultrasound. Russel Ritenour (ed). VCH Publisher, NY.
336p.
Suslick, K. S., Grinstaff, M. W., Kolbeck, K. J., and Wong, M. (1994).
Characterization of sonochemically prepared proteinaceous microspheres.
Ultrasonics-Sonochemistry. 1(1): 65-68.
Tobergte, D. R., and Curtis, S. (2013). Lipid and function. In: The Lipid Handbook.
CRC press, NY. 681p.
52
Toma, M., Vinatoru, M., Paniwnyk, L., and Mason, T. J. (2001). Investigation of the
effects of ultrasound on vegetal tissues during solvent extraction. Ultr.
Sonochem. 8(2): 137-142.
Tzen, J., Cao, Y., Laurent, P., Ratnayake, C., and Huang, A. (1993). Lipids, Proteins,
and Structure of Seed Oil Bodies from Diverse Species. Plant Physiology. 101
(1): 267-276.
Van Boven, M., Daenens, P., Maes, K., and Cokelaere, M. (1997). Content and
Composition of Free Sterols and Free Fatty Alcohols in Jojoba Oil. J. Agri.
and Food Chem. 45(4): 1180-1184.
Vinatoru, M., Toma, M., Radu, O., Filip, P. I., Lazurca, D., and Mason, T. J. (1997).
The use of ultrasound for the extraction of bioactive principles from plant
materials. Ultr. Sonochem. 4(2): 135-139.
Xu, Z., and Godber, J. S. (1999). Purification and identification of components of
gamma-oryzanol in rice bran oil. J. Agri. and Food Chem. 47(7): 2724-2728.
Yasui, K. (2002). Influence of ultrasonic frequency on multibubble sonoluminescence.
J. Acoustical Soci. of America. 112(4): 1405-1413.
Zenker, M., Heinz, V., and Knorr, D. (2003). Application of Ultrasound-Assisted
Thermal Processing for Preservation and Quality Retention of Liquid Foods. J.
Food Protection. 66(9): 1642-1649.
Zhang, H. F., Yang, X. H., and Wang, Y. (2011). Microwave assisted extraction of
secondary metabolites from plants: Current status and future directions.
Trends in Food Sci. and Technol. 22(12): 672-688.
Zhang, Z. S., Wang, L. J., Li, D., Jiao, S. S., Chen, X. D., and Mao, Z. H. (2008).
Ultrasound-assisted extraction of oil from flaxseed. Separation and
53
Purification Technol. 62(1): 192-198.
Zullaikah, S., Melwita, E., and Ju, Y. H. (2009). Isolation of oryzanol from crude rice
bran oil. Bio. Technol. 100(1): 299-302.

54
CHAPTER III
EFFECTS OF ULTRASONICATION AND THERMAL COOKING
PRE-TREATMENTS ON THE EXTRACTABILITY AND QUALITY OF
COLD PRESS EXTRACTED RICE BRAN OIL
3.1 Abstract
This research investigates the effects of different extraction processes on the recovery
and quality of rice bran oil. The extraction processes under study included hexane
extraction (HE), cold press extraction (CE), ultrasonic pre-treatment combined with
cold press extraction (UCE), and thermal cooking combined with cold press extraction
(CCE). The ultrasonic power and irradiation duration were varied between 2.25, 4.50,
and 6.75 W/g; and 10, 25, and 40min. The cooking temperature was 100°C, and the
cooking time was varied between 5, 15, 25, and 35 min. The results showed that oil
recovery was positively correlated to ultrasonic power and duration and to thermal
cooking time, while the oil quality and ultrasonic intensity and thermal cooking period
were inversely correlated. Specifically, the oxidative stability, gamma-oryzanol and
unsaturated fatty acids of the short-period CCE oil were significantly higher than
those of the UCE oil. In addition, similar to the HE and CE oils, oleic, linoleic, and
palmitic acids were the dominant fatty acids in the CCE oil. Essentially, the shorter
thermal cooking time combined with cold press extraction is optimal for the
commercial production of rice bran oil due to improved oil recovery and quality.

55
Keywords: Rice bran; Cold press extraction; Ultrasonic pre-treatment; Cooking pre-treatment
3.2 Introduction
Rice bran oil is used in food, pharmaceutical, and cosmetic products (Hamm et
al., 2013; Lerma-García et al., 2009; Sharma and Rukmini, 1986). Rice bran oil is
high in vitamin B, vitamin E (tocopherols and tocotrienols), vitamin K, and gamma-
oryzanol (Joshi et al., 2016; Lerma-García et al., 2009). Given a high smoke point of
232°C, rice bran oil is also used in high-temperature cooking, e.g., stir frying and deep
frying (Joshi et al., 2016).
Currently, there are two production methods of rice bran oil:
extrusion/pressing and solvent extraction (SE) with pure solvent (Sayasoonthorn et al.,
2012; Carrín and Crapiste, 2008). Although the extracted oil is of high quality (i.e.,
high oxidative stability, high gamma-oryzanol, and high unsaturated fatty acids), the
extrusion/pressing method suffers from low oil extractability. On the other hand, the
SE method achieves high oil recovery but is time-consuming and requires
environmentally hostile chemicals. The quality of SE oil is also lower than the
mechanically pressed oil.
As a result, advanced extraction methods, including supercritical fluid
extraction (SFE), microwave assisted extraction (MAE), pulsed electric field (PEF),
and enzymatic assisted extraction (EAE), were proposed for extraction of rice bran oil
(Soares et al., 2016; Jegannathan and Nielsen, 2013; Zigoneanu et al., 2008; Zbinden
et al., 2013). These advanced extraction methods possess several advantages over the
conventional extraction methods, including shorter extraction time, lower solvent
requirement, and higher recovery (Bjorklund, 2000). However, their commercialization
potential is limited by high operation costs for SFE, MAE, and PEF (Bjorklund, 2000;
56
Zhang et al., 2011); restricted application to food processing due to high pressure
stresses and high temperatures for PEF (Kumar et al., 2015); unsuitability for
thermally labile compounds for MAE (Bjorklund, 2000; Zhang et al., 2011); and lack
of industrial use for EAE (Jegannathan and Nielsen, 2013).
Other extraction methods were also proposed to improve the recovery and
quality of plant-based extract oils. In Sayasoonthorn et al. (2012), screw press was
used to improve the rice bran oil recovery. In Taghvaei et al. (2013), the recovery and
quality of cotton-seed oil were enhanced by thermal cooking pre-treatment combined
with microwave-assisted solvent extraction. In addition, Thanonkaew et al. (2012)
experimented with various heating pre-treatment schemes (hot air, roasting,
steaming/cooking, microwave) followed by cold press extraction to improve the
recovery and quality of rice bran oil.
However, there exists no research on the effect of ultrasonic pre-treatment
combined with cold press extraction on the recovery and quality of rice bran oil. In
addition, the previous thermal cooking combined with cold press extraction was
carried out under high-temperature and long-period condition (130°C and 60min)
(Thanonkaew et al., 2012), a condition which is not optimal for the commercial
production of rice bran oil.
Thus, this research investigates the effects of ultrasonic and cooking pre-
treatments combined with cold press extraction on the recovery and quality (oxidative
stability, gamma-oryzanol, and unsaturated fatty acids) of rice bran oil. The study
focuses on four extraction processes: hexane extraction (HE, Control 1), cold press
extraction (CE, Control 2), ultrasonic pre-treatment combined with cold press
extraction (UCE), and thermal cooking pre-treatment combined with cold press

57
extraction (CCE). The ultrasonic power and irradiation times were varied between
2.25, 4.50, and 6.75 W/g; and 10, 25, and 40 min. The cooking temperature was
100°C, and the cooking time was varied between 5, 15, 25, and 35 min.
3.3 Objectives
The objective of the present study was determined the different extraction
methods to the oil recovery and oil quality.
3.4 Materials and methods
3.4.1 Materials
Rice bran (RB) of jasmine variety was acquired from Korat Rice Mill
factory in Thailand’s northeastern province of Nakhon Ratchasima. The RB was
passed through a 60-mesh sieve (0.25 mm) and dried at 100°C for 15min to inactivate
endogenous lipase. The final moisture content was 6-8% (dry basis, db), determined
by a moisture meter (A&D, AD-4714A, Japan). The product was then vacuum-packed
and stored below 4ºC for further analysis (Hamm et al., 2013).
Methanol (Mallinckrodt), n-hexane, ethanol and chloroform absolute
value (<98.5%) were from Sigma-Aldrich and used without treatment. Standard fatty
acid methyl esters (37-component FAME Mix of Supercool, USA) and gamma-
oryzanol (Oryza Oil & Fat Chemical Co., Ltd, Japan) were used for quantifications.
3.4.2 Methods
3.4.2.1 Hexane extraction (HE)
A Soxtec solvent extraction system was used for rice bran oil
extraction .A 10 g processed RB was packed into a thimble and extracted with 100 mL

58
n-hexane for 3 hours at 90ºC ) Samaram et al., 2014; Zhang et al., 2008( .The n-hexane
was then removed and the oil weighed and stored at 4ºC for further analysis .The HE
technique yielded 18.50±0.03 g of oil per 100 g of RB (db), which was set as 100% oil
recovery (Control 1).
3.4.2.2 Cold press extraction (CE)
A 100 g processed RB was pressed by a cold press machine
(Dulong, DL-ZY J02, China) at 35-40ºC, and the extracted oil was collected in a
stainless steel container and weighed. The recovery (Control 2) was expressed as the
proportion of the cold-press extracted (CE) oil to the HE-treated rice bran oil (Zhang
et al., 2008).
3.4.2.3 Ultrasonic pre-treatment combined with cold pressing
extraction (UCE)
A 100 g processed RB was dispersed in 300 mL distilled water
(1:3) in a conical stainless steel container. The ultrasonic pre-treatment was carried
out at 20 kHz using an ultrasonic generator (VCX750 Vibracell; Sonic & Materials,
Inc., Newtown, CT, USA). The ultrasonic power and irradiation times were varied
between 2.25, 4.50, and 6.75 W/g; and 10, 25, and 40 min, respectively. The
ultrasonic generator operated on a cycle of 50 s on and 10 s off (pulse 50⁄10 s) with
the temperature maintained at 30ºC. The ultrasonic-treated slurries were filtered with
Whatman filter paper no.1. The solid portion was then heated at 100ºC for 1 hour to
reduce the moisture content to 6-8%db before cold press extraction. The oil recovery
was expressed as the oil extracted by UCE and the oil content in the initial rice bran as
determined by HE.

59
3.4.2.4 Cooking process combined with cold press extraction (CCE)
The processed RB was placed evenly on a 15 cm-diameter
aluminum tray and covered with aluminum foil. The tray was then processed in an
autoclave (Tommy, SX700, Japan) at 100°C for 5, 15, 25, and 35min. The cooked RB
products were oven-dried (Memmert, ULM400, Germany) at 100°C for 1 hour and the
moisture content adjusted to 6-8%db. The oil was then extracted using the cold
pressing machine, and the yield was calculated as per equation (1).
(%) Oil recovery =W o o l x ( )
To l w o n l n o l x y x n ( ) (3.1)
3.4.2.5 Physicochemical and phytochemical analysis
The American Oil Chemists’ Society (AOCS) official methods
(1997) were used: Cd 8b-90 for peroxide value (PV), Ca 5a-40 for acid value (AV),
Cd 3a-94 for soaponification value, and Cd 1d-92 for iodine value (IV). Color was
measured by a Minolta CR-300 Chroma Meter (Osaka, Japan) using the la
Commission Internationale de l’Eclairage (CIE) L*a*b* (lightness, redness, and
yellowness) color system. Density was measured by pycnometer. Gamma-oryzanol in
the extracted rice bran oils was analyzed by UV-spectrophotometer/NIR (Shimazu,
UV-2600, Japan) (Joshi et al., 2016).
3.4.2.6 Gas Chromatography with Flame-Ionization Detection
(GC-FID) analysis
The fatty acids (FAs) were analyzed by GC-FID (Agilent
7890C axis detector, England), following Stanisavljevic et al. (2009) with some
modifications. In the analysis, a 20 mg rice bran oil sample was weighed into a test
tube and 1 mL 0.5 M KOH added. The solution was heated in a water bath at 90°C for

60
30min, and then neutralized with 0.6 M HCl before adding 3.0 mL BF3 in methanol.
The mixture was re-heated at 90°C for another 15min in a water bath. The methylated
oil was then extracted with n-hexane, and then the solvent was removed by nitrogen
gas prior to the FA analysis.
The GC-FID protocol was as follows: the injector temperature
was 180°C, the oven temperature started from 50°C to 250°C at a rate of 40°C/min,
with the detector temperature at 250°C, and the ion source temperature was 230°C.
The FAs were identified by the GC–FID mass fragmentation pattern and spectral and
compared against the standards of the National Institute of Standards and Technology.
3.4.2.7 Scanning electron microscope (SEM)
Scanning electron microscopy (SEM JEOL, JSM 6010 LV,
Technology Development Ltd., Japan) was used to determine the effect of HE,
ultrasonic and thermal cooking pre-treatments on the morphology of the experimental
rice bran. In the analysis, the native and treated rice bran samples were placed on the
metal stub and gold-sputtered. The shape and surface characteristics of the rice bran
samples were determined, and the most representative images selected.
3.4.3 Statistical analysis
All analyses were carried out in triplicate, and the results expressed as
the mean ± standard deviation. One-way analysis of variance (ANOVA) was used to
analyze the differences among group means. Tukey-HSD multiple comparison was
used to compare the means, given the 5% significance level (p<0.05). The statistical
analysis was carried out using Stagraphic Centrution XV (Statsoft Inc., USA).
61
3.4.4 Experimental site
T xp m n w s on u Su n Un v s y o T nolo y,
N k on R s m , T l n .
3.5 Results and Discussions
3.5.1 Oil recovery
Table 3.1 compares the rice bran oil recovery by different extraction
methods (HE, CE, UCE, and CCE) and conditions. The HE method produced the
maximum oil recovery (18.5 g oil/100g RB; set as 100%) (Control 1), which is slightly
higher than 16.7 g oil/100g RB in Gunawan et al. (2006). The oil recovery of the UCE
and CCE methods were in the range of 86.42-95.11% and 93.59-97.93%, respectively.
The ultrasonic (U) and thermal cooking (C) pre-treatments combined
with cold press extraction (CE) significantly improved the oil recovery by more than
2% and 10%, respectively, compared with that of cold press extraction (Control 2).
Under the UCE, given the same irradiation time, varying ultrasonic powers (2.25,
4.50, 6.75W/g) significantly impacted the oil recovery (p<0.05). More specifically, the
ultrasonic power was positively correlated to the oil recovery. Similar results were
also reported for oils extracted from ground tobacco seeds and flaxseeds pre-treated
with ultrasonic waves (S n s vlj v ć et al., 2009; Zhang et al., 2008).
The ultrasonic pre-treatment enhances the mass liquid transfer by the
cavitation forces (Sharma and Gupta, 2006; Zhang et al., 2008). The high shearing
force creates micro-bubbles and the bubble collapse generates localized pressures,
causing the rupture of cell walls to release the intracellular components into the
solvent (Zhang et al., 2008). However, ultrasound contributes to the formation of
peroxide radicals in the cavitation bubbles and the subsequent degradation of the

62
components, resulting in a low quality extracted oil (low oxidative stability, low
bioactive components, and low unsaturated fatty acids). Specifically, high ultrasonic
intensity induces these radicals to form and accelerates the chemical reactions in the
bulk solution and decomposition of components (Chemat et al., 2004).
In the table, the CCE-treated oil extractabilities (i.e., CCE15, CCE25,
and CCE35) were significantly higher than those of the UCE-treated (p<0.05) (all
conditions). The higher CCE oil recoveries could be attributed to the protein
denaturation of cell membranes by thermal cooking, enhancing the liquid mass
transfer (Taghvaei et al., 2013). On the other hand, sonication (ultrasonic pre-
treatment) affected the droplet surface (Hashtjin and Abbasi, 2015), leading to oil
oxidation and loss (Lethuaut et al., 2002). This is consistent with Porto et al., 2015;
Lou et al., 2010, who documented that high ultrasonic power and an extended
sonication period decreased the oil recovery due to the degradation reactions. In this
study, the extended thermal cooking pre-treatment followed by cold press extraction
(CCE15, CCE25, CCE35) produced higher oil extractabilities than the UCE scheme
(all conditions).
The cooking-assisted extraction improved the oil recovery by disruption
of tissues (Taghvaei et al., 2013; Thanonkaew et al., 2012). More specifically, thermal
cooking at temperatures above 100ºC denatures the enzyme and oil cell’s protein to
facilitate oil extract from the cell of rice bran (Taghvaei et al., 2013). The high-
temperature cooking alters the moisture and porosity of the rice bran, rendering it
more brittle to rupture (Thanonkaew et al., 2012). However, the thermal cooking could
result in more impurities and oil loss in the refining step (Taghvaei et al., 2013).

63
3.5.2 Physicochemical properties
The peroxide value (PV) and acid value (AV) are respectively used as
the indicators of deterioration and edibility of rice bran oils (Li et al., 2014; Akubugo
et al., 2007). Peroxide and acid formation indicates the lipid degradation by hydrolysis
or oxidation, resulting in rancidity and off-favors of the oil (Chemat et al., 2004;
Akabugo et al., 2007; Oluremi et al., 2013).
In Table 3.2, the PV of the CE (Control 2) and CCE5 oils were
significantly lower (p<0.05) than that of the HE (Control 1), UCE (all conditions), and
CCE (15, 25, 35min) oils. The lower PV (5.14±0.02 for CE and 5.37±0.16 meq O2/kg
oil for CCE5) indicated low deterioration and a long shelf life. This is consistent with
Akubugwo et al. (2007), who reported that PV should be below 10 meq O2/kg oil,
given that a value between 20 and 40 results in a rancid taste.
The AV of the CE oil (Control 2) was the lowest (3.34±0.17%oleic
acid). On the other hand, the lowest AV under the pre-treated conditions (i.e.,
ultrasound and thermal cooking) of 4.13±0.06 %oleic acid were achieved with the low
to moderate ultrasonic intensity (2.25 W/g; 10 and 25min); and short cooking time
(CCE5). Both PV and AV increased with increases in the ultrasound intensity and
irradiation time as well as the cooking time. The elevated PV and AV were attributed
to the degradation of lipids in the presence of high temperatures, oxygen, and
ultrasound irradiation (Chemat et al., 2004; Gharby et al., 2016). Similar results were
also reported for papaya seed oil (Samaram et al., 2014). In this study, the shorter
cooking-time pre-treatment followed by cold press extraction, especially the CCE5,
yielded a higher quality rice bran oil in terms of oxidative stability than the UCE
scheme (all conditions).

64
Iodine value (IV) represents the degree of unsaturation or the average
number of double bonds of fatty acids (FAs) in oils or fats. A high IV indicates a high
degree of unsaturation (Gharby et al., 2016; Oluremi et al., 2013; Samaram et al.,
2014). In Table 3.2, the IV of the extracted rice bran oils was in the range of 77.7-
103.40 g I2/100g oil. The IV of the CCE5 oil (101.2 g I2/100g oil) was similar to that
of the CE oil (103.4 g I2/100g oil, Control 2). The finding indicated that the thermal
cooking process slightly altered the degree of unsaturation in the oil. This is consistent
with Oluremi et al. (2013), who documented that the IV of rice bran oil was in the
range of 85-105 g I2/100g oil. In addition, the IV of the CCE5 oil was significantly
higher (p<0.05) than that of the HE (Control 1), UCE (all conditions), CCE15, CCE25,
and CCE35 oils.
The increase in the processing parameters of the UCE and CCE
processes adversely affected the IV, especially those of the oils under the high-
intensity ultrasound pre-treatment conditions (i.e., high ultrasonic power and long
irradiation time), which were considerably reduced. The IV reduction could be
attributed to lipid oxidation which altered the chemical structures of UFAs. The
collapse of micro-bubbles during the sonication increased temperatures and pressures
in the medium, causing the lipid oxidation (Chemat et al., 2004; Kentish et al., 2011).
This is consistent with Chemat et al. (2004), who reported that an ultrasonic power of
0.65W/g reduced the UFAs in sunflower oil due to the presence of conjugated dienes.
This showed that sonication induced oil oxidation, resulting in a reduction in the
degree of unsaturation.
Saponification value is used to check adulteration (Oluremi et al.,
2013). The saponification value was found in crude rice bran oil from 175.28-177.23
65
mg KOH/g. The SV of HE, CE, and CCE were considerable significantly lower than that
of UCE at all treatments under high intensity. The increase in saponification value
might have occurred due to the hydrolysis of the esters of fatty acids of the oil. It
results in improved free fatty acids and glycerol formation with consequential
saponification value increases in the oil. Furthermore, these resulted the increase in
hydrolytic oxidation of the oil (Haji and Taghian, 2018). Under high-intensity
ultrasound pre-treatment, the increase temperature caused lipid to break down, and
reduce the average molecular weight of the oil. Our result is in good agreement with
Haji and Taghian, 2018 about the effect of ultrasound process on the saponification
value increase. Meanwhile, the relative density index, phosphorus matter, and
saponification value of the oils were not significantly affected (p<0.05) by different
extraction means and ultrasound assisted extraction. Similar results were reported by
Latif, Diosady and Anwar.
Carotenoids and chlorophylls are the main pigments present in
vegetable oils. During the thermal processing, chlorophyll decomposes into
pheophytins which cause the oil to become opaque and dark-colored (Sabah,
2007). Table 3.3 demonstrates the effects of different extraction methods and
conditions on the color of the rice bran oil.

66
Table 3.1 The rice bran oil recovery from different extraction methods and conditions.
Extraction method1 Condition Sample code Oil recovery (%)
2
HE - HE 100a±0.00
CE - CE 84.97h±1.06
UCE
2.25 W/g, 10min UCE2.25-10 86.42hg
±0.92
4.50 W/g, 10min UCE4.50-10 89.89f±1.06
6.75 W/g, 10min UCE6.75-10 94.78cd
±0.59
2.25 W/g, 25min UCE2.25-25 92.52e±0.54
4.50 W/g, 25min UCE4.50-25 93.93d±0.71
6.75 W/g, 25min UCE2.25-25 95.07c±1.03
2.25 W/g, 40min UCE4.50-40 92.54e±0.56
4.50 W/g, 40min UCE6.75-40 93.91d±0.63
6.75 W/g, 40min UCE6.75-40 95.11c±0.23
CCE
100ºC, 5min CCE5 93.59d±0.14
100ºC, 15min CCE15 96.81b±0.31
100ºC, 25min CCE25 97.73b±0.50
100ºC, 35min CCE35 97.93b±0.45
1 HE, CE, UCE, and CCE denote the hexane extraction, cold press extraction,
ultrasonic pre-treatment combined with cold press extraction, and CCE cooking
process combined with cold press extraction, respectively. 2
Different letters denote
statistically significant differences between treatments (p<0.05). The values are the
mean of three replications ± standard deviation.

67
Table 3.2 Physicochemical properties of the rice bran oils under different extraction methods and conditions.
Oil extract
sample code
Peroxide Value
(meq O2/kg oil)1
Acid Value
(%oleic acid)2
Iodine Value
(g I2/100 g oil)3
Saponification value
(mg KOH/g oil)4
Relative
Density5
Phosphorus
content (ppm)6
HE 9.11e±0.37 5.09
de±0.09 98.42
bc±1.34 175.28
a±0.42
0.91-0.92
317.1-318.5
CE 5.14a±0.02 3.34
a±0.17 103.40
a±3.03 175.47
a±0.76
UCE2.25-10 5.41b±0.34 4.13
b±0.06 100.20
b±1.39 175.51
a±0.47
UCE4.50-10 8.53d±0.21 4.87
d±0.27 98.34
bc±0.54 176.69
b±0.60
UCE6.75-10 12.87h±0.08 6.27
f±0.08 86.26
d±0.39 177.53
c±0.61
UCE2.25-25 9.27e±0.51 4.13
b±0.06 97.11
c±0.34 175.53
a±0.19
UCE4.50-25 9.82f±0.12 4.85
d±0.22 96.08
c±0.03 176.50
b±0.30
UCE6.75-25 13.78i±0.28 6.27
f±0.07 79.97
e±0.24 175.96
ab±0.62
UCE2.25-40 10.14g±0.41 4.40
c±0.02 88.25
d±0.45 176.30
b±0.16
UCE4.50-40 13.16h±0.12 5.24
e±0.06 80.99
e±1.39 177.11
bc±0.33
67
68
Table 3.2 Physicochemical properties of the rice bran oils under different extraction methods and conditions (Continued).
Oil extract
sample code
Peroxide Value
(meq O2/kg oil)1
Acid Value
(%oleic acid)2
Iodine Value
(g I2/100 g oil)3
Saponification value
(mg KOH/g oil)4
Relative
Density5
Phosphorus
content (ppm)6
UCE6.75-40 15.53k±0.32 6.34
g±0.09 77.68
f±0.25 177.16
c±0.42
0.91-0.92
317.1-318.5
CCE5 5.37ab
±0.16 4.13b±0.10 101.20
ab±0.69 175.53
a±0.27
CCE15 6.68c±0.16 4.35
c±0.15 100.01
b±0.90 175.95
a±0.53
CCE25 9.06e±0.17 4.91
d±0.02 99.12
bc±0.38 175.51
a±1.01
CCE35 10.05fg
±0.17 5.16e±0.02 98.56
bc±0.38 175.5
a±1.01
1,2,3,4,5,6 Different letters in each column denote statistically significant differences between treatments (p<0.05). The values are the mean
of three replications ± standard deviation.
68
69
The HE (Control 1), CE (Control 2), CCE5, and CCE15 oils had the high lightness
(L*) values (22.61±0.05, 22.59±0.05, 22.59±0.05, and 22.59±0.08, respectively)
(p<0.05). In this study, the high-intensity ultrasound (i.e., high ultrasonic power and
extended irradiation time) and longer thermal cooking time pre-treatments reduced L*
of the extracted rice bran oils.
The CE (Control 2), CCE5, and CCE15 oils had the low yellow (b*)
values (3.53±0.10, 3.55±0.07, and 3.76±0.09, respectively) (p<0.05). The CE oil
(Control 2) possessed the lowest red (a*) value (4.23±0.11) (p<0.05). The extended
extraction time at elevated temperatures facilitated the mass transfer of pigments and
other impurities from the sample matrix to the extracted oil (Mizukoshi et al., 1999;
Samaram et al., 2014a). Moreover, the Maillard products contributed to the red color
of oils under high temperatures (Severimi et al., 1994; Negroni et al., 2001). By
comparison, the CCE5 and CCE15 oils had L* comparable to the HE (Control 1) and
CE (Control 2) oils, given that L* is commonly used to indicate the oil quality
(Shahidi et al., 2006).
3.5.3 Phytochemical property
Gamma-oryzanol plays an important role in the quality of extracted oil.
The gamma-oryzanol contents of the HE, CE, UCE, and CCE oils were 1.79%, 1.83%,
0.53-1.79%, and 1.78-1.83%, respectively (Table 3.4), suggesting the effect of
different extraction processes on the gamma-oryzanol contents. According to
Chotimarkorn et al. (2008); Pengkumsri et al. (2015), the recovery of gamma-oryzanol
is subject to extraction methods.
In this study, the CE and CCE5 oils had the highest gamma-oryzanol
contents (1.83±0.02% and 1.83±0.03%, respectively). The longer thermal cooking

70
time (CCE15, CCE25, CCE35) slightly decreased the gamma-oryzanol content.
However, the elevated ultrasonic power (4.50 and 6.75 W/g) accelerated the
degradation of gamma-oryzanol. According to Kentish et al. (2011), high ultrasonic
power generated high pressure, resulting in higher temperatures or severe turbulence
in the medium and disintegration of the microstructures. The finding is consistent with
Khuwijitjaru and Taengtieng, 2004, who reported that the degradation of gamma-
oryzanol was accelerated as the temperature increased from 132°C to 222°C. In Table
3.4, the gamma-oryzanol content of CCE5, CCE15, CCE25, and CCE35 were
significantly higher than the UCE with 4.50 and 6.75 W/g ultrasonic power (p<0.05).
3.5.4 GC analysis for fatty acid composition
Table 3.5 illustrates the fatty acid (FA) composition of the HE, CE,
UCE, and CCE rice bran oils. The dominant FAs were oleic, linoleic, and palmitic
acids, while myristic, dihomo gamma-linolenic, heneicosylic, and stearic acids were
present in smaller amounts. The FA composition of the HE (Control 1) and CE
(Control 2) oils were similar. The FAs of the UCE and CCE oils varied, depending on
the pre-treatment conditions.
The saturated (myristic, palmitic, stearic, and heneicosylic acids) and
unsaturated (oleic, linoleic, and dihomo gamma-linolenic acids) FAs of the HE, CE,
and CCE oils were in the range of 27-30% and 70-73%, respectively. The unsaturated
fatty acids (UFA) of the UCE oil decreased by 16.17% when the ultrasonic power and
irradiation time increased from 2.25 W/g, 10min (72.98%) to 6.75 W/g, 40min
(61.18%). Meanwhile, linoleic acid decreased by 31.70%, and oleic acid by only
2.2%. Dihomo gamma-linolenic acid also slightly decreased under the high ultrasonic
intensity (i.e., high ultrasonic power and extended irradiation time), while the
71
saturated fatty acids (SFA) increased from 27.02 (2.25 W/g, 10min) to 38.82% (6.75
W/g, 40min). The finding indicated that high ultrasonic intensity exerted more
influence on UFAs than SFAs, consistent with S n s vlj v ć l. (2009), who
reported that ultrasonic intensity had a strong effect on UFAs, particularly linolenic
acid in rice bran oil when the ultrasonic power increased from 0.048 to 0.481 W/g.
This was attributable to the ultrasonic-induced cavitation, which altered the structural
and functional components of UFAs (Chemat, Grondin, Costes, et al., 2004; Samaram
et al., 2014).
Under the CCE, the unsaturated fatty acids (UFAs) slightly decreased
while the saturated fatty acids (SFAs) minimally increased as the cooking time
increased. Specifically, the thermal cooking pre-treatment had a smaller impact on the
FA composition of the extracted oils. Moreover, the unsaturated compounds of the
CCE5 oil closely resembled those of the CE oil (Control 2).
3.5.5 Microstructural analysis
SEM was used to investigate the microstructures of the native and
treated (i.e., HE-processed, ultrasonic- and cooking-pretreated) rice bran. In Fig. 3.1a,
the native rice bran had a relatively complete structure, regular or compact shape and
smooth surface, rendering it less ideal for oil extraction. In Fig. 3.1b, the micro-
fractures and cracks appeared on the HE-treated rice bran as the solvent penetrated,
resulting in the expanded cellular structure and partially dragging lipids and starches
(Alcázar-alay et al., 2015).
The ultrasonic- and cooking-pretreated rice bran (prior to cold press
extraction) exhibited numerous micropores with fissured and rough surface (Figs.3.1c,
d, e, f, g, h, k). The results are consistent with (Zhang et al., 2008; Kurian et al., 2015;
72
Yi et al., 2016), who reported that the ultrasonic and cooking pre-treatments induced
the structural changes, fissures, and cavities in the samples. The ultrasonic and thermal
cooking pre-treatments disrupt the tissues and cell walls of rice bran, enhancing the
mass transfer and the subsequent increased oil extractabilities.
3.6 Conclusions
This study comparatively investigates the effects of four extraction methods of
rice bran oil on the extractabilities. and quality: the hexane extraction (HE), cold press
extraction (CE), ultrasonic pre-treatment combined with cold press extraction (UCE),
and cooking process combined with cold press extraction (CCE). The results showed
that elevated ultrasonic intensity (i.e., higher ultrasonic power and longer irradiation
time) and extended cooking time increased the rice bran oil extractabilities; but
lowered the oil quality (i.e., oxidative stability, gamma-oryzanol, phosphorus content
and unsaturated fatty acids). The results also indicated that the oil quality of the rice
bran oil extracted under the short-time thermal cooking combined with cold press
extraction (CCE5) was higher than the ultrasonic-pretreated UCE rice bran oils (all
conditions). The SEM images illustrated that the ultrasonic and cooking pre-treatments
induced the structural changes, fissures, and cavities in the rice bran. Overall, the short
cooking time followed by cold press extraction (CCE5) is highly efficient and
commercially viable for the rice bran oil extraction because of the improved recovery
(increased oil yield) and good oil quality.

73
Table 3.3 Color of the rice bran oil under different extraction methods and conditions.
Oil extract sample code L*1 a*
2 b*
3
HE 22.6a±0.05 4.31
i±0.09 3.57
g±0.08
CE 22.59a±0.05 4.23
k±0.11 3.53
h±0.10
UCE2.25-10 22.43b±0.02 4.38
h±0.09 4.38
f±0.09
UCE4.50-10 22.23c±0.02 4.50
g±0.05 4.50
e±0.05
UCE6.75-10 22.25cd
±0.03 4.61ef
±0.07 4.61d±0.07
UCE2.25-25 22.39b±0.01 4.66
e±0.05 4.66
d±0.05
UCE4.50-25 22.12d±0.03 4.59
f±0.06 4.59
d±0.06
UCE6.75-25 22.05e±0.05 4.72
d±0.10 4.72
c±0.10
UCE2.25-40 22.38b±0.02 4.85
c±0.06 4.85
b±0.06
UCE4.50-40 22.07e±0.10 4.98
ab±0.09 4.98
a±0.09
UCE6.75-40 22.06e±0.03 4.93
b±0.08 4.93
a±0.08
CCE5 22.59a±0.05 4.32
i±0.07 3.55
h±0.07
CCE15 22.59a±0.08 4.31
i±0.08 3.76
gh±0.09
CCE25 22.10d±0.03 4.67
e±0.10 4.02
g±0.11
CCE35 22.61a±0.05 5.01
a±0.05 4.48
e±0.08
1,2,3 Different letters in each column denote statistically significant differences between
treatments (p<0.05). The values are the mean of three replications ± standard
deviation.
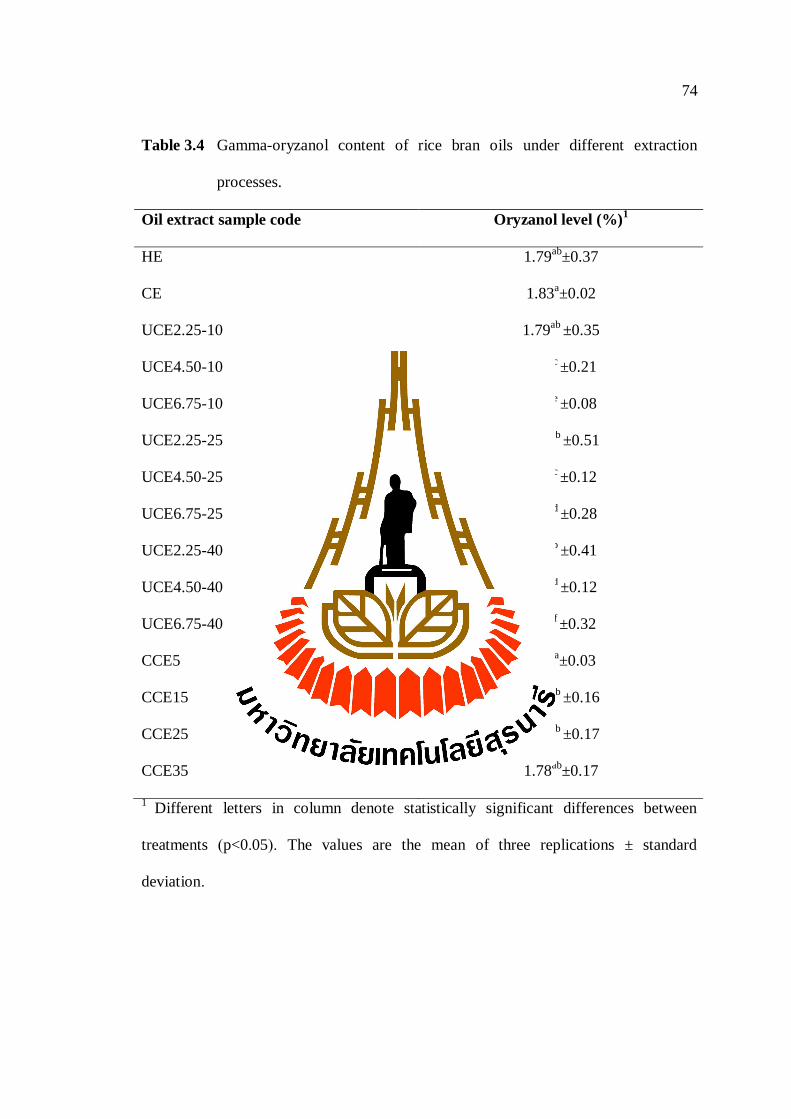
74
Table 3.4 Gamma-oryzanol content of rice bran oils under different extraction
processes.
Oil extract sample code Oryzanol level (%)1
HE 1.79ab
±0.37
CE 1.83a±0.02
UCE2.25-10 1.79ab
±0.35
UCE4.50-10 1.38c ±0.21
UCE6.75-10 0.89e ±0.08
UCE2.25-25 1.77ab
±0.51
UCE4.50-25 1.37c ±0.12
UCE6.75-25 0.98d ±0.28
UCE2.25-40 1.64b ±0.41
UCE4.50-40 1.05d ±0.12
UCE6.75-40 0.53f ±0.32
CCE5 1.83a±0.03
CCE15 1.79ab
±0.16
CCE25 1.78ab
±0.17
CCE35 1.78ab
±0.17
1 Different letters in column denote statistically significant differences between
treatments (p<0.05). The values are the mean of three replications ± standard
deviation.
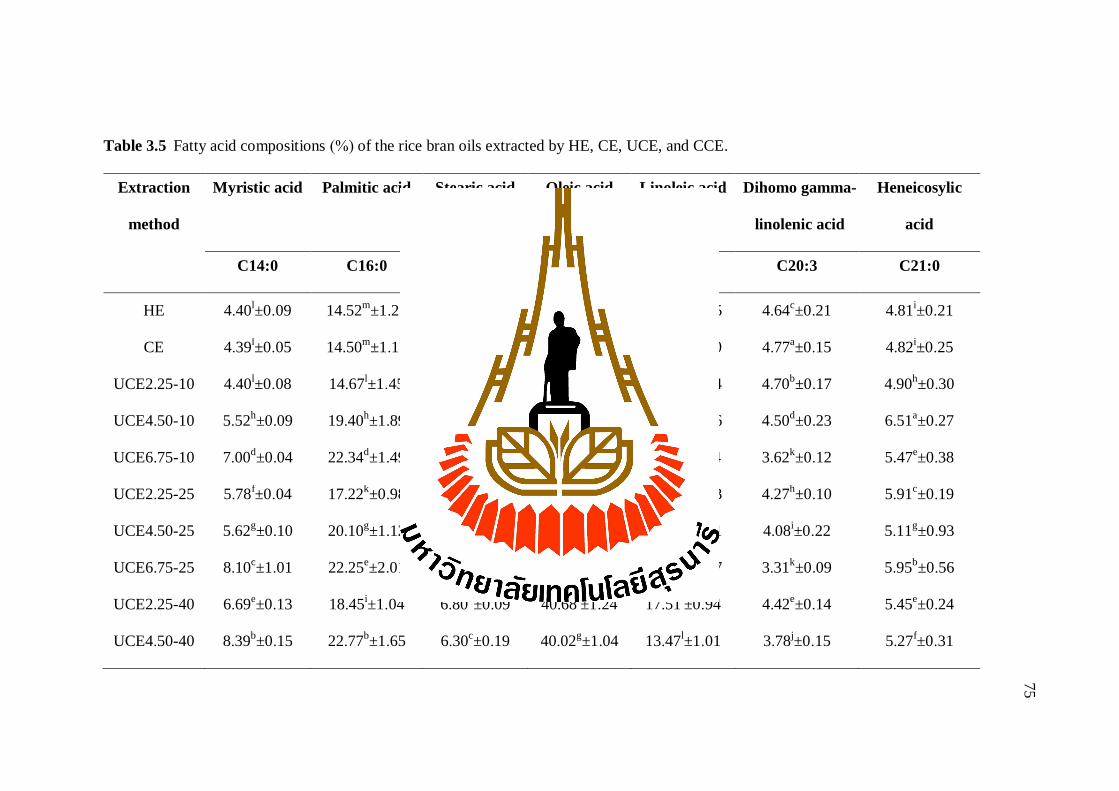
73
Table 3.5 Fatty acid compositions (%) of the rice bran oils extracted by HE, CE, UCE, and CCE.
Extraction
method
Myristic acid Palmitic acid Stearic acid Oleic acid Linoleic acid Dihomo gamma-
linolenic acid
Heneicosylic
acid
C14:0 C16:0 C18:0 C18:1 C18:2 C20:3 C21:0
HE 4.40l±0.09 14.52
m±1.21 3.61
k±0.10 44.86
b±2.09 23.16
b±1.35 4.64
c±0.21 4.81
i±0.21
CE 4.39l±0.05 14.50
m±1.11 3.42
j±0.12 44.90
a±1.74 23.19
a±1.00 4.77
a±0.15 4.82
i±0.25
UCE2.25-10 4.40l±0.08 14.67
l±1.45 5.20
f±0.09 43.04
c±1.61 23.09
c±0.94 4.70
b±0.17 4.90
h±0.30
UCE4.50-10 5.52h±0.09 19.40
h±1.89 3.57
i±0.17 41.45
e±1.69 19.05
g±1.36 4.50
d±0.23 6.51
a±0.27
UCE6.75-10 7.00d±0.04 22.34
d±1.49 5.90
d±0.31 39.92
h±2.01 15.75
j±0.94 3.62
k±0.12 5.47
e±0.38
UCE2.25-25 5.78f±0.04 17.22
k±0.98 3.57
i±0.35 41.48
d±2.19 21.77
d±1.03 4.27
h±0.10 5.91
c±0.19
UCE4.50-25 5.62g±0.10 20.10
g±1.12 5.58
e±0.64 41.46
e±1.63 18.05
h±1.71 4.08
i±0.22 5.11
g±0.93
UCE6.75-25 8.10c±1.01 22.25
e±2.01 6.30
c±0.89 39.92
h±1.39 14.17
k±0.97 3.31
k±0.09 5.95
b±0.56
UCE2.25-40 6.69e±0.13 18.45
i±1.04 6.80
b±0.09 40.68
f±1.24 17.51
i±0.94 4.42
e±0.14 5.45
e±0.24
UCE4.50-40 8.39b±0.15 22.77
b±1.65 6.30
c±0.19 40.02
g±1.04 13.47
l±1.01 3.78
j±0.15 5.27
f±0.31
75

74
Table 3.5 Fatty acid compositions (%) of the rice bran oils extracted by HE, CE, UCE, and CCE (Continued).
Extraction
method
Myristic acid Palmitic acid Stearic acid Oleic acid Linoleic acid Dihomo gamma-
linolenic acid
Heneicosylic
acid
C14:0 C16:0 C18:0 C18:1 C18:2 C20:3 C21:0
UCE6.75-40 9.03a±0.21 25.12
a±2.02 9.50
a±0.12 34.24
k±1.09 13.30
m±0.89 3.15
l±0.10 5.66
d±0.43
CCE5 4.39l±0.07 14.51
m±0.94 3.42
j±0.06 44.90
a±2.00 23.20
a±0.99 4.76
a±0.24 4.82
i±0.46
CCE15 4.46k±0.10 19.37
j±0.99 4.55
i±0.05 41.03
g±1.16 21.46
d±1.05 4.31
f±0.12 4.82
i±0.29
CCE25 4.93i±0.14 21.88
f±1.67 4.90
h±0.10 39.03
i±1.42 20.14
e±0.95 4.31
f±0.11 4.81
i±0.05
CCE35 4.78j±0.12 22.56
c±2.11 5.10
g±0.07 39.00
j±1.67 19.49
f±0.97 4.29
g±0.18 4.78
j±0.18
Different letters in column denote statistically significant differences between treatments (p<0.05). The values are the mean of three
replications ± standard deviation.
76
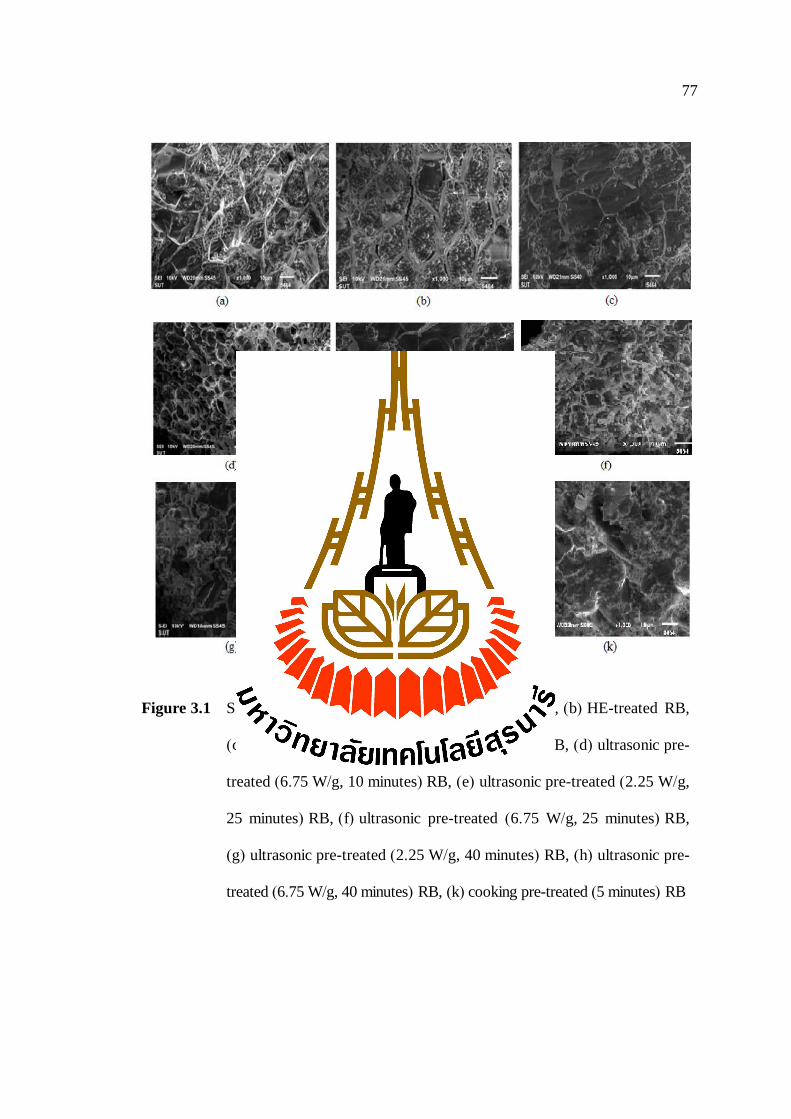
77
Figure 3.1 SEM images (1000x) of: (a) native rice bran (RB), (b) HE-treated RB,
(c) ultrasonic pre-treated (2.25 W/g, 10 minutes) RB, (d) ultrasonic pre-
treated (6.75 W/g, 10 minutes) RB, (e) ultrasonic pre-treated (2.25 W/g,
25 minutes) RB, (f) ultrasonic pre-treated (6.75 W/g, 25 minutes) RB,
(g) ultrasonic pre-treated (2.25 W/g, 40 minutes) RB, (h) ultrasonic pre-
treated (6.75 W/g, 40 minutes) RB, (k) cooking pre-treated (5 minutes) RB

78
3.7 References
Akubugwo and Ugbogu, A. E., (2007). Physicochemical studies on oils from five
selected Nigerian plant seeds. Pakistan J. Nutrition. 6(1): 75-78.
Official Methods and Recommended Practices. (1989). AOCS Press, Champaign, IL,
Official method Cd 1b-87, Ca 5a-40, Ca 12-55, Aa 516-01, Cd 3a-94.
Alcázar-alay, S. C., Cardenas-toro, F. P., Santos, D. T., and Meireles, M. A. A.
(2015). Study of an Extraction Process as the Pretreatment Step for Sugar
Production from Acid Hydrolysis. J. Food Eng. 5(2): 47-55.
Bjorklund, C. S. E. and E. J. (2000). Analytical-scale microwave-assisted extraction.
J.Chromatogr. A. 902: 227p.
Carrín, M. E., and Crapiste, G. H. (2008). Mathematical modeling of vegetable oil-
solvent extraction in a multistage horizontal extractor. J. Food Eng. 85(3):
418-425.
Chemat, F., Grondin, I., Costes, P., Moutoussamy, L., Sing, A. S. C., and Smadja, J.
(2004). High power ultrasound effects on lipid oxidation of refined sunflower
oil. Ultr. Sonochem. 11(5): 281-285.
Chemat, F., Grondin, I., Sing, A. S. C., and Smadja, J. (2004). Deterioration of edible
oils during food processing by ultrasound. Ultr. Sonochem. 11(1): 13-15.
Chotimarkorn, C., Benjakul, S., and Silalai, N. (2008). Antioxidant components and
properties of five long-grained rice bran extracts from commercial available
cultivars in Thailand. Ultr. Sonochem. 111(3): 636-641.
Da Porto, C., Natolino, A., and Decorti, D. (2015). Effect of ultrasound pre-treatment
of hemp (Cannabis sativa L.) seed on supercritical CO2 extraction of oil. J.
Food Sci. and Technol. 52(3): 1748-1753.
79
Gharby, S., Harhar, H., Matthäus, B., Bouzoubaa, Z., and Charrouf, Z. (2016). The
chemical parameters and oxidative resistance to heat treatment of refined and
extra virgin Moroccan Picholine olive oil. J. Taibah University for Science.
10(1): 100-106.
Gunawan, S., Vali, S. R., and Ju, Y.-H. (2006). Purification and identification of rice
bran oil fatty acid steryl and wax esters. J. Amer. Oil Chem. Soci. 83(5): 449-
456.
Haji, S., and Taghian, S. (2018). Evaluation of Iodine and Saponification Values of
Peanut Oil Extracted By Ultrasound-Assisted Enzymatic Method. Radv. Food
Sci. 1(1): 1-10.
Hamm, W., Hamilton, R. J., Calliauw, G., Dijkstra, A. J., Hamm, W., Richard J.
Hamilton, and Calliauw, G. (2013). Edible Oil Processing. Lipid Library.
Hashtjin, A. M., and Abbasi, S. (2015). Optimization of ultrasonic emulsification
conditions for the production of orange peel essential oil nanoemulsions. J.
Food Sci. and Technol. 52(5): 2679-2689.
Jegannathan, K. R., and Nielsen, P. H. (2013). Environmental assessment of enzyme
use in industrial production-a literature review. J. Cleaner Production. 42:
228-240.
Joshi, M., Kaur, R., Kanwar, P., Dhiman, G., Sharma, G., Lata, S., Mishra, T. (2016).
To Evaluate Antioxidant Activity of gamma-oryzanol Extracted From Rice
Bran Oil. Int. J. Life Sc. And Pharma Research. 6(3): 17-25.
Huwijitjaru, P., and Taengtieng, N. (2004). Degradation of Gamma-oryzanol in Rice
bran oil during h n : An analysis using derivative UV-spectrophotometry.
Silpakorn University International Journal. 4(1): 154-165.

80
Kentish, S., and Ashokkumar, M. (2011). Chemical effects of ultrasound. In H. Feng,
G. V. Barbosa and J. Weiss (Eds.), Food and Bioprocessing (pp. 1-12). New
York, NY: Springer.
Kumar, Y., Patel, K. K., and Kumar, V. (2015). Pulsed Electric Field Processing in
Food Technology. Int. J. Eng. Studies and Technical Approach. 1(2): 6-17.
Kurian, J. K., Gariepy, Y., Orsat, V., and Raghavan, G. S. V. (2015). Comparison of
steam-assisted versus microwave-assisted treatments for the fractionation of
sweet sorghum bagasse. Bio. and Bioproces. 2(1): 30-42.
Lerma-García, M. J., Herrero-Martínez, J. M., Simó-Alfonso, E. F., Mendonça, C. R.
B., and Ramis-Ramos, G. (2009). Composition, industrial processing and
ppl ons o n γ-oryzanol. Food Chem. 115(2): 389-404.
Lethuaut, L., Metro, F., and Genot, C. (2002). Effect of droplet size on lipid oxidation
rates of oil-in-water emulsions stabilized by protein. J. Amer. Oil Chem. Soc.,
79(5): 425-430.
Li, Y., Li, D., Qi, B., Rokayya, S., Ma, W., Liang, J., Jiang, L. (2014). Heating quality
and stability of aqueous enzymatic extraction of fatty acid-balanced oil in
comparison with other blended oils. J. Chemistry. 30: 20-29.
Lou, Z., Wang, H., Zhang, M., and Wang, Z. (2010). Improved extraction of oil from
chickpea under ultrasound in a dynamic system. J. Food Eng. 98(1): 13-18.
Mizukoshi, Y., Nakamura, H., Bandow, H., Maeda, Y., and Nagata, Y. (1999).
Sonolysis of organic liquid: Effect of vapour pressure and evaporation rate.
Ultr. Sonochem. 6(4): 203-209.
Negroni, M., Agostina, A. D., Arnoldi, A., Molecolari, S., and Chimica, S. (2001).
Effects of olive, canola, and sunflower oils on the formation of volatiles from
81
the Maillard reaction of Lysine with Xylose and Glucose, J. Amer. Oil Chem.
Soc. 21(1): 439-445.
Oluremi, O. I., Solomon, A. O., and Saheed, A. A. (2013). Fatty acids, metal
composition and physico-chemical parameters of Igbemo Ekiti rice bran oil. J.
Environ. Chem. and Ecotoxicology. 5(2): 39-46.
Pengkumsri, N., Chaiyasut, C., Sivamaruthi, B. S., Saenjum, C., Sirilun, S., Peerajan,
S., and Kesika, P. (2015). The influence of extraction methods on composition
and antioxidant properties of rice bran oil. Food Sci. and Technol.
(Campinas), 35(3): 493-501.
Sabah, E. (2007). Decolorization of vegetable oils: Chlorophyll-a adsorption by acid-
activated sepiolite. J. Colloid and Interface Sci. 310(1): 1-7.
Samaram, S., Mirhosseini, H., Tan, C. P., and Ghazali, H. M. (2014). Ultrasound-
assisted extraction and solvent extraction of papaya seed oil: Crystallization
and thermal behavior, saturation degree, color and oxidative stability.
Industrial Crops and Products. 52: 702-708.
Sayasoonthorn, S., Kaewrueng, S., and Patharasathapornkul, P. (2012). Rice bran oil
extraction by screw press method: Optimum operating settings, oil extraction
level and press cake appearance. Rice Science. 19(1): 75-78.
Shahidi, F., Liyana-Pathirana, C. M., and Wall, D. S. (2006). Antioxidant activity of
white and black sesame seeds and their hull fractions. Food Chem. 99(3): 478-
483.
Sharma, A., and Gupta, M. N. (2006). Ultrasonic pre-irradiation effect upon aqueous
enzymatic oil extraction from almond and apricot seeds. Ultr. Sonochem.
13(6): 529-534.
82
Sharma, R. D., and Rukmini, C. (1986). Rice bran oil and hypocholesterolemia in rats.
Lipids. 21(11): 715-717.
Soares, J. F., Dal Prá, V., De Souza, M., Lunelli, F. C., Abaide, E., Da Silva, J. R. F.,
Mazutti, M. A. (2016). Extraction of rice bran oil using supercritical CO2 and
compressed liquefied petroleum gas. J. Food Engineering. 170: 58-63.
S n s vlj v ć, I. T., V l č Kov ć, D. T., To o ov ć, Z. B., L z ć, M. L., and
V ljkov ć, V. B. (2 9). Comp son of techniques for the extraction of
tobacco seed oil. European J. Lipid Sci. and Technol. 111(5): 513-518.
Taghvaei, M., Jafari, S. M., Nowrouzieh, S., and Alishah, O. (2013). The influence of
cooking process on the microwave-assisted extraction of cottonseed oil. J.
Food Sci. and Technol. 52(2): 1138-1144.
Thanonkaew, A., Wongyai, S., McClements, D. J., and Decker, E. A. (2012). Effect of
stabilization of rice bran by domestic heating on mechanical extraction yield,
quality, and antioxidant properties of cold-pressed rice bran oil (Oryza saltiva
L.). LWT - Food Sci. and Technol. 48(2): 231-236.
Yi, J., Zhang, Q., Li, X., Wang, X., Li, B., and Zhu, W. (2016). Steam explosion
technology based for oil extraction from sesame (Sesamum indicum L.) seed.
J. Saudi. Soc. of Agr. Sci. 23(3): 129-136.
Zbinden, M. D. A., Sturm, B. S. M., Nord, R. D., Carey, W. J., Moore, D., Shinogle,
H., and Stagg-Williams, S. M. (2013). Pulsed electric field (PEF) as an
intensification pretreatment for greener solvent lipid extraction from
microalgae. Biotechnol. and Bioeng. 110(6): 1605-1615.
Zhang, H. F., Yang, X. H., and Wang, Y. (2011). Microwave assisted extraction of
secondary metabolites from plants: Current status and future directions.

83
Trends in Food Sci. and Technol. 22(12): 672-688.
Zhang, Z. S., Wang, L. J., Li, D., Jiao, S. S., Chen, X. D., and Mao, Z. H. (2008).
Ultrasound-assisted extraction of oil from flaxseed. Separation and
Purification Technology. 62(1): 192-198.
Zigoneanu, I. G., Williams, L., Xu, Z., and Sabliov, C. M. (2008). Determination of
antioxidant components in rice bran oil extracted by microwave-assisted
method. Bio. Technol. 99(11): 4910-4918.
CHAPTER IV
RESPONSE SURFACE METHODOLOGY OPTIMIZATION OF
CHEMICAL NEUTRALIZATION PARAMETERS FOR ENHANCED
RICE BRAN OIL RECOVERY AND QUALITY
4.1 Abstract
This research investigates the effect of variable chemical neutralization
parameters on the oil recovery, free fatty acid (FFA) level, and gamma-oryzanol
content of neutralized rice bran oil, using response surface methodology. The
neutralization parameters under study included NaOH concentrations (10-30°Be),
temperatures (60-90°C), and process time (5-15min). The quadratic response models
were generated and statistical analysis performed to validate the models. The optimal
neutralization condition was 19.24°Be, 74.79°C, and 11.18min. Under the optimal
condition, the predicted oil recovery, FFA level, and gamma-oryzanol were 80.00%,
0.31%, and 1.00%, respectively, while the corresponding experimental results were
80.12%, 0.29%, and 1.02%, suggesting good agreement between the predicted and
experimental data and high predictive ability of the models. The response models
could thus be applied to optimizing the neutralization parameters for enhanced oil
yield and quality.
Keywords: Response surface methodology, rice bran oil, neutralization, free fatty
acids, gamma-oryzanol.
85
4.2 Introduction
Rice bran is cuticle between the paddy husk and rice grain which obtained as a
byproduct during rice processing (Amarasinghe et al., 2004). Rice bran contains lipids,
proteins, minerals, and vitamins (Oluremi et al., 2013) and is a rich source of
unsaturated fatty acids (UFAs), including oleic, linoleic, and linolenic (Oluremi et al.,
2013). UFAs help lower cardiovascular risks, such as hyperlipidemia,
hypercholesterolemia, and hypertriglyceridemia (Grundy, 1975).
According to Jung et al. (2017); Ghasemzadeh et al. (2015), polyphenols,
gamma-oryzanol, tocopherols, and tocotrienols are found in abundance in rice bran oil
(RBO). These bioactive compounds are beneficial for decreasing plasma cholesterol
(Wilson et al., 2007), platelet aggregation, and cholesterol absorption (Sharma et al.,
1986; Seetharamaiah et al., 1986). RBO is thus commonly used in food, cosmetic, and
pharmaceutical products (Lerma-García et al., 2009).
In RBO production, the main challenge lies in the refining process of crude rice
bran oil (CRBO) to remove impurities, such as free fatty acids (FFAs), phospholipids,
pigments, and waxes, to improve the flavor, odor, appearance, and shelf life of the oil
(Gunstone, 2011). According to De et al. (2011), CRBO poses the greatest refining
challenge in order to meet the standards of edible oil.
There are two CRBO refining processes: physical and chemical. The physical
refining technique involves degumming and distillation (steam refining and
deodorization) (Jiri et al., 2000). The advantages of the physical refining included low
oil loss and preserved gamma-oryzanol (De and Bhattacharyya, 1998; Rajam et al.,
2005). However, the disadvantages are high implementation costs at industrial level

86
(Engelmann et al., 2017) and sensitivity to the quality of input crude oil (Kövari et al.,
2000; Engelmann et al., 2017).
The chemical refining involves degumming, neutralization, bleaching, and
deodorization (Gunstone, 2002). Neutralization is crucial to remove FFAs in CRBO
by saponification using sodium hydroxide (NaOH) solution (De and Patel, 2010).
Chemical neutralization is more effective in removing FFAs and impurities (waxes
and mucilage), contributing to improved RBO quality (Hoed et al., 2006). However,
chemical neutralization suffers from excessive loss of gamma-oryzanol, in which as
high as 90% was lost through soapstock (Das et al., 1998; Gopalakrishna et al., 2001).
Previous research on improved neutralization of RBO focused on low oil
recovery (Chumsantea et al., 2012; Gopalakrishna et al., 1988), darkening of color
(Hoed et al., 2010; De et al., 1998), or low gamma-oryzanol content (Chumsantea et
al., 2012; Das et al., 1998; Gopalakrishna et al., 2001). There is currently no study on
chemical neutralization optimization specific to RBO to improve FFA removal and oil
and gamma-oryzanol recovery.This study thus investigates the effect of variable
neutralization parameters on the recovery of RBO, FFA removal, and preservation of
gamma-oryzanol, using response surface methodology. The neutralization parameters
under study included NaOH concentrations, temperature, and process time, which
were varied between 10, 20, and 30°Be; 60, 75, and 90°C; and 5, 10, and 15min,
respectively.
4.3 Objectives
In order to study the effect of neutralization condition to optimize the
neutralization parameters of rice bran oil to reduce the oil loss during alkaline

87
neutralization and improve the oil quality by lowering free fatty acids while preserving
gamma-oryzanol.
4.4 Materials and methods
4.4.1 Materials
Rice bran (RB) of jasmine variety was acquired from Korat Rice Mill
factory in Thailand’s northeastern province of Nakhon Ratchasima. The RB was
passed through a 60-mesh sieve (0.25 mm) and pretreated according to Sun et al.
(2017), with minor modifications. Rice bran was dried at 100°C for 15min to
inactivate endogenous lipase. Dried samples were thermally cooked at 100°C for 5min
(pretreated), followed by cold press extraction (Phan et al., 2018). The crude rice bran
oil was centrifuged at 10,000 rpm for 10min and the CRBO stored in amber plactic
container at -20°C for further analysis.
Methanol (Mallinckrodt), n-hexane, ethanol, chloroform absolute value
(<98.5%), hanus reagent, ammonium molybdate, and ammonium metavanadate were
from Sigma-Aldrich. Citric acid (99%) was acquired from Acros Organics (New
Jersey, USA). Standards of fatty acid methyl esters (37-component FAME Mix of
Supercool, USA) and gamma-oryzanol (Oryza Oil and Fat Chemical Co., Ltd, Japan)
were used for quantification.
4.4.2 Experimental methods
4.4.2.1 Degumming of crude rice bran oil (CRBO)
The degumming was carried out according to Ringers (2000)
with some modifications. In degumming, 50 g of CRBO was heated to 70°C in water
bath, and then hydrated by adding 0.3%wt of 50% citric acid solution. The
degumming was conducted at 70°C for 30min with continuous slow agitation.

88
Degummed rice bran oil (DRBO) was then centrifuged at 10,000 rpm for 10min to
remove the gum and decanted for further refining.
4.4.2.2 Neutralization of degummed of crude rice bran oil (DRBO)
Free fatty acids in DRBO were neutralized following the
procedure in Engelmann et al. (2017) with some modifications. NaOH concentrations
were varied between 10, 20, and 30°Be, and the mixtures heated at different
temperatures (60, 75, and 90°C) and durations (5, 10, and 15min). The oil was stirred
vigorously and heated up to detemine temperature for the addition of aqueous NaOH,
and then 15%v/v of hot ultra-pure water sprayed on (Andersen et al., 1962). The oil was
left to settle and centrifuged at 10,000 rpm for 10min to precipitate the sludge before
neutralized rice bran oil (NRBO) collected. Residual water in NRBO was vacuum-
evaporated prior to physicochemical analysis. The NRBO recovery was calculated by
NRBO recovery % Weight of neutralized oil
Weight of inital degummed rice bran oil (4.1)
4.4.3 Experimental design for oil neutralization
In this study, response surface methodology (RSM) with central
composite face-centered (CCF) design was used to optimize the neutralization
parameters for RBO refining. Statistical software (Modde version 5.0, Sweden) was
used to analyze the experimental data. Three independent variables included NaOH
concentration (°Be, X1), temperature (°C, X2), and time (min, X3). The responses (Y)
were the NRBO recovery, FFA level, and gamma-oryzanol content. Each independent
variable was coded -1, 0, and +1 (Table 4.1), and the design of experiment consisted
of 17 experimental runs (Table 4.2). The experiments were carried out in triplicate and
averaged.
89
Table 4.1 Experimental levels of the three independent variables.
Symbol Variables Levels
-1 0 +1
X1 NaOH concentration (°Be) 10 20 30
X2 Temperature pretreatment (°C) 60 75 90
X3 Time pretreatment (min) 5 10 15
Multiple regression analysis was utilized to derive second-order polynomial
equation to predict the oil recovery (Y1), FFA (Y2), and gamma-oryzanol content (Y3):
𝑓 𝑌 0 ∑ ikn 1 i ∑ ii i
∑ ∑ ij i j𝑘𝑗
𝑘 𝑖
𝑘𝑛 (4.2)
where 𝑌 is the predicted response; 𝛽0 is a constant; Xi, and Xj are the independent
variables, 𝛽i is the linear coefficient, 𝛽ij is the interactive coefficient, and 𝛽ii is the
quadratic coefficient.
The model adequacy was evaluated by lack of fit, F-test, and regression
coefficient of determination (R2) from analysis of variance (ANOVA), and the 3D
response surface plots generated. Model validation was subsequently carried out. The
significance level was based on the 5% significance level (p<0.05).

90
4.4.4 Analytical methods
4.4.4.1 Fatty acid analysis
Fatty acids of CRBO, DRBO, and optimized NRBO were
analyzed by GC-FID (Agilent 7890C axis detector, England), following Stanisavljević
et al. (2009) with some modifications. The fatty acids were transformed into methyl
esters in BF3-methanol at 90°C for 15min in water bath. The methylated oil was then
extracted with n-hexane, and the solvent removed by nitrogen gas.
The temperature scheme used was as follows: the injector
temperature was 180°C, the oven temperature started from 50 to 250°C at a rate of
40°C/min, and the ion source temperature was 230°C. The injection volume was 1 µL
in splitless injection mode with Luer Tip syringe (LT) (Merck KGaA, Darmstadt,
Germany). The FA methyl esters were identified by comparing the retention time of
oil components against the standards of the National Institute of Standards and
Technology.
4.4.4.2 α-tocopherol chromatography conditions
The HPLC analysis was carried out using the Agilent 1200
series equipped with an Agilent 1200 series with a pump (LPG 3X00), auto-sampler
(ACC-3000), and diode-array UV/VIS detector (DAD). The mobile phase was
consisted of acetonitrile (50%) and methanol (50%) at a flow rate of 1.0 mL/min. The
quantitative estimation of α-tocopherol is performed on reversed phase C18 column
(1.5 mm × 150 mm, 1.75µm).The injection volume was 20 μL. The detection UV
wavelength was set at 330 nm, and the column temperature was set at 25°C.

89
Table 4.2 Experimental and predicted oil recovery (Y1), FFA level (Y2), and gamma-oryzanol of neutralized rice bran oil (NRBO)
(Y3) under variable NaOH concentrations (°Be, X1), temperature (°C, X2), and time (min, X3).
Run Code variable
Experimental
Predicted
X1 X2 X3 X1 X2 X3 Y1
(%)
Y2
(%)
Y3
(%)
Y1
(%)
Y2
(%)
Y3
(%)
1 -1 -1 -1 10 60 5 80.13±1.21 0.71±0.05 1.00±0.06 80.22±1.05 0.68±0.03 1.02±0.09
2 -1 1 -1 10 90 5 80.20±1.13 0.76±0.08 0.90±0.07 80.15±1.13 0.78±0.05 0.89±0.08
3 1 -1 -1 30 60 5 79.13±1.41 0.48±0.06 0.65±0.05 79.03±1.12 0.48±0.02 0.64±0.07
4 1 1 -1 30 90 5 79.61±1.39 0.60±0.05 0.63±0.08 79.55±1.19 0.59±0.04 0.63±0.08
5 -1 -1 1 10 60 15 79.82±1.34 0.69±0.06 0.99±0.08 79.83±1.09 0.72±0.05 0.98±0.09
6 -1 1 1 10 90 15 80.12±1.15 0.79±0.08 0.88±0.07 80.14±1.05 0.81±0.05 0.88±0.05
7 1 -1 1 30 60 15 79.11±1.29 0.25±0.03 0.49±0.05 79.12±1.06 0.23±0.05 0.50±0.09
8 1 1 1 30 90 15 80.08±1.20 0.31±0.04 0.55±0.05 80.02±1.15 0.32±0.05 0.52±0.05
9 0 -1 0 20 60 10 79.69±1.09 0.33±0.03 0.96±0.08 79.72±1.15 0.35±0.04 0.93±0.09
10 0 1 0 20 90 10 80.06±1.08 0.45±0.03 0.89±0.09 80.14±1.04 0.44±0.04 0.87±0.09
91

90
Table 4.2 Experimental and predicted oil recovery (Y1), FFA level (Y2), and gamma-oryzanol of neutralized rice bran oil (NRBO) (Y3)
under variable NaOH concentrations (°Be, X1), temperature (°C, X2), and time (min, X3) (Continued).
Run Code variable
Experimental
Predicted
X1 X2 X3 X1 X2 X3 Y1
(%)
Y2
(%)
Y3
(%)
Y1
(%)
Y2
(%)
Y3
(%)
11 -1 0 0 10 75 10 80.12±1.21 0.68±0.05 1.02±0.05 80.11±1.10 0.64±0.03 1.02±0.07
12 1 0 0 30 75 10 79.23±1.19 0.28±0.03 0.63±0.08 79.45±1.06 0.30±0.04 0.65±0.09
13 0 0 -1 20 75 5 80.01±1.05 0.31±0.03 0.90±0.08 80.01±1.05 0.39±0.05 0.91±0.09
14 0 0 1 20 75 15 80.05±1.21 0.30±0.02 0.81±0.04 80.05±1.17 0.28±0.05 0.84±0.08
15 0 0 0 20 75 10 80.02±1.27 0.33±0.05 0.95±0.09 79.99±1.03 0.32±0.03 0.93±0.09
16 0 0 0 20 75 10 80.09±1.09 0.30±0.05 0.90±0.07 79.99±1.45 0.32±0.05 0.93±0.07
17 0 0 0 20 75 10 80.09±1.10 0.35±0.03 0.95±0.05 79.99±1.04 0.32±0.04 0.93±0.06
Different letters in column denote statistically significant differences between treatments (p<0.05). The values are the mean of three
replications ± standard deviation.
92

93
4.4.4.3 Total phenolic content
The total phenolic content (TPC) was determined according to
the Folin-Ciocalteau method (Slinkard and Singleton, 1977), with slight modifications.
A 0.1 mL sample was mixed with 2 mL Folin-Ciocalteau, and 0.6 mL Na2CO3
(20.0%). The test tubes were vortexed and allowed to stand for 30min in the dark
before measurement at absorbance of 765 nm. The results were expressed as mg of
Gallic acid per g of powder (mg GA/g powder).
4.4.4.4 Thermal analysis
Differential scanning calorimetry (DSC 7, Perkin Elmer Corp.,
Norwalk, CT, USA) was utilized to characterize the thermal behavior. In the analysis,
the baseline was first established using two empty sealed aluminum crucibles under a
thermal program in which the initial temperature was 30°C and cooled down to -60°C
before heating to 60°C at a rate of 10°C/min. Then, 3-5 mg of CRBO, DRBO, and
optimized NRBO were individually transferred into one of the crucible (i.e., sample
crucible) and the analysis carried out and the melting curve plotted.
4.4.4.5 Other analytical methods
The American Oil Chemists’ Society (AOCS) official methods
(1997) were used: Cd 1b-87 for iodine value, Aa 516-01 for peroxide value, Ca 5a-40 for
free fatty acid, Ca 12-55 for phosphorus value, and Cd 3a-94 for saponification value. The
relative density of oil was measured by density bottle. Gamma-oryzanol was analyzed by
UV-spectrophotometer/NIR (Shimazu, UV-2600, Japan) (Joshi et al., 2016).
4.4.5 Statistical analysis
All experiments were carried out in triplicate and the results expressed
as mean±standard deviation. One-way analysis of variance (ANOVA) was used to
94
assess the effects of degumming and neutralization on the fatty acid profile and
physicochemical properties of DRBO and NRBO, CRBO. Tukey-HSD comparison
was used to compare means, given p<0.05. The statistical analysis was carried out
using Stagraphic Centrution XV (Statsoft Inc., USA) and Modde 5.0 (Umea, Sweden).
4.4.6 Experimental site
The experiment was conducted at Suranaree University of Technology,
Nakhon Ratchasima, Thailand.
4.5 Results and Discussion
4.5.1 Evaluation of progress for neutralization parameters
Experimental data based on RSM with CCF were used to optimize the
neutralization parameters; and evaluate the relationships between three independent
variables: NaOH concentration (°Be, X1), temperature (°C, X2), and time (min, X3)
and the responses: oil recovery (Y1), FFA (Y2), and gamma-oryzanol content (Y3).
Table 4.2 tabulates the experimental and predicted values. Specifically, the oil
recovery, FFA level, and gamma-oryzanol from the experiments were 79.11-80.20%,
0.25-0.76% oleic acid, and 0.49-1.02%, respectively.
The statistical significance of quadratic model terms was determined by
ANOVA, and the significance of regression coefficients by F-value, p-value, and lack
of fit. The insignificant terms (p>0.05) were excluded from the quadratic models.
Tables 4.3a-c respectively present the ANOVA results for the fitted quadratic models
for the oil recovery, FFA, and gamma-oryzanol of NRBO. Specifically, there existed
statistically significant relationships between the independent and response variables,
with high F-values and very low p-values (p<0.05), indicating that the model terms
were significant. According to Quanhong and Caili (2005); Yolmeh et al. (2014), larger

95
F-values and smaller p-values indicated a strong relationship between independent
variables and the response. In this research, the p-values of lack of fit were greater than
0.05, indicating that the models satisfactorily fitted the experimental data.
The robustness and predictive ability of the models were evaluated by
coefficient of determination (R2), adjusted R
2, and model predictive ability (Q
2). The
high R2 (0.952, 0.976, 0.987) and adjusted R
2 (0.891, 0.944, 0.971) of the oil recovery
(Y1), FFA (Y2), and gamma-oryzanol (Y3) models suggested good agreement between
the experimental and predicted data. Meanwhile, Q2 of Y1, Y2, and Y3 models were
0.575, 0.863, and 0.826, respectively, indicating that the variability of responses was
well explained by the models with small prediction error. According to Veerasamy et
al. (2011), high Q2 (>0.5) indicates good predictive ability of a model. In this research,
the oil recovery (Y1) model possessed a high R2 (0.952) but low Q
2 (0.575), suggesting
that the predictive ability of the Y1 model was not as high as the FFA (Y2) and gamma-
oryzanol (Y3) models. This was probably attributable to over-fitting (Makanjuola et al.,
2015).
The fitted quadratic relationships between the independent variables (X1
= NaOH concentration, X2 = temperature, X3 = time) and responses (Y1 = the oil
recovery, Y2 = FFA, and Y3 = gamma-oryzanol content) were as follows:
Y1 = 79.9908-0.2577X1+0.1652X2+0.0911X1*X2+0.0775X1*X3-0.1310X12 (4.3)
Y2 = 0.3157-0.1343X1+0.0386X2-0.0437X3-0.0462X1*X3-0.0967X12+0.0493X2
2 (4.4)
Y3 = 0.9280-0.1462X1-0.0207X2-0.0283X3+0.0195X1*X2-0.0156X1*X3-0.0556X12-
0.0331X32 (4.5)

96
Table 4.3a ANOVA results of the response surface quadratic model on the recovery
of neutralized rice bran oil.
R2 = 0.9520; Adjusted R
2 = 0.8901; Q
2 = 0.5750; p-value<0.05 indicates statistical
significance.
Table 4.3b ANOVA results of the response surface quadratic model on FFA of
neutralized rice bran oil.
FFA Degree of
freedom
Sum of
squares
Mean square F-value p-value
Total Corrected 16 0.6008 0.0376
Regression 9 0.5862 0.0652 31.059 0.0000
Residual 7 0.0147 0.0021
Lack of Fit 5 0.0134 0.0027 4.235 0.2020
Pure Error 2 0.0013 0.0006
R2 = 0.9760; Adjusted R
2 = 0.9440; Q
2 = 0.8630; p-value<0.05 indicates statistical
significance.
Oil yield Degree of
freedom
Sum of
squares
Mean
square
F-value p-value
Total Corrected 16 2.1797 0.1362
Regression 9 2.0744 0.2305 15.3227 0.0010
Residual 7 0.1053 0.0150
Lack of Fit 5 0.1022 0.0205 13.4089 0.0760
Pure Error 2 0.0031 0.0016

97
Table 4.3c ANOVA results of the response surface quadratic model on gamma-
oryzanol of neutralized rice bran oil.
Gamma-oryzanol level Degree of
freedom
Sum of
squares
Mean
square
F-value p-value
Total Corrected 16 0.4635 0.0289
Regression 9 0.4578 0.0509 63.25 0.000
Residual 7 0.0056 0.0008
Lack of Fit 5 0.0041 0.0008 1.0848 0.5700
Pure Error 2 0.0015 0.0008
R2 = 0.9870; Adjusted R
2 = 0.9710; Q
2 = 0.8260; p-value<0.05 indicates statistical
significance.
Table 4.4 Regression coefficients and p-values for the recovery of neutralized rice
bran oil after backward elimination.
1 X1, X2, and X3 denote NaOH concentration (°Be), temperature (°C), and time (min),
respectively.
2 p<0.05 indicates statistical significance
Source 1
Regression coefficients p-value 2
Constant 79.988 0.0000
X1 -0.2577 0.0010
X2 0.1652 0.0010
X1*X2 0.0911 0.0120
X1*X3 0.0775 0.0261
X12 -0.1310 0.0266
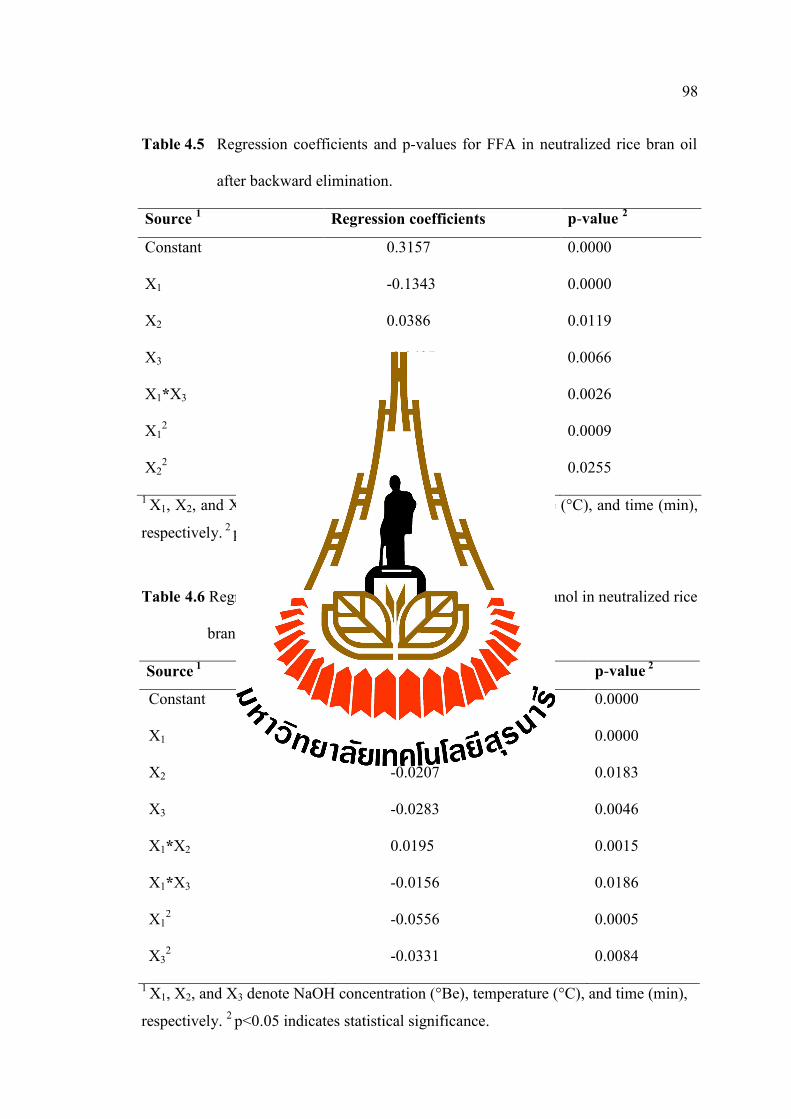
98
Table 4.5 Regression coefficients and p-values for FFA in neutralized rice bran oil
after backward elimination.
Source 1 Regression coefficients p-value
2
Constant 0.3157 0.0000
X1 -0.1343 0.0000
X2 0.0386 0.0119
X3 -0.0437 0.0066
X1*X3 -0.0462 0.0026
X12 0.0967 0.0009
X22 0.0493 0.0255
1 X1, X2, and X3 denote NaOH concentration (°Be), temperature (°C), and time (min),
respectively. 2
p<0.05 indicates statistical significance.
Table 4.6 Regression coefficients and p-values for gamma-oryzanol in neutralized rice
bran oil after backward elimination
Source 1
Regression coefficients p-value 2
Constant 0.9280 0.0000
X1 -0.1462 0.0000
X2 -0.0207 0.0183
X3 -0.0283 0.0046
X1*X2 0.0195 0.0015
X1*X3
-0.0156 0.0186
X12 -0.0556 0.0005
X32 -0.0331 0.0084
1 X1, X2, and X3 denote NaOH concentration (°Be), temperature (°C), and time (min),
respectively. 2 p<0.05 indicates statistical significance.

99
4.5.2 Effect of neutralization parameters on oil recovery
The removal of FFAs causes the loss of neutralized rice bran oil. In the
neutralization process, FFAs are removed as sodium soaps but some neutralized oil is
entrapped in the emulsion and removed during centrifugation. Table 4.4 presents the
effects of neutralization parameters on the oil recovery. The oil recovery was
negatively affected by X1 (NaOH concentration) and X2 (temperature). The linear
terms X1 and X2, the quadratic terms X12, and the interaction terms X1X2, X1X3 had
significant effects on the oil recovery (p<0.05). On the other hand, X3, X22, X3
2, and
X2X3 had no significant effect on the oil recovery (p>0.05).
In Figure 4.1 (A), the maximum oil recovery was achieved under the
NaOH concentration (X1) of 19.25°Be and temperature (X2) of 78.36°C. In Figure 4.1
(B), lower NaOH concentrations (5.0-19.05°Be) and shorter times (5.0-11.28min)
yielded greater oil recovery, while increased NaOH concentrations and time reduced
the oil recovery. Specifically, increased NaOH concentrations accelerated the
formation of rice bran soap and trapped oil, reducing oil discharge (Gunstone et al.,
1994; Casimir, 2003; Sayre et al., 1985). Similar results were also reported on
neutralization of sun flower and soybean oils due to higher alkali-refining loss
(Lasztity, 1999).
In Figure 4.1 (C), the maximum recovery was achieved under 75°C and
10.63 min condition. Specifically, elevated temperatures (from 60 to 90°C) and
extended time (from 5 to 15min) had a positive effect on oil recovery. However, high
temperatures (90ºC) were ineffective in neutralizing FFA, contributing to gamma-
oryzanol loss (Table 4.2). This is consistent with Wei et al. (2015), who documented
that acids value slightly increased while bioactive compounds (sterols, α-

100
tocopherol, and Vitamin D3) were significantly reduced at high neutralization
temperatures (85ºC) after 30min. According to Lee et al. (2014); Chew et al. (2017),
neutralization was normally undertaken between 60-75°C and 10-50min to allow for
the complete reaction of FFA with NaOH solution.
4.5.3 Effect of neutralization parameters on FFA
FFA content is used to determine the edibility and deterioration
of oils and fats. The presence of FFA and other fatty materials in oil led to offensive
odor and taste caused by enzymatic hydrolysis during processing and storage (Chemat
et al., 2004; Oluremi et al., 2013). In this research, the variables that affected the
removal of FFA were the linear terms X1, X2, X3, the quadratic terms X12, X2
2, and the
interaction term X1X3 (Table 4.5).
In Figure 4.2 (A), FFA was reduced from 0.79 to 0.28% when NaOH
concentration (X1) and temperature (X2) were increased to 19.26°Be and 78.36°C,
given X3 of 10min. The neutralization efficiency nevertheless was lowered beyond the
19.26°Be (X1) and 78.36°C (X2) threshold. In Figure 4.2 (B), elevated NaOH
concentrations (X1, from 10 to 19.29°Be) and extended time (X3, from 5 to 11.19min)
decreased FFA to 0.32%. Specifically, NaOH concentrations (X1) had more impact on
the neutralization of rice bran oil. Similar results were reported for neutralization of
kenaf seed oil (Chew et al., 2017) in which excessively low or high levels of NaOH
increased FFA. As a result, the FFA content in neutral oil was lower than that of
CODEX standard (0.4%). In Figure 4.2 (C), higher temperatures (X2) and extended
time (X3) reduced the efficiency of FFA removal.

101
4.5.4 Effect of neutralization parameters on gamma-oryzanol
In Table 4.6, the linear terms X1, X2 and X3, the interaction terms X1X2,
X1X3, and the quadratic terms X12, X3
2 significantly impacted the gamma-oryzanol
content (p<0.05). Specifically, X1 and X3 significantly lowered gamma-oryzanol
content. This is consistent with Engelmann et al. (2017); Gopala Krishna et al. (2001),
who reported that the decrease in gamma-oryzanol was accelerated by increased
NaOH concentrations and process time.
Figure 4.3 (A) illustrates the interaction between X1 and X2 on the
gamma-oryzanol content in NRBO, in which the bioactive decreased significantly
(p<0.05) with increase in X1 (from 15 to 30°Be) and X2 (from 80 to 90°C). The
maximum gamma-oryzanol content was achieved under 19.86°Be (X1) and 78.36°C
(X2) condition. In Figure 4.3 (B), gamma-oryzanol decreased as X2 and X3 increased
from 75.34 to 90°C and 10.62 to 15min, given X1 of 20°Be. Specifically, under higher
temperatures and extended time, gamma-oryzanol in NRBO was reduced. In Figure
4.3 (C), given X2 of 75ºC, the elliptical response surface plot indicated that the
interaction between X1 and X3 was significant (p<0.05). The maximum gamma-
oryzanol content was achieved under 19.51°Be (X1) and 11.18min (X3) condition.
4.5.5 Optimization of the neutralization parameters and model validation
Based on the CCF design, the optimal neutralization condition that
achieved high oil recovery and quality was that of 19.24°Be for NaOH concentration
(X1), 74.79°C for temperature (X2), and 11.18min for process time (X3). Under the
optimal condition, the predicted oil recovery, FFA, and gamma-oryzanol were
80.00%, 0.31%, and 1.00%, respectively. Meanwhile, the experimental results for the
oil recovery, FFA, and gamma-oryzanol were 80.12%, 0.29%, and 1.02%. The

102
predicted and experimental data were in good agreement, suggesting that the response
models could be applied to optimizing the RBO neutralization parameters for
enhanced oil yield and quality.
4.5.6 Physiochemical properties and fatty acid profile
Table 4.7 compares the fatty acid profile and physicochemical
properties of CRBO, DRBO, and NRBO under the optimal neutralization condition
(19.24°Be, 74.79°C, and 11.18min). In this study, CRBO was obtained by thermal
cooking followed by cold press extraction. Since CRBO contains impurities,
particularly phospholipids which have unfavorable effects on the flavor and shelf life
of the oil, the compounds were thus removed by degumming (Zufarov et al., 2008).
Fatty acid profile is an important indicator of the nutritive value and
quality of the oil. According to Oluremi et al. (2013); Pena Muniz et al. (2015), high-
quality RBO contains high percentages of unsaturated fatty acids, mainly oleic and
linoleic. In this study, oleic acid (C18:1) and linoleic acid (C18:2) were dominant fatty
acids, followed by palmitic acid (C16:0). In addition, the degumming and
neutralization had minimal impact on the quality of oil in terms of fatty acid
composition. This is consistent with Chew et al., (2017); Karabulut et al., (2005).
The peroxide value, iodine value, free fatty acid (FFA), saponification
value, gamma-oryzanol value, and relative density of DRBO were not significantly
different from those of CRBO (p>0.05). However, Ortega-García et al. (2006)
documented that peroxide value of degummed safflower oil was higher than that of its
crude oil, probably due to the presence of moisture and high temperature (70°C)
during degumming, promoting the primary oxidation compounds. In this study, the
phosphorus value of DRBO (33.59 mg/kg) was drastically decreased, compared with

103
CRBO (318.52 mg/kg) (p<0.05). The finding suggested that citric acid degumming
process at 70°C effectively removed phospholipids from CRBO, consistent with
Smiles et al. (1988); Zufarov et al. (2008). Mei et al. (2013) also reported that the
phosphorus value of Silybum marianum seed oil was reduced by 53.1% after citric
acid degumming. In addition, the melting point of DRBO was lower than CRBO’s.
The presence of impurities (phospholipids, wax, and peroxide) in CRBO contributed
to higher melting point (Taghvaei et al., 2013) .
The peroxide value, FFA, saponification value, gamma-oryzanol
content, phosphorus value, and melting point of NRBO were significantly lower than
those of CRBO and DRBO (p<0.05). In comparison with CRBO, the phosphorus
value, FFA, and gamma-oryzanol of NRBO were reduced by 98.03%, 91.12%, and
44.75%, respectively. The reduction in phosphorus value, FFA, and gamma-oryzanol
was attributable to the formation of soapstock (De at al., 2010; Van Hoed et al., 2006).
The lower saponification value and melting point were probably due to the absence of
impurities in NRBO (Taghvaei at al., 2013). Nevertheless, the neutralization had no
effect on the iodine value and relative density of RBO, consistent with Oluremi et al.
(2013).
Total phenolic contents (TPC) and α-tocopherol were slightly reduced
in degumming and a significant reduction in neutralization of the rice bran oils. The
TPC and α-tocopherol of CRBO and DRBO were 4.39 mg GAE/g oil, 200ppm and
4.35 mg GAE/g oil, 197ppm, respectively whereas NRBO was 3.18 mg GAE/g oil and
130ppm. This reduction was due to the formation of soapstock. Similar results were
reported by for palm oil (Prasanth Kumar and Gopala Krishna, 2014; Czerniak and
Łaszewska, 2015), and olive oil (Nergiz, 1993). Nergiz. (1993) reported that some

104
bioactive compounds of oil (i.e., phenolic compounds and α-tocopherol) were almost
destroyed during neutralization refining (95.01 mg/L to 64.03 mg/L). According to
Prasanth Kumar and Gopala Krishna. (2014); Čmolík et al. (2000) the decline of α-
tocopherol may be due to the fact that α-tocopherol is unstable in the presence of
longer contact time with air and alkali.
During the degumming and neutralization process, chlorophyll, waxes,
and phospholipids decomposes and is absorbed through soapstock which increase the
bright oil colored (Sabah, 2007). The NRBO had the high lightness (L*) values
(23.12±0.15) (p<0.05), wheares CRBO and DRBO had a low L* value (22.59±0.05
and 22.79±0.11). The L* parameter color value obtained indicates that CRBO is
darker than NRBO. The NRBO possess the highest yellow (b*) value (4.91±0.16)
(p<0.05), while there was non-significant changes in a* value, which related to tonality
of color (from red to greenness) of DRBO and NRBO in comparison with CRBO. The
results obtained are quite similar with previous research in other type of oil ((Lamas et
al., 2016; Lamas et al., 2016).
4.6 Conclusions
Nowadays, market competition is forcing the oil producers to optimize the
refining process for reducing oil loss and quality. Thus, this research investigated the
effect of neutralization parameters on the oil recovery (Y1), FFA level (Y2), and
gamma-oryzanol content (Y3) of neutralized rice bran oil, using response surface
methodology (RSM) with central composite face-centered design. The quadratic RSM
models were generated and statistical analysis performed to give an insight the effects
of processing parameters. The ANOVA results showed that regression models were
statistically good with a significance level of p<0.0001 and the model had no

105
significant lack of fit (p>0.05). Therefore, the well-fitting model was successfully
generated with a good predictor of all experimental results. The optimal condition for
chemical neutralization was 19.24°Be, 74.79°C, and 11.18min. The predicted and
experimental results were agreeable in which the predicted oil recovery, FFA level,
and gamma-oryzanol were 80.00%, 0.31%, and 1.00% under the optimal condition,
while the corresponding experimental results were 80.12%, 0.29%, and 1.02%. The
findings verified high predictive ability of the response models and thus could be
deployed for optimization of rice bran oil neutralization parameters to enhance the oil
yield and quality.
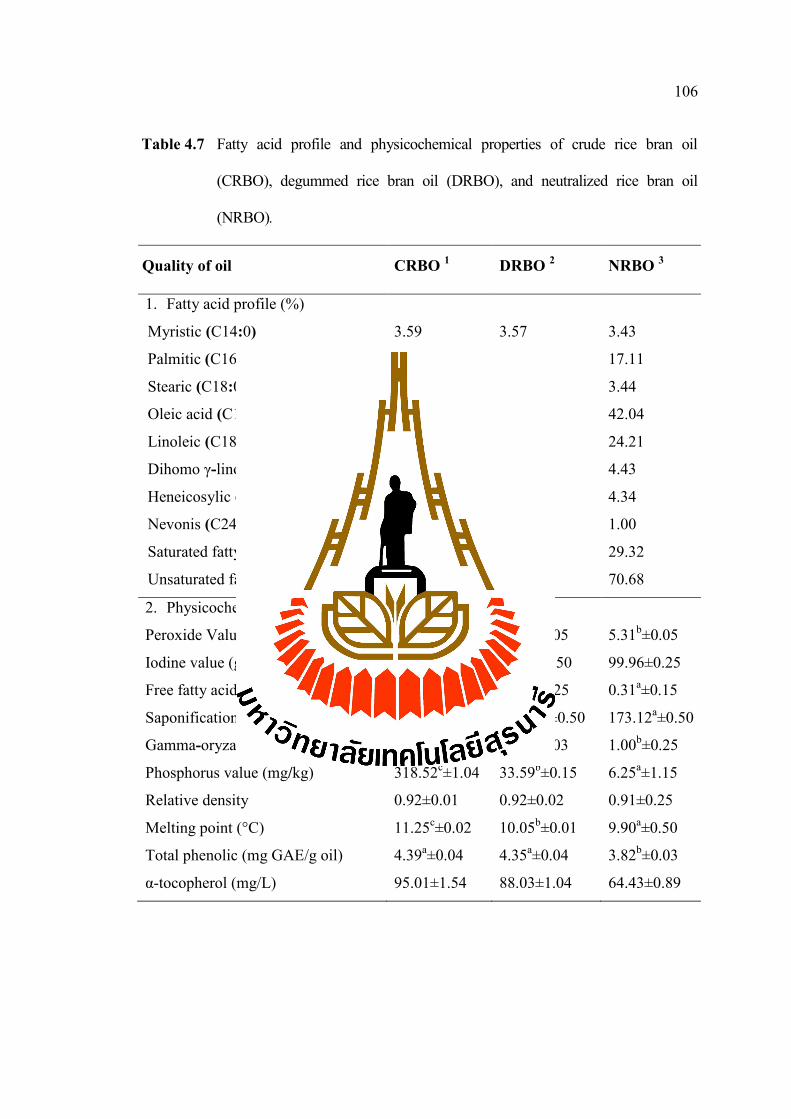
106
Table 4.7 Fatty acid profile and physicochemical properties of crude rice bran oil
(CRBO), degummed rice bran oil (DRBO), and neutralized rice bran oil
(NRBO).
Quality of oil CRBO 1 DRBO
2 NRBO
3
1. Fatty acid profile (%)
Myristic (C14:0) 3.59 3.57 3.43
Palmitic (C16:0) 16.75 16.51 17.11
Stearic (C18:0) 3.45 3.58 3.44
Oleic acid (C18:1) 41.91 41.59 42.04
Linoleic (C18:2) 24.19 24.49 24.21
Dihomo γ-linolenic (C20:3) 4.59 4.46 4.43
Heneicosylic (C21:0) 4.52 4.62 4.34
Nevonis (C24:0) 1.00 1.10 1.00
Saturated fatty acid 29.31
29.38
29.32
Unsaturated fatty acid 70.69 70.62 70.68
2. Physicochemical properties
Peroxide Value (meqO2/kg) 5.27a±0.03 5.29
a±0.05 5.31
b±0.05
Iodine value (g I2/100g) 99.98±1.22 99.72±0.50 99.96±0.25
Free fatty acid (%oleic acid) 4.44b±0.05 4.37
b±0.25 0.31
a±0.15
Saponification value (mgKOH/g oil) 176.98b±0.98 176.68
b±0.50 173.12
a±0.50
Gamma-oryzanol value (%) 1.81a±0.02 1.80
a±0.03 1.00
b±0.25
Phosphorus value (mg/kg) 318.52c±1.04 33.59
b±0.15 6.25
a±1.15
Relative density 0.92±0.01 0.92±0.02 0.91±0.25
Melting point (°C) 11.25c±0.02 10.05
b±0.01 9.90
a±0.50
Total phenolic (mg GAE/g oil) 4.39a±0.04 4.35
a±0.04 3.82
b±0.03
α-tocopherol (mg/L) 95.01±1.54 88.03±1.04 64.43±0.89

107
Table 4.7 Fatty acid profile and physicochemical properties of crude rice bran oil
(CRBO), degummed rice bran oil (DRBO), and neutralized rice bran oil
(NRBO) (Continue).
Quality of oil CRBO 1 DRBO
2 NRBO
3
3. Color of rice bran oil
L* 22.59
c±0.05 22.78
b±0.11 23.12
a±0.15
a* 4.23
b±0.11 4.13
a±0.09 4.15
a±0.10
b* 3.53
c±0.10 4.86
b±0.12 4.91
a±0.16
1,2,3 Different letters in each row of physicochemical properties denote statistically
significant differences between treatments (p<0.05). The values are mean of three
replications ± standard deviation.
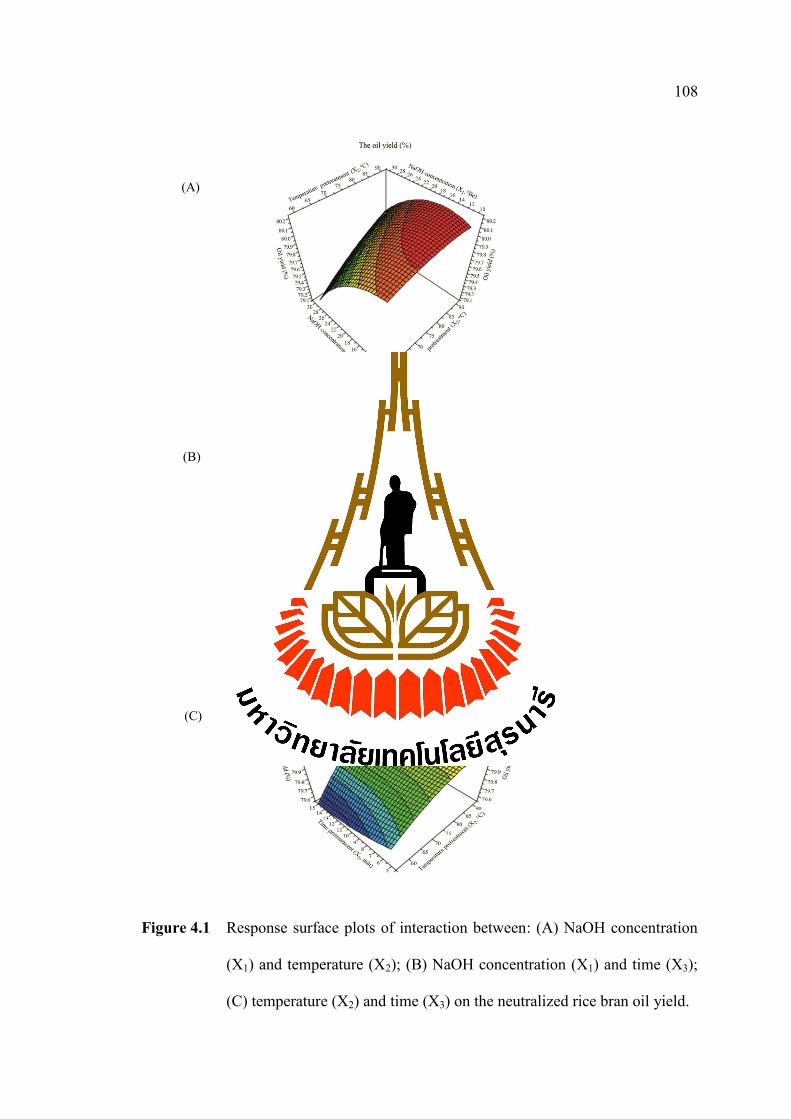
108
Figure 4.1 Response surface plots of interaction between: (A) NaOH concentration
(X1) and temperature (X2); (B) NaOH concentration (X1) and time (X3);
(C) temperature (X2) and time (X3) on the neutralized rice bran oil yield.
(A)
(B)
(C)

109
Figure 4.2 Response surface plots of interaction between: (A) NaOH concentration
(X1) and temperature (X2); (B) NaOH concentration (X1) and time (X3);
(C) temperature (X2) and time (X3) on the FFA of neutralized rice bran oil.
(A)
(B)
(C)
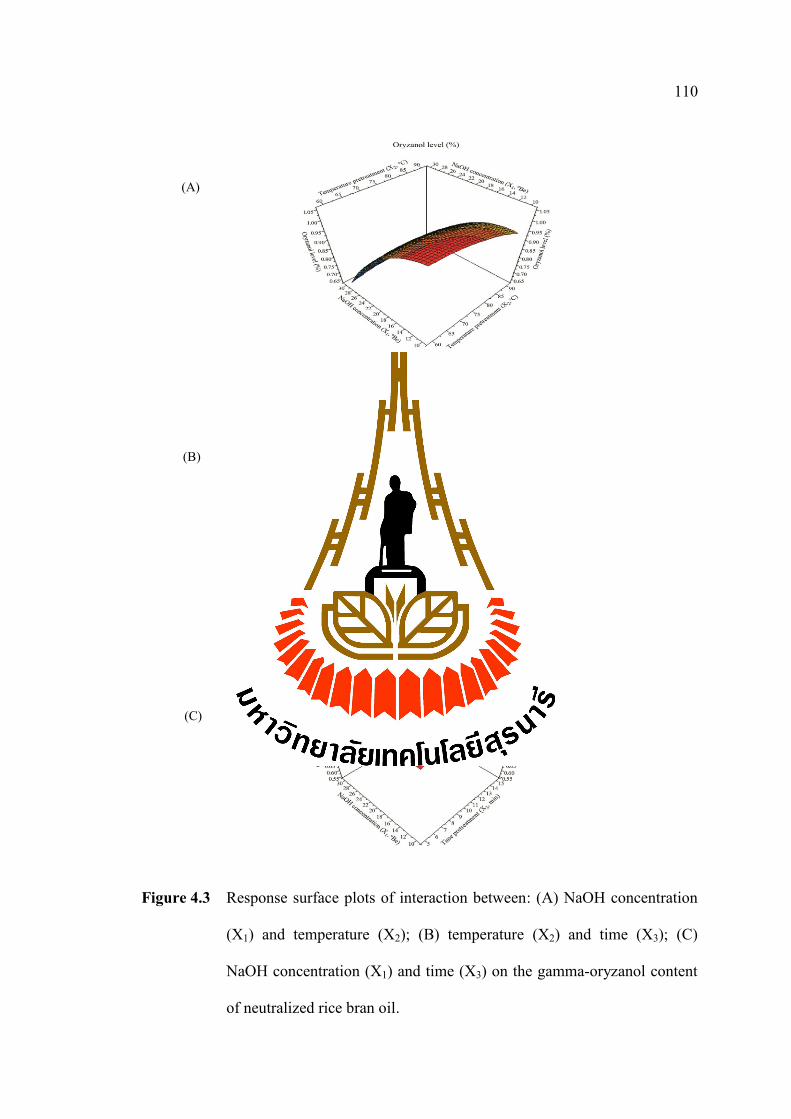
110
Figure 4.3 Response surface plots of interaction between: (A) NaOH concentration
(X1) and temperature (X2); (B) temperature (X2) and time (X3); (C)
NaOH concentration (X1) and time (X3) on the gamma-oryzanol content
of neutralized rice bran oil.
(A)
(B)
(C)

111
4.7 References
Amarasinghe, B. M. W. P. K., Gangodavilage, N. C., and Rao, T. (2004). Data for
Process Equipment Design. J. Amer. Oil Chem. Soc. 82: 54-59.
Casimir C. Akoh, D. B. M. (2003). Application of structured lipid in emulsions. In:
Lipid. Hannah, T. O., and Casimir C. Akoh, D. B. M., (ed). CRC press, NY,
210-225 p.
Chemat, F., Grondin, I., Costes, P., Moutoussamy, L., Sing, A. S. C., and Smadja, J.
(2004). High power ultrasound effects on lipid oxidation of refined sunflower
oil. Ultr. Sonochem. 11(5): 281-285.
Chew, S. C., Tan, C. P., and Nyam, K. L. (2017). Optimization of neutralization
parameters in chemical refining of kenaf seed oil by response surface
methodology. Industrial Crops and Products. 95: 742-750.
Chumsantea, S., Aryusuk, K., Lilitchan, S., Jeyashoke, N., and Krisnangkura, K.
(2012). Reducing oil losses in alkali refining. J. Amer. Oil Chem. Soc. 89(10):
1913-1919.
CODEX ALIMENTARIUS for Fats & Oils. (2015). Agenda Item 5 Joint FAO/ Food
standards programme CODEX committes on fats and oils, Nine- teenth Session
London, United Kingdom, February 21-25, 2015 A. Proposed Draft
Amendment to the Standard for Named Vegetable Oils (Rice Bran Oil:
Prepared by Agenda).
Das, P. K., Chaudhuri, A., Kaimal, T. N. B., and Bhalerao, U. T. (1998). Isolation of
γ-Oryzanol through Calcium Ion Induced Precipitation of Anionic Micellar
Aggregates. J. Agri. and Food Chem. 46(8): 3073-3080.

112
De, B. K., and Bhattacharyya, D. K. (1998). Physical refining of rice bran oil in
relation to degumming and dewaxing. J. Amer. Oil Chem. Soc. 75(11): 1683-
1686.
De, B. K., and Patel, J. D. (2010). Effect of different degumming processes and some
nontraditional neutralizing agent on refining of RBO. J. Oleo Sci. 59(3): 121-
125.
De, B. K., and Patel, J. D. (2011). Refining of rice bran oil by neutralization with
calcium hydroxide. European J. Lipid Sci. and Technol. 113(9): 1161-1167.
Engelmann, J. I., Ramos, L. P., Crexi, V. T., and Morais, M. M. (2017). Degumming
and neutralization of rice bran oil. J. Food Process Eng. 40(2): 1-10.
Ghasemzadeh, A., Jaafar, H. Z. E., Juraimi, A. S., and Tayebi-Meigooni, A. (2015).
Comparative evaluation of different extraction techniques and solvents for the
assay of phytochemicals and antioxidant activity of hashemi rice bran.
Molecules. 20(6): 10822-10838.
Gopala Krishna, A. G., Khatoon, S., Shiela, P. M., Sarmandal, C. V., Indira, T. N., and
Mishra, A. (2001). Effect of refining of crude rice bran oil on the retention of
oryzanol in the refined oil. J. Amer. Oil Chem. Soc. 78(2): 127-131.
Grundy, S. M. (1975). Effects of polyunsaturated fats on lipid metabolism in patients
with hypertriglyceridemia. J. Clinical Invest. 55(2): 269-282.
Gunstone, F.D. (2011). Occurrence and characterisation of oils and fats. In: Vegetable
Oils in Food Technology. Gunstone, F.D., and Hardwood. J.L., (eds).
Blackwell Publishing, NY, p. 37-141.
Hoed, V. Van, Depaemelaere, G., Ayala, J. V. V., Santiwattana, P., Verhe, R., and
Greyt, W. De. (2006). Influence of chemical refining on the major and minor

113
components of rice bran oil. J. Amer. Oil Chem. Soc. 83(4): 315-321.
Gopalakrishna, I, A. M., and Prabhakar, J. V. (1988). and Factors Affecting Refining
Losses in Rice (Oryza sativa L.) Bran Oil. J. Amer. Oil Chem. Soc. 85: 1605-
09.
Joshi, M., Kaur, R., Kanwar, P., Dhiman, G., Sharma, G., Lata, S., Mishra, T. (2016).
To evaluate antioxidant activity of gamma-oryzanol extracted from rice bran
oil. Int. J. Life Sc. And Pharma Research. 6(3): 17-25.
Jung, T. D., Shin, G. H., Kim, J. M., Choi, S. Il, Lee, J. H., Lee, S. J., Lee, O. H.
(2017). Comparative analysis of gamma-oryzanol, β-glucan, total phenolic
content and antioxidant activity in fermented rice bran of different varieties.
Nutrients. 9(6): 1-12.
Karabulut, I., Topcu, A., Yorulmaz, A., Tekin, A., and Ozay, D. S. (2005). Effects of
the industrial refining process on some properties of hazelnut oil. European J.
Lipid Sci. and Technol. 107(8): 476-480.
Kövari, K., Denise, J., Kemény, Z., and Recseg, K. (2000). Physical refining of
sunflower oil. Oleagin. Corps Gras Lipides. 7(4): 305-308.
Lee, S. Y., Jung, M. Y., and Yoon, S. H. (2014). Optimization of the refining process of
camellia seed oil for edible purposes. Food Sci. and Biotechnol. 23(1): 65-73.
Lerma-García, M. J., Herrero-Martínez, J. M., Simó-Alfonso, E. F., Mendonça, C. R.
B., and Ramis-Ramos, G. (2009). Composition, industrial processing and
applications of rice bran gamma-oryzanol. Food Chem. 115(2): 389-404.
Wen, S. Lv, Sun, L. H., Zhao, S. Y., and Bao, Y. M. (2017). Effect of dry heat
stabilisation on the functional properties of rice bran proteins. Int. J. Food
Scie. and Technol. 52(8): 1836-1843.

114
Makanjuola, S. A., Enujiugha, V. N., Omoba, O. S., and Sanni, D. M. (2015).
Optimization and prediction of antioxidant properties of a tea-ginger extract,
Int. J. Food Scie. and Technol. 13(4): 443-452.
Mei, L., Wang, L., Li, Q., Yu, J., and Xu, X. (2013). Comparison of acid degumming
and enzymatic degumming process for Silybum marianum seed oil. J. Scie
of.Food and Agr. 93(11): 2822-2828.
Official Methods and Recommended Practices. (1989). AOCS Press, Champaign, IL,
Official method Cd 1b-87, Ca 5a-40, Ca 12-55, Aa 516-01, Cd 3a-94.
Oluremi, O. I., Solomon, A. O., and Saheed, A. A. (2013). Fatty acids, metal
composition and physico-chemical parameters of Igbemo Ekiti rice bran oil. J.
Environ.hem. and Ecotoxic. 5: 39-46.
Ortega-García, J., Gámez-Meza, N., Noriega-Rodriguez, J. A., Dennis-Quiñonez, O.,
García-Galindo, H. S., Angulo-Guerrero, J. O., and Medina-Juárez, L. A.
(2006). Refining of high oleic safflower oil: Effect on the sterols and
tocopherols content. European Food Res. and Technol. 223(6): 775-779.
Pena Muniz, M., Ferreira dos Santos, M., da Costa, C. E., Morais, L., Lamarão, M. N.,
Ribeiro-Costa, R., and Silva, J. O. (2015). Physicochemical characterization,
fatty acid composition, and thermal analysis of Bertholletia excelsa HBK oil.
Pharmacognosy Magazine. 11(41): 147-155.
Phan, V.M., Junyusen, T., Liplap, P., and Junyusen, P. (2018). Effects of
ultrasonication and thermal cooking pretreatments on the extractability and
quality of cold press extracted rice bran oil. J. Food Process Eng. 42(2): 1-8.
Quanhong, L., and Caili, F. (2005). Application of response surface methodology for
extraction optimization of germinant pumpkin seeds protein. Food Chem. 92
115
(4): 701-706.
Rajam, L., Kumar, D. R. S., Sundaresan, A., and Arumughan, C. (2005). A novel
process for physically refining rice bran oil through simultaneous degumming
and dewaxing. J. Amer. Oil Chem. Soci. 82(3): 213-220.
Ringers, H. J. (1977). Degumming process for triglyceride. United States Patent,
US4,049,686, p. 1-4.
Kady El, Gawwad El, Kassemi, R. Lasztity, and M. Hamedi., (1999). Effect of
refining on the physical and chemical properties of sunflower. J. Amer. Oil
Chem. Soci. 97: 513-517.
Samaram, S., Mirhosseini, H., Tan, C. P., and Ghazali, H. M. (2014). Ultrasound-
assisted extraction and solvent extraction of papaya seed oil: Crystallization
and thermal behavior, saturation degree, color and oxidative stability.
Industrial Crops and Products. 52: 702-708.
Seetharamaiah, G. S., and Prabhakar, J. V. (1986). Oryzanol Content of Indian Rice
Bran Oil and Its Extraction from Soap Stock. J. Food Scie. and Technol. 23:
270-273.
Sharma, R. D., and Rukmini, C. (1986). Rice bran oil and hypocholesterolemia in rats.
Lipids. 21(11): 715-717.
Smiles, A., Kakuda, Y., and MacDonald, B. E. (1988). Effect of degumming reagents
on the recovery and nature of lecithins from crude canola, soybean and
sunflower oils. J. Amer. Oil Chem. Soci. 65(7): 1151-1155.
Stanisavljević, I. T., Velič Ković, D. T., Todorović, Z. B., Lazić, M. L., and Veljković,
V. B. (2009). Comparison of techniques for the extraction of tobacco seed oil.
European J. Lipid Scie. and Technol. 111(5): 513-518.
116
Taghvaei, M., and Jafari, S. M. (2015). Application and stability of natural
antioxidants in edible oils in order to substitute synthetic additives. J. Food
Scie. and Technol. 52(3): 1272-1282.
Taghvaei, M., Jafari, S. M., Nowrouzieh, S., and Alishah, O. (2013). The influence of
cooking process on the microwave-assisted extraction of cottonseed oil. J.
Food Sci. and Technol. 52(2): 1138-1144.
Tandy, D. C., Mcpherson, W. J., and Plaines, D. (1984). Physical refining of edible
oil. Springer Berlin Heidelberg. 61(7): 1253-1259.
Van Hoed, V., Ayala, J. V., Czarnowska, M., De Greyt, W., and Verhé, R. (2010).
Optimization of physical refining to produce rice bran oil with light color and
high oryzanol content. J. Amer. Oil Chem. Soci. 87(10): 1227-1234.
Veerasamy, R., Rajak, H., Jain, A., Sivadasan, S., Varghese, C. P., and Agrawal, R. K.
(2011). Validation of QSAR models-strategies and importance. Inter. J. Drug
Design and Disocovery. 2(3): 511-519.
Wang, T., and Johnson, L. A. (2001). Refining high-free fatty acid wheat germ oil.
JAOCS, J. Amer. Oil Chem. Soci. 78(1): 71-76.
Wei, J., Chen, L., Qiu, X., Hu, W., Sun, H., Chen, X., Shen, G. (2015). Optimizing
refining temperatures to reduce the loss of essential fatty acids and bioactive
compounds in tea seed oil. Food and Bioproducts Process. 94: 136-146.
Wilson, T. A., Nicolosi, R. J., Woolfrey, B., and Kritchevsky, D. (2007). Rice bran oil
and oryzanol reduce plasma lipid and lipoprotein cholesterol concentrations
and aortic cholesterol ester accumulation to a greater extent than ferulic acid in
hypercholesterolemic hamsters. J. Nutrit. Biochem. 18(2): 105-112.

117
Yolmeh, M., Habibi Najafi, M. B., and Farhoosh, R. (2014). Optimisation of
ultrasound-assisted extraction of natural pigment from annatto seeds by
response surface methodology (RSM). Food Chem. 155: 319-324.
Zufarov, O., Schmidt, Š., and Sekretár, S. (2008). Degumming of rapeseed and
sunflower oils. Acta Chimica Slovaca. 15(1): 321-328.

CHAPTER V
OPTIMIZATION OF PROCESS PARAMETERS AND KINETIC
MODEL OF ULTRASOUND ASSISTED SOLVENT EXTRACTION
GAMMA-ORYZANOL FROM DRIED RICE BRAN SOAPSTOCK
5.1 Abstract
Gamma-oryzanol extraction from dried rice bran soapstock (DRBS) was
performed using the ultrasound assisted solvent extraction (UASE) technique with a
mixture solvent of ethyl acetate and ethanol. Response surface methodology (RSM)
with a face-centered composite design (FCCD) was used to investigate the optimal
extraction conditions including ultrasound power (X1) (0.5-4.5 W/g), temperature (X2)
(35-55ºC), and extraction time (X3) (4-26min). The quadratic response model was
generated and statistical analysis performed to validate the model. The maximum
gamma-oryzanol recovery was found to be 98.03% at the optimal extraction
conditions of 4.0 W/g, 50.0ºC, and 21.5min. The predicted value of gamma-oryzanol
recovery was 98.15%, suggesting in good agreement with the experimental data. In
addition, the extraction experiments were performed for describing the kinetics
behavior of UASE of gamma-oryzanol from the DRBS under selected conditions and
results were well correlated using a second-order kinetic model. The theoretical
gamma-oryzanol concentration at saturation (Cs), extraction rate constant (k), and
119
initial rate of extraction (h) at various ultrasound powers and temperatures ranging
from 0.5-4.5 W/g and 35-55ºC, respectively, and extraction time of 21.5 min were
determined. The obtained results from the predicted models were consistent with
experimental value (R2>0.97) and suggesting that the high ultrasound power and
moderate temperature provided a best performance on gamma-oryzanol extraction. In
addition, sonication time of 21.5min was sufficient to obtain the maximum gamma-
oryzanol recovery.
Keywords: Optimization, gamma-oryzanol, rice bran soapstock, response surface
methodology, kinetic model.
5.2 Introduction
Rice bran oil is an excellent source of essential nutrients, including fatty acids,
vitamin E (tocopherols and tocotrienols), vitamin K, and gamma-oryzanol (Lerma-
García et al., 2009; Patel and Naik, 2004; Pestana-Baueret al., 2012; Gunstone, 2011).
In particular, gamma-oryzanol helps reduce plasma cholesterol (Wilsonet et al., 2007),
platelet aggregation, and cholesterol absorption (Sharma and Rukmini, 1986).
Gamma-oryzanol is also used in cosmetic products for its anti-itching and anti-
dandruff properties (Seetharamaiah and Prabhakar, 1986).
However, rice bran oil in crude form is high in free fatty acids (FFA) and wax
(Gunstone, 2011), requiring chemical refining (i.e., degumming, neutralization,
bleaching, and deodorization) to remove the undesirable compounds. Specifically,
chemical neutralization removes FFA by using aqueous sodium hydroxide (NaOH) to
form soapstock, trapping neutralized rice bran oil and gamma-oryzanol. According
Gopala Krishna et al. (2001), nearly 90% of gamma-oryzanol loss occurred through
wet soapstock.
120
At present, soapstock is mostly converted into toiletry and detergent products
(Narayan et al., 2006), feedstock (Ju and Vali, 2005), and lecithin products (Thurman,
1961). In fact, gamma-oryzanol present in rice bran soapstock holds promising
potential for commercial-scale production (Narayan et al., 2006). Thus, several
authors focused their attention on gamma-oryzanol extraction from rice bran
soapstock. In 2009, Kumar et al. investigated the extraction of gamma-oryzanol from
dried rice bran soapstock using various solvents (ethyl acetate, ethyl methyl ketone,
hexane, acetone, and isopropanol) assisted by conventional extraction. The authors
recognized ethyl acetate was most suited for gamma-oryzanol extraction (97-99%
yield under 6 hour extraction) probably due to low polarity and viscosity of this
solvent. In 2010, Kaewboonnum et al. also extracted gamma-oryzanol from rice bran
soapstock using ethyl acetate because of the most suitable extraction solvent. Even
though ethyl acetate is accepted to use in food and pharmaceutical due to its low
toxicity, ethanol is used as a nontoxic and an ecologically-friendlier replacement to
extract vegetable oil and antioxidant compounds (Franco et al., 2009; Moreau and
Hicks, 2005). Interestingly, there is no study on gamma-oryzanol extraction from rice
bran soapstock using a mixture of ethyl acetate and ethanol as solvent extraction.
Therefore, in this study the possibility of replacing ethyl acetate with ethanol to be a
mixture solvent for gamma-oryzanol extraction from the DRBS was investigated.
Conventional extraction technique is time-consuming. Thus, it is necessary to
find a novel technique for extracting gamma-oryzanol economically. Ultrasound
assisted extraction is one of the most promising alternative extraction method because
of the advantages of lower process temperatures and extraction time, ease of operation,
and high efficiency (Zhang, Yang, and Wang, 2011; Gayas and Kaur, 2017). The
difference between ultrasound assisted extraction and conventional solvent extraction
121
method is here mechanical cavitation and thermal effects. Specifically, mechanical
cavitation can produce physical effects (liquid turbulence and liquid circulation)
which accelerated diffusion of solvent in particles, disrupted of cell wall, and
enhanced the mass transfer efficiency of target compounds in the solvent, and thus
increase extraction yield. (Vetal, Lade, and Rathod, 2013). Although the previous
studies have sucessfully extracted gamma-oryzanol from rice bran soapstock using
conventional solvent extration (Venkatadri and Sreesaila, 2005; Kumar et al., 2009;
Seetharamaiah and Prabhakar, 1986; Kaewboonnum et al., 2010), the advanced
technique such as ultrasound assisted extraction has not been applied.
The extraction efficiency of the gamma-oryzanol is closely related to the
UASE operating parameters, these factors having as well a high influence on its
kinetics. Kinetic studies help in understanding various factors that affected to the
extraction process. Nowadays, many kinetic models of solid-liquid extraction for oil
and polyphenols from natural sources were carried out such as the second-order
kinetic model (Lazar et al., 2016; Rakotondramasy-Rabesiakaet al., 2009), Fick’s
second law (Petrović et al., 2012), film theory (Bora et al., 2008), or Peleg’s model
(Jesus et al., 2010). However, the second-order kinetic model of ultrasound assisted
gamma-oryzanol extraction using a mixture solvent is still not well evaluated.
Thus, this research aims to investigate the effect of ultrasound assisted solvent
extraction, using a mixture of ethanol and ethyl acetate, on gamma-oryzanol recovery
from dried rice bran soapstock. Response surface methodology (RSM), specifically
face-centered composite design (FCCD), was used for optimize the extraction
conditions considering the effective variables of ultrasound power, temperature, and
time on the maximum yield of gamma-oryzanol. In this study, ultrasound power was
varied between 0.5, 2.5, and 4.5 W/g, extraction temperature between 35, 45, and
122
55ºC, and extraction time between 4, 15, and 26min. In addition, a second-order
kinetic model was used to study the kinetics of the UASE of gamma-oryzanol under
selected conditions.
5.3 Objectives
This study was designed to investigate the effect of ultrasound assisted solvent
extraction on the gamma-oryzanol recovery.
5.4 Materials and Methods
5.4.1 Materials
Rice bran oil wet soapstock was first pretreated following Venkatadri
and Sreesaila (2005), whereby 1.25%wt NaOH solution was added and reacted at
80°C for 15-30min with constant stirring until the moisture content was 55.0%. The
soapstock was then centrifuged and decanted prior to dehydration in vacuum
evaporator (100ºC, 550mmHg) for 2-3 hours to obtain dried rice bran soapstock
(DRBS) with 4.0-4.5% moisture content and used as the starting material for
extraction.
Methanol (Mallinckrodt), n-hexane, ethanol (<98.5%), and ethyl
acetate absolute value (99.5%) were from Sigma-Aldrich (Darmstadt, Germany), and
NaOH anhydrous pellets (98%) from Carlo Erba reagent (Burkina Faso, France).
5.4.2 Experimental methods
5.4.2.1 Soxhlet extraction (SE)
A 20 g DRBS in thimbles was extracted with ethyl acetate at
90ºC for 4 hours (Kaewboonnum et al., 2010) with a solvent to solid ratio of 10:1
(Kumar et al., 2009). Gamma-oryzanol rich fraction was then centrifuged at 10,000

123
rpm and 10ºC for 10min to remove solids, and the solvent vacuum-evaporated (55°C,
500 mmHg) to dryness. The resulting gamma-oryzanol content was 4.41±0.21 g/100 g
DRBS (control 1).
5.4.2.2 Gamma-oryzanol extraction by mixed solvent extraction
A 20 g DRBS was extracted by a mixture of ethanol in ethyl
acetate (MEE), where ethanol content was varied between 5%, 10%, 15%, 20%, and
25%. The solvent to solid ratio was 10:1 (Kumar et al., 2009), and the extraction was
carried out at 90ºC for 4 hours. Gamma-oryzanol rich fraction was then centrifuged
and the solvent evaporated. The optimal ethanol content in MEE provided a maximum
gamma-oryzanol recovery was used as a control 2.
5.4.2.3 Ultrasound assisted solvent extraction
An ultrasonic generator with 40 kHz operating frequency and
750 W ultrasonic power (VCX750 Vibracell; Sonic and Materials, Inc., Newtown,
CT, USA) was used in ultrasound assisted solvent extraction (UASE). In extraction,
20 g DRBS in 500 mL flask was mixed with 200 mL MEE at optimal ethanol
concentration. The mixtures were ultrasound-treated, given the ultrasound power (X1)
of 0.5-4.5 W/g, extraction temperature (X2) of 35-55ºC, and sonication time (X3) of 4-
26min, with 5 s pulse duration. Gamma-oryzanol rich fraction was then centrifuged at
10,000 rpm for 10 min, and vacuum-evaporated (55°C, 500 mmHg) to dryness. The
gamma-oryzanol recovery was determined in relation to control 2, as expressed in Eq. 1:
- recover (%) = eight of recovered -
ontrol ( )

124
5.4.2.4 Experimental design for gamma-oryzanol extraction from
dried rice bran soapstock
A face-centered composite (FCCD) design was used in the
implementation of response surface methodology (RSM) to optimize the extraction
parameters, using MODDE version 5.0. The extraction parameters (independent
variables) included ultrasound power (X1), extraction temperature (X2), and sonication
time (X3), and each parameter was varied between low, moderate, and high, coded -1,
0, and +1, respectively (Table 5.1). In Table 5.2, the design of experiment consisted of
17 experimental runs in 3 replicates, and the response (Y) were averages.
Table 5.1 Extraction parameters (independent variables) of the face-centered central
composite design (FCCD).
Symbol Variables Levels
-1 0 +1
X1 Ultrasound power (W/g) 0.5 2.5 4.5
X2 Extraction temperature (ºC) 4 15 26
X3 Sonication time (min) 35 45 55
A second order polynomial model was applied to predict the gamma-oryzanol
recovery: (Y)
𝑓(𝑌) 0 ∑ 1
∑ 2 ∑ ∑
𝑘
𝑗
𝑘 1
𝑖
𝑘
𝑛 1 (5.2)
where 𝑌 is the predicted response; 𝛽0 is a constant; Xi and Xj are independent
variables, 𝛽i and 𝛽ij are the linear coefficients, and cross coefficients; 𝛽ii is the
125
quadratic coefficients. The model adequacy was evaluated by lack of fit, F-test, and
coefficient of determination (R2) by analysis of variance (ANOVA) that was
generated by MODDE version 5.0. Model validation was subsequently carried out.
The statistical difference was at 5% significance level (p<0.05).
5.4.2.5 Kinetic model of ultrasound assisted solvent extraction
A deeper analysis of ultrasound powers and extraction
temperatures of gamma-oryzanol yield were investigated by the study of kinetic of
extraction. The second-order kinetic model was applied to determine the kinetic
parameters following Lazar et al. (2016) method. The experimental tests included: (i)
ultrasound powers (0.5, 2.5, and 4.5 W/g), carrying on the extraction temperature up
to 45ºC; (ii) temperatures (35°C, 45°C, and 55°C), employing the ultrasound at 2.5
W/g. Mixture of ethyl acetate and ethanol at 85:15 (v/v) was used as an extraction
solvent. The experiments were performed at sonication time from 0-21.5min.
According to Lazar et al. (2016), the rate of dissolution of
gamma-oryzanol extraction from the DRBS can be described by the second-order
model as shown in Eq. 3.
𝑑𝐶𝑡
𝑑𝑡 𝑘(𝐶𝑠 𝐶𝑡)
2 (5.3)
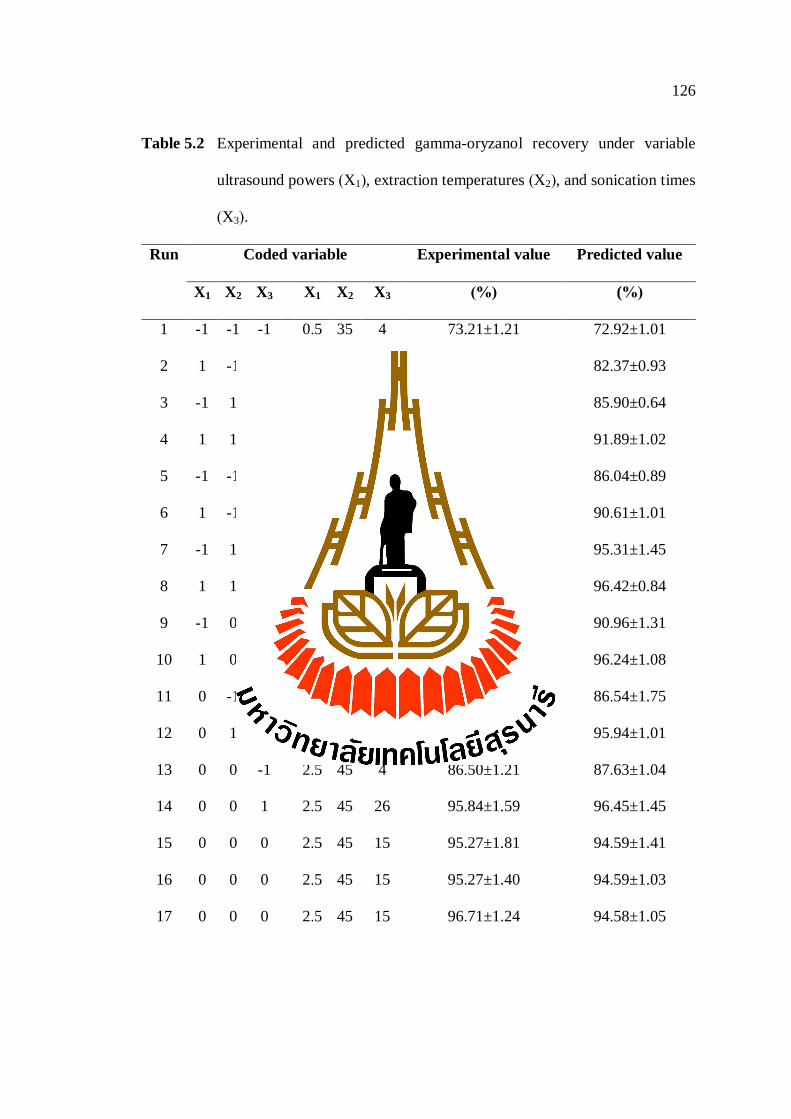
126
Table 5.2 Experimental and predicted gamma-oryzanol recovery under variable
ultrasound powers (X1), extraction temperatures (X2), and sonication times
(X3).
Run Coded variable
Experimental value Predicted value
X1 X2 X3 X1 X2 X3 (%) (%)
1 -1 -1 -1 0.5 35 4 73.21±1.21 72.92±1.01
2 1 -1 -1 4.5 35 4 82.89±0.95 82.37±0.93
3 -1 1 -1 0.5 55 4 86.12±1.04 85.90±0.64
4 1 1 -1 4.5 55 4 91.99±1.45 91.89±1.02
5 -1 -1 1 0.5 35 26 86.37±1.00 86.04±0.89
6 1 -1 1 4.5 35 26 90.82±1.34 90.61±1.01
7 -1 1 1 0.5 55 26 95.56±1.61 95.31±1.45
8 1 1 1 4.5 55 26 96.46±1.07 96.42±0.84
9 -1 0 0 0.5 45 15 90.20±1.41 90.96±1.31
10 1 0 0 4.5 45 15 95.27±0.94 96.24±1.08
11 0 -1 0 2.5 35 15 85.18±1.91 86.54±1.75
12 0 1 0 2.5 55 15 95.19±1.15 95.94±1.01
13 0 0 -1 2.5 45 4 86.50±1.21 87.63±1.04
14 0 0 1 2.5 45 26 95.84±1.59 96.45±1.45
15 0 0 0 2.5 45 15 95.27±1.81 94.59±1.41
16 0 0 0 2.5 45 15 95.27±1.40 94.59±1.03
17 0 0 0 2.5 45 15 96.71±1.24 94.58±1.05
127
where Ct is the concentration of the gamma-oryzanol (g/L) at a given extraction time t
(min). k is the second-order extraction rate constant (L/g.min), and Cs is the
concentration of gamma-oryzanol at saturation in the liquid extraction (g/L). To
determine the kinetic parameters, the integrated rate law of a second-order extraction
under the boundary conditions Ct = 0 to Ct and t = 0 to t, can be written as Eq. 4 or a
linearized Eq. 5:
Ct=Cs .k.t
+Cs.k.t (5.4)
𝑡
𝐶𝑡
1
𝑘 𝐶𝑠
𝑡
𝐶𝑠 1
ℎ
𝑡
𝐶𝑠 (5.5)
where h is initial extraction rate (g/L.min) when t and Ct approach 0 and can be
defined as (Pan et al., 2011):
ℎ 𝑘 𝐶𝑠2 (5.6)
The Cs and k were determined from experimentally from the slope and intercept by
plotting t/Ct against t.
5.4.3 Analytical method
5.4.3.1 Quantitative analysis of gamma-oryzanol content
ORF content was analyzed by UV-spectrophotometry/NIR
(Shimazu, UV-2600, Japan) (Joshi et al., 2016), whereby ORF was dissolved in
hexane and absorptions at multi wavelength between 200-400 nm were measured.
Gamma-oryzanol was determined by high-performance liquid chromatography
(HPLC)/UV following Sakunpaket et al. (2014). The HPLC/UV composed a pump

128
(LPG 3X00), auto-sampler (ACC-3000), diode-array UV/VIS detector (DAD), and a
Poroshell 120 EC-C 18 column (3.0 mm×150 mm, 2.7µm). The UV detector and the
column temperature were 325 nm and 25°C, respectively. The mobile phase of 100:0
(v/v), 50:50 (v/v), and 40:60 (v/v) methanol and acetonitrile was carried out
sequentially for 5, 10, and 15 min each, with gradient elution at a flow rate of 1.0
mL/min.
5.4.3.2 Scanning electron microscopy (SEM)
Scanning electron microscopy (SEM JEOL, JSM 6010 LV,
Technology Development Ltd., Japan) was used to characterize the effect of
ultrasound on the morphology of dried rice bran soapstock. In the analysis, untreated
and treated dried rice bran soapstock were placed on a metal stub and gold-sputtered.
The shape and surface characteristics of untreated and treated DRBS were determined.
The most representative images were selected at 600x magnification.
5.4.3.3 Data statistical analysis
The entire analysis was performed in triplicate and the
averages and standard deviations were computated in Stagraphic centrution XV
(Statsoft Inc., USA) and Modde 5.0 (Umea, Sweeden). A one-way analysis of
variance (ANOVA) was carried out to assess the effects of extraction process on the
ORF recovery. Tukey-HSD test was used to compare the means, given the 5%
significance level (p<0.05).

129
5.5 Results and discussions
5.5.1 Mixed solvent extraction
In this study, ethanol was chosen as a replacing ethyl acetate solvent for
gamma-oryzanol extraction from the DRBS, taking into account its recommendation
as an eco-friendly and safe solvent for use in food. Therefore, mixtures of ethyl
acetate with ethanol at various concentrations (0-25% v/v) were studied to obtain an
optimal gamma-oryzanol extraction. Table 5.3 presented the effect of introduced
ethanol into ethyl acetate as a mixture of ethanol in ethyl acetate (MEE) on the
gamma-oryzanol recovery from the dried rice bran soapstock (DRBS) using
conventional technique (Soxhlet extraction, SE). Replacing ethyl acetate with ethanol
from 0 to 15% (v/v) did not affect the efficiency of gamma-oryzanol extraction yields
(4.39 to 4.41 g/100 g DRBS) (p>0.05). However, higher concentrations of ethanol
(>15% v/v) in the MEE significantly reduced the yield of gamma-oryzanol (p<0.05).
This was probably because high polarity and viscosity of ethanol affecting the
efficiency of gamma-oryzanol extraction. The varying ratios of the MEE modify the
solvent polarity influencing the solubility of gamma-oryzanol, as the MEE could not
penetrate the DRBS where hydrophobicity is prevalent. In addition, a high viscosity of
solvent resist mass transfer, hence it could not effectively extract gamma-oryzanol
(Kumar et al., 2009; Lebovka et al., 2012). According to previous statements, some
authors indicated the lower selectivity of alcohol towards gamma-oryzanol due to less
solubility of gamma-oryzanol in the solvent mixture (Narayan et al., 2006; Antonio, et
al., 2011), which was in agreement with our results. For further experiment, the
replacement of ethyl acetate with ethanol by 15% in the MEE was considered suitable
for study the optimizing the parameters of ultrasound assisted solvent extraction
130
(UASE) of gamma-oryzanol extraction from the DRBS. Under this concentration is
suitable in view of possible application of the gamma-oryzanol extractions in food
industries because it is not only a safe solvent, but it is also cheaper when compared
with the ethyl acetate.
Table 5.3 Effect of ethanol concentration in the MEE on gamma-oryzanol extraction
from dried rice bran soapstock.
Ethyl acetate/ethanol
ratio (v/v)
100:0 95:5 90:10 85:15 80:20 75:25
Gamma-oryzanol
(g/100g DRBS)
4.41a±
0.26
4.40a±
0.15
4.41a±
0.29
4.39a±
0.15
4.05b±
0.31
4.05b±
0.37
Different letters in each row denote statistically significant differences between
treatments (p<0.05). The values are the mean of three replications ± standard
deviation.
5.5.2 Evaluation of regression for gamma-oryzanol extraction
In this study, the response surface methodology (RSM) with face-
centered central composite design (FCCD) was used to determine the optimum
conditions for the ultrasound assisted solvent extraction (UASE) of gamma-oryzanol
from the dried rice bran soapstock. The variables used were ultrasound power (W/g,
X1), extraction temperature (X2) and sonication time (min, X3). The relationships
between these three variables on gamma-oryzanol yield also were evaluated. The
experimental and predicted values were given in Table 5.2. The recovery of gamma-
oryzanol obtained from the DRBS was 73.21-96.71%.
131
The statistical significance of each coefficient was determined by using
the F-test, p-value, and lack of fit (LOF) obtained from the analysis of variance
(ANOVA). Table 5.4 showed the ANOVA results of the fitted quadratic models on
the response of gamma-oryzanol recovery. The high F-values for gamma-oryzanol
recovery (45.38) and very low p-value (p<0.05) indicated the model terms were
significant. Quanhong and Caili (2005); Yolmeh et al. (2014) who documented the
larger F-value and smaller p-value in optimization model would be a greater
significant effect on the corresponding response variable. Moreover, the p-value of the
LOF in model was 0.2830, indicating non-significant (p>0.05), which illustrated the
model satisfactorily fitted to the experimental data.
The robustness and predictive ability of the model developed were
evaluated based on the correlation coefficient (R2), adjusted R
2, and model predictive
ability (Q2). The high R
2 value (0.983) and adjusted R
2 (0.961) of the gamma-oryzanol
recovery showed a good agreement between the experimental data and predicted data.
While Q2
value of the gamma-oryzanol recovery was 0.933. The result indicated that
the variability was explained well by the models and has a small prediction error on
new predictive models. Additionally, the difference between adjusted R2 and Q
2 value
in our results was less than 0.3, which presented models were in reasonable agreement
(Analytics Solutions, 2013).
The quadratic equations were used to establish the relationship between the
independent variables (X1 = ultrasound power, X2 = temperature treatment and X3 =
sonication time) of UASE and responses (Y = gamma-oryzanol recovery) were as followed:
Y=94.596+2.641X1+4.698X2+4.410X3-1.220X1*X3-3.560X2
2-2.559X2
3 (5.7)

132
Table 5.4 ANOVA results of the response surface quadratic model on gamma-
oryzanol recovery.
Degree of
freedom
Sum of
squares
Mean
square
F-value p-value
Total Corrected 16 659.750 41.234
Regression 9 648.634 72.071 45.3854 0.0000
Residual 7 11.116 1.5879
Lack of Fit 5 9.733 1.947 2.81634 0.2830
Pure Error 2 0.691 0.691
R2 = 0.983; Adjusted R
2 = 0.961; Q
2=0.933; p-value<0.05 indicates statistical significance.
Table 5.5 Regression coefficients and p-values for gamma-oryzanol recovery after
backward elimination.
Source a
Regression coefficients p-value b
Constant 94.595 0.0000
X1 2.641 0.0002
X2 4.698 0.0000
X3 4.410 0.0000
X1* X3
-1.212 0.0499
X22 -3.360 0.0029
X32 -2.559 0.0111
a X1, X2, and X3 denote ultrasound power, extraction temperature, and sonication time,
respectively. b p<0.05 indicates statistical significance.

133
5.5.3 Effect of process variables on gamma-oryzanol recovery
Table 5.5 presents the effect of the UASE parameters on the gamma-
oryzanol recovery. The result showed that the linear term of X1, X2 and X3, cross-
product term of X1X3 and quadratic of X22, X3
2 had a positive effect on the gamma-
oryzanol extraction from rice bran soapstock. The interaction term of X1X2, and X2X3,
and quadratic term of X12 on the model significantly did not significantly affected
(p>0.05) the gamma-oryzanol recovery, thus, they were eliminated.
Figure 5.1A illustrated the interaction between ultrasonic power (X1)
and extraction temperature (X2) on the gamma-oryzanol recovery, given sonication
time at 15min. The recovery increased by increasing X1 and X2, and maximum value
(96.98%) was achieved under 4.5 W/g and 49ºC. Increase extraction temperature to
55ºC under 4.5 W/g slightly reduced the gamma-oryzanol recovery.
Figure 5.1B showed that ultrasound power (X1) and sonication time (X3)
had a significant influence on the gamma-oryzanol recovery. The maximum gamma-
oryzanol recovery was achieved (97.15%) under the ultrasound power (X1) of 4.5 W/g
and sonication time (X3) of 19.40min, given a fixed extraction temperature of 45ºC. The
positive influence to gamma-oryzanol recovery was also indicated after prolonging the
time treatment from 19.40 to 26min at 4.5 W/g. The results could be due to high
ultrasonic power and an extended sonication time generates high temperatures and
violent pressure, resulting in severe turbulence in the medium and the subsequent
disintegration of the microstructures (Balachandran et al., 2006; Zhang et al., 2008).
In Figure 5.1C, the gamma-oryzanol recovery was maximum value of
97.59%, when X2 and X3 were 50.30ºC, and 21.54min, respectively, given X1 of 2.5
W/g. Although Sharma and Gupta, (2006); Zhang et al. (2008), who reported that the
high extraction temperature and extended sonication duration enhances the mass
134
liquid transfer by the cavitation forces resulting in increased the extraction yield. In
this study, the high extraction temperature (51-55ºC) and extended sonication duration
(22-26 min) resulted in slightly reduction of gamma-oryzanol recovery.
5.5.4 Optimization of the extraction process
Table 5.6 indicates the optimum UASE condition for the maximum
recovery of gamma-oryzanol from DRBS. Based on the FCCD, the ultrasound power
of 4.00 W/g, extraction temperature of 50ºC, and sonication time of 21.50min resulted
in the optimal conditions of the UASE for gamma-oryzanol recovery of 98.15% from
DRBS. The predicted gamma-oryzanol recovery was 98.03% under the optimal
condition. These experimental and predicted values validated the response model with
a good correlation, suggesting that the response model could be applied to optimizing
the UASE parameters for enhanced gamma-oryzanol recovery.
To characterize the gamma-oryzanol composition obtained from the
DRBS using UASE under optimal parameters, HPLC was employed in order to
compare with gamma-oryzanol standard. The chromatograms of gamma-oryzanol
presented in Figure 5.2A and 5.2B. It obviously showed similar profiles with four peaks
of gamma-oryzanol standard and obtained in this study including campesteryl ferulate
(RT = 7.753min and 7.765min), 24-methylene cycloartanyl ferulate (RT = 7.050min
and 7.065min), β-sitosteryl ferulate (RT = 9.006min and 8.989min) and cycloartenyl
ferulate (RT = 6.235min and 6.243min), respectively. Specifically, cycloartanyl ferulate
and 24-methylene cycloartanyl ferulate exhibited the maximum proportions in gamma-
oryzanol, while the minimum proportion of campesteryl ferulate and β-sitosteryl
ferulate in gamma-oryzanol were observed. Thus, the HPLC results confirmed that the
gamma-oryzanol components obtained from DRBS were comparable with gamma-

135
oryzanol standard. Moreover, similar profiles with other study were obtained by Kumar
et al. (2009); Sakunpak et al. (2014).
Table 5.6 Model validation for maximum gamma-oryzanol recovery given the
optimal UASE condition.
Ultrasound
power (X1,W/g)
Temperature
treatment (X2,ºC)
Sonication time
(X3, min)
Experimental
value (%)
Predicted
value (%)
4.00±0.65 50±0.85 21.50±0.41 98.03±0.98 98.15±0.75
5.5.5 Rice bran soapstock microstructure
Figure 5.3 presents the SEM images of the DRBS and the residue after
the optimal UASE condition. The morphology of the DRBS (Figure 5.3A) was
irregularly spherical in shape and the heterogeneity size. It can be explained due to the
stickiness of soapstock. Similar result was observed with Lamas et al., (2016), who
reported that no uniformity of rice bran soapstock because the material has asticky
characteristic. The formation of dented surfaces of soapstock particles after sonication
indicated that the efficiency of extraction was increased (Figure 5.3B). In addition, it
suggested that the ultrasound treatment leads to destroy the soapstock structure and
increase a porous characteristic enhancing the extraction efficiency. The finding
confirmed the extraction efficiency when using the UASE technique. While the DRBS
(untreated) shows a completely dense structure. The results were consistent with;
Kurian et al. (2015); Yi et al. (2016), who reported that the ultrasonic treatments
induced the structural changes, fissures, and cavities in the sample.

136
Figure 5.1 The response surface plots of the effects of ultrasound power, extraction
temperature, and sonication time on gamma-oryzanol recovery: (A) fixed
sonication time at 15min; (B) (extraction temperature at 45°C; and (C)
fixed ultrasound power at 2.5 W/g.
(A)
(B)
(C)

137
Figure 5.2 HPLC chromatograms of gamma-oryzanol (1) cycloartenylferulate, (2) 24-
methylenecy cloartanyl ferulate, (3) campesterylferulate, and (4) β-sitosteryl
ferulate): (A) standard and (B) recovered gamma-oryzanol from DRBS.
(A) (B)
Figure 5.3 SEM images of: (A) untreated and (B) UASE treated DRBS.
(A)
(B)

138
5.5.6 Kinetic of UASE process
The extraction kinetics were studies in order to describe the effect of
UASE process parameters on the gamma-oryzanol extraction. Experimental data on
the concentration of gamma-oryzanol of UASE from the DRBS using the MEE
composition ethyl acetate/ethanol 85:15 (v/v) for the three investigated ultrasound
powers and extraction temperatures as function of extraction time were reported in
Figure 5.4. Because based on the optimal parameters of the UASE obtained from the
RSM, the extraction time between 0-21.5min was used for the kinetics studies. The
calculated values from the second-order kinetic model were compared with the
experimental data for the gamma-oryzanol extractions with UASE under different
conditions. In Figure 5.4A and 5.4B, the solid lines are the model prediction and the
points are the experimental data. The calculated gamma-oryzanol concentrations over
time obtained were fitted with the experimental data, showing the validity relationship
of the second-order kinetic models. These results indicated that the two-third of
gamma-oryzanol extractions (more than 3.0 g/L) occurred during the first stage
extraction time (0-8min). Extended extraction time from 8 to 21.50min resulted
slightly increase in gamma-oryzanol concentrations (Figure 5.4A and 5.4B). However,
at high temperature of 55ºC (Figure 5.4B), small reduction of the concentration was
observed agreeing with the RSM results (Figure 5.1C). According to Lebovka et al.
(2012), the longer extraction time lead to greater the chance of solvent dissolving
other solutes from the solid, or desired solute (target compound) to be degraded by
temperature or expose to the atmosphere. According to Pan et al. (2011), the
extraction of total phenolics from pomegranate peel using three different extraction
methods (continuous and pulsed ultrasound assisted extraction (CUAE and PUAE),
and conventional extraction (CE)) presented two stage extractions. First stage is

139
characterized by a rapid extraction rate involving the dissolution of soluble substances
near particle surfaces into the solvent. Second stage is characterized by a slow
extraction rate involving mass transfer of soluble substances from the internal material
into the solvent by diffusion process (Pan et al., 2011; Lebovka et al., 2012).
The gamma-oryzanol concentration significantly increased with increase
intensity level from 0.5 W/g to 2.5 W/g (p<0.05) over the extraction time, however,
from 2.5 W/g to 4.5 W/g only slightly increase in concentration was observed
(p>0.05) (Figure 5.4 A). According to Goula (2013), ultrasound intensity level
influenced on the extraction process, a larger ultrasound power increasing the mass
transfer process and resulting in a moderate rise in the recovered yield. In addition,
gamma-oryzanol concentration increased with elevated extraction temperature from
35ºC to 45ºC (p<0.05). As Lazar et al. (2016) reported that higher extraction
temperature using ultrasound assisted extraction increase on the extraction rates of
polyphenolic compounds from different biomass due to under higher temperature, the
solubility and diffusivity of the phenolic compounds are increased, enhancing the
mass transfer and accelerating the extraction process. However, elevated temperature
from 45ºC to 55ºC at 21.5min extraction time small decrease in concentration were
observed (p>0.05). High temperature could lead to thermal degradation of phenolic
compounds and cause a faster evaporation of the solvent, resulting in the efficiency of
the whole process (Lazar et al., 2016; Goula, 2013).
Figure 5.5 showed the linearized forms of the second-order model for
the UASE process (Eq. 5). The gamma-oryzanol concentration at saturation (Cs), and
extraction rate constant (k) were calculated from the slope and intercept by plotting
t/Ct against t. The initial extraction rate (h) was calculated following the Eq. 6. Table
5.7 presents the kinetic parameters for the second-order kinetic models of the gamma-

140
oryzanol extraction. The Cs, k, h values trended to increase with increasing
ultrasounds from 0.5 to 4.5 W/g, and with increasing temperature from 35 to 45°C.
While, the Cs, and h values slightly decreased when increased temperature from 45 to
55°C. These results suggested that more efficiency of the UASE for increasing
gamma-oryzanol extraction rate were obtained when the conditions of high ultrasound
power (4.5 W/g) and moderate temperature of 45°C. Based on the coefficients of
determination (R2 = 0.9722-0.9971) and the RSME (0.0907-0.2134) (Table 5.7), the
second-order kinetic model resulted the fitting models for all the investigated
ultrasound powers and temperatures, and could be used for describing the effect of
UASE parameters for the gamma-oryzanol extraction form the DRBS.
Table 5.7 Kinetic parameters of gamma-oryzanol recovery from the DRBS for
different ultrasound powers and extraction temperatures.
Kinetic parameters
Ultrasound power
(W/g)
Extraction temperature
(°C)
0.5 2.5 4.5 35 45 55
Cs experimental (g/L) 3.910 4.290 4.310 3.890 4.317 4.219
Cs calculated (g/L) 3.841 4.251 4.330 3.724 4.195 3.986
k (L/g.min) 0.207 0.215 0.215 0.193 0.216 0.217
h (g/L.min) 3.165 3.975 3.994 2.920 4.025 3.863
R2 0.9766 0.9971 0.9962 0.9722 0.9964 0.9955
RMSE 0.0907 0.0912 0.0989 0.1136 0.1736 0.2134
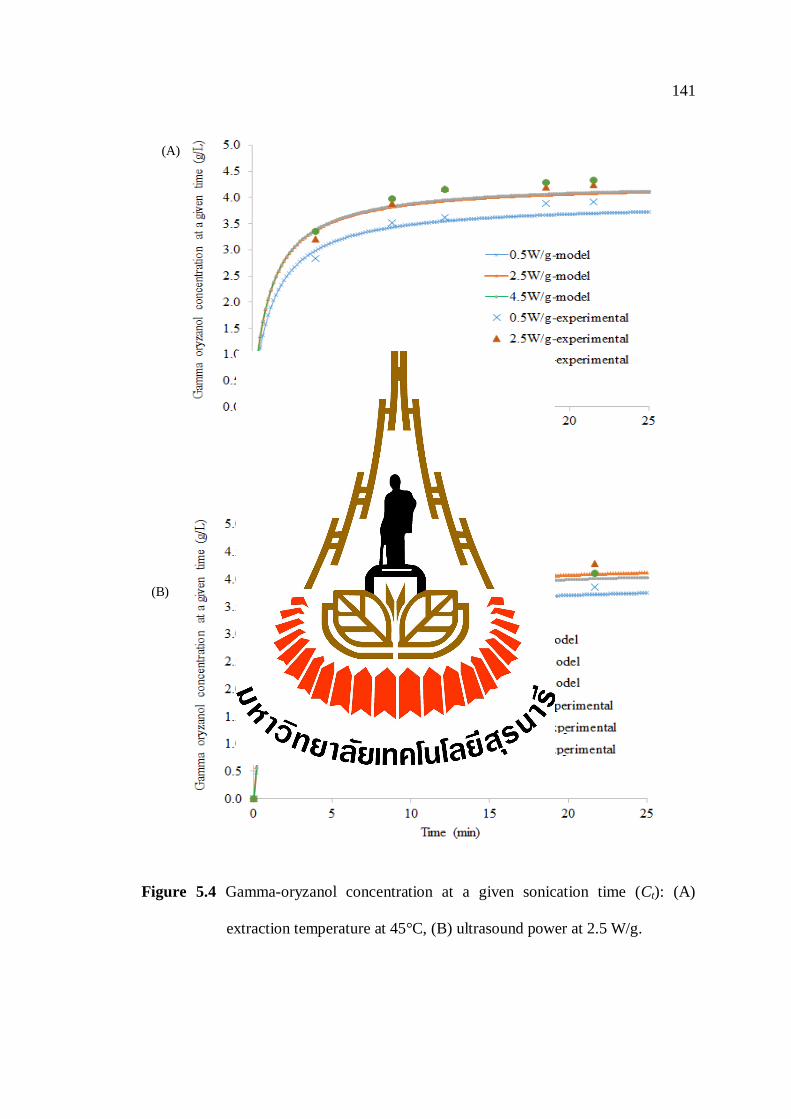
141
Figure 5.4 Gamma-oryzanol concentration at a given sonication time (Ct): (A)
extraction temperature at 45°C, (B) ultrasound power at 2.5 W/g.
(A)
(B)

142
Figure 5.5 Extraction rate reciprocal (t/Ct) of gamma-oryzanol recovery from the
DRBS at different sonication time (t): (A) extraction temperature at
45°C, (B) ultrasound power at 2.5 W/g.
(A)
(B)

143
5.6 Conclusion
In this study, UASE of gamma-oryzanol recovery from DRBS were
investigated and compared. RSM and FCC were applied to give an insight into the
effects and interactions of all parameters during extraction. The results illustrated that
the well-fitting model was generated with a good predictor of all experimental results.
The optimum conditions for extraction gamma-oryzanol extraction were an ultrasonic
power of 4.0 W/g, temperature process of 50ºC, and 21.50 min for the ultrasonication
process, which achieved ORF of 98.03%, respectively. HPLC profile showed four
chromatographic peaks in ORF (campesteryl ferulate, 24-methylene cycloartanyl
ferulate, β-sitosteryl ferulate and cycloartenyl ferulate). The experimental data fits
well with the second-order model and kinetics parameters included the initial
extraction rate (h), the extraction rate constant (k), the concentration at saturation (Ce)
and the activation energy (Ea). These data were calculated using the obtained model.
The activation energy obtained 39.05 kJ mol−1
indicated the endothermic nature of the
UASE process. Hence in this study, the optimization UASE parameters of gamma-
oryzanol from rice bran soapstock are reliable, stable and available in practice. In
addition, the fitting equation of kinetic model fitting equation can apply to describe
the mechanism of ultrasound-assisted extraction.
5.7 References
Analytics Solutions, M. D. (2013). User Guide. SpringerReference, New york, p.1-6.
Antonio, J. A. M., Eduardo, A. C. B., Mariana, C. C., and Marcelo, L. (2011). Liquid-
Liquid Extraction and Adsorption Applied to the Processing of Nutraceuticals
and Functional Foods. In: Handbook of Nutraceuticals Volume II, Yashwant
Pathak (ed). Routledge, Lodon, p. 145-268.
144
Balachandran, S., Kentish, S. E., Mawson, R., and Ashokkumar, M. (2006).
Ultrasonic enhancement of the supercritical extraction from ginger. Ultr.
Sonochem. 13(6): 471-479.
Chan, C. H., Yusoff, R., and Ngoh, G. C. (2014). Modeling and kinetics study of
conventional and assisted batch solvent extraction. Chemical Engineering
Research and Design. 92(6): 1169-1186.
Franco, D., Sineiro, J., and Nunez, M. J. (2009). Analysis of variables and modeling
of gevuina avellana oil extraction with ethanol near azeotrope conditions. J.
Food Process Engineering. 32(5): 664-681.
Gayas, B., and Kaur, G ( 7) Novel oil extraction methods in food industr : A
review, J. Food Process Eng. 8(5): 1-11.
González-Centeno, M. R., Comas-Serra, F., Femenia, A., Rosselló, C., and Simal, S.
(2015). Effect of power ultrasound application on aqueous extraction of
phenolic compounds and antioxidant capacity from grape pomace (Vitis
vinifera L.): Experimental kinetics and modeling. Ultr. Sonochem., 22, 506-
514.
Gopala Krishna, A. G., Khatoon, S., Shiela, P. M., Sarmandal, C. V., Indira, T. N.,
and Mishra, A. (2001). Effect of refining of crude rice bran oil on the retention
of oryzanol in the refined oil. J. Amer. Oil Chem.’ Soci. 78(2): 127-131.
Gunstone, F.D. (2011). Occurrence and characterisation of oils and fats. In: Vegetable
Oils in Food Technology. Gunstone, F.D., and Hardwood. J.L., (eds).
Blackwell Publishing, NY, p. 37-141.
Jesus, S. P., Grimaldi, R., and Hense, H. (2010). Recovery of gamma-oryzanol from
rice bran oil byproduct using supercritical fluid extraction. J. Supercritical
Fluids. 55(1): 149-155.

145
Joshi, M., Kaur, R., Kanwar, P., Dhiman, G., Sharma, G., Lata, S., Mishra, T. (2016).
To evaluate antioxidant activity of gamma–oryzanol extracted from rice bran
oil. Int. J. of Life Sc. And Pharma Research. 6(3): 17-25.
Ju, Y. H., and Vali, S. R. (2005). Rice bran oil as a potential resource for biodiesel: A
review. J. Sci. and Industrial Res. 64(11): 866-882.
Kaewboonnum, P., Vechpanich, J., Santiwattana, P., and Shotipruk, A. (2010).
gamma-oryzanol recovery from rice bran oil soapstock. Separation Sci. and
Techno. 45(9): 1186-1195.
Kumar, R. R., Tiku, P. K., and Prakash, V ( 9) Preferential extractabilit of γ-
oryzanol from dried soapstock using different solvents. J. Sci. of Food and
Agr. 89(2): 195-200.
Kurian, J. K., Gariepy, Y., Orsat, V., and Raghavan, G. S. V. (2015). Comparison of
steam-assisted versus microwave-assisted treatments for the fractionation of
sweet sorghum bagasse. Bio. and Bioprocessing. 2(1): 30-39.
Lamas, D. L., Constenla, D. T., and Raab, D. (2016). Effect of degumming process on
physicochemical properties of sunflower oil. Biocatalys. and Agr.
Biotechnol. 6: 138-143.
Lazar, L., Talmaciu, A. I., Volf, I., and Popa, V. I. (2016). Kinetic modeling of the
ultrasound-assisted extraction of polyphenols from Picea abies bark. Ultr.
Sonochem. 32: 191-197.
Lerma-García, M. J., Herrero-Martínez, J. M., Simó-Alfonso, E. F., Mendonça, C. R. B.,
and Ramis-Ramos, G. (2009). Composition, industrial processing and applications
of rice bran gamma-oryzanol. Food Chem. 115(2): 389-404.
Moghaddam, M. Y., Shafaei, S. Z., Noaparast, M., Ardejani, F. D., Abdollahi, H.,
Ranjbar, M., Manafi, Z. (2015). Empirical model for bio-extraction of copper
146
from low grade ore using response surface methodology. Transactions of
Nonferrous Metals Society of China. 25(12): 4126-4143.
Moreau, R. A., and Hicks, K. B. (2005). The composition of corn oil obtained by the
alcohol extraction of ground corn. J. Amer. Oil Chem.’ Soci. 82(11): 809-
815.
Narayan, A. V., Barhate, R. S., and Raghavarao, K. S. M. S. (2006). Extraction and
purification of oryzanol from rice bran oil and rice bran oil soapstock. J.
Amer. Oil Chem.’ Soci. 83(8): 663-670.
Patel, M., and Naik, S. N. (2004). Gamma-oryzanol from rice bran oil - A review. J.
Sci. and Industrial Res. 63(7): 569-578.
Pestana-Bauer, V. R., Zambiazi, R. C., Mendonça, C. R. B., Beneito-Cambra, M., and
Ramis-Ramos, G. (2012). gamma-oryzanol and tocopherol contents in residues
of rice bran oil refining. Food Chem. 134(3): 1479-1483.
Petrović, S S , Ivanović, J , Milovanović, S , and ŽIžović, I ( ) omparative
analyses of the diffusion coefficients from thyme for different extraction
processes. J. Serbian Chemical Soci. 77(6): 799-813.
Qu, W., Pan, Z., and Ma, H. (2010). Extraction modeling and activities of antioxidants
from pomegranate marc. J. Food Eng. 99(1): 16-23.
Quanhong, L., and Caili, F. (2005). Application of response surface methodology for
extraction optimization of germinant pumpkin seeds protein. Food Chem.
92(4): 701-706.
Rakotondramasy-Rabesiaka, L., Havet, J. L., Porte, C., and Fauduet, H. (2009). Solid–
liquid extraction of protopine from Fumaria officinalis L.-Kinetic modelling of
influential parameters. Industrial Crops and Products. 29(2): 516-523.
147
Sakunpak, A., Suksaeree, J., Pathompak, P., Charoonratana, T., and Sermkaew, N.
( 4) Antioxidant individual γ-oryzanol screening in cold pressed rice bran
oil of different thairice varieties by HPLC-DPPH method. Int. J. Pharma. and
Pharmaceuti. Scie. 6(6), 592-597.
Seetharamaiah, G. S., and Prabhakar, J. V. (1986). Oryzanol Content of Indian Rice
Bran Oil and Its Extraction from Soap Stock. J. Food Sci. and Technol. 23:
270-273.
Sharma, A., and Gupta, M. N. (2006). Ultrasonic pre-irradiation effect upon aqueous
enzymatic oil extraction from almond and apricot seeds. Ultr. Sonochem.
13(6): 529-534.
Sharma, R. D., and Rukmini, C. (1986). Rice bran oil and hypocholesterolemia in rats.
Lipids. 21(11): 715-717.
Taghvaei, M., Jafari, S. M., Nowrouzieh, S., and Alishah, O. (2013). The influence of
cooking process on the microwave-assisted extraction of cottonseed oil. J.
Food Sci. and Technol. 52(2): 1138-1144.
Thurman, B. H. (1961). Process for producting lecithin products from soapstock.
United States Patent office 2,859,240., 1-8.
Venkatadri, A., and Sreesaila, K. (2005). Process for crystallization of gamma-
oryzanol enriched fraction derived from rice bran soapstock. United States
Patent, WO 20004055040Á1, 1-12.
Vetal, M. D., Lade, V. G., and Rathod, V. K. (2013). Extraction of ursolic acid from
Ocimum sanctum by ultrasound: Process intensification and kinetic studies. Chem.
Eng. and Process.: Process Intensif. 69: 24-30.
148
Wang, Y. G., Yue, S. T., Li, D. Q., Jin, M. J., and Li, C. Z. (2002). Kinetics and
mechanism of Y(III) extraction with CA-100 using a constant interfacial cell
with laminar flow. Solvent Extraction and Ion Exchange. 20 (3): 345-358.
Wilson, T. A., Nicolosi, R. J., Woolfrey, B., and Kritchevsky, D. (2007). Rice bran oil
and oryzanol reduce plasma lipid and lipoprotein cholesterol concentrations
and aortic cholesterol ester accumulation to a greater extent than ferulic acid in
hypercholesterolemic hamsters. J. Nutritional Biochem. 18(2): 105-112.
Yi, J., Zhang, Q., Li, X., Wang, X., Li, B., and Zhu, W. (2016). Steam explosion
technology based for oil extraction from sesame (Sesamum indicum L.) seed.
J. Saudi Soci. of Agr. Sci. 34(5): 556-567.
Yolmeh, M., Habibi Najafi, M. B., and Farhoosh, R. (2014). Optimisation of
ultrasound-assisted extraction of natural pigment from annatto seeds by
response surface methodology (RSM). Food Chem. 155: 319-324.
Zhang, H. F., Yang, X. H., and Wang, Y. (2011). Microwave assisted extraction of
secondary metabolites from plants: Current status and future directions.
Trends in Food Sci. and Technol. 22(12): 672-688.
Zhang, Z. S., Wang, L. J., Li, D., Jiao, S. S., Chen, X. D., and Mao, Z. H. (2008).
Ultrasound-assisted extraction of oil from flaxseed. Separation and
Purification Technology, 62(1): 192-198.

CHAPTER VI
ISOLATION AND CHARACTERIZATION OF GAMMA-ORYZANOL
ISOLATED FROM RICE BRAN SOAPSTOCK
6.1 Abstract
This research investigates the effect of ethanol concentrations in ethyl
acetate/ethanol mixture and crystallization conditions on the recovery and purity of
gamma oryzanol isolated from dried rice bran soapstock, using two-step
crystallization. The ethanol concentrations were varied between 0, 10, 20, 30, and 40%
v/v, and the crystallization parameters included solvent to crude gamma oryzanol rich
fraction solution (ORF) ratio, crystallization temperature, and crystallization time. In
the first crystallization, the solvent to ORF ratio was varied between 2.5:1, 5.0:1, 7.5:1
and 10:1 (v/v), crystallization temperature between -60, -45, -30, -15 and 0°C, and
crystallization time between 5, 7.5, 10, 12.5, and 15 h. The liquid phase was
subsequently subjected to second crystallization for gamma oryzanol crystal, where
the crystallization temperatures and time were varied between 0, 5, 10, 15 and 20ºC;
and 1, 6, 11 and 15 h. The optimal ethanol concentration in the solvent mixture was
30% v/v. The optimal first-crystallization solvent to ORF ratio, crystallization
temperature and time were 7.5:1 (v/v), -15°C, and 7.5 h. The optimal second-
crystallization temperature and time were 5ºC and 6 h, with gamma oryzanol recovery
and purity of 58.03-61.17% and 87.10-90.29%, respectively. The physiochemical
properties of gamma oryzanol crystal also indicated good agreement between isolated
150
gamma oryzanol and gamma oryzanol standard.
Keywords: Optimization, soapstock, gamma-oryzanol purity, crystallization.
6.2 Introduction
Rice bran, a by-product of rice milling, contains 12-23% oil (Wongwaiwech et
al., 2018). Rice bran is also rich in nutraceuticals, including gamma oryzanol,
tocopherols, and tocotrienols, making crude rice bran oil highly nutritious. However,
high contents of free fatty acids (FFA), waxes, gums, and pigments in crude rice bran
oil complicate the refining process to improve the odor, appearance, and shelf life to
meet the standards of edible oil (Gunstone, 2011; De et al., 2011).
In rice bran oil refining, FFA and mucilaginous impurities are removed by
alkaline neutralization (Engelmann et al., 2017). The alkaline neutralization process
nevertheless causes nearly 90% gamma oryzanol loss through wet soapstock (Gopala
Krishna et al., 2001). At present, rice bran soapstock is mostly converted into
detergent soaps (Narayan et al., 2006), feedstock (Ju and Vali, 2005), and lecithin
products (Thurman, 1961). In fact, residual gamma oryzanol contained in rice bran
soapstock presents a promising opportunity for gamma oryzanol production on a
commercial scale (Narayan et al., 2006). Research have shown that gamma oryzanol
helps reduce plasma cholesterol (Wilson et al., 2007; Kumar et al., 2009), platelet
aggregation, and cholesterol absorption (Sharma et al., 1986; Seetharamaiah et al.,
1986). It is also used in cosmetic for anti-itching and anti-dandruff properties (Gopala
Krishna et al., 2001; Patel and Naik, 2004) and in food products (Patel and Naik, 2004).
Therefore, many extraction methods have been proposed for isolating gamma oryzanol
from alkaline oil cake (soapstock).
151
Masao and Yashizane (1968) isolated gamma oryzanol from alcoholic solution
(ethanolic and methanolic) of rice bran oil soapstock using CO2 as anti-solvent. They
successfully derived white-crystal gamma oryzanol with 85% purity; however, gums
and waxes were mostly insoluble in gaseous solvent mixture. Das et al. (1998)
isolated gamma oryzanol from rice bran oil soapstock using calcium ion-induced
precipitation. Although the recovery and purity were high (76% and 96%), the
technique was highly complex and required a toxic solvent (chloroform).
Narayan et al. (2004) and Zullaikah et al. (2009) experimentally isolated
gamma oryzanol from rice bran oil and rice bran soapstock by using preparative high
performance liquid chromatography (HPLC); and reported 90% gamma oryzanol
recovery with 90-98% purity. Nonetheless, the method was ideal for laboratory-scale
production due to low productivity. Zullaikah et al. (2009) isolated gamma oryzanol
from rice bran oil at a very low temperature (-60ºC) by a mixture of ethyl acetate and
methanol as crystallization solvent using two-step crystallization; and reported 57-
59% gamma oryzanol crystal recovery with 93-95% purity. However, the sub-zero
temperature (-60ºC) during the first crystallization necessitated a special cooling
device. Kaewboonnum et al. (2010) isolated gamma oryzanol from rice bran oil
soapstock with 20:80 (v/v) ethyl acetate/methanol mixture using two-step
crystallization (3°C and 1 h for the first crystallization, followed by 5°C and 24 h for
the subsequent step). However, the recovery and purity of gamma oryzanol were
relatively low (55.17% and 74.60%).
In this research, ethanol was used in combination with ethyl acetate. Ethanol is
commonly used in food and pharmaceuticals because of its low toxicity and cost-
effectiveness. Besides, ethanol, when combined with ethyl acetate, moderates the

152
solvent polarity, thus enhancing gamma oryzanol crystallization. However, there
exists no study on gamma oryzanol isolation using ethyl acetate/ethanol mixture.
Thus, this research investigates the effect of ethanol concentrations (0, 10, 20,
30, and 40% v/v) in ethyl acetate/ethanol mixture and crystallization conditions (i.e.,
solvent to ORF ratio, crystallization temperature and time) on gamma oryzanol
isolated from dried rice bran soapstock. The isolation was carried out using two-step
crystallization. In the first crystallization, the solvent to ORF ratio was varied between
2.5:1, 5.0:1, 7.5:1 and 10:1 (v/v), the crystallization temperature between -60, -45, -
30, -15 and 0°C, and the crystallization time between 5, 7.5, 10, 12.5, and 15 h. The
liquid phase from the first crystallization was subsequently subjected to second
crystallization where the crystallization temperatures and time were varied between 0,
5, 10, 15 and 20ºC; and 1, 6, 11 and 15 h, respectively, for gamma oryzanol crystal.
The gamma oryzanol recovery and purity were determined and the physicochemical
properties characterized.
6.3 Objectives
This study was to investigate the effect of crystallization conditions on
gamma-oryzanol recovery and purity.
6.4 Materials and Methods
6.4.1 Materials
Wet rice bran oil soapstock, following Venkatadri and Sreesaila
(2005), was heated to 80ºC in a water bath and saponified by adding 1.25% (w/v)
NaOH solution with constant stirring for 30 min before centrifugation at 10,000 rpm
and 10ºC for 15 min to remove liquid. The solid was then vacuum-evaporated (100ºC,
153
550 mmHg) for 2 h for dried rice bran soapstock (DRBS) with 4-4.5% moisture
content, measured by a moisture meter (A&D, AD-4714A, Japan). The DRBS was
used as the starting material for gamma oryzanol extraction.
In extraction, 50 g DRBS was extracted in 500 mL ethanol/ethyl
acetate mixture (15% ethanol: 85% ethyl acetate) by using ultrasound assisted
extraction (4.0 W/g, 50.0ºC, and 21.5min). The crude gamma oryzanol rich fraction
solution (ORF) was then centrifuged to remove solid before vacuum evaporation
(Evaporator, Cole Parmer EW-28615-01, Cole Parmer, USA). The ORF contained
4.41 g gamma oryzanol/100 g DRBS.
Gamma oryzanol standard (Oryza Oil and Fat Chemical Co., Ltd,
Japan) was used for quantification. Meanwhile, ethyl acetate (99.5%), acetonitrile
(99.8%), and ethanol (98.5%) were from Sigma-Aldrich (Darmstadt, Germany).
6.4.2 Experimental methods
In the first crystallization, the mucilaginous impurities (waxes and
gums) in the crude ORF solution were removed by a mixture of ethyl acetate and
ethanol and stirred for 15 min at room temperature. The ethyl acetate to ethanol ratio
was varied between 100:0, 90:10, 80:20, 70:30, and 60:40% (v/v); solvent to crude
ORF solution ratio between 2.5:1.0, 5.0:1.0, 7.5:1.0, and 10.0:1.0 (v/v); crystallization
temperature between 0, -15, -30, -45, and -60ºC; and crystallization time between 5,
7.5, 10, 12.5, and 15 h. After crystallization, liquid phase (LP) and solid phase (SP)
were separated by filtering with Whatman filter paper no.1 under vacuum condition
(350 mmHg). Gamma oryzanol recovery in LP was determined by spectrophotometry
and HPLC.

154
In the second crystallization, the LP was subjected to different
crystallization temperatures (0, 5, 10, 15, and 20ºC) and times (1, 6, 11, and 15 h).
Gamma oryzanol crystal was precipitated and separated by vacuum filtering. The
recovery and purity of gamma oryzanol were calculated by Eqs. (1) and (2).
Weight of gamma-oryzanol in LP/isolated
Gamma-oryzanol recovery (%) = 100Weight of gamma-oryzanol in ORF
(6.1)
Weight of gamma-oryzanol in sampleGamma-oryzanol purity (%) = 100
Weight of sample (6.2)
6.4.3 Analytical methods
6.4.3.1 Quantitative analysis of gamma-oryzanol content
Gamma oryzanol contents were analyzed by UV-spectrophotometer/NIR
(Shimazu, UV-2600, Japan) and HPLC, following Joshi et al. (2016) and Sakunpaket
et al. (2014). HPLC consisted of a pump (LPG 3X00), auto-sampler (ACC-3000),
diode-array UV/VIS detector (DAD), and Poroshell 120 EC-C18 column (3.0 mm x
150 mm, 2.7µm). The column temperature and UV detector were set at 25°C and 325
nm. The gradient mobile phase consisted of 100:0, 50:50, and 40:60 (v/v)
methanol:acetonitrile for 5, 10, and 30 min. The flow rate was 1.0 ml/min throughout
the HPLC analysis, and the sample injection volume was 20 μl.
6.4.3.2 Thermal behavior analysis
The melting point of gamma oryzanol was determined by
differential scanning calorimetry (DSC 7, Perkin Elmer Corp., Norwalk, USA). The
baseline was established using two empty sealed aluminum pans. Then, 3-5 mg
gamma oryzanol crystal was weighed in aluminum pan and sealed. The DSC chamber
was flushed with nitrogen (0.5 mL/min) and the samples were heated from 25°C to
155
200°C at 10°C/min and maintained at 200°C for 10 min and the melting curve plotted.
The samples were then cooled down from 200°C to 25°C at 10°C/min.
6.4.3.3 Liquid chromatography–mass spectrometry (LC-MS)
The components of gamma oryzanol were characterized by
Dionex Ultimate 3000 HPLC coupled with Bruker Amazon SL mass spectrometer
(Thermo Fisher Scientific, USA), following Sakunpak et al. (2014). The samples were
separated at 25ºC on Poroshell 120EC-C18 column (3.0 mm x 150 mm, 2.7µm) using
gradient mobile phase consisting of 95:5, 40:60, and 5:95 (v/v) methanol:acetonitrile
containing 0.1% formic acid for 2, 20, and 8 min, with a flow rate of 1.0 ml/min. The
injection volume was 20 µL and the UV detector wavelength was 325 nm. The mass
spectrometer was equipped with electrospray ionization (ESI) and quadrupole-ion
trap. The mass spectra were observed in negative ion mode and recorded on a mass to
charge ratio (m/z) range of 100-800. The capillary voltage was 4500 V, the drying gas
temperature was 200°C with a flow rate of 4.5 L/min, and the nebulizer pressure was
200 kPa. The gamma oryzanol components were individually identified using multiple
reaction monitoring (MRM) mode and data analyzed by LTQ Orbitrap mass
spectrometer software (Thermo Fischer Scientific, U.S.A.).
6.4.3.4 Field emission scanning electron microscope (FESEM)
The particle size and morphology of gamma oryzanol were
determined by FESEM (HITACHI JEOL JSM 7800F, Technology Development Ltd.,
Japan). In the analysis, standard and isolated gamma oryzanol were placed on the
metal stub and gold-sputtered; and 25,000x images of the shape and surface
characteristics of gamma oryzanol crystal were taken.
156
6.4.4 Other analytical methods
Color values were measured by Minolta CR-300 Chroma Meter
(Osaka, Japan) and expressed in accordance with the Commission Internationale de
l’Eclairage (CIE) L*a*b* system (lightness, redness, and yellowness). The particle
size distribution of gamma oryzanol crystal was determined by a laser scattering
particle size distribution analyzer (Horiba, LA 920, Kyoto, Japan), following Hong,
Nakayama, & Park, (2002). The particle size curve and mean particle size were
analyzed by LA-920 software analyzer (Horiba, LA 920, Kyoto, Japan).
6.4.5 Statistical analysis
The entire analysis was performed in triplicate and the averages and
standard deviations were computed in Stagraphic centrution XV (Statsoft Inc., USA).
A one-way analysis of variance (ANOVA) was carried out to assess the effects of
isolation processes on the gamma-oryzanol recovery and physiochemical properties of
gamma-oryzanol isolated. The Tukey-HSD comparison was used to compare the
mean values given that the significant differences at p<0.05 were observed.
6.5 Results and discussions
6.5.1 First step crystallization
6.5.1.1 Effect of ethanol content in solvent mixture composition
Solvent mixture polarity plays a crucial role in isolation of
gamma oryzanol from crude ORF solution. In the first crystallization, crude ORF
solution was mixed, on a trial basis, with ethyl acetate/ethanol mixture (i.e., 0, 10, 20,
30, and 40% v/v ethanol concentrations), given 5.0:1.0 v/v solvent to ORF ratio
(Kaewboonnum et al., 2010) under constant stirring. The mixture was then retained at

157
-60°C for 15 h (Zullaikah et al., 2009) until liquid (LP) and solid phases (SP) were
formed. The LP was filtered through Whatman filter paper no.1 for enriched gamma
oryzanol.
Table 6.1 tabulates the effect of ethanol concentrations in ethyl
acetate/ethanol mixture on gamma oryzanol recovery. Gamma oryzanol contents in
LP were insignificantly different (p>0.05) under 0, 10, 20, and 30% (v/v) ethanol
conditions. With 40% (v/v) ethanol concentration, gamma oryzanol recovery was
reduced significantly (p<0.05), which could be attributed to low solubility of gamma
oryzanol in alcohol (Narayan et al., 2006; Antonio, et al., 2011). In other words,
gamma oryzanol was trapped in the residual impurities.
The LP was then subjected to second crystallization for further
isolation of gamma oryzanol, given the crystallization temperature and time of 5°C
and 15 h (Kaewboonnum et al., 2010). The recovery and purity of gamma oryzanol
were analyzed by spectrophotometry and HPLC. Higher ethanol concentration (40%
v/v) signficantly lowered gamma oryzanol recovery (47.35% and 44.87% for
spectrophotometry and HPLC) (p<0.05). However, variations in ethanol
concentrations had no significant effect on gamma oryzanol purity (89.93-90.38% and
87.38-87.40% for spectrophotometry and HPLC) (p>0.05). As a result, a 30% ethanol
concentration (70:30% v/v) was adopted to isolate gamma oryzanol from crude ORF
solution.
6.5.1.2 Effect of solvent to ORF ratio on the first crystallization
The ethyl acetate/ethanol mixture solvent to crude ORF ratio
was varied between 2.5:1.0, 5.0:1.0, 7.5:1.0, and 10.0:1.0 (v/v), given 70:30% (v/v)
ethyl acetate/ethanol mixture, and retained at -60°C for 15 h (Zullaikah et al., 2009).

158
In Table 2, gamma oryzanol recovery in LP significantly increased as the ratio
increased from 2.5:1.0 to 7.5:1.0 (v/v). This is because higher solvent to ORF ratio
increased concentration gradients between solute and solvent, thereby enhancing
gamma oryzanol solubility in LP. However, under 10.0:1.0 (v/v), gamma oryzanol
recovery was insignificantly different from that of 7.5:1.0 (v/v) ratio.
As shown in Table 6.2, high gamma oryzanol contents in LP
in turn increased the recovery and purity of gamma oryzanol in second crystallization.
By comparison, the recovery and purity of gamma oryzanol under 2.5:1.0 v/v were
lowest due to large quantities of residual mucilage in LP, which subsequently co-
precipitated in the second crystallization. On the other hand, higher solvent to ORF
ratios (7.5:1.0 and 10.0:1.0 v/v) significantly improved gamma oryzanol recovery and
purity (p<0.05). However, use of large quantities of solvent translates into high
production costs. As a result, the solvent to ORF ratio of 7.5:1.0 (v/v) was employed,
given the comparably high gamma oryzanol recovery and purity.
6.5.1.3 Effect of temperature on the first crystallization
The first-crystallization temperatures were varied between 0, -
15, -30, -45, and -60°C, given 15 h crystallization time. In Table 6.3, the recovery of
gamma oryzanol in LP was insignificantly different as temperatures rose from -15°C
to -60°C (p>0.05). Gamma oryzanol contents in LP under subzero conditions were
higher than at 0°C. This is consistent with Zullaikah et al. (2009), who documented
that the crystallization temperature of 0°C achieved low gamma oryzanol recovery
and subsequently low gamma oryzanol crystal.
First-crystallization LP was further subjected to second
crystallization, given the crystallization temperature and time of 5°C for 15 h

159
(Kaewboonnum et al., 2010). The second-crystallization results showed no significant
difference in the recovery and purity, given subzero first-crystallization temperatures
(-15, -30, -45, and -60°C). On the other hand, at 0°C, the recovery and purity were
comparatively low. The low recovery could be attributed to crystallization of gamma
oryzanol with impurities during the first crystallization. The mucilaginous impurities
in LP after the first crystallization also co-precipitated in the second crystallization
under 0°C condition, resulting in low purity. As a result, the first-crystallization
temperature of -15°C was adopted and used in subsequent experiments.
6.5.1.4 Effect of crystallization time on the first crystallization
The first-crystallization time was varied between 5, 7.5, 10,
12.5, 15 h, given -15°C crystallization temperature. In Table 6.4, gamma oryzanol
recovery belonging to 5 h crystallization time was significantly lower than that of 7.5
h condition (p<0.05). However, the differences were insignificant between 7.5, 10.0,
12.5, and 15.0h crystallization time (p>0.05).
Additionally, after the second crystallization at 5°C for 15 h
(Kaewboonnum et al., 2010), the recovery and purity of gamma oryzanol improved,
given the first-crystallization time between 5.0-7.5 h. However, the recovery and
purity of gamma oryzanol were insignificantly different for the first-crystallization
time beyond 7.5 h. As a result, the first-crystallization time of 7.5 h was adopted as it
could optimally remove impurities.
6.5.2 Second crystallization
6.5.2.1 Effect of temperature on the second crystallization
The second crystallization isolates gamma oryzanol with
higher purity from LP derived from the first crystallization. The second-crystallization

160
temperatures were varied between 0, 5, 10, 15, and 20°C, given 15 h crystallization
time. In Table 6.5, gamma oryzanol recovery at 0 and 5°C were insignificantly
indifferent (p>0.05). Higher temperatures (10-20°C) lowered gamma oryzanol
recovery as dissolution of gamma oryzanol was accelerated, adversely affecting the
recovery. According to Zullaikah et al. (2009), the recovery and purity of gamma
oryzanol at high process (crystallization) temperatures could be improved by
prolonging the crystallization time from 24 to 72 h. In this research, the purity of
gamma oryzanol was insignificantly different between different second-crystallization
temperatures (p>0.05), consistent with Kaewboonnum et al. (2010), who reported that
5°C was optimal for gamma oryzanol crystallization. As a result, the second-
crystallization temperature of 5°C was adopted.

161
Table 6.1 Effect of solvent mixture composition on gamma-oryzanol recovery.
Ethyl
acetate:ethanol
(v/v)
First crystallization1
Second crystallization2
Gamma oryzanol recovery (%)3
Gamma oryzanol recovery
(%)3
Purity (%)3
Spectrophotometry HPLC Spectrophotometry HPLC Spectrophotometry HPLC
100:0 80.03a±0.15 75.90
a±1.10 60.10
a±1.51 ND
4 90.38
a±1.57 87.40
a±2.00
90:10 79.80a±0.93 75.98
a±0.93 59.92
a±1.23 57.93
a±1.54 90.31
a±1.23 87.38
a±2.01
80:20 79.79a±1.01 75.90
a±1.01 60.13
a±1.59 58.03
a±2.01 90.29
a±1.35 87.39
a±1.95
70:30 79.78a±1.05 75.92
a±1.05 59.97
a±1.45 57.99
a±1.58 90.31
a±1.56 87.40
a±1.69
60:40 74.94b±1.10 71.94
b±1.10 47.35
b±1.20 44.87
b±2.11 89.93
a±1.61 87.38
a±1.75
1 Experimental condition was solvent:ORF = 5.0:1.0; crystallization temperature = -60°C; crystallization time = 15 h.
2 Experimental condition was crystallization temperature = 5°C; crystallization time = 15 h.
3 The values are the mean of three replications ± standard deviation. Different letters in each column denote statistically significant
differences between treatments (p<0.05).
4 ND = not determined.
161
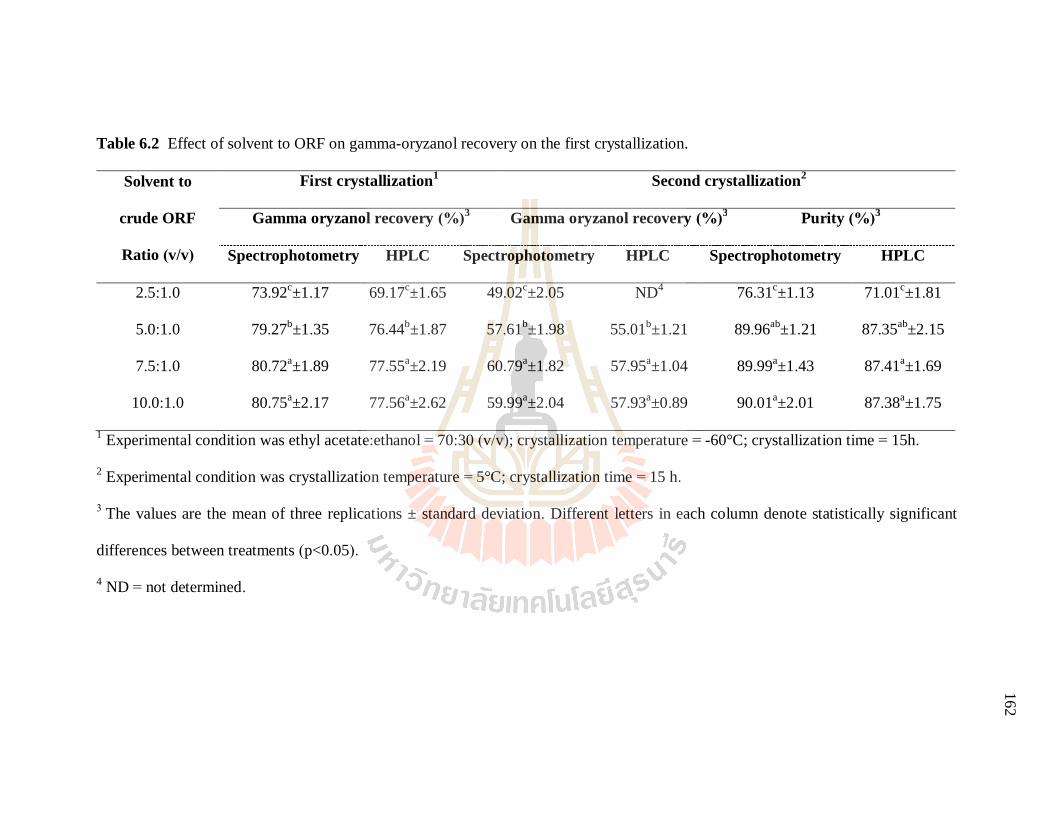
162
Table 6.2 Effect of solvent to ORF on gamma-oryzanol recovery on the first crystallization.
Solvent to
crude ORF
Ratio (v/v)
First crystallization1
Second crystallization2
Gamma oryzanol recovery (%)3 Gamma oryzanol recovery (%)
3 Purity (%)
3
Spectrophotometry HPLC Spectrophotometry HPLC Spectrophotometry HPLC
2.5:1.0 73.92c±1.17 69.17
c±1.65 49.02
c±2.05 ND
4 76.31
c±1.13 71.01
c±1.81
5.0:1.0 79.27b±1.35 76.44
b±1.87 57.61
b±1.98 55.01
b±1.21 89.96
ab±1.21 87.35
ab±2.15
7.5:1.0 80.72a±1.89 77.55
a±2.19 60.79
a±1.82 57.95
a±1.04 89.99
a±1.43 87.41
a±1.69
10.0:1.0 80.75a±2.17 77.56
a±2.62 59.99
a±2.04 57.93
a±0.89 90.01
a±2.01 87.38
a±1.75
1 Experimental condition was ethyl acetate:ethanol = 70:30 (v/v); crystallization temperature = -60°C; crystallization time = 15h.
2 Experimental condition was crystallization temperature = 5°C; crystallization time = 15 h.
3 The values are the mean of three replications ± standard deviation. Different letters in each column denote statistically significant
differences between treatments (p<0.05).
4 ND = not determined.
162

163
Table 6.3 Effect of temperature on gamma-oryzanol recovery on the first crystallization.
Temperature
(ºC)
First crystallization1
Second crystallization2
Gamma oryzanol recovery (%)3 Gamma oryzanol recovery (%)
3 Purity (%)
3
Spectrophotometry HPLC Spectrophotometry HPLC Spectrophotometry HPLC
0 44.96b±0.87 42.34
b±1.98 35.21
b±1.83 ND
4 89.90
ab±1.89 84.61
ab±1.11
-15 80.49a±1.29 75. 02
a±1.78 59.98
a±1.08 57.82
a±0.78 90.19
a±1.59 87.69
a±1.65
-30 80.57a±0.94 74.98
a±2.12 60.17
a±1.32 57.93
a±1.25 90.15
a±1.65 87.60
a±1.69
-45 80.55a±1.12 75.11
a±2.45 59.89
a±1.05 57.85
a±1.16 90.21
a±1.54 87.59
a±1.55
-60 80.59a±1.15 75.09
a±2.38 59.89
a±1.19 57.90
a±1.42 90.18
a±1.72 87.60
a±1.69
1 Experimental condition was ethyl acetate:ethanol = 70:30 (v/v); solvent:ORF = 7.5:1.0 (v/v); crystallization time = 15 h.
2 Experimental condition was crystallization temperature = 5°C; crystallization time = 15 h.
3 The values are the mean of three replications ± standard deviation. Different letters in each column denote statistically significant
differences between treatments (p<0.05).
4 ND = not determined.
163

164
Table 6.4 Effect of crystallization time on gamma-oryzanol recovery in the first crystallization.
Time
(hour)
First crystallization1
Second crystallization2
Gamma oryzanol recovery (%)3 Gamma oryzanol recovery (%)
3 Purity (%)
3
Spectrophotometry HPLC Spectrophotometry HPLC Spectrophotometry HPLC
5 44.84b±0.87 39.29
b±1.05 45.21
b±1.83 42.01
b±1.05 89.91
ab±2.09 87.51
ab±1.11
7.5 80.06a±0.99 75.00
a±1.31 59.98
a±1.08 57.98
a±1.68 90.09
a±2.10 87.59
a±1.65
10 80.05a±1.50 74.98
a±1.10 60.10
a±1.32 57.88
a±1.55 90.12
a±1.84 87.62
a±1. 69
12.5 80.05a±1.20 74.99
a±0.99 59.95
a±1.05 57.91
a±1.41 90.11
a±1.79 87.59
a±1.55
15 80.03a±1.02 75.01
a±1.01 59.93
a±1.19 57.86
a±1.49 90.13
a±1.83 87.60
a±1.69
1 Experimental condition was ethyl acetate:ethanol = 70:30 (v/v); solvent:ORF = 7.5:1.0 (v/v); crystallization temperature = -15°C.
2 Experimental condition was crystallization temperature = 5°C; crystallization time = 15 h.
3 The values are the mean of three replications ± standard deviation. Different letters in each column denote statistically significant
differences between treatments (p<0.05).
164
165
Figures 6.1 A-E illustrate the FESEM images and particle size histograms
of gamma oryzanol crystal under different second-crystallization temperatures (0, 5, 10,
15, and 20°C). Large particle sizes were present at low temperatures (0 and 5°C), with
75% of the particles larger than 150 µm. At higher crystallization temperatures (10, 15,
and 20°C), 74% of gamma oryzanol crystals were smaller than 150 µm. The results could
be attributed to the fact that low crystallization temperatures induced crystal growth and
aggregation of crystals, resulting in larger particle sizes.
6.5.2.2 Effect of crystallization time on the second crystallization
The second-crystallization time was varied between 1, 6, 11,
and 15 h, given 5°C crystallization temperature. In Table 6, gamma oryzanol recovery
was significantly positively correlated with crystallization time (p<0.05). At 1 h
crystallization time, the resulting gamma oryzanol crystal was of small particles
(Figure 6.2A). By comparison, extension of crystallization time increased the size of
gamma oryzanol crystal (Figures 6.2B-D), but the crystal sizes (100-300 nm) under
prolonged crystallization time were insignificantly different and the crystal shape was
similar. In addition, the crystalline structure and shape were similar to gamma
oryzanol standard (Figure 2E). Besides, variation in the crystallization time had no
effect on gamma oryzanol purity (Table 6.6). Thus, the crystallization time of 6 h was
adopted as the second-crystallization duration.
In short, the optimal ethanol concentration in the solvent
mixture was 30% v/v. The optimal first-crystallization solvent to ORF ratio,
crystallization temperature and time were 7.5:1 (v/v), -15°C, and 7.5 h. The optimal
second-crystallization temperature and time were 5ºC and 6 h, with gamma oryzanol
recovery and purity of 58.03-61.17% and 87.10-90.29%, respectively.

169
Table 6.5 Effect of temperature process on gamma-oryzanol recovery on the second crystallization.
Temperature (°C)
Gamma oryzanol recovery (%)1 Purity (%)
1
Spectrophotometry HPLC Spectrophotometry HPLC
0 59.91a±0.78 ND
2 90.21
a±0.95 87.10
a±0.95
5 59.98a±0.95 57.68
a±1.14 90.24
a±1.01 87.09
a±1.01
10 58.15b±0.98 55.61
b±0.89 90.19
a±1.01 87.15
a±0.95
15 55.94c±0.90 51.15
c±0.93 90.23
a±1.10 87.10
a±1.01
20 51.00d±0.90 46.00
d±1.06 90.21
a±1.10 87.08
a±1.05
1 Second crystallization time was 15 h after the first crystallization (ethyl acetate:ethanol = 70:30 (v/v); solvent:ORF = 7.5:1.0 (v/v);
crystallization temperature = -15°C, and crystallization time = 7.5 h). The values are the mean of three replications ± standard deviation.
Different letters in each column denote statistically significant differences between treatments (p<0.05).
2 ND = not determined.
1
66
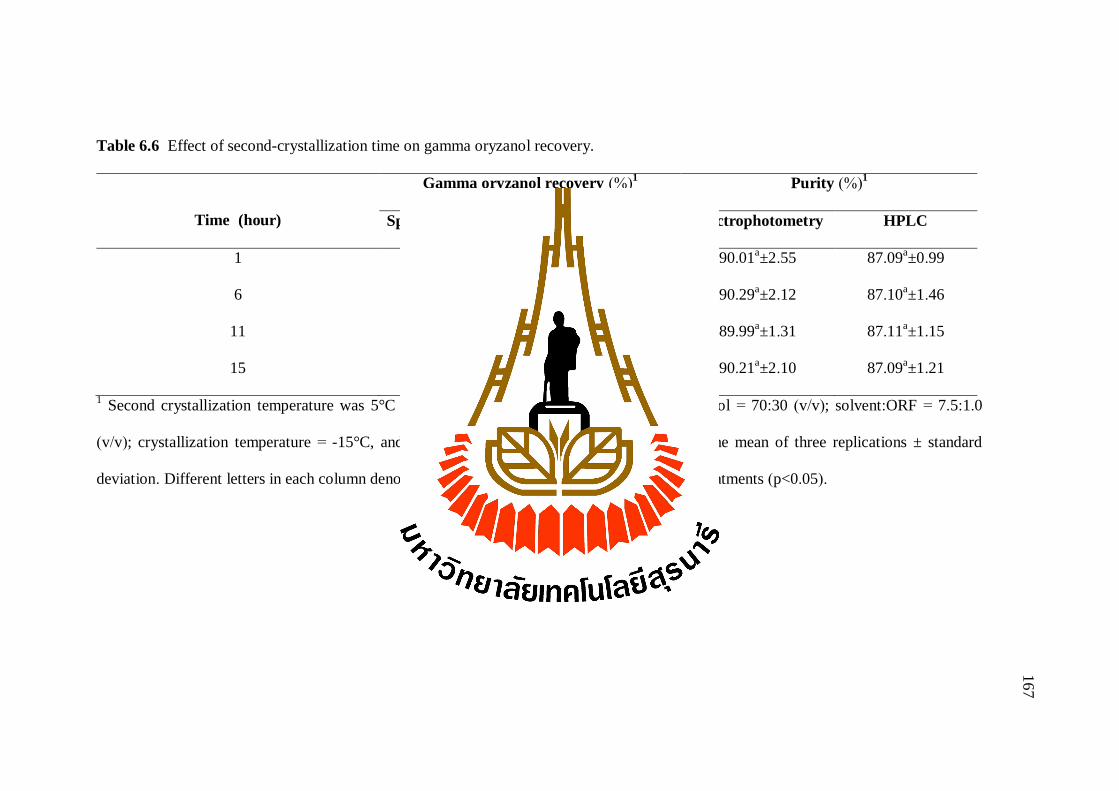
170
Table 6.6 Effect of second-crystallization time on gamma oryzanol recovery.
Time (hour)
Gamma oryzanol recovery (%)1 Purity (%)
1
Spectrophotometry HPLC Spectrophotometry HPLC
1 55.60b±1.18 51.16
b±1.28 90.01
a±2.55 87.09
a±0.99
6 61.17a±1.05 58.03
a±1.35 90.29
a±2.12 87.10
a±1.46
11 61.12a±2.08 57.98
a±1.43 89.99
a±1.31 87.11
a±1.15
15 61.16a±1.99 58.05
a±1.32 90.21
a±2.10 87.09
a±1.21
1 Second crystallization temperature was 5°C after the first crystallization (ethyl acetate:ethanol = 70:30 (v/v); solvent:ORF = 7.5:1.0
(v/v); crystallization temperature = -15°C, and crystallization time = 7.5 h). The values are the mean of three replications ± standard
deviation. Different letters in each column denote statistically significant differences between treatments (p<0.05).
167

168
6.5.3 The physiochemical properties of gamma-oryzanol
The physicochemical properties of gamma oryzanol crystal under the
optimal two-stage crystallization condition were characterized using HPLC, LC-MS,
and DSC; and results compared against gamma oryzanol standard.
Figure 6.3 compares the HPLC chromatograms of gamma oryzanol
standard and isolated gamma oryzanol (i.e., gamma oryzanol crystal) with four similar
peaks: cycloartenyl ferulate (retention time (RT) = 6.235 and 6.243 min), 24-
methylene cycloartanyl ferulate (RT = 7.050 and 7.065 min), campesteryl ferulate (RT
= 7.763 and 7.765 min), and β-sitosteryl ferulate (RT = 9.006 and 8.089 min).
Cycloartanyl ferulate and 24-methylene cycloartanyl ferulate were dominant in gamma
oryzanol crystal, consistent with (Patel & Naik, 2004; Kumar et al., 2015; Inamuddin,
2012; Gopala Krishna et al., 2001; and Khuwijitjaru et al., 2009). Interestingly, in this
study, 24-methylene cycloartanyl ferulate and β-sitosteryl ferulate in the standard and
isolated gamma oryzanol were significantly different (p<0.05) (Table 6.7). This could
be attributed to different solvent extraction methods and starting material effect
(Kurma et al., 2009).
The four characteristic peaks of isolated gamma oryzanol were
identified using LC-MS and compared with those of gamma oryzanol standard and
previous studies. In Figures 4A-D, the isolated gamma oryzanol showed fragmentation
patterns, including cycloartenyl ferulate (RT = 12.41 min, deprotonated molecular ion
[M-H]- at m/z 601.9 and 587), 24-methylcycloartenyl ferulate (RT = 13.75 min, [M-
H]- at m/z 615.9 and 601.0), campesteryl ferulate (RT = 15.11 min, [M-H]
- at m/z
575.9 and 561.0), and β-sitosteryl ferulate (RT = 17.51 min, [M-H]- at m/z 589.9 and
575.0). The results were consistent with those of gamma oryzanol standard and in

169
cold-pressed rice bran oil (Kumar et al., 2009; Das, Chaudhuri, Kaimal, & Bhalerao,
1998) and soapstock (Sakunpak et al., 2014). The melting points of isolated gamma
oryzanol and gamma oryzanol standard were between 125-130°C, which were slightly
different from that of isolated oryzanol from rice bran oil soapstock of Rao et al.
(2002) (120-125°C) and of Das et al. (1998) (132-135°C).
The HPLC, LC-MS, and DSC results of isolated gamma oryzanol
confirmed that gamma oryzanol derived from crude ORF of this research was
comparable to gamma oryzanol standard and those of previous studies. However,
gamma oryzanol standard had a higher lightness (L*) (94.25±0.50) than isolated
gamma oryzanol (83.33±0.98) (p<0.05). On the other hand, redness (a*) and
yellowness (b*) of gamma oryzanol standard were lower than isolated gamma
oryzanol. The high redness (0.57±0.02) and yellowness (4.69±0.03) of isolated gamma
oryzanol could be attributed to the impurities, e.g., triglyceride and mucilage.
6.6 Conclusion
This research investigated the effect of ethanol concentrations (0, 10, 20, 30,
and 40% v/v) in ethyl acetate/ethanol mixture and crystallization conditions (solvent to
ORF ratio, crystallization temperature, and crystallization time) on the recovery and
purity of gamma oryzanol isolated from dried rice bran soapstock. Two-step
crystallization was performed to isolate gamma oryzanol. The results showed that the
optimal ethanol concentration in the solvent mixture was 30% v/v. Given 70:30 (v/v)
ethyl acetate/ethanol mixture, the optimal first-crystallization solvent to ORF ratio,
crystallization temperature and time were 7.5:1 (v/v), -15°C, and 7.5 h. The liquid
phase derived from the first crystallization was subsequently subjected to second
crystallization for gamma oryzanol crystal. The optimal second-crystallization

170
temperature and time were 5ºC and 6 h, with gamma oryzanol recovery and purity of
58.03-61.17% and 87.10-90.29%, respectively. Furthermore, the physicochemical
properties of gamma oryzanol crystal were characterized and results indicated good
agreement between isolated gamma oryzanol and gamma oryzanol standard.
Essentially, the findings revealed that ethyl acetate/ethanol mixture, together with two-
step crystallization, is operationally viable for gamma oryzanol extraction from rice
bran soapstock.
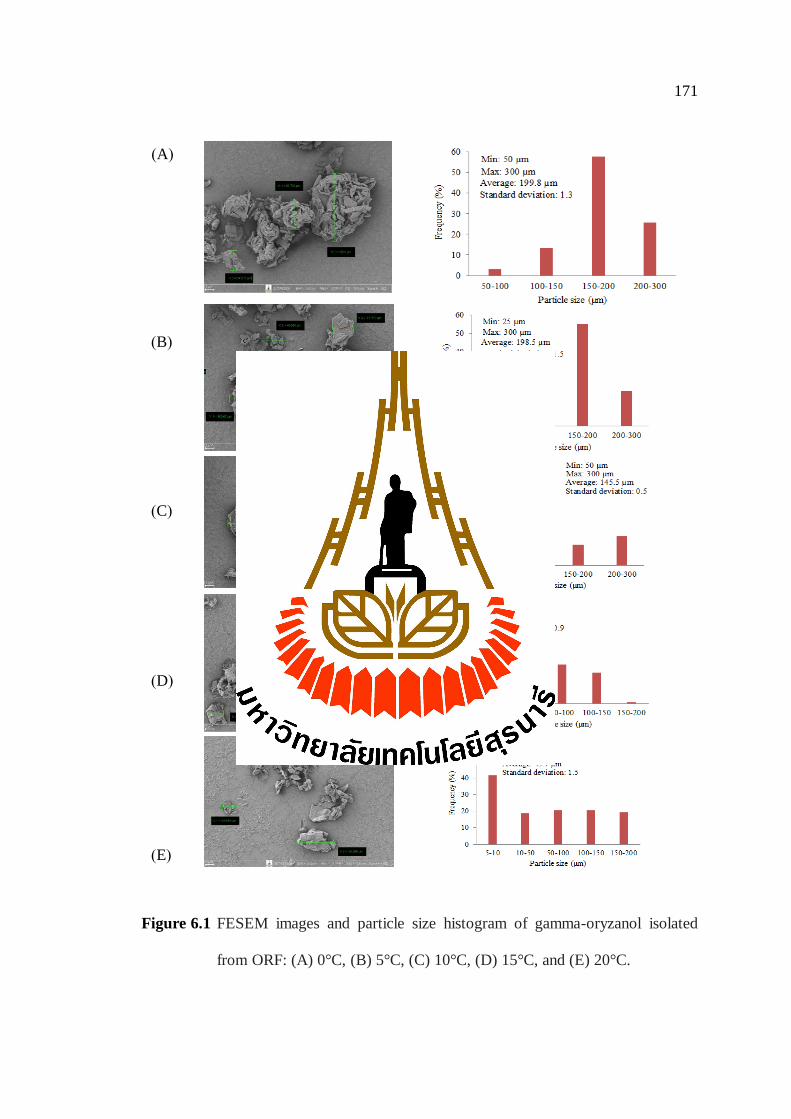
171
Figure 6.1 FESEM images and particle size histogram of gamma-oryzanol isolated
from ORF: (A) 0°C, (B) 5°C, (C) 10°C, (D) 15°C, and (E) 20°C.
(A)
(C)
(B)
(D)
(E)
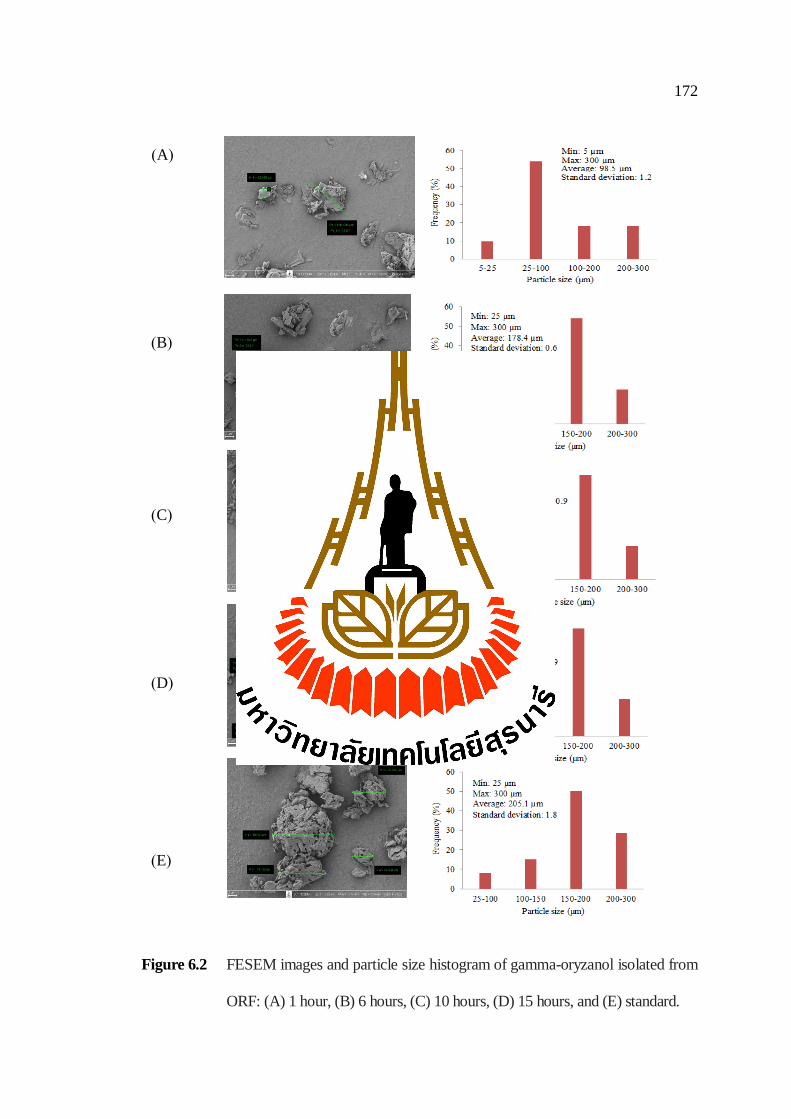
172
Figure 6.2 FESEM images and particle size histogram of gamma-oryzanol isolated from
ORF: (A) 1 hour, (B) 6 hours, (C) 10 hours, (D) 15 hours, and (E) standard.
(A)
(C)
(B)
(D)
(E)

173
Figure 6.3 HPLC chromatogram showing retention times of gamma-oryzanol
analogues at 325 nm (A:gamma-oryzanol standard; and B: gamma-
oryzanol isolated from ORF): (a) cycloartenyl ferulate; (b) 24 methylene
cycloartanyl ferulate; (c) campesteryl ferulate; (d) β-sitosteryl ferulate.
Numbers on HPLC peaks represent elution times (min).
(B)
(A)

174
Figure 6.4 Mass spectra of isolated gamma oryzanol: (A) cycloartenyl ferulate, (B)
24-methylene cycloartanyl ferulate, (C) campesteryl ferulate, (D) β-
sitosteryl ferulate.
(B) (A)
(C) (D)

175
Table 6.7 The properties of gamma-oryzanol standard and gamma-oryzanol isolated
from rice bran soapstock.
Gamma oryzanol
standard1
Isolated gamma
oryzanol1
Components (%)
Cycloartenyl ferulate 26.12±0.94 26.68±0.43
24-Methylene cycloartanyl
ferulate
35.27a±1.05 30.70
b±0.76
Campesteryl ferulate 23.20±0.55 23.21±0.23
β-Sitosteryl ferulate 15.41b±1.04 19.41
a±0.55
Color value
L* 94.25
a±0.16 83.33
b±0.95
a* -0.01
a±0.0 -0.57
b±0.01
b* 0.76
b±0.05 4.69
a±0.25
1 The values are the mean of three replications ± standard deviation. Different letters in
each row denote statistically significant differences between treatments (p<0.05).
Different letters in each column denote statistically significant differences between
treatments (p<0.05). The values are the mean of three replications±standard deviation.
6.7 References
Antonio, J. A. M., Eduardo, A. C. B., Mariana, C. C., and Marcelo, L. (2011). Liquid-
Liquid Extraction and Adsorption Applied to the Processing of Nutraceuticals
and Functional Foods. J. Agr. and Food Chem. 13(1): 120-291.
Das, P. K., Chaudhuri, A., Kaimal, T. N. B., and Bhalerao, U. T. (1998). Isolation of
gamma-oryzanol through Calcium Ion Induced Precipitation of Anionic Micellar
176
Aggregates. J. Agr. and Food Chem. 46(8): 3073-3080.
Engelmann, J. I., Ramos, L. P., Crexi, V. T., and Morais, M. M. (2017). Degumming
and Neutralization of Rice Bran Oil. J. Food Process Eng. 40(2): 1-10.
FAO report. (2018). FAO Rice Market Monitor (RMM). XXI (1): 1-38.
Gopala Krishna, A. G., Khatoon, S., Shiela, P. M., Sarmandal, C. V., Indira, T. N., and
Mishra, A. (2001). Effect of refining of crude rice bran oil on the retention of
oryzanol in the refined oil. J. Amer. Oil Chem.’ Soci. 78(2): 127-131.
Gunstone, F.D. (2011). Occurrence and characterisation of oils and fats. In: Vegetable
Oils in Food Technology. Gunstone, F.D., and Hardwood. J.L., (eds).
Blackwell Publishing, NY, p. 37-141.
Hong, K., Nakayama, K., and Park, S. (2002). Effects of protective colloids on the
preparation of poly(l-lactide)/poly(butylene succinate) microcapsules.
European Polymer J. 38(2): 305-311.
Inamuddin, A. M. (2012). Green solvent: properties and applications in chemistry.
Science-Business. Media Dordrecht. 2: 145-154
Joshi, M., Kaur, R., Kanwar, P., Dhiman, G., Sharma, G., Lata, S., Mishra, T. (2016).
To Evaluate Antioxidant Activity of Γ-Oryzanol Extracted From Rice Bran
Oil. Int. J. Life Sc. And Pharma Res. 6(3): 17-25.
Ju, Y. H., and Vali, S. R. (2005). Rice bran oil as a potential resource for biodiesel: A
review. J. Sci. and Industrial Res. 64(11): 866-882.
Kaewboonnum, P., Vechpanich, J., Santiwattana, P., and Shotipruk, A. (2010).
Gamma-oryzanol recovery from rice bran oil soapstock. Separation Sci. and
Technol. 45(9): 1186-1195.
177
Khuwijitjaru, P., Yuenyong, T., Pongsawatmanit, R., and Adachi, S. (2009).
Degradation Kinetics of Gamma-Oryzanol in Antioxidant-Stripped Rice Bran
Oil during Thermal Oxidation. J. Oleo Sci. 58(10): 491-497.
Kumar, R. R., Tiku, P. K., and Prakash, V. (2009). Preferential extractability of γ-
oryzanol from dried soapstock using different solvents. J. Sci. Food and Agr.
89(2): 195-200.
Kumar, Y., Patel, K. K., and Kumar, V. (2015). Pulsed Electric Field Processing in
Food Technology. Int. J. Eng. Studies and Technical Approach. 1(2): 6-17.
Masao, N., and S. Yoshizane, Oryzanol from Alkaline Cake of Rice Oil. (1968).
Japanese Patent 6812730. Chem. Abst. 1-19.
Narayan, Ayappapankave, Barhate Tajendrakumar, I. T. (2004). Process for
crystallization of oryzanol from oryzanol enriched fraction derived from rice
bran oil soapstock. WO 2004055040A1. Council research and industrial
research. 1-6.
Narayan, A. V., Barhate, R. S., and Raghavarao, K. S. M. S. (2006). Extraction and
purification of oryzanol from rice bran oil and rice bran oil soapstock. J.
Amer. Oil Chem.’ Soci. 83(8): 663-670.
Patel, M., and Naik, S. N. (2004a). Gamma-oryzanol from rice bran oil-A review. J.
Scie. and Industrial Res. 63: 569-578.
Rao, K. V. S. A., Thengumpilil, N. B. K., and Rao, B. V. S. K., (2002). Process of
isolation oryzanol from rice bran oil soapstock. US 6410762B1. Council
research and industrial research. 1-4.
Sakunpak, A., Suksaeree, J., Pathompak, P., Charoonratana, T., and Sermkaew, N.
(2014). Antioxidant individual gamma-oryzanol screening in cold pressed rice

178
bran oil of different thairice varieties by HPLC-DPPH method. Int. J.
Pharma. and Pharmaceutical Sci. 6(6): 592-597.
Seetharamaiah, G. S., and Prabhakar, J. V. (1986). Oryzanol Content of Indian Rice
Bran Oil and Its Extraction from Soap Stock. J. Food Sci. and Technol. 23:
270-273.
Sharma, R. D., and Rukmini, C. (1986). Rice bran oil and hypocholesterolemia in rats.
Lipids. 21(11): 715-717.
Thurman, B. H. (1961). Process for producing lecithin products from soapstock. US
2859240. Council research and industrial research. 1-8.
Venkatadri, A., and Sreesaila, K. (2005). Process for the production of gamma-
oryzanol enriched fraction from rice bran soapstock. US 6.896.911B2. Council
research and industrial research. 1-4.
Wilson, T. A., Nicolosi, R. J., Woolfrey, B., and Kritchevsky, D. (2007). Rice bran oil
and oryzanol reduce plasma lipid and lipoprotein cholesterol concentrations
and aortic cholesterol ester accumulation to a greater extent than ferulic acid in
hypercholesterolemic hamsters. J. Nutritional Biochem. 18(2): 105-112.
Wongwaiwech, D., Weerawatanakorn, M., Tharatha, S., and Ho, C. T. (2018).
Comparative study on amount of nutraceuticals in by-products from solvent
and cold pressing methods of rice bran oil processing. J. Food and Drug
Analysis. 12(3): 1-12.
Zullaikah, S., Melwita, E., and Ju, Y. H. (2009). Isolation of oryzanol from crude rice
bran oil. Bio. Technol. 100(1): 299-302.
CHAPTER VII
OVERALL CONCLUSION
The main purposes of this work were to determine the efficiency of the
extraction of lipid and gamma-oryzanol from rice bran and evaluated the
physiochemical properties of lipid and gamma-oryzanol obtained. For these purposes,
5 experiments were carried out. The first experiment focused on the effects of
ultrasound and thermal pretreatments combined cold press extraction on the increase
in the yield and the quality of rice bran oil (Chapter III). The next experiment was to
evaluate the effects of chemical neutralization (i.e., NaOH concentration, time, and
temperature process) on the oil recovery and physiochemical properties of the
neutralized rice bran oil (Chapter IV). Response surface methodology (RSM) was
used to find the optimal conditions for the chemical neutralization. The two last
experiments were done to evaluate the effect of ultrasound assisted solvent extraction
and kinetic model for the extraction of gamma-oryzanol from rice bran soapstock
(Chapter V), and the isolation method used in collecting the gamma-oryzanol powder
from gamma-oryzanol rich fraction (ORF) (Chapter VI). The summary of study was
summarized as follows:
Regarding the extraction methods, the ultrasound pretreatment and the
thermal pretreatment combined cold press extraction (CCE and UCE) were successful
in extracting lipid from rice bran. Various criteria were used for evaluating the quality

180
and the quantity of rice bran oil extract (i.e., oil extractability, IV, PV, PPV, gamma-
oryzanol content, color, and fatty acid profile). As our results, the ultrasonic power and
thermal cooking time was positively correlated to the oil extractability. High
ultrasound intensity (UCE 4.5- and UCE6.75-) and extended thermal cooking (CCE25
and CCE35) enhanced high oil extractability. However, high ultrasonic intensity and
extended cooking time resulted in a low crude rice bran oil quality Meanwhile, short
thermal cooking (CCE5) had less oil extractability than UCE (4.5- and 6.75-) and CCE
(15, 25, and 35), but the high quality of crude rice bran oil, especially fatty acid was
observed, which closely resembled those of the CE.
In the chemical refining, FFA, wax, and phospholipids were successfully
removed by NaOH solution. The effect of variable chemical neutralization parameters
on the oil recovery, free fatty acid ( FFA )level, and gamma-oryzanol content of
neutralized rice bran oil was evaluated by using response surface methodology .The
response surface methodology (RSM) results indicated the positive correlation among
NaOH concentration, temperature, and process time. These results also revealed that
there were strong impacts of NaOH concentration and process temperature on FFA,
gamma-oryzanol content and oil recovery and quality (Chapter IV). An increase in
NaOH concentration (10-20°Be) and process temperature (60-75°C) accelerated the
decrease of FFA and preserved gamma-oryzanol in oil. In addition, lower NaOH
concentration (10-20°Be) and shorter time (5-12min) also yielded greater oil recovery
and slightly reduced gamma-oryzanol. Whereas, an increase NaOH concentration from
20 to 30°Be and process time up to 15min led the oil yield loss and gamma-oryzanol
loss. From our results, the optimum neutralization condition was found to be
19.24°Be, 74.79°C, and 11.18 min. Under the optimum condition, the quality of rice

181
bran was improved, with a low FFA (0.39% oleic acid), phosphorus content (6.25ppm)
and peroxide value (5.31 meq O2/kg).
Gamma-oryzanol presented in dried rice bran soapstock was about 4.41 g/100
g dried soapstock. Our research aims to extract gamma-oryzanol from rice bran
soapstock. A mixture of ethyl acetate and ethanol (MEE, 85:15 (v/v)) was found to be
the highest yield of gamma-oryzanol rich fraction (ORF) using the ultrasound assisted
solvent extraction (UASE) technique (Chapter V). In this chapter, response surface
methodology (RSM) with a face-centered composite design ( FCCD) was used to
investigate optimal extraction conditions. The results showed that the optimum
conditions for ORF extraction from rice bran soapstock were 4.0 W/g, 50ºC, and 21.50
min. redeU ehe poetidn cpedtetpe , the gamma-oryzanol concentration was found to be
4.32 g gamma-oryzanol/100 g DRBS or 98.03% of yield compared with soxhlet
extraction. From the extraction model, the ultrasound power and the temperature
affected to the ORF recovery more significantly than that of extraction time.
Furthermore, the kinetic model confirmed that ultrasound parameters have a strong
affluence on the ORF recovery. Especially, ultrasound power and extraction
temperature have a predominant influence in Ce, h, and k of the kinetic model.
The purification of gamma-oryzanol using low temperature was experimented
by a two-step crystallization process (Chapter VI). In the first step crystallization,
gamma-oryzanol rich fraction (ORF) was dissolved in a mixture of ethanol in ethyl
acetate 30:70 (v/v) at 7.5:1 of solvent to solid ratio. The samples were then stored at -
15°C for 7.5 hours. The solid phase (wax and the impurities) and liquid phase were
separated by using high-speed centrifuge (10,000 rpm) and filtered using Whatman
filter no1. The liquid phase (LP) was crystallized again at 5°C for 6 h (the second
182
crystallization). The yield and purity of gamma-oryzanol obtained from this step were
68.89 wt% and 87.10 wt% by HPLC measurement. The physical properties of the
sample matrix such as color, melting, and individual composition were determined.
The melting point of gamma-oryzanol isolated from ORF and standard was in a range
of 125-130°C. In addition, gamma-oryzanol obtained was darker than gamma-
oryzanol standard due to the remaining wax and impurities. The gamma-oryzanol
standard and isolated from rice bran soapstock presented four important compounds
including 24-methylene cycloartanyl ferulate, campesteryl ferulate, cycloartenyl
ferulate or beta-sistosteryl ferulate. Specially, 24-methylene cycloartanyl ferulate and
campesteryl ferulate are considered as a major fraction of gamma-oryzanol.

183
APPENDIX A
PUBLICATIONS

184
LIST OF PUBLICATIONS
Journals
Phan, V.M., Junyusen, T., Liplap, P., and Junyusen, P. (2018). Effects of
ultrasonication and thermal cooking pretreatments on the extractability and
quality of cold press extracted rice bran oil. J. Food Process Eng. 42(2): 1-8.
Phan, V.M., Junyusen, T., Liplap, P., and Junyusen, P. (2019). Optimization of
chemical neutralization parameters for enhanced rice bran oil recovery and
quality. J. Suranaree J. Sci. Technol (Accepted-In press).
Phan, V.M., Junyusen, T., Liplap, P., and Junyusen, P. (2019). Optimization and
kinetics of ultrasound assisted solvent extraction of gamma oryzanol from
dried rice bran soapstock. J. Agriculture and Natural Resources (Under
review).
Phan, V.M., Junyusen, T., Liplap, P., and Junyusen, P. (2019). Isolation and
characterization of gamma oryzanol from rice bran oil soapstock. J. Food
Science and Nutrition (Under review).
Proceedings
Phan, V.M., Junyusen, T., Liplap, P., and Junyusen, P. (2017). Effect of ultrasound
pretreatment on the physiocchemical properties of cold press extracted rice
bran oil. The 3rd
International Conference on Chemical Engineering, Food
Biotechnology, 12-13 October 2017, Viet Nam.
185
Phan, V.M., Junyusen, T., Liplap, P., and Junyusen, P. (2019). Ultrasound assisted
solvent extraction oil from dried rice bran soapstock. The 12th
TSAE
International Conference, 14-15 March 2019, Thailand.
Phan, V.M., Junyusen, T., Liplap, P., and Junyusen, P. (2019). Kinetic modeling of
ultrasound assisted solvent extraction for rice bran oil from dried rice bran
soapstock. The 5th
National Food Engineering Conference, 28-29 March
2019, Thailand.
183
BIOGRAPHY
Mr. PHAN VAN MAN was born on the 5th of Sept 1986 in Quang Ngai
province, Vietnam. He graduated Bachelor of Food Engineering from Faculty of
Chemical and Food Engineering, HCM City University of Technology and Education
in 2009. After graduation, he was studied master degree at Faculty of Chemistry,
HCM City University of Technology, Vietnam. In 2016, he obtained the scholarship
“Provision of 2016 Postgraduate Scholarships for Foreign Students” to presence a
Doctor degree at school of Agricultural Engineering, Institute of Engineering,
Suranaree University of Technology, under the supervision of Assist Prof. Dr.
Tiraporn Junyusen and Assist Prof. Dr. Pansa Liplap. He conducted the research in the
topic of extraction lipid and gamma-oryzanol from rice bran.