extreme datamining: the killer appfor...
TRANSCRIPT

Extreme Data Mining:
the Killer App for Metalearning?
Carlos Soares
MAP-I 2007
id1847398108 pdfMachine by Broadgun Software - a great PDF writer! - a great PDF creator! - http://www.pdfmachine.com http://www.broadgun.com

Trading in the Stock Exchange:
The Machine Learning Way
� Goal: decide whether to buy or sell shares
� Table of data
sellbuy,-11: dOthersariablesAnFinancialVf
3
2
1
i decisionxi,1
xi,1
xi,1
xi,1
...............
1411234.2-0.6
-150327.20.7
...............
?9114.320.2
?15137.2-0.8
11 38.004.1 xxdecision
Apply
Train

Problem of Algorithm Selection
Understand
problem
and select
data sources
Prepare
data and
select task
Pro
ble
m Select
and execute
algorithms
Evaluate
modelsDeploy
WHICH ONE TO USE?and then some�
MLP
RBFN
RNN
SVM
Decision
Trees
�
ITL
Plan: Part I
PART I
� Background: why is this a problem?
� approximating functions with machine learning
� algorithm selection and bias
� a few solutions
� Meta-Learning: THE solution
PART II
� Meta-learning for Algorithm Recommendation

Problem (1/2)
� Quantifiable phenomena...
0.0 0.2 0.4 0.6 0.8 1.0
0.0
0.5
1.0
1.5
2.0
y=2*x
x
y
0.0 0.2 0.4 0.6 0.8 1.0
0.0
0.2
0.4
0.6
0.8
1.0
black: (x > 0.5) XOR (y > 0.5)
x
y

Problem (2/2)
� ... known only through samples
0.3 0.4 0.5 0.6 0.7 0.8 0.9
0.6
0.8
1.0
1.2
1.4
1.6
1.8
y=?(x)
x
y
0.0 0.2 0.4 0.6 0.8 1.0
0.0
0.2
0.4
0.6
0.8
1.0
color:?(x, y)
x
y

Applications of Machine Learning
� Based on data samples
� ... model
� which function describes the relationship
between x and y?
� how to describe the area in black as a function
of x and y?
� ... predict
� which is the value of y given x=0.35?
� which is the color of the point (x=0.3, y=0.7)?
0.3 0.4 0.5 0.6 0.7 0.8 0.9
0.6
0.8
1.0
1.2
1.4
1.6
1.8
y=?(x)
x
y
0.0 0.2 0.4 0.6 0.8 1.00.
00.
20.
40.
60.
81.
0
color:?(x, y)
x
y
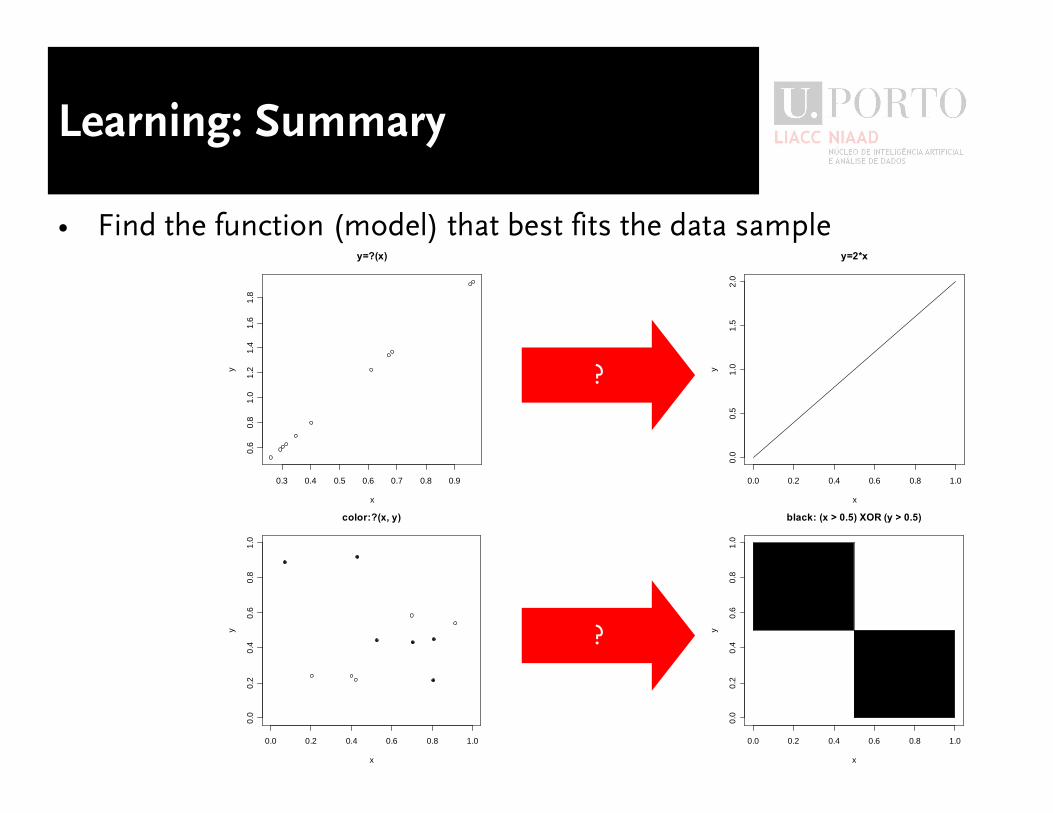
Learning: Summary
� Find the function (model) that best fits the data sample
0.3 0.4 0.5 0.6 0.7 0.8 0.9
0.6
0.8
1.0
1.2
1.4
1.6
1.8
y=?(x)
x
y
0.0 0.2 0.4 0.6 0.8 1.0
0.0
0.5
1.0
1.5
2.0
y=2*x
x
y
?
?
0.0 0.2 0.4 0.6 0.8 1.0
0.0
0.2
0.4
0.6
0.8
1.0
color:?(x, y)
x
y
0.0 0.2 0.4 0.6 0.8 1.00.
00.
20.
40.
60.
81.
0
black: (x > 0.5) XOR (y > 0.5)
x
y

Issues (1/2)
� Representativeness of sample
0.0 0.2 0.4 0.6 0.8 1.0
0.0
0.2
0.4
0.6
0.8
1.0
decision tree
black:x<0.57 AND y>0.67
x
y
0.0 0.2 0.4 0.6 0.8 1.0
0.0
0.2
0.4
0.6
0.8
1.0
black: (x > 0.5) XOR (y > 0.5)
x
y

Issues (2/2)
� Noise
0.0 0.2 0.4 0.6 0.8 1.0
0.0
0.2
0.4
0.6
0.8
1.0
black: (x > 0.5) XOR (y > 0.5)
x
y

Machine Learning Algorithms:
Examples
� Neural Networks
� Support Vector Machines
� Decision trees
� Rule induction
� Linear Discriminants
� Naive Bayes
� k-Nearest Neighbors
WHAT IS THE DIFFERENCE?

Bias
� Criteria to select one from a set of models
� adapted from des Jardins e Gordon (95)
� which is extended from Mitchell (80, 90), which did not include error
� Types of bias
� representation: hypotheses space
� procedural: search algorithm
� Corollary
� given a data sample and a learning algorithm
� ... not every model is possible

Example: Bias of ID3
� Top-Down Induction of Decision Trees
� Quinlan (86)
� Hypotheses space: DNF expressions
� disjunction of conjunctions
� ... defining hyperplanes that are orthogonal to the axes
� Search algorithm: Top-Down Induction
� start with simple models (large hyperplanes)
� increase complexity gradually (smaller hyperplanes)

Example: ID3 is Suitable
0.0 0.2 0.4 0.6 0.8 1.0
0.0
0.2
0.4
0.6
0.8
1.0
sample: 100 examples
x
y
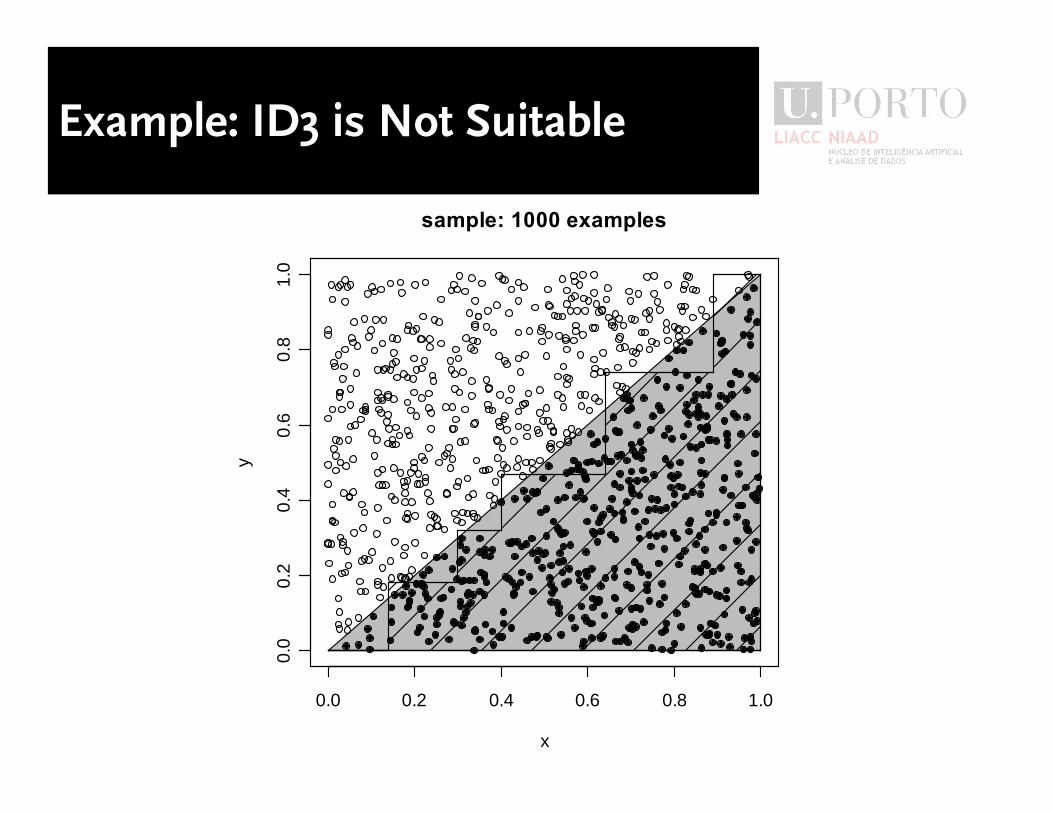
Example: ID3 is Not Suitable
0.0 0.2 0.4 0.6 0.8 1.0
0.0
0.2
0.4
0.6
0.8
1.0
sample: 1000 examples
x
y
Types of Hypotheses Spaces
(According to Langley - 2000)
� Decision trees
� Logical rules
� Cases
� Neural networks
� Probabilistic descriptions

Choice of Algorithm: Summary
� Limits to the models that may be obtained from a data sample
using any algorithm
� can be successful
� ... or not
0.0 0.2 0.4 0.6 0.8 1.0
0.0
0.2
0.4
0.6
0.8
1.0
sample: 100 examples
x
y
0.0 0.2 0.4 0.6 0.8 1.0
0.0
0.2
0.4
0.6
0.8
1.0
sample: 1000 examples
x
y

Solution I: Bias-Free Algorithm
� Bias-free learning is futile (Mitchell 97, Ch. 2)
� an algorithm that assumes nothing concerning the function it is trying to
learn has no rational basis to classify unknown cases
� Going back to the definition of bias
� criteria to prefer one model relative to another
� ... and the goal of learning
� find function (model) that best fits a data sample
� ... how to select the best model if all models are considered equally
suitable?

Solution II: The Hard Way
� Test all algorithms
� pick the one with the best results
� Computationally impossible
� many algorithms
� ... most with several parameters
� ... limited time

Solution III: The Chosen One
� Experimental study
� a few algorithms (a few parameter settings)
� ... a few problems
� ... pick best
� ... use always
� No-Free Lunch Theorem
� Wolpert (96)
� the mean error of all algorithms for all problems in the universe is the same
(assuming no information about the problem is used)
� ... limited practical value
� ... but the corollary is verified in practice
� empirical studies show that �the chosen one� does not exist
Solution IV: Meta-Learning
� Biases, biases... not really
� ... implementations of biases
� ... or algorithms
� There are other definitions
Learning by experience when different
biases are suitable for particular
problems
Rendell, Seshu e Tcheng (1987)

Solutions for Algorithm Selection:
Summary
� Bias is necessary
� Trying all alternatives is not possible
� Choice is important
� Meta-learning: learning models to select which algorithm to use for
which problems
� and more...

Plan: Part I
PART I
� Background: why is this a problem?
� Meta-Learning: THE solution
� difference between base-level and meta-level learning
� different meta-learning approaches
PART II
� Meta-learning for Algorithm Recommendation

The Meta-Learning Picture
DS2
DS 1
�Data sets
�Algorithms
A2
A1
META-DATA

Said Differently, Meta-Learning�
� Applying learning methods to model the relationship between the
characteristics of learning problems and the suitability of biases
� [Meta-]data
� sample: learning problems
� points
� problem characteristics
� x and y
� suitability of biases
� black or white
0.0 0.2 0.4 0.6 0.8 1.0
0.0
0.2
0.4
0.6
0.8
1.0
suitability of bias:?(x, y)
x
y

Base vs. Meta: Examples
3
2
1
i targetxi,1
xi,1
...
...
...
?..
?..
?..
Apply
Train
Meta
� learning problems
� e.g. medical diagnosis of disease x
in hospital y ; direct marketing for
company z
Base
� individuals of interest in the
domain
� e.g. patients; clients
11 38.004.1 xxtarget
3
2
1
i targetxi,1
xi,1
...
...
...
3
2
1
i targetxi,1
xi,1
...
...
...
3
2
1
i targetxi,1
xi,1
...
...
...
3
2
1
i targetxi,1
xi,1
...
...
...
3
2
1
i targetxi,1
xi,1
...
...
...
3
2
1
i targetxi,1
xi,1
...
...
...

Base vs. Meta: Target Variable
3
2
1
i targetxi,1
xi,1
...
...
...
?..
?..
?..
Apply
Train
Meta
� algorithm
� e.g. decision trees, MLP
Base
� problem-specific decision
� e.g. diagnosis; send catalog or not
11 38.004.1 xxtarget

Base vs. Meta: Independent
Variables
3
2
1
i targetxi,1
xi,1
...
...
...
?..
?..
?..
Apply
Train
Meta
� problem characteristics and
suitability measures
� e.g. number of variables, number
of classes and classification error
Base
� different characteristics of
individuals
� e.g. job, age and income of
person; price and type of product
11 38.004.1 xxtarget

Base vs. Meta: Problem
3
2
1
i targetxi,1
xi,1
...
...
...
?..
?..
?..
Apply
Train
Meta
� relationship between problem
characteristics and suitability of biases
� e.g. sample morphology and
performance of algorithms
Base
� relationships between variables
from a domain
� e.g. individual profile and income;
symptoms and diagnosis
11 38.004.1 xxtarget

Meta-Learning Approaches
� Type of goal
� continuous adaptation of models/algorithms
� model construction
� model combination
� algorithm selection
� Other classifications are possible
Continuous Adaptation of
Models/Algorithms
� Change bias while solving a problem and across different problems
� also known as �knowledge transfer� or �learning to learn�
� Example: Self-Modifying Policies
� Schmidhuber, Zhao and Schraudolph (97)
� parts of the algorithm are able to change other parts of the same algorithm
� ... even themselves
� probability of application of a part depends on its past merit
� illustrated with a reinforcement learning algorithm
� ... assumes problems are similar
Model Construction
� Build a model made of parts with different biases
� Example: Model Class Selection
� Brodley (93)
� recursive partitioning algorithm (decision trees-alike)
� choice of better bias at each node
� tested with 3 different biases
� ... no real learning at the meta-level: choice is based on fixed rules
Model Combination
� Meta-model combining several different base models
� Examples: Stacked Generalization/Cascade Generalization
� Wolpert (92)/Gama and Brazdil (00)
� meta-dataset including the predictions made by the base models
� meta-model obtained by learning with the meta-dataset
� possibly recursive

Algorithm Selection
� Choosing one (or more) algorithms for a given problem
� Examples: algorithm recommendation
� Rendell, Seshu and Tcheng (87)
� Variable Bias Management System
� Aha (92)
� generalization from case studies
� Brazdil, Gama and Henery (94)
� systematic approach
� as part of the StatLog Project
� METAL project (02 � many publications by many authors)
� follow-up to the work on the StatLog project
� Data Mining Advisor website
� www.metal-kdd.org

Plan: Part II
PART I
� Background: why is this a problem?
� Meta-Learning: THE solution
PART II
� Meta-learning for Algorithm Recommendation
� context & goals
� ranking methodology based on the k-NN
� evaluation methodology
� results on the problem of recommending classification algorithms
� Discussion
� Recommendation of Parameter Settings of SVM

Application Context:
Data Mining
� Many alternative methods
� common approach is experimentation
Goal of algorithm recommendation: save time/computational
resources with minimal loss in the quality of results
Understand
problem
and select
data sources
Prepare
data and
select task
Pro
ble
m Select
and execute
algorithms
Evaluate
modelsDeploy
MLP
RBFN
RNN
SVM
Decision
Trees
�
ITL
Understand
problem
and select
data sources
Prepare
data and
select task
Pro
ble
m Select
and execute
algorithms
Evaluate
modelsDeploy
MLP
RBFN
RNN
SVM
Decision
Trees
�
ITL

Research Context:
Meta-Learning
Goal of meta-learning: accurately predict the relative performance of
algorithms (i.e., ranking)
3
2
1
i targetxi,1
xi,1
...
...
...
?..
?..
?..
Apply
Train

Data Preparation
� Define alternatives
� 10 classification algorithms
� Define examples
� 57 problems mostly from the UCI repository
� Obtain performance meta-data
� run all algorithms on all the data sets
� computationally intensive�
� but time to obtain results is not critical
� measure classification accuracy
� Characterize data sets
� meta-features: # examples, # continuous variables, etc.

k-NN Ranking Method
dc2
dc1
Given new data set
1. characterize it
� e.g., # attributes, # examples
2. select k nearest neighbors
3. retrieve performance information
� e.g., accuracy
4. build recommended ranking by
aggregating performance information
1.
2.
3. Alg 1 61%Alg 2 89%�
1. Alg 2
2. Alg 3
�
n Alg 14.
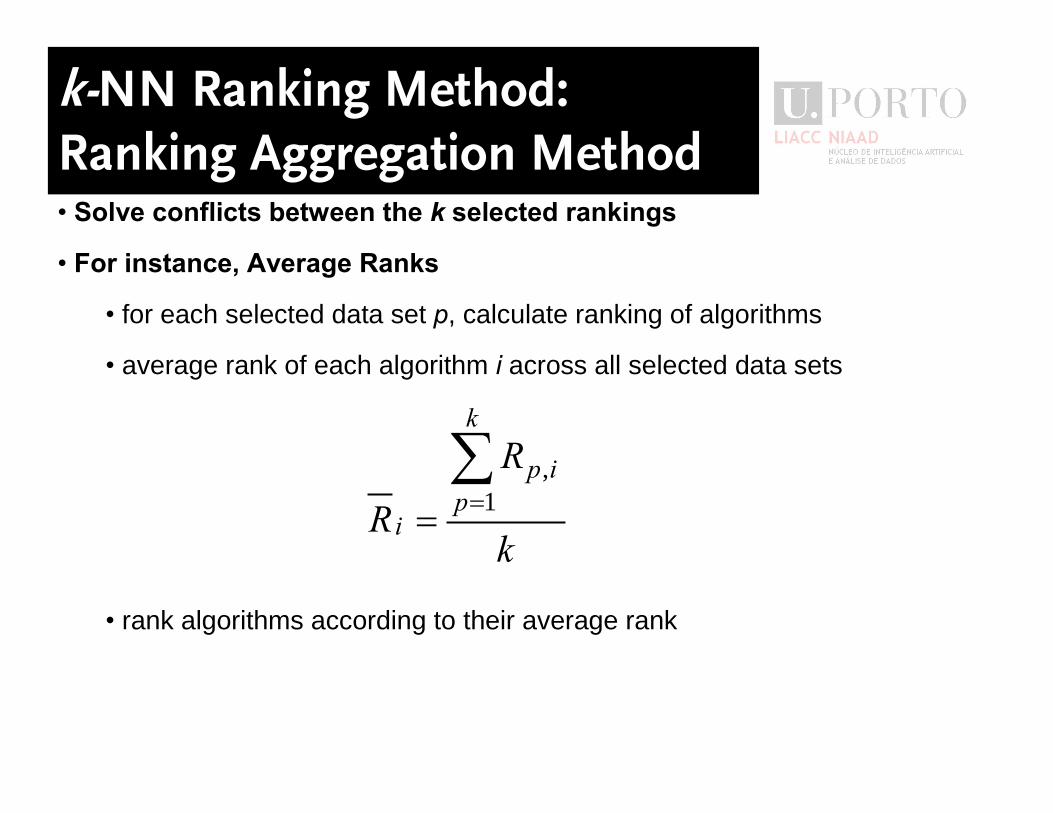
k-NN Ranking Method:
Ranking Aggregation Method
k
R
R
k
p
ip
i
1
,
� Solve conflicts between the k selected rankings
� For instance, Average Ranks
� for each selected data set p, calculate ranking of algorithms
� average rank of each algorithm i across all selected data sets
� rank algorithms according to their average rank

k-NN Ranking Method:
Example
� Recommendation for the letter data set using 3-NN
85134109751predicted
59138107642pendigits
83461910752isolet
83145910762byzantine
RIPNBIB1LtLDRBFNMLPC5tC5rbC5ranks
algorithms
data sets
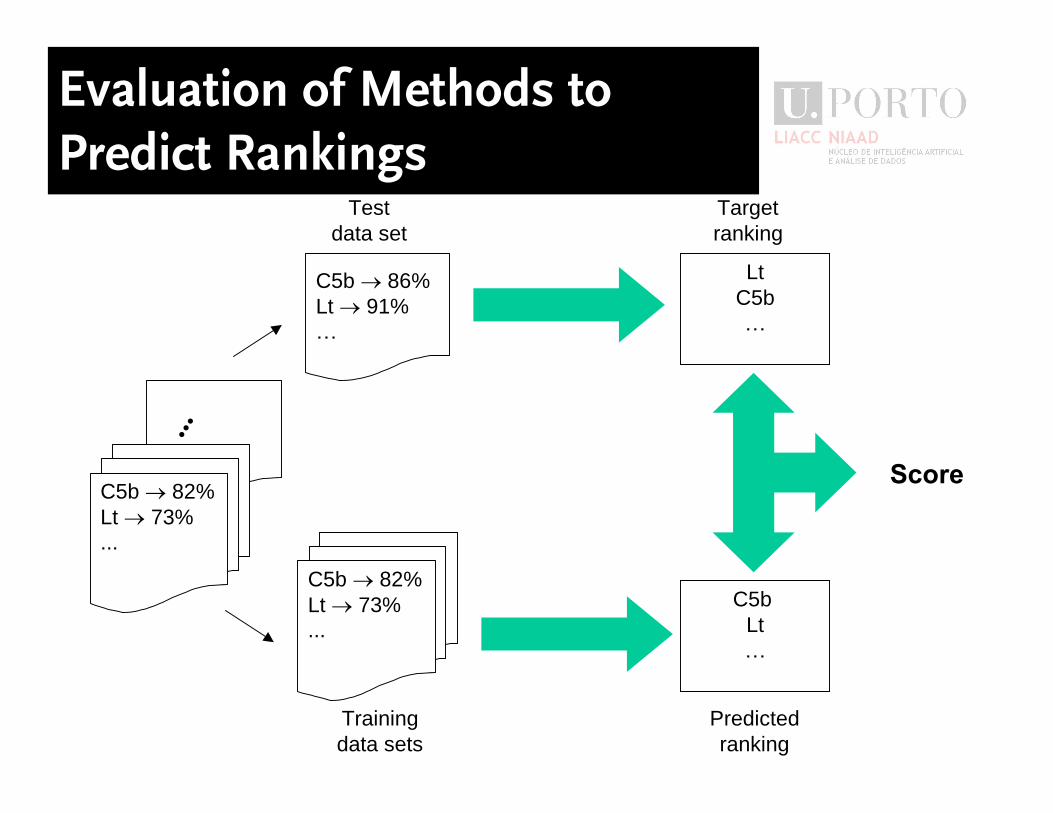
Evaluation of Methods to
Predict Rankings...
C5b 82%Lt 73%...
Trainingdata sets
Predictedranking
C5b 86%Lt 91%�
Testdata set
LtC5b�
Targetranking
Score
C5b 82%Lt 73%...
C5b Lt�

Measuring Ranking Accuracy
69248107531target
85.51.53410975.51.5predicted
RIPNBIB1LtLDRBFNMLPC5tC5rbC5ranks
� Target ranking
� representing performance of algorithms on the �new� data set
� Spearman�s Rank Correlation Coefficient
� values range from �1 to 1
nn
RR
r
n
i
ii
S
31
2�6
1
709.0Sr

Default Ranking
69248107531target
59638107421default
RIPNBIB1LtLDRBFNMLPC5tC5rbC5Ranks
� Baseline
� simple method
� assess whether ranking method is finding useful patterns
� Default ranking
� apply ranking aggregation method on all the rankings
709.0879.0 Sr
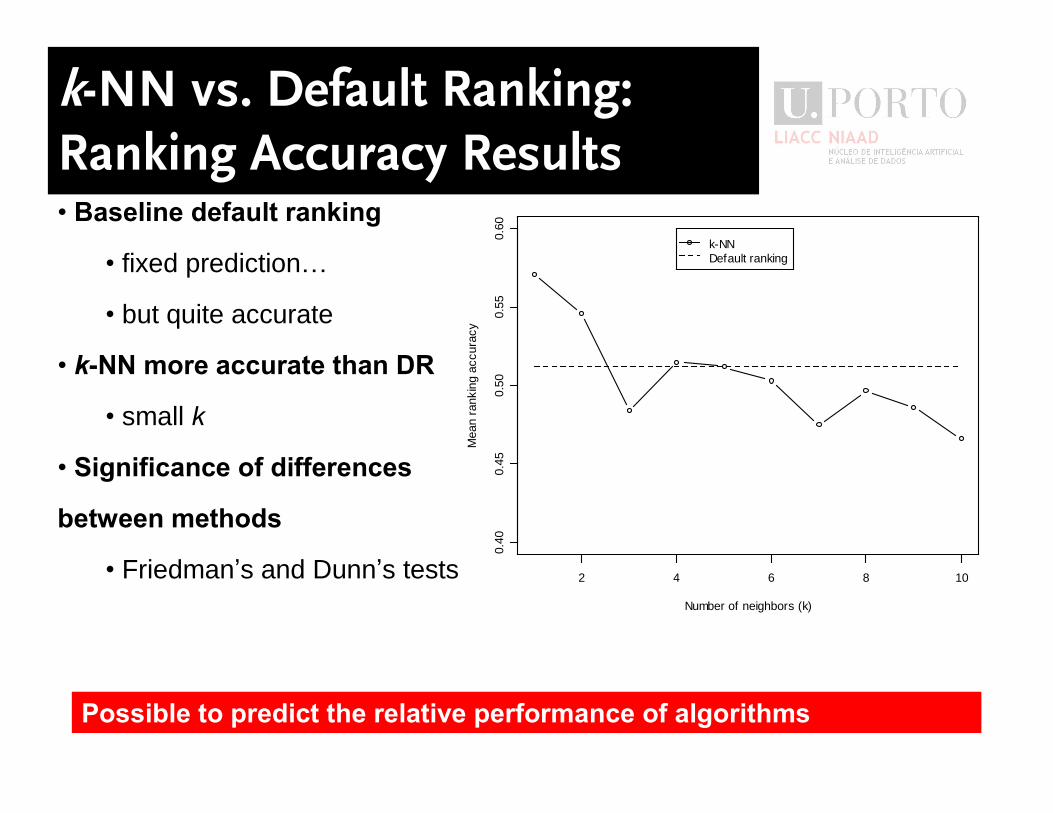
k-NN vs. Default Ranking:
Ranking Accuracy Results
2 4 6 8 10
0.40
0.45
0.50
0.55
0.60
Number of neighbors (k)
Mea
n ra
nkin
g ac
cura
cy
k-NNDefault ranking
� Baseline default ranking
� fixed prediction�
� but quite accurate
� k-NN more accurate than DR
� small k
� Significance of differences
between methods
� Friedman�s and Dunn�s tests
Possible to predict the relative performance of algorithms

Measuring Value of
Recommended Rankings
� Accurate rankings are not necessarily useful
� goal is to save time with minimal loss in (classification) accuracy
� Value depends on the use
� order defined by ranking is followed�
� but number of algorithms executed is not known beforehand
� Top-N evaluation
� best accuracy of top-N algorithms in the ranking
� total cost of executing them
RBFN�NBC5RLDLTIB1bC5recommendation for
letter
81%/56s
87%/81s 88%/478s

k-NN vs. Default Ranking:
Top-N Results
2 4 6 8 10
0.80
0.82
0.84
0.86
0.88
0.90
Classification accuracy nb. of algorithms
Number of algorithms (N)
Mea
n ac
cura
cy
1-NN2-NNDR
500 1000 2000 5000 10000
0.80
0.82
0.84
0.86
0.88
0.90
Classification accuracy execution time
Mean execution time (log s)
Mea
n ac
cura
cy
8 min86.5
(-1.8)
bC5
20
min
87.5
(-0.8)
Top-2
86.8
(-1.5)
88.3
Acc.
(%)
11
min
Top-1
2.5 hAll
Time
� Difficult problem!
� Possible to save significant amounts of time with small loss in
accuracy
� Ranking is more suitable for algorithm recommendation

Ranking According to Accuracy
and Time
� Incorporate knowledge about the goal into the recommendation method
� save time with minimal loss in (classification) accuracy
� Adjusted Ratio of Ratios
� Parameter defining relative importance of accuracy and time
� AccD= the accuracy the user is willing to trade for a 10 times speedup
j
i
j
i
ji,
T
TAccD
SR
SR
ARR
log1

k-NN with ARR: Top-N Results
� Better results sooner
� less accurate algorithms at the top�
� but more algorithms are executed
500 1000 2000 5000 10000
0.85
0.86
0.87
0.88
0.89
Classification accuracy execution time
Mean execution time (log s)
Mea
n ac
cura
cy
10%1%SRR
500 1000 2000 5000 10000
0.85
0.86
0.87
0.88
0.89
AccD=10%
Mean execution time (log s)
Mea
n cl
assi
ficat
ion
accu
racy
ARRDR
Problem-specific knowledge is more important than the choice of
aggregation method

Plan: Part II
PART I
� Background: why is this a problem?
� Meta-Learning: THE solution
PART II
� Meta-learning for Algorithm Recommendation
� Discussion
� pre-selection of alternatives
� obtaining problems
� characterization of problems
� meta-accuracy
� other applications
� Recommendation of Parameter Settings of SVM

Pre-selection of Alternatives
� Which algorithms?
� the ones in available tools
� constraints on acceptable models
� e.g. understandability
� preferences of the data analyst
� ... or ignorance concerning others
� Which parameters?
� domains are frequently infinite
� continuous parameters
� Is the selected set adequate?

Pre-selection of Alternatives:
Overall Relevance
� For most data sets there should be an alternative that obtains an
error which is lower than the error of a given baseline
Min
imum
NM
SE
0.0
0.2
0.4
0.6
0.8
1.0
1km
abal
one
acce
lera
tion
aile
rons
avai
labl
e_po
wer
bank
32nh
bank
8FM
cal_
hous
ing
cart
clos
edow
clos
enik
kei
CO
2-em
issi
oncp
u_ac
tcp
u_sm
all
CW
_dra
g d2de
lta_a
ilero
nsde
lta_e
leva
tors
driv
ing_
nois
eel
evat
ors
fluid
_dis
char
geflu
id_s
wirl
frie
dfu
el_c
onsu
mpt
ion_
coun
try
fuel
_con
sum
ptio
n_to
tal
fuel
_con
sum
ptio
n_to
wn
heat
hous
e_16
Hho
use_
8Lho
usin
gin
dki
n8nm
mai
ntan
ence
_int
erva
lm
axim
al_t
orqu
em
vpu
ma3
2Hpu
ma8
NH
stee
ring_
acce
lera
tion
stee
ring_
angl
est
eerin
g_ve
loci
tyte
leco
mm
top_
spee
d

Pre-selection of Alternatives:
Overall Competitiveness
� Given some pre-selected set of alternatives, the results cannot be
further significantly improved by adding additional ones
Min
imum
NM
SE
0.0
0.2
0.4
0.6
0.8
1.0
1km
abal
one
acce
lera
tion
aile
rons
avai
labl
e_po
wer
bank
32nh
bank
8FM
cal_
hous
ing
cart
clos
edow
clos
enik
kei
CO
2-em
issi
oncp
u_ac
tcp
u_sm
all
CW
_dra
g d2de
lta_a
ilero
nsde
lta_e
leva
tors
driv
ing_
nois
eel
evat
ors
fluid
_dis
char
geflu
id_s
wirl
frie
dfu
el_c
onsu
mpt
ion_
coun
try
fuel
_con
sum
ptio
n_to
tal
fuel
_con
sum
ptio
n_to
wn
heat
hous
e_16
Hho
use_
8Lho
usin
gin
dki
n8nm
mai
ntan
ence
_int
erva
lm
axim
al_t
orqu
em
vpu
ma3
2Hpu
ma8
NH
stee
ring_
acce
lera
tion
stee
ring_
angl
est
eerin
g_ve
loci
tyte
leco
mm
top_
spee
d
21
11
5

Pre-selection of Alternatives:
Individual Competitiveness
� For every alternative, we should be able to identify at least one data
set for which it is the best one, from the pre-selected setN
umbe
r of d
ata
sets
in to
p ra
nk
01
23
45
6
0.25 1 4 16 64 25
6
1000
4000
1600
0
6400
0
2560
00
0.25 1 4 16 64 25
6
1000
4000
1600
0
6400
0
2560
00

Pre-selection of Alternatives:
Individual Relevance
� For every alternative, there should not exist another one such that
the performance of former is never significantly better than that of
latter for all data sets considered
� each setting is significantly better than each of the others on at least one data
set
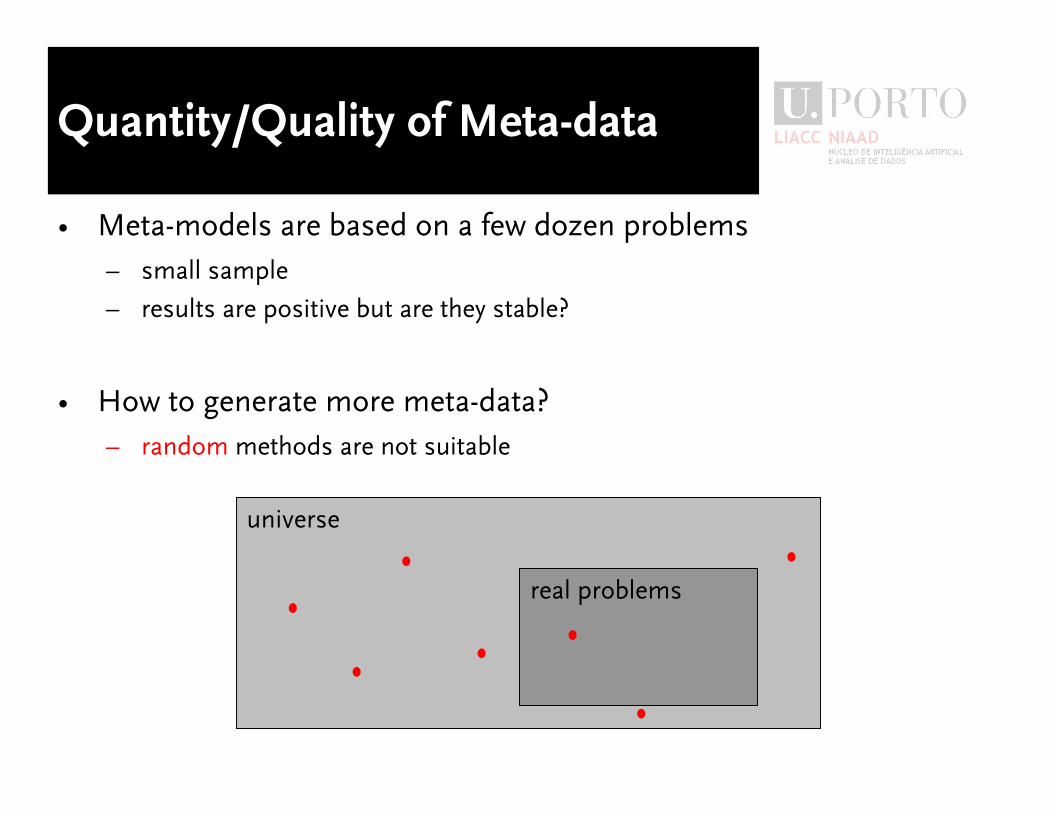
Quantity/Quality of Meta-data
� Meta-models are based on a few dozen problems
� small sample
� results are positive but are they stable?
� How to generate more meta-data?
� random methods are not suitable
universe
real problems

Simulated Applications using Real
Data
� Get real data
� any source is fine
� e.g. transactions, time between events
� Simulate applications
� one problem for each variable
� � corresponding value may not make any sense
� Goal
universe
real
problems

Characterization of Datasets
3
2
1
i targetxi,1
xi,1
...
...
...
?..
?..
?..
Apply
Train
11 38.004.1 xxtarget
3
2
1
i targetxi,1
xi,1
...
...
...
3
2
1
i targetxi,1
xi,1
...
...
...
3
2
1
i targetxi,1
xi,1
...
...
...
3
2
1
i targetxi,1
xi,1
...
...
...
3
2
1
i targetxi,1
xi,1
...
...
...
3
2
1
i targetxi,1
xi,1
...
...
...
� Meta-Dataset
ePerformancDataSetsmodelmeta :

Meta-Features
� c is a mapping between a matrix of values of variable size and type
and a set of values of fixed size
c2399,49,1,0.65,�
examples
continuous
variables
symbolic
variables
max.
correlation
continuous-
target
ePerformancDataSetscmodelmeta )(:
3
2
1
i decisionxi,1
xi,1
xi,1
xi,1
...............
1411234.2-0.6
-150327.20.7

Good Meta-features
� Measures that potentially
contain information about the
relative performance of
algorithms
� ... but are computationally
cheaper than the algorithms
� probably the hardest problem!
?
0.0 0.2 0.4 0.6 0.8 1.0
0.0
0.2
0.4
0.6
0.8
1.0
suitability of bias:?(x, y)
x
y

Approaches to Characterize
Problems
� General, Statistical and Information-theoretic meta-features
� à la StatLog
� ex. # attributes, proportion of numeric attributes with outliers, class entropy
� Landmarkers
� Bensusan and Giraud-Carrier (2000)
� results of simple algorithms used to predict the performance of more
complex ones
� subsampling landmarkers: results of comples algorithms on subsamples of
the data
� Furnkranz and Petrak (01), Soares, Petrak and Brazdil (01)
� Model-based
� Bensusan, Giraud-Carrier and Kennedy (2000)
� properties of an induced model

Meta-Feature Selection
� Adequate choice of meta-features is essential
� k-NN algorithm assigns the same weight to all variables
� measures that potentially contain information about the relative
performance of algorithms
� Knowledge-based approach
� identify properties of the data
� select/design meta-features representing those properties

Meta-Feature Selection:
Classification
Property Measure
Scalability # examples Nominal vs. numeric attributes proportion of symbolic attributes
Robustness to missing values proportion of missing values
Robustness to outliers proportion of numeric attributes with outliers
Number of classes
Frequency of classes class entropy
Information in nominal attributes mean mutual information of class and attributes
Information in numeric attributes canonical correlation of the most discriminating single linear combination of numeric attributes and the class distribution
� Set used so far
� Other properties and measures could be used

Results with Selected
Classification Meta-Features
2 4 6 8 10
0.30
0.35
0.40
0.45
0.50
0.55
0.60
Mean Ranking Accuracy
Number of neighbors (k)
r S
Sel-setStat-setMet-setDR
500 1000 2000 5000 10000
0.80
0.82
0.84
0.86
0.88
0.90
Classification accuracy execution time
Mean execution time (log s)
Mea
n ac
cura
cy
� Significantly better than previous sets of meta-features
� general, statistical and information-theoretic measures
Informal method for meta-feature selection/design
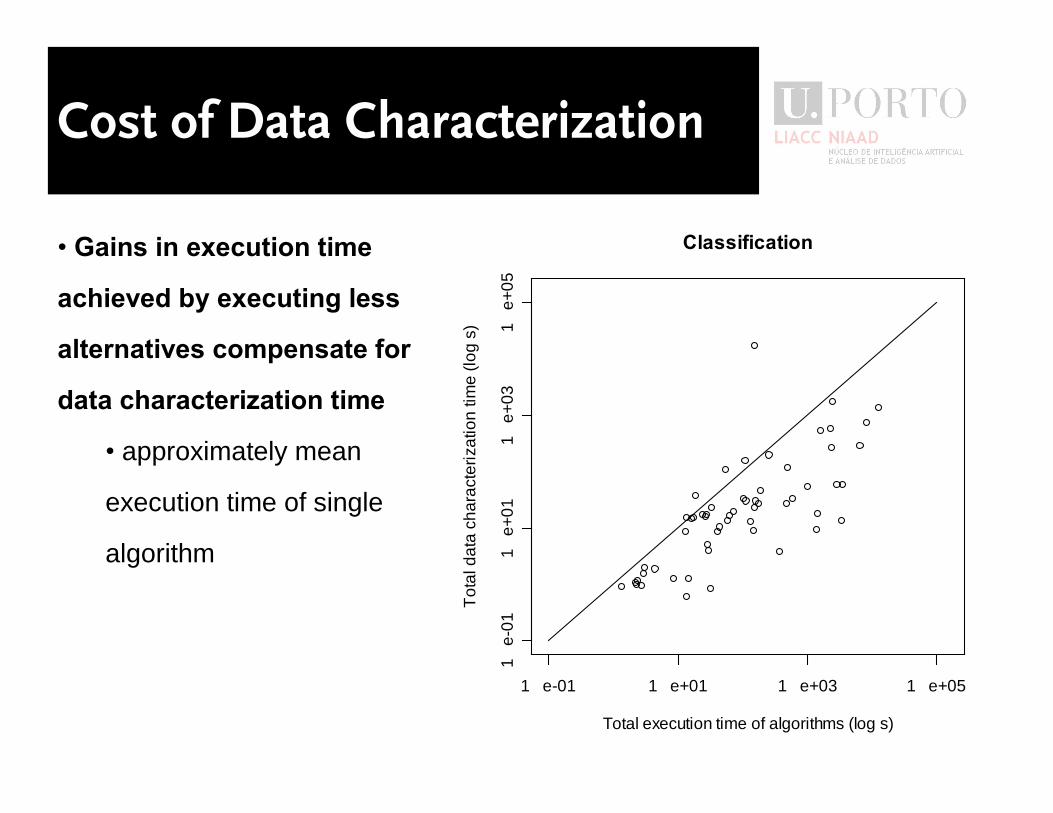
Cost of Data Characterization
� Gains in execution time
achieved by executing less
alternatives compensate for
data characterization time
� approximately mean
execution time of single
algorithm
1 e-01 1 e+01 1 e+03 1 e+05
1 e
-01
1 e
+01
1 e
+03
1 e
+05
Classification
Total execution time of algorithms (log s)
Tot
al d
ata
char
acte
rizat
ion
time
(log
s)

Weighted Ranking Accuracy
� The highest the rank, the more harmful the error
� top-ranked algorithms are selected more often
� Weighted Rank Correlation Coefficient
� rW yields values quite different from rS in some cases�
� up to 0.1 just by swapping a pair of ranks
� but similar results in the algorithm recommendation problem
nnnn
YRXRnYRXR
r
n
i
iiii
W
2341
2 126
1,YX

Log Ranking Accuracy
� The highest the rank, the more harmful the error
� top-ranked algorithms are selected more often
� Log Ranking Accuracy Measure
� Complementary information
� k-NN makes fewer errors at top ranks than the default ranking
n
i
i
n
i
iiXR
ni
YRXR
ri
1
21
1
21
log
111log
1log2
1,YX
Measure of ranking accuracy that assigns more importance to
algorithms that are most likely to be selected

Other Applications
� Tested
� regression
� recommendation of parameters for pre-processing methods
� Current work
� time series
� outlier detection
� optimization
� Future work
� pre-processing methods + algorithm + parameters

Plan: Part II
PART I
� Background: why is this a problem?
� Meta-Learning: THE solution
PART II
� Meta-learning for Algorithm Recommendation
� Discussion
� Recommendation of Parameter Settings of SVM
SVM
� Support Vector Machines
� linear learning machines that maximize the margin
� duality
� kernel trick
� According to Bennet & Campbell, �Support Vector Machines: Hype
of Hallelujah?�, SIGKDD Explorations, 2000
� geometrical intuition
� elegant math
� theoretical guarantees
� practical (and successful) algorithms
� Successful but�
� heavy tuning usually required

k-NN Ranking for Parameter
Setting
� Goal: test methodology on different problem
� Application: Support Vector Machines for regression
� width of the Gaussian kernel,
� Pre-selection of a set values required
� continuous parameter
� set of 11 values
� Pre-selected set valid?
� (explained earlier)
2
2
2,
ji
eK
xx
ji xx

k-NN Ranking vs. Default Ranking:
Parameter Setting Results
� More accurate rankings than DR
� Significantly more accurate algorithms at the top ranks
2 4 6 8 10
0.20
0.25
0.30
0.35
0.40
0.45
0.50
Mean Ranking Accuracy
Number of neighbors (k)
r S
k-NNDR
2 4 6 8 10
0.3
0.4
0.5
0.6
0.7
0.8
NMSE nb. of algorithms
Number of algorithms (N)
Mea
n N
MS
E
1-NN2-NNDR

k-NN Ranking vs. Jaakkola�s
Heuristic: Results
� Heuristic commonly used in SVMs
� for all examples x
� set width to
� k-NN achieves better results
� also more robust
� top-5 results confirms advantage of ranking
� heuristic obtains surprisingly good results
i
ii yxd2minyx
xd
jaakkola top5 top10
12
3
NM
SE
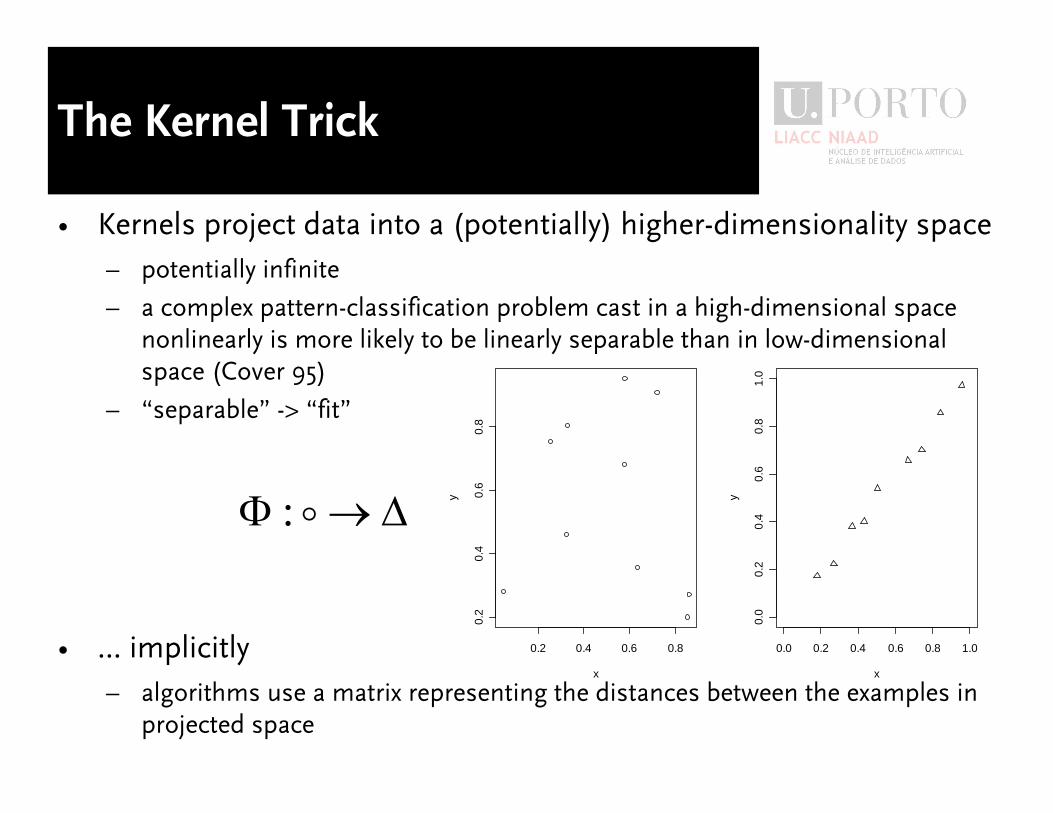
The Kernel Trick
� Kernels project data into a (potentially) higher-dimensionality space
� potentially infinite
� a complex pattern-classification problem cast in a high-dimensional space
nonlinearly is more likely to be linearly separable than in low-dimensional
space (Cover 95)
� �separable� -> �fit�
� ... implicitly
� algorithms use a matrix representing the distances between the examples in
projected space
0.2 0.4 0.6 0.8
0.2
0.4
0.6
0.8
x
y
0.0 0.2 0.4 0.6 0.8 1.0
0.0
0.2
0.4
0.6
0.8
1.0
x
y
:

Meta-Features Based on the
Kernel Matrix
� Kernel matrix represents distance of examples in projected space
� Design meta-features based on the values of the kernel matrix
� off-diagonal values are close to 0 when examples are �isolated�
� MF1: mean of off-diagonal values
� off-diagonal values should vary when there is structure
� MF2: variance of off-diagonal values
� measures �correlation� between a kernel function and ideal kernel
� MF3: kernel-target alignment
� Calculate for all parameter settings

Results with Selected Kernel
Meta-Features
� Significantly improved results with the set of Kernel meta-features
� unexpected results with the combination of the two sets
2 4 6 8 10
0.1
0.2
0.3
0.4
0.5
Mean Ranking Accuracy
Number of neighbors (k)
r S
M-setK-setMK-setDR
2 4 6 8 10
0.3
0.4
0.5
0.6
0.7
0.8
NMSE nb. of algorithms
Number of algorithms (N)
Mea
n N
MS
E
� Successful adaptation of the methodology to a different problem
� Successful design of problem-specific meta-features

Conclusions
� Relating characteristics of problems to (relative) performance of
learning algorithms is possible
� Recommendation is not the only goal
� understanding behavior of algorithms
� insights leading to improvements/new algorithms
� Research on meta-learning is at an early stage
� data characterization
� insufficient examples (i.e. data sets)
� Learning to predict rankings is interesting too!

(Very) Short Bibliography
somewhat biased too...
� L. Rendell, R. Seshu and D. Tcheng (87), More Robust Concept
Learning Using Dynamically-Variable Bias, in Proc. of the Fourth
Int. Workshop on Machine Learning, pp 66-78
� P. Brazdil, C. Soares and J. Costa (03), Ranking Learning
Algorithms: Using IBL and Meta-Learning on Accuracy and Time
Results, Machine Learning, 50 (3), pp 251-277
� C. Soares, P. Brazdil and P. Kuba (04), A Meta-Learning Method to
Select the Kernel Width in Support Vector Regression, Machine
Learning, 54, pp 195-20
� C. Soares (03), Is the UCI Repository Useful for Data Mining?,
Proceedings of the 11th Portuguese Conference on Artificial
Intelligence (EPIA2003), LNAI 2902, pp 209-223

Acknowledgements
� Pavel Brazdil and Joaquim Costa (supervisors)
� Petr Kuba
� Rui Pereira and Adam Woznica
� www.metal-kdd.org
� METAL project