extreme hardening of pb at high pressure and strain rate
TRANSCRIPT

Extreme Hardening of Pb at High Pressure and Strain Rate
A. Krygier ,* P. D. Powell, J. M. McNaney, C. M. Huntington, S. T. Prisbrey, B. A. Remington, R. E. Rudd,D. C. Swift, C. E. Wehrenberg, A. Arsenlis, and H.-S. Park
Lawrence Livermore National Laboratory, 7000 East Ave, Livermore, California 94550, USA
P. Graham, E. Gumbrell, M. P. Hill, A. J. Comley, and S. D. RothmanAtomic Weapons Establishment, Aldermaston, Reading, Berkshire RG7 4PR, United Kingdom
(Received 26 February 2019; published 11 November 2019)
We study the high-pressure strength of Pb and Pb-4wt%Sb at the National Ignition Facility. We measureRayleigh-Taylor growth of preformed ripples ramp compressed to ∼400 GPa peak pressure, among thehighest-pressure strength measurements ever reported on any platform. We find agreement with 2Dsimulations using the Improved Steinberg-Guinan strength model for body-centered-cubic Pb; the Pb-4wt%Sb alloy behaves similarly within the error bars. The combination of high-rate, pressure-inducedhardening and polymorphism yield an average inferred flow stress of ∼3.8 GPa at high pressure,a ∼250-fold increase, changing Pb from soft to extremely strong.
DOI: 10.1103/PhysRevLett.123.205701
Material deformation at high pressure and strain rate is aburgeoning research topic with applications in geophysics,inertial fusion, and ballistic penetration and advancedarmor design [1,2]. While direct dynamic strength, or flowstress, measurements under high-strain-rate, high-pressureconditions exceeds current capabilities, there are severaltechniques from which it can be inferred, including ramprelease [3], x-ray diffraction [4–6], and EXAFS [7]. Wecompare in situ plastic flow measurements to predictionsfrom hydrodynamics simulations that include flow stressmodels. Our method, which builds upon the conceptpioneered by Barnes et al. [8] and the development ofhohlraum-based, reservoir-gap ramp drives [9], acceleratesa sample with preformed sinusoidal ripples, while main-taining high-pressure conditions within the sample (seeFig. 1). As the sample is accelerated, the ripples grow viaRayleigh-Taylor (RT) instability [10,11] and are radio-graphically characterized [12,13]. The working principle ofthese measurements is that RT growth of the ripples issuppressed by the material’s flow stress: the greater theflow stress, the less the ripple growth for the sameacceleration and Atwood number.The crystallographic structure of a material is a key
factor influencing its strength, since the lattice structureaffects the Peierls stress (the barrier to dislocation move-ment through the crystal lattice). For example, body-centered-cubic (bcc) metals like Ta and V have a relativelylarge strength even at low strain due to high Peierls stress.On the contrary, face-centered-cubic (fcc) metals like Pboften have comparatively lower ambient strength anddifferent hardening behavior, since dislocations glide moreeasily with a lower Peierls barrier. Much work using the RTgrowth technique has focused on Ta and V [12,13], which
were expected to stay in the bcc phase throughout theexperiments; our team is also currently investigating shock-melted Cu. While ambient Pb forms the fcc phase, theexpected phase transformation to bcc at ∼50 GPa [14–17]should significantly change the flow stress behavior in ourexperiment (see Fig. 2). However, no flow stress data for Pbcurrently exist at these high pressures to test this hypothesisand the predictions of the Pb flow stress models.Lead is commonly alloyed with antimony to increase
strength for applications ranging from lead-acid batteries(∼4–10wt%) [23,24] to bullets (∼2–5wt%) [25]. In anti-monial lead with more Sb than the 3.5wt% solubility limitand less than the 11.2wt% eutectic concentration, the grainsare predominantly Pb with a small amount of fine-scale Sbrodlike particles with Pb-Sb eutectic at the grain boundaries[24]. Alloying with 4wt% Sb results in 4× increase in
FIG. 1. Cutaway diagram of the experimental setup includingthe hohlraum, multilayer ablator/reservoir, rippled sample pack-age, and backlighter. Bottom left: initial ripples and ripple-growthsimulations with and without strength.
PHYSICAL REVIEW LETTERS 123, 205701 (2019)Editors' Suggestion Featured in Physics
0031-9007=19=123(20)=205701(6) 205701-1 © 2019 American Physical Society
strength at ambient conditions and the relatively low strainrate of 103 s−1 [47 MPa vs 12 MPa at strain ðεÞ ¼ 0.15][26,27]. It is an open question whether this kind of alloyingincreases high-pressure dynamic strength. This motivates anew capability to increase sample size allowing side-by-side measurements of pure and alloyed metals subjected toidentical drives.In this Letter, we present results of experiments used to
infer the flow stress in Pb and Pb-4wt%Sb at peak pressuresof ∼400 GPa and strain rate ∼106–108 s−1, determined bysimulations. We use a novel, foam-based multilayerexpanding plasma drive [9,12,28] that prevents meltingat these pressures despite the low ambient melting temper-ature of lead and shock Hugoniot melting pressure(∼54 GPa) [15,29]. A time series of five x-ray radiographscharacterize the growth of preformed ripples in experimentsat the National Ignition Facility (NIF), similar to experi-ments using the Omega laser facility at lower peakpressures (∼100 GPa) [13,30,31]. We evaluate differentflow stress models by their ability to reproduce thesemeasurements in radiation hydrodynamic simulations.The original Steinberg-Guinan (SG) model [32] and the
newer Improved Steinberg-Guinan (ISG) model [20] are
the only available dynamic flow stress models for Pb. Bothmodels assume that the pressure and temperature depend-ence of the flow stress follows the shear modulus. However,the SG model parameters are extrapolated to high pressurefrom measurements of ambient fcc Pb. Rudd et al. [20]addressed this issue with the ISG model, which is based onthe high-pressure bcc phase and predicts 65% larger flowstress than the SG model in our experimental conditions.Lacking experimental data in this regime, the shearmodulus for the ISG model was calculated using densityfunctional theory (DFT) and quantum molecular dynamics(QMD), which explicitly account for crystalline structure.The ISG model is intended for high-pressure, high-ratedeformation, but is not explicitly rate dependent [33–35] ordesigned to describe slip-to-twinning transitions [36].Figure 1 shows our experimental setup. We use a
reservoir-gap plasma drive generated by heating a hohl-raum with 160 NIF beams (∼800 kJ); the reservoir is amultilayer density gradient stack [37] (see SupplementalMaterial [38]) that expands across a gap, ramp compressingthe sample as it stagnates. This technique shapes the driveand prevents melting in the rippled sample. The rippleamplitudes and substrate thickness are chosen to producesufficient radiographic contrast while preventing degrada-tion from effects like feedthrough [39] and nonlinear ripplegrowth. Feedthrough occurs when the sample is hydrody-namically thin and the ripple growth produces sufficientflow to form unwanted ripples on the rear surface. We findno evidence of nonlinear growth in the ripple lineouts andmitigate feedthrough with the design. Characterization ofthe Pb and Pb-4wt%Sb samples were performed viascanning electron microscope (SEM) and energy dispersivex-ray analysis (EDAX). We find that the grain sizes are∼10 s μm for Pb and ∼5 μm for Pb-4wt%Sb; in the alloy,Sb atoms mostly reside along the Pb grain boundaries.The driven samples are radiographed face on using a
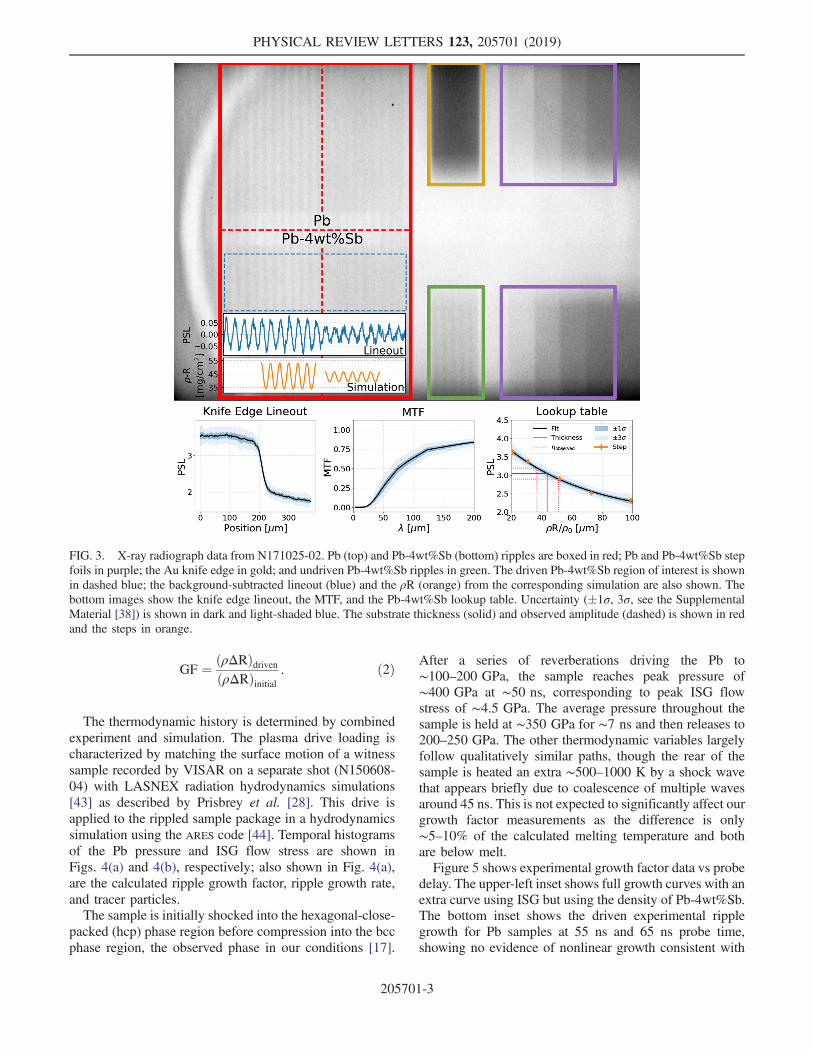
high-energy (>25 keV) x-ray source generated from an Agfoil heated with 12 tightly focused NIF beams. Exampledata is shown in Fig. 3. High-resolution 1D imaging isproduced using a wedged slit (15 μm × 300 μm, ∼7°opening angle). The image plate data are digitized intophoto-stimulated luminescence (PSL), which is linearlyrelated to an x-ray dose. We use an Au knife edge to derivethe modulation transfer function (MTF) [40] and correct forsource size effects [41,42]. The corrected amplitude η iscalculated from the observed amplitude in PSL, ηobserved,using Eq. (1).
η ¼ ηobservedMTFðλÞ ½PSL� ð1Þ
The in situ areal density ripple amplitude ðρΔRÞdriven isdetermined from η using a step-calibration table con-structed with Pb/Pb-4wt%Sb steps. We characterize theripple growth by the growth factor GF:
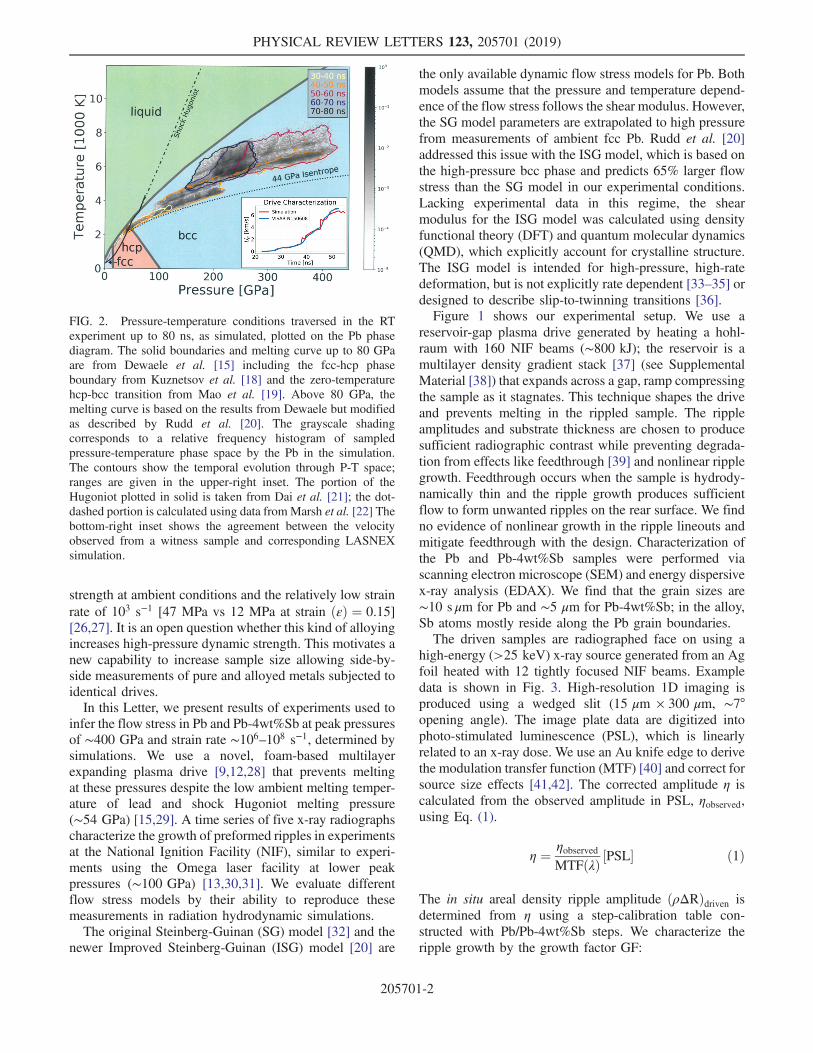
FIG. 2. Pressure-temperature conditions traversed in the RTexperiment up to 80 ns, as simulated, plotted on the Pb phasediagram. The solid boundaries and melting curve up to 80 GPaare from Dewaele et al. [15] including the fcc-hcp phaseboundary from Kuznetsov et al. [18] and the zero-temperaturehcp-bcc transition from Mao et al. [19]. Above 80 GPa, themelting curve is based on the results from Dewaele but modifiedas described by Rudd et al. [20]. The grayscale shadingcorresponds to a relative frequency histogram of sampledpressure-temperature phase space by the Pb in the simulation.The contours show the temporal evolution through P-T space;ranges are given in the upper-right inset. The portion of theHugoniot plotted in solid is taken from Dai et al. [21]; the dot-dashed portion is calculated using data fromMarsh et al. [22] Thebottom-right inset shows the agreement between the velocityobserved from a witness sample and corresponding LASNEXsimulation.
PHYSICAL REVIEW LETTERS 123, 205701 (2019)
205701-2
GF ¼ ðρΔRÞdrivenðρΔRÞinitial
: ð2Þ
The thermodynamic history is determined by combinedexperiment and simulation. The plasma drive loading ischaracterized by matching the surface motion of a witnesssample recorded by VISAR on a separate shot (N150608-04) with LASNEX radiation hydrodynamics simulations[43] as described by Prisbrey et al. [28]. This drive isapplied to the rippled sample package in a hydrodynamicssimulation using the ARES code [44]. Temporal histogramsof the Pb pressure and ISG flow stress are shown inFigs. 4(a) and 4(b), respectively; also shown in Fig. 4(a),are the calculated ripple growth factor, ripple growth rate,and tracer particles.The sample is initially shocked into the hexagonal-close-
packed (hcp) phase region before compression into the bccphase region, the observed phase in our conditions [17].
After a series of reverberations driving the Pb to∼100–200 GPa, the sample reaches peak pressure of∼400 GPa at ∼50 ns, corresponding to peak ISG flowstress of ∼4.5 GPa. The average pressure throughout thesample is held at ∼350 GPa for ∼7 ns and then releases to200–250 GPa. The other thermodynamic variables largelyfollow qualitatively similar paths, though the rear of thesample is heated an extra ∼500–1000 K by a shock wavethat appears briefly due to coalescence of multiple wavesaround 45 ns. This is not expected to significantly affect ourgrowth factor measurements as the difference is only∼5–10% of the calculated melting temperature and bothare below melt.Figure 5 shows experimental growth factor data vs probe
delay. The upper-left inset shows full growth curves with anextra curve using ISG but using the density of Pb-4wt%Sb.The bottom inset shows the driven experimental ripplegrowth for Pb samples at 55 ns and 65 ns probe time,showing no evidence of nonlinear growth consistent with
FIG. 3. X-ray radiograph data from N171025-02. Pb (top) and Pb-4wt%Sb (bottom) ripples are boxed in red; Pb and Pb-4wt%Sb stepfoils in purple; the Au knife edge in gold; and undriven Pb-4wt%Sb ripples in green. The driven Pb-4wt%Sb region of interest is shownin dashed blue; the background-subtracted lineout (blue) and the ρR (orange) from the corresponding simulation are also shown. Thebottom images show the knife edge lineout, the MTF, and the Pb-4wt%Sb lookup table. Uncertainty (�1σ, 3σ, see the SupplementalMaterial [38]) is shown in dark and light-shaded blue. The substrate thickness (solid) and observed amplitude (dashed) is shown in redand the steps in orange.
PHYSICAL REVIEW LETTERS 123, 205701 (2019)
205701-3

the design. All data are taken when the model predictionsstart differentiating at peak pressure (55 ns) and later duringrelease. While most of the distinguishing growth occursduring the highest-pressure conditions, the integratednature of our platform enables meaningful measurementswhen the sample is releasing from the highest-pressurestate. As expected, the no-strength simulations predict thelargest growth and are beyond the experimental error barswhen they are sufficiently separated from the other models.The fcc-based SG model predictions improve on the no-strength case and overlap the error bars in a few cases, butclearly and systematically over-predict the ripple growth.Finally, the stronger, bcc-based ISG model reproduces thedata well, with the error bars overlapping the modelprediction at each datum.Despite the polymorphism exhibited by lead across the
range of experimental conditions, we only consider single-phase flow stress models. This is possible because theripple growth predominantly occurs while Pb is in the bccphase at peak acceleration and pressure. Furthermore, the
growth factor is small (<1.5 in all models) and growthfactor curves for the different flow stress models do notdifferentiate until well after the sample crosses the hcp-bccphase boundary at ∼40 ns. Additionally, the ripple growthrate and pressure histogram shown in Fig. 4(a) are highlyresemblant indicating that the largest growth rates occurwhile the sample is at the highest pressures. This isconsistent with standard RT growth since the largestacceleration occurs for the largest jumps in pressure.The flow stress calculated by the ISG model, which
reproduces our experimental growth factor data, is shownin Fig. 4(b). The inferred flow stress averaged across thehigh-pressure plateau spanning ∼49–56 ns is ∼3.8 GPa,representing a ∼250× increase over ambient. While thisvalue is high, it is comparable to the 6 GPa inferred flowstress for Ta at 100 GPa [13] and 2.5 GPa inferred flowstress found at 90 GPa peak pressure in V [12]. While theseflow stresses are all of the same order of magnitude, theinferred Pb hardening is much higher than the ∼8× for Tainferred using the Livermore Multiscale Strength (LMS)model, which found very high dislocation density,approaching saturation [34], where the correspondingTaylor hardening dwarfs other microstructural contribu-tions [13]. While ISG does not include the same detailedphysics as LMS, we expect any well-behaved flow stressmodel that could reproduce our experimental data to yieldsimilar values for the average flow stress during ripplegrowth, independent of the mechanism.Beyond the hardening mechanisms Pb shares with Ta, we
need to consider whether the flow stress of Pb in the RTexperiments is affected by phase transformation, specifically
FIG. 4. Temporal evolution of (a) pressure and (b) flow stress inPb from the simulation of N171025-02 (∼1 μm initial rippleamplitude). The color denotes the relative frequency of the Pbpressure and flow stress, respectively, at that time as sampledfrom the simulation. Panel (a) also shows the calculated GF[unitless] and growth rate [1=10 ns], indicated on the right axis.Two pressure history tracer particles, which are initialized 2 μmfrom a ripple peak (front) and rear surface (back), are also shownin (a). The right axis of (b) indicates the flow stress normalized tothe ambient yield stress, Y0.
FIG. 5. Growth factor data for Pb (blue squares) and Pb-4wt%Sb (orange circles) with ∼0.4 μm initial ripple amplitude andhydrodynamics simulations using no strength, fcc-based Pb SGmodel, and the bcc-based Pb ISG model. Discontinuities in thesimulation curves are due to shot-to-shot variations. The insetshows full growth factor curves for 65 ns delay with an additionalsimulation curve using Pb ISG with Pb-4wt%Sb initial density(11.15 g=cm3). Driven ripple growth data for 55 ns and 65 nsexperiments is shown in the bottom-right corner.
PHYSICAL REVIEW LETTERS 123, 205701 (2019)
205701-4

in two possibleways: (a) the flow stress in the high-pressurebcc phase of Pb may be greater due to microstructuraldifferences resulting from the phase transformation, and(b) the flow stress increase may be greater due to lowerstrength of the initial (fcc)metal. First consider case (a), suchas in iron. Iron RT-experiments have been performed withpeak pressure of ∼100 GPa, whose data were consistentwith flow stress> 40 GPa [31]. Separate EXAFS measure-ments made at peak pressure 560 GPa were consistent withan upper limit of ∼70 GPa attributed to significant plasticwork heating [7]. It has been suggested that the high flowstress of iron is caused by Taylor hardening due todislocations associated with the α-ϵ phase transformation,a reduction in dislocationmobility in the hcp phase, or grain-size strengthening (the Hall-Petch effect) related to anultrafine grain structure. For example, formation of2–15 nm sized grains has been reported when single crystaliron is shocked across theα-ϵ phase boundary [45].While Pbcrosses the hcp and bcc phase boundaries in the RTexperiment, its flow stress may be significantly lower thanirons since it is deforming in a cubic phase rather than a low-symmetry phase and unlike iron it does not undergo strongvolume collapse at either transition. Furthermore, recentdiffraction experiments see no evidence of formationof <10 nm grains under dynamic compression in thisregime [17].The growth factor data in Fig. 5 show no difference
between Pb and Pb-4wt%Sb beyond the experimental errorbars (described in the Supplemental Material [38]). Thisimplies similar flow stress behavior (i.e., no significantalloy strengthening) as the alloy is only 1.6% less densethan the Pb and therefore experiences very similar hydro-dynamic conditions. While there are small differencesbetween the respective equations of state [46], our experi-ments are designed to minimize these effects. This absenceof alloy hardening is in contrast to the ambient behaviorwhere alloying with 4wt% Sb produces 4× hardening[26,27]. The unalloyed Pb shows similarly high flow stress.The agreement in the Pb and Pb-4wt%Sb growth factordata therefore suggests that the Taylor hardening togetherwith pressure hardening (and possibly twinning) dwarfsany alloy-related hardening including alloy-induced grainboundary segregation hardening arising from the Sb, whichis mostly distributed on the grain boundaries, and othermicrostructural changes.The technique described here can be used to probe the
flow stress of multiple samples simultaneously at pressuresup to∼400 GPa. The high energy drive at the NIF enables alarge hohlraum and thus a large planar drive combined witha low-density foam-based multilayer reservoir to keep thetemperature below melt during compression. The observedgrowth factor for Pb is described well by simulations usingthe ISG flow stress model for high-pressure bcc Pb, withoutexplicitly accounting for the transformations to reach bcc orchanges to the grain structure or any plastic reversion
during release [47]. The inferred peak flow stress of∼4.5 GPa and plateau average of ∼3.8 GPa is much higherthan at ambient conditions. The Pb-4wt%Sb alloying hasno measurable effect on the flow stress. Whether theseproperties are common to other metals and alloys remainsan interesting, open question suitable for this platform.These are among the highest-pressure flow stress data everrecorded on any platform and the first to investigate the roleof alloy strengthening in this regime.
We thank the National Ignition Facility target engineersfor their outstanding capabilities and contributions thatmade this work possible. This work was performed underthe auspices of the U.S. Department of Energy byLawrence Livermore National Laboratory under ContractNo. DE-AC52-07NA27344.
*[email protected][1] R. E. Rudd, T. C. Germann, B. A. Remington, and J. S.
Wark, MRS Bull. 35, 999 (2010).[2] B. A. Remington, R. E. Rudd, and J. S. Wark, Phys. Plasmas
22, 090501 (2015).[3] J. L. Brown, C. S. Alexander, J. R. Asay, T. J. Vogler, and
J. L. Ding, J. Appl. Phys. 114, 223518 (2013).[4] A. K. Singh, C. Balasingh, H.-K. Mao, R. J. Hemley, and J.
Shu, J. Appl. Phys. 83, 7567 (1998).[5] S. Merkel, J. Phys. Condens. Matter 18, S949 (2006).[6] A. J. Comley, B. R. Maddox, R. E. Rudd, S. T. Prisbrey,
J. A. Hawreliak, D. A. Orlikowski, S. C. Peterson, J. H.Satcher, A. J. Elsholz, H.-S. Park, B. A. Remington, N.Bazin, J. M. Foster, P. Graham, N. Park, P. A. Rosen, S. R.Rothman, A. Higginbotham, M. Suggit, and J. S. Wark,Phys. Rev. Lett. 110, 115501 (2013).
[7] Y. Ping, F. Coppari, D. G. Hicks, B. Yaakobi, D. E.Fratanduono, S. Hamel, J. H. Eggert, J. R. Rygg, R. F.Smith, D. C. Swift, D. G. Braun, T. R. Boehly, and G.W.Collins, Phys. Rev. Lett. 111, 065501 (2013).
[8] J. F. Barnes, P. J. Blewett, R. G. McQueen, K. A. Meyer, andD. Venable, J. Appl. Phys. 45, 727 (1974).
[9] J. Edwards, K. T. Lorenz, B. A. Remington, S. Pollaine,J. Colvin, D. Braun, B. F. Lasinski, D. Reisman, J. M.McNaney, J. A. Greenough, R. Wallace, H. Louis, and D.Kalantar, Phys. Rev. Lett. 92, 075002 (2004).
[10] Y. Zhou, Phys. Rep. 720–722, 1 (2017).[11] Y. Zhou, Phys. Rep. 723–725, 1 (2017).[12] H.-S. Park, K. T. Lorenz, R. M. Cavallo, S. M. Pollaine,
S. T. Prisbrey, R. E. Rudd, R. C. Becker, J. V. Bernier, andB. A. Remington, Phys. Rev. Lett. 104, 135504 (2010).
[13] H.-S. Park et al., Phys. Rev. Lett. 114, 065502 (2015).[14] C. A. Vanderborgh, Y. K. Vohra, H. Xia, and A. L. Ruoff,
Phys. Rev. B 41, 7338 (1990).[15] A. Dewaele, M. Mezouar, N. Guignot, and P. Loubeyre,
Phys. Rev. B 76, 144106 (2007).[16] P. Song and L. Cai, Physica (Amsterdam) 405B, 1509
(2010).[17] A. Lazicki (private communication).[18] A. Kuznetsov, V. Dmitriev, L. Dubrovinsky, V. Prakapenka,
and H. Weber, Solid State Commun. 122, 125 (2002).
PHYSICAL REVIEW LETTERS 123, 205701 (2019)
205701-5

[19] H. K. Mao, Y. Wu, J. F. Shu, J. Z. Hu, R. J. Hemley, andD. E. Cox, Solid State Commun. 74, 1027 (1990).
[20] R. E. Rudd, L. H.Yang, P. D. Powell, P. Graham,A.Arsenlis,R. M. Cavallo, A. G. Krygier, J. M.McNaney, S. T. Prisbrey,B. A. Remington, D. C. Swift, C. E. Wehrenberg, and H.-S.Park, AIP Conf. Proc. 1979, 070027 (2018).
[21] C. Dai, H. Tan, and H. Geng, J. Appl. Phys. 92, 5019 (2002).[22] S. Marsh, LASL Shock Hugoniot Data (University of
California Press, Berkeley, 1980).[23] R. S. Dean, W. E. Hudson, and M. F. Fogler, Ind. Eng.
Chem. 17, 1246 (1925).[24] J. Perkins, Mater. Sci. Eng. 28, 167 (1977).[25] C. A. Johnson, H. Moench, P. Wersin, P. Kugler, and C.
Wenger, J. Environ. Qual. 34, 248 (2005).[26] S. El-Gamal, G. Mohammed, and E. E. Abdel-Hady, Am. J.
Mater. Sci. 5, 97 (2015).[27] V. A. M. Cristino, P. A. R. Rosa, and P. A. F. Martins, Tribol.
Trans. 55, 652 (2012).[28] S. T. Prisbrey, H.-S. Park, B. A. Remington, R. Cavallo, M.
May, S. M. Pollaine, R. Rudd, B. Maddox, A. Comley, L.Fried, K. Blobaum, R. Wallace, M. Wilson, D. Swift, J.Satcher, D. Kalantar, T. Perry, E. Giraldez, M. Farrell, andA. Nikroo, Phys. Plasmas 19, 056311 (2012).
[29] B. K. Godwal, C. Meade, R. Jeanloz, A. Garcia, A. M. Y. Y.Liu, and M. L. Cohen, Science 248, 462 (1990).
[30] H.-S. Park, B. A. Remington, R. C. Becker, J. V. Bernier,R. M. Cavallo, K. T. Lorenz, S. M. Pollaine, S. T. Prisbrey,R. E. Rudd, and N. R. Barton, Phys. Plasmas 17, 056314(2010).
[31] C. M. Huntington, J. L. Belof, K. J. M. Blobaum, R. M.Cavallo, N. B. Kostinsko, B. R. Maddox, H. S. Park, C.Plechaty, R. Rudd, D. W. Swift, R. J. Wallace, S. V. Weber,C. Wehrenberg, M. J. Wilson, and B. A. Remington, AIPConf. Proc. 1793, 110007 (2017).
[32] D. J. Steinberg, S. G. Cochran, and M.W. Guinan, J. Appl.Phys. 51, 1498 (1980).
[33] N. R. Barton, J. V. Bernier, R. Becker, A. Arsenlis, R.Cavallo, J. Marian, M. Rhee, H.-S. Park, B. A. Remington,and R. T. Olson, J. Appl. Phys. 109, 073501 (2011).
[34] N. R. Barton and M. Rhee, J. Appl. Phys. 114, 123507(2013).
[35] D. L. Preston, D. L. Tonks, and D. C. Wallace, J. Appl.Phys. 93, 211 (2003).
[36] C. E. Wehrenberg, D. McGonegle, C. Bolme, A.Higginbotham, A. Lazicki, H. J. Lee, B. Nagler, H.-S. Park,B. A. Remington, R. E. Rudd, M. Sliwa, M. Suggit, D.Swift, F. Tavella, L. Zepeda-Ruiz, and J. S. Wark, Nature(London) 550, 496 (2017).
[37] Y. P. Opachich, J. A. Koch, M. J. Haugh, E. Romano, J. J.Lee, E. Huffman, F. A.Weber, J. W. Bowers, L. R. Benedetti,M.Wilson, S. T. Prisbrey, C. E. Wehrenberg, T. F. Baumann,J. M. Lenhardt, A. Cook, A. Arsenlis, H.-S. Park, and B. A.Remington, Rev. Sci. Instrum. 87, 073706 (2016).
[38] See Supplemental Material at http://link.aps.org/supplemental/10.1103/PhysRevLett.123.205701 for themultilayer sample parameters, the initial ripple quality,and the uncertainty analysis.
[39] S. T. Weir, E. A. Chandler, and B. T. Goodwin, Phys. Rev.Lett. 80, 3763 (1998).
[40] H. H. Barrett and W. Swindell, Radiological Imaging: TheTheory of Image Formation, Detection, and Processing(Academic Press, San Diego, 1981).
[41] U. Neitzel, E. Buhr, G. Hilgers, and P. R. Granfors, Med.Phys. 31, 3485 (2004).
[42] E. Gumbrell, J. M. McNaney, C. M. Huntington, A. G.Krygier, and H.-S. Park, Rev. Sci. Instrum. 89, 10G118(2018).
[43] G. B. Zimmerman and W. L. Kruer, Commun. Plasma Phys.Controlled Fusion 2, 51 (1975).
[44] R. M. Darlington, T. L. Mcabee, and G. Rodrigue, Comput.Phys. Commun. 135, 58 (2001).
[45] J. A. Hawreliak, D. H. Kalantar, J. S. Stölken, B. A.Remington, H. E. Lorenzana, and J. S. Wark, Phys. Rev.B 78, 220101(R) (2008).
[46] S. D. Rothman, J.-P. Davis, J. Maw, C. M. Robinson, K.Parker, and J. Palmer, J. Phys. D 38, 733 (2005).
[47] M. Sliwa, D. McGonegle, C. Wehrenberg, C. A. Bolme,P. G. Heighway, A. Higginbotham, A. Lazicki, H. J. Lee, B.Nagler, H. S. Park, R. E. Rudd, M. J. Suggit, D. Swift, F.Tavella, L. Zepeda-Ruiz, B. A. Remington, and J. S. Wark,Phys. Rev. Lett. 120, 265502 (2018).
PHYSICAL REVIEW LETTERS 123, 205701 (2019)
205701-6