extrusion foaming of poly(lactic acid) blown with co ... · cellular polymers, vol. 26, no. 2, 2007...
TRANSCRIPT
83Cellular Polymers, Vol. 26, No. 2, 2007
Extrusion Foaming of Poly(Lactic acid) Blown with CO2: Toward 100% Green Material
©Rapra Technology, 2007
Extrusion Foaming of Poly(Lactic acid) Blown with CO2: Toward 100% Green Material
Joël Reignier, Richard Gendron and Michel F. Champagne
Industrial Materials Institute, National Research Council Canada75, de Mortagne, Boucherville, QC, Canada, J4B 6Y4
Received: 6 July 2006 Accepted: 2 April 2007
ABSTRACT
This paper presents a thorough investigation of the continuous extrusion foaming
of amorphous poly(lactic acid) (PLA) using carbon dioxide (CO2) as the blowing
agent. Detailed results describing the plasticization induced by CO2 dissolution
as measured from two different methods, on-line rheometry and in-line ultrasonic
technique, are given. Characteristics of the foams obtained from extrusion
performed under various processing conditions are also reported. Extrusion
of PLA foams in the 20-25 kg/m3 density range was achieved. However, the
associated processing window was very narrow: CO2 content lower than ca.
7 wt% did not lead to signifi cant foam expansion while foams blown at CO2
contents larger than 8.3 wt% showed severe shrinkage upon ageing.
INTRODUCTION
In the last decade, there have been considerable efforts devoted to the development of polymers from renewable agricultural resources in order to gradually replace traditional polymers made from nonrenewable fossil resources such as polystyrene or polyethylene. Among those, poly(lactic acid) (PLA), conventionally considered as a relatively expensive synthetic polymer dedicated exclusively to biomedical applications, can now be produced at low cost, typically ca. 1.50 US$/pound. Biotechnology breakthrough enables corn-based feedstock transformation into high-quality PLA polymer(1). Thus, PLA is being currently commercialized in large quantity for targeted implementation in fi ber and packaging applications. An extensive review on the physical properties of PLA indicates that it is a good candidate for packaging applications(1). PLA can
Tel: 1-450-641-5183, Fax: 1-450-641-5105, E-mail: [email protected]
Cell Poly 2 07.indb 83Cell Poly 2 07.indb 83 11/4/07 3:05:34 pm11/4/07 3:05:34 pm
84 Cellular Polymers, Vol. 26, No. 2, 2007
Joël Reignier, Richard Gendron and Michel F. Champagne
be molded, blown, or extruded to yield products which were traditionally made from petroleum-based plastics. When composted, PLA can be degraded down to its basic natural component, lactic acid, readily assimilated by bio-organisms commonly found in nature, thus making the polymer biodegradable.
Until recently, foaming of PLA was restricted exclusively to biomedical applications. Indeed, both tissue engineering and guided tissue regeneration required the use of porous biodegradable polymeric materials. Pioneering study on the foaming of poly(D,L-lactic-co-glycolic acid) (PLGA) with CO
2
as blowing agent was done by Mooney et al.(2) using batch processing at ambient temperature. Interestingly, they demonstrated that the porosity (in other words the density) of the foam could be controlled by mixing crystalline and amorphous polymers. Following studies aimed at improving such technology through better control of cell population density and cell size(3) and/or by incorporating encapsulated proteins(4).
The issue of PLA foaming for non biomedical applications has been recently addressed by several researchers(5,6,7), through studies performed mostly using batch processes such as the autoclave method. Iannace’s group carried out a number of interesting studies on the foaming of semi-crystalline biodegradable poly(ε-caprolactone) (PCL) and PLA with a 20:80 CO
2:N
2 mixture as physical
blowing agent(6). In addition, they proposed a strategy to increase the poor rheological properties and small processing window of the PLA foams by either adding nanoclays or through reactive processing (chain extenders and/or peroxides). In both cases, the foams exhibited reduced cell size and increased cell density (at foaming temperature of 110 °C). Using a similar approach, Fujimoto et al.(5) reported the preparation and characterization of semi-crystalline PLA/layered silicate nanocomposite foams using only CO
2 as the blowing
agent. They claimed that the more uniform cell morphology exhibited by the nanocomposite foam (foaming temperature of 140 °C) compared to neat PLA foam may be explained by the presence of dispersed silicate particles acting as nucleating sites for cell formation. Surprisingly, the role of crystallization on the bubble nucleation was not addressed whereas a lot of studies have pointed out that CO
2 gas molecules can induced crystallization of the PLA matrix(8).
This issue may greatly affect the interpretation of the previous data since it is diffi cult to separate the effect of nanoclays from those of crystals on bubble nucleation and growth.
In a completely different approach, numerous research efforts have been made to commercialize starch-based foams, in order to replace loose-fi ll packaging materials traditionally prepared from petrochemical products such as expanded polystyrene. Unfortunately, packaging materials made of pure
Cell Poly 2 07.indb 84Cell Poly 2 07.indb 84 11/4/07 3:05:35 pm11/4/07 3:05:35 pm

85Cellular Polymers, Vol. 26, No. 2, 2007
Extrusion Foaming of Poly(Lactic acid) Blown with CO2: Toward 100% Green Material
starch show properties unacceptable for these applications: low moduli and strength and, even worse, solubility in water. To overcome this issue, several researchers have attempted in the last decade to improve the characteristics of starch-based foams by blending starch with synthetic polymers. Unfortunately, they generally relied on non-biodegradable polymers to provide the foam functionality. Therefore, there has been a growing interest in the development of completely biodegradable foams i.e. by mixing starch-based material with biodegradable polymers such as PCL, PLA and poly(hydroxy ester ether) (PHEE). Extruded foams made of starch blended with PLA (up to 40 wt%) had signifi cantly lower densities and larger radial expansion than control foams made from neat starch(9,10). Compared to pure starch foams, the addition of PLA contributes to increase the elasticity of the cell walls thus preventing the cell structure to collapse(9) and improving the ultimate tensile strength and the percentage of elongation at break of the foam products(11). Even if addition of PLA would signifi cantly increase the cost of raw material – starch is ten times cheaper than PLA resins – the use of pure PLA foams may have a great potential in other packaging applications such as dinnerware, food containers and take-away products. While batch processing enables valuable small-scale studies, scale-up towards industrial applications requires mass-production methods like the foam extrusion process. The specifi c characteristic of this process must then be taken into account. Therefore, the overall objective of this work was to investigate the continuous extrusion foaming of PLA with carbon dioxide (CO
2) as the single blowing agent, over a wide range of CO
2
concentrations. The rationale for combining PLA with an environmentally friendly blowing agent such as carbon dioxide is to generate a greener-type material since CO
2 would replace any conventional physical foaming agents
(PFA), either organic or hydrofl uorocarbon, that would otherwise directly enter the atmosphere.
EXPERIMENTAL PROCEDURE
Materials
The PLA resin, grade 8302D, was purchased from NatureWorksTM. It is worth noting that the lactide monomer used to produce PLA has two enantiomers, L and D. Control of the ratio between L and D components is of critical importance since it has a large impact on the material properties. For instance, PLA derived from greater than 93% L-lactic acid can be semi-crystalline whereas PLA with L-lactic acid content ranging from 50 to 93% are totally amorphous. According to the supplier, the PLA grade 8302D is a completely amorphous copolymer made up of L- and D,L-lactide with a D- content of 9.85%. Some
Cell Poly 2 07.indb 85Cell Poly 2 07.indb 85 11/4/07 3:05:36 pm11/4/07 3:05:36 pm
86 Cellular Polymers, Vol. 26, No. 2, 2007
Joël Reignier, Richard Gendron and Michel F. Champagne
other physical characteristics of the PLA used in this study are reported in Table 1. Since amorphous PLA requires drying at temperature below its T
g,
the PLA was dried for around 8 h in a dryer set at 50 °C prior to extrusion. Such drying stage is reported to be suffi cient to decrease the moisture level below 250 ppm and thus to prevent hydrolysis of PLA in the molten state. In selected foam formulations, talc (Mistron Vapor-R from Luzenac Corporation) with a median particle size of 2 μm and a specifi c surface of 13.4 m2/g was used as nucleating agent. The concentration of nucleating agent in the melt was set to 0.5 or 1 wt%.
Table 1. Selected properties of amorphous PLA8302D (according to NatureWorks data sheets)
D-content Density at 23 °C
Tg (°C) Tensile Strengtha
(MPa) Tensile Modulusa
(GPa)9.85% 1.24 55 60 3.5a Measurements were made in our laboratory according to ASTM D690 (tensile mode)
Foam Extrusion and In-line Characterization
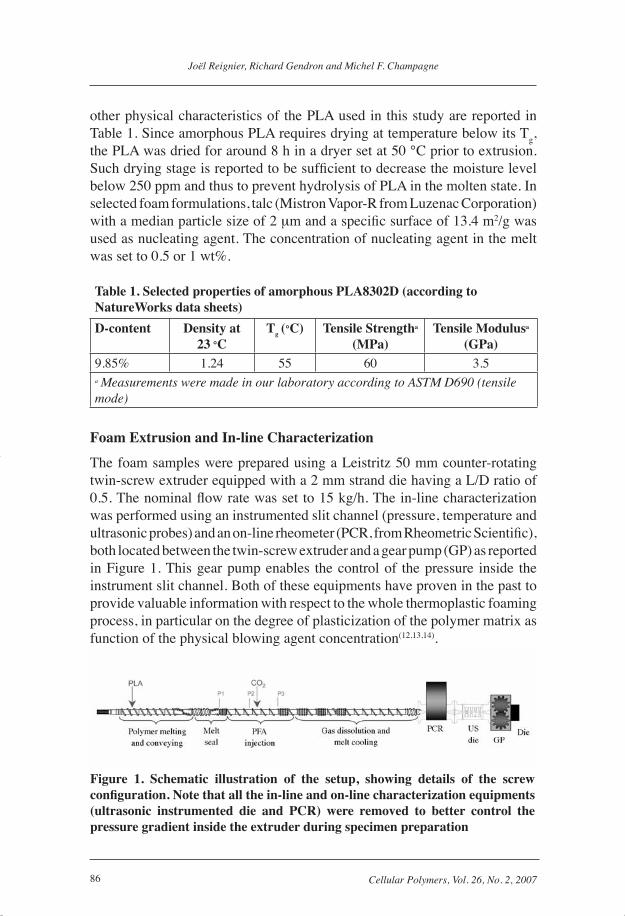
The foam samples were prepared using a Leistritz 50 mm counter-rotating twin-screw extruder equipped with a 2 mm strand die having a L/D ratio of 0.5. The nominal fl ow rate was set to 15 kg/h. The in-line characterization was performed using an instrumented slit channel (pressure, temperature and ultrasonic probes) and an on-line rheometer (PCR, from Rheometric Scientifi c), both located between the twin-screw extruder and a gear pump (GP) as reported in Figure 1. This gear pump enables the control of the pressure inside the instrument slit channel. Both of these equipments have proven in the past to provide valuable information with respect to the whole thermoplastic foaming process, in particular on the degree of plasticization of the polymer matrix as function of the physical blowing agent concentration(12,13,14).
Figure 1. Schematic illustration of the setup, showing details of the screw confi guration. Note that all the in-line and on-line characterization equipments (ultrasonic instrumented die and PCR) were removed to better control the pressure gradient inside the extruder during specimen preparation
Cell Poly 2 07.indb 86Cell Poly 2 07.indb 86 11/4/07 3:05:38 pm11/4/07 3:05:38 pm
87Cellular Polymers, Vol. 26, No. 2, 2007
Extrusion Foaming of Poly(Lactic acid) Blown with CO2: Toward 100% Green Material
Density Measurement
The density of highly expanded specimens (typically <500 kg/m3) was determined by water volume displacement of a known mass of foam. High density samples (typically >500 kg/m3) were measured by weighting the foam extrudate in air and in water, using a balance with a resolution of 10-4 g. In both cases, the PLA extrudates were cut using a razor blade at ambient temperature.
Morphology Observation and Image Analysis
A scanning electron microscope (SEM), Hitachi SR-4700, operated at 1 kV voltage, was used to examine the morphology of the foams after fracturing the extrudate in liquid nitrogen. The cross-section was coated with platinum using a sputter coater (Emitech K575X) operating at 10 mA for about 15 s under argon atmosphere. The average cell size of the foam was measured by image analysis. The cell population density, as defi ned by the number of cells per unit volume of the original unfoamed polymer, was evaluated using the following equation:
β
ρ ρπ
≅× ( ) −⎡⎣ ⎤⎦
+6 10 112
3
p f
d
/
(1)
where β is the cell population density (cells/cm3), d the average diameter of the cells (μm), ρ
p and ρ
f the densities of the unfoamed and foamed polymers
respectively (g/cm3). The mean cell wall thickness (δ in μm) was estimated using the following equation:
δρ ρ
=− ( )
⎛
⎝
⎜⎜
⎞
⎠
⎟⎟−
⎡
⎣
⎢⎢
⎤
⎦
⎥⎥d
f p
1
11
/ (2)
Dimensional Stability
The radial dimension of the foam extrudates was measured using a laser scan (Keyence LS-3100 & LS-3060) coupled to a custom-built LabView™ application.
Open-cell Content
The open-cell content was measured using a gas pycnometer (model Accupyc 1330). For each sample, at least three measurements were done. The applied pressure (N
2 gas) was set to a value as low as 34.5 kPa (5 psi) to minimize
collapse of the cellular structure.
Cell Poly 2 07.indb 87Cell Poly 2 07.indb 87 11/4/07 3:05:39 pm11/4/07 3:05:39 pm
88 Cellular Polymers, Vol. 26, No. 2, 2007
Joël Reignier, Richard Gendron and Michel F. Champagne
Compression Mechanical Test
The compression tests were performed using a computer-controlled Instron mechanical tester on cylindrical samples having a diameter varying between 12 and 14 mm and an initial length of 28 mm. The crosshead speed was set to 1 mm/min for all samples. The load-displacement curves were monitored during these tests in order to estimate both the compressive modulus and the compressive strength of the various foams investigated. Note that the compressive modulus of elasticity, E, was obtained from the slope of the initial linear portion of the compressive stress-strain curve. The compressive strength, σ
y, was obtained from the compressive stress at the yield point, i.e.
to the fi rst point on the compressive stress-strain curve at which an increase in strain occurs without an increase in stress.
RESULTS AND DISCUSSION
Plasticization
For an amorphous resin, the plasticization of the polymer matrix by the gas molecules is one of the critical steps in continuous extrusion foaming since it allows the process to be conducted at a temperature close to the glass transition temperature, T
g, of the neat polymer. This contributes to the stabilization of
the cellular structure: as the foaming agent phase separates from the matrix to form the bubbles, the resin forming the walls and struts undergoes a rapid viscosity increase that prevents any cell collapse. Unfortunately, there was no data available in the literature for the actual PLA/CO
2 system. Different
techniques have thus been used in the present work to estimate the Tg reduction
induced by CO2 sorption.
In the fi rst approach, the magnitude of the plasticization has been assessed through in-line measurement of the ultrasonic velocity (V
us) of the PLA/CO
2
mixtures using the instrumented slit die. Figure 2 reports the infl uence of CO2
concentration on the sound velocity of PLA/CO2 mixtures during extrusion
conducted at three different temperatures. It is worth noting that these data were collected at pressures ranging from 10.2 to 16.2 MPa, pressures considered suffi ciently high to prevent phase separation and cell nucleation inside the ultrasonic slit die for the gas concentrations investigated. Since the pressure largely infl uences the ultrasonic velocity, the data reported in Figure 2 were corrected at a constant value of 14.5 MPa through the knowledge of the dependence of V
us with respect to pressure and temperature. Clearly, for
each temperature, the velocity decreases in an almost linear fashion with the
Cell Poly 2 07.indb 88Cell Poly 2 07.indb 88 11/4/07 3:05:40 pm11/4/07 3:05:40 pm

89Cellular Polymers, Vol. 26, No. 2, 2007
Extrusion Foaming of Poly(Lactic acid) Blown with CO2: Toward 100% Green Material
CO2 content. The variation of ultrasonic velocity for polystyrene as a function
of CO2 and measured using the same apparatus is also reported on Figure 2
for comparison purposes (data excerpted from Ref(15)). With a slope of about -13 m/s/wt%, the plasticization of CO
2 seems less pronounced with PLA than
with PS (≅ -17m/s/wt%). As reported earlier by Gendron et al.(16), the decrease of sound velocity is proportional to the lowering of the glass transition temperature of the polymer due to the plasticizing effect of the dissolved gas. Therefore, these data can be used to estimate the shift in glass transition temperature due to the presence of the blowing agent by comparing the temperature/CO
2
content equivalence at a given constant value of ultrasonic velocity. Neglecting the variation in density with temperature and/or blowing agent content, the concentration dependence of the PLA T
g under fl ow conditions (in-line) can
be approximated as -8 °C/wt.% CO2.
In the second approach, stress sweep tests were realized using the on-line rheometer in order to measure the effect of blowing agent concentration on the rheological properties of the PLA/CO
2 mixtures. Typical results of viscosity
Figure 2. Ultrasonic velocity (homogenous single phase) as a function of CO2
content dissolved in PLA for different nominal temperatures. The ultrasonic velocity values were corrected for pressure effects using a reference pressure of 14.5 MPa. The reported data for PS/CO2 mixtures were taken from Ref (15)
Cell Poly 2 07.indb 89Cell Poly 2 07.indb 89 11/4/07 3:05:41 pm11/4/07 3:05:41 pm
90 Cellular Polymers, Vol. 26, No. 2, 2007
Joël Reignier, Richard Gendron and Michel F. Champagne
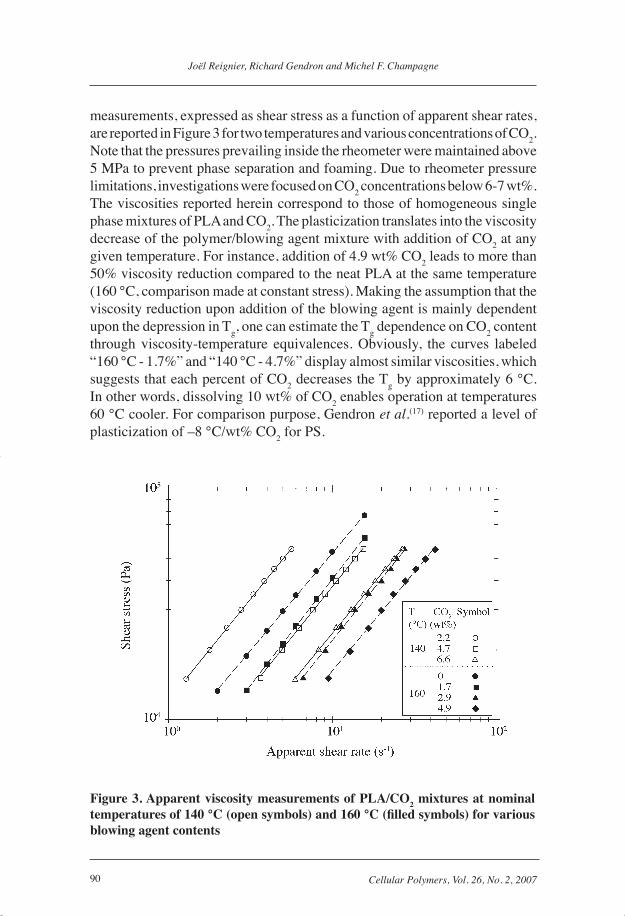
measurements, expressed as shear stress as a function of apparent shear rates, are reported in Figure 3 for two temperatures and various concentrations of CO
2.
Note that the pressures prevailing inside the rheometer were maintained above 5 MPa to prevent phase separation and foaming. Due to rheometer pressure limitations, investigations were focused on CO
2 concentrations below 6-7 wt%.
The viscosities reported herein correspond to those of homogeneous single phase mixtures of PLA and CO
2. The plasticization translates into the viscosity
decrease of the polymer/blowing agent mixture with addition of CO2 at any
given temperature. For instance, addition of 4.9 wt% CO2 leads to more than
50% viscosity reduction compared to the neat PLA at the same temperature (160 °C, comparison made at constant stress). Making the assumption that the viscosity reduction upon addition of the blowing agent is mainly dependent upon the depression in T
g, one can estimate the T
g dependence on CO
2 content
through viscosity-temperature equivalences. Obviously, the curves labeled “160 °C - 1.7%” and “140 °C - 4.7%” display almost similar viscosities, which suggests that each percent of CO
2 decreases the T
g by approximately 6 °C.
In other words, dissolving 10 wt% of CO2 enables operation at temperatures
60 °C cooler. For comparison purpose, Gendron et al.(17) reported a level of plasticization of –8 °C/wt% CO
2 for PS.
Figure 3. Apparent viscosity measurements of PLA/CO2 mixtures at nominal temperatures of 140 °C (open symbols) and 160 °C (fi lled symbols) for various blowing agent contents
Cell Poly 2 07.indb 90Cell Poly 2 07.indb 90 11/4/07 3:05:42 pm11/4/07 3:05:42 pm
91Cellular Polymers, Vol. 26, No. 2, 2007
Extrusion Foaming of Poly(Lactic acid) Blown with CO2: Toward 100% Green Material
The depression of the glass transition temperature caused by absorption of diluent molecules can also be estimated using a theoretical relation developed by Chow(18), which is mainly based on the respective molecular weight of the diluent and the polymer repeat unit:
ln ln ln
T
Tg
g0
1 1= −( ) −( )+⎡⎣ ⎤⎦Ψ θ θ θ θ (3)
Where
θ ω
ω=
−( )/
/
M
z Md
p1 (4)
and
ψ = zR
M Cp p∆ (5)
Here, Tg0
is the glass transition temperature for the pure polymer, while T
g is the value function of the weight fraction of diluent ω. M
d and M
p are
respectively the molecular weight of the diluent and that of the polymer repeat unit. ∆C
p is the change in specifi c heat of the polymer at its glass transition
temperature and R the gas constant. The parameters for the PLA/CO2 system
used in the calculations were Md=44 g/mol, M
p=72 g/mol, ∆C
p=0.548 J/g/K
and Tg0
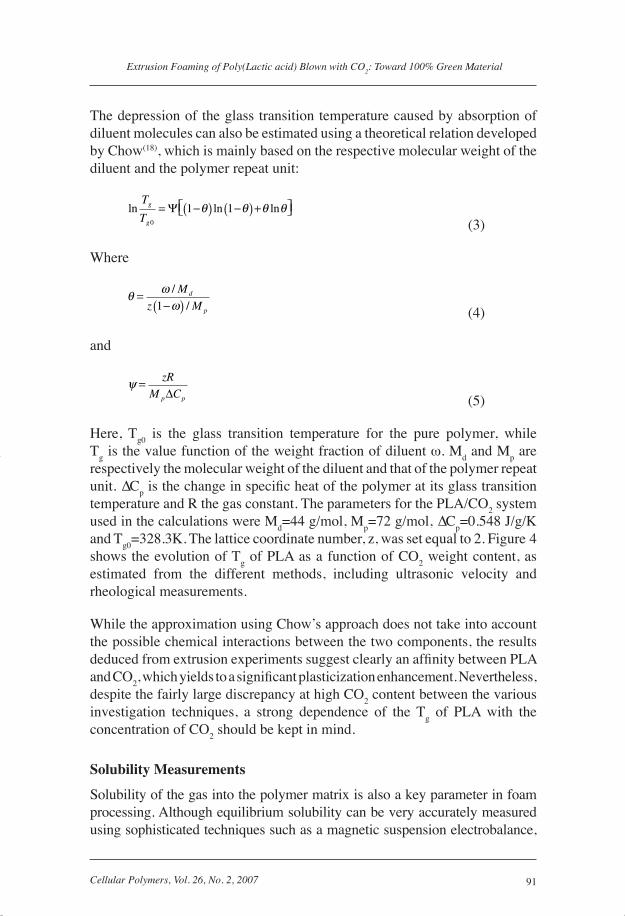
=328.3K. The lattice coordinate number, z, was set equal to 2. Figure 4 shows the evolution of T
g of PLA as a function of CO
2 weight content, as
estimated from the different methods, including ultrasonic velocity and rheological measurements.
While the approximation using Chow’s approach does not take into account the possible chemical interactions between the two components, the results deduced from extrusion experiments suggest clearly an affi nity between PLA and CO
2, which yields to a signifi cant plasticization enhancement. Nevertheless,
despite the fairly large discrepancy at high CO2 content between the various
investigation techniques, a strong dependence of the Tg of PLA with the
concentration of CO2 should be kept in mind.
Solubility Measurements
Solubility of the gas into the polymer matrix is also a key parameter in foam processing. Although equilibrium solubility can be very accurately measured using sophisticated techniques such as a magnetic suspension electrobalance,
Cell Poly 2 07.indb 91Cell Poly 2 07.indb 91 11/4/07 3:05:43 pm11/4/07 3:05:43 pm
92 Cellular Polymers, Vol. 26, No. 2, 2007
Joël Reignier, Richard Gendron and Michel F. Champagne
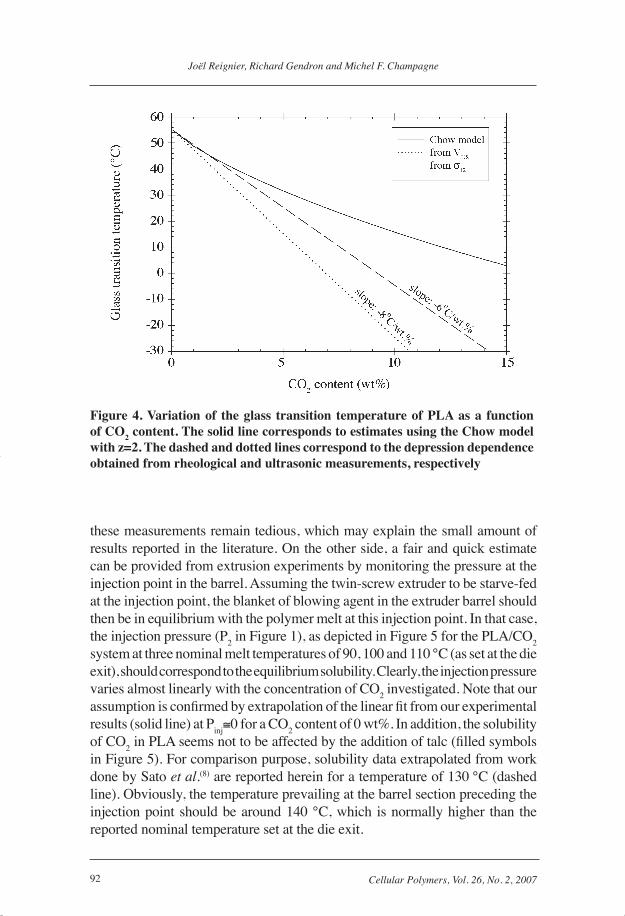
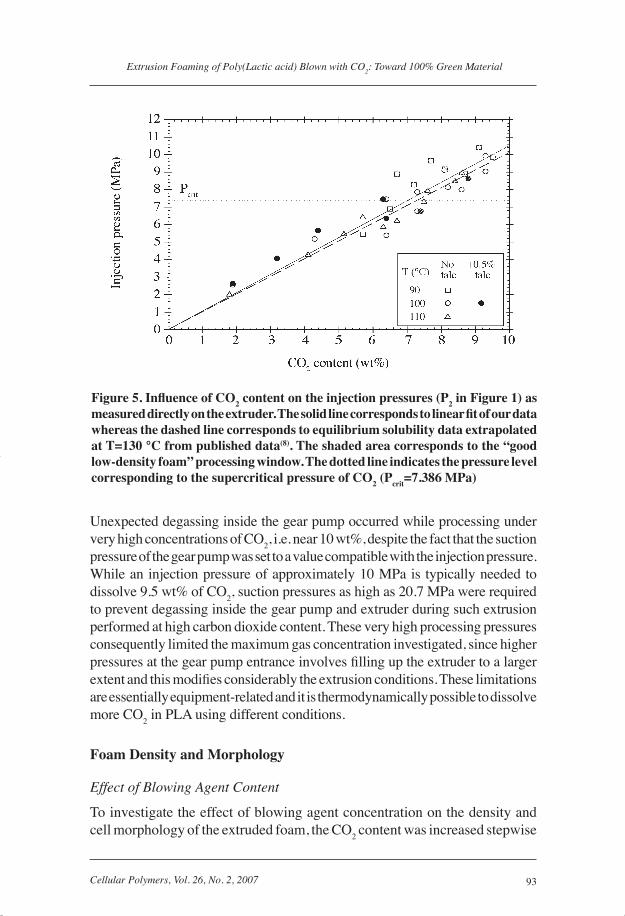
these measurements remain tedious, which may explain the small amount of results reported in the literature. On the other side, a fair and quick estimate can be provided from extrusion experiments by monitoring the pressure at the injection point in the barrel. Assuming the twin-screw extruder to be starve-fed at the injection point, the blanket of blowing agent in the extruder barrel should then be in equilibrium with the polymer melt at this injection point. In that case, the injection pressure (P
2 in Figure 1), as depicted in Figure 5 for the PLA/CO
2
system at three nominal melt temperatures of 90, 100 and 110 °C (as set at the die exit), should correspond to the equilibrium solubility. Clearly, the injection pressure varies almost linearly with the concentration of CO
2 investigated. Note that our
assumption is confi rmed by extrapolation of the linear fi t from our experimental results (solid line) at P
inj≅0 for a CO
2 content of 0 wt%. In addition, the solubility
of CO2 in PLA seems not to be affected by the addition of talc (fi lled symbols
in Figure 5). For comparison purpose, solubility data extrapolated from work done by Sato et al.(8) are reported herein for a temperature of 130 °C (dashed line). Obviously, the temperature prevailing at the barrel section preceding the injection point should be around 140 °C, which is normally higher than the reported nominal temperature set at the die exit.
Figure 4. Variation of the glass transition temperature of PLA as a function of CO2 content. The solid line corresponds to estimates using the Chow model with z=2. The dashed and dotted lines correspond to the depression dependence obtained from rheological and ultrasonic measurements, respectively
Cell Poly 2 07.indb 92Cell Poly 2 07.indb 92 11/4/07 3:05:44 pm11/4/07 3:05:44 pm
93Cellular Polymers, Vol. 26, No. 2, 2007
Extrusion Foaming of Poly(Lactic acid) Blown with CO2: Toward 100% Green Material
Unexpected degassing inside the gear pump occurred while processing under very high concentrations of CO
2, i.e. near 10 wt%, despite the fact that the suction
pressure of the gear pump was set to a value compatible with the injection pressure. While an injection pressure of approximately 10 MPa is typically needed to dissolve 9.5 wt% of CO
2, suction pressures as high as 20.7 MPa were required
to prevent degassing inside the gear pump and extruder during such extrusion performed at high carbon dioxide content. These very high processing pressures consequently limited the maximum gas concentration investigated, since higher pressures at the gear pump entrance involves fi lling up the extruder to a larger extent and this modifi es considerably the extrusion conditions. These limitations are essentially equipment-related and it is thermodynamically possible to dissolve more CO
2 in PLA using different conditions.
Foam Density and Morphology
Effect of Blowing Agent Content
To investigate the effect of blowing agent concentration on the density and cell morphology of the extruded foam, the CO
2 content was increased stepwise
Figure 5. Infl uence of CO2 content on the injection pressures (P2 in Figure 1) as measured directly on the extruder. The solid line corresponds to linear fi t of our data whereas the dashed line corresponds to equilibrium solubility data extrapolated at T=130 °C from published data(8). The shaded area corresponds to the “good low-density foam” processing window. The dotted line indicates the pressure level corresponding to the supercritical pressure of CO2 (Pcrit=7.386 MPa)
Cell Poly 2 07.indb 93Cell Poly 2 07.indb 93 11/4/07 3:05:45 pm11/4/07 3:05:45 pm
94 Cellular Polymers, Vol. 26, No. 2, 2007
Joël Reignier, Richard Gendron and Michel F. Champagne
from 1.8 to 9.4 wt% by ca. 1 wt% increment. It is worth noting that all the in-line characterization equipments (ultrasonic instrumented die and on-line rheometer), acting as fl ow rectrictors, were removed to better control the pressure prevailing inside the extruder and to ease the increase of the suction pressure at the entrance of the gear pump to values as high as 20.7 MPa. As mentioned in the previous section, these extra precautions were taken to avoid premature foaming inside the gear pump at high CO
2 concentrations. Indeed,
it has been shown recently that the degassing pressure – i.e. the pressure at which bubble nucleation and growth begins – may increase signifi cantly under fl ow conditions well above the equilibrium solubility associated value because of the shear and tensile stresses induced during fl ow(19).
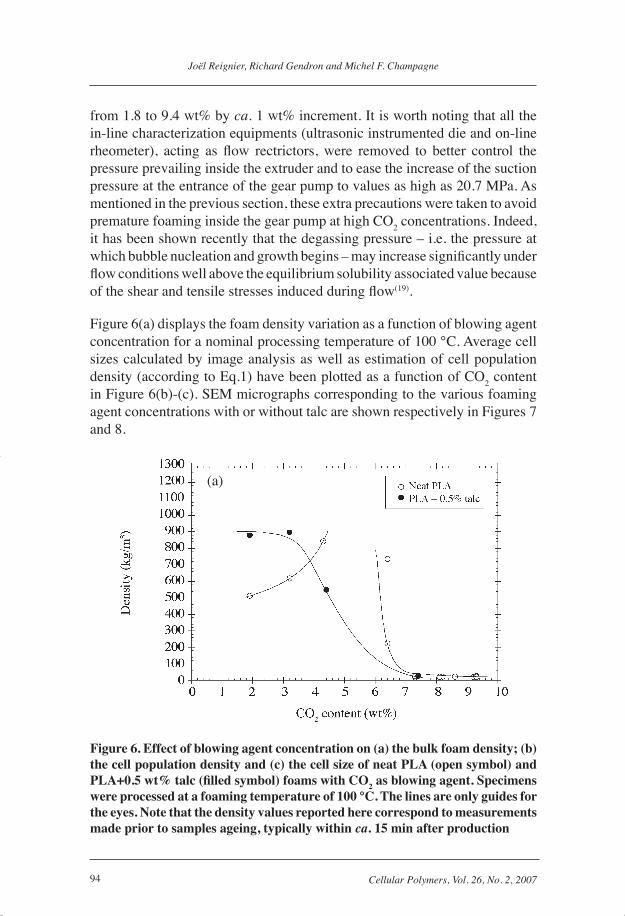
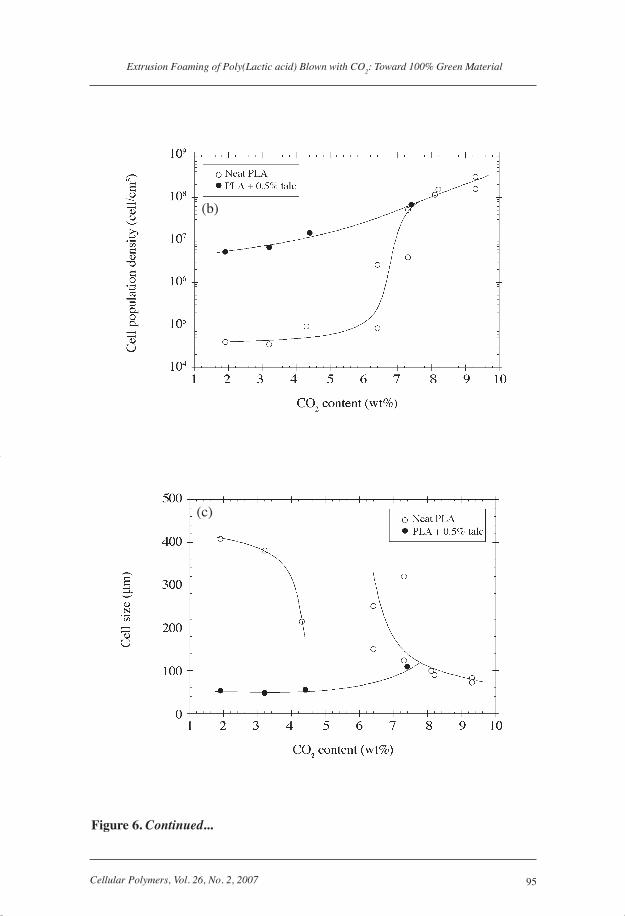
Figure 6(a) displays the foam density variation as a function of blowing agent concentration for a nominal processing temperature of 100 °C. Average cell sizes calculated by image analysis as well as estimation of cell population density (according to Eq.1) have been plotted as a function of CO
2 content
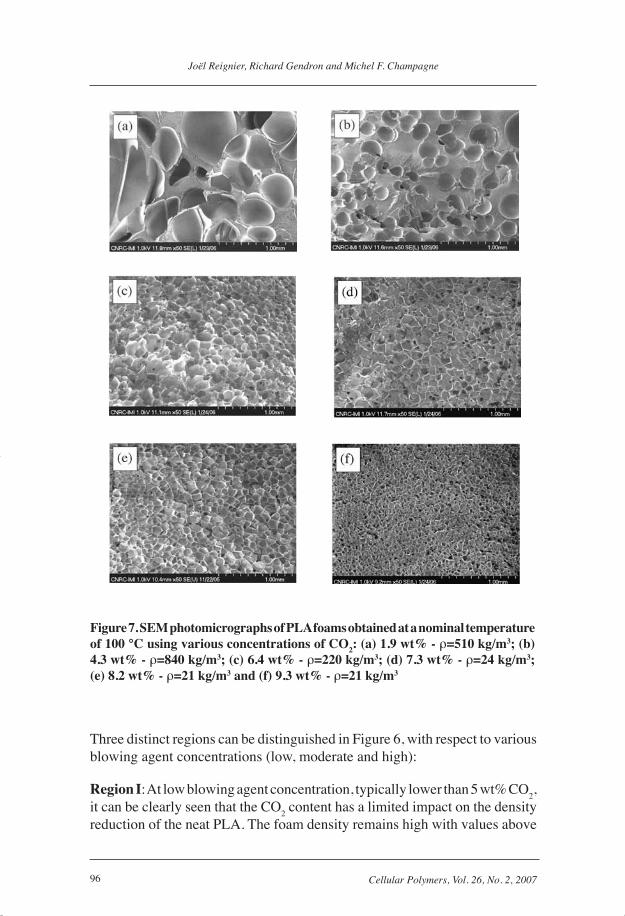
in Figure 6(b)-(c). SEM micrographs corresponding to the various foaming agent concentrations with or without talc are shown respectively in Figures 7 and 8.
Figure 6. Effect of blowing agent concentration on (a) the bulk foam density; (b) the cell population density and (c) the cell size of neat PLA (open symbol) and PLA+0.5 wt% talc (fi lled symbol) foams with CO2 as blowing agent. Specimens were processed at a foaming temperature of 100 °C. The lines are only guides for the eyes. Note that the density values reported here correspond to measurements made prior to samples ageing, typically within ca. 15 min after production
(a)
Cell Poly 2 07.indb 94Cell Poly 2 07.indb 94 11/4/07 3:05:47 pm11/4/07 3:05:47 pm
95Cellular Polymers, Vol. 26, No. 2, 2007
Extrusion Foaming of Poly(Lactic acid) Blown with CO2: Toward 100% Green Material
Figure 6. Continued...
(b)
(c)
Cell Poly 2 07.indb 95Cell Poly 2 07.indb 95 11/4/07 3:05:48 pm11/4/07 3:05:48 pm
96 Cellular Polymers, Vol. 26, No. 2, 2007
Joël Reignier, Richard Gendron and Michel F. Champagne
Three distinct regions can be distinguished in Figure 6, with respect to various blowing agent concentrations (low, moderate and high):
Region I: At low blowing agent concentration, typically lower than 5 wt% CO2,
it can be clearly seen that the CO2 content has a limited impact on the density
reduction of the neat PLA. The foam density remains high with values above
Figure 7. SEM photomicrographs of PLA foams obtained at a nominal temperature of 100 °C using various concentrations of CO2: (a) 1.9 wt% - ρ=510 kg/m3; (b) 4.3 wt% - ρ=840 kg/m3; (c) 6.4 wt% - ρ=220 kg/m3; (d) 7.3 wt% - ρ=24 kg/m3; (e) 8.2 wt% - ρ=21 kg/m3 and (f) 9.3 wt% - ρ=21 kg/m3
Cell Poly 2 07.indb 96Cell Poly 2 07.indb 96 11/4/07 3:05:48 pm11/4/07 3:05:48 pm
97Cellular Polymers, Vol. 26, No. 2, 2007
Extrusion Foaming of Poly(Lactic acid) Blown with CO2: Toward 100% Green Material
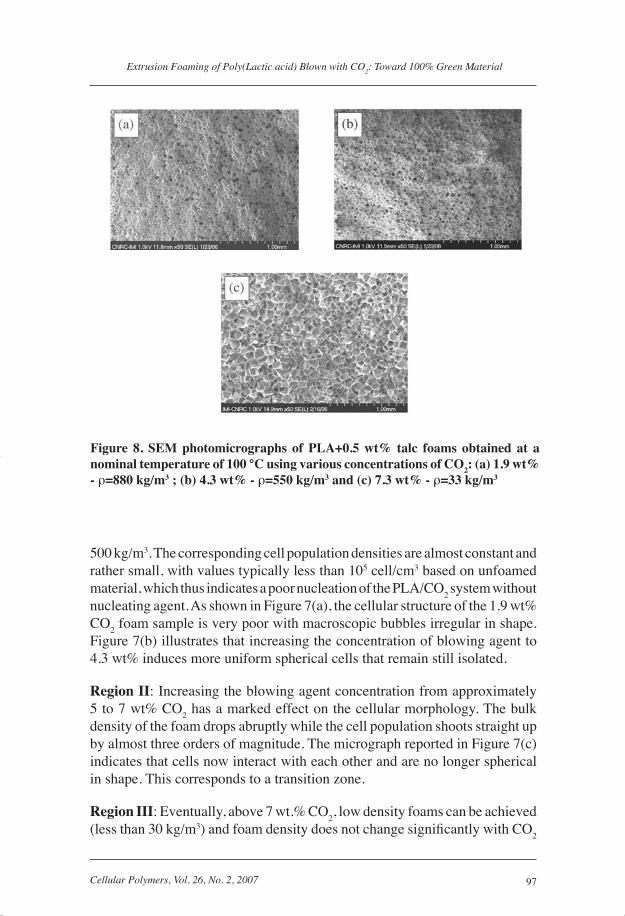
500 kg/m3. The corresponding cell population densities are almost constant and rather small, with values typically less than 105 cell/cm3 based on unfoamed material, which thus indicates a poor nucleation of the PLA/CO
2 system without
nucleating agent. As shown in Figure 7(a), the cellular structure of the 1.9 wt% CO
2 foam sample is very poor with macroscopic bubbles irregular in shape.
Figure 7(b) illustrates that increasing the concentration of blowing agent to 4.3 wt% induces more uniform spherical cells that remain still isolated.
Region II: Increasing the blowing agent concentration from approximately 5 to 7 wt% CO
2 has a marked effect on the cellular morphology. The bulk
density of the foam drops abruptly while the cell population shoots straight up by almost three orders of magnitude. The micrograph reported in Figure 7(c) indicates that cells now interact with each other and are no longer spherical in shape. This corresponds to a transition zone.
Region III: Eventually, above 7 wt.% CO2, low density foams can be achieved
(less than 30 kg/m3) and foam density does not change signifi cantly with CO2
Figure 8. SEM photomicrographs of PLA+0.5 wt% talc foams obtained at a nominal temperature of 100 °C using various concentrations of CO2: (a) 1.9 wt% - ρ=880 kg/m3 ; (b) 4.3 wt% - ρ=550 kg/m3 and (c) 7.3 wt% - ρ=33 kg/m3
Cell Poly 2 07.indb 97Cell Poly 2 07.indb 97 11/4/07 3:05:49 pm11/4/07 3:05:49 pm
98 Cellular Polymers, Vol. 26, No. 2, 2007
Joël Reignier, Richard Gendron and Michel F. Champagne
content while the cell population density slightly increases with CO2 from 107
to 108 cell/cm3. The corresponding foam morphologies depicted in Figures 7(d)-(f) reveal regular hexagonal bubbles with an average diameter in the 200-400 μm range, with the cell size decreasing with increasing CO
2 content. A
few open cells are visible in all cases. It appears from the above results that a critical gas concentration of 7 wt.% is required for a favorable nucleation and expansion process leading to low density foams, in absence of any nucleating agent. This concentration threshold will be discussed later in the paper.
Effect of Talc on Cellular Structure
The effect of talc addition on cell density and cell morphology is considered next. Addition of 0.5 wt% talc to foam formulations clearly leads to a much fi ner cell morphology in regions I and II, indicative that talc particles act as heterogeneous nucleation sites for bubble nucleation. The cell population density increases by a factor 100 while the average size drops from a few hundreds micrometers down to less than 60 μm. Foam morphologies presented in Figures 8(a)-(b) show a clear trend of decreasing cell sizes with respect to neat PLA at the same content of CO
2 (see Figures 7(a) and (c), respectively).
However, at higher carbon dioxide concentrations (region III), the effect of talc on the morphology of the cellular structure vanishes since there is no longer signifi cant difference between the foam density, cell population density and average cell size for the samples processed with or without talc. This point will be discussed in more details in the next section.
Foaming PLA with CO2 near Supercritical Conditions
The most striking fact displayed in Figure 6(a) is the critical foaming agent concentration below which foam expansion remains very low. Note that a similar observation have been reported for polycarbonate (PC) blown with CO
2(20). Above this critical value, i.e. ca. 7 wt% CO
2, signifi cant expansion
occurs and foam density decreases abruptly down to approximately 20 kg/m3. For instance, the foam density obtained at 100 °C for a CO
2 concentration
of 6.4 wt% is slightly higher than 700 kg/m3, which is only half the density of pure PLA, despite the high concentration of blowing agent used. Similar results, not reported here, have also been obtained at 90 °C.
The processing window associated to “good foams” (honeycomb structure and density lower than 40 kg/m3) is reported in Figure 5 by a shaded area. Interestingly, the processing window associated with low-density foams and high nucleation rate (107-108 cell/cm3) involves an injection pressure (for the associated required gas concentration) that corresponds relatively well to the
Cell Poly 2 07.indb 98Cell Poly 2 07.indb 98 11/4/07 3:05:50 pm11/4/07 3:05:50 pm
99Cellular Polymers, Vol. 26, No. 2, 2007
Extrusion Foaming of Poly(Lactic acid) Blown with CO2: Toward 100% Green Material
critical pressure of CO2 (7.38 MPa). Based on several abnormal features observed
during extrusion foaming involving various polymer/PFA combinations, it has been recently proposed(21) that processing a physical blowing agent under conditions that are close to or slightly above its critical point (i.e. at a temperature greater than its critical temperature T
c and at pressure around its
critical pressure Pc) could dramatically affect the cell nucleation due to the
presence of local density inhomogeneities of the physical blowing agent. At this point, it is still not clear if this strange behavior could be a reminiscence of the supercritical state of the blowing agent prevailing during its injection or to the physical state of the PFA during the phase separation stage.
Recently reviewed by Tucker(22), the issue of solvent density inhomogeneities in supercritical fl uids (SCF) are of primary importance in the development of new chemical processes based on control of solvation properties. Density variations of ca. 20% have been reported(23) in pure SCF. However, it has been demonstrated in dilute supercritical solutions – in that case, a very low concentration of polymer is introduced into the solvent - that additional inhomogeneities exist leading to local density that may be 2-3 times that of the bulk density(23). In addition, the magnitude of these local inhomogeneities was found to be related to the intensity of solute-solvent interactions(23). According to Urdahl et al.(24), this particular behavior may be seen as a liquid-like condensation, i.e. a localized phase transition of the fl uid molecules around the solute polymer because the attractive solute-solvent interaction would be greater than that between the solvent molecules. Such local inhomogeneities would likely act as powerful nuclei for initiating bubble nucleation.
In another approach, Cotugno et al.(25) reported on the formation of macroscopic fl uid bubbles (visible through the window of a high pressure view cell) in molten PCL/CO
2 system upon increase of the CO
2 pressure inside the chamber. They
proposed that this phase separation would be intimately linked to a pressure effect for the fl uid in its supercritical state. Melnichenko et al.(26) addressed the effect of temperature and pressure on the phase behavior of poly(dimethylsiloxane) (PDMS) diluted in CO
2 using small angle neutron scattering (SANS). They
reported the fi rst experimental observation that an increase in pressure in supercritical polymer solutions can induce demixing. This polymer-solvent phase separation would correspond classically to the lower critical solution temperature observed for phase diagram of polymers in inorganic solvents. In a different approach, a few authors(27,28) reported swelling anomalies, explained by an onset of phase separation, in polymer thin fi lms exposed to CO
2 near its
critical point. Again, the high pressure associated with CO2 supercritical state
processing would favor the generation of small CO2 clusters acting as bubble
nuclei, thus leading to good foams in these conditions.
Cell Poly 2 07.indb 99Cell Poly 2 07.indb 99 11/4/07 3:05:52 pm11/4/07 3:05:52 pm
100 Cellular Polymers, Vol. 26, No. 2, 2007
Joël Reignier, Richard Gendron and Michel F. Champagne
Another clue on the enhanced nucleation reported when the blowing agent is injected near its supercritical state is given by comparing the effect of talc on cell nucleation density before and near the critical region. Interestingly, while the effect of talc as nucleating agent is clearly visible for CO
2 concentrations
lower than 5 wt%, it seems to vanish at higher concentration of CO2 (see
Figure 6(b)). However, it does not necessarily mean that talc particles cannot play the role of nucleating agent since increase of the cell population density by an absolute value of ca. 107 cell/cm3 – as observed at low CO
2 content
– would be barely apparent on a log scale at a nucleation level greater than 108 cell/cm3. The cell nucleation rate in homogeneously nucleated systems reaches its maximum value near the critical conditions.
Two different hypotheses can explain these results:
(i) By analogy with crystallization from the molten state where the nucleation effi ciency of various nucleating agents can be ranked in percent between non-nucleated and “ideally nucleated” (i.e self-nucleation)(29), the best nucleating agent for cell nucleation will be a cluster or a stable nuclei of the blowing agent itself.
(ii) As shown in static conditions, phase separation in a binary polymer/PFA system does not necessarily occur at the binodal curve, which corresponds to the equilibrium solubility(30). In other words, the system could enter in a metastable zone at lower pressure and stay some time in a supersaturated state before experiencing phase separation. However, at higher concentration of blowing agent, the metastable region, expressed in terms of ∆P, is reduced and even vanishes at the junction between the binodal and spinodal curves. Therefore, density fl uctuations characteristic of spinodal decomposition would be higher for the same value of ∆P (supersaturation state), which would facilitate the formation of clusters. This mechanism would thus render talc inoperative for heterogeneous nucleation purposes.
From a processing point of view, foaming in the supercritical region was found to be generally problematic as it often renders the extrusion process unstable and leads to foams exhibiting an heterogeneous morphology made of large mm-sized cells dispersed in a microcellular morphology(21). In our case, despite the fact that the foams resulting from an injection pressure (or equivalent concentration) approaching P
c varied widely in terms of physical
characteristics from one run to the other (see Figure 6(a) and (c) at 6.4 wt.% of CO
2), the use of CO
2 at injection pressures higher than P
c (with T/T
c ratio
close to 1.22) eliminates this product variation and greatly enhances the cell nucleation, thus leading to foam densities lower than 30 kg/m3 with no blow
Cell Poly 2 07.indb 100Cell Poly 2 07.indb 100 11/4/07 3:05:54 pm11/4/07 3:05:54 pm
101Cellular Polymers, Vol. 26, No. 2, 2007
Extrusion Foaming of Poly(Lactic acid) Blown with CO2: Toward 100% Green Material
holes. It then seems possible that polymer/PFA interactions are one of the key parameters to explain the above discrepancy.
Dimensional Stability of Low Density PLA Foams
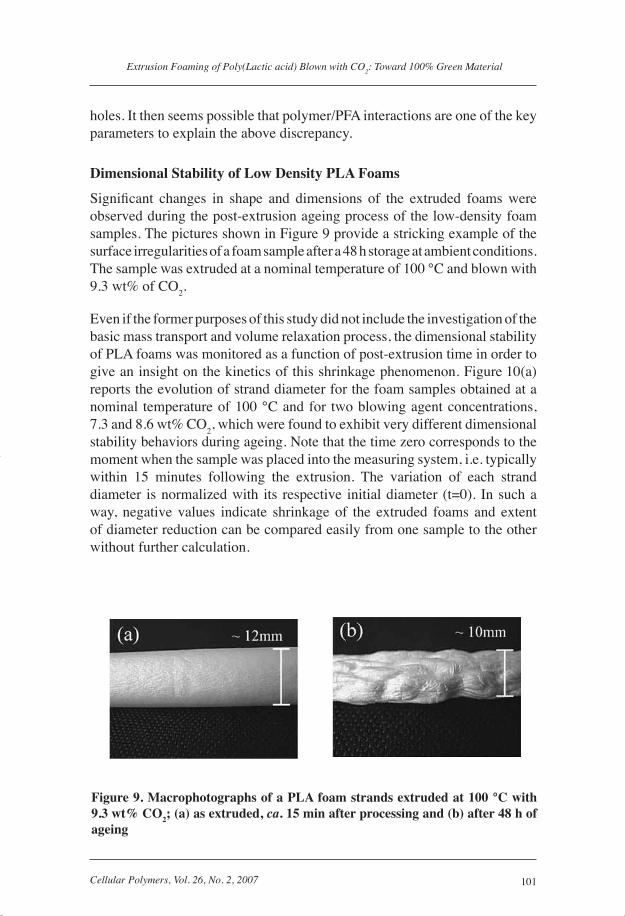
Signifi cant changes in shape and dimensions of the extruded foams were observed during the post-extrusion ageing process of the low-density foam samples. The pictures shown in Figure 9 provide a stricking example of the surface irregularities of a foam sample after a 48 h storage at ambient conditions. The sample was extruded at a nominal temperature of 100 °C and blown with 9.3 wt% of CO
2.
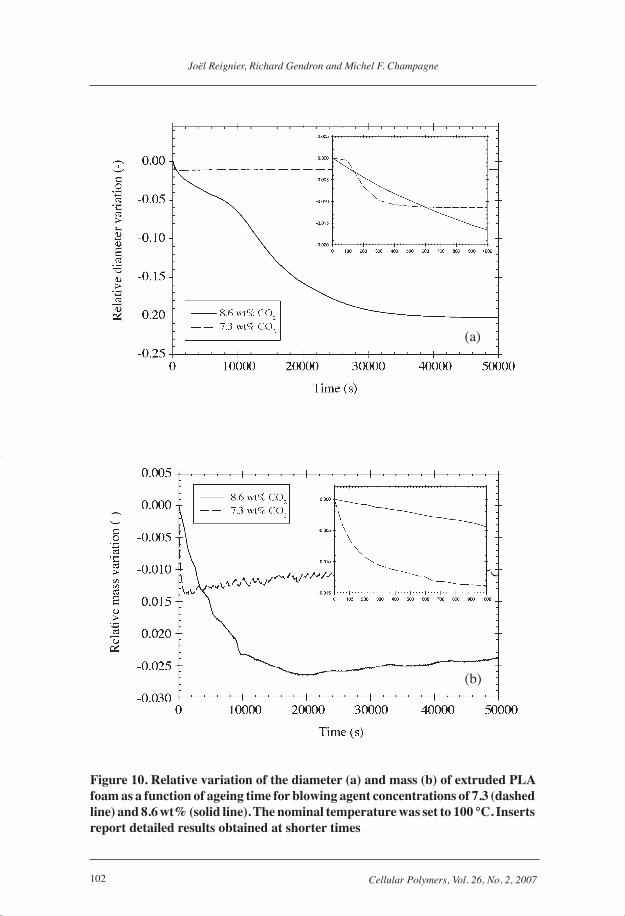
Even if the former purposes of this study did not include the investigation of the basic mass transport and volume relaxation process, the dimensional stability of PLA foams was monitored as a function of post-extrusion time in order to give an insight on the kinetics of this shrinkage phenomenon. Figure 10(a) reports the evolution of strand diameter for the foam samples obtained at a nominal temperature of 100 °C and for two blowing agent concentrations, 7.3 and 8.6 wt% CO
2, which were found to exhibit very different dimensional
stability behaviors during ageing. Note that the time zero corresponds to the moment when the sample was placed into the measuring system, i.e. typically within 15 minutes following the extrusion. The variation of each strand diameter is normalized with its respective initial diameter (t=0). In such a way, negative values indicate shrinkage of the extruded foams and extent of diameter reduction can be compared easily from one sample to the other without further calculation.
Figure 9. Macrophotographs of a PLA foam strands extruded at 100 °C with 9.3 wt% CO2; (a) as extruded, ca. 15 min after processing and (b) after 48 h of ageing
Cell Poly 2 07.indb 101Cell Poly 2 07.indb 101 11/4/07 3:05:55 pm11/4/07 3:05:55 pm
102 Cellular Polymers, Vol. 26, No. 2, 2007
Joël Reignier, Richard Gendron and Michel F. Champagne
Figure 10. Relative variation of the diameter (a) and mass (b) of extruded PLA foam as a function of ageing time for blowing agent concentrations of 7.3 (dashed line) and 8.6 wt% (solid line). The nominal temperature was set to 100 °C. Inserts report detailed results obtained at shorter times
(a)
(b)
Cell Poly 2 07.indb 102Cell Poly 2 07.indb 102 11/4/07 3:05:56 pm11/4/07 3:05:56 pm
103Cellular Polymers, Vol. 26, No. 2, 2007
Extrusion Foaming of Poly(Lactic acid) Blown with CO2: Toward 100% Green Material
As shown in Figure 10(a), the kinetics and diameter reduction are completely different for the two samples. The sample blown with 7.3 wt% CO
2 shrink
only during the fi rst 10 minutes (6x10² s) with less than 1% variation. On the other side, the diameter of the sample blown with 8.6 wt% CO
2 decreases
continuously over 8 h (3x10⁴ s) by more than 20%. For each system examined, the extruded foams were also allowed to age for at least two months, and no signifi cant further change in their dimensions was observed compared to the large shrinkage happening in one case during the fi rst 8 h period. Therefore, the shrinkage process was found to be permanent i.e. non-recoverable.
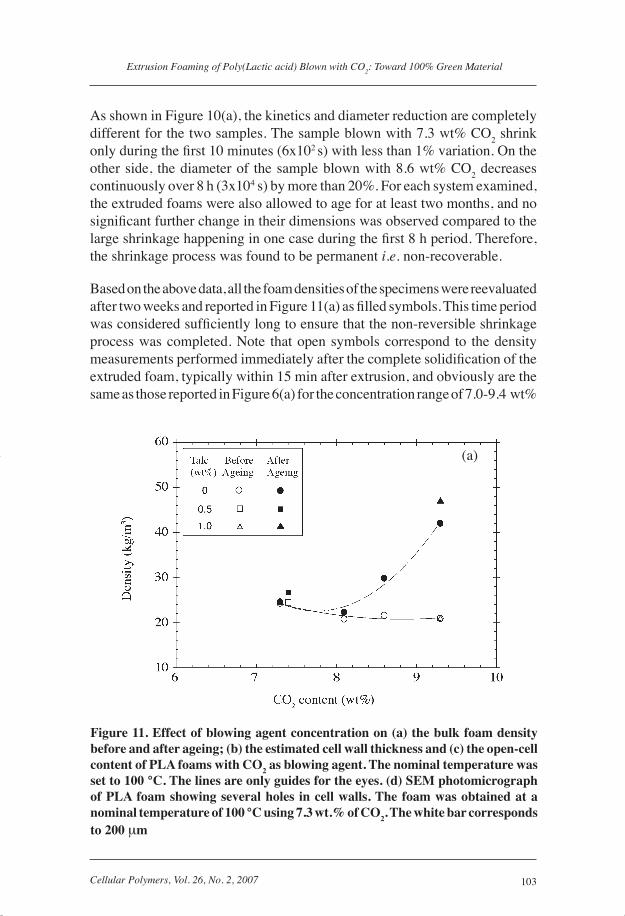
Based on the above data, all the foam densities of the specimens were reevaluated after two weeks and reported in Figure 11(a) as fi lled symbols. This time period was considered suffi ciently long to ensure that the non-reversible shrinkage process was completed. Note that open symbols correspond to the density measurements performed immediately after the complete solidifi cation of the extruded foam, typically within 15 min after extrusion, and obviously are the same as those reported in Figure 6(a) for the concentration range of 7.0-9.4 wt%
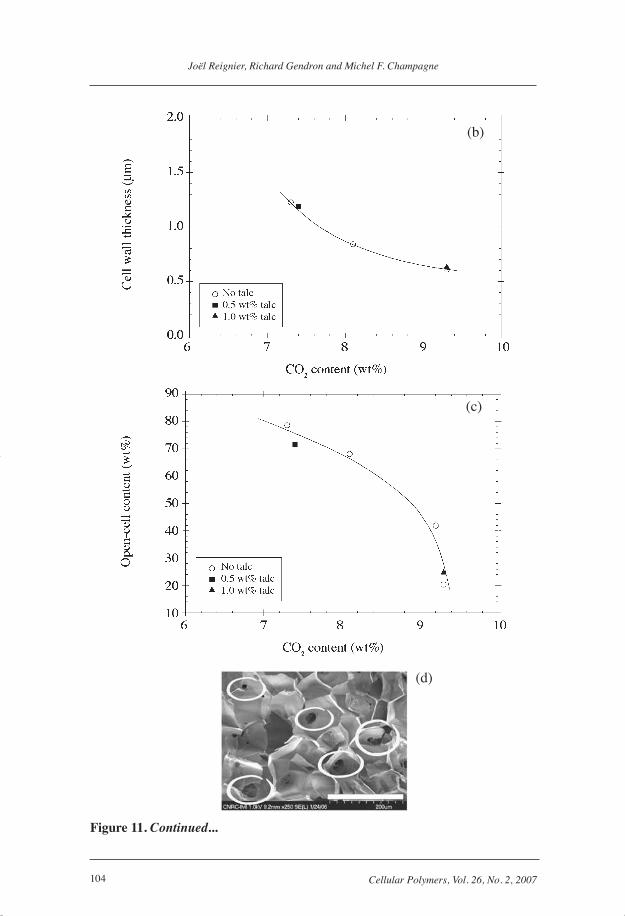
Figure 11. Effect of blowing agent concentration on (a) the bulk foam density before and after ageing; (b) the estimated cell wall thickness and (c) the open-cell content of PLA foams with CO2 as blowing agent. The nominal temperature was set to 100 °C. The lines are only guides for the eyes. (d) SEM photomicrograph of PLA foam showing several holes in cell walls. The foam was obtained at a nominal temperature of 100 °C using 7.3 wt.% of CO2. The white bar corresponds to 200 μm
(a)
Cell Poly 2 07.indb 103Cell Poly 2 07.indb 103 11/4/07 3:05:56 pm11/4/07 3:05:56 pm
104 Cellular Polymers, Vol. 26, No. 2, 2007
Joël Reignier, Richard Gendron and Michel F. Champagne
Figure 11. Continued...
(b)
(c)
(d)
Cell Poly 2 07.indb 104Cell Poly 2 07.indb 104 11/4/07 3:05:58 pm11/4/07 3:05:58 pm

105Cellular Polymers, Vol. 26, No. 2, 2007
Extrusion Foaming of Poly(Lactic acid) Blown with CO2: Toward 100% Green Material
CO2. Several densities were found to be signifi cantly higher after ageing, and
this effect is more pronounced for the highest CO2 content. Obviously, these
results are in agreement with the variation in strand diameter evidenced in Figure 10. Several papers have already treated this shrinkage issue for low-density foams, especially in the case of low density polyethylene foams(31)
and PCL blown with CO2(32). Works conducted over the past decade have
shown that the contraction of the cellular structure is caused by the buildup of a negative pressure inside the cell cavities. This is due to differences in permeation rates of the blowing agent present in the closed-cell foam and exiting the foam faster than air (80% N
2) is entering into the cells. Since the
reduction of the pressure inside the cells does not rupture the cell walls, the cellular structure collapse or shrink. Obviously, this phenomenon is amplifi ed in low modulus foams.
More interestingly, the systematic difference in the density increase during the ageing process for concentrations of CO
2 varying between 7 and 9.3 wt%
is quite surprising. Since the initial density of the tested specimens is similar (21-24 kg/m3), the mechanical response of the cellular structure to the internal negative pressure would be expected to be almost the same.
In order to investigate the reasons for such a difference, a thorough investigation of the dimensional–mass changes interrelationship is needed. Figure 10(b) depicts the mass variation during ageing for each of the system reported in Figure 10(a). Similarly, the mass change is normalized by dividing the variation in the sample mass by the initial mass of the extruded foam (t=0). Even though the exchange of gases after foam production started immediately as the foams underwent cooling, these experimental data indicate that gas diffusion out of the foam may still happen for a long period. However, the time required for the completion of gas mass transfer was found to strongly depend on the CO
2 content. More precisely, the sample with the highest concentration of CO
2
presents a mass reduction of more than 2.5 wt% after over 5 h (1.8x10⁴ s) of ageing whereas the decrease in the mass of the sample with the lowest content of CO
2
is approximately 1.4 wt% after only 15 min (900 s). Even if extrapolation is uncertain, the relative amount of gas lost during the transfer from the extruder to the balance should be higher for the lowest CO
2 content. The kinetics (initial
slope of the curve) is clearly faster for lower CO2 content foams when compared
to samples made with larger CO2 concentrations. Therefore, the plateau value
corresponding to the lower CO2 content should be shifted downward with
respect to the curve corresponding to the higher CO2 content and thus, it is
not possible to determine which samples show the greater mass loss during ageing. Moreover, the above results cannot explain the dependence of the dimensional stability with CO
2 content. The only information available is that
Cell Poly 2 07.indb 105Cell Poly 2 07.indb 105 11/4/07 3:05:58 pm11/4/07 3:05:58 pm
106 Cellular Polymers, Vol. 26, No. 2, 2007
Joël Reignier, Richard Gendron and Michel F. Champagne
the time required to reach a constant and stable mass was found to be strongly dependent on the CO
2 concentration: the lower the CO
2 content is, the shorter
the time to reach equilibrium will be.
Open-cell Content
For closed-cell structures, gas transport is initiated between the inner surface of the foam and the ambient air, and then propagates within the material cell by cell through two main modes of transport: (i) Permeation of the gas dissolved in the solid matrix through the cell walls and (ii) gas phase diffusion across the space inside the cells. However, the presence of open-cells interferes with the transport mode described above since the gas molecules are free to move (convection) through holes in cell walls, bypassing the diffusion step through the polymer network. Therefore, open-cells should obviously reduce the pressure gradients between the cells and accelerate the mass transport kinetic of the various gases in and out of the foam. Eventually, the dimensional stability of the foam should be affected by the content of opened cells. The open-cell content (OCC) was therefore measured immediately after the foams have been produced (typically within 30 min) and is reported in Figure 11(c) as a function of CO
2 content for the foams blown at a nominal temperature
of 100 °C. Figure 11(d) shows several holes in cell walls for the PLA foam obtained with 7.3 wt% CO
2 at 100 °C (same sample as shown in Figure 7(d)).
Clearly, the content of blowing agent signifi cantly impacts the open-cell content. Increasing the CO
2 content from around 7.3 to 9.3 wt% reduces the
open-cell content by a factor of 4. It is worth noting that it was not possible to characterize PLA foams having a CO
2 content higher than 9.1 wt% since the
dimensional change of these foam samples was too fast to allow a fair estimate of their OCC. In these latter cases, massive foam densifi cation was observed even during the measurements in the gas pycnometer.
Obviously, Figure 11(b) evidences a slight but signifi cant reduction in cell wall thickness with an increase of the CO
2 content. Adding more and more blowing
agent increases the nucleation rate despite a reduction of the pressure drop rate (higher plasticization then lower melt pressure at the die). Note that the foam expansion ratio is almost the same within the concentration range reported in Figure 11. Surprisingly, comparing Figures 11(b) and 11(c) unambiguously shows that open-cell content decreases with a reduction in wall thickness. The opposite behavior would have been expected since cell opening is more likely to happen with thinner cell walls. This unexpected behaviour is probably refl ecting the impact of CO
2-induced plasticization upon PLA melt extensional properties. Adding more
and more CO2 seems to increase PLA fi lm resistance to rupture during the thin
fi lm stretching phase inherent to any low density foaming process.
Cell Poly 2 07.indb 106Cell Poly 2 07.indb 106 11/4/07 3:06:00 pm11/4/07 3:06:00 pm
107Cellular Polymers, Vol. 26, No. 2, 2007
Extrusion Foaming of Poly(Lactic acid) Blown with CO2: Toward 100% Green Material
It is also worth noting that the presence of talc does not have any signifi cant impact on the open-cell content. Even if it is generally admit that adding talc increases the cell nucleation density through heterogeneous nucleation which in turn decreases the cell wall thickness (for a constant expansion ratio) and should then favor cell opening, this is not the case in our study since the cell population density is not signifi cantly affected by the presence of talc (see Figure 6(b)) in this CO
2 concentration range.
More interesting, combining Figure 11(a) to 11(c) clearly evidences a relationship between densifi cation (during ageing) and open-cell content. At low OCC (typically, between 20-30%), the density can increase by more than 100%, whereas the densifi cation at higher OCC (above 40%) is limited to less than 10%. In other words, increasing the open-cell content seems to improve the dimensional stability of the foam but this relation does not necessary mean that the densifi cation is solely controlled by the OCC. High OCC observed in the low concentration range may at least explain the faster permeation and thus the rapid dimensional stabilization of the foam produced.
Residual Plasticization
One possibility to explain the difference in the densifi cation of the foams during ageing would be to consider the residual plasticization of the cell walls by dissolved CO
2 “left behind” after foaming. Indeed, the CO
2 molecules are not
only distributed as a gaseous phase in the closed cells but they are also dissolved into the polymer matrix present as cell wall and struts. Since the foam density is almost the same - the number of gas molecules used to effectively blow the polymer matrix should also be the same - one would expect the residual CO
2
dissolved in walls and struts to increase with the initial CO2 content. Basically,
increasing the level of plasticization of the PLA phase would decrease the glass transition temperature of amorphous PLA phase close to or even below the ambient temperature and the foam properties would then be signifi cantly modifi ed. The degassing kinetics would be accelerated since permeability of small molecules through a rubbery membrane is usually much faster than for an amorphous glassy material. Even worse, residual gases dissolved in the matrix would signifi cantly decrease the mechanical properties of the foam sample.
Making the assumption that the extruded foams stop expanding when the cell gas pressure drops to about the pressure of environmental air and that the gas losses are negligible, the amount of CO
2 molecules χ
cell required to maintain
a given pressure inside the cell wall can be estimated using a PVT model by the following expression:
Cell Poly 2 07.indb 107Cell Poly 2 07.indb 107 11/4/07 3:06:01 pm11/4/07 3:06:01 pm
108 Cellular Polymers, Vol. 26, No. 2, 2007
Joël Reignier, Richard Gendron and Michel F. Champagne
χ
ρρ
ρcell
f
p
f
P W
RT=
−⎛
⎝⎜⎜
⎞
⎠⎟⎟int 1
(6)
where Pint
=1.013x10⁵ Pa is the pressure of CO2 inside the cell at t=0, W=44.010 g/
mol is the molar mass of CO2, R=8.3145 J/mol/K is the universal gas constant,
ρp=1.24 g/cm3 and ρ
f the density of solid and foam PLA respectively. The
amount of CO2 remaining in the cell wall χ
wall (wt% with respect to the mass
of PLA) can be estimated by
χwall
= χinit
- χcell
(7)
where χinit
is the initial weight fraction of CO2 in the PLA/CO
2 mixture.
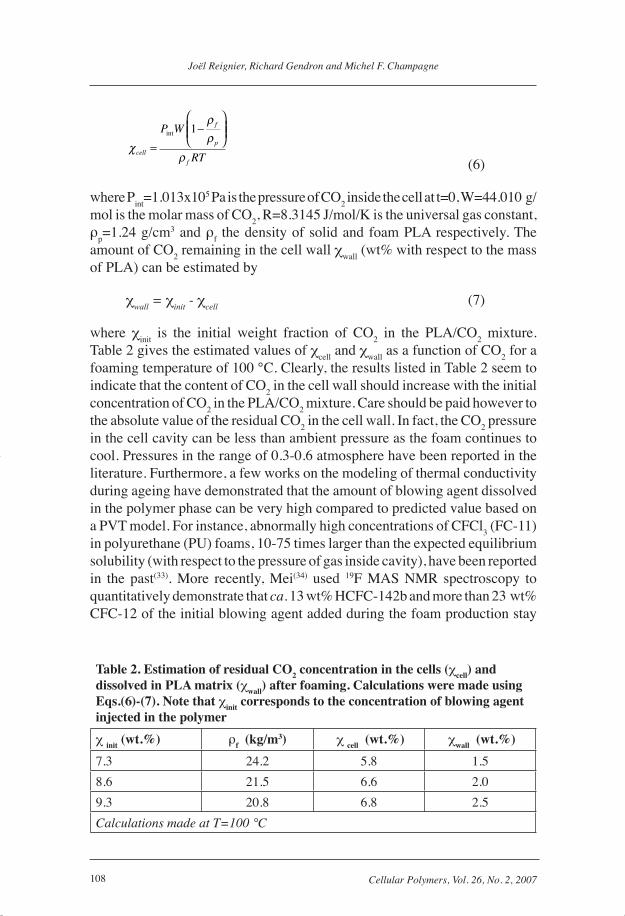
Table 2 gives the estimated values of χcell
and χwall
as a function of CO2 for a
foaming temperature of 100 °C. Clearly, the results listed in Table 2 seem to indicate that the content of CO
2 in the cell wall should increase with the initial
concentration of CO2 in the PLA/CO
2 mixture. Care should be paid however to
the absolute value of the residual CO2 in the cell wall. In fact, the CO
2 pressure
in the cell cavity can be less than ambient pressure as the foam continues to cool. Pressures in the range of 0.3-0.6 atmosphere have been reported in the literature. Furthermore, a few works on the modeling of thermal conductivity during ageing have demonstrated that the amount of blowing agent dissolved in the polymer phase can be very high compared to predicted value based on a PVT model. For instance, abnormally high concentrations of CFCl
3 (FC-11)
in polyurethane (PU) foams, 10-75 times larger than the expected equilibrium solubility (with respect to the pressure of gas inside cavity), have been reported in the past(33). More recently, Mei(34) used 19F MAS NMR spectroscopy to quantitatively demonstrate that ca. 13 wt% HCFC-142b and more than 23 wt% CFC-12 of the initial blowing agent added during the foam production stay
Table 2. Estimation of residual CO2 concentration in the cells (χcell) and dissolved in PLA matrix (χwall) after foaming. Calculations were made using Eqs.(6)-(7). Note that χinit corresponds to the concentration of blowing agent injected in the polymer
χ init (wt.%) ρf (kg/m3) χ cell (wt.%) χwall (wt.%)
7.3 24.2 5.8 1.5
8.6 21.5 6.6 2.0
9.3 20.8 6.8 2.5
Calculations made at T=100 °C
Cell Poly 2 07.indb 108Cell Poly 2 07.indb 108 11/4/07 3:06:02 pm11/4/07 3:06:02 pm
109Cellular Polymers, Vol. 26, No. 2, 2007
Extrusion Foaming of Poly(Lactic acid) Blown with CO2: Toward 100% Green Material
dissolved in the PS matrix. These values are well above the equilibrium solubility of HCFC-142b and CFC-12 in PS at ambient pressure. In the case of PU foams, it was demonstrated that about 27 wt% of the HCFC-142b (based on the total amount of gas in the foam) remains dissolved in the solid polymer network of the fresh foam (before ageing), and this value can even increase up to 33-37 wt% for samples stored during 7 years. More importantly, the study highlighted that in both cases the dissolved blowing agents (within cell walls and struts) are strongly held in the polymer matrix since signifi cant loss of dissolved gas can only be found after ageing under extreme conditions, i.e. high temperature and/or small size sample. No explanation was given on the origin of this strange behaviour. The affi nity between the blowing agents and the polymer may obviously play a signifi cant role as well as a low diffusion coeffi cient of the blowing agent in the polymer matrix. In our case, the CO
2
molecules are rather small compared to HCFC or CFC molecules, and thus CO
2 molecules should diffuse out of the foam much more rapidly than HCFCs
or CFCs. Nevertheless abnormally high concentrations of CO2 dissolved in
the polymer matrix may still be expected.
On the other side, it has been shown using Fourier transform infrared spectroscopy (FT-IR) that the electron pair on the carbonyl oxygen of poly(methyl methacrylate) (PMMA) exhibits specifi c interactions, most probably of Lewis acid-base nature, with the carbon atom of CO
2 molecules(35). Even if these
specifi c interactions seem to be relatively weak, they take part in the relative high solubility of CO
2 in PMMA, which is also observed with other polymers
containing carbonyl groups such as PLA and polycarbonate (PC). Indeed, it is important to remind that gas sorption is not a purely physical phenomenon (free volume) but it mainly depends on specifi c interactions between gas/fl uid and the polymer. More interestingly, Kazarian et al.(35) explained that these interactions can be responsible for the “partitioning” of the CO
2 molecules. At
low saturation pressures, the CO2 dissolved within the polymer fi lm interacts
weakly with the available carbonyl groups of PMMA whereas non-specifi cally interacting CO
2 molecules dominates the spectrum at higher CO
2 pressures. In
another study, Shieh et al.(36) clearly demonstrated that it is more diffi cult to desorb CO
2 from PMMA and PC than from PS because of the greater interaction
of the carbon of CO2 with the carbonyl group present in PMMA compared to the
phenyl group of PS. This differential interaction explains the higher solubility of CO
2 in PMMA than in PS. Although CO
2 was assumed to be absent within
aged samples of PMMA based on weight data measurements, these authors surprisingly found a shift of the relaxation peak to lower temperatures using dynamic mechanical analyzer (DMA). Carbon dioxide molecules were still dissolved in PMMA fi lm 6 months after CO
2 treatment. This plasticization
effect was not found in the case of PS fi lm, thus indicating that the presence
Cell Poly 2 07.indb 109Cell Poly 2 07.indb 109 11/4/07 3:06:03 pm11/4/07 3:06:03 pm
110 Cellular Polymers, Vol. 26, No. 2, 2007
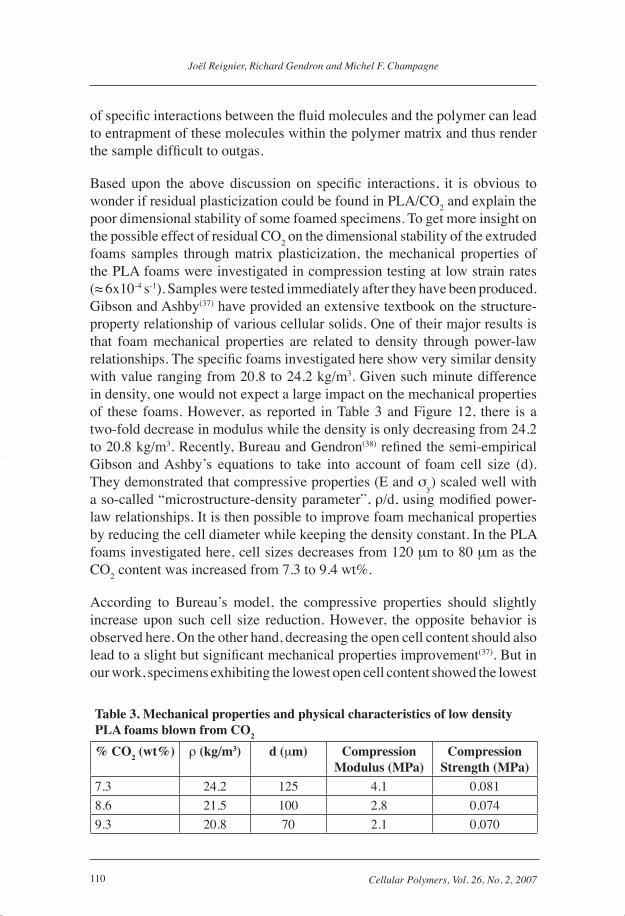
Joël Reignier, Richard Gendron and Michel F. Champagne
of specifi c interactions between the fl uid molecules and the polymer can lead to entrapment of these molecules within the polymer matrix and thus render the sample diffi cult to outgas.
Based upon the above discussion on specifi c interactions, it is obvious to wonder if residual plasticization could be found in PLA/CO
2 and explain the
poor dimensional stability of some foamed specimens. To get more insight on the possible effect of residual CO
2 on the dimensional stability of the extruded
foams samples through matrix plasticization, the mechanical properties of the PLA foams were investigated in compression testing at low strain rates (≈ 6x10⁻⁴ s-1). Samples were tested immediately after they have been produced. Gibson and Ashby(37) have provided an extensive textbook on the structure-property relationship of various cellular solids. One of their major results is that foam mechanical properties are related to density through power-law relationships. The specifi c foams investigated here show very similar density with value ranging from 20.8 to 24.2 kg/m3. Given such minute difference in density, one would not expect a large impact on the mechanical properties of these foams. However, as reported in Table 3 and Figure 12, there is a two-fold decrease in modulus while the density is only decreasing from 24.2 to 20.8 kg/m3. Recently, Bureau and Gendron(38) refi ned the semi-empirical Gibson and Ashby’s equations to take into account of foam cell size (d). They demonstrated that compressive properties (E and σ
y) scaled well with
a so-called “microstructure-density parameter”, ρ/d, using modifi ed power-law relationships. It is then possible to improve foam mechanical properties by reducing the cell diameter while keeping the density constant. In the PLA foams investigated here, cell sizes decreases from 120 μm to 80 μm as the CO
2 content was increased from 7.3 to 9.4 wt%.
According to Bureau’s model, the compressive properties should slightly increase upon such cell size reduction. However, the opposite behavior is observed here. On the other hand, decreasing the open cell content should also lead to a slight but signifi cant mechanical properties improvement(37). But in our work, specimens exhibiting the lowest open cell content showed the lowest
Table 3. Mechanical properties and physical characteristics of low density PLA foams blown from CO2
% CO2 (wt%) ρ (kg/m3) d (μm) Compression Modulus (MPa)
Compression Strength (MPa)
7.3 24.2 125 4.1 0.081
8.6 21.5 100 2.8 0.074
9.3 20.8 70 2.1 0.070
Cell Poly 2 07.indb 110Cell Poly 2 07.indb 110 11/4/07 3:06:04 pm11/4/07 3:06:04 pm
111Cellular Polymers, Vol. 26, No. 2, 2007
Extrusion Foaming of Poly(Lactic acid) Blown with CO2: Toward 100% Green Material
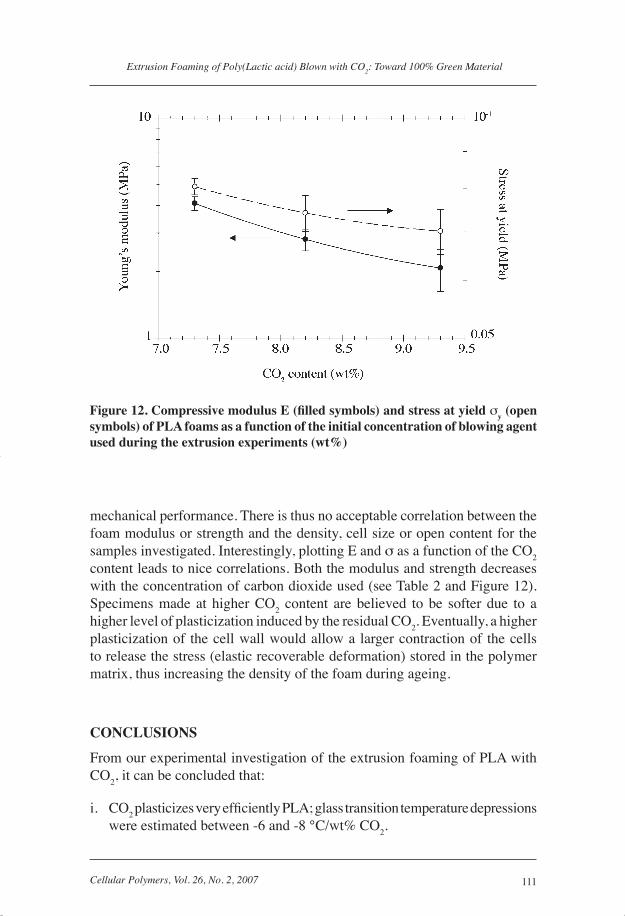
mechanical performance. There is thus no acceptable correlation between the foam modulus or strength and the density, cell size or open content for the samples investigated. Interestingly, plotting E and σ as a function of the CO
2
content leads to nice correlations. Both the modulus and strength decreases with the concentration of carbon dioxide used (see Table 2 and Figure 12). Specimens made at higher CO
2 content are believed to be softer due to a
higher level of plasticization induced by the residual CO2. Eventually, a higher
plasticization of the cell wall would allow a larger contraction of the cells to release the stress (elastic recoverable deformation) stored in the polymer matrix, thus increasing the density of the foam during ageing.
CONCLUSIONS
From our experimental investigation of the extrusion foaming of PLA with CO
2, it can be concluded that:
i. CO2 plasticizes very effi ciently PLA; glass transition temperature depressions
were estimated between -6 and -8 °C/wt% CO2.
Figure 12. Compressive modulus E (fi lled symbols) and stress at yield σy (open symbols) of PLA foams as a function of the initial concentration of blowing agent used during the extrusion experiments (wt%)
Cell Poly 2 07.indb 111Cell Poly 2 07.indb 111 11/4/07 3:06:05 pm11/4/07 3:06:05 pm
112 Cellular Polymers, Vol. 26, No. 2, 2007
Joël Reignier, Richard Gendron and Michel F. Champagne
ii. Very low density PLA foams, in the order of 20-25 kg/m3, have been achieved using a CO
2 concentration in the 7-9 wt% PFA range. Surprisingly, foams
having an intermediate density could not be obtained by reducing slightly the blowing agent concentration. Interestingly, the injection pressure associated with this critical concentration threshold (CO
2 ≅ 7 wt%) corresponds to the
critical pressure of carbon dioxide. As a consequence, this system requires high processing pressures in order to prevent premature foaming, despite the reported high solubility of CO
2 into PLA.
iii. Increasing the concentration of blowing agent beyond this critical point has no effect on the bulk density of the produced foam. However, high CO
2 content severely deteriorates the dimensional stability of the foam
over time in the post-extrusion ageing process. Our results show a clear relationship between open-cell content and foam dimensional stability. Plasticization of the PLA matrix by residual CO
2 molecules entrapped in
the polymer network signifi cantly soften the foam and contribute to the massive shrinkage of the cellular structure observed in this work.
More work is needed to clearly identify the mechanisms responsible for some of these observations. Obviously, the strong affi nity between PLA and CO
2 should contribute signifi cantly to the observed behaviors. While lack of
solubility has usually been reported as a major obstacle for extrusion foaming, the interaction between the carbonyl groups of PLA and carbon dioxide might play an adverse role in this actual foaming situation.
In addition, despite our partial success in fi nding an appropriate processing window to produce low density foams, use of amorphous PLA presents severe drawbacks in terms of utilization of the end product, particularly with respect to degradation of the mechanical properties with temperature. Experiments based on extrusion foaming of semi-crystalline grades of PLA are underway, with a particular attention dedicated to the enhanced crystallization kinetics in presence of CO
2(39).
Use of a different blowing agent might also be considered in a near future. The same way volatile hydrocarbons have proven their usefulness in low density foaming polyolefi ns, such non-polar molecules might also fi nd their utility in PLA foaming. Adequate solubility has been already reported for butane and isobutane in PLA(40). Another interesting strategy would be based on mixtures of foaming agents, in which case carbon dioxide is partially replaced by another inert and high volatile component, such as nitrogen(6).
Foaming PLA is still in its infancy, but concerted efforts in investigating
Cell Poly 2 07.indb 112Cell Poly 2 07.indb 112 11/4/07 3:06:06 pm11/4/07 3:06:06 pm
113Cellular Polymers, Vol. 26, No. 2, 2007
Extrusion Foaming of Poly(Lactic acid) Blown with CO2: Toward 100% Green Material
potential methods such as material modifi cation and processing aids might rapidly bring foamed PLA into large scale industrial production and use, with huge environmental benefi ts.
ACKNOWLEDGEMENTS
The authors are grateful to Karine Théberge, Manon Plourde and François Vachon for their technical support. Joël Reignier is also particularly grateful to Jacques Tatibouët for fruitful discussions.
REFERENCES
1. R. Auras, R., Harte, B. and Selke, S., Macromol. Biosci., 4, (2004) 835-864.
2. Mooney, D.J., Baldwin, D.F., Suh, N.P., Vacanti, J.P. and Langer, R., Biomaterials, 17, (1996) 1417-1422.
3. Sparacio, A. and Beckman, E.J., Generation of Microcellular Biodegradable Polymers Using Supercritical Carbon Dioxide, ACS Polymer Preprints, 11, (1998) 38.
4. Hile, D.D., Amirpour, M.L., Akgerman, A. and Pishko, M.V., J. Control. Released, 66, (2000) 177-185.
5. Fujimoto, Y., Sinha Ray, S., Okamoto, M., Ogami, A., Yamada, K and Ueda, K., Macromol. Rapid. Commun., 24, (2003) 457-461.
6. Iannace, S., Di, Y., Di Maio, E. and Marrazzo, C., The 7th International Conference on Blowing Agents and Foaming Processes, Stuttgart (2005).
7. Hu, X., Nawaby, A.V., Naguib, H.E., Day, M., Ueda, K. and Lia, X., ANTEC 2005 Annual Technical Conference, Boston, 2670 (2005).
8. Sato, Y., Yamane, M., Sorakubo, A., Takishima, S., Masuoka, H., Yamamoto, H. and Takasugi, M. The 21st Japan Symposium on Thermophysical Properties, Nagoya, 196-198 (2000).
9. Fang, Q. and Hanna, M.H., Cereal Chem., 77, (2000) 779-783.
10. Willett, J.L. and Shogren, R.L., Polymer, 43, (2002) 5935-5947.
11. Prechawoong, D., Peesan, M., Supaphol, P. and Rujiravanit, R., Carbohydr. Polym., 59, (2005) 329-337.
12. Sahnoune, A., Tatibouët, J., Gendron, R., Hamel, A. and Piché, L., J. Cell. Plast., 37, (2001) 429-454.
13. Gendron, R. and Daigneault, L.E., Rheological Behavior of Mixtures of Polystyrene with HCFC 142b and HFC 134a., J. Cell. Plast., 35, (1999) 221-246.
Cell Poly 2 07.indb 113Cell Poly 2 07.indb 113 11/4/07 3:06:07 pm11/4/07 3:06:07 pm
114 Cellular Polymers, Vol. 26, No. 2, 2007
Joël Reignier, Richard Gendron and Michel F. Champagne
14. Tatibouët, J., Chapter 5: Investigating Foam Processing in Thermoplastic Foam Processing – Principles and Applications. Edited by R. Gendron, CRC Press, 195-233 (2005).
15. Vachon, C. and Gendron, R., Cell. Polym., 22, (2003) 75-88.
16. Gendron, R., Huneault, M.A., Tatibouët, J. and Vachon, C., Cell. Polym., 21, (2002) 315-341.
17. Gendron, R., Champagne, M.F., Delaviz, Y. and Polaski, M.E., ANTEC 2005 Annual Technical Conference, Boston, 2650-2652 (2005).
18. Chow, T.S., Macromolecules, 13, (1980) 362-364.
19. Tatibouët, J. and Gendron, R., J. Cell. Plast., 40, (2004) 27-44.
20. Lee, J.W.S., Wang, K. and Park, C.B., Ind. Eng. Chem. Res., 44, (2005) 92-99.
21. Gendron, R. Champagne, M.F., and Reignier, J., Cell. Polym., 25, (2006) 199-220.
22. Tucker, S.C., Chem. Rev., 99, (1999) 391-418.
23. Song, W., Biswas, R. and Maroncelli, M., J. Phys. Chem. A, 104, (2000) 6924-6939.
24. Urdahl, R.S., Rector, K.D., Myers, D.J., Davis, P.H. and Fayer, M.D., J. Chem. Phys., 105, (1996) 8973-8976.
25. Cotugno, S., Di Maio, E., Mensitieri, G., Iannace, S., Roberts, G.W., Carbonell, R.G. and Hopfenberg, H.B., Ind. Eng. Chem. Res., 44, (2005) 1795-1803.
26. Melnichenko, Y.B., Kiran, E., Wignall, G.D., Heath, K.D., Salaniwal, S., Cochran, H.D. and Stamm, M., Macromolecules, 32, (1999) 5344-5347.
27. Sirard, S.M., Ziegler, K.J., Sanchez, I.C., Green, P.F. and Johnston, K.P., Macromolecules, 35, (2002) 1928-1935.
28. Koga, T., Akashige, E., Reinstein, A., Bronner, M., Seo, Y.S., Shin, K., Rafailovich, M.H., Sokolov, J.C., Chu, B. and Satija, S.K., Physica B, 357, (2005) 73-79.
29. Fillon, B., Lotz, B., Thierry, A. and Wittmann, J.C., J. Polym. Sci: B, Polym. Phys., 31, (1993) 1395-1405.
30. Reignier, J., Tatibouët, J. and Gendron, R., Polymer, 47, (2006) 5012-5024.
31. Yang, T.C., Lee, K.L. and Lee, S.T., J. Cell. Plast., 38, (2002) 113-128.
32. Di Maio, E., Mensitieri, G., Iannace, S., Nicolais, L., Li, W. and Flumerfelt, R.W., Polym. Eng. Sci., 45, (2005) 432-441.
33. Brandreth, D.A. and Ingersoll, H.G., J. Cell. Plast., 16, (1980) 235-238.
34. Mei Z., NMR Imaging and Spectroscopic Investigations of Blowing Gases in Polymer Insulating Foams, Ph.D Thesis – University of British Columbia (1996).
Cell Poly 2 07.indb 114Cell Poly 2 07.indb 114 11/4/07 3:06:08 pm11/4/07 3:06:08 pm
115Cellular Polymers, Vol. 26, No. 2, 2007
Extrusion Foaming of Poly(Lactic acid) Blown with CO2: Toward 100% Green Material
35. Kazarian, S.G., Vincent, M.F., Bright, F.V., Liotta, C.L. and Eckert, C.A., J. Am. Chem. Soc., 118, (1996) 1729-1736.
36. Shieh, Y.-T., Liu, K.-H., J. Supercrit. Fluids, 25, (2003) 261-268.
37. Gibson, L.J. and Ashby, M.F., Cellulars Solids Structure and Properties, 2nd ed., pp.510, Cambridge University Press, New-York (1997).
38. Bureau, M. and Gendron, R., J. Cell. Plast., 39, (2003) 353-367.
39. Tatibouët, J., Reignier, J. and Gendron, R., Proceed. Blowing Agents and Foaming Processes 2007, Frankfurt, May 2007 (2007).
40. Sato, Y., Sakai, H., Wang, M., Takishima, S. and Masuoka, H., Proceed. Polymer Processing Society PPS 2004, Akron, OH, paper 114 (2004).
Cell Poly 2 07.indb 115Cell Poly 2 07.indb 115 11/4/07 3:06:10 pm11/4/07 3:06:10 pm
116 Cellular Polymers, Vol. 26, No. 2, 2007
Joël Reignier, Richard Gendron and Michel F. Champagne
Cell Poly 2 07.indb 116Cell Poly 2 07.indb 116 11/4/07 3:06:10 pm11/4/07 3:06:10 pm