ey50 state tax
TRANSCRIPT

Total state and local business taxesState-by-state estimates for fi scal year 2014
October 2015


Total state and local business taxes | 1
This report presents detailed state-by-state estimates of the state and local taxes paid by businesses for FY2014. It is the 13th annual study prepared by Ernst & Young LLP in conjunction with the Council On State Taxation (COST).
Businesses paid more than $688 billion in state and local taxes in FY2014, an increase of 2.2% from FY2013. State business taxes grew less quickly than local taxes, with state taxes growing 1.5% compared to local tax growth of 3.1%. In FY2014, business tax revenue accounted for 45% of all state and local tax revenue. The business share has been within one percentage point of 45% since FY2003.
The state and local business tax estimates presented in this report refl ect tax collections from July 2013 through June 2014 in most states.1 These include business property taxes, sales and excise taxes paid by businesses on their input purchases and capital expenditures, gross receipts taxes, corporate income and franchise taxes, business and corporate license taxes, unemployment insurance taxes, individual income taxes paid by owners of non-corporate (pass-through) businesses, and other state and local taxes that are the statutory liability of business taxpayers.
Executive summary

2
Key fi ndings of the report include:
• Revenue from state and local business taxes increased from FY2013 to FY2014. Overall state and local business tax revenue increased 2.2%, with state business tax revenue growing by 1.5% and local business tax revenue growing 3.1%.
• Business property tax revenue increased 3.2% in FY2014, a gain of $7.8 billion. Property taxes remain by far the largest state and local tax paid by businesses, accounting for 36.4% of the total.
• General sales taxes on business inputs and capital investment totaled $142.8 billion, or 20.7% of state and local business taxes. Overall sales taxes paid by businesses increased 4.3%.
• In FY2014, state and local corporate income tax revenue was $64.4 billion, or 9.4% of all state and local business taxes. FY2014 marked the fourth consecutive year of corporate income tax growth.
• � Individual income taxes on pass-through business income accounted for 4.9% of total state and local business tax revenue. Individual income tax revenue on business income decreased 4.8%, the largest decrease of any tax in FY2014.
• On average, business taxes are equal to 4.6% of private sector gross state product (GSP), which measures the total value of a state’s annual private sector production of goods and services. There is substantial variation among states, with business tax revenue as a share of GSP ratios ranging from 3.4% to 11.5%.
• On average, businesses continue to pay more in state and local taxes than they receive in benefi ts. Businesses paid $3.35 for every dollar of government spending benefi ting businesses, on average, assuming that education spending does not benefi t local businesses. An alternate assumption, that half of education spending benefi ts local businesses, results in businesses paying $1.23 for every dollar of government spending benefi ting businesses.
• Businesses paid 10.6% of their gross operating surplus (similar to net profi ts) in state and local taxes in 2014.

Total state and local business taxes | 3
Total state and local business taxes in FY2014Businesses paid $688.7 billion in total state and local taxes in FY2014, as presented in Table 1.2 This section describes the business taxes in more detail and highlights the key results.
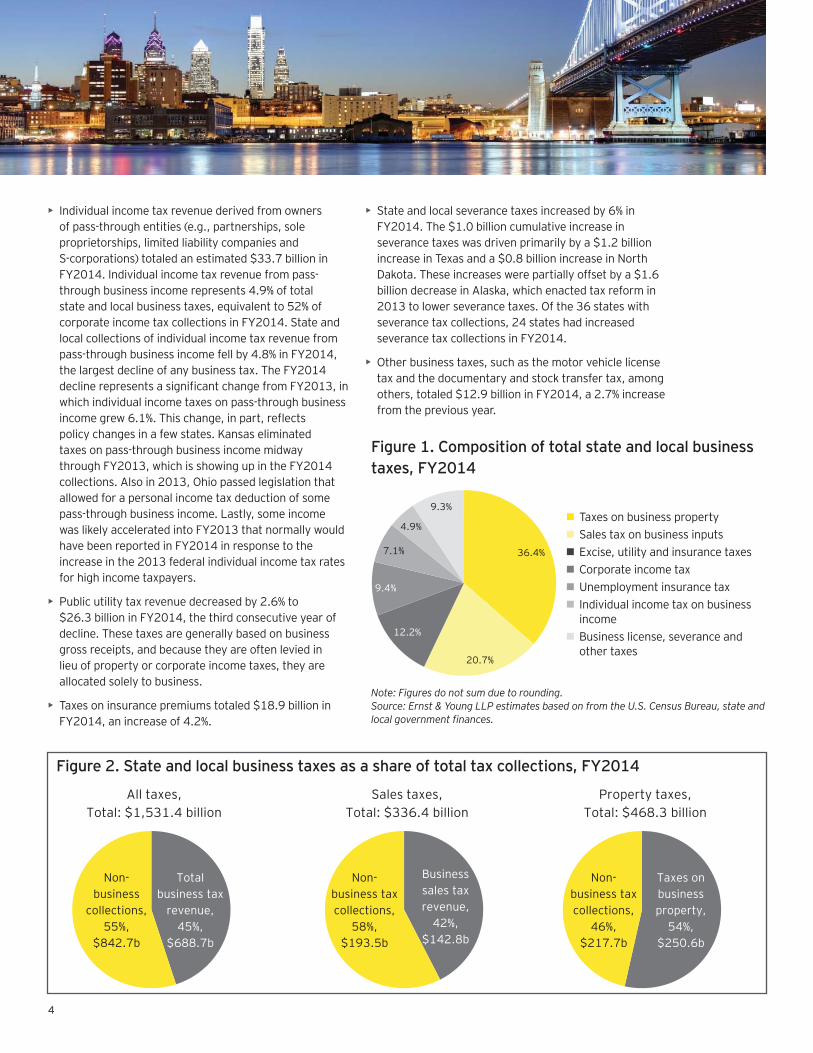
• As shown in Table 1 and Figure 1, property tax revenue on real and personal property owned by businesses account for the largest share of total state and local business tax revenue, 36.4% or $250.6 billion in FY2014. Business property tax revenue increased 3.2% in FY2014. It is the second time since FY2009 that the growth rate has been substantially higher than 1%. Additionally, Figure 2 shows business property tax revenue as a share of total property tax revenue in 2014. Of the $468.3 billion of total property tax revenue, 54% ($250.6 billion) of the collections were taxes on business property.
• General sales and use tax revenue derived from businesses on purchases of inputs, including capital equipment, totaled $142.8 billion, or 20.7% of all state and local business taxes. General sales and use tax revenue derived from business increased 4.3% overall. Sales and use taxes collected on sales to fi nal consumers are excluded; only the taxes paid on businesses’ operating inputs and capital equipment purchases are included in the total business tax estimates.3 Figure 2 displays general sales tax revenue on business inputs as a share of total state and local general sales tax revenue. In 2014, 42% of total sales tax revenue was from sales tax on business inputs.
• State and local corporate income tax revenue was $64.4 billion in FY2014, an increase of 3% from FY2013. FY2014 was the fourth consecutive year of rising state and local corporate income taxes. Included in corporate income tax revenue are Ohio’s Commercial Activity Tax, Texas’ Margin Tax, and Washington’s Business & Occupation Tax. These taxes are based on gross receipts and constitute the primary business entity tax in each state, none of which imposes a traditional corporate income tax.
• Employer contributions to unemployment insurance (unemployment taxes) were $48.7 billion in FY2014, a decrease of 4.3% from FY2013. This is the fi rst year that unemployment tax collections have declined since FY2008. States provided fewer unemployment benefi ts in 2014. In addition, tax rates on employers declined, and surcharges expired in some states, easing the burden on employers and lowering collections.
• Excise taxes paid by business were an estimated $38.9 billion in FY2014. Excise taxes attributed to business include a portion of motor fuel taxes and other excise taxes, such as taxes on hotel and rental car expenditures by business, as well as health care provider taxes on the revenue of hospitals and other providers of health services.
• Business and corporate license tax revenue totaled $33.6 billion, an increase of 4.8% from FY2013. In FY2014, business and corporate license tax revenue contributed 4.9% of total state and local business tax collections.
Table 1. Total state and local business taxes, FY2014 ($ billions)
Business tax FY2013* FY2014 2014 % total taxes One-year changeProperty taxes on business property $242.8 $250.6 36.4% 3.2%
General sales taxes on business inputs 137.0 142.8 20.7% 4.3%
Corporate income tax 62.5 64.4 9.4% 3.0%
Unemployment insurance 50.8 48.7 7.1% –4.3%
Excise taxes 38.5 38.9 5.6% 1.1%
Individual income tax on business income 35.5 33.7 4.9% –4.8%
Business and corporate license taxes 32.1 33.6 4.9% 4.8%
Public utility taxes 27.0 26.3 3.8% –2.6%
Insurance premium taxes 18.2 18.9 2.7% 4.2%
Severance taxes 16.9 17.9 2.6% 6.0%
Other business taxes 12.6 12.9 1.9% 2.7%
Total state and local business taxes $673.7 $688.7 100.0% 2.2%
Note: Amounts may not sum due to rounding.*FY2013 tax estimates are revised from the COST FY2013 study due to newly released data from the US Census Bureau. See Appendix for more information.Source: Ernst & Young LLP estimates based on data from the U.S. Census Bureau, state and local government fi nances.
4
• Individual income tax revenue derived from owners of pass-through entities (e.g., partnerships, sole proprietorships, limited liability companies and S-corporations) totaled an estimated $33.7 billion in FY2014. Individual income tax revenue from pass-through business income represents 4.9% of total state and local business taxes, equivalent to 52% of corporate income tax collections in FY2014. State and local collections of individual income tax revenue from pass-through business income fell by 4.8% in FY2014, the largest decline of any business tax. The FY2014 decline represents a signifi cant change from FY2013, in which individual income taxes on pass-through business income grew 6.1%. This change, in part, refl ects policy changes in a few states. Kansas eliminated taxes on pass-through business income midway through FY2013, which is showing up in the FY2014 collections. Also in 2013, Ohio passed legislation that allowed for a personal income tax deduction of some pass-through business income. Lastly, some income was likely accelerated into FY2013 that normally would have been reported in FY2014 in response to the increase in the 2013 federal individual income tax rates for high income taxpayers.
• Public utility tax revenue decreased by 2.6% to $26.3 billion in FY2014, the third consecutive year of decline. These taxes are generally based on business gross receipts, and because they are often levied in lieu of property or corporate income taxes, they are allocated solely to business.
• Taxes on insurance premiums totaled $18.9 billion in FY2014, an increase of 4.2%.
• State and local severance taxes increased by 6% in FY2014. The $1.0 billion cumulative increase in severance taxes was driven primarily by a $1.2 billion increase in Texas and a $0.8 billion increase in North Dakota. These increases were partially offset by a $1.6 billion decrease in Alaska, which enacted tax reform in 2013 to lower severance taxes. Of the 36 states with severance tax collections, 24 states had increased severance tax collections in FY2014.
• Other business taxes, such as the motor vehicle license tax and the documentary and stock transfer tax, among others, totaled $12.9 billion in FY2014, a 2.7% increase from the previous year.
Figure 1. Composition of total state and local business taxes, FY2014
Figure 2. State and local business taxes as a share of total tax collections, FY2014
36.4%
20.7%
12.2%
9.4%
7.1%
4.9%
9.3%
All taxes, Total: $1,531.4 billion
Non-business
collections, 55%,
$842.7b
Total business tax
revenue, 45%,
$688.7b
Sales taxes, Total: $336.4 billion
Non-business tax collections,
58%, $193.5b
Business sales tax revenue,
42%, $142.8b
Property taxes, Total: $468.3 billion
Non-business tax collections,
46%, $217.7b
Taxes on business property,
54%, $250.6b
Note: Figures do not sum due to rounding.Source: Ernst & Young LLP estimates based on from the U.S. Census Bureau, state and local government fi nances.
Taxes on business property Sales tax on business inputs Excise, utility and insurance taxes Corporate income tax Unemployment insurance tax Individual income tax on business
income Business license, severance and
other taxes

Total state and local business taxes | 5
Classifying business taxesThis report generally defi nes business taxes as those that are the legal liability of businesses. Certain taxes collected by business, such as excise taxes on tobacco and alcohol and sales taxes on household purchases, are not included. In addition, individual income tax on pass-through business income is included as a legal tax liability of business owners. The business taxes included in this analysis are:
• Property taxes paid by business on real and personal property; taxes on income-generating, residential rental property are treated as business taxes
• General sales taxes paid by businesses on purchases of goods and services used in production; sales taxes on fi nal goods paid by consumers are not included
• A portion of excise taxes, such as businesses’ share of motor fuel taxes
• Corporate income taxes
• Taxes on insurance premiums and utility gross receipts, which are in some cases levied in lieu of other business entity taxes
• Individual income taxes on pass-through business income; taxes withheld on employee earnings are not considered business taxes
• Unemployment insurance tax paid by employers
• Business licenses, including general business licenses, specifi c industry and occupational licenses, and commercial motor vehicle licenses
• Severance taxes on mining, natural gas, oil and other natural resources
In most states, the corporate income tax is the primary tax levied specifi cally on business entities, but other types of taxes are used in several states.
Ohio, Texas, and Washington levy a tax based on gross receipts instead of a traditional corporate income tax. In addition, New Hampshire’s Business Enterprise Tax is levied on a value-added base rather than income. This analysis includes gross receipts and value-added business entity taxes as corporate income tax revenue despite the different defi nition of the tax base. Many states also levy franchise taxes based on the capital stock or net worth of a business.
As shown in previous tables, businesses pay more in property and sales taxes than they do in specifi c corporate income, franchise, or gross receipt taxes.
6
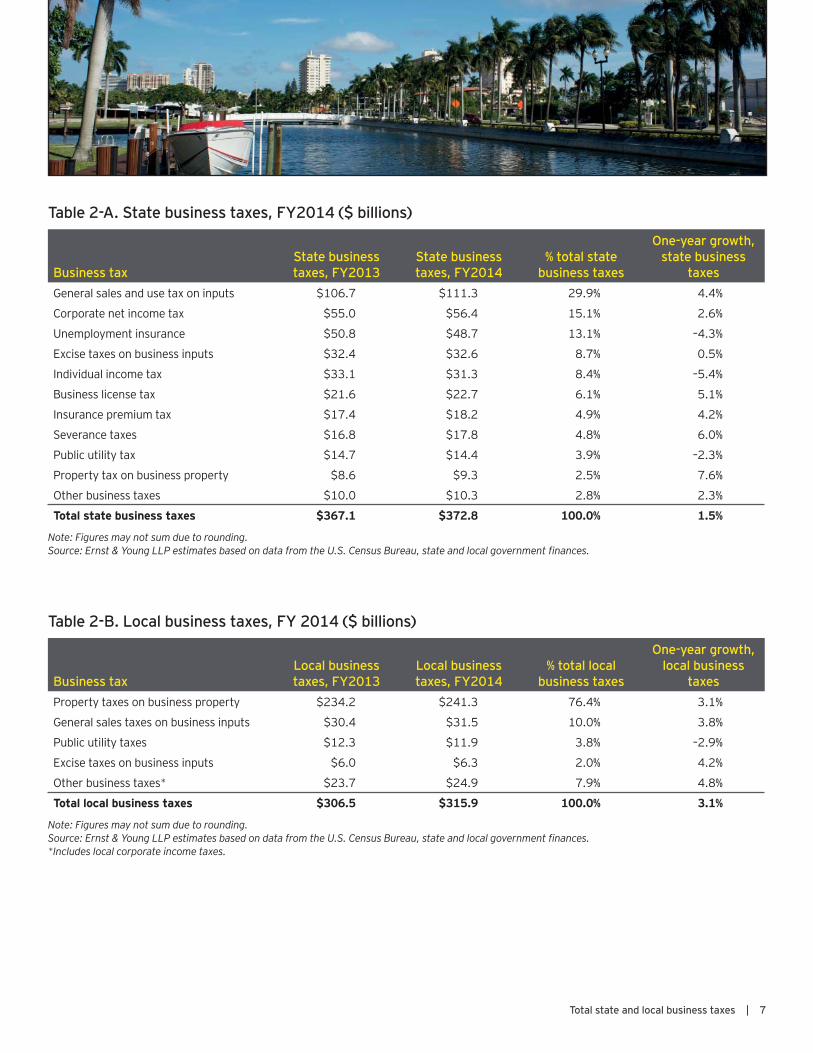
State versus local business taxes in FY2014State and local business tax revenues both grew between FY2013 and FY2014, with local tax revenues growing at a faster rate than state tax revenues. Tables 2-A and 2-B provide dollar amounts, percentage distributions and growth rates in FY2014 for total business taxes at the state and local levels of government.
Total state and local business tax revenues from FY2013 increased by $15.0 billion in FY2014, after growing by $21.1 billion in FY2013 compared to FY2012. State and local business tax revenues grew 1.5% and 3.1%, respectively. The largest local tax, business property taxes, which remained relatively fl at between FY2009 and FY2012, increased in revenue by $9.1 billion in FY2013 and $7.2 billion in FY2014. While local public utility tax revenue fell, the increase in property tax revenue alone more than offset that decline in revenue. Local excise and other business tax revenues rose 4.2% and 4.8%, respectively.
At the state level, there was little overall change in collections from FY 2013. Some state taxes declined, such as individual income taxes on pass-through business income, state unemployment insurance taxes and public utilities taxes. The increase in state business taxes was primarily due to increases in general sales and use, corporate income, and severance tax collections.
Tables 2-A and 2-B demonstrate that the composition of state business taxes differs signifi cantly from business taxes at the local level. Table 2-A shows the percentage distribution of state taxes by tax type; Table 2-B shows the distribution of local business taxes. While state business tax revenues draw on a relatively broad set of sources, local governments rely heavily on property tax revenue, which make up 76.4% of local business taxes.
The largest business tax at the state level, the sales and use tax, accounts for 29.9% of state business tax revenue. The degree to which states impose sales and use taxes on business purchases and the implications of proposals to increase this leading component of state business taxes are detailed in the 2013 Ernst & Young LLP/COST study, “What’s Wrong with Taxing Business Services? Adverse Effects from Existing and Proposed Sales Taxation of Business Investment and Services.”
Total state and local business taxes | 7
Table 2-A. State business taxes, FY2014 ($ billions)
Business taxState business taxes, FY2013
State business taxes, FY2014
% total state business taxes
One-year growth, state business
taxesGeneral sales and use tax on inputs $106.7 $111.3 29.9% 4.4%
Corporate net income tax $55.0 $56.4 15.1% 2.6%
Unemployment insurance $50.8 $48.7 13.1% –4.3%
Excise taxes on business inputs $32.4 $32.6 8.7% 0.5%
Individual income tax $33.1 $31.3 8.4% –5.4%
Business license tax $21.6 $22.7 6.1% 5.1%
Insurance premium tax $17.4 $18.2 4.9% 4.2%
Severance taxes $16.8 $17.8 4.8% 6.0%
Public utility tax $14.7 $14.4 3.9% –2.3%
Property tax on business property $8.6 $9.3 2.5% 7.6%
Other business taxes $10.0 $10.3 2.8% 2.3%
Total state business taxes $367.1 $372.8 100.0% 1.5%
Note: Figures may not sum due to rounding.Source: Ernst & Young LLP estimates based on data from the U.S. Census Bureau, state and local government fi nances.
Table 2-B. Local business taxes, FY 2014 ($ billions)
Business taxLocal business taxes, FY2013
Local business taxes, FY2014
% total local business taxes
One-year growth, local business
taxesProperty taxes on business property $234.2 $241.3 76.4% 3.1%
General sales taxes on business inputs $30.4 $31.5 10.0% 3.8%
Public utility taxes $12.3 $11.9 3.8% –2.9%
Excise taxes on business inputs $6.0 $6.3 2.0% 4.2%
Other business taxes* $23.7 $24.9 7.9% 4.8%
Total local business taxes $306.5 $315.9 100.0% 3.1%
Note: Figures may not sum due to rounding.Source: Ernst & Young LLP estimates based on data from the U.S. Census Bureau, state and local government fi nances.*Includes local corporate income taxes.

8
State-by-state business tax collectionsFigure 3 shows the state-by-state change in total state and local business taxes between FY2013 and FY2014. States with signifi cant tax changes in FY2014 and trends in business tax collections are described below.
• In 2014, business property taxes increased substantially for the second year in a row since 2009. The $7.8 billion in increased property tax revenue was driven largely by gains in fi ve large states: California, Florida, Georgia, New York and Texas. Nationally, property tax revenue increased 3.2%, but 37 states grew at a slower rate than the national average. Texas had the largest dollar increase in business property tax revenue for the second year in a row, collecting $1.8 billion more than in 2013. North Dakota had the highest growth rate for business property tax revenue, increasing 11.5%.
• Alaska saw the single largest decline in business tax revenue, driven by a 39% drop in severance tax revenue in FY2014. Unlike most states, severance taxes are by far the largest business tax in Alaska, accounting for 68% of Alaska’s state and local business tax revenue in FY2013 and 59% in FY2014, even with the decline in severance tax rates that occurred in 2013.
• On the other end of the spectrum, North Dakota had the largest increase in state and local business tax revenue due to more than $800 million in additional severance taxes in FY2014.
• Business tax revenue derived from individual income fell 4.8% in 2014, following an increase of 6.1% in 2013. Kansas enacted an exemption on the taxation of pass-through business income midway through FY2013, which is refl ected in this year’s tax receipts. Also in 2013, Ohio’s legislature approved a new tax deduction on some income received from pass-through entities. Taxes on business income fell 13% in Ohio between FY2013 and FY2014. An increase in the 2013 federal income tax rates also likely accelerated income in FY2013 that normally would have been in FY2014.
• Gains in state sales tax collections were concentrated in California and Texas, which each experienced sales tax increases of approximately $2 billion. Of the 45 states with a state sales tax, 39 experienced a sales tax collection increase. Arkansas, Maine, Ohio and Virginia raised state sales tax rates in FY2014. In contrast, Arizona let a temporary sales tax increase expire on July 1, 2013, and Kansas and the District of Columbia moderately lowered sales tax rates from 6.3% to 6.15% and 6% to 5.75%, respectively.
Table 3 presents business tax collections by tax type and state. The results show that states vary widely in the composition of their business tax structures, producing implications for revenue growth and stability in each state. Appendix Table A-3 presents the percentage composition by tax type for each of the 50 states and the District of Columbia.

Total state and local business taxes | 9
Figure 3. Change in state and local business taxes by state, FY2013–14(Percentage change in total state and local business taxes)
Source: Ernst & Young LLP estimates based on data from the U.S. Census Bureau, state and local government fi nances. -40% -30% -20% -10% 0% 10% 20% 30%
Alaska, -29.5%New Hampshire, -2.2%
Arizona, -1.4%Iowa, -0.8%
Pennsylvania, -0.6%Tennessee, -0.5%
Kansas, -0.3%Delaware, 0.0%Alabama, 0.0%Virginia, 0.0%
Illinois, 0.0%Idaho, 0.2%
Michigan, 0.3%Rhode Island, 0.4%
Nebraska, 0.5%West Virginia, 0.5%
Florida, 0.6%Nevada, 0.6%
Maryland, 1.0%Utah, 1.1%
Oklahoma, 1.1%Connecticut, 1.1%
Wyoming, 1.2%Montana, 1.4%
Indiana, 1.5%Missouri, 1.5%
Hawaii, 1.7%Kentucky, 1.8%
Wisconsin, 1.9%Dist. Columbia, 1.9%
Mississippi, 1.9%Colorado, 2.4%
North Carolina, 2.4%Maine, 2.4%
New York, 2.5%South Carolina, 2.5%
Oregon, 2.7%New Jersey, 2.8%
Minnesota, 3.1%Arkansas, 3.3%Vermont, 3.5%
California, 3.6%Washington, 3.7%
Ohio, 3.7%South Dakota, 3.7%
Georgia, 3.8%Massachusetts, 4.0%
Louisiana, 5.3%New Mexico, 5.8%
Texas, 6.5%North Dakota, 21.1%
District of Columbia, US state and local business tax growth: 2.2%

10
Jurisdiction Property tax Sales tax
Excise tax including public
utilities and insurance
Corporate income and individual
income tax on business income
Unemployment insurance tax
License and other taxes*
Total business taxes
Alabama $1.9 $1.5 $1.6 $0.8 $0.4 $0.8 $7.1Alaska 0.9 — 0.1 0.4 0.2 2.5 4.2Arizona 5.0 3.8 1.1 0.9 0.4 0.5 11.8Arkansas 1.1 1.5 0.5 0.7 0.4 0.4 4.5California 28.4 18.7 10.0 15.8 6.4 8.5 87.8Colorado 4.9 2.6 1.0 1.3 0.7 0.7 11.3Connecticut 2.4 1.6 1.2 1.4 0.9 0.3 7.7Delaware 0.3 — 0.2 0.4 0.1 1.3 2.4Florida 15.3 8.2 7.1 2.0 2.1 2.5 37.1Georgia 6.4 4.1 1.5 1.9 0.9 0.6 15.3Hawaii 1.0 1.2 0.8 0.3 0.4 0.2 3.8Idaho 0.9 0.5 0.2 0.4 0.3 0.2 2.4Illinois 13.9 3.9 5.1 5.7 2.9 1.7 33.1Indiana 4.5 2.3 1.4 1.5 0.8 0.2 10.6Iowa 2.9 1.7 0.3 0.9 0.6 0.4 6.8Kansas 2.5 1.6 0.6 0.3 0.4 0.4 5.9Kentucky 2.1 1.5 1.5 1.3 0.5 0.6 7.5Louisiana 2.7 2.8 1.0 0.9 0.3 1.4 8.9Maine 1.7 0.4 0.3 0.3 0.2 0.2 3.1Maryland 2.2 1.8 2.3 2.1 0.8 1.0 10.3Massachusetts 6.5 2.6 1.1 3.4 1.9 0.9 16.4Michigan 5.8 3.0 1.5 1.5 1.8 0.9 14.4Minnesota 4.0 2.6 2.0 2.1 1.4 0.9 13.0Mississippi 2.1 1.3 0.8 0.7 0.2 0.5 5.6Missouri 3.3 2.2 0.7 1.0 0.6 0.8 8.7Montana 0.9 — 0.2 0.3 0.2 0.5 2.0Nebraska 1.9 1.0 0.3 0.7 0.1 0.3 4.2Nevada 1.5 2.0 0.9 — 0.6 1.2 6.2New Hampshire 1.2 — 0.4 0.6 0.2 0.2 2.5New Jersey 11.0 3.9 2.2 3.5 3.0 1.2 24.9New Mexico 0.9 1.9 0.4 0.3 0.2 1.2 4.9New York 27.6 11.0 7.0 17.1 3.3 3.0 69.0North Carolina 4.0 3.3 2.0 2.6 1.3 1.2 14.4North Dakota 0.6 0.8 0.3 0.3 0.1 3.4 5.5Ohio 6.6 5.1 2.8 3.4 1.2 2.6 19.9Oklahoma 1.5 2.2 0.8 0.9 0.5 1.2 7.2Oregon 2.3 — 0.9 1.1 1.1 0.9 6.3Pennsylvania 8.7 4.1 3.6 4.2 3.1 2.5 26.1Rhode Island 1.2 0.4 0.3 0.2 0.3 0.1 2.5South Carolina 3.5 1.5 0.8 0.6 0.5 0.8 7.6South Dakota 0.6 0.8 0.2 0.0 0.0 0.2 1.8Tennessee 3.0 3.3 1.5 1.2 0.6 1.4 11.0Texas 29.2 18.1 7.9 4.7 2.6 12.9 70.7Utah 1.7 1.0 0.6 0.6 0.4 0.3 4.5Vermont 1.0 0.2 0.3 0.2 0.1 0.1 1.9Virginia 6.3 1.8 2.0 1.6 0.8 1.6 14.2Washington 4.5 8.2 2.6 3.3 1.4 1.3 18.0West Virginia 1.0 0.5 0.7 0.4 0.2 0.9 3.8Wisconsin 4.6 2.0 1.2 1.6 1.2 0.7 11.4Wyoming 0.9 0.6 0.1 — 0.1 1.0 2.7District of Columbia 1.8 0.5 0.3 0.7 0.2 0.1 3.6United States $250.6 $142.8 $84.0 $98.2 $48.7 $64.4 $688.7
Table 3. State and local business taxes by type, FY2014 ($ billions)
Note: “—” indicates zero collections; “0.0” indicates collections of less than $50 million.*Corporate income and individual income tax on business income include gross receipts taxes levied in Ohio, Texas, Washington, and the BET in New Hampshire. “Other taxes” include death and gift taxes, documentary and stock transfer taxes, severance taxes and local gross receipts taxes. Certain Ohio localities impose a net profi ts tax, which is included in the “Corporate income” column. The small amount of corporate profi ts taxes at the local level in Michigan is included in “other taxes.”Source: Ernst & Young LLP estimates based on data from the U.S. Census Bureau, state and local government fi nances.
Total state and local business taxes | 11
Comparing state business tax levelsA state’s business tax burden can be measured in many ways, including the level of business taxes compared to the level of economic activity that is subject to taxation, or by measuring the fi nal incidence of business taxes after they have been shifted to consumers or owners of factors of production, including workers.4 State and local business taxes are imposed on a variety of tax bases, including net income, input purchases, payroll, property and other tax bases. Therefore, a broad measure of a state’s overall economic activity should be used to determine the measure of aggregate business tax burden that can be compared across states.
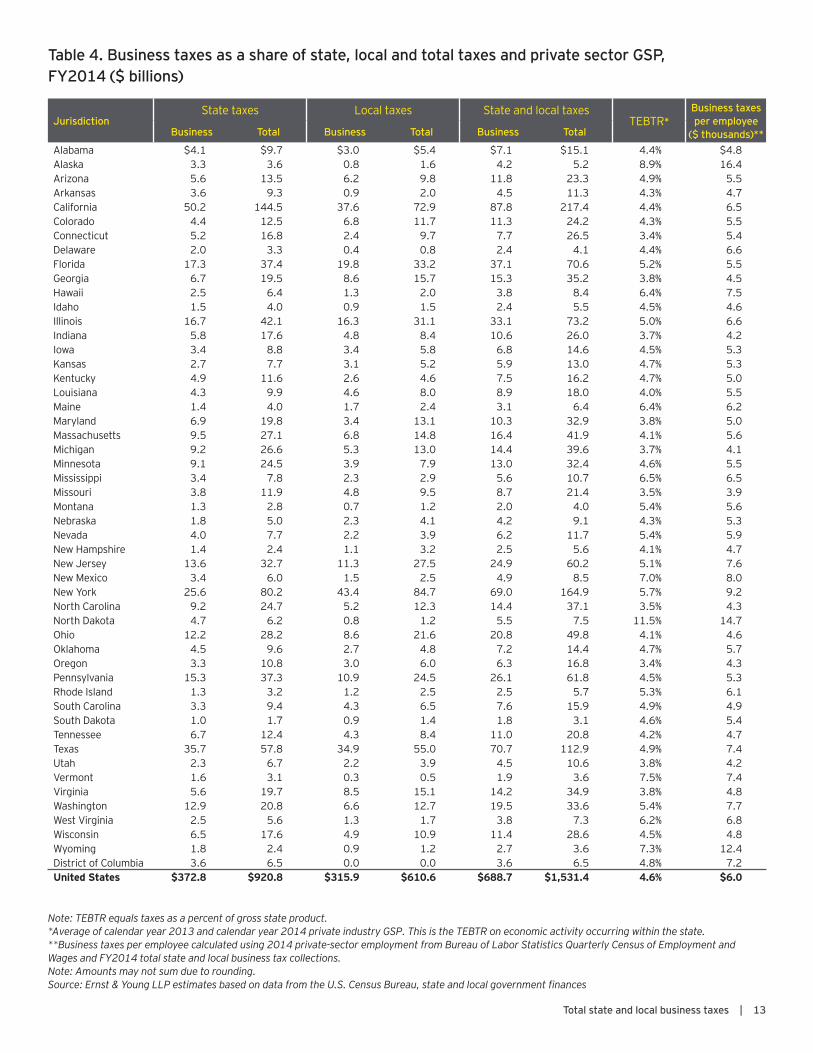
Table 4 presents state-by-state estimates of state and local business and total taxes, as well as the total effective business tax rate (TEBTR) imposed on business activity by state and local governments. The TEBTR is measured as the ratio of state and local business taxes to private-sector gross state product (GSP), the total value of a state’s annual production of goods and services by the private sector. The average TEBTR across all states is 4.6%; Connecticut and Oregon had the lowest TEBTR on GSP at 3.4%, while North Dakota had the highest at 11.5%.
TEBTRs provide a starting point for comparing burdens across states, but they do not provide suffi cient information to evaluate a state’s competitiveness. States with relatively low TEBTRs that derive most of their business taxes from origin-based taxes such as property taxes and sales taxes are not as competitive as states with higher TEBTRs that rely on taxes that have a larger impact on out-of-state businesses.
TEBTRs also do not indicate the economic incidence of a tax. When a tax can be passed on to consumers, the tax is not a burden in the same way as taxes where the economic incidence, not just the legal liability, falls on the owners of a business. This is particularly likely in some of the states with the highest TEBTRs, such as North Dakota and Alaska. These states rely on severance taxes (included in the “Other taxes” category in this analysis) that are imposed on businesses but are likely passed on to consumers, many of whom are located outside the state.5
Furthermore, two states with similar TEBTRs may vary in how they tax certain industries. For example, some states may levy relatively high taxes on capital-intensive manufacturers and relatively low taxes on labor-intensive service industries. When the state and local tax structure imposes disparate burdens by industry, economic decisions may be distorted due to disincentives facing highly taxed industries. It is also important to note that the TEBTR is a measure of the average tax burden on existing businesses in a state rather than a measure of the marginal tax that would be borne by a company investing in a new facility. For this reason, the TEBTR provides one metric that can be used to evaluate a state’s business tax structure, but it is not a clear indicator of the competitiveness of a state’s business tax system in terms of attracting new investment.
12
The average TEBTR was 4.6%, ranging from 11.5% in North Dakota to 3.4% in Connecticut and Oregon. The average TEBTR on gross operating surplus was 10.6% in 2014, ranging from 26.1% in North Dakota to 7% in Oregon.
Several of the states with high TEBTRs derive a signifi cant share of their tax revenue from natural resources. Natural resource severance tax revenues account for more than 12% of total revenues in North Dakota, Alaska, New Mexico and Wyoming. The high tax burden on the extractive industries in these states largely accounts for their high level of business taxes per dollar of GSP.
On the other end of the spectrum, North Carolina, Oregon, Connecticut and Maryland have low ratios of tax collections to GSP.
• Connecticut is home to several high-output industries, including insurance, fi nancial services and aerospace. Connecticut’s economy generates a large amount of GSP per worker, meaning that while Connecticut imposes higher-than-average taxes on a per-worker basis, its business taxes are signifi cantly below the national average when measured per dollar of GSP. These results should not be interpreted to mean that Connecticut is a low-tax environment overall.
• North Carolina’s effective tax rate on GSP is among the lowest due partially to the signifi cant share of revenue that North Carolina derives from the individual income tax. As a share of total state and local tax revenue, North Carolina derives 27% of its revenue from individual income taxes, the fourth-highest share in the nation.
• Oregon also ranks among the lowest states in terms of TEBTR on GSP due to its lack of a sales tax, which accounts for more than 21% of state and local business taxes nationwide. If sales tax revenue is excluded from the TEBTR on GSP calculation for all states, Oregon’s TEBTR stays at 3.4% but moves from the lowest TEBTR to the 20th-lowest rate. Oregon also generates higher-than-average GDP per worker, which reduces the TEBTR by increasing the denominator relative to other states.
• Maryland’s TEBTR is among the lower rates, at 3.8%, due to its heavy reliance on the individual income tax because of signifi cant non-taxable Federal Government and nonprofi t activity in the state as well as the signifi cant number of Maryland residents that work in the District of Columbia or Virginia. Individual income tax on business income consists of 11% of Maryland’s total state and local business tax collections, while the overall US average (excluding Maryland) is 4.8%, which results in a lower business share and lower TEBTR.
Table 4 also presents the level of business taxes per private-sector employee. In states with above-average GSP, such as Connecticut and Oregon, the denominator of the effective tax rate calculation is larger than average, causing the overall effective tax rate on GSP to be below average. Business taxes per private-sector employee presents an additional way to measure business tax levels.
Total state and local business taxes | 13
JurisdictionState taxes Local taxes State and local taxes
TEBTR*Business taxes per employee
($ thousands)**Business Total Business Total Business Total
Alabama $4.1 $9.7 $3.0 $5.4 $7.1 $15.1 4.4% $4.8Alaska 3.3 3.6 0.8 1.6 4.2 5.2 8.9% 16.4Arizona 5.6 13.5 6.2 9.8 11.8 23.3 4.9% 5.5Arkansas 3.6 9.3 0.9 2.0 4.5 11.3 4.3% 4.7California 50.2 144.5 37.6 72.9 87.8 217.4 4.4% 6.5Colorado 4.4 12.5 6.8 11.7 11.3 24.2 4.3% 5.5Connecticut 5.2 16.8 2.4 9.7 7.7 26.5 3.4% 5.4Delaware 2.0 3.3 0.4 0.8 2.4 4.1 4.4% 6.6Florida 17.3 37.4 19.8 33.2 37.1 70.6 5.2% 5.5Georgia 6.7 19.5 8.6 15.7 15.3 35.2 3.8% 4.5Hawaii 2.5 6.4 1.3 2.0 3.8 8.4 6.4% 7.5Idaho 1.5 4.0 0.9 1.5 2.4 5.5 4.5% 4.6Illinois 16.7 42.1 16.3 31.1 33.1 73.2 5.0% 6.6Indiana 5.8 17.6 4.8 8.4 10.6 26.0 3.7% 4.2Iowa 3.4 8.8 3.4 5.8 6.8 14.6 4.5% 5.3Kansas 2.7 7.7 3.1 5.2 5.9 13.0 4.7% 5.3Kentucky 4.9 11.6 2.6 4.6 7.5 16.2 4.7% 5.0Louisiana 4.3 9.9 4.6 8.0 8.9 18.0 4.0% 5.5Maine 1.4 4.0 1.7 2.4 3.1 6.4 6.4% 6.2Maryland 6.9 19.8 3.4 13.1 10.3 32.9 3.8% 5.0Massachusetts 9.5 27.1 6.8 14.8 16.4 41.9 4.1% 5.6Michigan 9.2 26.6 5.3 13.0 14.4 39.6 3.7% 4.1Minnesota 9.1 24.5 3.9 7.9 13.0 32.4 4.6% 5.5Mississippi 3.4 7.8 2.3 2.9 5.6 10.7 6.5% 6.5Missouri 3.8 11.9 4.8 9.5 8.7 21.4 3.5% 3.9Montana 1.3 2.8 0.7 1.2 2.0 4.0 5.4% 5.6Nebraska 1.8 5.0 2.3 4.1 4.2 9.1 4.3% 5.3Nevada 4.0 7.7 2.2 3.9 6.2 11.7 5.4% 5.9New Hampshire 1.4 2.4 1.1 3.2 2.5 5.6 4.1% 4.7New Jersey 13.6 32.7 11.3 27.5 24.9 60.2 5.1% 7.6New Mexico 3.4 6.0 1.5 2.5 4.9 8.5 7.0% 8.0New York 25.6 80.2 43.4 84.7 69.0 164.9 5.7% 9.2North Carolina 9.2 24.7 5.2 12.3 14.4 37.1 3.5% 4.3North Dakota 4.7 6.2 0.8 1.2 5.5 7.5 11.5% 14.7Ohio 12.2 28.2 8.6 21.6 20.8 49.8 4.1% 4.6Oklahoma 4.5 9.6 2.7 4.8 7.2 14.4 4.7% 5.7Oregon 3.3 10.8 3.0 6.0 6.3 16.8 3.4% 4.3Pennsylvania 15.3 37.3 10.9 24.5 26.1 61.8 4.5% 5.3Rhode Island 1.3 3.2 1.2 2.5 2.5 5.7 5.3% 6.1South Carolina 3.3 9.4 4.3 6.5 7.6 15.9 4.9% 4.9South Dakota 1.0 1.7 0.9 1.4 1.8 3.1 4.6% 5.4Tennessee 6.7 12.4 4.3 8.4 11.0 20.8 4.2% 4.7Texas 35.7 57.8 34.9 55.0 70.7 112.9 4.9% 7.4Utah 2.3 6.7 2.2 3.9 4.5 10.6 3.8% 4.2Vermont 1.6 3.1 0.3 0.5 1.9 3.6 7.5% 7.4Virginia 5.6 19.7 8.5 15.1 14.2 34.9 3.8% 4.8Washington 12.9 20.8 6.6 12.7 19.5 33.6 5.4% 7.7West Virginia 2.5 5.6 1.3 1.7 3.8 7.3 6.2% 6.8Wisconsin 6.5 17.6 4.9 10.9 11.4 28.6 4.5% 4.8Wyoming 1.8 2.4 0.9 1.2 2.7 3.6 7.3% 12.4District of Columbia 3.6 6.5 0.0 0.0 3.6 6.5 4.8% 7.2United States $372.8 $920.8 $315.9 $610.6 $688.7 $1,531.4 4.6% $6.0
Table 4. Business taxes as a share of state, local and total taxes and private sector GSP, FY2014 ($ billions)
Note: TEBTR equals taxes as a percent of gross state product.*Average of calendar year 2013 and calendar year 2014 private industry GSP. This is the TEBTR on economic activity occurring within the state.**Business taxes per employee calculated using 2014 private-sector employment from Bureau of Labor Statistics Quarterly Census of Employment and Wages and FY2014 total state and local business tax collections.Note: Amounts may not sum due to rounding.Source: Ernst & Young LLP estimates based on data from the U.S. Census Bureau, state and local government fi nances
14
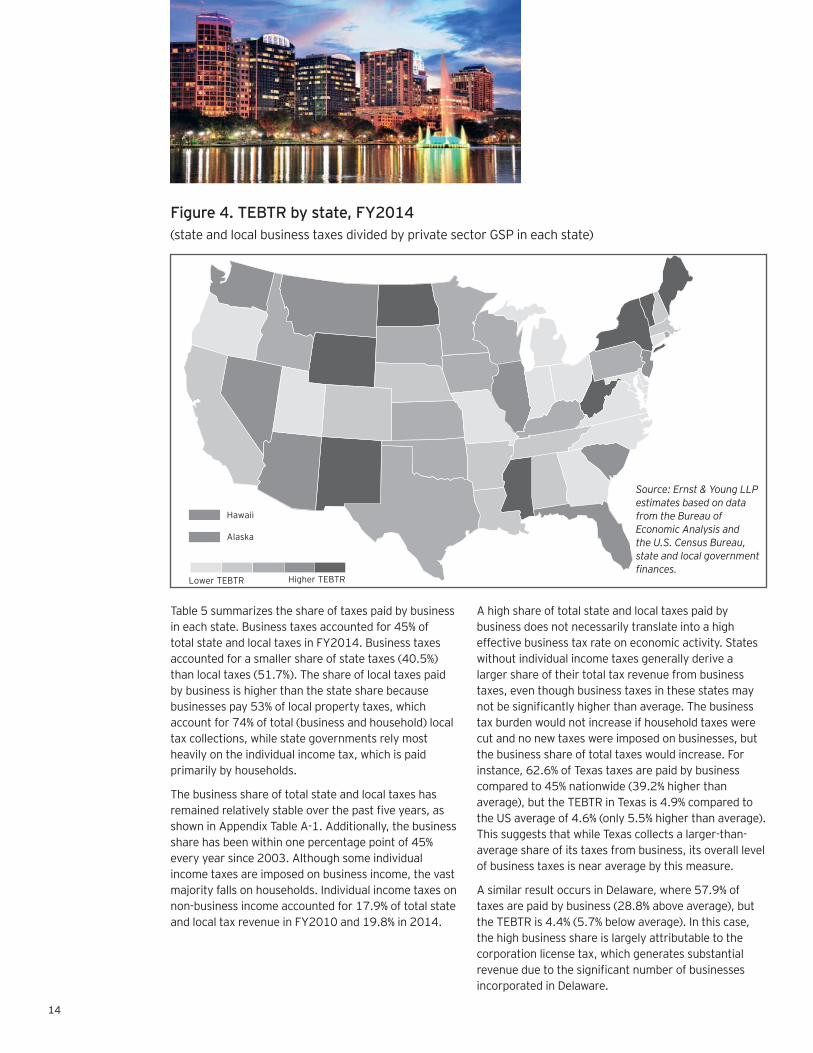
Lower TEBTR Higher TEBTR
Hawaii Alaska
Figure 4. TEBTR by state, FY2014(state and local business taxes divided by private sector GSP in each state)
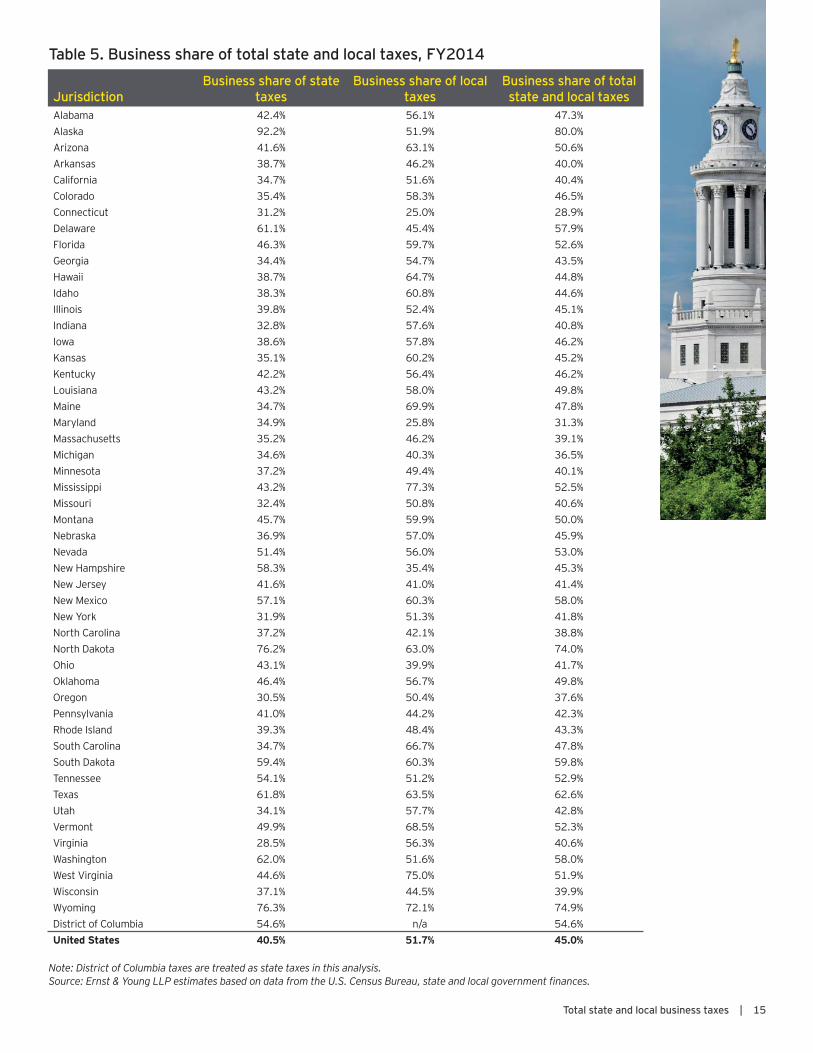
Table 5 summarizes the share of taxes paid by business in each state. Business taxes accounted for 45% of total state and local taxes in FY2014. Business taxes accounted for a smaller share of state taxes (40.5%) than local taxes (51.7%). The share of local taxes paid by business is higher than the state share because businesses pay 53% of local property taxes, which account for 74% of total (business and household) local tax collections, while state governments rely most heavily on the individual income tax, which is paid primarily by households.
The business share of total state and local taxes has remained relatively stable over the past fi ve years, as shown in Appendix Table A-1. Additionally, the business share has been within one percentage point of 45% every year since 2003. Although some individual income taxes are imposed on business income, the vast majority falls on households. Individual income taxes on non-business income accounted for 17.9% of total state and local tax revenue in FY2010 and 19.8% in 2014.
A high share of total state and local taxes paid by business does not necessarily translate into a high effective business tax rate on economic activity. States without individual income taxes generally derive a larger share of their total tax revenue from business taxes, even though business taxes in these states may not be signifi cantly higher than average. The business tax burden would not increase if household taxes were cut and no new taxes were imposed on businesses, but the business share of total taxes would increase. For instance, 62.6% of Texas taxes are paid by business compared to 45% nationwide (39.2% higher than average), but the TEBTR in Texas is 4.9% compared to the US average of 4.6% (only 5.5% higher than average). This suggests that while Texas collects a larger-than-average share of its taxes from business, its overall level of business taxes is near average by this measure.
A similar result occurs in Delaware, where 57.9% of taxes are paid by business (28.8% above average), but the TEBTR is 4.4% (5.7% below average). In this case, the high business share is largely attributable to the corporation license tax, which generates substantial revenue due to the signifi cant number of businesses incorporated in Delaware.
Source: Ernst & Young LLP estimates based on data from the Bureau of Economic Analysis and the U.S. Census Bureau, state and local government fi nances.
Total state and local business taxes | 15
Table 5. Business share of total state and local taxes, FY2014
Note: District of Columbia taxes are treated as state taxes in this analysis.Source: Ernst & Young LLP estimates based on data from the U.S. Census Bureau, state and local government fi nances.
JurisdictionBusiness share of state
taxesBusiness share of local
taxesBusiness share of total state and local taxes
Alabama 42.4% 56.1% 47.3%Alaska 92.2% 51.9% 80.0%Arizona 41.6% 63.1% 50.6%Arkansas 38.7% 46.2% 40.0%California 34.7% 51.6% 40.4%Colorado 35.4% 58.3% 46.5%Connecticut 31.2% 25.0% 28.9%Delaware 61.1% 45.4% 57.9%Florida 46.3% 59.7% 52.6%Georgia 34.4% 54.7% 43.5%Hawaii 38.7% 64.7% 44.8%Idaho 38.3% 60.8% 44.6%Illinois 39.8% 52.4% 45.1%Indiana 32.8% 57.6% 40.8%Iowa 38.6% 57.8% 46.2%Kansas 35.1% 60.2% 45.2%Kentucky 42.2% 56.4% 46.2%Louisiana 43.2% 58.0% 49.8%Maine 34.7% 69.9% 47.8%Maryland 34.9% 25.8% 31.3%Massachusetts 35.2% 46.2% 39.1%Michigan 34.6% 40.3% 36.5%Minnesota 37.2% 49.4% 40.1%Mississippi 43.2% 77.3% 52.5%Missouri 32.4% 50.8% 40.6%Montana 45.7% 59.9% 50.0%Nebraska 36.9% 57.0% 45.9%Nevada 51.4% 56.0% 53.0%New Hampshire 58.3% 35.4% 45.3%New Jersey 41.6% 41.0% 41.4%New Mexico 57.1% 60.3% 58.0%New York 31.9% 51.3% 41.8%North Carolina 37.2% 42.1% 38.8%North Dakota 76.2% 63.0% 74.0%Ohio 43.1% 39.9% 41.7%Oklahoma 46.4% 56.7% 49.8%Oregon 30.5% 50.4% 37.6%Pennsylvania 41.0% 44.2% 42.3%Rhode Island 39.3% 48.4% 43.3%South Carolina 34.7% 66.7% 47.8%South Dakota 59.4% 60.3% 59.8%Tennessee 54.1% 51.2% 52.9%Texas 61.8% 63.5% 62.6%Utah 34.1% 57.7% 42.8%Vermont 49.9% 68.5% 52.3%Virginia 28.5% 56.3% 40.6%Washington 62.0% 51.6% 58.0%West Virginia 44.6% 75.0% 51.9%Wisconsin 37.1% 44.5% 39.9%Wyoming 76.3% 72.1% 74.9%District of Columbia 54.6% n/a 54.6%United States 40.5% 51.7% 45.0%
16
Governmental benefi ts received by businesses versus taxes paidIn addition to the TEBTR, the business tax burden can be evaluated by comparing business taxes paid to benefi ts received by businesses due to government spending. Because government spending can reduce businesses’ non-tax costs, if two businesses pay the same amount of taxes but one receives larger benefi ts from government spending, the true tax burden is not the same for both businesses. Calculating the business tax-to-benefi t ratio estimates the extent to which businesses are “getting what they paid for” from their tax dollars.
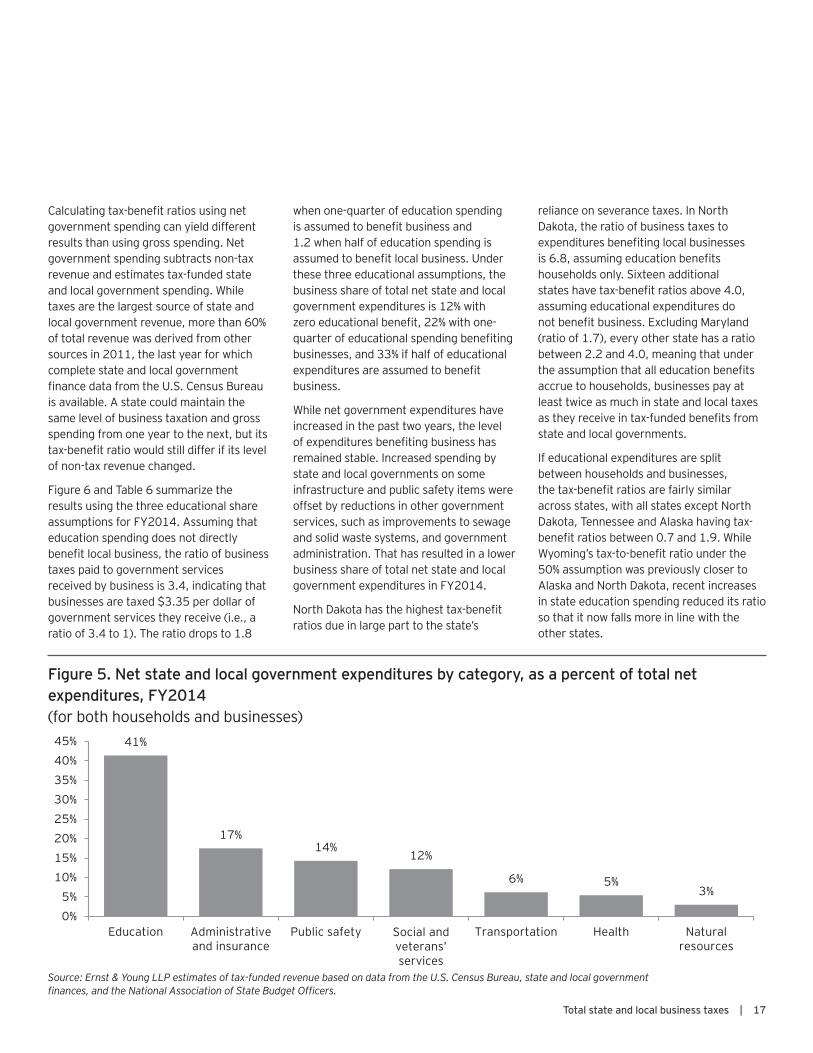
Figure 5 shows FY2014 total estimated state and local government spending by category (net of user charges and other non-tax revenue) for both households and businesses. Using a methodology developed by economists at the Federal Reserve Bank of Chicago, expenditures in the major categories shown in Figure 5 were allocated between households and businesses to refl ect the extent to which each group benefi ts from each type of expenditure.6 Certain expenditures, such as health and human services, were assigned entirely to households while other categories, such as public safety and highway infrastructure costs (transportation category), were split evenly between businesses and households. The tax-benefi t ratio was calculated by dividing business taxes in each state by estimated government expenditures benefi ting business.
Since education spending is by far the largest category of net state and local expenditures, estimates of the tax-benefi t ratio for businesses are sensitive to the allocation of education expenditures between businesses and households. While economic theory suggests that individuals are the primary benefi ciaries of education
due to higher wages, business owners can benefi t if an educated workforce generates higher returns to capital. Returns to capital would increase if workers do not completely capture productivity gains through higher wages or an educated workforce improves the productivity of capital (e.g., an educated or trained worker may know how to use machines in production more effi ciently, resulting in fewer breakdowns or work stoppages). A review of the literature fi nds that a 1% increase in the share of workers with a college education in a city increases output by 0.5 to 0.6 percentage points.7 If businesses are able to capture some or all of the additional productivity from increased education, they are deriving benefi ts from this type of government spending.
Education can increase profi ts through indirect channels as well. For example, increasing education may reduce property crime, lowering business costs and increasing the return to capital. One estimate of the social returns of an educated workforce is that social benefi ts, in the form of lower government spending for police services and incarceration costs, are equal to 14% to 26% of the private return of education (higher wages) that accrues to individuals.8
Since the benefi t of education to households and businesses is unknown, and the tax-benefi t ratio is sensitive to this assumption, this analysis presents a range of estimates for the share of educational expenditures that benefi t local business. The ratio is estimated assuming 0%, 25% and 50% of education spending benefi ts businesses.9
Total state and local business taxes | 17
Calculating tax-benefi t ratios using net government spending can yield different results than using gross spending. Net government spending subtracts non-tax revenue and estimates tax-funded state and local government spending. While taxes are the largest source of state and local government revenue, more than 60% of total revenue was derived from other sources in 2011, the last year for which complete state and local government fi nance data from the U.S. Census Bureau is available. A state could maintain the same level of business taxation and gross spending from one year to the next, but its tax-benefi t ratio would still differ if its level of non-tax revenue changed.
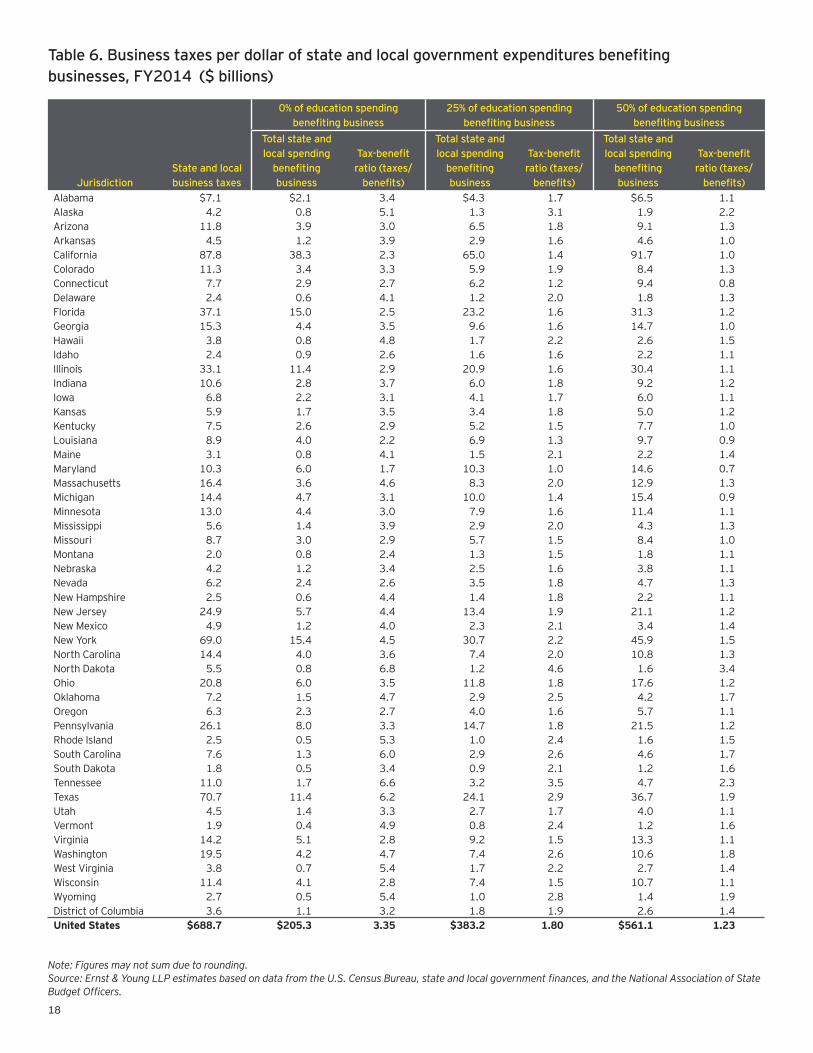
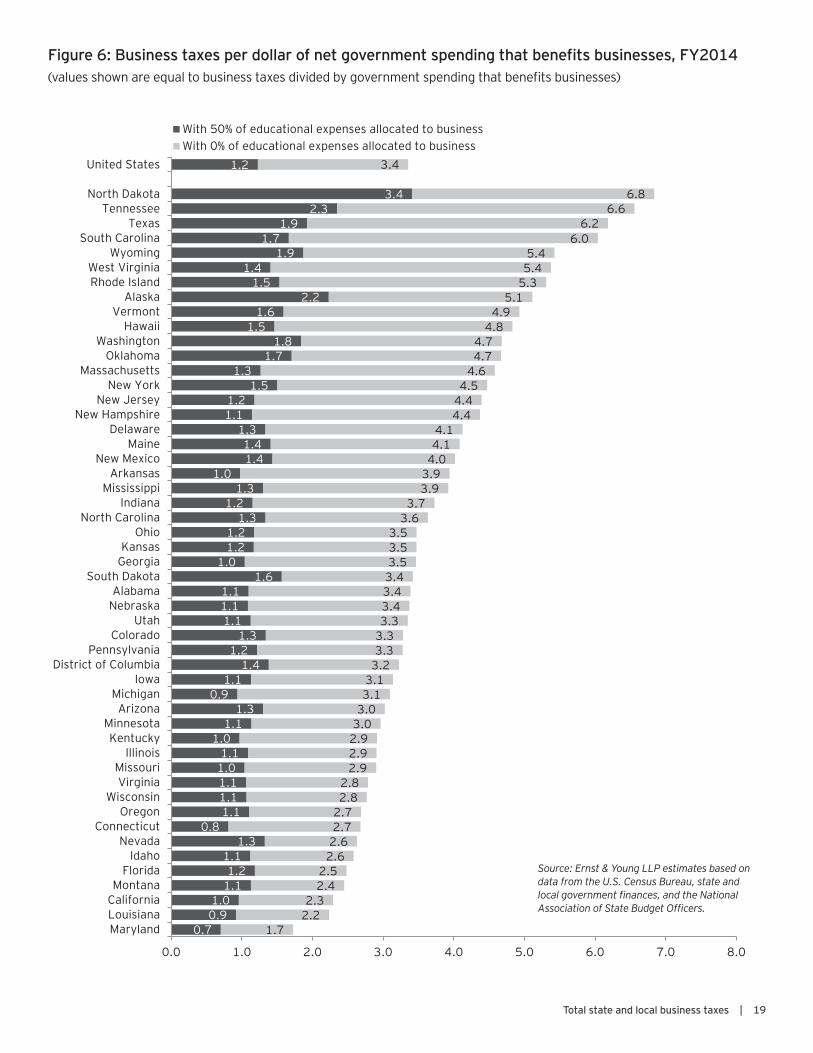
Figure 6 and Table 6 summarize the results using the three educational share assumptions for FY2014. Assuming that education spending does not directly benefi t local business, the ratio of business taxes paid to government services received by business is 3.4, indicating that businesses are taxed $3.35 per dollar of government services they receive (i.e., a ratio of 3.4 to 1). The ratio drops to 1.8
when one-quarter of education spending is assumed to benefi t business and 1.2 when half of education spending is assumed to benefi t local business. Under these three educational assumptions, the business share of total net state and local government expenditures is 12% with zero educational benefi t, 22% with one-quarter of educational spending benefi ting businesses, and 33% if half of educational expenditures are assumed to benefi t business.
While net government expenditures have increased in the past two years, the level of expenditures benefi ting business has remained stable. Increased spending by state and local governments on some infrastructure and public safety items were offset by reductions in other government services, such as improvements to sewage and solid waste systems, and government administration. That has resulted in a lower business share of total net state and local government expenditures in FY2014.
North Dakota has the highest tax-benefi t ratios due in large part to the state’s
reliance on severance taxes. In North Dakota, the ratio of business taxes to expenditures benefi ting local businesses is 6.8, assuming education benefi ts households only. Sixteen additional states have tax-benefi t ratios above 4.0, assuming educational expenditures do not benefi t business. Excluding Maryland (ratio of 1.7), every other state has a ratio between 2.2 and 4.0, meaning that under the assumption that all education benefi ts accrue to households, businesses pay at least twice as much in state and local taxes as they receive in tax-funded benefi ts from state and local governments.
If educational expenditures are split between households and businesses, the tax-benefi t ratios are fairly similar across states, with all states except North Dakota, Tennessee and Alaska having tax-benefi t ratios between 0.7 and 1.9. While Wyoming’s tax-to-benefi t ratio under the 50% assumption was previously closer to Alaska and North Dakota, recent increases in state education spending reduced its ratio so that it now falls more in line with the other states.
Figure 5. Net state and local government expenditures by category, as a percent of total net expenditures, FY2014 (for both households and businesses)
Source: Ernst & Young LLP estimates of tax-funded revenue based on data from the U.S. Census Bureau, state and local government fi nances, and the National Association of State Budget Offi cers.
41%
17% 14%
12%
6% 5% 3%
0%5%
10%15%20%25%30%35%40%45%
Education Administrativeand insurance
Public safety Social andveterans'services
Transportation Health Naturalresources
Social and veterans’ services
18
Table 6. Business taxes per dollar of state and local government expenditures benefi ting businesses, FY2014 ($ billions)
Note: Figures may not sum due to rounding.Source: Ernst & Young LLP estimates based on data from the U.S. Census Bureau, state and local government fi nances, and the National Association of State Budget Offi cers.
0% of education spending benefi ting business
25% of education spending benefi ting business
50% of education spending benefi ting business
JurisdictionState and local business taxes
Total state and local spending
benefi ting business
Tax-benefi t ratio (taxes/
benefi ts)
Total state and local spending
benefi ting business
Tax-benefi t ratio (taxes/
benefi ts)
Total state and local spending
benefi ting business
Tax-benefi t ratio (taxes/
benefi ts)Alabama $7.1 $2.1 3.4 $4.3 1.7 $6.5 1.1Alaska 4.2 0.8 5.1 1.3 3.1 1.9 2.2Arizona 11.8 3.9 3.0 6.5 1.8 9.1 1.3Arkansas 4.5 1.2 3.9 2.9 1.6 4.6 1.0California 87.8 38.3 2.3 65.0 1.4 91.7 1.0Colorado 11.3 3.4 3.3 5.9 1.9 8.4 1.3Connecticut 7.7 2.9 2.7 6.2 1.2 9.4 0.8Delaware 2.4 0.6 4.1 1.2 2.0 1.8 1.3Florida 37.1 15.0 2.5 23.2 1.6 31.3 1.2Georgia 15.3 4.4 3.5 9.6 1.6 14.7 1.0Hawaii 3.8 0.8 4.8 1.7 2.2 2.6 1.5Idaho 2.4 0.9 2.6 1.6 1.6 2.2 1.1Illinois 33.1 11.4 2.9 20.9 1.6 30.4 1.1Indiana 10.6 2.8 3.7 6.0 1.8 9.2 1.2Iowa 6.8 2.2 3.1 4.1 1.7 6.0 1.1Kansas 5.9 1.7 3.5 3.4 1.8 5.0 1.2Kentucky 7.5 2.6 2.9 5.2 1.5 7.7 1.0Louisiana 8.9 4.0 2.2 6.9 1.3 9.7 0.9Maine 3.1 0.8 4.1 1.5 2.1 2.2 1.4Maryland 10.3 6.0 1.7 10.3 1.0 14.6 0.7Massachusetts 16.4 3.6 4.6 8.3 2.0 12.9 1.3Michigan 14.4 4.7 3.1 10.0 1.4 15.4 0.9Minnesota 13.0 4.4 3.0 7.9 1.6 11.4 1.1Mississippi 5.6 1.4 3.9 2.9 2.0 4.3 1.3Missouri 8.7 3.0 2.9 5.7 1.5 8.4 1.0Montana 2.0 0.8 2.4 1.3 1.5 1.8 1.1Nebraska 4.2 1.2 3.4 2.5 1.6 3.8 1.1Nevada 6.2 2.4 2.6 3.5 1.8 4.7 1.3New Hampshire 2.5 0.6 4.4 1.4 1.8 2.2 1.1New Jersey 24.9 5.7 4.4 13.4 1.9 21.1 1.2New Mexico 4.9 1.2 4.0 2.3 2.1 3.4 1.4New York 69.0 15.4 4.5 30.7 2.2 45.9 1.5North Carolina 14.4 4.0 3.6 7.4 2.0 10.8 1.3North Dakota 5.5 0.8 6.8 1.2 4.6 1.6 3.4Ohio 20.8 6.0 3.5 11.8 1.8 17.6 1.2Oklahoma 7.2 1.5 4.7 2.9 2.5 4.2 1.7Oregon 6.3 2.3 2.7 4.0 1.6 5.7 1.1Pennsylvania 26.1 8.0 3.3 14.7 1.8 21.5 1.2Rhode Island 2.5 0.5 5.3 1.0 2.4 1.6 1.5South Carolina 7.6 1.3 6.0 2.9 2.6 4.6 1.7South Dakota 1.8 0.5 3.4 0.9 2.1 1.2 1.6Tennessee 11.0 1.7 6.6 3.2 3.5 4.7 2.3Texas 70.7 11.4 6.2 24.1 2.9 36.7 1.9Utah 4.5 1.4 3.3 2.7 1.7 4.0 1.1Vermont 1.9 0.4 4.9 0.8 2.4 1.2 1.6Virginia 14.2 5.1 2.8 9.2 1.5 13.3 1.1Washington 19.5 4.2 4.7 7.4 2.6 10.6 1.8West Virginia 3.8 0.7 5.4 1.7 2.2 2.7 1.4Wisconsin 11.4 4.1 2.8 7.4 1.5 10.7 1.1Wyoming 2.7 0.5 5.4 1.0 2.8 1.4 1.9District of Columbia 3.6 1.1 3.2 1.8 1.9 2.6 1.4United States $688.7 $205.3 3.35 $383.2 1.80 $561.1 1.23
Total state and local business taxes | 19
0.7 0.9 1.0
1.1 1.2
1.1 1.3
0.8 1.1 1.1 1.1 1.0 1.1
1.0 1.1
1.3 0.9
1.1 1.4
1.2 1.3
1.1 1.1 1.1
1.6 1.0
1.2 1.2
1.3 1.2
1.3 1.0
1.4 1.4
1.3 1.1 1.2
1.5 1.3
1.7 1.8
1.5 1.6
2.2 1.5
1.4 1.9
1.7 1.9
2.3 3.4
1.2
1.7 2.2 2.3
2.4 2.5
2.6 2.6 2.7 2.7 2.8 2.8
2.9 2.9 2.9 3.0 3.0 3.1 3.1 3.2 3.3 3.3 3.3 3.4 3.4 3.4 3.5 3.5 3.5
3.6 3.7
3.9 3.9 4.0 4.1 4.1
4.4 4.4 4.5
4.6 4.7 4.7
4.8 4.9
5.1 5.3 5.4 5.4
6.0 6.2
6.6 6.8
3.4
0.0 1.0 2.0 3.0 4.0 5.0 6.0 7.0 8.0
MarylandLouisianaCaliforniaMontana
FloridaIdaho
NevadaConnecticut
OregonWisconsin
VirginiaMissouri
IllinoisKentucky
MinnesotaArizona
MichiganIowa
District of ColumbiaPennsylvania
ColoradoUtah
NebraskaAlabama
South DakotaGeorgiaKansas
OhioNorth Carolina
IndianaMississippi
ArkansasNew Mexico
MaineDelaware
New HampshireNew Jersey
New YorkMassachusetts
OklahomaWashington
HawaiiVermont
AlaskaRhode IslandWest Virginia
WyomingSouth Carolina
TexasTennessee
North Dakota
United States
With 50% of educational expenses allocated to businessWith 0% of educational expenses allocated to business
Figure 6: Business taxes per dollar of net government spending that benefi ts businesses, FY2014(values shown are equal to business taxes divided by government spending that benefi ts businesses)
Source: Ernst & Young LLP estimates based on data from the U.S. Census Bureau, state and local government fi nances, and the National Association of State Budget Offi cers.

20
ConclusionBusinesses paid more than $688 billion in state and local taxes in FY2014, representing a 2.2% revenue increase from the previous year. Growth in tax revenue from business was concentrated in property taxes, sales taxes and corporate income taxes. Several states enacted reforms to exempt pass-through business income from the individual income tax, reversing a trend of growth in this category and leading to the largest tax category decline in FY2014.
Business taxes as a share of economic activity (measured by private sector gross state product) declined slightly in FY2014, as state and local business tax growth was half the growth in private sector GSP between 2013 and 2014. The share of tax revenue derived from business stayed constant at 45%, continuing the trend of modestly declining business share since 2007. On average, businesses paid 10.6% of gross operating surplus in state and local taxes nationwide. Governmental spending that benefi ts business remained fl at between 2013 and 2014, while overall net state and local expenditures grew, meaning that businesses received a smaller share of the benefi t of government spending in 2014.

Total state and local business taxes | 21
Appendix

22
Table A-1. Total state and local business taxes, 2010–14 ($ billions)
State and local taxes 2010 2011 2012 2013 2014
Total business taxes $595.4 $628.6 $652.6 $673.7 $688.7
Individual income taxes on non-business income 234.1 255.6 273.6 298.3 302.9
Other taxes 481.8 500.5 508.0 523.5 539.8
Total state and local taxes $1,311.3 $1,384.8 $1,434.1 $1,495.5 $1,531.4
Composition of state and local taxes 2010 2011 2012 2013 2014
Total business taxes 45.4% 45.4% 45.5% 45.0% 45.0%
Individual income taxes on non-business income 17.9% 18.5% 19.1% 19.9% 19.8%
Other taxes 36.7% 36.1% 35.4% 35.0% 35.2%
Total state and local taxes 100% 100% 100% 100% 100%
Note: Figures may not sum due to rounding.Source: Ernst & Young LLP estimates based on data from the U.S. Census Bureau, state and local government fi nances.
Table A-2. Composition of state and local business taxes, 2010–14 ($ billions)
Business tax 2010 2011 2012 2013 2014
Property tax on business property $231.3 $233.5 $236.1 $242.8 $250.6
General sales and use tax on inputs 125.4 130.7 133.5 137.0 142.8
Corporate net income 52.1 57.0 58.4 62.5 64.4
Unemployment compensation 32.4 41.2 48.4 50.8 48.7
Business license tax 29.5 30.2 31.1 32.1 33.6
Excise taxes 30.1 35.0 35.3 38.5 38.9
Public utility tax 28.5 28.8 28.8 27.0 26.3
Individual income tax 27.1 29.5 33.4 35.5 33.7
Severance taxes 11.5 13.9 17.7 16.9 17.9
Insurance premium tax 16.5 17.1 17.4 18.2 18.9
Other business taxes 11.0 11.7 12.4 12.6 12.9
Total business taxes $595.4 $628.6 $652.6 $673.7 $688.7
Note: Figures may not sum due to rounding.Source: Ernst & Young LLP estimates based on data from the U.S. Census Bureau, state and local government fi nances.
Total state and local business taxes | 23
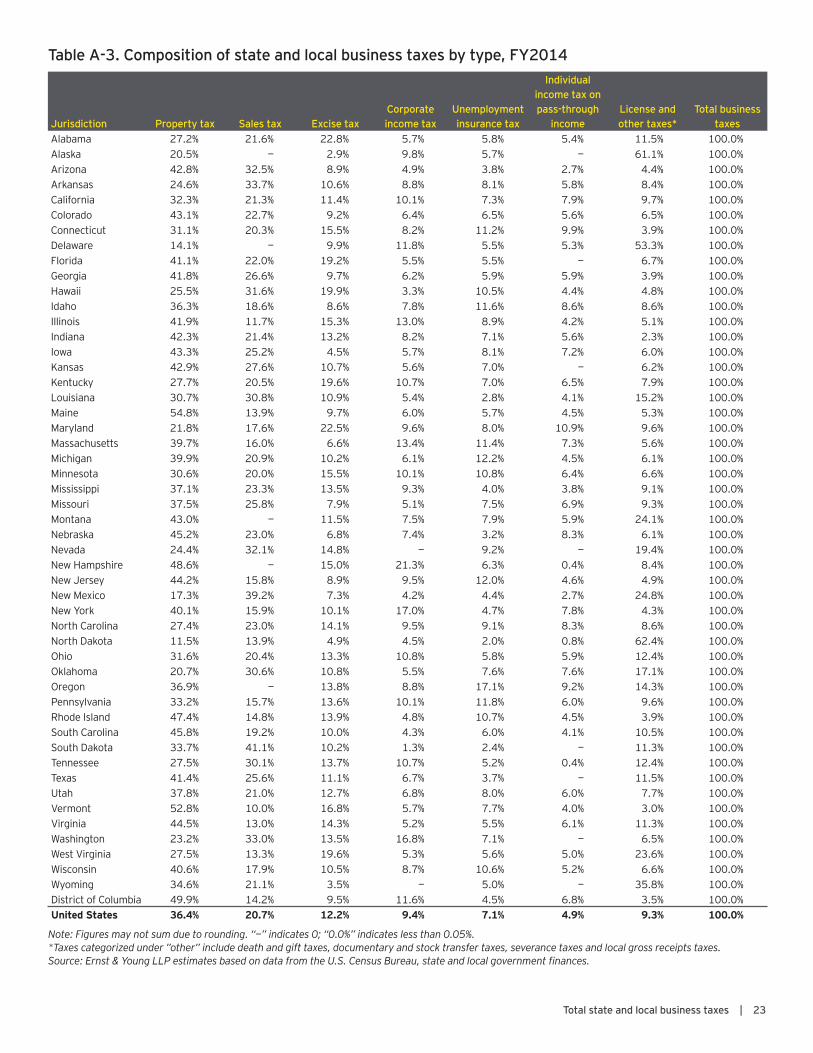
Table A-3. Composition of state and local business taxes by type, FY2014
Jurisdiction Property tax Sales tax Excise taxCorporate income tax
Unemployment insurance tax
Individual income tax on pass-through
incomeLicense and other taxes*
Total business taxes
Alabama 27.2% 21.6% 22.8% 5.7% 5.8% 5.4% 11.5% 100.0%Alaska 20.5% — 2.9% 9.8% 5.7% — 61.1% 100.0%Arizona 42.8% 32.5% 8.9% 4.9% 3.8% 2.7% 4.4% 100.0%Arkansas 24.6% 33.7% 10.6% 8.8% 8.1% 5.8% 8.4% 100.0%California 32.3% 21.3% 11.4% 10.1% 7.3% 7.9% 9.7% 100.0%Colorado 43.1% 22.7% 9.2% 6.4% 6.5% 5.6% 6.5% 100.0%Connecticut 31.1% 20.3% 15.5% 8.2% 11.2% 9.9% 3.9% 100.0%Delaware 14.1% — 9.9% 11.8% 5.5% 5.3% 53.3% 100.0%Florida 41.1% 22.0% 19.2% 5.5% 5.5% — 6.7% 100.0%Georgia 41.8% 26.6% 9.7% 6.2% 5.9% 5.9% 3.9% 100.0%Hawaii 25.5% 31.6% 19.9% 3.3% 10.5% 4.4% 4.8% 100.0%Idaho 36.3% 18.6% 8.6% 7.8% 11.6% 8.6% 8.6% 100.0%Illinois 41.9% 11.7% 15.3% 13.0% 8.9% 4.2% 5.1% 100.0%Indiana 42.3% 21.4% 13.2% 8.2% 7.1% 5.6% 2.3% 100.0%Iowa 43.3% 25.2% 4.5% 5.7% 8.1% 7.2% 6.0% 100.0%Kansas 42.9% 27.6% 10.7% 5.6% 7.0% — 6.2% 100.0%Kentucky 27.7% 20.5% 19.6% 10.7% 7.0% 6.5% 7.9% 100.0%Louisiana 30.7% 30.8% 10.9% 5.4% 2.8% 4.1% 15.2% 100.0%Maine 54.8% 13.9% 9.7% 6.0% 5.7% 4.5% 5.3% 100.0%Maryland 21.8% 17.6% 22.5% 9.6% 8.0% 10.9% 9.6% 100.0%Massachusetts 39.7% 16.0% 6.6% 13.4% 11.4% 7.3% 5.6% 100.0%Michigan 39.9% 20.9% 10.2% 6.1% 12.2% 4.5% 6.1% 100.0%Minnesota 30.6% 20.0% 15.5% 10.1% 10.8% 6.4% 6.6% 100.0%Mississippi 37.1% 23.3% 13.5% 9.3% 4.0% 3.8% 9.1% 100.0%Missouri 37.5% 25.8% 7.9% 5.1% 7.5% 6.9% 9.3% 100.0%Montana 43.0% — 11.5% 7.5% 7.9% 5.9% 24.1% 100.0%Nebraska 45.2% 23.0% 6.8% 7.4% 3.2% 8.3% 6.1% 100.0%Nevada 24.4% 32.1% 14.8% — 9.2% — 19.4% 100.0%New Hampshire 48.6% — 15.0% 21.3% 6.3% 0.4% 8.4% 100.0%New Jersey 44.2% 15.8% 8.9% 9.5% 12.0% 4.6% 4.9% 100.0%New Mexico 17.3% 39.2% 7.3% 4.2% 4.4% 2.7% 24.8% 100.0%New York 40.1% 15.9% 10.1% 17.0% 4.7% 7.8% 4.3% 100.0%North Carolina 27.4% 23.0% 14.1% 9.5% 9.1% 8.3% 8.6% 100.0%North Dakota 11.5% 13.9% 4.9% 4.5% 2.0% 0.8% 62.4% 100.0%Ohio 31.6% 20.4% 13.3% 10.8% 5.8% 5.9% 12.4% 100.0%Oklahoma 20.7% 30.6% 10.8% 5.5% 7.6% 7.6% 17.1% 100.0%Oregon 36.9% — 13.8% 8.8% 17.1% 9.2% 14.3% 100.0%Pennsylvania 33.2% 15.7% 13.6% 10.1% 11.8% 6.0% 9.6% 100.0%Rhode Island 47.4% 14.8% 13.9% 4.8% 10.7% 4.5% 3.9% 100.0%South Carolina 45.8% 19.2% 10.0% 4.3% 6.0% 4.1% 10.5% 100.0%South Dakota 33.7% 41.1% 10.2% 1.3% 2.4% — 11.3% 100.0%Tennessee 27.5% 30.1% 13.7% 10.7% 5.2% 0.4% 12.4% 100.0%Texas 41.4% 25.6% 11.1% 6.7% 3.7% — 11.5% 100.0%Utah 37.8% 21.0% 12.7% 6.8% 8.0% 6.0% 7.7% 100.0%Vermont 52.8% 10.0% 16.8% 5.7% 7.7% 4.0% 3.0% 100.0%Virginia 44.5% 13.0% 14.3% 5.2% 5.5% 6.1% 11.3% 100.0%Washington 23.2% 33.0% 13.5% 16.8% 7.1% — 6.5% 100.0%West Virginia 27.5% 13.3% 19.6% 5.3% 5.6% 5.0% 23.6% 100.0%Wisconsin 40.6% 17.9% 10.5% 8.7% 10.6% 5.2% 6.6% 100.0%Wyoming 34.6% 21.1% 3.5% — 5.0% — 35.8% 100.0%District of Columbia 49.9% 14.2% 9.5% 11.6% 4.5% 6.8% 3.5% 100.0%United States 36.4% 20.7% 12.2% 9.4% 7.1% 4.9% 9.3% 100.0%
Note: Figures may not sum due to rounding. “—” indicates 0; “0.0%” indicates less than 0.05%.*Taxes categorized under ”other” include death and gift taxes, documentary and stock transfer taxes, severance taxes and local gross receipts taxes.Source: Ernst & Young LLP estimates based on data from the U.S. Census Bureau, state and local government fi nances.
24
Endnotes1. States that follow a different fi scal year are Alabama (ends September 30), Michigan (ends September 30), New York
(ends March 31) and Texas (ends August 31). Data presented in this study are for each state’s fi scal year.
2. The general methodology used to estimate state and local business taxes is described in detail in the Appendix to the Ernst & Young LLP/COST FY2005 50-State Business Tax study published in March 2006 (available at www.cost.org). Note that business tax estimates for prior years have been revised from those published in earlier editions of this study due to the use of newly released U.S. Census Bureau data and refi nements to the estimation of individual income taxes. All references to business taxes in prior fi scal years refer to the updated estimates included in this study, rather than the previously published estimates.
3. Robert Cline, Andrew Phillips and Tom Neubig, What’s Wrong with Taxing Business Services? Adverse Effects from Existing and Proposed Sales Taxation of Business Investment and Services, prepared for the Council On State Taxation, April 4, 2013.
4. For an analysis of the incidence of state and local taxes on business, see Robert Cline, Andrew Phillips, Joo Mi Kim and Tom Neubig, “The Economic Incidence of Additional State Business Taxes,” State Tax Notes, Tax Analysts, January 11, 2010.
5. Robert Cline, Andrew Phillips, Joo Mi Kim and Tom Neubig, “The Economic Incidence of Additional State Business Taxes,” State Tax Notes, January 11, 2010
6. Richard H. Mattoon and William A. Testa, “How Closely Do Business Taxes Conform to the Benefi ts Principle?” presentation at the Future State Business Tax Reforms: Perspectives from the Business, Government and Academic Communities conference, Federal Reserve Bank of Chicago (September 17, 2007). The authors distributed state and local government expenditures between businesses and households. Services benefi ting business include shares of expenditures for transportation, water and sewer infrastructure, police and fi re protection, general government “overhead” (e.g., legislative, administrative and judicial services), interest and regulatory activities. The methodology used is described in detail in William H. Oakland and William A. Testa, “State-Local Business Taxation and the Benefi ts Principle,” Economic Perspectives (January/February 1996). The authors also note that selective excise taxes, such as the severance tax, impact a small portion of businesses and could be removed from the business tax numerator to provide a measure of the tax to benefi t ratio generally applicable to most fi rms. Ernst & Young LLP added in expenditure categories to the analysis not included in the 2007 data.
7. Evidence is reviewed in Enrico Moretti, “Workers’ Education, Spillovers, and Productivity: Evidence from Plant-Level Production Functions,” The American Economic Review, June 2004.
8. An example of work related to the social benefi ts of education is Lance Lochner and Enrico Moretti, “The Effect of Education on Crime: Evidence from Prison Inmates, Arrests, and Self-Reports,” NBER Working Paper 8605, November 2001.
9. The tax-benefi t ratios shown in this study were constructed in the following way. Ernst & Young LLP followed the general methodology used by Mattoon and Testa that allocates expenditures net of user charges and federal transfers to businesses and households. Like Mattoon and Testa, Ernst & Young LLP identifi ed major categories of state and local spending. Using data from the U.S. Census Bureau’s 2010 State and Local Government Finances, expenditures, charges, federal transfers and other category-specifi c non-tax revenue were assigned to each category. These items were used to calculate the net expenditures for each category. The net expenditures were then allocated to businesses and households in an identical manner to the Mattoon and Testa allocation for all categories included in their analysis. For new categories, Ernst & Young LLP followed Mattoon and Testa’s general principles in allocating net expenditures. Using data from the National Association of State Budget Offi cers’ State Expenditure Report (2012), the 2010 amounts were adjusted to 2012 using the All Funds growth rate. For the District of Columbia, Ernst & Young LLP used data from the Statistical Section of the District of Columbia’s 2012 Comprehensive Annual Financial Report to grow state and local net expenditures.

The authorsThis study was prepared by the Quantitative Economics and Statistics (QUEST) practice of Ernst & Young LLP in conjunction with the Council On State Taxation (COST).
QUEST is a group of economists, statisticians, survey specialists and tax policy researchers within Ernst & Young LLP’s National Tax Practice, located in Washington, DC. QUEST provides quantitative advisory services and products to private and public sector clients that enhance business processes, support regulatory compliance, analyze proposed policy issues and provide litigation support.
COST is a nonprofi t trade association based in Washington, DC. COST was formed in 1969 as an advisory committee to the Council of State Chambers of Commerce and today has an independent membership of nearly 600 major corporations engaged in interstate and international business. COST’s objective is to preserve and promote the equitable and nondiscriminatory state and local taxation of multijurisdictional business entities.
Andrew Phillips is a principal in the Quantitative Economics and Statistics practice of Ernst & Young LLP and directs the Regional Economics practice. He has an MA in Economics from Johns Hopkins University and a BA in Economics from Emory University.
Caroline Sallee is a manager in the Quantitative Economics and Statistics practice of Ernst & Young LLP. She has an MPP from the University of Michigan and a BA in Economics from Augustana College.
Daniel Sufranski is an analyst in the Quantitative Economics and Statistics practice of Ernst & Young LLP. He has a BA in Economics and Political Science from Washington University in St. Louis.
Elizabeth Larimore is an analyst in the Quantitative Economics and Statistics practice of Ernst & Young LLP. She has a BS in Economics and Political Science from Syracuse University.

EY | Assurance | Tax | Transactions | Advisory
About EYEY is a global leader in assurance, tax, transaction and advisory services. The insights and quality services we deliver help build trust and confidence in the capital markets and in economies the world over. We develop outstanding leaders who team to deliver on our promises to all of our stakeholders. In so doing, we play a critical role in building a better working world for our people, for our clients and for our communities.
EY refers to the global organization, and may refer to one or more, of the member firms of Ernst & Young Global Limited, each of which is a separate legal entity. Ernst & Young Global Limited, a UK company limited by guarantee, does not provide services to clients. For more information about our organization, please visit ey.com.
Ernst & Young LLP is a client-serving member firm of Ernst & Young Global Limited operating in the US.
Quantitative Economics and Statistics (QUEST) QUEST is a group of economists, statisticians, survey specialists and tax policy analysts within Ernst & Young LLP’s National Tax Practice, located in Washington, DC. QUEST provides quantitative advisory services to private and public sector clients including tax policy economic studies, statistical sampling, and surveys.
© 2015 Ernst & Young LLP and Council On State Taxation.All Rights Reserved.
SCORE No. YY3703BSC No. 1509-1696924
ED None