eye-tracking for user modeling in exploratory learning environments: an empirical evaluation
TRANSCRIPT

www.elsevier.com/locate/knosys
Knowledge-Based Systems 20 (2007) 557–574
Eye-tracking for user modeling in exploratory learningenvironments: An empirical evaluation
Cristina Conati a,b,*, Christina Merten a
a Department of Computer Science, University of British Columbia, 2366 Main Mall, Vancouver, BC, Canada V6Z2T4b Department of Information and Communication Technology, University of Trento Via Sommarive 14, 3805, Povo, Trento, Italy
Received 18 December 2006; accepted 17 April 2007Available online 27 April 2007
Abstract
In this paper, we describe research on using eye-tracking data for on-line assessment of user meta-cognitive behavior during interac-tion with an environment for exploration-based learning. This work contributes to user modeling and intelligent interfaces research byextending existing research on eye-tracking in HCI to on-line capturing of high-level user mental states for real-time interaction tailoring.We first describe the empirical work we did to understand the user meta-cognitive behaviors to be modeled. We then illustrate the prob-abilistic user model we designed to capture these behaviors with the help of on-line information on user attention patterns derived fromeye-tracking data. Next, we describe the evaluation of this model, showing that gaze-tracking data can significantly improve model per-formance compared to lower level, time-based evidence. Finally, we discuss work we have done on using pupil dilation information, alsogathered through eye-tracking data, to further improve model accuracy.� 2007 Elsevier B.V. All rights reserved.
Keywords: User modeling; Eye-tracking; Intelligent learning environments; Exploration-based learning; Self-explanation
1. Introduction
One of the functionalities that an Intelligent User Inter-face may include is providing tailored support to help usersperform complex tasks. Providing this functionalityinvolves building a model of user traits relevant to ade-quately tailoring the interaction, i.e., a user model. Depend-ing on the nature of the task and the extent of the support,the relevant user traits may include simple performancemeasures (such as frequencies of interface actions),domain-dependent cognitive traits (such as knowledgeand goals), meta-cognitive processes that cut across tasksand domains, and affective states. Arguably, the higherthe level of the traits to be captured, the more difficult itis to assess them unobtrusively from simple interaction
0950-7051/$ - see front matter � 2007 Elsevier B.V. All rights reserved.
doi:10.1016/j.knosys.2007.04.010
* Corresponding author. Address: Department of Computer Science,University of British Columbia, 2366 Main Mall, Vancouver, BC, CanadaV6Z2T4. Tel.: +1 604 8224632; fax: +1 604 822 5485.
E-mail address: [email protected] (C. Conati).
events. This problem has generated a stream of researchon using innovative sensing devices to enrich the informa-tion available to a user model.
Our work contributes to this research stream by present-ing results on using real time eye-tracking information toinform a user model designed to assess student meta-cogni-tive behavior during interaction with an ExploratoryLearning Environment (ELE). ELEs are computer-basededucational tools designed to stimulate learning throughfree exploration of the target domain, instead of throughthe more structured activities supported by traditionalIntelligent Tutoring Systems [29].
The meta-cognitive behaviors covered by the user modelwe describe include the capability to learn effectively fromfree exploration [11,30] and the capability to self-explaininstructional material, i.e., to clarify and elaborate thegiven information in light of the underlying domain theory(e.g., [7,25]). Both of these meta-cognitive skills have beenshown to improve the quality of student learning withELE, but it has also been shown that many students lackthem [7,25].

558 C. Conati, C. Merten / Knowledge-Based Systems 20 (2007) 557–574
As a consequence, there have been several efforts to sup-port the acquisition of these skills in ELE. However, few ofthese efforts tried to generate support tailored to studentmeta-cognitive needs. In relation to effective exploration,most work focused on providing interface tools that stim-ulate the right exploratory behaviors [23,29]. In relationto self-explanation, research either focused on generatinguntailored prompts [1], or relied on simple tailoring strate-gies such as prompting for self-explanation after every newaction or after every incorrect action [21]. One of the rea-sons for the lack of sophisticated tailoring is the difficultyof assessing user meta-cognitive behaviors. Conati andVanlehn [10] proposed a system that models user self-explanation behavior using interface artifacts that allowthe system to obtain relevant information on user atten-tion. However, it is not always possible to devise interfaceartifacts that do not interfere with the nature of theinteraction. For this reason, we are exploring the use ofeye-tracking data to provide information on user meta-cog-nition. In particular, in this paper we describe our inclusionof eye-tracking information to track student self-explana-tion and exploration behavior in ACE (Adaptive Coachfor Exploration), an ELE that supports student explora-tion of mathematical functions.
In an ELE, an essential component of effective explora-tion involves trying out a variety of domain-explorationactions. However, simply trying out actions is not sufficientfor learning. It is also important to attend to and reasonabout the actions’ outcome, i.e., to perform self-explana-tion. Intuitively, self-explanation may be more likely ifthe student actually attends to the parts of the interfaceshowing the effects of a specific exploratory action. Previ-ous studies [22] showed that a user’s gaze can be a goodindicator of which parts of an interface hold the user’sattention. Thus, it is reasonable to assume that the presenceor absence of certain gaze patterns (such as gaze shifts fromthe screen region where an action is executed to the regionshowing its effects) may be used to assess self-explanationbehavior. The first objective of this work is to test thisassumption. The second objective is to show that accurateassessment of self-explanation can improve assessment ofstudent exploratory behavior. To meet these objectives,we set two subgoals: (i) creating a student model that usesspecific gaze patterns as evidence of implicit self-explana-tion; (ii) evaluating the performance of the model as a pre-dictor of implicit self-explanation and sufficientexploration, particularly in comparison with previousmodel versions that do not use gaze-tracking data. In thispaper, we describe how we achieved both goals. For goal(i), we first illustrate a user study that tests assumptionson which gaze patterns indicate implicit self-explanationand compare these patterns as predictors against a simplermeasure based on action latency. We then describe the usermodel we built based on the results of this study.
For goal (ii), we show that including gaze-trackinginformation significantly improves the model assessmentof student self-explanation, compared to previous versions.
The evaluation also shows that more accurate assessmentof student self-explanation significantly improves theassessment of student learning through exploration. Thisis a significant contribution to the research on eye-trackingin HCI, which has mostly involved the use of eye-trackingfor either interface evaluation/manipulation or on-lineassessment of lower-level mental states.
We also explored whether pupil dilation informationmay further improve model accuracy. Previous researchfound a positive correlation between a person’s pupildilation and cognitive load in a wide variety of tasks [4].Self-explanation requires cognitive effort to make sense ofstudied instructional material, thus students who self-explain may incur a higher cognitive load than studentswho do not. Since the eye-tracker we used in this researchprovides data on pupil size, we investigated whether thismeasure could be an additional predictor of self-explana-tion for our student model. Our findings contribute tothe increasing body of work that has been recently devotedto evaluate the performance of pupil dilation as a source ofinformation for interface adaptation.
In the rest of the paper, we first discuss related work.Next, we introduce the ACE learning environment, theELE we used in this project. Then we present previous ver-sions of the ACE student model and their limitations, andwe follow with the illustration of the new model. Next, wedescribe a study to evaluate the new model. Finally, wepresent our investigation on whether pupil dilation infor-mation, also derived from eye-tracking data, may contrib-ute to model accuracy. We conclude with a discussion offuture work.
2. Related work
2.1. Research on self-explanation and exploration
Several studies in Cognitive Science have shown the effec-tiveness of self-explanation as a learning skill in a variety ofinstructional tasks, including studying worked-out examplesolutions (e.g., [8,25]), reading instructional text ([8]) andsolving problems (e.g., [1]). Because there is evidence thatthis learning skill can be taught (e.g., REF), several com-puter-based tutors have been devised to provide explicit sup-port for self-explanation. However, all of these tutors focuson coaching self-explanation during fairly structured interac-tions targeting problem-solving skills (e.g., [1,10,21]). Forinstance, the SE-Coach [10] is designed to model and triggerstudents’ self-explanations as they study examples ofworked-out solutions for physics problems. The GeometryExplanation Tutor [1] and Normit-SE [21] support self-explanations of problem-solving steps, in geometry theoremproving and data normalization, respectively. In this paper,we describe our extension of support for self-explanation tothe less structured pedagogical interactions supported byexploratory learning environments.
Exploratory learning environments place less emphasison supporting learning through structured, explicit instruc-

C. Conati, C. Merten / Knowledge-Based Systems 20 (2007) 557–574 559
tion and more on allowing the learner to freely explore theavailable instructional material (e.g., [11,30,29]). In theory,this type of active learning should enable students toacquire a deeper, more structured understanding of con-cepts in the domain. In practice, empirical evaluations haveshown that open learning environments are not alwayseffective for all students (e.g., [11,30]). The degree of learn-ing from such environments depends on a number of stu-dent-specific features, such as activity level and whetheror not the student already possesses the meta-cognitiveskills necessary to learn from exploration. These resultshighlight the importance of providing support to explora-tion-based learning that is tailored to the needs of individ-ual students.
2.2. Eye-tracking research
2.2.1. Retrospective analysis of eye movement
In HCI, retrospective analysis of eye movement data hasbeen studied to evaluate usability issues and understandhuman performance. For instance, Schiessl et al. [27] usedan eye-tracker to investigate gender differences in attentionbehavior for textual vs. pictorial stimuli on websites. Aninteresting outcome was that, when the participants wereasked where in the interface they thought they looked, theirperceptions often differed from reality, showing that accu-rate attention patterns could only be found with an eye-tracker. In [13], offline processing of eye-tracking data wasused to improve the efficient generation of non-photorealis-tic images. Users’ eye fixations were analyzed to determinewhich parts of given pictures users found to be most mean-ingful, and the findings were used to design algorithms thatdraw the most ‘‘important’’ parts of the picture first.
The research described in this paper differs from theefforts above because, although it includes the use of retro-spective analysis of eye movements to design and test a stu-dent model, it also uses eye-tracking data on-line to modelstudent learning.
2.2.2. On-line use of eye-tracking in interface operation
There has also been fairly extensive research in using eyegaze as an alternative form of input to allow a user toexplicitly operate an interface. In [19], Jakob exploresissues surrounding the real-time processing of eye datasuch as efficient noise reduction and the organization ofgaze information into tokens from which relevant datamay be extracted. He then discusses the potential of eye-tracking as a tool in several forms of interface manipula-tion, including object selection/movement, scrolling text,and navigating menus. Salvucci and Anderson [26] appliedthese ideas to design IGO (Intelligent Gaze-added Operat-ing-system), a system that allows users to use their eyes toperform interface operations such as opening, closing anddragging windows. Majaranta et al. [20] devised a systemthat allowed users to type with their eyes via an eye-tracker, given a picture of a keyboard for users to lookand an algorithm to interpret small fixations as key presses.
In [16], Hornof et al. describe EyeDraw, a system to enablechildren with severe motor impairments to draw picturesby just moving their eyes. Unlike the above systems, thework discussed in this paper uses real-time processing ofa user’s gaze to interpret user non-explicit meta-cognitivebehaviours for on-line interaction adaptation.
2.2.3. Eye-tracking for on-line interaction adaptation
A parallel research stream has used eye-tracking dataon-line for real-time interaction adaptation. Some of thiswork uses gaze tracking to assess user task performance.For example, in [31], Sibert et al. describe the use of gazetracking to assess reading performance in the ReadingAssistant, a system for automated reading remediation thatprovides visual and auditory cues if user gaze patterns indi-cate difficulties in reading a word. In [17], Iqbal and Baileyuse gaze-tracking to determine which type of task the useris performing (e.g., reading email vs. reading a web page),with the goal of devising an attention manager that bal-ances the user’s need for minimal disruption with an appli-cation’s need to deliver necessary information.
There has also been research on using gaze informationfor real-time adaptation to user mental states such as inter-est or problem-solving strategies. In [32], Starker and Boltdescribe a system that uses an eye-tracker to determinewhich part of a graphical interface a user is interested in,and then provides more information about this area viavisual zooming or synthesized speech. In [24], Qu andJohnson use eye-tracking for interaction adaptation withinthe Virtual Factory Teaching System (VFTS), an computertutor for teaching engineering skills. Eye-tracking is used todiscern the time the user spends reading something fromthe time the user spends thinking before taking action, withthe goal of assessing and adapting to the motivationalstates of student effort and confusion. Gluck and Anderson[15] studied the use of eye-tracking to assess student prob-lem-solving behaviors within the PAT Algebra I tutor,including attention shifts, disambiguation of problem state-ments and errors, processing of error messages and otherinformation critical to problem solving.
Our work extends this body of research by exploring ifand how eye-tracking can help assess mental states relatedto the meta-cognitive, domain-independent skill of self-explanation.
2.3. Using pupil dilation in adaptive interfaces
Recently, there has been increasing interest in exploringthe potential of pupil dilation as a source of informationfor an adaptive system, mostly because of the link that hasbeen found between pupil dilation and cognitive load [3].However, so far the existing research on this topic has yieldedcontroversial results. Schultheis and Jameson [28] analyzedpupil sizes of users reading texts of varying difficulty withinan adaptive hypermedia system. They found that the differ-ence in text difficulty – and thus cognitive load – was notreflected in pupil diameter changes. Iqbal et al. [18] examined

560 C. Conati, C. Merten / Knowledge-Based Systems 20 (2007) 557–574
the sensitivity of pupil size to cognitive load as users per-formed different tasks, including file manipulation and thereading of text. While, as in [28], pupil size failed to be anaccurate indication of cognitive load during the readingtasks, it was found to be sensitive to task difficulty during cer-tain subtasks of the file management task.
The investigations described in this paper contributes tothe above body of work by providing initial indicationsthat pupil dilation is not a good predictor of self-explana-tion during exploration with an ELE.
3. The ace learning environment
ACE is a learning environment that supports the explo-ration of mathematical via a set of activities divided intounits and exercises. Units are collections of exercises whosematerial is presented with a common theme and mode ofinteraction. Exercises within units differ in function typeand equation.
Fig. 1 shows the main interaction window for the PlotUnit. We will focus on this unit throughout the paperbecause it is the unit most relevant to the research pre-sented in later sections. In the Plot Unit, a learner canexplore the relationship between a function’s graph andequation by moving the graph in the Cartesian plane andobserving how that affects the equation (displayed belowthe graph area). The student can also change the equationparameters and see how these changes affect the graph.
To support the exploration process, ACE includes acoaching component that provides tailored hints whenACE’s student model detects that students are having dif-ficulties exploring effectively. For more details on ACE’sinterface and coaching component, see [5]. In the next sec-tion, we describe two preliminary versions of ACE’s stu-dent model, which we will use for performancecomparison against the new model with eye-tracker datain the evaluation section.
4. Previous versions of ACE’S student model
4.1. Version with no self explanation
ACE’s student model uses Dynamic Bayesian Networks(DBN) [12] to manage the uncertainty in assessing
Fig. 1. ACE’s plot unit.
students’ exploratory behavior. The main cause of thisuncertainty is that the reasoning processes that influencethe effectiveness of student exploration are not easily obser-vable unless students are required to make them explicit.However, forcing students to articulate this reasoningwould likely be intrusive and clash with the unrestrictednature of this type of learning.
We chose DBNs for the ACE student model becausethey are a well-established formalism for reasoning underuncertainty in domains where there are dynamic randomvariables, i.e., variables with values that can change overtime (e.g., student knowledge during interaction withACE). A DBN is a graph where nodes represent stochasticvariables of interest and arcs capture the direct probabilis-tic relationships between these variables, including tempo-ral dependencies between the evolving values of dynamicvariables. Each node has an associated probability distri-bution representing the conditional probability of each ofits possible values, given the values of its parent nodes.As evidence on one or more network variables becomesavailable, ad hoc algorithms update the posterior probabil-ities of all the other variables, given the observed values.
The first version of ACE’s student model was derivedfrom an iterative design process that yielded a better under-standing of what defines effective exploration [5]. Fig. 2shows a high-level description of this model, which com-prises several types of nodes to assess exploratory behav-iour at different levels of granularity. These nodesinclude: Relevant Exploration Cases, representing explora-tion of individual exploration cases in an exercise (e.g.,changing the slope of a line to 3, a positive number, inthe Plot Unit); Exploration of Exercises and Exploration
of Units, representing adequate exploration for the variousACE exercises and units, respectively; and Exploration of
Categories, representing the exploration of groups of rele-vant exploration cases that appear across multiple exercises(e.g., all of the exploration cases involving a positive slopein the Plot Unit). The links among the different types ofexploration nodes represent how they interact to defineeffective exploration. Exploration nodes have binary valuesrepresenting the probability that the learner has sufficientlyexplored the associated items.
ACE’s student model also includes binary nodes repre-senting the probability that the learner understands the rel-evant pieces of knowledge (summarized by the node
Fig. 2. High-level structure of ACE’s student model.

e0
e0Case1
time Stimuli to SE
SE Tendency
Knowledge
Coach hintto SE
e0 Case 0
Implicit SEPositiveIntercept
NegativeIntercept
Plot UnitExploration
Fig. 3. Original ACE student model with self-explanation.
C. Conati, C. Merten / Knowledge-Based Systems 20 (2007) 557–574 561
Knowledge in Fig. 2). The links between knowledge andexploration nodes represent the fact that the degree ofexploration needed to understand a concept depends onhow much knowledge a learner already has. Knowledgenodes are updated only through actions for which thereis a clear definition of correctness. These nodes are neverupdated within the Plot Unit, since it consists of purelyexploratory activities.
Initial studies on ACE generated encouraging evidencethat the system based on the model in Fig. 2 could help stu-dents learn better from exploration [5]. However, thesestudies also showed that sometimes the ACE student model –labeled Action_Based model from now on – overestimatedstudents’ exploratory behaviour, because it consideredinterface actions to be sufficient evidence of good explora-tion, without taking into account whether a student wasself-explaining the outcome of these actions. For instance,a student who quickly moves a function graph aroundthe screen in the Plot Unit – but never reflects on how thesemovements change the function equation – performs manyexploratory actions but can hardly learn from thembecause she is not reflecting on (self-explaining) their out-comes. We observed this behavior in several studyparticipants.
4.2. Extending ACE to track and support self-explanation
To address the model limitation described above, westarted extending ACE’s interface and student model totrack and support self-explanation [6]. The original versionof ACE only generated hints indicating that a studentshould further explore some elements of a given exercise.Augmenting ACE with the capability to track self-explana-tion allows ACE not only to detect when a student’s explo-ration is sub-optimal, but also to understand if the cause isa lack of self-explanation and generate tailored hints tocorrect this behavior.
There are two types of self-explanation that ACEneeds to detect: (i) explicit self-explanation, i.e., self-explanation that the student generates using menu-basedtools available in the interface; and (ii) implicit self-expla-nation that students generate in their head. The latter isthe most difficult to detect, due to the lack of hard evi-dence of its occurrence. Implicit self-explanation is thefocus of the extensions to the student model we describein the next sections.
The first version of the ACE student model with an assess-ment of self-explanation [6] used only time spent on eachexploratory action as evidence of implicit self-explanation.We will refer to this model as Time_Based model fromnow on. Fig. 3 shows a time slice 1 in this model,
1 In a DBN, a time slice represents the model’s variables at a particularpoint in time. The temporal evolution of dynamic variables is representedby a sequence of time slices connected by links that encode the temporaldependencies between slices.
corresponding to an implicit self-explanation action (similarslices capture the occurrence of explicit self-explanation).
Nodes representing the assessment of self-explanationare shaded grey. In this figure, the learner is currentlyexploring exercise 0 (node e0) in the Plot Unit, for whichtwo relevant exploration cases (e0Case0 and e0Case1 inFig. 3) are shown. Each exploration case influences oneor more exploration categories (positive intercepts and neg-ative intercepts in the figure). Here, the learner performs anaction corresponding to e0case1. In this new version of themodel, the probability that a learner’s action implies effec-tive exploration of a given case depends on both the prob-ability that the student self-explained the action and theprobability that she knows the corresponding concept, asassessed by the set of knowledge nodes in the model (sum-marized in Fig. 3 by the node Knowledge). Factors influ-encing the probability that implicit self-explanationoccurs include the time spent exploring the case and thestimuli that the learner has to self-explain. Low time isalways taken as negative evidence for implicit explanation.The probability of self-explanation with longer time spenton an action depends on whether there is a stimulus toself-explain, i.e., on the learner’s general tendency to self-explain and on whether the system generated an explicithint to self-explain.
Time, however, can be an ambiguous predictor for self-explanation. First, it is hard to define for different learnerswhat is insufficient time for self-explanation. Furthermore,a student may be completely distracted during a long inter-val between exploration cases. Thus, we chose to explorean additional source of evidence of self-explanation behav-ior, i.e., the student’s attention patterns during the explora-tion of a given case.
5. Adding eye-tracking to ACE – preliminary investigation
The intuition for using an eye-tracker to assess self-explanation is that self-explanation is more likely to have

562 C. Conati, C. Merten / Knowledge-Based Systems 20 (2007) 557–574
occurred if the student actually attends to the interface’sregions showing the effects of a specific exploratory action.As an example, if a student has modified the function equa-tion, a gaze shift pattern suggestive of self-explanationwould start from the equation region and then hoveraround the graph region above.
However, monitoring user gaze with an eye-tracker canbe expensive and laborious. Thus, we ran a study to com-pare the effectiveness of gaze tracking as predictor of self-explanation against a simpler time-based predictor.Although the study was discussed in [8] we report it here,expanding on the experimental design and data analysis,because it lays the groundwork for the new model and eval-uation methodology described later.
5.1. Study design
The 19 participants recruited for the study were univer-sity students who had not yet taken any college level math,but had had high school calculus. We set this requirementto have subjects with limited knowledge of mathematicalfunctions, so that it would be meaningful for them toexplore this topic through ACE. We needed subjects withsome initial understanding of the subject, however, becauseACE does not offer any background instruction and totalnovices would not know where to start.
The study consisted of individual sessions lastingapproximately 80 min. In each session, the student firstcompleted a pre-test to determine his/her initial knowledgeof mathematical functions. This was followed by interac-tion with ACE,2 while a student’s eye movements wererecorded by an head-mounted eye-tracker. This particulareye-tracker was used because it was readily availablethrough the Psychology Department at the University ofBritish Columbia. However, the same data could beobtained through a completely non-intrusive remote eye-tracker, consisting of a small camera that sits on top ofthe monitor or on some other flat surface (e.g., IView XRed from SensoMotoric Instruments, USA).
Before starting the interaction with ACE, participantsunderwent an eye-tracker calibration phase. Next, we useda standard script to instruct participants to ‘‘think aloud’’,i.e., to verbalize what they thought during interaction, evenif it seemed unimportant. Finally, participants wentthrough each of the ACE units at their own pace. Afterexiting ACE, each participant completed a post-test verysimilar to the pre-test, the only differences being the con-stants used in the functions and the ordering of differentquestions.
In addition to the paper pre-test and post-test, each ses-sion yielded a log file from the ACE system, which includedeach exploratory action and the time when it was taken.The eye-tracker also generated a log file containing the
2 In this study, we used the original version of ACE, which does notinclude tools to support explicit student self-explanation.
coordinates and duration of each fixation. In addition,we collected video and audio recordings of the interaction,showing the ACE screen and allowing for later analysis ofthe user’s speech.
5.2. Data analysis
5.2.1. Setting the ‘‘gold standard’’
In order to assess the performance of latency and gazepatterns as predictors of implicit self-explanation, it wasnecessary to first classify students’ self-explanation behav-ior. In particular, we needed to isolate exploratory actionsaccompanied by implicit self-explanation (termed positive
self-explanation cases from now on) and those that werenot (termed negative self-explanation cases), so that theseclassifications could be tested for correlations with thosepredicted by time and gaze shifts. Note that here ‘‘negativeself-explanation’’ indicates situations in which the studentsdid not self-explain, not situations in which students self-explained incorrectly, consistent with the original definitionof self-explanation [8].
We used the audio recordings of each interaction fordetecting the presence or absence of implicit self-explana-tion. As described earlier, these recordings consisted ofexplicit verbalization by the subjects as to their thoughts.Similar to other studies on self-explanation [3,21], usingsubjects’ verbalizations is acceptable since the participantswere instructed to share all of their thoughts and were nottold anything about the data analysis process or the actualpurpose of the study. Thus, the episodes we related to pres-ence or absence of self-explanation in the data can accu-rately be described as ‘‘internal’’ since they reflect thesubjects’ thoughts, which are unknown to the ACE system.Further, with existing technology, this is as close as wecould come to reading the students’ thoughts in our searchfor evidence of implicit self-explanation or lack thereof.
To maximize objectivity in the analysis of the audiodata, two observers (the second author and another gradu-ate research assistant) independently analyzed the audiodata and then created links between the verbal episodesand the corresponding exploration cases in the log files.This turned out to be a fairly laborious process, becauseof two main factors.
First, we needed to devise a detailed coding scheme inorder to objectively convert fragments of audio data intoisolated episodes of positive or negative self-explanation.While coding schemes exist for self-explanation study dur-ing problem solving (see, for instance, [8]), ours was thefirst attempt to evaluate self-explanation during indepen-dent exploration. This problem was addressed by havingthe two observers independently label a subset of the audiodata, then compare their classifications, possibly reconcilethem and devise the coding scheme based on thisdiscussion.
In the coding scheme, student utterances were classifiedas self-explanation if they expressed a conclusion about adomain-specific principle related to the exploration process

C. Conati, C. Merten / Knowledge-Based Systems 20 (2007) 557–574 563
(e.g., ‘‘when I increase the coefficient here, the line gets stee-
per’’) regardless of correctness, or if they predicted theresult of an action just before it occurred (e.g., ‘‘putting a
negative sign here will turn the curve upside-down’’). Simplynarrating the outcome of each action once it happened(e.g., ‘‘this number just changed to a 3’’), obvious statementsof inattentiveness (e.g., ‘‘I’m just playing’’) or isolated state-ments of confusion (e.g., ‘‘I do not understand what is hap-
pening’’) were not considered self-explanation. However,tentative explanations followed by expressions of confu-sion were coded as self-explanation. This classificationscheme is summarized in Table 1. It should also be notedthat whenever an exploratory action was followed by evi-dence of both positive and negative self-explanation, theaction was considered self-explained. The coded data fortwo episodes appears below.CODED DATA FOR TWO VERBALIZATION EPISODES
ÆACE_TIME: 16:59:23æ ÆVID_TIME:02:38:34æ
(a) ÆACE_TIME: 17:07:08æ ÆVID_TIME:æ ÆACTION:Moved constant functionæ ÆSE_TYPE:NæÆSE_DESCRIPTION: ‘‘I’m not sure what’s
going on’’æ ÆLOG_PTR: 1057æ(b) ÆACE_TIME: 17:07:27æ ÆVID_TIME:æ ÆACTION:
Moved linear functionæ ÆSE_TYPE:YæÆSE_DESCRIPTION: ‘‘moving the line
changes the y intercept in the equa-
tion’’æ ÆLOG_PTR: 1127æ
Here, the various tags describe each episode, as fol-lows.ACE_TIME gives the system time when the actionoccurs; VID_TIME gives the time as kept by the video-recorder; ACTION describes the exploratory actionoccurred; SE_TYPE gives the aforementioned experiment-ers classification of self-explanation episodes. Here, a Y(yes), N (no) or ? (inconclusive) always appears;SE_DESCRIPTION gives the student’s statement used todefine SE_TYPE; LOG_PTR gives the action’s line numberin the ACE log file for quick reference.
For each coded episode, the experimenter records therelevant utterance in the SE_DESCRIPTION tag, asshown in the two coded episodes above. The VID_TIMEtag gives the video-recorder time of when the speechoccurred, and the SE_TYPE tag gives the corresponding
Table 1Coding scheme for self-explanation episodes
Evidence of positive self-explanation Evidence of negativeself-explanation
Verbalized conclusions about domain-specificprinciples related to the exploration process(regardless of correctness)
Simple narration of theinteractionIsolated statements ofconfusionExpressions ofinattentiveness
Prediction of an action just before it occurred
observers’ classification. A post-processing program helpsfind the ACE action associated with a given utterance byusing the synchronization line appearing at the start ofeach coded file, which gives the time when ACE was startedin both forms. From this line, the program derives theACE_TIME for each coded utterance from its correspond-ing VID_TIME tag, and then retrieves the co-occurringaction from the ACE log file, filling the ACTION, andLOG_PTR tags accordingly.
The second factor contributing to the complexity of dataanalysis was that knowing the time of occurrence was notalways sufficient to map utterances with actions. Theobservers at first assumed that subjects’ utterances alwayspertained to whatever exploratory action they had justtaken. However, subsequent analysis of the video datashowed that this was not always the case, particularly forusers who showed great reluctance to think aloud. Theselearners had to be repeatedly prompted by the observersto speak, so some of the conclusions they shared werenot reached when they spoke, but related to self-explana-tion that occurred a few minutes earlier. The observerssolved this problem by studying every coded episode andusing its content to match it to its corresponding action.For example, if a user made a comment about even expo-nents, it was matched with an exploratory action whichinvolved even exponents, even if this action occurredslightly earlier. Thirteen coded episodes were discardedbecause the match was ambiguous.
Each observer individually applied the above coding cri-teria to code the audio data, and then their results werecompared. The intercoder reliability was 93% , which sug-gests a high level of objectivity in the classification scheme.Only episodes on which the coders fully agreed were usedin the rest of the analysis.
While all the factors mentioned above resulted in theelimination of data points, the factor that had the greatestimpact on the amount of data that could be obtained fromthe study was students’ willingness to verbalize theirthoughts. A number of students were incapable or unwill-ing to think aloud, even if they were periodically remindedto do so. Without such verbalization, the coders could nottell whether a student had self-explained or not. Thus, ofthe 567 exploration cases recorded in the log files for allstudents, only 149 could be classified in terms of associatedself-explanation and used to explore the correspondencebetween self-explanation, gaze information and time, asdescribed next.3
5.2.2. Time and gaze shifts as predictors of self-explanation
To analyze the relationship between time per explora-tion case and self-explanation, we first checked whetherthere was any difference between average time spent on
3 Each of the 36 participants generated at least some relevant verbal-izations, thus no student was eliminated by this process.

Fig. 4. Sample gaze shift.
Fig. 5. Excerpt of ACE log file with added gaze shift tags.
564 C. Conati, C. Merten / Knowledge-Based Systems 20 (2007) 557–574
exploration cases with self-explanation (24.7 s) and without(11.6 s). The difference is statistically significant at the 0.05level (two-tailed t-test), suggesting that time per explora-tion case is a fairly reliable indicator of self-explanation.We then used ROC curve analysis to determine the optimalthreshold to indicate sufficient time for self-explanation,which we determined to be 16 s (see [9] for more details).The reader should recall that both positive and negativeself-explanations are verbalized, so higher time for positiveself-explanation is not an artifact of verbalization.
Raw eye-tracker data was parsed by a pattern detectionalgorithm developed to detect gaze patterns we hypothe-sized to be associated with self-explanation in the plotunit.4 These patterns consist of switches of attention (‘‘gazeshifts’’) between the graph panel and the equation area. Weconsidered as gaze shifts both direct switches of attentionbetween the plot and equation regions, as well as switcheswhere the gaze moves to non-salient regions in between(indirect gaze shifts). We did so because we believe thatboth types of shifts can indicate student attention to therelationship between changes in the function equationand in its plot.5 A sample (direct) gaze shift appears inFig. 4. Here, a student’s eye gaze (shown as the dotted line)starts in some untracked area below the screen, moves tothe equation region and then hovers around the graphregion above. The data-parsing algorithm uses fixationcoordinates from the eye-tracker and matches them toappropriate ACE interface regions. Next, it searches thedata for the pattern of looking at one region and thenanother, i.e., having a gaze shift. In post-processing mode,when a gaze shift is found, a tag is placed in the ACE logfile to synchronize the switch with the appropriate explora-tion case.6
An excerpt of a synchronized log file appears in Fig. 5.Here, the user begins by typing a new value for the slopeinto the equation (line 1 in the figure).
Then several gaze shifts occur (lines 2–4). Log entries forgaze shifts only report the region where the shift originated,since the region where the gaze shifted to is implicit in thedefinition of gaze shift. So, for instance, the log entry in line2 represents an indirect gaze shift that starts from the equa-tion area, moves to an (unreported) irrelevant region (e.g.,ACE help menu on the screen or the keyboard on the table)and then ends in the graph region. The next two entriesrepresent two consecutive direct gaze shifts from the graphto the equation area and back. Next the user moves the
4 This algorithm was devised by Dave Ternes, an undergraduateresearch assistant in the computer science department at UBC.
5 Although we also believe that the distinction between direct andindirect gaze shifts may be utilized to make finer-grain inferences onstudent self-explanation, we felt we did not have enough data to explorethe differences in this work. However, we kept the distinction in the logfiles for future work.
6 In on-line processing mode, the detection of a gaze shift or lack thereofis passed as evidence to the ACE student model, as we will describe in alater section.
curve without looking down at the function region (line5). Finally, the user moves the curve again and then shiftsher gaze down to the function region and back (lines 6–8).
After the synchronized log file has been generated, aprogram merges it with the coded data from the observersto create a file containing all data for one user in a conciseform.
5.3. Results and discussion
Table 2 shows different measures of self-explanationclassification accuracy if the predictor used is: (i) the eye-tracker to detect gaze shifts; (ii) time per exploration case,where the occurrence of self-explanation is predicted if timeis greater than the 16 s threshold; (iii) a combination of thetwo, where the occurrence of self-explanation is predicted ifthere is a gaze shift or time is greater than the threshold.7
7 Note that an alternative, possibly more intuitive way to combine thetwo predictors is to use an AND condition, to catch cases where a longtime elapses because students are distracted, not because they are self-explaining. But the OR condition works better with our data because wehave few such cases. Thus, elapsed time is indeed a good predictor for thepresence of self-explanation, as we discuss later in the section.

Table 2Classification accuracy of different predictors
Eye-tracker(%)
Time(%)
Eye-tracker+ time (%)
True positive rate (sensitivity) 61.6 71.7 85.8True negative rate (specificity) 76.0 68.0 62.0
Combined accuracy 68.8 69.85 73.9
C. Conati, C. Merten / Knowledge-Based Systems 20 (2007) 557–574 565
Accuracy is reported in terms of true positive rate (i.e., per-centage of positive self-explanation cases correctly classi-fied as such, or sensitivity of the predictor), true negativerate (i.e., percentage of negative self-explanation cases cor-rectly classified as such, or the specificity of the predictor)and the average of these two accuracies. As the tableshows, time alone has a higher sensitivity than gaze shift,i.e., the episodes involving self-explanation were morelikely to take over 16 s than to include a gaze shift.8 How-ever, the eye-tracker alone has comparably higher specific-
ity, i.e., the cases without self-explanation were more likelyto involve the absence of a gaze shift than shorter time perexploration case. The two predictors have comparablecombined accuracy. Alternate analysis was performed tocheck if multiple gaze shifts would serve as a good predic-tor, with or without time. When two gaze shifts wererequired to indicate self-explanation, the specificity of theeye-tracker alone dropped to 51.7%, and the sensitivityonly rose to 79.5%, resulting in a combined accuracy of60.6%. Adding time raised the combined accuracy to67.9%, but this is still lower than the results for a singlegaze shift. Requiring more then two gaze shifts continuedto lower the sensitivity to unacceptable levels.
These results seem to suggest at first that the gain ofusing an eye-tracker is not worth the cost of adding thisinformation to the ACE model. However, there are a fewcounterarguments to this conclusion. First, it should benoted that time accuracy here is artificially high. One ofthe drawbacks of using time as a predictor of self-explana-tion is that the amount of time elapsed tells the model noth-ing about a student’s behavior between actions. During along time spent on a given case, a student may be doingor thinking of something completely unrelated to ACE.This seldom occurs in our data, as indicated by the highsensitivity of time, but it should be kept in mind that stu-dents were in a laboratory setting with little available dis-traction, in the presence of an observer and wearing arather intrusive device, making it more difficult for the stu-dents’ thoughts to wander and resulting in time being amore reliable indicator of self-explanation than it wouldbe in actual practice.
Second, the sensitivity of the eye-tracker as a predictormay be artificially low due to errors in the eye-trackingdata. Eye-tracker calibration proved very difficult for par-
8 Note that we cannot report statistical significance on these results, asthey represent individual numbers (percentages of cases classifiedcorrectly).
ticipants with heavy eyelashes or thick glasses. Theeye-tracker would function with a reading of ‘‘GOODCALIBRATION’’ or ‘‘POOR CALIBRATION’’, and forseveral subjects ‘‘POOR CALIBRATION’’ was the bestthat could be achieved. Also, calibration could sometimesbe compromised when a student sneezed or touched herface. Problems with calibration would make it more diffi-cult for the eye-tracker to detect eye movements, and thussome gaze shifts could go unrecorded. These calibrationproblems are specific to a head-mounted device and wouldlikely be less of an issue with a desk-mounted one. It shouldbe noted that when we recomputed these accuracies usingonly the data points associated with the eleven studentsout of nineteen for whom ‘‘GOOD CALIBRATION’’was achieved, sensitivity increased to 63.8%. Although thisdoes not seem like a substantial increase, the reader shouldbear in mind that it is based on only 79 episodes (about50% of the available data points) and possibly included stu-dents whose calibration was compromised during the inter-action with ACE.
Finally, combining gaze shift and time into one predic-tor substantially improves sensitivity. That is, if an actionis classified as self-explained when there is either a gazeshift or more than 16 s elapsed time, most of the self-expla-nation episodes (85.8%) are correctly recognized. Thisincrease also causes the combined accuracy to improve.
However, as sensitivity increases with the combined ORpredictor, specificity is reduced, such that only 62% of theepisodes that lack self-explanation were discovered by themodel. Here, a tradeoff appears between sensitivity andspecificity. Depending on how the system is used, it maybe more important to correctly classify self-explanationwhen it occurs than to detect the lack thereof. This is thesituation when letting natural self-explainers explore with-out interruption is given highest priority. Here, using thecombination of the eye-tracker and time data is best. Alter-natively, it may be more important to make sure that thesystem intervenes wherever it is necessary. Thus, failingto identify lack of self-explanation is a bigger problem thanfailing to detect it when it occurs. In this case, the eye-tracker alone is a more appropriate predictor, because stu-dents who need help will be more likely to get it.
There are also practical considerations. In some situa-tions an eye-tracker might not be available due its cost orother factors. Then time, which is always simple and effi-cient to measure, would be the only predictor available.However, there may also be settings in which ACE usersare surrounded by such high levels of distraction (e.g., anoisy classroom) that time would perform exceptionallypoorly. Then an eye-tracker would be preferable to presenta much more reliable picture of the focus of the student’sattention.
Given the above arguments, we felt that it is worthwhileadding eye-tracker data to the ACE model, and in such away that allows for flexibility in deciding which predictor(or combination of predictors) to use, as we describe inthe next section.

Table 3CPTs for time and gaze shift in the new model
implicitSE P (time <16 s) implicitSE P (gaze shift)
Y 0.71 Y 0.61N 0.32 N 0.24
566 C. Conati, C. Merten / Knowledge-Based Systems 20 (2007) 557–574
6. The new ace student model
Fig. 6 shows the revised student model over two timeslices, where the shaded nodes indicate the part of the modelthat we modified to include evidence from eye-tracking. Inthis model, after an exploratory action occurs (e.g., theaction represented by the node e0Case1 in slice T), time iskept and eye movements are monitored until the next action.When the next action is carried out, a new slice is created; inparallel, if the new action is not an action indicating explicitself-explanation (i.e., a selection of predefined self-explana-tions in an interface menu), an implicitSE node is createdfor the previous action in slice T, along with time, gaze shift
and tendency-to-SE nodes with the appropriate values.These new nodes are used to assess the effectiveness of theexploration case, updating the corresponding node, e0Case1,shown in Fig. 6. This update further propagates to the explo-ration of exercise (node e0 in Fig. 6) and the other relevantexploration nodes shown in Fig. 2. The second time sliceshows the addition of analogous SE nodes after the studentperforms an exploratory action corresponding to the explo-ration case e0Case2.
As Fig. 6 shows, the revised model – termed Gaze_Based
model from now on – relies on a clear separation betweenthe causes of implicit self-explanation and its effects, i.e.,gaze shifts and time on action. These effects are encodedas independent predictors, as in a naı̈ve Bayesian classifier.
The main advantage to this approach is that it is highlymodular, allowing the gaze shift and time nodes to be easilyused or ignored as needed. Modularity, along with the factthat all the variables in this part of the model are observa-ble, also facilitates learning the relevant conditional proba-bilities tables (CPTs, shown in Table 3) from frequencies inour dataset. For instance, the probability that there is agaze shift if a student self-explains (first entry on the rightin Table 3) is computed as the ratio of the number of datapoints showing both self-explanation and a gaze shift overthe total number of data points corresponding to self-
T T+1
e0
e0
e0Case1
e0Case0
e0Case2
SETendency
e 0Case2
Knowledge
Knowledge
SE Tendency
Implicit SE
e0Case0
e0Case1
time
Implicit SE
time
Gaze shift
Gaze shift
Knowledge
Fig. 6. The revised ACE student model.
explanation episodes. Similarly, the probability that timeon action is greater than 16 s if a student self-explains (firstentry on the left in Table 3) is computed as the ratio ofnumber of data points showing both self-explanation andtime greater that 16 s over the total number of data pointscorresponding to self-explanation episodes. In the previousmodel, the portion that tracks self-explanation was basedon intuition and reasonable estimates of conditionalprobabilities.
The disadvantage of this structure is that it assumesindependence between time and the presence of gaze shifts,which is not necessarily true. In fact, our data actually sug-gests a small positive correlation between the two. How-ever, similar assumptions in pure naı̈ve Bayesianclassifiers have been shown to perform surprisingly wellin practice, even when this independence cannot beguaranteed.
Note that the version of the model in Fig. 6 does notinclude the Coach’s hints to SE nodes, nor the Stimuli-to-
SE nodes shown in Fig. 3. The Coach’s hints to SE wereremoved because no hints were provided during the preli-minary user study, and thus we had no data to set the rel-evant conditional probabilities. The Stimuli-to-SE nodeswere removed because they were redundant, given thatwe were left with only one possible stimulus, the student’sSE tendency.
To determine the relationship between tendency to self-explain and implicit self-explanation, the study participantswere divided into self-explainers – those who self-explainedat least 20% of the time – and non-self-explainers – thosewho did not. We found that self-explainers and non-self-explainers self-explained 79.8% and 13.3% of the time,respectively. These frequencies were then used to set theconditional probabilities for the Implicit SE node: theprobability that there is a self-explanation episode if a stu-dent is a self-explainer was set to 0.8, while the probabilitythat there is a self-explanation episode if the student is anon-self-explainer was set to 0.1.
It should also be mentioned here that when we com-pared the average learning gain (difference from pre-testto post-test) of self-explainers and non-self-explainers, wefound a mean 24% gain for the self-explainers, against a5.7% for non-self-explainers. The difference was found tobe statistically significant at the 0.05 level (two-tailedt-test), confirming that self-explanation has a significanteffect on overall learning.
7. Testing the new student model
In this section, the performance of the new, Gaze_Based, model, is evaluated using new user data. For

C. Conati, C. Merten / Knowledge-Based Systems 20 (2007) 557–574 567
purposes of comparison, we also tested the two previousversions of the ACE model: Action_Based model, whichdoes not include self-explanation at all, and Time_Basedmodel, with time only. This allows for an assessment ofthe incremental effects of adding self-explanation and thenthe gaze data to the ACE model.
In order to gain data for model testing, we ran 18 moresubjects with the same experimental setup and data analy-sis adopted for the first study. As in the previous study,participants were university students who had not takenany college level math. This new set of subjects yielded109 exploration cases with self-explanation and 68 without,which were then used to assess the performance of the threemodels.
In the reminder of this section, we first report the accu-racy of the new model on this new data in assessing self-explanation (first subsection) and exploration (second sub-section). We then describe a cross-validation analysis wecarried out to provide a more precise picture of the overallmodel performance and stability in assessing individualstudents. In the last subsection, the model is tested usingdifferent evidence of implicit self-explanation.
Fig. 7. ROC curves for models as predictors of implicit self-explanationover training data.
Table 5
7.1. Accuracy of implicit SE assessment
To test model accuracy in assessing implicit self-expla-nation, we needed a threshold probability to decide whenan implicitSE node predicts the occurrence of self-explana-tion. We derived this probability from data from the previ-ous study, as follows. Using a simulated student program,the log files from the first study (training data) were runthrough each of the two models that do assess implicitself-explanation, e.g., the Time_Based model and theGaze_Based model. The probabilities of implicitSE nodeswere then compared against the coded data points fromthe first study. Recall that each data point corresponds toa user action classified by human coders as self-explainedor not. The implicitSE node in each model (see Figs. 3and 6) also yielded probabilities that self-explanationoccurred at the time of this action. These probabilities werecompared to coder assessments to test the predictive per-formance of each model. A small fragment of this dataappears in Table 4 below.
To determine a good threshold over implicit SE nodesfor each model, a Receiver Operating Characteristic(ROC) curve was constructed for these implicitSE proba-bilities. A ROC curve is a standard technique used inmachine learning to evaluate the extent to which an infor-
Table 4Values of implicitSE nodes corresponding to actions in study data
Action Experts SEassessment
Time_Based model(time only)
Gaze_Based model( time and gaze shifts)
1 Y 0.698 0.7232 N 0.287 0.1803 Y 0.409 0.645
mation filtering system can successfully distinguish betweenrelevant data (episodes the filter correctly classifies as posi-tive, or true positives) and noise (episodes the filter incor-rectly classifies as positive, or false positives), given achoice of different filtering thresholds.
Fig. 7 shows the ROC curves for our two models, wherethe filter is the threshold over implicit SE probabilities.From these curves, we chose for each model the thresholdthat optimizes the tradeoff between true positive rate andfalse positive rate, as is standard practice in machinelearning. These thresholds are marked by an asterisk inFig. 7.
Next, the user log files from the new study (test data)were run through each model. Using the thresholds foundfrom the training set, the model’s implicitSE nodes weretested for accuracy against the new set of coded data. Table5 shows the sensitivity, specificity and combined accuracyfor the two models.
Here, the addition of the eye-tracker causes an increasein each of the measures, with the increase being more sub-stantial for specificity. This is consistent with the assump-tion, supported by data in the first study, that the use ofeye-tracking will catch many of the false positives inherentin the use of time as a predictor. To further compare theaccuracy of the two models, we generated the ROC curvesof their performance as predictors of implicit SE over thenew data set (Fig. 8).
Accuracies of implicitSE nodes
Time_Based model(time only) (%)
Gaze_Based model(time and gaze shifts) (%)
True positive rate(sensitivity)
65.1 71.6
True negative rate(specificity)
62.6 74.3
Combined 63.9 73.0
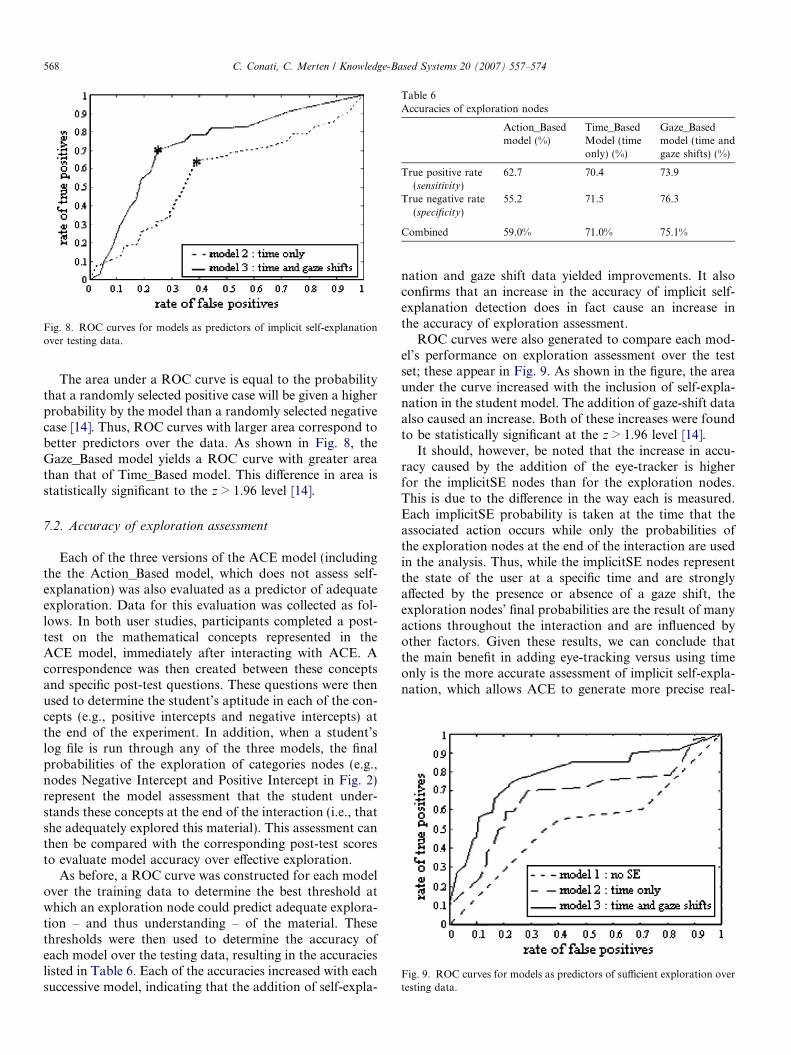
Fig. 8. ROC curves for models as predictors of implicit self-explanationover testing data.
Table 6Accuracies of exploration nodes
Action_Basedmodel (%)
Time_BasedModel (timeonly) (%)
Gaze_Basedmodel (time andgaze shifts) (%)
True positive rate(sensitivity)
62.7 70.4 73.9
True negative rate(specificity)
55.2 71.5 76.3
Combined 59.0% 71.0% 75.1%
568 C. Conati, C. Merten / Knowledge-Based Systems 20 (2007) 557–574
The area under a ROC curve is equal to the probabilitythat a randomly selected positive case will be given a higherprobability by the model than a randomly selected negativecase [14]. Thus, ROC curves with larger area correspond tobetter predictors over the data. As shown in Fig. 8, theGaze_Based model yields a ROC curve with greater areathan that of Time_Based model. This difference in area isstatistically significant to the z > 1.96 level [14].
Fig. 9. ROC curves for models as predictors of sufficient exploration overtesting data.
7.2. Accuracy of exploration assessment
Each of the three versions of the ACE model (includingthe the Action_Based model, which does not assess self-explanation) was also evaluated as a predictor of adequateexploration. Data for this evaluation was collected as fol-lows. In both user studies, participants completed a post-test on the mathematical concepts represented in theACE model, immediately after interacting with ACE. Acorrespondence was then created between these conceptsand specific post-test questions. These questions were thenused to determine the student’s aptitude in each of the con-cepts (e.g., positive intercepts and negative intercepts) atthe end of the experiment. In addition, when a student’slog file is run through any of the three models, the finalprobabilities of the exploration of categories nodes (e.g.,nodes Negative Intercept and Positive Intercept in Fig. 2)represent the model assessment that the student under-stands these concepts at the end of the interaction (i.e., thatshe adequately explored this material). This assessment canthen be compared with the corresponding post-test scoresto evaluate model accuracy over effective exploration.
As before, a ROC curve was constructed for each modelover the training data to determine the best threshold atwhich an exploration node could predict adequate explora-tion – and thus understanding – of the material. Thesethresholds were then used to determine the accuracy ofeach model over the testing data, resulting in the accuracieslisted in Table 6. Each of the accuracies increased with eachsuccessive model, indicating that the addition of self-expla-
nation and gaze shift data yielded improvements. It alsoconfirms that an increase in the accuracy of implicit self-explanation detection does in fact cause an increase inthe accuracy of exploration assessment.
ROC curves were also generated to compare each mod-el’s performance on exploration assessment over the testset; these appear in Fig. 9. As shown in the figure, the areaunder the curve increased with the inclusion of self-expla-nation in the student model. The addition of gaze-shift dataalso caused an increase. Both of these increases were foundto be statistically significant at the z > 1.96 level [14].
It should, however, be noted that the increase in accu-racy caused by the addition of the eye-tracker is higherfor the implicitSE nodes than for the exploration nodes.This is due to the difference in the way each is measured.Each implicitSE probability is taken at the time that theassociated action occurs while only the probabilities ofthe exploration nodes at the end of the interaction are usedin the analysis. Thus, while the implicitSE nodes representthe state of the user at a specific time and are stronglyaffected by the presence or absence of a gaze shift, theexploration nodes’ final probabilities are the result of manyactions throughout the interaction and are influenced byother factors. Given these results, we can conclude thatthe main benefit in adding eye-tracking versus using timeonly is the more accurate assessment of implicit self-expla-nation, which allows ACE to generate more precise real-

C. Conati, C. Merten / Knowledge-Based Systems 20 (2007) 557–574 569
time interventions during the student’s interaction with thesystem.
7.3. Cross-validation analysis
We conducted a cross-validation analysis to get a betterpicture of how the various models performed on individualstudents. For each student model, leave-one-out cross-val-idation was performed using all 36 students from bothstudies. This involved isolating a student and then settingmodel thresholds and conditional probabilities using thedata from all remaining students. This procedure was per-formed for each of the 36 students, and the accuracy resultsfrom each student were averaged.
We started the analysis by assigning a generic priorprobability of 0.5 to knowledge and tendency to SE nodesin each set. The mean combined accuracies and the stan-dard deviations for the implicitSE nodes for each modelwith generic priors are given in the first row of Table 7.These values show improved performance with the addi-tion of the eye-tracker as well as slightly higher stability.The performance difference is statistically significant atthe 0.05 level (one-tailed t-test).
The first row of Table 8 shows analogous results for theexploration nodes. As before, there is an improvement inmean accuracy with each successive model. ANOVA anal-ysis showed statistical significance in the differences within
Table 7Cross-validation results for ImplicitSE nodes for different models andpriors
Time_Basedmodel (%)
Gaze_Basedmodel (%)
Generic priors Combinedaccuracy
62.1 71.6
SD 8.1 7.9Customized knowledge
node priorsCombinedaccuracy
65.8 75.2
SD 7.4 7.2Customized knowledge
and SE tendencynode priors
Combinedaccuracy
67.2 76.4
SD 7.6 7.1
Table 8Cross-validation results for ImplicitSE nodes for different models andpriors
Action_Basedmodel (%)
Time_Basedmodel (%)
Gaze_Basedmodel (%)
Generic priors Combinedaccuracy
57.3 65.3 71.6
SD 11.6 9.4 8.7Customized
knowledgenode priors
Combinedaccuracy
64.7 69.9 76.8
SD 10.1 9.3 8.4Customized
knowledge andSE tendencynode priors
Combinedaccuracy
68.4 70.4 77.5
SD 9.2 10.3 7.9
the set of mean accuracies, and a one-tailed t-tests showedthat the differences between each model are statisticallysignificant.
We then looked at the influence of assigning student tai-lored priors on each model’s performance. Knowledgenode priors were set based on each participant’s perfor-mance on the study pre-test. If the student answered thecorresponding pre-test items correctly, a prior probabilityof 0.85 was assigned to the corresponding knowledge node.Otherwise, the probability was set to 0.15. These valueswere chosen as reasonable estimates since they are closeto 1 and 0, but they still allow for those students who guesscorrectly or make errors even though they understand theconcept. Also, early analysis showed that the model isnot sensitive to small changes in these prior probabilities(e.g., using 0.9 and 0.1 instead).
Cross-validation was then performed again using cus-tomized prior probabilities for knowledge nodes. The meanaccuracies for the implicitSE nodes appear in the secondrow of Table 7. While customizing these prior probabilitiescauses an increase in accuracy and stability for each model,this increase was statistically significant only for the modelthat uses time and gaze shifts to detect self-explanation.Results with customized priors are also given for the explo-ration nodes in the second row of Table 8. Here, the cus-tomization causes a statistically significant increase in themean accuracy for each model, as well as an increase instability.
Priors for the tendency to SE node were derived fromour previously discussed classification of study participantsinto self-explainers – those who self-explained at least 20%of the time – and non-self-explainers – those who did not.If a student was classified as a self-explainer, the priorprobability for her tendency to SE node was set to 0.85,while for a non-self-explainer, a value of 0.15 was used(these values were arbitrarily picked after trying a few forboth the high and low probabilities and realizing that themodel was not sensitive to small changes over them).Repeating the cross-validation procedure using tailoredpriors for both knowledge and Tendency to SE nodesyielded the results given in the third rows of Tables 7 and8. In each case, for each model the improvement broughtabout by the customization of the Tendency to SE nodefailed to achieve statistical significance, showing that themodel is not very sensitive to this parameter. However,we believe it is still worth keeping this node in the model,for two reasons. First, it provides ACE with an extra pieceof information on potential causes of poor exploration by astudent (i.e., low self-explanation tendency). Second, itsinfluence may become more relevant in the presence ofthe ‘‘coach hint to self-explain’’ node, which we plan toadd as an additional cause of implicit self-explanation oncewe add data on the effect of these hints on studentbehavior.
In summary, we found that adding eye-tracking to thestudent model causes a statistically significant improve-ment in the assessment of both implicit self-explanation

570 C. Conati, C. Merten / Knowledge-Based Systems 20 (2007) 557–574
and sufficient exploration. It is also advantageous to usepre-test results, if available, to customize the prior proba-bilities of the knowledge nodes. Tailoring the tendency toSE prior probabilities, however, fails to bring about a sig-nificant improvement.
7.4. Performance with different evidence
This section illustrates how the new model’s(Gaze_Based model) performance changes depending uponthe type of evidence used (time alone, gaze shifts alone orboth).
The log files of the new study participants were runthrough the new model two more times, once withholdingeye-tracking data, once withholding time data. For eachrun, the accuracy of the model’s assessment over implicitself-explanation and exploration were computed asdescribed earlier, yielding the results in Table 9. For pur-poses of comparison, the table also repeats the accuraciesof the model that receives evidence from both time andgaze shifts. As shown in the table, information on timealone generates higher sensitivity than information on gazeshifts alone, while the latter generates higher specificity.These findings match those of the original user study [9].They are also consistent with the assumption that timeoverestimates self-explanation behavior by assuming thatthe user spends all idle time considering the exploration.For each measure, the combined predictor outperformseither on its own.
A similar analysis was performed to assess the influenceof evidence type over exploration assessment, with resultsreported in Table 10. As with the implicitSE nodes, infor-mation on time alone has a higher sensitivity than usingonly gaze shifts. However, gaze shifts alone achieve higher
Table 9ImplicitSE accuracies for ACE Gaze_Based model using different predic-tors as evidence of implicit self-explanation
Timeevidenceonly (%)
Eye-trackingevidenceonly (%)
Time andeye-trackingevidence (%)
True positive rate(sensitivity)
67.9 62.3 71.6
True negative rate(specificity)
64.8 67.8 74.3
Combined 66.3 65.1 73.0
Table 10Exploration accuracies for ACE Gaze_Based model using differentpredictors as evidence of implicit self-explanation
Time evidenceonly (%)
Eye-trackingevidenceonly (%)
Time andeye-trackingevidence (%)
True positive rate(sensitivity)
71.2 69.8 73.9
True negative rate(specificity)
72.9 73.4 76.3
Combined 72.1 71.6 75.1
specificity. These predictors combine to yield the highestaccuracy for each measure. This is due to the fact thataccuracy improves with more evidence used. It should alsobe noted that each single predictor seems to succeed wherethe other fails, so this complementary behavior likely con-tributes to the high accuracy of the combined predictor.
Notably, the accuracies generated by the new model whenonly time information is used are comparable to (althoughslightly higher than) the accuracies of the Time_Basedmodel, despite the differences in structure and method ofCPT definition (data-based for the Gaze_Based model andexpert-based for the Time_Based model).
7.5. Pupil dilation as predictor of self-explanation
In the previous sections, we showed that gaze-patterninformation as detected by an eye-tracker can improvereal-time assessment of user self-explanation, and conse-quent exploration behavior, during interaction with anELE. The eye-tracker we used also records user pupil sizeduring fixations. Pupil size has been shown to have a posi-tive correlation with cognitive load. Since self-explanationrequires cognitive effort that may increase a user’s cognitiveload, we wanted to check whether we could use pupil sizeas an additional means of detecting self-explanation inthe ACE student model. In this section, we describe theresults of this investigation.
7.6. Data collection
In the user studies described in previous sections, theeye-tracker generated a log file containing, in addition togaze data, the diameter of the user’s pupil throughout theinteraction.
Several factors are known to influence pupil size in addi-tion to cognitive load [4], including ambient lighting, thesize of the eye itself and even nonvisual stimuli such assound. Since it is not possible to keep environmental con-ditions adequately constant from one study session to thenext or to ensure that users have similar pupils, it is com-mon practice to use normalization to get a pure correlationbetween pupil size and cognition. One standard normaliza-tion method [28] involves taking a baseline measurement ata time when all users should have the same cognitive state.This baseline encapsulates all information regarding eachuser’s pupil attributes, as well as environmental conditions.When the baseline is subtracted from all other pupil sizevalues it yields a normalized measure that can then be com-pared across users.
We collected baseline measurements for all 18 subjectsin the second ACE study. Participants were asked to turnoff the computer monitor and stare at the blank screenfor a few seconds after completing their interaction withACE. This baseline was chosen because it was assumedthat sitting idle while staring at the same visual stimulusat the close of the interaction with ACE would bring theparticipants to the same cognitive state.
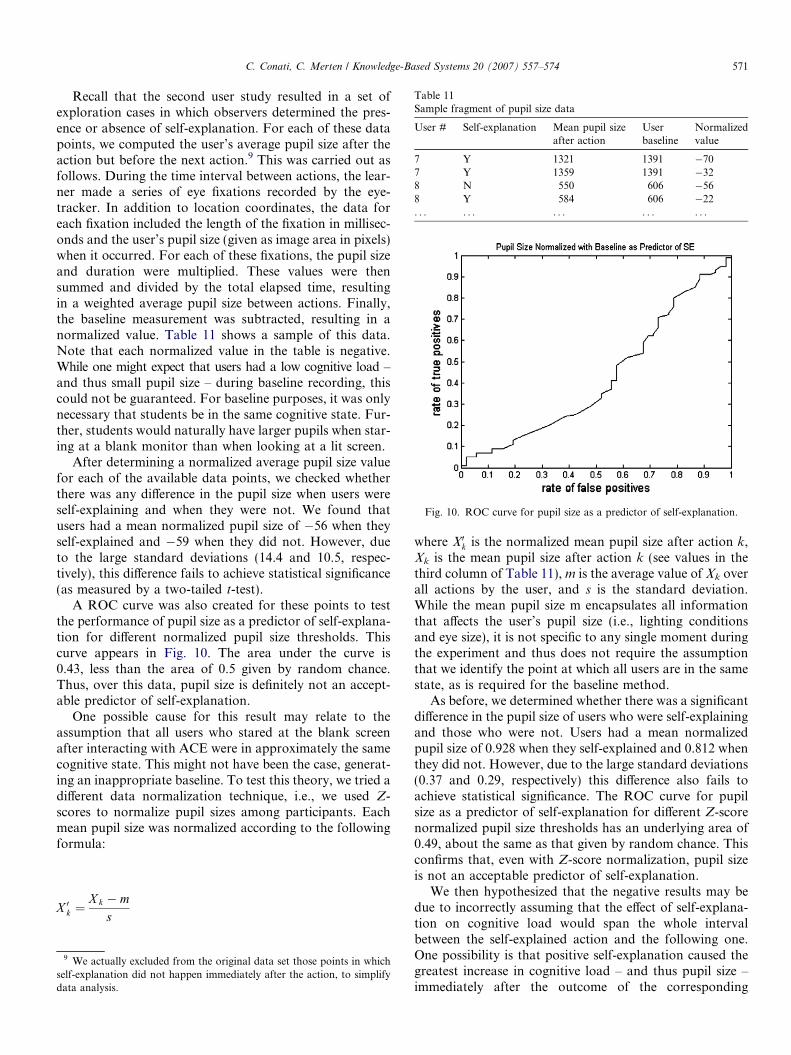
Fig. 10. ROC curve for pupil size as a predictor of self-explanation.
Table 11Sample fragment of pupil size data
User # Self-explanation Mean pupil sizeafter action
Userbaseline
Normalizedvalue
7 Y 1321 1391 �707 Y 1359 1391 �328 N 550 606 �568 Y 584 606 �22. . . . . . . . . . . . . . .
C. Conati, C. Merten / Knowledge-Based Systems 20 (2007) 557–574 571
Recall that the second user study resulted in a set ofexploration cases in which observers determined the pres-ence or absence of self-explanation. For each of these datapoints, we computed the user’s average pupil size after theaction but before the next action.9 This was carried out asfollows. During the time interval between actions, the lear-ner made a series of eye fixations recorded by the eye-tracker. In addition to location coordinates, the data foreach fixation included the length of the fixation in millisec-onds and the user’s pupil size (given as image area in pixels)when it occurred. For each of these fixations, the pupil sizeand duration were multiplied. These values were thensummed and divided by the total elapsed time, resultingin a weighted average pupil size between actions. Finally,the baseline measurement was subtracted, resulting in anormalized value. Table 11 shows a sample of this data.Note that each normalized value in the table is negative.While one might expect that users had a low cognitive load –and thus small pupil size – during baseline recording, thiscould not be guaranteed. For baseline purposes, it was onlynecessary that students be in the same cognitive state. Fur-ther, students would naturally have larger pupils when star-ing at a blank monitor than when looking at a lit screen.
After determining a normalized average pupil size valuefor each of the available data points, we checked whetherthere was any difference in the pupil size when users wereself-explaining and when they were not. We found thatusers had a mean normalized pupil size of �56 when theyself-explained and �59 when they did not. However, dueto the large standard deviations (14.4 and 10.5, respec-tively), this difference fails to achieve statistical significance(as measured by a two-tailed t-test).
A ROC curve was also created for these points to testthe performance of pupil size as a predictor of self-explana-tion for different normalized pupil size thresholds. Thiscurve appears in Fig. 10. The area under the curve is0.43, less than the area of 0.5 given by random chance.Thus, over this data, pupil size is definitely not an accept-able predictor of self-explanation.
One possible cause for this result may relate to theassumption that all users who stared at the blank screenafter interacting with ACE were in approximately the samecognitive state. This might not have been the case, generat-ing an inappropriate baseline. To test this theory, we tried adifferent data normalization technique, i.e., we used Z-scores to normalize pupil sizes among participants. Eachmean pupil size was normalized according to the followingformula:
X 0k ¼X k � m
s
9 We actually excluded from the original data set those points in whichself-explanation did not happen immediately after the action, to simplifydata analysis.
where X0k is the normalized mean pupil size after action k,Xk is the mean pupil size after action k (see values in thethird column of Table 11), m is the average value of Xk overall actions by the user, and s is the standard deviation.While the mean pupil size m encapsulates all informationthat affects the user’s pupil size (i.e., lighting conditionsand eye size), it is not specific to any single moment duringthe experiment and thus does not require the assumptionthat we identify the point at which all users are in the samestate, as is required for the baseline method.
As before, we determined whether there was a significantdifference in the pupil size of users who were self-explainingand those who were not. Users had a mean normalizedpupil size of 0.928 when they self-explained and 0.812 whenthey did not. However, due to the large standard deviations(0.37 and 0.29, respectively) this difference also fails toachieve statistical significance. The ROC curve for pupilsize as a predictor of self-explanation for different Z-scorenormalized pupil size thresholds has an underlying area of0.49, about the same as that given by random chance. Thisconfirms that, even with Z-score normalization, pupil sizeis not an acceptable predictor of self-explanation.
We then hypothesized that the negative results may bedue to incorrectly assuming that the effect of self-explana-tion on cognitive load would span the whole intervalbetween the self-explained action and the following one.One possibility is that positive self-explanation caused thegreatest increase in cognitive load – and thus pupil size –immediately after the outcome of the corresponding

Fig. 11. Hypothetical pupil size plotted over the time interval when it islargest at (a) the beginning and (b) at the beginning or the end (b). In (b),dotted lines indicate the middle 60% of the time interval.
572 C. Conati, C. Merten / Knowledge-Based Systems 20 (2007) 557–574
exploratory action. In this case, examining the weightedmean pupil size over the whole time interval betweenactions would fail to capture this behavior, as the pupil sizeincrease would be dissipated by the smaller pupil size val-ues at the end of the time interval. Fig. 11(a) shows a plotof the hypothetical pupil size in this case. Another possibil-ity is that the greatest increase in cognitive load occurred atthe end of the time interval, after the user had noticed theaction outcome and had time to consider its meaning.These two cases appear together in Fig. 11(b). In eithercase, taking the mean pupil size over only the middle por-tion of the interval, as shown in the figure, would best cap-ture the pupil size increase.
To test this theory, we calculated normalized weightedpupil sizes (using Z-score normalization) over only themiddle 60% of each time interval. With this new measure,users had a mean normalized pupil size of 0.861 whenself-explaining and a mean pupil size of 0.794 otherwise.The difference of these means still failed to reach statisticalsignificance. The area under the ROC curve for this datawas found to be 0.41, again less than that which wouldhave resulted from random chance.
8. Discussion
The results discussed in the above section provide an ini-tial indication that pupil dilation may not be a good predic-tor of self-explanation. This could be due to two reasons.The first is the inadequacy of pupil dilation as a detectorof the differences in cognitive loads generated by presenceor absence of self-explanation. The second is that such dif-ferences are not substantial enough to be detectable. Ourdata does not provide conclusive evidence to discriminatebetween the two explanations, nor are we aware of anycognitive science research on the relationship betweenself-explanation and cognitive load that may provideinsights into this issue. However, the large standard devia-tions we found in all of the different cognitive load mea-sures we tried speak in favor of the second hypothesis.That is, there seem to be cases when users were not self-explaining but their cognitive load was relatively high, per-haps because of the very fact that they were interactingwith a complex system or thinking about mathematical
functions. The rather intrusive eye-tracker may have alsointerfered with some of the subjects’ thinking, thus workingas an external cause of increased cognitive load. It is alsopossible that for some of the study participants, the spon-taneous self-explainers in particular, self-explanationcomes quite naturally and thus does not involve an increasein cognitive load significant enough to be reflected in theirpupil size.
Note that support for the first hypothesis, i.e., that pupilsize is not always a good predictor of cognitive load, maycome from the findings in [27]. This work described a studythat failed to show a correlation between pupil size and thedifficulty of text subjects were asked to read. One couldconclude from these results that pupil size is not a goodpredictor of cognitive load during reading tasks if the read-ing tasks in the study did indeed cause detectable cognitiveload differences. This was not necessarily the case, however.The different texts used were classified as easy or difficultoverall but, being quite long, may have had passages ofvarying difficulty. Thus, subjects’ cognitive load may havesignificantly fluctuated within each reading task, makingit impossible to detect any significant differences when theload was measured over the complete task.
9. Discussion and future work
In this paper, we have presented research on using real-time eye-tracking data for the on-line modeling of user self-explanation and effective exploration, two meta-cognitivebehaviors relevant for student learning during interactionwith ACE, an exploratory learning environment for math-ematical functions. The goal is to enable the environmentto provide adaptive support to improve these meta-cogni-tive behaviors and consequent student learning.
The main contribution of the paper is a formal evalua-tion showing that the model including eye-tracking infor-mation on user gaze shifts provides a more accurateassessment of student self-explanation than a model usingonly time as a lower-level predictor. Our evaluation alsoshows that modeling self-explanation improves the assess-ment of student exploratory behavior, as opposed to rely-ing only on student interface actions. This result supportsthe argument that modeling high-level user traits canimprove the adaptive capability of an Intelligent UserInterface, providing an initial justification for the effortinvolved in this type of sophisticated user modeling.
One of the avenues of future work in this research is tofurther explore gaze-tracking as a predictor of self-explana-tion and effective exploration by considering additionalgaze patterns in addition to the gaze shifts discussed in thispaper. We have started to investigate the distinctionbetween direct and indirect gaze shifts by using unsuper-vised machine learning (clustering) on these two gaze pat-terns in conjunction with all ACE interface actions (notonly plot and equation changes considered in this paper).This enabled us to identify clusters of students with similarinteraction behaviors and learning outcomes [2]. While

C. Conati, C. Merten / Knowledge-Based Systems 20 (2007) 557–574 573
intuition suggests that indirect gaze shifts may indicate stu-dent distraction, our preliminary results show that they area better predictor of effective exploration than direct gazeshifts. Although our finding that direct gaze shifts seemto be less informative than indirect ones may be an artifactof the available data points, the fact that indirect gazeshifts do correlate with effective exploration shows thatthey generally do not indicate distraction, consistent withwhat we had assumed in the research presented here. How-ever, these findings are based on the data set collected inthe constrained laboratory setting described in this paper.It will be interesting to investigate if and how they transferto a more natural, noisy environment where it is easier for astudent to be distracted.
Another question that we are planning to address infuture research is whether gaze patterns other than gazeshifts can predict effective exploration. For instance, whatif the student does not shift between the graph and plotregions, but looks at one of them for a while? Can this indi-cate self-explanation? Since the space of potentially mean-ingful patterns can be rather large and some of them maybe unintuitive, we are planning to use unsupervised cluster-ing to mine gaze data for these patterns.
In this paper, we have also presented results on the per-formance of pupil dilation as a predictor of self-explana-tion. The rationale behind investigating this predictorrelies on the link that has been found between pupil sizeand cognitive load, and on the assumption that self-expla-nation may generate detectably higher cognitive load thanlack of it. Our findings, however, suggest that pupil size isnot a reliable predictor of self-explanation, at least duringinteraction with ACE.
The final proof of the utility of rich user models mustcome from empirical evidence that adaptive intelligentinterfaces based on these models improve user perfor-mance. The next step in our research is to provide thisempirical evidence for ACE. We have designed a varietyof interface tools that allow ACE to provide different levelsof prompting for both exploration and self-explanation byrelying on the assessment of the student model describedhere. We are in the process of designing a user study to testthe effectiveness of these adaptive tools. One of the goals ofthe study will be to gain better insight on the distinctionbetween explicit and implicit self-explanation, in particularon their relative frequency and on how much is gained bybeing able to detect implicit over explicit self-explanation,which is significantly easier to detect.
A longer-term research avenue is to investigate how theresults presented in this paper generalize to other tasks anddomains. For instance, Conati and Vanlehn [10] proposeda system that tracks user self-explanation of examples dur-ing problem solving of physics problems by making eachindividual example line visible only if the student movesthe mouse over it. This allowed the system to gather dataon the latency of student attention for each uncovered line,which was then used as a prediction of self-explanation inthe system’s user model. We are planning to substitute
the mouse-based tracking mechanism with an eye-trackerto ascertain how much more information it can provideon useful user gaze patterns, as well as to compare thetwo interfaces in terms of user disruption.
Acknowledgments
We thank the National Science and EngineeringResearch Council of Canada (NSERC) for funding thisresearch. We also would like to thank David Ternes forwriting the algorithm that parses raw eye-tracker data,Kasia Muldner for helping with the user studies, andGiuseppe Carenini for his insights on ROC curve analysis.
References
[1] V. Aleven, K.R. Koedinger, An effective meta-cognitive strategy:learning by doing and explaining with a computer-based cognitivetutor, Cognitive Science 2 (2) (2002) 147–179.
[2] S. Amershi, C. Conati, Unsupervised and supervised machinelearning in user modeling for intelligent Learning Environments, in:Intelligent User Interfaces, 2007.
[3] M. Bassok, Transfer of domain-specific problem-solving procedures,Journal of Experimental Psychology: Learning, Memory and Cogni-tion 16 (3) (1990) 522–533.
[4] J. Beatty, Task-evoked pupillary responses, processing load, and thestructure of processing resources, Psychological Bulletin 91 (1982) 276–292.
[5] A. Bunt, C. Conati, Probabilistic student modeling to improveexploratory behaviour, Journal of User Modeling and User AdaptedInteraction 13 (3) (2003) 269–309.
[6] A. Bunt, C. Conati, K. Muldner, Scaffolding Self-explanation toimprove learning in exploratory learning environments, in: 7thInternational Conference on Intelligent Tutoring Systems, 2004.
[7] M.T.H. Chi, Constructing Self-explanations and scaffolded explana-tions in tutoring, Applied Cognitive Psychology 10 (1996) S33–S49.
[8] M.T.H. Chi, M. Bassok, M.W. Lewis, P. Reimann, R. Glaser, Self-explanations: How students study and use examples in learning tosolve problems? Cognitive Science 15 (1989) 145–182.
[9] C. Conati, C. Merten, K. Muldner, D. Ternes, Exploring eye trackingto increase bandwidth in user modeling, in: 10th Annual Conferenceon User Modeling, 2005.
[10] C. Conati, K. Vanlehn, Toward computer-based support of meta-cognitive skills: a computational framework to coach self-explanation,International Journal of Artificial Intelligence in Education 11 (2000).
[11] T. De Jong, R. Van Joolingen, Scientific discovery learning withcomputer simulations of conceptual domains, Review of EducationalResearch 68 (179–201) (1998).
[12] T. Dean, K. Kanazawa, A model for reasoning about persistence andcausation, Computational Intelligence 5 (3) (1989) 142–150.
[13] D. Decarlo, A. Santella, Stylization and abstraction of photographs,in: 29th Annual Conference on Computer Graphics and InteractiveTechniques, 2002, pp. 769–776.
[14] J. Fogarty, R. Baker, S. Hudson, Case studies in the use of roc curveanalysis for sensor-based estimates in human–computer interaction,in: Graphics Interface, 2005, pp. 129–136.
[15] K.A. Gluck, J.R. Anderson, What role do cognitive architectures playin intelligent tutoring systems? in: D. Klahr, S.M. Carver (Eds.),Cognition and Instruction: Twenty-Five Years of Progress, Erlbaum,2001, pp. 227–262.
[16] A.J. Hornof, A. Cavender, R. Hoselton, Eyedraw: A system fordrawing pictures with eye movements, in: ASSETS 2004’’ The SixthInternational ACM SIGACCESS Conference on Computers andAccessibility, 2004, pp. 86–93.
[17] S.T. Iqbal, B.P. Bailey, Using eye gaze patterns to identify user tasks,The Grace Hopper Celebration of Women in Computing (2004).

574 C. Conati, C. Merten / Knowledge-Based Systems 20 (2007) 557–574
[18] S.T. Iqbal, X.S. Zheng, B.P. Bailey, Task-evoked pupillary response tomental workload in human–computer interaction, in: ACM Confer-ence on Human Factors in Computing Systems, 2004, pp. 1477–1480.
[19] R. Jakob, The Use of eye movements in human–computer interactiontechniques: What you look at is what you get, 1998, pp. 65–83.
[20] P. Majaranta, A. Aula, K.-J. Raiha, Effects of feedback on eye typingwith a short dwell time, in: Symposium on Eyetracking Research andApplications, 2004, pp. 139–146.
[21] T. Mitrovic, Supporting self-explanation in a data normalizationtutor, in: Supplementary Proceedings of AIED2003, 2003.
[22] R.A. Monty, J.W. Senders (Eds.), Eye Movements and PsychologicalProcesses, Lawrence Erlbaum Associates, Hillsdale, New Jersey, 1976.
[23] M. Njoo, T.D. Jong, Exploratory learning with a computer simula-tion for control theory: learning processes and instructional support,Journal of Research in Science Teaching 30 (8) (1993) 821–844.
[24] L. Qu, L. Johnson, Detecting the learner’s motivational states in aninteractive learning environment, in: 12th International Conferenceon Artificial Intelligence in Education, 2005.
[25] A. Renkl, Learning mathematics from worked-out examples: analyz-ing and fostering self-explanation, European Journal of Psychologyand Education, in press.
[26] D. Salvucci, J. Anderson, Intelligent gaze-added interfaces, in:SIGHCI Conference on Human Factors in Computing Systems, 2000.
[27] M. Schiessl, S. Duda, A. Tholke, R. Fischer, Eye tracking and itsapplication in usability and media research, ‘‘Sonderheft: Blickbewe-gung’’ in MMI-interaktiv Journal 6 (2003).
[28] H. Schultheis, A. Jameson, Assessing cognitive load in adaptivehypermedia systems: physiological and behavioral methods, in:Adaptive Hypermedia, 2004, pp. 225–234.
[29] V.J. Shute, A comparison of learning environments: All that glitters,in: S. Lajoie, S. Derry (Eds.), Computers as Cognitive Tools,Lawrence Erlbaum Associates, Hillsdale, NJ, 1993, pp. 47–73.
[30] V.J. Shute, R. Glaser, A large-scale evaluation of an intelligentdiscovery world, Interactive Learning Environments 1 (1990) 51–76.
[31] J.L. Sibert, M. Gokturk, R.A. Lavine, The reading assistant: Eye gazetriggered auditory prompting for reading remediation, in: 13th
Annual ACM Symposium on User Interface Software and Technol-ogy, 2000.
[32] I. Starker, R.A. Bolt, A gaze-responsive self-disclosing display, CHI:Human Factors in Computing Systems, 1990.
Cristina Conati, Dr. Conati is an Associate Pro-fessor of Computer Science at the University ofBritish Columbia. She received a ‘‘Laurea’’ degree(M.Sc. equivalent) in Computer Science at theUniversity of Milan, Italy (1988), as well as aM.Sc. (1996) and Ph.D. (1999) in Artificial Intel-ligence in Intelligent Systems at the University ofPittsburgh. Dr. Conati’s research goal is to inte-grate research in Artificial Intelligence (AI), Cog-nitive Science and Human Computer Interaction(HCI) to make complex interactive systems
increasingly more effective and adaptive to the users’ needs. Her areas of
interest include Adaptive Interfaces, Intelligent Tutoring Systems, UserModeling, and Affective Computing. Dr. Conati has served on programcommittees and as a reviewer for major AI and HCI conferences/journals.She published over 40 strictly referred articles, and her research hasreceived awards from the International Conference on User Modeling, theInternational Conference of AI in Education and the Journal of UserModeling and User Adapted Interaction.Christina Merten, Christina Merten earned aM.Sc. in Mathematics at the University of Wash-ington (2003) in Seattle and then completed aM.Sc. in Computer Science at the University ofBritish Columbia (2006). Her research at UBCfocused on user modeling and intelligent userinterfaces. She currently works as a softwaredesign engineer for Microsoft Office Project.