ezh2 inhibition blocks multiple myeloma cell growth...
TRANSCRIPT

1
EZH2 inhibition blocks multiple myeloma cell growth through upregulation of
epithelial tumor suppressor genes
Henar Hernando1,2, Kathy A. Gelato1,2, Ralf Lesche1,2, Georg Beckmann1,2, Silke Koehr1,2, Saskia Otto1,2,
Patrick Steigemann1,2 and Carlo Stresemann1,2,3
1 From the Global Drug Discovery, Bayer Pharma AG, 13353 Berlin, Germany.
Running title: Characterization of EZH2 inhibitors in multiple myeloma
Keywords: EZH2, Multiple Myeloma, Epigenetic, Cancer Therapy and Reactivation of gene expression.
Abbreviations list: MM (Multiple Myeloma), BM (Bone Marrow), EZH2 (Enhancer of Zeste Homolog 2),
PRC2 (Polycomb Repressive Complex 2), H3 (Histone 3), K (lysine), KDM6A, UTX (lysine-specific
demethylase 6A), MMSET (Methyltransferase Multiple Myeloma SET domain), SAM (S-
adenosylmethionin), ELISA (Enzyme-linked immunosorbent assay), qRT-PCR (quantitative real time
polymerase chain reaction), JMJD3 (Jumonji Domain Containing 3), ChIP( Chromatin
Immunoprecipitation), TSS (transcription start site), p.o. (oral administration), BID (twice a day), EMT
(epithelial-mesenchymal transition), ECM (extracellular matrix)
2 Financial & competing interests disclosure: All authors are employees of Bayer Pharma AG, and the
research work was conducted under the employment of Bayer Pharma AG.
3 Corresponding author: Carlo Stresemann, Global Drug Discovery, Bayer Pharma AG, Müllerstr. 178,
13353 Berlin, Germany. E-mail: [email protected]
210-word abstract
5,000 total words of text (exclusive of references)
50 references
6 total figures
on September 6, 2018. © 2015 American Association for Cancer Research. mct.aacrjournals.org Downloaded from
Author manuscripts have been peer reviewed and accepted for publication but have not yet been edited. Author Manuscript Published OnlineFirst on November 20, 2015; DOI: 10.1158/1535-7163.MCT-15-0486

2
ABSTRACT
Multiple myeloma is a plasma cell malignancy characterized by marked heterogeneous genomic
instability including frequent genetic alterations in epigenetic enzymes. In particular the histone
methyltransferase Enhancer of Zeste Homolog 2 (EZH2) is overexpressed in multiple myeloma. EZH2 is
the catalytic component of the polycomb repressive complex 2 (PRC2), a master transcriptional regulator
of differentiation. EZH2 catalyzes methylation of lysine 27 on histone H3 and its de-regulation in cancer
has been reported to contribute to silencing of tumor suppressor genes, resulting in a more
undifferentiated state, and thereby contributing to the multiple myeloma phenotype. In this study we
propose the use of EZH2 inhibitors as a new therapeutic approach for the treatment of multiple
myeloma. We demonstrate that EZH2 inhibition causes a global reduction of H3K27me3 in multiple
myeloma cells, promoting re-expression of EZH2 repressed tumor suppressor genes in a subset of cell
lines. As a result of this transcriptional activation, multiple myeloma cells treated with EZH2 inhibitors
become more adherent and less proliferative compared to untreated cells. The anti-tumor efficacy of
EZH2 inhibitors is also confirmed in vivo in a multiple myeloma xenograft model in mice. Together our
data suggests that EZH2 inhibition may provide a new therapy for multiple myeloma treatment, and a
promising addition to current treatment options.
on September 6, 2018. © 2015 American Association for Cancer Research. mct.aacrjournals.org Downloaded from
Author manuscripts have been peer reviewed and accepted for publication but have not yet been edited. Author Manuscript Published OnlineFirst on November 20, 2015; DOI: 10.1158/1535-7163.MCT-15-0486
3
INTRODUCTION
Multiple myeloma (MM) is a plasma cell malignancy characterized by abnormal proliferation of clonal
plasma cells in the bone marrow (BM), typically accompanied by the secretion of defective monoclonal
immunoglobulins (1). Current therapies that have improved the outcome of patients include the
proteasome inhibitor bortezomib and immunomodulatory drugs such as thalidomide and lenalidomide
(2). Nevertheless MM remains an incurable disease with a high rate of relapse and development of drug
resistance, and a median survival of less than 5 years (3). The BM microenvironment plays a pivotal role
in MM proliferation, survival, migration, and resistance to drugs, protecting cells from the cytotoxic
effects of chemotherapy and radiation treatment (4). The genetic and epigenetic heterogeneity in MM
also contributes to relapse, and accordingly finding a druggable oncogenic process common in all
patients has not yet been achieved (5).
One of the common genetic alterations in MM is the overexpression of the histone methyltransferase
enhancer of zeste homolog 2 (EZH2) (6). EZH2 is, along with its paralogue EZH1, the catalytic subunit of
Polycomb repressive complex 2 (PRC2), and is responsible for the methylation of histone H3 lysine 27
(H3K27) (7). Methylation of H3K27 is associated with transcriptional repression, and it plays a critical role
in regulating genes that determine the balance between cell differentiation and proliferation.
Normal BM plasma cells do not express EZH2, however, gene expression is induced and correlates with
tumor burden during progression of MM (6). While EZH2 controls H3K27 methylation in MM cells,
inactivating mutations and deletions of the H3K27 demethylase lysine (K)-specific demethylase 6A
(KDM6A, UTX) are frequent in MM (8), further contributing to H3K27 aberrant hypermethylation of
genes. Enzymes controlling methylation on histone H3 lysine 36 (H3K36), such as histone
methyltransferase multiple myeloma SET domain (MMSET), can additionally regulate H3K27 methylation
levels and distribution across the genome in MM (9). In cells with high levels of MMSET, EZH2 is unable
on September 6, 2018. © 2015 American Association for Cancer Research. mct.aacrjournals.org Downloaded from
Author manuscripts have been peer reviewed and accepted for publication but have not yet been edited. Author Manuscript Published OnlineFirst on November 20, 2015; DOI: 10.1158/1535-7163.MCT-15-0486

4
to bind and methylate sites with increased H3K36me2, and is relocated to loci that maintain H3K27
methylation (10). Around 20% of MM cases have MMSET overexpression due to the genomic
translocation t(4;14) (11), placing the MMSET gene under the regulation of strong immunoglobulin
enhancers, leading to abnormally high levels of H3K36me2 (12) and a concomitant reduction in H3K27
tri-methylation (H3K27me3) (13). Thus overexpression of MMSET results in a shift of EZH2 function with
a reduction of global levels of H3K27me3 and a localized gene specific increase of H3K27me3. Taken
together, frequent genetic alterations of EZH2, UTX and MMSET disrupt the global and/or gene-specific
balance of H3K27 methylation in MM.
Changes in the H3K27 methylation pathway have emerged as a recurrent phenomenon in many types of
cancer, demonstrating that either excess or lack of H3K27 methylation can have oncogenic effects in
different indications (14). In MM it has been shown that PRC2 target genes are most often found
silenced in myeloma (15). Exploration of EZH2 inhibitors in MM models is therefore an attractive field of
research which may lead to a broader understanding of MM biology and will guide the development of
new targeted therapies.
Intensive efforts devoted to developing therapeutic approaches to target EZH2 function led to the
discovery of small molecules that specifically inhibit EZH2. First molecules that directly target EZH2 and
compete with the cofactor S-adenosylmethionin (SAM) binding have been described. The inhibitor E7438
has shown efficacy in SMARCB1 mutant Rhabdoid tumors (16) and as well as GSK126 and other reported
EZH2 inhibitors (17, 18), in EZH2-mutant non-Hodgkin lymphoma (19) where activating mutations are
described (20). In addition effects of EZH2 inhibitors in melanoma (21), ovarian tumors (22), cervical
cancer (23) and, mixed lineage leukemia (MLL) (24, 25) have been reported. Three first generation EZH2
inhibitors have recently entered phase I clinical trials (26). In this study we propose that EZH2 plays an
important role in MM development and progression. EZH2 inhibition promotes an anti-proliferative
on September 6, 2018. © 2015 American Association for Cancer Research. mct.aacrjournals.org Downloaded from
Author manuscripts have been peer reviewed and accepted for publication but have not yet been edited. Author Manuscript Published OnlineFirst on November 20, 2015; DOI: 10.1158/1535-7163.MCT-15-0486

5
effect on a subset of MM cells, and we provide one possible mechanism by which EZH2 inhibition
achieves cell growth inhibition in a cell line panel of various MM models.
MATERIALS AND METHODS
Cell Culture
Cell lines NCI-H929, MM.1S and U-266 were obtained from the American Type Culture Collection (ATCC)
between 2009 and 2014. OPM-2, MOLP-8, LP-1, KMS-12-PE, L-363 and RPMI-8226 were obtained from
the Deutsche Sammlung von Mikroorganismen und Zellkulturen (DSMZ) between 2012 and 2013. KMS-
11, KMS-28BM, KMS-20 and KMS-34 were obtained from the Japanese Collection of Research
Bioresources Cell Bank (JCRB) between 2012 and 2014. Cell lines were authenticated by short tandem
repeat (STR) DNA typing at the DSMZ. They were maintained in the recommended cell culture media at
37°C in 5% CO2.
Antibodies and Materials
Primary antibodies used in this study: H3K27me3, H3K36me2, EZH2 (Cell Signaling #9733, #2901, #5246),
total histone H3, MMSET, JMJD3, anti-phosphoS5 RNA Pol II (Abcam ab10799, ab75359, ab154985,
ab5408), UTX (BETHYL A302-374A), E-Cadherin (BD Biosciences 610182), EMP1 (Santa Cruz sc-55717)
and GAPDH (Advanced Immunochem #RGM2). Secondary antibodies used: goat anti-mouse/rabbit IRDye
800 CW (LI-COR Biosciences), Alexa Fluor 680 goat anti-mouse/rabbit IgG and Rabbit anti-Goat IgG, anti-
rabbit Alexa Fluor 680, anti-mouse Alexa 488 (Life technologies), and SULFO-TAG anti-rabbit/mouse
(Meso Scale Discovery). E7438, CPI169, GSK126 and GSK343 were synthesized in house.
Proliferation Assays
on September 6, 2018. © 2015 American Association for Cancer Research. mct.aacrjournals.org Downloaded from
Author manuscripts have been peer reviewed and accepted for publication but have not yet been edited. Author Manuscript Published OnlineFirst on November 20, 2015; DOI: 10.1158/1535-7163.MCT-15-0486
6
Cells (in triplicate) were treated with dilution series of E7438 from 16μM to 0.125μM, or with DMSO and
were incubated for 3 and 7 days. Proliferation was quantified using AlamarBlue® (Thermo Fisher
Scientific) and fluorescence signal was detected with a VICTOR™ X3 Multilabel Plate Reader.
Western Blot
Cells were lysed in RIPA buffer with Benzonase and protease inhibitors (Roche Diagnostics). Proteins
were separated on SDS-PAGE gels and blotted onto nitrocellulose membranes. Experiments were
performed in triplicate. Bands were detected and quantified with LI-COR Odyssey® Fc Software.
Enzyme-linked immunosorbent assay (ELISA)
Histones were extracted using the EpiXtract™ Total Histone Extraction Kit (Enzo) and added to 96-well
ELISA Standard Plates (Meso Scale Discovery) in triplicate. After overnight incubation, plates were
blocked with Blocker A Kit and incubated with the respective antibodies. Read Buffer T 4x was added
prior to the measurement in SECTOR Imager 6000 (Meso Scale Discovery).
Gene expression analysis
Cells (2x10⁵per well) were seeded into six-well culture plates 24h before treatment. Five replicate wells
were then exposed to 2μM of E7438 or DMSO for 3 days. RNA was extracted using RNeasy kit (Qiagen).
For each sample, 250ng of total RNA was amplified using the Affymetrix GeneChip WT PLUS Reagent Kit
according to the protocol described in User Manual Target Preparation for GeneChip Whole Transcript
(WT) Expression Arrays (P/N 703174 Rev. 2). An Affymetrix Human Gene 2.1 ST 96-array plate was
hybridized with 3μg of fragmented and labeled ss cDNA, washed, stained, and scanned according to the
protocol described in the User Manual GeneTitan®Instrument User Guide for Expression Arrays Plates
(P/N 702933 Rev.1) and Affymetrix® GeneChip® Command Console™ User’s Guide (P/N 702569 Rev.9)
using the Affymetrix GeneTitan instrument. These data are available in the ArrayExpress database
on September 6, 2018. © 2015 American Association for Cancer Research. mct.aacrjournals.org Downloaded from
Author manuscripts have been peer reviewed and accepted for publication but have not yet been edited. Author Manuscript Published OnlineFirst on November 20, 2015; DOI: 10.1158/1535-7163.MCT-15-0486

7
(www.ebi.ac.uk/arrayexpress) under accession number E-MTAB-3540. Principal component and
correlation analyses were used to confirm data reproducibility. Differentially expressed probe sets were
determined by carrying out paired t-test comparisons of treated versus control cells. Significant probe
sets with a false discovery rate (FDR) (Benjamini-Hochberg) < 0.1 were filtered by fold-change > 1.5 using
Expressionist - GeneData software. Functional analysis of differentially expressed probe sets was
performed using AmiGO Term Enrichment Service for Biological Process
(http://amigo.geneontology.org/amigo).
qRT-PCR
RNA (1μg) was reverse transcribed using SuperScript® III First-Strand Synthesis SuperMix (Life
technologies) and cDNA obtained was used for quantifying gene expression in the 7500 Fast Real-Time
PCR System (Applied Biosystems) utilizing TaqMan® Fast Advanced Master Mix (Life technologies).
Commercial primers used in this study are listed in the supplementary materials and methods.
Chromatin Immunoprecipitation (ChIP)
MOLP-8 cells (2x10⁶) were treated with 2μM E7438 or DMSO for 3 days. Standard chromatin
immunoprecipitation (ChIP) assays were performed. See Supplemental Materials and Methods for more
details.
Cell Cycle distribution by FACS and apoptosis detection
Cells (0.2x10⁶ cells/well) were seeded 24h before they were treated for 7 days with E7438, at their IC50
concentration. DMSO was used as control. Cells were washed with PBS and fixed overnight at -20°C with
ethanol 70%. Fixed cells were stained with propidium iodide (Sigma P-4170) solution containing RNaseA
(Sigma R4875). Fluorescence was measured with FACSCalibur flow cytometer and data were analyzed
using BD CellQuest™ Pro Software. Apoptosis was analyzed using ANNEXIN V-FITC APOPTOSIS
on September 6, 2018. © 2015 American Association for Cancer Research. mct.aacrjournals.org Downloaded from
Author manuscripts have been peer reviewed and accepted for publication but have not yet been edited. Author Manuscript Published OnlineFirst on November 20, 2015; DOI: 10.1158/1535-7163.MCT-15-0486

8
DETECTION KIT I (BD Biosciences) according to the manufacturer’s protocol, fluorescence was measured
with FACSCalibur flow cytometer and data were analyzed using BD CellQuest™ Pro Software.
Cell imaging
Cells were seeded in CellCarrier-384 Black Optically Clear Bottom plates (PerkinElmer) 24h before the
treatment with 2μM of E7438 or DMSO, and cultured for 5 days. Transmitted light images were acquired
with a 10x-magnification with a Molecuar Devices ImageXpress Micro widefield imaging system.
Immunofluorescence staining was done with cells attached to Chamber Slides (Thermo Fisher Scientific)
treated with Poly-L-Lysine . Cells were fixed with 4% paraformaldehyde, permeabilized with 0.5%
Triton™ X-100 and blocked with 1.0% bovine serum albumin. Staining was done using specific antibodies.
DAPI and Actin–fluorescent Alexa Fluor 568 (Life technologies) were used for nuclear and cytoplasmic
staining, respectively. Images were acquired with an LSM700 confocal microscope (Zeiss) using 63x-
magnification.
xCELLigence adhesion quantification
Cells were seeded into 96 wells e-plates (Acea Biosciences) 24h before the treatment. Cells (in triplicate)
were treated with 2 μM of E7438 and DMSO. Adhesion was monitored by impedance measurement
every 15 min using the RTCA MP Station (Acea Biosciences).
Multiple myeloma xenograft mouse model
Animal experiments were conducted in accordance with the German animal welfare law, approved by
local authorities and in accordance with the ethical guidelines of Bayer AG. Seven-weeks-old female
scid/scid mice obtained from Charles River Laboratories (Germany) were acclimated for 8 days before
tumor cell injection. A total of 1x10⁷ MOLP-8 cells were resuspended in 100μL of 100% matrigel and
injected subcutaneously to the right flank of the mice. Treatment was started at day 4 after tumor
on September 6, 2018. © 2015 American Association for Cancer Research. mct.aacrjournals.org Downloaded from
Author manuscripts have been peer reviewed and accepted for publication but have not yet been edited. Author Manuscript Published OnlineFirst on November 20, 2015; DOI: 10.1158/1535-7163.MCT-15-0486
9
inoculation. E7438 or vehicle (PEG400/EtOH 90/10) was administered p.o. BID at 250 and 500 mg/kg.
Tumor size was measured 2-3 times a week for 16 days. For RNA and protein extraction, tumor samples
were immediately frozen in liquid nitrogen and stored at 80°C. Frozen tumors were mechanically
homogenized using the TissueLyser and Stainless Steel Beads (Qiagen) and RNA and proteins were
extracted as described above.
RESULTS
EZH2 inhibition induces time-dependent anti-proliferative effects in several MM cell lines
A total of 13 MM cell lines were selected for the initial set of experiments to characterize EZH2 inhibition
effects. Different genetic alterations commonly found in MM patients were represented in the selected
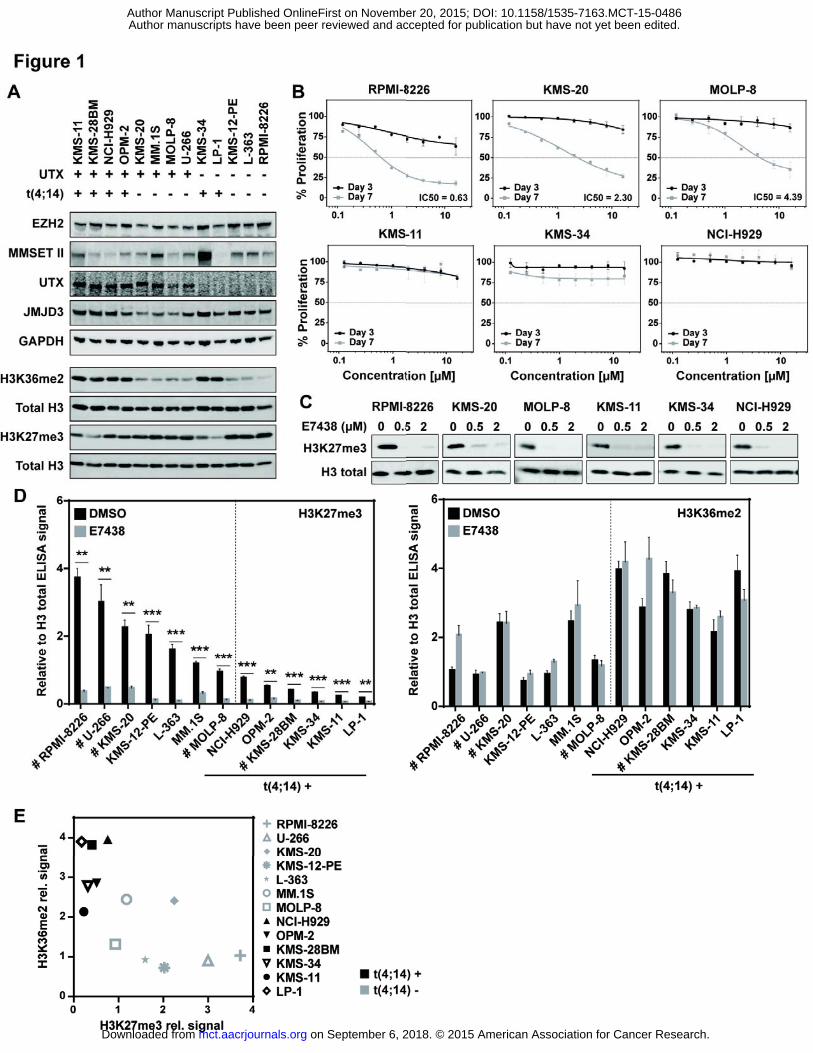
panel of cell lines (Figure 1A). Among them were cell lines with and without the t(4;14) translocation,
combined with the presence or the absence of UTX protein expression. Although cell lines harboring the
t(4;14) translocation all showed elevated mRNA levels of MMSET (Supplementary Figure S1B), not all cell
lines clearly showed this phenotype at the protein level (Figure 1A and Supplementary Figure S1A),
which might reflect the complexity of possible protein products from the MMSET gene (13). However,
each of these cell lines presented high amounts of H3K36me2 combined with low levels of H3K27me3,
and the inverse occurred for the cell lines without the t(4;14) translocation, confirming results also
reported by others (27). The protein levels of EZH2 and JMJD3 (another H3K27me3 specific demethylase
not reported to be altered in MM) showed slight differences, which did not correlate with global
H3K27me3 levels (Figure 1A).
To determine the effects of EZH2 inhibition on this panel of cell lines, they were treated with increasing
concentrations of the E7438 for 3 and 7 days, and cell proliferation was measured (Figure 1B and
Supplementary Figure S1A). While only in the L-363 cell line a proliferation effect was observed after 3
on September 6, 2018. © 2015 American Association for Cancer Research. mct.aacrjournals.org Downloaded from
Author manuscripts have been peer reviewed and accepted for publication but have not yet been edited. Author Manuscript Published OnlineFirst on November 20, 2015; DOI: 10.1158/1535-7163.MCT-15-0486

10
days of treatment (Supplementary Figure S2B), after 7 days more pronounced proliferation effects of at
least ~50% inhibition were observed in 5 cell lines (KMS-20, KMS-28BM, MOLP-8, RPMI-8226 and U-266).
A more pronounced effect of EZH2 inhibition on proliferation on day 7 is expected and can be explained
by the mode of action of EZH2 inhibition. H3K27me3 loss precedes the transcriptional activation needed
for proliferation defects. We and others have observed that the H3K27me3 mark has slow turnover
kinetics (18) and a 2-3 day inhibition period is needed for significant demethylation (19, 28).
To investigate the underlying mechanism of proliferation inhibition, effects on the cell cycle were
measured after treatment with E7438 for 7 days (Supplementary Figure S2C). Cell lines were treated
with E7438 at the calculated IC50 value from proliferation assays, in order to compare the cycle effects
at a similar inhibition level. We observed a general decrease in the percentage of cells in G2/M
accompanied by an increase in sub-G1 (apoptotic) cells, except for the U-266 cell line which showed only
a minor increase in the G0/G1 fraction. Similar results for apoptosis induction were obtained by
analyzing the Annexin V/propidium iodide positive cells (Supplementary Figure S2D). Next, we analyzed
the effects of EZH2 inhibition on histone modifications. Global H3K27me3 levels were quantified by
western blot after 3 days of treatment with 0.5 and 2 μM E7438, or DMSO as control. While only a
subset of cell lines showed an effect on cell proliferation in response to E7438, H3K27me3 levels were
reduced after E7438 treatment in a dose dependent manner in all tested MM cell lines, already at 3 days
with 0.5 μM E7438 (Figure 1C and Supplementary Figure S2E). In order to obtain more quantitative data
on the effect of E7438, we performed H3K27me3 and H3K36me2 ELISA on extracted histones.
Confirming the results observed by western blot, all cell lines showed reduced levels of H3K27me3 after
3 days of E7438 treatment at 2 μM compared with the DMSO control. By contrast, H3K36me2 levels
were not significantly changed after treatment with E7438 (Figure 1D). It is important to highlight that
these experiments were done after three days of E7438 treatment, which is a timepoint with a
significant effect on histone methylation which precedes effects on cell proliferation (Figure 1B and
on September 6, 2018. © 2015 American Association for Cancer Research. mct.aacrjournals.org Downloaded from
Author manuscripts have been peer reviewed and accepted for publication but have not yet been edited. Author Manuscript Published OnlineFirst on November 20, 2015; DOI: 10.1158/1535-7163.MCT-15-0486

11
Supplementary Figure S2B). By comparing the basal levels of these two antagonistic histone
modifications in MM cell lines, we confirmed interdependency between H3K27me3 and H3K36me2
based on the underlying genomic alterations. All the cell lines harboring the t(4;14) translocation with an
increased expression of the MMSET H3K36 methyltransferase showed a tendency for higher levels of
H3K36me2. Elevated levels of H3K36me2 were accompanied by lower H3K27me3 levels, and conversely
cells with high H3K27me3 show a tendency to have lower H3K36me2 (Figure 1E). Interestingly, the three
cell lines showing the highest levels of global H3K27me3 responded in the proliferation assay, which
might indicate a higher degree of cancer cell addiction towards EZH2 activity. Notably the presence or
absence of UTX did not seem to have an effect on the global H3K27me3 levels.
To re-confirm that H3K27me3 de-methylation does not always result in proliferation effects we also
tested three other EZH2 inhibitors (GSK126, GSK343 and CPI169) in KMS-11 (Supplementary Figure S3A).
Notably all inhibitors showed comparable target inhibition with an almost complete reduction in total
H3K27me3 methylation with 2 μM after 3 days of treatment (Supplementary Figure S3B). No
proliferation effects were observed in KMS11 for any inhibitor used. GSK126 and GSK343 showed some
additional proliferation effects with higher concentrations (>7.5 μM), but which could not be connected
to an improved methylation inhibition in comparison to E7438 or CPI169 (Supplementary Figure S3B).
Together our data reveal that E7438 reduces H3K27me3 levels in all tested MM cell lines, without
significant changes in H3K36me2, causing a time-dependent anti-proliferative response in a subset of
MM cell lines.
EZH2 inhibition promotes transcriptional activation in MM cell lines
Gene expression was analyzed in 10 of the MM cell lines, including the cell lines showing anti-
proliferation effects with E7438 treatment (KMS-20, KMS-28BM, MOLP-8, RPMI-8226 and U-266) and 5
on September 6, 2018. © 2015 American Association for Cancer Research. mct.aacrjournals.org Downloaded from
Author manuscripts have been peer reviewed and accepted for publication but have not yet been edited. Author Manuscript Published OnlineFirst on November 20, 2015; DOI: 10.1158/1535-7163.MCT-15-0486
12
of the non-affected cell lines (KMS-11, KMS-12-PE, KMS-34, LP-1 and NCI-H929). These data are available
in the ArrayExpress database (www.ebi.ac.uk/arrayexpress) under accession number E-MTAB-3540. All
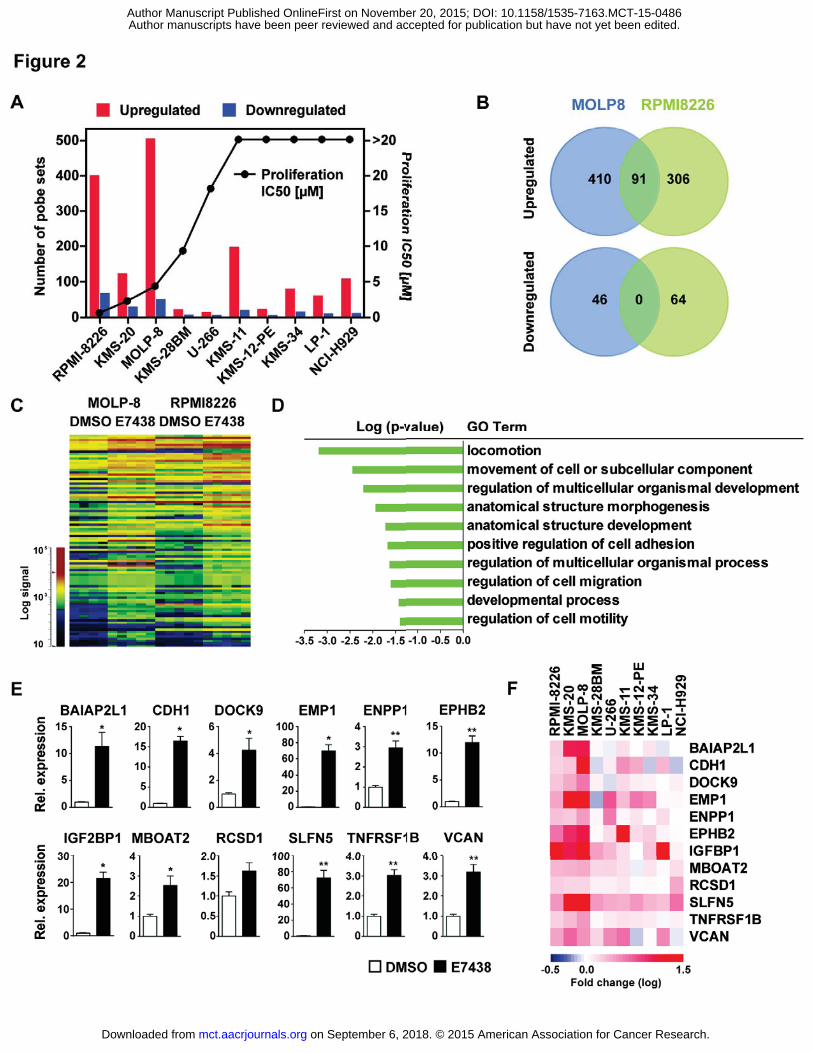
cell lines were treated with 2 μM of E7438 or DMSO control for 3 days. E7438 differentially altered the
expression in the MM cell lines ranging from a few hundreds of gene probes (false discovery rate (FDR) <
0.1 and fold change > 1.5) in MOLP-8 to only minor changes in the U-266 cell line (Figure 2A) In
agreement with the silencing role of EZH2, most of the genes were upregulated upon the global loss of
H3K27me3. The number of upregulated probes in each cell line in general correlated only partially with
their E7438 IC50 values (Figure 2A). RPMI-8226 and MOLP-8 cell lines showed the most robust
transcriptional activation after 3 days, which also translated to lower IC50 proliferation inhibition by
E7438 after 7 days of treatment. The number of gene probes activated in KMS-20 cells with a
proliferative IC50 of 2.3 μM was comparable with KMS-11, KMS-34 and NCI-H929 cell lines, which
showed no detectable proliferation effects after 7 days of treatment. Surprisingly KMS-28BM, U-266 and
KMS-12-PE showed only minor transcriptional changes even with globally reduced H3K27me3 levels
(compare with Supplementary Figure S2E). Therefore addiction to the H3K27me3 methylation mark for
transcriptional regulation seems to be variable between MM cell lines.
In a deeper analysis of all overlapping gene probes significantly changed specifically in RPMI-8226 and
MOLP-8, we found 91 probes upregulated in common and no common probes downregulated (Figure 2B
and C). Gene ontology analysis showed enrichment of different pathways (Figure 2D), a major one being
related to cell structure, adhesion and migration. To characterize further the underlying molecular
mechanisms of EZH2 inhibition in MM, we focused in the next set of the experiments on the MOLP-8 cell
line that had the highest number of significant transcriptional changes. To validate the expression screen
results, we selected a subset of 12 upregulated genes for qRT-PCR analysis. Genes were selected from
enriched categories of the gene ontology analysis, and were mostly related to cell adhesion. Each gene
was confirmed to be upregulated after treatment with E7438 (Figure 2E). Results were independently
on September 6, 2018. © 2015 American Association for Cancer Research. mct.aacrjournals.org Downloaded from
Author manuscripts have been peer reviewed and accepted for publication but have not yet been edited. Author Manuscript Published OnlineFirst on November 20, 2015; DOI: 10.1158/1535-7163.MCT-15-0486

13
confirmed with an additional EZH2 inhibitor, GSK126 (Supplementary Figure S4A). Additionally, we
observed that these genes showed a clear tendency for upregulation in all tested cell lines, regardless of
if their sensitivity to E7438 in the proliferation assay (Figure 2F) and despite the limited overlap observed
comparing all cell lines (Supplementary Tables S1A and B). These results showed significant
transcriptional activation after E7438 treatment in MM cell lines, revealing that most of the upregulated
genes were related with cell structure, adhesion and migration.
E7438 induces local reduction of H3K27me3 at the promoter region of epithelial tumor suppressor
genes
To further explore the regulation of the selected adhesion-related genes by EZH2, we analyzed gene
specific H3K27me3 levels by Chromatin Immunoprecipitation (ChIP) and their expression at the protein
level. In order to correlate the expression changes with the local loss of H3K27me3, ChIP experiments
were performed. Enrichment of H3, H3K27me3, or phosphorylated RNA Pol II after ChIP was quantified
in different regions surrounding the transcription start site (TSS) of CDH1, EMP1, VCAN, EPHB2 and
ENPP1 genes, while GAPDH served as a control. H3K27me3 occupancy significantly decreased at all
analyzed genes after E7438 treatment (Figure 3A).The basal levels of H3K27me3 before treatment in
upregulated genes were high compared to GAPDH, indicating that they were potentially EZH2 targets
marked by H3K27me3. A decrease of H3K27me3 in the promoter region of these genes after E7438
treatment presumably would allow for an increased binding of RNA Pol II and the initiation of
transcription. Accordingly, we detected significant enrichment of RNA Pol II in the promoter region of
analyzed genes after treatment (Figure 3A). These results confirmed the transcriptional activation
observed in the gene expression analysis and qRT-PCR. Total histone H3 enrichment after ChIP was
comparable among the samples, and the IgG control showed negligible signal, confirming that overall
on September 6, 2018. © 2015 American Association for Cancer Research. mct.aacrjournals.org Downloaded from
Author manuscripts have been peer reviewed and accepted for publication but have not yet been edited. Author Manuscript Published OnlineFirst on November 20, 2015; DOI: 10.1158/1535-7163.MCT-15-0486

14
histone H3 content did not lead to the loss of H3K27me3, and that the non-specific signal was low
(Supplementary Figure S4C and S5). Notably, ChIP results have been re-produced independently with the
GSK126 inhibitor (Supplementary Figure S4B). Western blot experiments demonstrated that the
observed upregulation at the transcription level was translated to an increase also at the protein level.
We observed more than double the protein levels of E-cadherin (CDH1 gene) and EMP1, two key
adherence-related proteins, in MOLP-8 cell treated with E7438 in comparison to the DMSO control
(Figure 3B). We conclude that global loss of H3K27me3 was also observed at the gene-specific level and
led to an increased expression of mRNA and protein.
EZH2 inhibition increases adhesion of MM cells by morphological changes
Most of the upregulated genes from the expression analysis were described as epithelial tumor
suppressor genes closely connected to adhesion and a more epithelial phenotype (29). Therefore we
speculated that their re-expression could increase adherence properties in MM cells. We closely
analyzed MOLP-8 cell adhesion and morphology after E7438 treatment. This MM cell line originally
consisted of a mixture of predominantly suspension cells with some slightly adherent cells (30).
However, after treatment with 2 μM E7438, the number of adherent cells increased and their
morphology changed, with many cells becoming elongated rather than round (Figure 4A). In order to
quantify the increase in the MOLP-8 adherent population after treatment with E7438, we used
xCelligence technology. An increase in signal indicates an increase in number of live adherent cells. Even
though E7438 induces a proliferation arrest in MOLP-8 cells (Figure 1B), an elevated number of adherent
cells in MOLP-8 was detected (Figure 4B).We obtained similar results using GSK126 (Supplementary
Figure S4D). To further investigate the phenotype, the protein expression of the epithelial tumor
suppressor gene E-cadherin, H3K27me3 and actin distribution, was analyzed in situ (Figure 4C). In
on September 6, 2018. © 2015 American Association for Cancer Research. mct.aacrjournals.org Downloaded from
Author manuscripts have been peer reviewed and accepted for publication but have not yet been edited. Author Manuscript Published OnlineFirst on November 20, 2015; DOI: 10.1158/1535-7163.MCT-15-0486

15
treated cells, characterized by the absence of H3K27me3, a larger fraction of cells showed a more
elongated morphology with cell-cell junctions. E-cadherin was localized mostly in trafficking vesicles.
Untreated MOLP-8 cells were more rounded, isolated, and with the E-cadherin signal surrounding the
nuclei (Figure 4C). Altogether, treatment with an EZH2 inhibitor induced expression of
epithelial/adherence associated genes in MOLP-8 cells and modulated their morphology to a more
spindle-like and adherent phenotype.
EZH2 inhibition shows significant anti-tumor efficacy in vivo
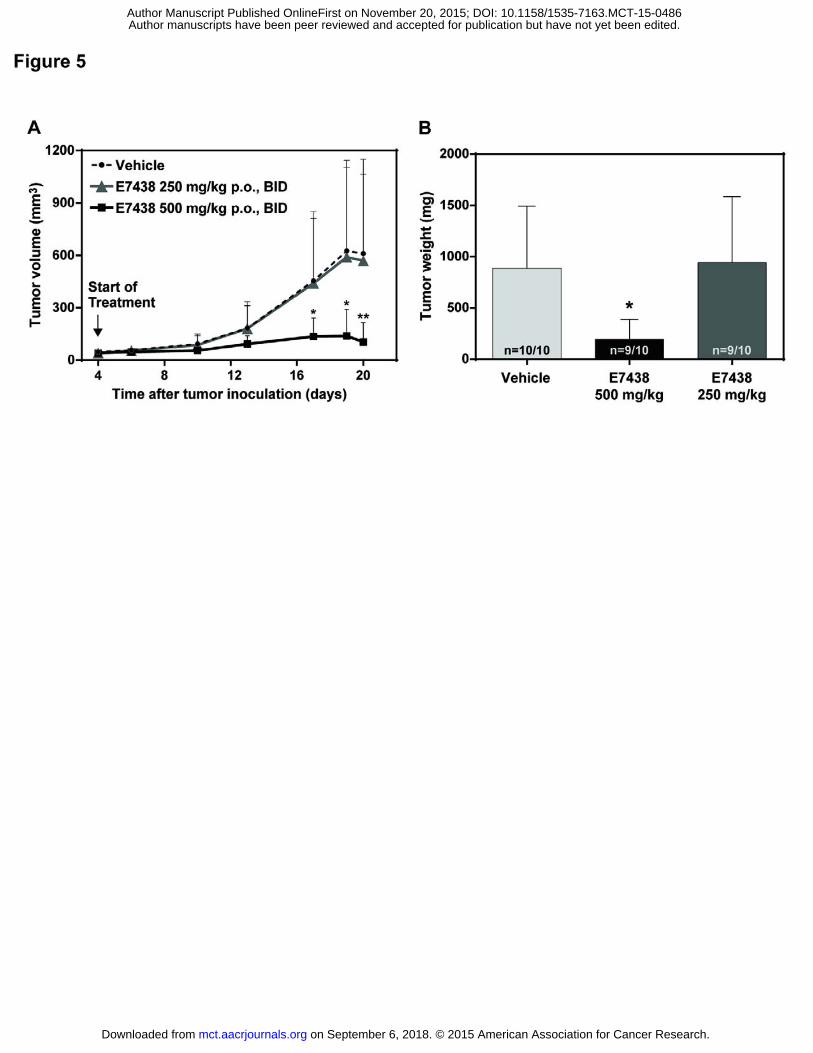
The MM xenograft model MOLP-8 was used in order to evaluate if the observed changes in cell
morphology and gene expression translate to anti-tumor efficacy in vivo. Therefore, three groups of
tumor bearing mice were treated p.o., twice daily (BID) with the following treatments. The first group
was treated with vehicle (PEG400/EtOH 90/10) only (control group), the second group was treated with
E7438 at 500mg/kg, p.o., BID and the third group with 250 mg/kg p.o. BID. Tumors of mice treated with
E7438 (500 mg/kg, BID, p.o.) showed a significantly slower tumor progression based on tumor volume
(Figure 5A) and tumor weight (Figure 5B)) compared to the vehicle control group, with no effect on
mouse body weight (Supplementary Figure S6). Additionally, levels of H3K27me3 were measured within
the tumor tissue. Western blot showed reduced levels of H3K27me3 in both treated groups at 250 and
500 mg/kg (Figure 6A). Quantitative detection by ELISA showed that levels of H3K27me3 in the
500mg/kg treated mice were significantly lower compared with mice treated at 250 mg/kg (Figure 6B).
Further, we analyzed the target genes identified in our in vitro studies in the tumor tissues ex vivo. . All
target genes were significantly upregulated in tumors from mice treated at 500 mg/kg compared to
control. Mice treated with 250 mg/kg inhibitor showed only partial upregulation relative to the control
(Figure 6C-D). Together with the methylation data (Figure 6B) we conclude that 250mg/kg treatment did
on September 6, 2018. © 2015 American Association for Cancer Research. mct.aacrjournals.org Downloaded from
Author manuscripts have been peer reviewed and accepted for publication but have not yet been edited. Author Manuscript Published OnlineFirst on November 20, 2015; DOI: 10.1158/1535-7163.MCT-15-0486
16
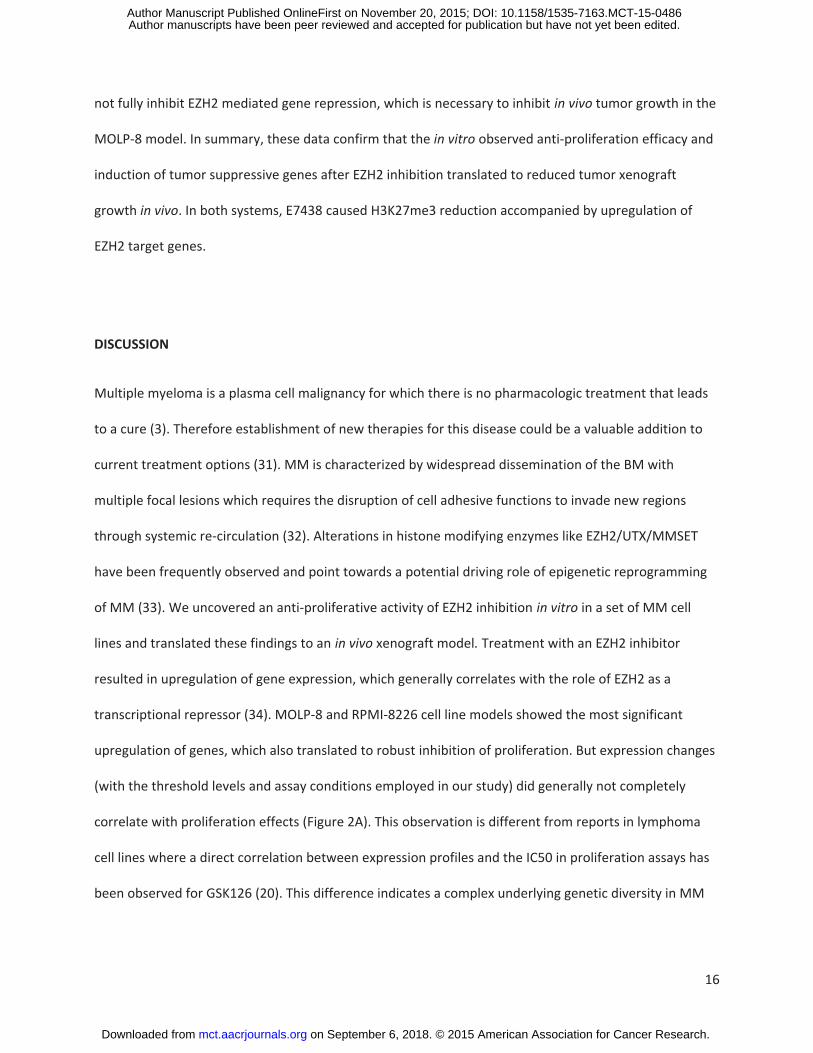
not fully inhibit EZH2 mediated gene repression, which is necessary to inhibit in vivo tumor growth in the
MOLP-8 model. In summary, these data confirm that the in vitro observed anti-proliferation efficacy and
induction of tumor suppressive genes after EZH2 inhibition translated to reduced tumor xenograft
growth in vivo. In both systems, E7438 caused H3K27me3 reduction accompanied by upregulation of
EZH2 target genes.
DISCUSSION
Multiple myeloma is a plasma cell malignancy for which there is no pharmacologic treatment that leads
to a cure (3). Therefore establishment of new therapies for this disease could be a valuable addition to
current treatment options (31). MM is characterized by widespread dissemination of the BM with
multiple focal lesions which requires the disruption of cell adhesive functions to invade new regions
through systemic re-circulation (32). Alterations in histone modifying enzymes like EZH2/UTX/MMSET
have been frequently observed and point towards a potential driving role of epigenetic reprogramming
of MM (33). We uncovered an anti-proliferative activity of EZH2 inhibition in vitro in a set of MM cell
lines and translated these findings to an in vivo xenograft model. Treatment with an EZH2 inhibitor
resulted in upregulation of gene expression, which generally correlates with the role of EZH2 as a
transcriptional repressor (34). MOLP-8 and RPMI-8226 cell line models showed the most significant
upregulation of genes, which also translated to robust inhibition of proliferation. But expression changes
(with the threshold levels and assay conditions employed in our study) did generally not completely
correlate with proliferation effects (Figure 2A). This observation is different from reports in lymphoma
cell lines where a direct correlation between expression profiles and the IC50 in proliferation assays has
been observed for GSK126 (20). This difference indicates a complex underlying genetic diversity in MM
on September 6, 2018. © 2015 American Association for Cancer Research. mct.aacrjournals.org Downloaded from
Author manuscripts have been peer reviewed and accepted for publication but have not yet been edited. Author Manuscript Published OnlineFirst on November 20, 2015; DOI: 10.1158/1535-7163.MCT-15-0486

17
model systems. Different genetic and epigenetic drivers are potentially necessary to drive malignant
transformation and are needed for cell proliferation.
For the H3K27 methylation/PRC2 pathway, several different gene mutations leading to elevated levels of
methylation and gene repression have been proposed to predict a potential addiction to EZH2 activity in
cancers (14, 35, 36). Particularly in MM, several alterations have been proposed to be directly correlated
with sensitivity to EZH2 inhibition. MMSET overexpression and UTX loss of function mutations have been
proposed in previous studies (8, 9), to lead to aberrant H3K27 methylation and transcriptional repression
in MM. However, in our study we did not find a clear correlation of EZH2 inhibitor sensitivity with a
distinct genetic mutational profile. Only the RPMI-8226 cell line from the five UTX mutated cell lines
showed a significant response in gene expression and proliferation. In the t(4;14) positive cell lines we
could confirm reports of globally increased levels of H3K36 methylation and decreased levels of H3K27
methylation (13). Despite significant gene upregulation in some of the t(4;14) positive cell lines after
treatment with E7438 only KMS-28BM showed a proliferation response. A potential limitation of our
proliferation results could be the experimental assay system used. Three-dimensional cultures
approximating physiological conditions have been proposed for EZH2 inhibitors to fully cover potential
effects of epigenetic re-programming (21, 37). Nevertheless our gene expression profiling after loss of
global H3K27me3 is different for cell lines having comparable genetic alterations. Therefore genetic
alterations predicting sensitivity to EZH2 inhibition remain elusive and further studies are needed.
We describe for the first time to our knowledge a potential role for EZH2 in the regulation of adherence
and epithelial-mesenchymal differentiation genes in MM. EZH2 has been generally proposed to be
critical for the regulation of epithelial-mesenchymal transition (EMT) associated master genes in cancer
(38, 39). We identified several genes involved in adherence, which showed a general trend for
upregulation in all analyzed models (see Figure 2F). Our data, together with recent publications in
additional indications such as melanoma (21), breast cancer (40), renal cell carcinoma (41), cervical
on September 6, 2018. © 2015 American Association for Cancer Research. mct.aacrjournals.org Downloaded from
Author manuscripts have been peer reviewed and accepted for publication but have not yet been edited. Author Manuscript Published OnlineFirst on November 20, 2015; DOI: 10.1158/1535-7163.MCT-15-0486

18
cancer (23) and oral squamous carcinoma (42), further indicates regulation of EMT and/or ECM
(extracellular matrix)-adhesion signaling as a fundamental feature of EZH2-mediated malignant
reprogramming in cancer.
MM is characterized by widespread dissemination of the BM at diagnosis, with multiple focal lesions in
the BM, re-circulation into the peripheral blood, and re-entrance or homing of MM cells into new sites
promoting metastasis (32). Our study suggests that EZH2 might play an important role in shaping the
interactions between MM cells and the micro-environment, regulating their adherence and their
capacity to migrate. That EZH2 inhibition promotes adherence properties in MM cells could be
beneficial, because it might prevent MM cell dissemination and new colonization within the BM, thus
abrogating metastasis. One of the most important drivers in EMT is the downregulation of E-cadherin,
which has been observed to be directly repressed by EZH2 in cancer (39). The E-cadherin gene, CDH1, is
upregulated in almost all the cell lines tested in this study, independent of their response to treatment.
During epithelial to mesenchymal transition, cells lose polarity and cell-cell adhesion, and gain migratory
and invasive properties. Some examples uncovered in our study regulating similar processes are EMP1
(epithelial membrane protein 1). Reduced levels of EMP1 were associated with tumor invasion, lymph
node metastasis, clinical stage and cell differentiation (43-45). EMP1 is an integral tetraspan membrane
protein whose function has been recently described to be involved in epithelial tight junction formation.
EPHB2 is a receptor tyrosine kinase from the ephrin family which is involved in multiple critical aspects of
cell adhesion and migration and a putative tumor suppressor (46). (47). Another example is DOCK9
(dedicator of cytokinesis 9), which belongs to the Dock family of evolutionarily conserved exchange
factors for the Rho GTPases Rac and Cdc42, regulating actin cytoskeleton, cell adhesion and migration
(48). SLFN5, a protein, was described to have a key role in controlling motility and invasiveness of renal
cell carcinoma and melanoma cells (49, 50). SLFN5 negatively controls expression of matrix
metalloproteinases (MMPs), and several other genes involved in the control of malignant cell motility.
on September 6, 2018. © 2015 American Association for Cancer Research. mct.aacrjournals.org Downloaded from
Author manuscripts have been peer reviewed and accepted for publication but have not yet been edited. Author Manuscript Published OnlineFirst on November 20, 2015; DOI: 10.1158/1535-7163.MCT-15-0486

19
MM results from a combination of multiple genetic and epigenetic factors, leading to the development
and progression of the disease. The relative complexity of MM prevents straightforward mutation-based
or other correlative measures to predict proliferation responses towards EZH2 and other inhibitors.
Nevertheless we demonstrated a role of EZH2 in MM survival and as regulator of differentiation
processes controlling adhesion and migration. Therefore further exploration of EZH2 inhibitors for MM
treatment is strongly supported, having the potential to be a promising addition to the current
treatments used for MM patients.
on September 6, 2018. © 2015 American Association for Cancer Research. mct.aacrjournals.org Downloaded from
Author manuscripts have been peer reviewed and accepted for publication but have not yet been edited. Author Manuscript Published OnlineFirst on November 20, 2015; DOI: 10.1158/1535-7163.MCT-15-0486

20
REFERENCES
1. Rollig C, Knop S, Bornhauser M. Multiple myeloma. Lancet. 2015;385:2197-208. 2. Mahindra A, Laubach J, Raje N, Munshi N, Richardson PG, Anderson K. Latest advances and current
challenges in the treatment of multiple myeloma. Nature reviews Clinical oncology. 2012;9:135-43.
3. Joao C, Costa C, Coelho I, Vergueiro MJ, Ferreira M, da Silva MG. Long-term survival in multiple myeloma. Clinical case reports. 2014;2:173-9.
4. Romano A, Conticello C, Cavalli M, Vetro C, La Fauci A, Parrinello NL, et al. Immunological dysregulation in multiple myeloma microenvironment. BioMed research international. 2014;2014:198539.
5. Abdi J, Chen G, Chang H. Drug resistance in multiple myeloma: latest findings and new concepts on molecular mechanisms. Oncotarget. 2013;4:2186-207.
6. Croonquist PA, Van Ness B. The polycomb group protein enhancer of zeste homolog 2 (EZH 2) is an oncogene that influences myeloma cell growth and the mutant ras phenotype. Oncogene. 2005;24:6269-80.
7. Crea F, Fornaro L, Bocci G, Sun L, Farrar WL, Falcone A, et al. EZH2 inhibition: targeting the crossroad of tumor invasion and angiogenesis. Cancer metastasis reviews. 2012;31:753-61.
8. van Haaften G, Dalgliesh GL, Davies H, Chen L, Bignell G, Greenman C, et al. Somatic mutations of the histone H3K27 demethylase gene UTX in human cancer. Nature genetics. 2009;41:521-3.
9. Popovic R, Martinez-Garcia E, Giannopoulou EG, Zhang Q, Zhang Q, Ezponda T, et al. Histone methyltransferase MMSET/NSD2 alters EZH2 binding and reprograms the myeloma epigenome through global and focal changes in H3K36 and H3K27 methylation. PLoS genetics. 2014;10:e1004566.
10. Yuan W, Xu M, Huang C, Liu N, Chen S, Zhu B. H3K36 methylation antagonizes PRC2-mediated H3K27 methylation. The Journal of biological chemistry. 2011;286:7983-9.
11. Keats JJ, Reiman T, Belch AR, Pilarski LM. Ten years and counting: so what do we know about t(4;14)(p16;q32) multiple myeloma. Leukemia & lymphoma. 2006;47:2289-300.
12. Stec I, Wright TJ, van Ommen GJ, de Boer PA, van Haeringen A, Moorman AF, et al. WHSC1, a 90 kb SET domain-containing gene, expressed in early development and homologous to a Drosophila dysmorphy gene maps in the Wolf-Hirschhorn syndrome critical region and is fused to IgH in t(4;14) multiple myeloma. Human molecular genetics. 1998;7:1071-82.
13. Martinez-Garcia E, Popovic R, Min DJ, Sweet SM, Thomas PM, Zamdborg L, et al. The MMSET histone methyl transferase switches global histone methylation and alters gene expression in t(4;14) multiple myeloma cells. Blood. 2011;117:211-20.
14. Ezponda T, Licht JD. Molecular pathways: deregulation of histone h3 lysine 27 methylation in cancer-different paths, same destination. Clinical cancer research : an official journal of the American Association for Cancer Research. 2014;20:5001-8.
15. Kalushkova A, Fryknas M, Lemaire M, Fristedt C, Agarwal P, Eriksson M, et al. Polycomb target genes are silenced in multiple myeloma. PloS one. 2010;5:e11483.
16. Knutson SK, Warholic NM, Wigle TJ, Klaus CR, Allain CJ, Raimondi A, et al. Durable tumor regression in genetically altered malignant rhabdoid tumors by inhibition of methyltransferase EZH2. Proceedings of the National Academy of Sciences of the United States of America. 2013;110:7922-7.
17. Qi W, Chan H, Teng L, Li L, Chuai S, Zhang R, et al. Selective inhibition of Ezh2 by a small molecule inhibitor blocks tumor cells proliferation. Proceedings of the National Academy of Sciences of the United States of America. 2012;109:21360-5.
on September 6, 2018. © 2015 American Association for Cancer Research. mct.aacrjournals.org Downloaded from
Author manuscripts have been peer reviewed and accepted for publication but have not yet been edited. Author Manuscript Published OnlineFirst on November 20, 2015; DOI: 10.1158/1535-7163.MCT-15-0486

21
18. Bradley WD, Arora S, Busby J, Balasubramanian S, Gehling VS, Nasveschuk CG, et al. EZH2 inhibitor efficacy in non-Hodgkin's lymphoma does not require suppression of H3K27 monomethylation. Chemistry & biology. 2014;21:1463-75.
19. Knutson SK, Kawano S, Minoshima Y, Warholic NM, Huang KC, Xiao Y, et al. Selective inhibition of EZH2 by EPZ-6438 leads to potent antitumor activity in EZH2-mutant non-Hodgkin lymphoma. Molecular cancer therapeutics. 2014;13:842-54.
20. McCabe MT, Ott HM, Ganji G, Korenchuk S, Thompson C, Van Aller GS, et al. EZH2 inhibition as a therapeutic strategy for lymphoma with EZH2-activating mutations. Nature. 2012;492:108-12.
21. Barsotti AM, Ryskin M, Zhong W, Zhang WG, Giannakou A, Loreth C, et al. Epigenetic reprogramming by tumor-derived EZH2 gain-of-function mutations promotes aggressive 3D cell morphologies and enhances melanoma tumor growth. Oncotarget. 2015;6:2928-38.
22. Bitler BG, Aird KM, Garipov A, Li H, Amatangelo M, Kossenkov AV, et al. Synthetic lethality by targeting EZH2 methyltransferase activity in ARID1A-mutated cancers. Nature medicine. 2015;21:231-8.
23. Ding M, Zhang H, Li Z, Wang C, Chen J, Shi L, et al. The polycomb group protein enhancer of zeste 2 is a novel therapeutic target for cervical cancer. Clinical and experimental pharmacology & physiology. 2015;42:458-64.
24. Konze KD, Ma A, Li F, Barsyte-Lovejoy D, Parton T, Macnevin CJ, et al. An orally bioavailable chemical probe of the Lysine Methyltransferases EZH2 and EZH1. ACS chemical biology. 2013;8:1324-34.
25. Xu B, On DM, Ma A, Parton T, Konze KD, Pattenden SG, et al. Selective inhibition of EZH2 and EZH1 enzymatic activity by a small molecule suppresses MLL-rearranged leukemia. Blood. 2015;125:346-57.
26. McGrath J, Trojer P. Targeting histone lysine methylation in cancer. Pharmacology & therapeutics. 2015;150:1-22.
27. Huang Z, Wu H, Chuai S, Xu F, Yan F, Englund N, et al. NSD2 is recruited through its PHD domain to oncogenic gene loci to drive multiple myeloma. Cancer research. 2013;73:6277-88.
28. Luense S, Denner P, Fernandez-Montalvan A, Hartung I, Husemann M, Stresemann C, et al. Quantification of histone H3 Lys27 trimethylation (H3K27me3) by high-throughput microscopy enables cellular large-scale screening for small-molecule EZH2 inhibitors. Journal of biomolecular screening. 2015;20:190-201.
29. Richter GH, Plehm S, Fasan A, Rossler S, Unland R, Bennani-Baiti IM, et al. EZH2 is a mediator of EWS/FLI1 driven tumor growth and metastasis blocking endothelial and neuro-ectodermal differentiation. Proceedings of the National Academy of Sciences of the United States of America. 2009;106:5324-9.
30. Matsuo Y, Drexler HG, Harashima A, Okochi A, Hasegawa A, Kojima K, et al. Induction of CD28 on the new myeloma cell line MOLP-8 with t(11;14)(q13;q32) expressing delta/lambda type immunoglobulin. Leukemia research. 2004;28:869-77.
31. Pawlyn C, Kaiser MF, Davies FE, Morgan GJ. Current and potential epigenetic targets in multiple myeloma. Epigenomics. 2014;6:215-28.
32. Azab AK, Hu J, Quang P, Azab F, Pitsillides C, Awwad R, et al. Hypoxia promotes dissemination of multiple myeloma through acquisition of epithelial to mesenchymal transition-like features. Blood. 2012;119:5782-94.
33. Dimopoulos K, Gimsing P, Gronbaek K. The role of epigenetics in the biology of multiple myeloma. Blood cancer journal. 2014;4:e207.
34. Morey L, Helin K. Polycomb group protein-mediated repression of transcription. Trends in biochemical sciences. 2010;35:323-32.
35. Sneeringer CJ, Scott MP, Kuntz KW, Knutson SK, Pollock RM, Richon VM, et al. Coordinated activities of wild-type plus mutant EZH2 drive tumor-associated hypertrimethylation of lysine 27
on September 6, 2018. © 2015 American Association for Cancer Research. mct.aacrjournals.org Downloaded from
Author manuscripts have been peer reviewed and accepted for publication but have not yet been edited. Author Manuscript Published OnlineFirst on November 20, 2015; DOI: 10.1158/1535-7163.MCT-15-0486

22
on histone H3 (H3K27) in human B-cell lymphomas. Proceedings of the National Academy of Sciences of the United States of America. 2010;107:20980-5.
36. Shen H, Laird PW. Interplay between the cancer genome and epigenome. Cell. 2013;153:38-55. 37. Amatangelo MD, Garipov A, Li H, Conejo-Garcia JR, Speicher DW, Zhang R. Three-dimensional
culture sensitizes epithelial ovarian cancer cells to EZH2 methyltransferase inhibition. Cell cycle. 2013;12:2113-9.
38. Malouf GG, Taube JH, Lu Y, Roysarkar T, Panjarian S, Estecio MR, et al. Architecture of epigenetic reprogramming following Twist1-mediated epithelial-mesenchymal transition. Genome biology. 2013;14:R144.
39. Cao Q, Yu J, Dhanasekaran SM, Kim JH, Mani RS, Tomlins SA, et al. Repression of E-cadherin by the polycomb group protein EZH2 in cancer. Oncogene. 2008;27:7274-84.
40. Parvani JG, Schiemann WP. Sox4, EMT programs, and the metastatic progression of breast cancers: mastering the masters of EMT. Breast cancer research : BCR. 2013;15:R72.
41. Liu L, Xu Z, Zhong L, Wang H, Jiang S, Long Q, et al. Enhancer of zeste homolog 2 (EZH2) promotes tumour cell migration and invasion via epigenetic repression of E-cadherin in renal cell carcinoma. BJU international. 2014.
42. Wu Y, Zhang L, Zhang L, Wang Y, Li H, Ren X, et al. Long non-coding RNA HOTAIR promotes tumor cell invasion and metastasis by recruiting EZH2 and repressing E-cadherin in oral squamous cell carcinoma. International journal of oncology. 2015;46:2586-94.
43. Zhang J, Cao W, Xu Q, Chen WT. The expression of EMP1 is downregulated in oral squamous cell carcinoma and possibly associated with tumour metastasis. Journal of clinical pathology. 2011;64:25-9.
44. Sun GG, Wang YD, Cui DW, Cheng YJ, Hu WN. EMP1 regulates caspase-9 and VEGFC expression and suppresses prostate cancer cell proliferation and invasion. Tumour biology : the journal of the International Society for Oncodevelopmental Biology and Medicine. 2014;35:3455-62.
45. Sun G, Zhao G, Lu Y, Wang Y, Yang C. Association of EMP1 with gastric carcinoma invasion, survival and prognosis. International journal of oncology. 2014;45:1091-8.
46. Herath NI, Boyd AW. The role of Eph receptors and ephrin ligands in colorectal cancer. International journal of cancer Journal international du cancer. 2010;126:2003-11.
47. Cortina C, Palomo-Ponce S, Iglesias M, Fernandez-Masip JL, Vivancos A, Whissell G, et al. EphB-ephrin-B interactions suppress colorectal cancer progression by compartmentalizing tumor cells. Nature genetics. 2007;39:1376-83.
48. Gadea G, Blangy A. Dock-family exchange factors in cell migration and disease. European journal of cell biology. 2014;93:466-77.
49. Sassano A, Mavrommatis E, Arslan AD, Kroczynska B, Beauchamp EM, Khuon S, et al. Human Schlafen 5 (SLFN5) Is a Regulator of Motility and Invasiveness of Renal Cell Carcinoma Cells. Molecular and cellular biology. 2015;35:2684-98.
50. Katsoulidis E, Mavrommatis E, Woodard J, Shields MA, Sassano A, Carayol N, et al. Role of interferon {alpha} (IFN{alpha})-inducible Schlafen-5 in regulation of anchorage-independent growth and invasion of malignant melanoma cells. The Journal of biological chemistry. 2010;285:40333-41.
on September 6, 2018. © 2015 American Association for Cancer Research. mct.aacrjournals.org Downloaded from
Author manuscripts have been peer reviewed and accepted for publication but have not yet been edited. Author Manuscript Published OnlineFirst on November 20, 2015; DOI: 10.1158/1535-7163.MCT-15-0486

23
FIGURE LEGENDS
Figure 1: E7438 treatment inhibits the proliferation of several multiple myeloma cell lines and reduces
H3K27me3 levels. A. Western blot of the 13 tested MM cell lines and their different genetic profiles. The
primary antibodies used were EZH2 (Cell Signaling #5246), MMSET (Abcam ab75359), UTX (BETHYL A302-
374A), JMJD3 (from Abcam ab154985), GAPDH (Advanced Immunochem #RGM2), H3K36me2 (Cell
Signaling #2901), H3K27me3 (Cell Signaling #9733) and total histone H3 (Abcam ab10799). B. Dose-
dependent effects of E7438 on cell proliferation at day 3 (black) and 7 (grey) of six multiple myeloma cell
lines (RPMI-8226, KMS-20, MOLP-8, KMS-11, KMS-34 and NCI-H929). Fluorescence values at days 3 and 7
were expressed as a percentage of the DMSO control value and plotted against compound
concentrations. The absolute IC50 was calculated by fitting a dose-response curve using GraphPad
software. C. Western blot of H3K27me3 (Cell Signaling #9733) in six multiple myeloma cell lines (RPMI-
8226, KMS-20, MOLP-8, KMS-11, KMS-34 and NCI-H929) tested after 3 days of treatment with DMSO, or
0.5 μM and 2μM E7438. Histone H3 (Abcam ab10799) is included as a loading control. D. ELISA
quantification of global levels of H3K27me3 (Cell Signaling #9733) (left) and H3K36me2 (Cell Signaling
#2901) (right) relative to total histone H3 (Abcam ab10799) of MM cell lines treated with DMSO (black)
or with E7438 2 μM (grey) for 3 days. Cell lines with anti-proliferation effects after E7438 treatment were
marked with # and t(4;14) positive cell lines were indicated. P values were calculated using t-test
compared to DMSO (*P 0.05, **P 0.01 and ***P 0.001). E. Correlation plot of H3K27me3 and
H3K36me2 levels quantified by ELISA, showing distribution of t(4;14) positive (black) and negative (grey)
cell lines.
Figure 2: E7438 treatment promotes transcriptional activation in MM cell lines. A. The number of
probe sets showing significantly altered expression (false discovery rate (FDR) < 0.1 and fold change >
1.5) following 72 hours treatment with 2 μM E7438 and its correlation with the IC50 in RPMI-8226, KMS-
20, MOLP-8, KMS-28BM, U-266, KMS-11, KMS-12-PE, KMS-34, LP-1 and NCI-H929 cell lines. B. Venn
diagrams showing the overlap of significantly upregulated (up) and downregulated (down) probes in
MOLP-8 and RPMI-8226. C. Expression heatmap representing the 93 overlapped probes in MOLP-8 and
RPMI-8226 cell lines treated with DMSO or 2 μM E7438. D. AmiGo gene ontology analysis of the 93
overlapped probes in MOLP-8 and RPMI-8226 showing GO categories with a p-value < 0.05. E. qRT-PCR
expression levels relative to GAPDH of 12 significantly upregulated genes (from MOLP-8 with false
discovery rate (FDR) < 0.1 and fold change > 1.5) tested in the MOLP-8 cell line. P values were calculated
using t-test (*P 0.05 and **P 0.01) compared to DMSO. F. Heatmap showing expression values for
on September 6, 2018. © 2015 American Association for Cancer Research. mct.aacrjournals.org Downloaded from
Author manuscripts have been peer reviewed and accepted for publication but have not yet been edited. Author Manuscript Published OnlineFirst on November 20, 2015; DOI: 10.1158/1535-7163.MCT-15-0486

24
the 12 upregulated genes (from MOLP-8 with false discovery rate (FDR) < 0.1 and fold change > 1.5)
tested in 10 MM cell lines. Expression values are represented as log10 fold change of cells treated with 2
μM E7438 relative to cells treated with DMSO.
Figure 3: E7438 treatment induces local reduction of H3K27me3 in promoter regions of upregulated
genes. A. H3K27me3 (Cell Signaling #9733) (left) and active (phosphorylated) RNA pol II (Abcam ab5408)
(right) ChIP signal reported as percent of input at CDH1, EMP1, ENPP1, EPHB2 and VCAN gene promoter
regions. P values were calculated using t-test (*P 0.05, **P 0.01 and ***P 0.001) compared to
DMSO. B. Western blot of E-cadherin (CDH1) (BD Biosciences 610182), EMP1 (Santa Cruz sc-55717) and
H3K27me3 (Cell Signaling #9733), in DMSO and 2 μM E7438 MOLP-8 treated cells. GAPDH (Advanced
Immunochem #RGM2) is used as a loading control. Quantification of western blot signal was done using
Odyssey software.
Figure 4: E7438 treatment increases adhesion of MOLP-8 cells. A. Transmitted light pictures of live
MOLP-8 cells at five days after treatment with DMSO control or 2 μM E7438, using a 10x objective.
Bottom left square detail of cells with 1.5x zoom. B. xCelligence adherence measurement showing the
cell index of adherent cells treated with DMSO (grey) or 2 μM E7438 (black). Measurements were taken
over 4 days using different numbers of starting cells (7500 and 10000). C. Immunofluorescence staining
of H3K27me3 (Cell Signaling #9733) (red), E-cadherin (BD Biosciences 610182) (green), actin (Life
technologies A12374) (magenta) and DAPI (blue) and the merged image, in MOLP-8 cells treated with
DMSO or 2 μM E7438 for 5 days.
Figure 5: in vivo inhibition of tumor growth with E7438. A. Effect of E7438 on tumor volume of MOLP-8
xenograft mice treated with vehicle, 250 mg/kg or 500 mg/kg of E7438 p.o. BID for 16 days after tumor
inoculation. *P 0.05 and **P 0.01 significant differences compared to vehicle using ANOVA, Holm-
Sidak method (based on log data). B. Effect of E7438 on tumor weight in mice treated with vehicle, 250
mg/kg and 500 mg/kg of E7438 p.o. BID for 16 days after tumor inoculation. *P 0.05 significant
difference compared to vehicle using ANOVA, Holm-Sidak method (based on log data).
Figure 6: in vivo reduction of H3K27me3 and activation of transcription with E7438. A. Western blot of
H3K27me3 (Cell Signaling #9733) in tumors from MOLP-8 xenograft mice treated with vehicle, 250 mg/kg
or 500 mg/kg of E7438. Histone H3 (Abcam ab10799) levels were used as a loading control. B. ELISA
quantification of H3K27me3 (Cell Signaling #9733) levels relative to total histone H3 (Abcam ab10799)
levels in mice treated with vehicle, 500 mg/kg or 250 mg/kg of E7438. P values were calculated using the
t-test to compare each group with the others (*P 0.05, *** P 0.001). C. qRT-PCR expression levels of
on September 6, 2018. © 2015 American Association for Cancer Research. mct.aacrjournals.org Downloaded from
Author manuscripts have been peer reviewed and accepted for publication but have not yet been edited. Author Manuscript Published OnlineFirst on November 20, 2015; DOI: 10.1158/1535-7163.MCT-15-0486

25
CDH1 in each tumor sample from mice belonging to vehicle, 250 mg/kg or 500 mg/kg of treatment
groups. D. qRT-PCR expression levels relative to GAPDH of 11 upregulated genes (from MOLP-8 with
false discovery rate (FDR) < 0.1 and fold change > 1.5). Box plots represent the mean, minimum, and
maximum value for the expression for each vehicle (light gray), 500 mg/kg (black) and 250 mg/kg (dark
grey) treatment groups. P values were calculated using ANOVA compared to vehicle (*P 0.05, **P
0.01 and *** P 0.001).
on September 6, 2018. © 2015 American Association for Cancer Research. mct.aacrjournals.org Downloaded from
Author manuscripts have been peer reviewed and accepted for publication but have not yet been edited. Author Manuscript Published OnlineFirst on November 20, 2015; DOI: 10.1158/1535-7163.MCT-15-0486

Published OnlineFirst November 20, 2015.Mol Cancer Ther Henar Hernando, Kathy A Gelato, Ralf Lesche, et al. upregulation of epithelial tumor suppressor genesEZH2 inhibition blocks multiple myeloma cell growth through
Updated version
10.1158/1535-7163.MCT-15-0486doi:
Access the most recent version of this article at:
Material
Supplementary
http://mct.aacrjournals.org/content/suppl/2015/11/20/1535-7163.MCT-15-0486.DC1
Access the most recent supplemental material at:
Manuscript
Authoredited. Author manuscripts have been peer reviewed and accepted for publication but have not yet been
E-mail alerts related to this article or journal.Sign up to receive free email-alerts
Subscriptions
Reprints and
To order reprints of this article or to subscribe to the journal, contact the AACR Publications
Permissions
Rightslink site. Click on "Request Permissions" which will take you to the Copyright Clearance Center's (CCC)
.http://mct.aacrjournals.org/content/early/2015/11/20/1535-7163.MCT-15-0486To request permission to re-use all or part of this article, use this link
on September 6, 2018. © 2015 American Association for Cancer Research. mct.aacrjournals.org Downloaded from
Author manuscripts have been peer reviewed and accepted for publication but have not yet been edited. Author Manuscript Published OnlineFirst on November 20, 2015; DOI: 10.1158/1535-7163.MCT-15-0486