#˜f, all-caps, 24pt a deeper look at table games...
TRANSCRIPT
By the team at Tangam Systemswww.tangamsystems.com
Does the design of your table games operation hinder pro�t potential?This article presents an in-depth review of the top 5 sources of operational ine�ciency. Strategies proposed here serve to improve the speed and accuracy of spread planning, and minimize the e�ects of operational gaps.
A DEEPER LOOK AT TABLE GAMES SPREAD PLANNINGIncreasing pro�t through operational alignment
Report Overall
Font Myriad Pro
Body Text#343434, 8pt
Title#�f, all-caps, 24pt Sub-Title#343434, 14.5pt
Description#6d6d6d, 12pt
Title Page + Table of Contents3-column width, right aligned
1
1
1
344
4 5 5 5 6 6 7
7 7 7 10 11 12
12 12
13
CONTENTS
Executive SummaryIntroductionPlanning the Table Game Mix, Open Hours and Betting Minimums Forecasting Patron Demand and Determining Target Occupancies
Unconstrained Ideal Spread
Capacity Constrained Ideal Spread
Shift Constrained Spread
Labour Constrained Spread
Roster
Floor Execution
E�ciency Gaps and Associated Pro�t Losses Game-Mix Design Gap
Table Scheduling and Pricing Gap
Levels of Control when Planning Table Minimums
Labour Allocation Gap
Rostering Gap
Floor Execution Gap
Integrated Solutions and the Use of Software Tools About Tangam Systems
Tang
am S
yste
ms,
Tabl
e G
ames
Spr
ead
Plan
ning
E�ective Yield Management combines sound analytical theory with e�cient spread planning operations.
After an in-depth review of the general approach to spread planning and its systematic constraints, this article exposes the top �ve gaps which reduce table games pro�ts:
1 Game Mix Design
2 Table Scheduling and Pricing
3 Labour Allocation
4 Rostering
5 Floor Execution
The strategies presented here serve to improve the spread planning process as a whole. Methods described allow the reader to benchmark optimal performance, and to monitor and measure the impact of these �ve operational gaps. The article goes on to propose strategies to improve spread planning speed and accuracy and to minimize these gaps.
Information, examples and descriptions presented in this article are based on real-world data, and demonstrate operational hindrances, several of which have been shown to encumber even the most advanced table game operators. All identifying features have been omitted to maintain the anonymity of contributors.
EXECUTIVE SUMMARY
The bene�t of yield management in casino table games is well established, and improved pro�ts have been demonstrated in various markets around the world. Three out of six 2013 �nancial reports from Macau based operators highlight “yield management initiatives” as strategic to maximizing pro�ts.1
While most table games operators have yield management strategies in place, e�ective operators support that yield management requires both sound theory, and e�cient execution. While the strategic theory is often established by table games management, execution requires the alignment of all table games ranks – it is this latter process that is often left unchecked. The focus of this paper is on the execution of yield management theory; the spread planning process, and translation from theory to action.
We set out with the appreciation that, in table games, yield management execution ultimately expresses itself in the planning of the gaming �oor – the mix of table games being o�ered, number of open hours of each gaming table, and the betting minimums at which those tables are priced – a process that is collectively referred to as spread planning.
The following sections present an overview of the conventional approach to spread planning, and expose procedural errors - e�ciency gaps - which erode management strategy. By identifying these gaps, this article enables table games management to take focused action. Reducing e�ciency gaps results in a more e�ective execution of yield management strategy, and ultimately, increases overall pro�t.
While the nuances of spread planning vary across operators, this article assumes certain ‘standards of best practice’ to limit the scope of investigation.2 Two key assumptions are: 1. that table spread plans are performed monthly, and 2. that statistical analyses are segment-speci�c.3 Information, examples and descriptions presented in this article are based on real-world data. To maintain the anonymity of contributors, all identifying features have been omitted.
INTRODUCTION
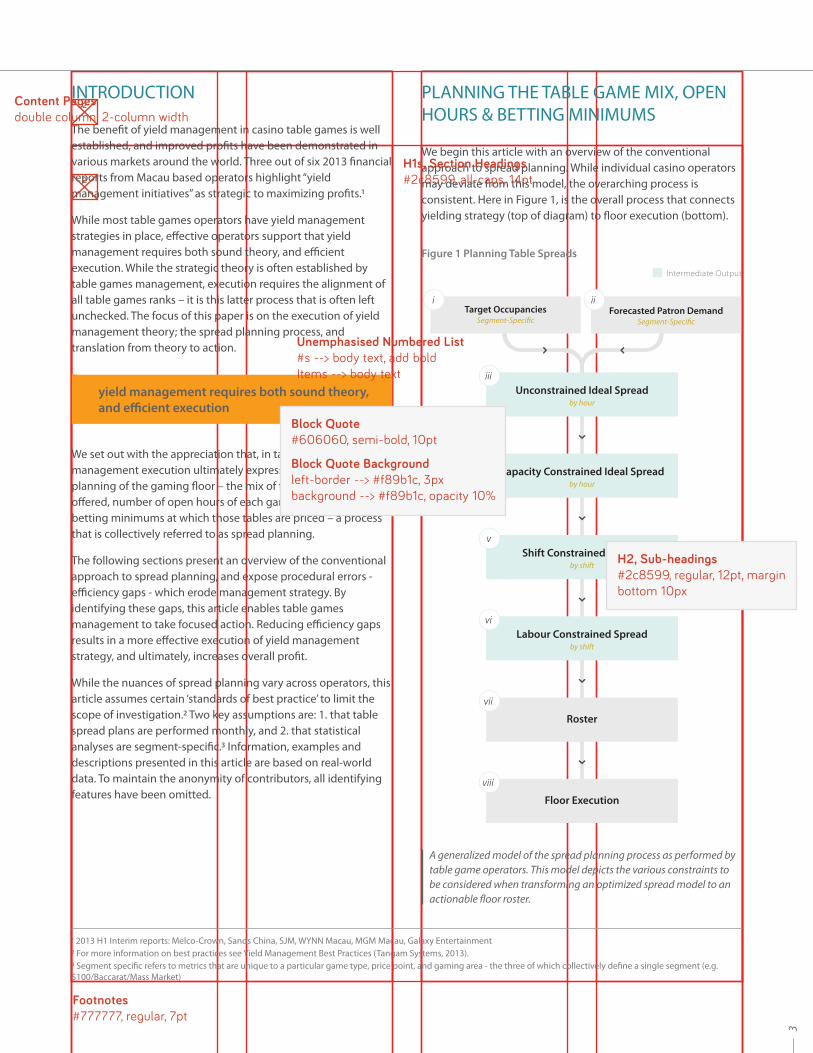
We begin this article with an overview of the conventional approach to spread planning. While individual casino operators may deviate from this model, the overarching process is consistent. Here in Figure 1, is the overall process that connects yielding strategy (top of diagram) to �oor execution (bottom).
PLANNING THE TABLE GAME MIX, OPENHOURS & BETTING MINIMUMS
yield management requires both sound theory, and e�cient execution
“
3
1 2013 H1 Interim reports: Melco-Crown, Sands China, SJM, WYNN Macau, MGM Macau, Galaxy Entertainment 2 For more information on best practices see Yield Management Best Practices (Tangam Systems, 2013).3 Segment speci�c refers to metrics that are unique to a particular game type, price point, and gaming area - the three of which collectively de�ne a single segment (e.g. $100/Baccarat/Mass Market)
Figure 1 Planning Table Spreads
A generalized model of the spread planning process as performed by table game operators. This model depicts the various constraints to be considered when transforming an optimized spread model to an actionable �oor roster.
Target OccupanciesSegment-Speci�c
iForecasted Patron Demand
Segment-Speci�c
ii
Unconstrained Ideal Spreadby hour
iii
Capacity Constrained Ideal Spreadby hour
iv
Shift Constrained Spreadby shift
v
Labour Constrained Spreadby shift
vi
Roster
vii
Floor Execution
viii
Intermediate Output
Content Pagesdouble column, 2-column width
H1s, Section Headings#2c8599, all-caps, 14pt
Unemphasised Numbered List#s --> body text, add boldItems --> body text
2
2
Block Quote#606060, semi-bold, 10pt
Block Quote Backgroundleft-border --> #f89b1c, 3pxbackground --> #f89b1c, opacity 10%
H2, Sub-headings#2c8599, regular, 12pt, marginbottom 10px
Footnotes#777777, regular, 7pt
4
intermediate output in the spread planning process. It is an hourly table schedule of the optimal number of tables, specifying the type and price of each open table. This output assumes that the property has in�nite capacity, labour, and complete �exibility in scheduling parameters – that it can open/close tables hourly, and modify table pricing at will.
Of course, an idealized unconstrained environment is far from gaming �oor reality. From this ideal, the spread planning process proceeds to overlay the various operational constraints to ensure that the output of spread planning is both optimal and feasible.
The greatest value of producing an Unconstrained Ideal Spread is to establish a benchmark against which operational e�ciency can be compared.
The �rst constraint pertains to capacity, and produces the hour-by-hour Capacity Constrained Ideal Spread (Figure 1-iv).
For properties where patron demand is high, it’s easy to imagine that capacity (�oor space, number of table licenses, or speci�c game mix) can inhibit management’s e�orts to cater to all possible patron segments. For a property in low season, or with adequate �oor space/table licenses, capacity constraints may not be signi�cant.
In cases where capacity is a hindrance, management must allocate the available capacity appropriately by ensuring tables are distributed appropriately among each game type. Furthermore, during periods of high demand, management must appropriately adjust table prices. In an e�ort to maximize pro�t, table games operators must ensure that the available capacity serves the most pro�table patron segments �rst.
Due to physical or licensing constraints, the mix of table games change less frequently. In contrast, the schedule of open hours and pricing for these tables can be quite dynamic and may change as often as bi-weekly.
Capacity Constrained Ideal Spread
Once capacity constraints have been accounted for, the next constraint to consider is sta� shift design. At this stage, the spread schedule moves from an hourly model, to a by-shift model – we refer to this as a Shift Constrained Spread (Figure 1-v). While an hourly model allows for tight alignment between forecasted patron demand and table supply, these hourly optimized outputs are simply not feasible in practice.
Shift Constrained Spread
6 Statistical methods for forecasting demand can be complex. To maintain scope, these methods are not explored in this paper.4 Game Mix – the game types and number of tables to be installed on the �oor.5 See Baccarat Yield Management (Tangam, 2013)
The connecting stages (green) are intermediate outputs - each one highlighting an operational constraint in the spread planning process.
Before investigating the details of this system, we de�ne its three distinct purposes: 1. To identify the game mix that best caters to patron demand,4 2. To determine the open hours schedule for each table, and 3. To indicate the betting minimums at which each table should be opened.
Because of the codependent nature of spread planning outputs (particularly open hours and table minimums), it’s important that they are planned simultaneously; such that limitations in one can be compensated for by accommodations in the other.
The following sections explain the spread planning process in detail.
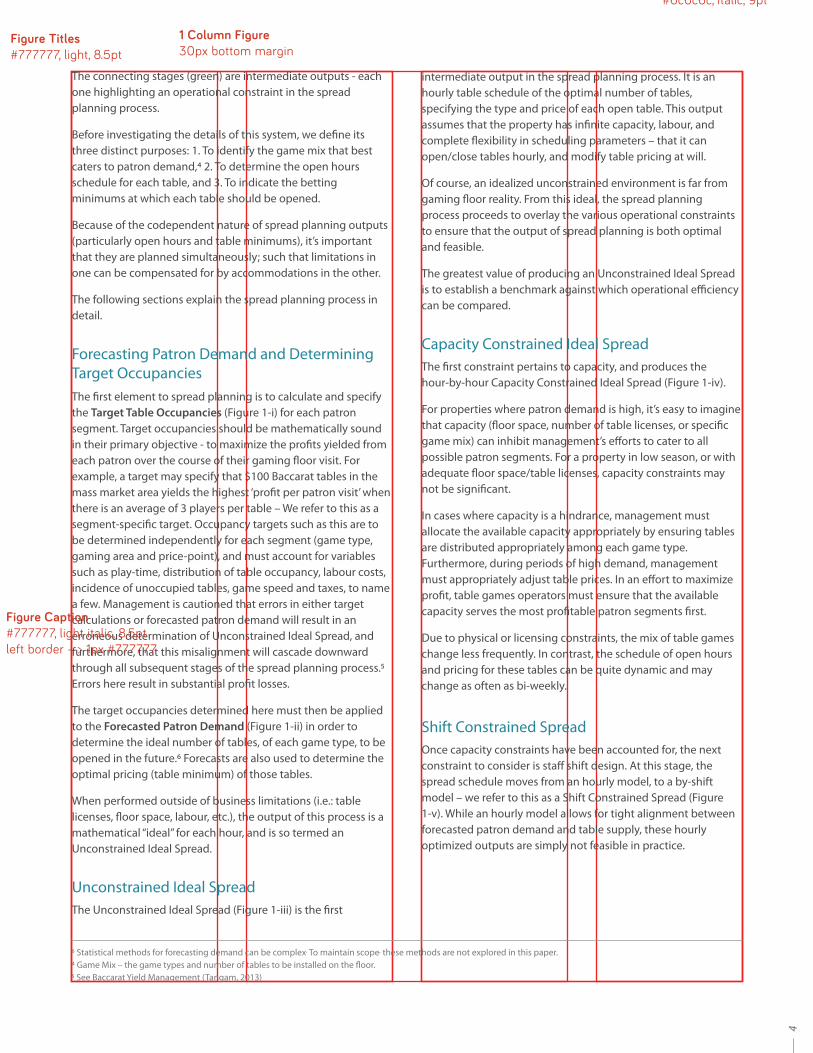
The �rst element to spread planning is to calculate and specify the Target Table Occupancies (Figure 1-i) for each patron segment. Target occupancies should be mathematically sound in their primary objective - to maximize the pro�ts yielded from each patron over the course of their gaming �oor visit. For example, a target may specify that $100 Baccarat tables in the mass market area yields the highest ‘pro�t per patron visit’ when there is an average of 3 players per table – We refer to this as a segment-speci�c target. Occupancy targets such as this are to be determined independently for each segment (game type, gaming area and price-point), and must account for variables such as play-time, distribution of table occupancy, labour costs, incidence of unoccupied tables, game speed and taxes, to name a few. Management is cautioned that errors in either target calculations or forecasted patron demand will result in an erroneous determination of Unconstrained Ideal Spread, and furthermore, that this misalignment will cascade downward through all subsequent stages of the spread planning process.5 Errors here result in substantial pro�t losses.
The target occupancies determined here must then be applied to the Forecasted Patron Demand (Figure 1-ii) in order to determine the ideal number of tables, of each game type, to be opened in the future.6 Forecasts are also used to determine the optimal pricing (table minimum) of those tables.
When performed outside of business limitations (i.e.: table licenses, �oor space, labour, etc.), the output of this process is a mathematical “ideal” for each hour, and is so termed an Unconstrained Ideal Spread.
Forecasting Patron Demand and DeterminingTarget Occupancies
The Unconstrained Ideal Spread (Figure 1-iii) is the �rst
Unconstrained Ideal Spread
Page Numbers#6c6c6c, italic, 9pt
Figure Titles#777777, light, 8.5pt
1 Column Figure30px bottom margin
Figure Caption#777777, light italic, 8.5ptleft border --> 1px #777777
In reality, table games operators have a �xed number of dealer shifts, each with a known start time and duration. For example, an operator may have nine distinct dealer start times, each one spanning eight hours.
Overlaying the shift design on the Capacity Constrained Ideal Spread ensures that table open/close times coincide with dealer start times, making labour allocation possible. This stage also computes trade-o�s in matching shift-supply with patron demand – computing instances where intentionally scheduling under/over-utilized tables is justi�ed. Intentional departures from the ideal for brief periods of time may be justi�ed when they are o�set by pro�ts gained during other times where supply/demand is tightly aligned.
Once more, as with capacity constraints, the shift constrained table spread will factor into determining table minimums. Where available shifts do not allow for segments to be adequately served, the schedule must ensure that the most pro�table patron price-points are served �rst.
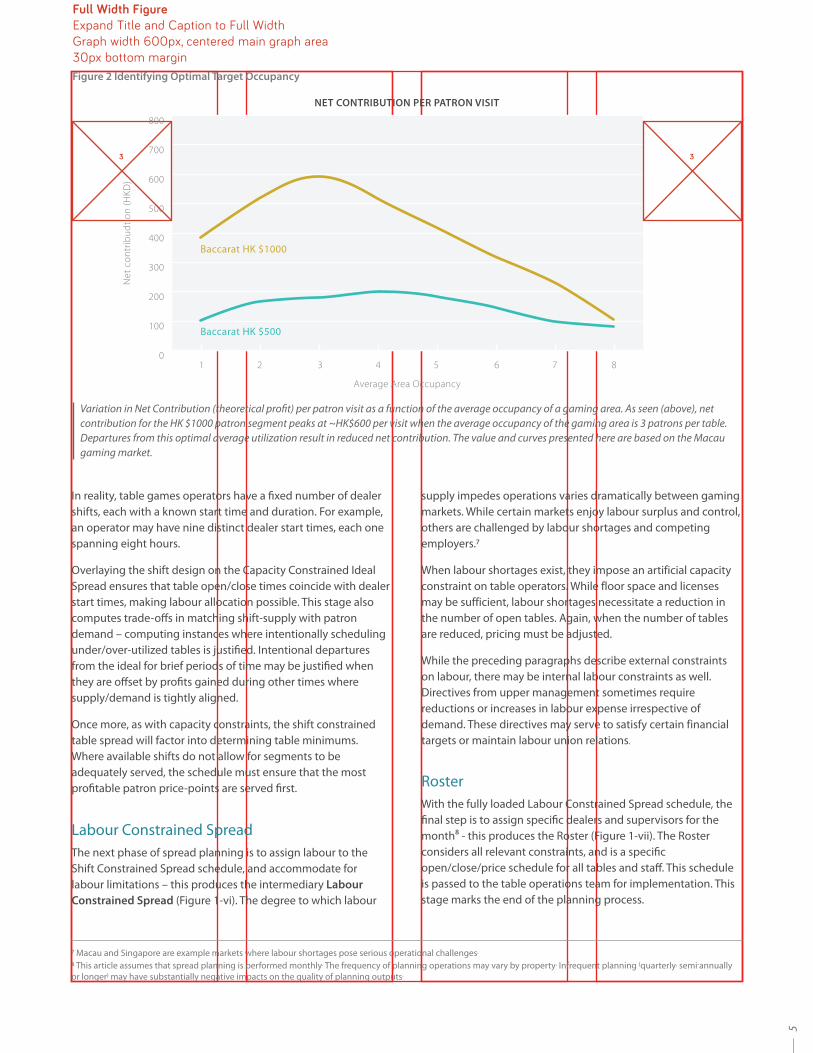
Figure 2 Identifying Optimal Target Occupancy
Variation in Net Contribution (theoretical pro�t) per patron visit as a function of the average occupancy of a gaming area. As seen (above), net contribution for the HK $1000 patron segment peaks at ~HK$600 per visit when the average occupancy of the gaming area is 3 patrons per table. Departures from this optimal average utilization result in reduced net contribution. The value and curves presented here are based on the Macau gaming market.
0
100
200
300
400
500
600
700
800
1 2 3 4 5 6 7 8
Baccarat HK $1000
NET CONTRIBUTION PER PATRON VISIT
Baccarat HK $500
The next phase of spread planning is to assign labour to the Shift Constrained Spread schedule, and accommodate for labour limitations – this produces the intermediary Labour Constrained Spread (Figure 1-vi). The degree to which labour
Labour Constrained Spread
supply impedes operations varies dramatically between gaming markets. While certain markets enjoy labour surplus and control, others are challenged by labour shortages and competing employers.7
When labour shortages exist, they impose an artificial capacity constraint on table operators. While floor space and licenses may be sufficient, labour shortages necessitate a reduction in the number of open tables. Again, when the number of tables are reduced, pricing must be adjusted.
While the preceding paragraphs describe external constraints on labour, there may be internal labour constraints as well. Directives from upper management sometimes require reductions or increases in labour expense irrespective of demand. These directives may serve to satisfy certain financial targets or maintain labour union relations.
With the fully loaded Labour Constrained Spread schedule, the �nal step is to assign speci�c dealers and supervisors for the month8 - this produces the Roster (Figure 1-vii). The Roster considers all relevant constraints, and is a speci�c open/close/price schedule for all tables and sta�. This schedule is passed to the table operations team for implementation. This stage marks the end of the planning process.
Roster
7 Macau and Singapore are example markets where labour shortages pose serious operational challenges.8 This article assumes that spread planning is performed monthly. The frequency of planning operations may vary by property. Infrequent planning (quarterly, semi-annually or longer) may have substantially negative impacts on the quality of planning outputs.
5
Net
con
trib
udtio
n (H
KD)
Average Area Occupancy
Full Width FigureExpand Title and Caption to Full WidthGraph width 600px, centered main graph area30px bottom margin
3 3
.
While the preceding sections describe the planning process, Floor Execution is the real-time implementation of that plan (Figure 1-viii). While �oor operations are typically outside the scope of planning teams, it’s important that planning sta� liaise with �oor operations to ensure that execution remains aligned with management strategy. Unpredictable situations like no-shows or sick leaves can place strain on �oor management, and impede their ability to execute even the most optimal Roster. In addition to unexpected labour events, �oor operators must also compensate for unforeseen volatility in patron demand. Even the best forecast models require ad hoc adjustments to meet unforeseen demand.
A thorough understanding of the spread planning process is prerequisite to identifying, and ultimately correcting, operational e�ciency losses. In this section we discuss a variety of operational ‘friction-points’ or ‘gaps’. These gaps are sources of e�ciency loss; they hinder optimal spread planning, and result in reduced table games pro�t.
For table games operators, understanding the sources of e�ciency gaps is only a �rst step. To drive operational improvement these gaps must be measured and actively managed. While all casinos have a system of constraints, high-performing teams equipped with the right tools can minimize the impact of e�ciency gaps and therefore improve table game performance.
Floor Execution
E�ciency Gaps and Associated Pro�t Losses
The right tools (teams) can minimize the impact of e�ciency gaps and therefore improve table game performance.
“
While capacity-related constraints (i.e. �oor space, table licenses) are a natural occurrence, the �rst gap is management’s e�ectiveness in allocating the constrained capacity. Simply put, the greater the mis-allocation, the larger the gap (Figure 3-i).
Table games analysts have a variety of metrics when proposing a game mix change. One common practice is to cite current table performance – either by way of ‘Win per open hour’ or ‘Win per day’ - as a forecast for future table performance. In this approach, analysts rank all table products from highest performance to lowest – and simply reallocate tables from the
Game-Mix Design Gap
Table scheduling and pricing gaps occur when the available dealer shifts or the scheduled open hours do not align with patron demand curves (Figure 3-ii).
Patron demand varies throughout the day; therefore it is important that dealer shifts are aligned with demand to ensure, for instance, that dealers do not arrive three hours earlier than their patrons, and leave three hours too soon.
Table Scheduling and Pricing Gap
lower game types to higher ones. The process is repeated on a regular basis, monthly or quarterly.
While this approach seems straightforward, it’s based on a fundamental oversight: That table occupancy a�ects table performance, and subsequently, that spread changes to a game will in turn a�ect the pro�tability of that game. Allocating more capacity to high performance games will only generate incremental pro�t if the segment was previously underspread. In the event that the segment was spread correctly, or overspread, capacity increases will worsen utilization and reduce overall pro�ts.
The usefulness of this strategy is further reduced when historical utilization is inconsistent; for instance, the game is overspread from Mon-Thurs, but underspread from Fri to Sun. When utilization �uctuates it’s unclear whether, when, and to what extent, open hours should be increased or reduced. This task is virtually impossible when the net contribution of each table occupancy is unknown (Figure 2).
Manually testing di�erent capacity combinations on the �oor, through trial and error, is a long and cumbersome process. It can result in pro�t losses, and there is no guarantee that the optimal setup will be found.
Some operators run mathematical sensitivity analyses (or ‘what-if’ scenarios) before implementing a capacity reallocation. These tests allow management to measure the theoretical �nancial gain/loss of capacity changes before enacting them on the gaming �oor (Figure 4).
With the right software tools, and skilled analysts, management can quickly and easily minimize the game mix design gap. Used to their fullest extent, mathematical models and software tools enable management to test hundreds of potential capacity allocations prior to implementation – A marked improvement over manual �oor experiments.
Of course, as the demand for table products vary over time, capacity allocation assessments must be repeated regularly to ensure that the game-mix is current and relevant. Assessments performed quarterly, or more frequently, ensure that the game-mix is in line with most current patron demands.
6
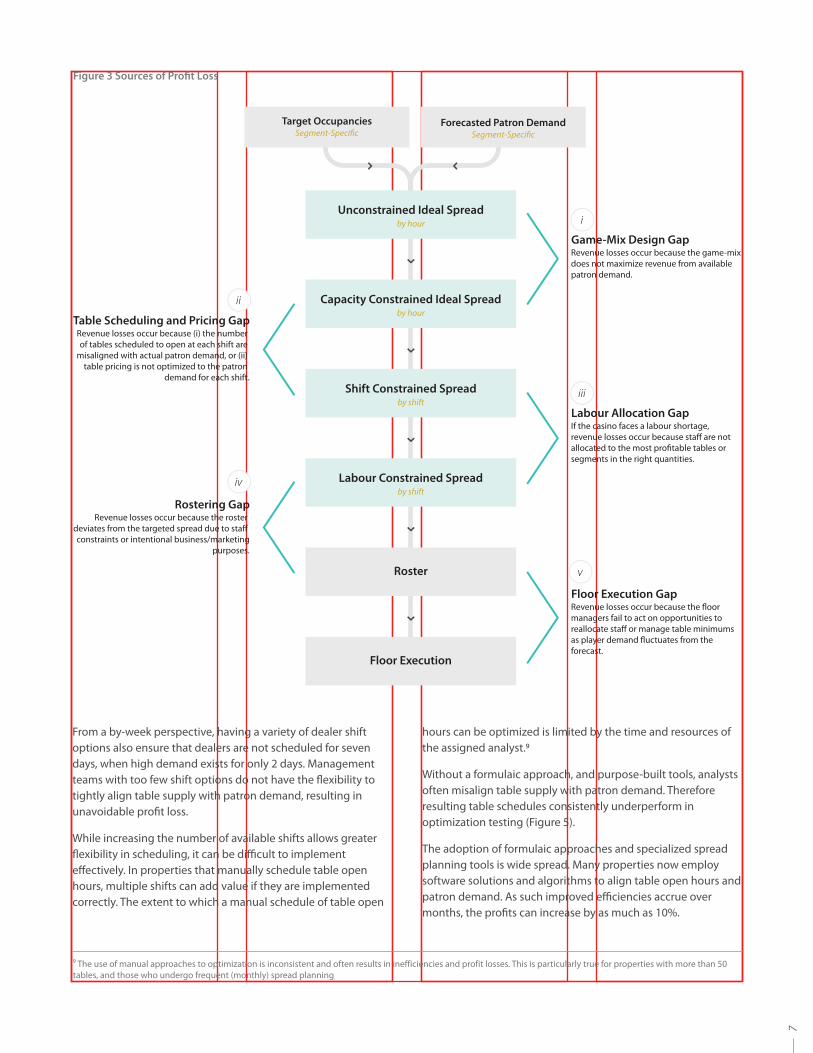
Figure 3 Sources of Pro�t Loss
Revenue losses occur because the game-mix does not maximize revenue from available patron demand.
Game-Mix Design Gap
If the casino faces a labour shortage, revenue losses occur because sta� are not allocated to the most pro�table tables or segments in the right quantities.
Labour Allocation Gap
Revenue losses occur because (i) the number of tables scheduled to open at each shift are
misaligned with actual patron demand, or (ii) table pricing is not optimized to the patron
demand for each shift.
Table Scheduling and Pricing Gap
Revenue losses occur because the roster deviates from the targeted spread due to sta� constraints or intentional business/marketing
purposes.
Rostering Gap
Revenue losses occur because the �oor managers fail to act on opportunities to reallocate sta� or manage table minimums as player demand �uctuates from the forecast.
Floor Execution Gap
Target OccupanciesSegment-Speci�c
Forecasted Patron DemandSegment-Speci�c
Unconstrained Ideal Spreadby hour
Capacity Constrained Ideal Spreadby hour
Shift Constrained Spreadby shift
Labour Constrained Spreadby shift
Roster
Floor Execution
ii
i
iii
iv
v
From a by-week perspective, having a variety of dealer shift options also ensure that dealers are not scheduled for seven days, when high demand exists for only 2 days. Management teams with too few shift options do not have the �exibility to tightly align table supply with patron demand, resulting in unavoidable pro�t loss.
While increasing the number of available shifts allows greater �exibility in scheduling, it can be di�cult to implement e�ectively. In properties that manually schedule table open hours, multiple shifts can add value if they are implemented correctly. The extent to which a manual schedule of table open
hours can be optimized is limited by the time and resources of the assigned analyst.9
Without a formulaic approach, and purpose-built tools, analysts often misalign table supply with patron demand. Therefore resulting table schedules consistently underperform in optimization testing (Figure 5).
The adoption of formulaic approaches and specialized spread planning tools is wide spread. Many properties now employ software solutions and algorithms to align table open hours and patron demand. As such improved e�ciencies accrue over months, the pro�ts can increase by as much as 10%.
9 The use of manual approaches to optimization is inconsistent and often results in inefficiencies and profit losses. This is particularly true for properties with more than 50 tables, and those who undergo frequent (monthly) spread planning.
7
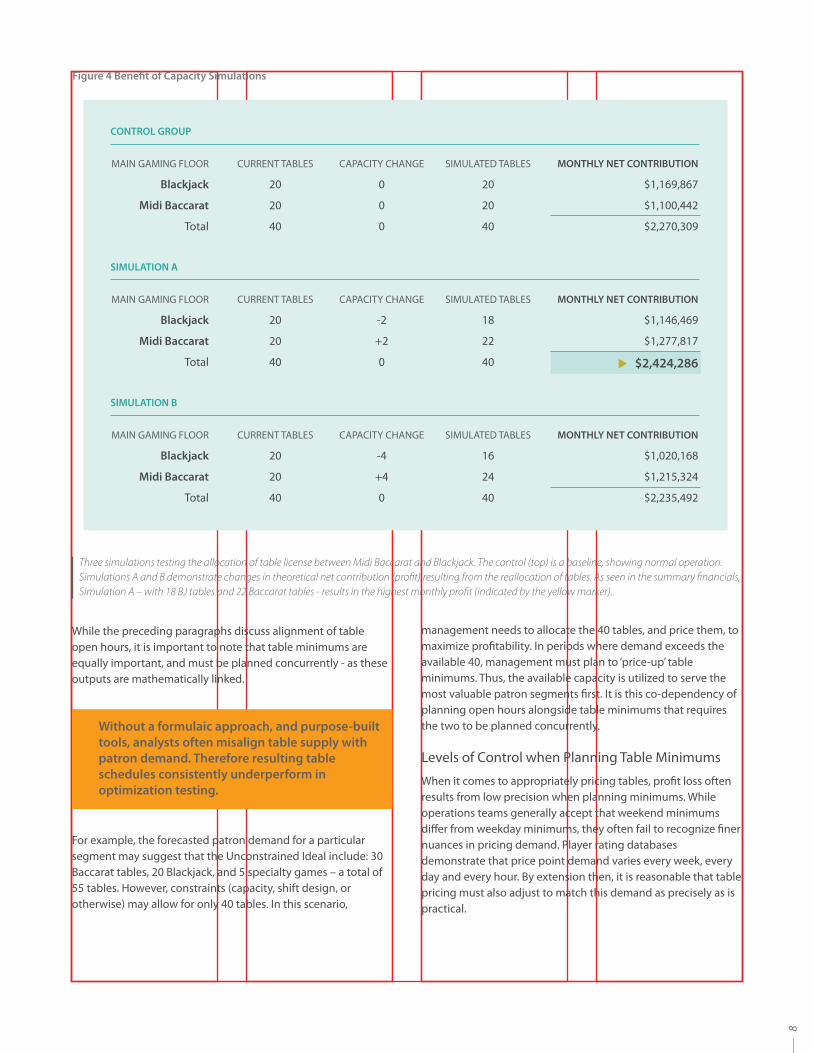
Figure 4 Bene�t of Capacity Simulations
CONTROL GROUP
MAIN GAMING FLOOR
Blackjack
Midi Baccarat
Total
CURRENT TABLES
20
20
40
CAPACITY CHANGE
0
0
0
SIMULATED TABLES
20
20
40
MONTHLY NET CONTRIBUTION
$1,169,867
$1,100,442
$2,270,309
SIMULATION A
MAIN GAMING FLOOR
Blackjack
Midi Baccarat
Total
CURRENT TABLES
20
20
40
CAPACITY CHANGE
-2
+2
0
SIMULATED TABLES
18
22
40
MONTHLY NET CONTRIBUTION
$1,146,469
$1,277,817
$2,424,286
SIMULATION B
MAIN GAMING FLOOR
Blackjack
Midi Baccarat
Total
CURRENT TABLES
20
20
40
CAPACITY CHANGE
-4
+4
0
SIMULATED TABLES
16
24
40
MONTHLY NET CONTRIBUTION
$1,020,168
$1,215,324
$2,235,492
Three simulations testing the allocation of table license between Midi Baccarat and Blackjack. The control (top) is a baseline, showing normal operation. Simulations A and B demonstrate changes in theoretical net contribution (pro�t) resulting from the reallocation of tables. As seen in the summary �nancials, Simulation A – with 18 BJ tables and 22 Baccarat tables - results in the highest monthly pro�t (indicated by the yellow marker).
For example, the forecasted patron demand for a particular segment may suggest that the Unconstrained Ideal include: 30 Baccarat tables, 20 Blackjack, and 5 specialty games – a total of 55 tables. However, constraints (capacity, shift design, or otherwise) may allow for only 40 tables. In this scenario,
Without a formulaic approach, and purpose-built tools, analysts often misalign table supply with patron demand. Therefore resulting table schedules consistently underperform in optimization testing.
“
management needs to allocate the 40 tables, and price them, to maximize pro�tability. In periods where demand exceeds the available 40, management must plan to ‘price-up’ table minimums. Thus, the available capacity is utilized to serve the most valuable patron segments �rst. It is this co-dependency of planning open hours alongside table minimums that requires the two to be planned concurrently.
8When it comes to appropriately pricing tables, pro�t loss often results from low precision when planning minimums. While operations teams generally accept that weekend minimums di�er from weekday minimums, they often fail to recognize �ner nuances in pricing demand. Player rating databases demonstrate that price point demand varies every week, every day and every hour. By extension then, it is reasonable that table pricing must also adjust to match this demand as precisely as is practical.
Levels of Control when Planning Table Minimums
While the preceding paragraphs discuss alignment of table open hours, it is important to note that table minimums are equally important, and must be planned concurrently - as these outputs are mathematically linked.
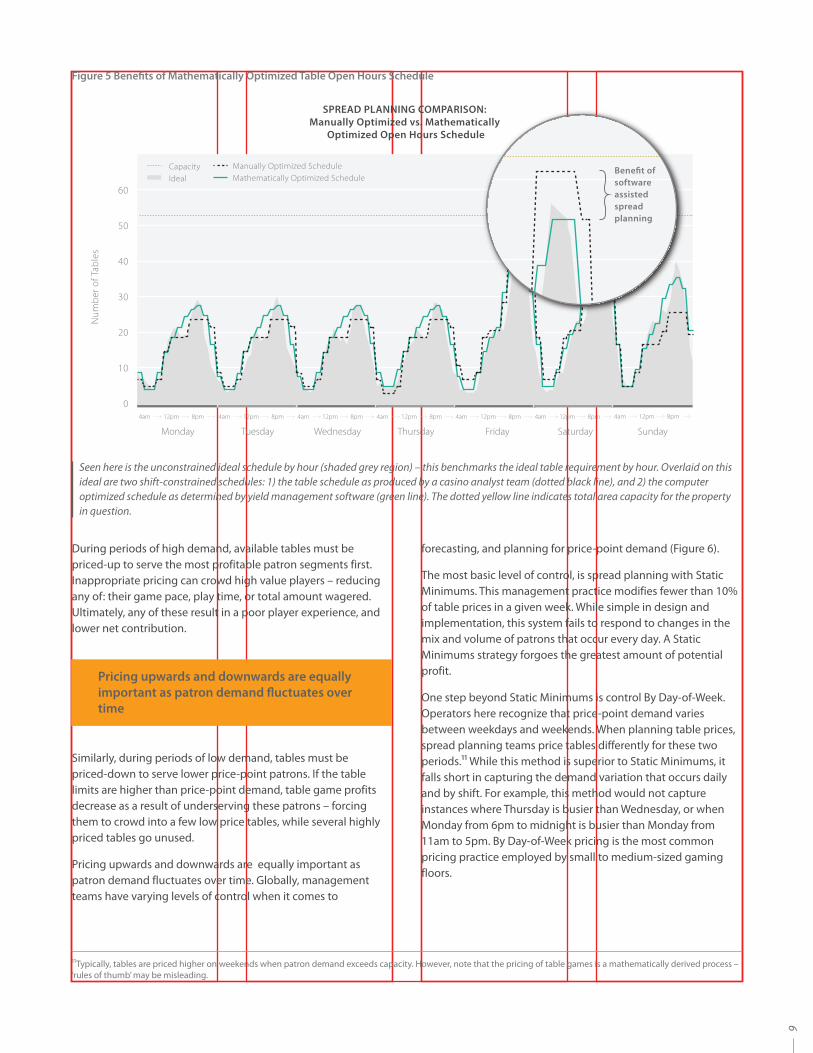
During periods of high demand, available tables must be priced-up to serve the most profitable patron segments first. Inappropriate pricing can crowd high value players – reducing any of: their game pace, play time, or total amount wagered. Ultimately, any of these result in a poor player experience, and lower net contribution.
0
10
20
30
40
50
60
Monday
4am 12pm 8pm
Tuesday Wednesday Thursday Friday Saturday Sunday
4am 12pm 8pm 4am 12pm 8pm 4am 12pm 8pm 4am 12pm 8pm 4am 12pm 8pm 4am 12pm 8pm
Seen here is the unconstrained ideal schedule by hour (shaded grey region) – this benchmarks the ideal table requirement by hour. Overlaid on this ideal are two shift-constrained schedules: 1) the table schedule as produced by a casino analyst team (dotted black line), and 2) the computer optimized schedule as determined by yield management software (green line). The dotted yellow line indicates total area capacity for the property in question.
SPREAD PLANNING COMPARISON: Manually Optimized vs. Mathematically
Optimized Open Hours Schedule
Figure 5 Bene�ts of Mathematically Optimized Table Open Hours Schedule
Tuesday Wednesday Thursday Friday Saturday
8pm 4am 12pm 8pm 4am 12pm 8pm 4am 12pm 8pm 4am 12pm 8pm 4am
forecasting, and planning for price-point demand (Figure 6).
The most basic level of control, is spread planning with Static Minimums. This management practice modifies fewer than 10% of table prices in a given week. While simple in design and implementation, this system fails to respond to changes in the mix and volume of patrons that occur every day. A Static Minimums strategy forgoes the greatest amount of potential profit.
One step beyond Static Minimums is control By Day-of-Week. Operators here recognize that price-point demand varies between weekdays and weekends. When planning table prices, spread planning teams price tables differently for these two periods.11 While this method is superior to Static Minimums, it falls short in capturing the demand variation that occurs daily and by shift. For example, this method would not capture instances where Thursday is busier than Wednesday, or when Monday from 6pm to midnight is busier than Monday from 11am to 5pm. By Day-of-Week pricing is the most common pricing practice employed by small to medium-sized gaming floors.
Pricing upwards and downwards are equally important as patron demand �uctuates over time
“
11Typically, tables are priced higher on weekends when patron demand exceeds capacity. However, note that the pricing of table games is a mathematically derived process – ‘rules of thumb’ may be misleading.
9
Num
ber o
f Tab
les
CapacityIdeal
Bene�t of software assisted spread planning
Similarly, during periods of low demand, tables must be priced-down to serve lower price-point patrons. If the table limits are higher than price-point demand, table game profits decrease as a result of underserving these patrons – forcing them to crowd into a few low price tables, while several highly priced tables go unused.
Pricing upwards and downwards are equally important as patron demand fluctuates over time. Globally, management teams have varying levels of control when it comes to
Manually Optimized ScheduleMathematically Optimized Schedule
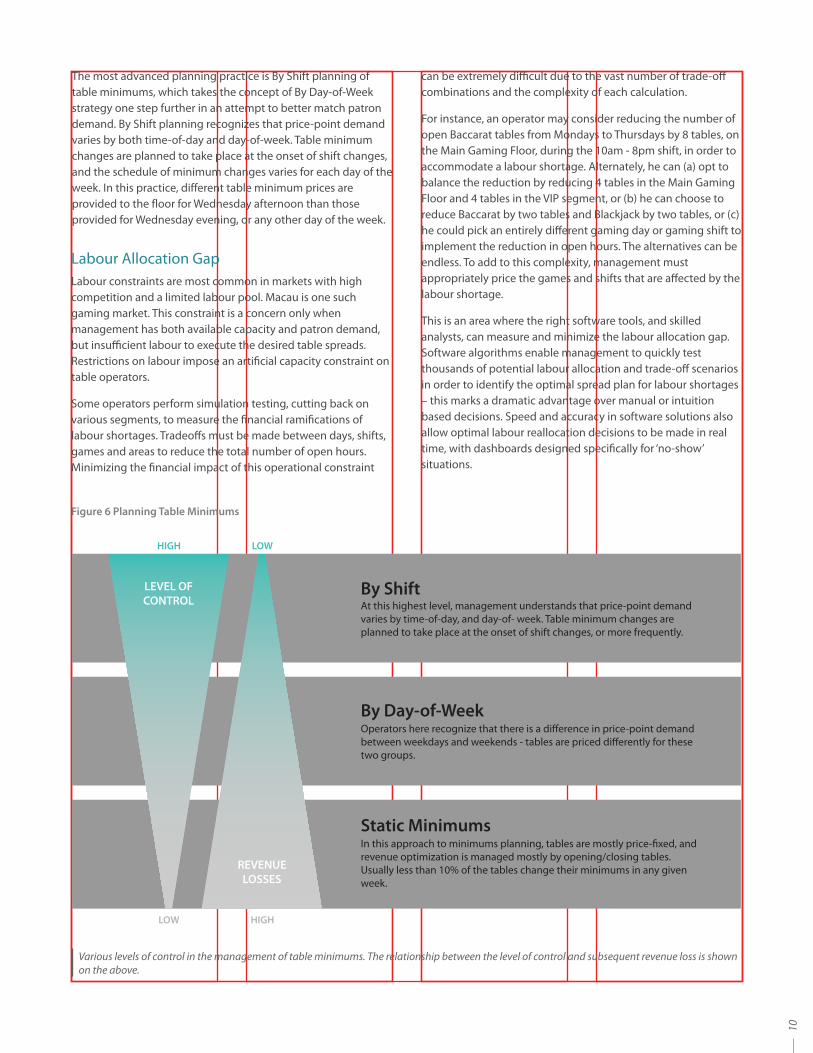
The most advanced planning practice is By Shift planning of table minimums, which takes the concept of By Day-of-Week strategy one step further in an attempt to better match patron demand. By Shift planning recognizes that price-point demand varies by both time-of-day and day-of-week. Table minimum changes are planned to take place at the onset of shift changes, and the schedule of minimum changes varies for each day of the week. In this practice, different table minimum prices are provided to the floor for Wednesday afternoon than those provided for Wednesday evening, or any other day of the week.
At this highest level, management understands that price-point demand varies by time-of-day, and day-of- week. Table minimum changes are planned to take place at the onset of shift changes, or more frequently.
Operators here recognize that there is a di�erence in price-point demand between weekdays and weekends - tables are priced di�erently for these two groups.
In this approach to minimums planning, tables are mostly price-�xed, and revenue optimization is managed mostly by opening/closing tables. Usually less than 10% of the tables change their minimums in any given week.
By Shift
By Day-of-Week
Static Minimums
HIGH
HIGH
LOW
LOW
LEVEL OFCONTROL
REVENUELOSSES
Various levels of control in the management of table minimums. The relationship between the level of control and subsequent revenue loss is shown on the above.
Figure 6 Planning Table Minimums
can be extremely di�cult due to the vast number of trade-o� combinations and the complexity of each calculation.
For instance, an operator may consider reducing the number of open Baccarat tables from Mondays to Thursdays by 8 tables, on the Main Gaming Floor, during the 10am - 8pm shift, in order to accommodate a labour shortage. Alternately, he can (a) opt to balance the reduction by reducing 4 tables in the Main Gaming Floor and 4 tables in the VIP segment, or (b) he can choose to reduce Baccarat by two tables and Blackjack by two tables, or (c) he could pick an entirely di�erent gaming day or gaming shift to implement the reduction in open hours. The alternatives can be endless. To add to this complexity, management must appropriately price the games and shifts that are a�ected by the labour shortage.
This is an area where the right software tools, and skilled analysts, can measure and minimize the labour allocation gap. Software algorithms enable management to quickly test thousands of potential labour allocation and trade-o� scenarios in order to identify the optimal spread plan for labour shortages – this marks a dramatic advantage over manual or intuition based decisions. Speed and accuracy in software solutions also allow optimal labour reallocation decisions to be made in real time, with dashboards designed speci�cally for ‘no-show’ situations.
10
Labour constraints are most common in markets with high competition and a limited labour pool. Macau is one such gaming market. This constraint is a concern only when management has both available capacity and patron demand, but insu�cient labour to execute the desired table spreads. Restrictions on labour impose an arti�cial capacity constraint on table operators.
Some operators perform simulation testing, cutting back on various segments, to measure the �nancial rami�cations of labour shortages. Tradeo�s must be made between days, shifts, games and areas to reduce the total number of open hours. Minimizing the �nancial impact of this operational constraint
Labour Allocation Gap
Rostering ine�ciencies result when planning sta� consciously choose to depart from the mathematically optimized , fully constrained schedule. There are several reasons for this to occur; known employee accommodations, anticipated labour shortages, ‘padding’ for local events/shows, or to support certain marketing initiatives. Marketing may mandate that a game type be opened, irrespective of demand, in an e�ort to entice player involvement.
Another rostering pitfall is to rely on a single occupancy target for all table game segments. In this practice planning sta� fail to recognize that each and every segment on the gaming �oor has a di�erent yield curve, and therefore a distinct occupancy target (Figure 2). Some commonly used rostering products lend themselves to this thinking by accepting a single input for ‘desired occupancy’. These products apply this number to all tables, irrespective of game type or price-point. With some segments yielding maximum pro�ts at 6 patrons per table, and others yielding at 1, it’s easy to see that a single representative spread target underserves both segments.
For management teams who practice infrequent spread planning, rosters in use are often several months out of date. Monitoring the alignment of the roster with the optimized schedule helps ensure that �oor sta� have a best possible chance at executing optimal strategy.
Due to the dynamic nature of patron activity in table games �oor, forecast models and spread plans may not be accurate in their prediction of patron demand. This uncertainty means that shift and pit managers will always need to adjust spreads and table minimums in real time - as patron demand �uctuates or labour constraints arise.
On the �oor, at the onset of a new shift, gaming managers compare their pre-planned schedule to the gaming �oor reality – the patron volume and available labour force. Segments experiencing high patron demand are allocated additional dealers and supervisors from less pro�table segments. In addition to dynamically opening or closing tables, pit managers are also required to respond to pricing needs. These ‘demand response’ decisions must be aligned to maximize overall pro�t across the entire gaming �oor. This requires that �oor operations understand segmental pro�t modeling and are able to rapidly assess the incremental gain/loss of the decisions they make.
Though �oor actions may contradict the roster, these dynamic adjustments may not reduce pro�t. When forecasts are incorrect, �oor operations are entrusted to adjust for the situation at hand. Dynamic adjustments are the last line of defense in achieving the objective of optimal table utilization.
However, when �oor operations are not aligned with the overarching yield management strategy, dynamic adjustments may result in lost pro�t. These are cases where, despite available
resources, opportunities to reallocate dealers or manage table minimums are not acted upon. It’s for this reason that dynamic adjustments must be monitored – for alignment to roster as well as alignment with table occupancy targets.
Floor Execution Gap
As demonstrated throughout this article, spread planning is a complex and involved process. Even with optimization models, matching algorithms and scenario testing, spread planning must be repeated on a regular basis. However, to the relief of operations teams, there are alternatives to manual spread planning. The use of appropriate software tools can lend substantial support to the various stages of the spread planning process. In planning activities, yield management software allow management to dramatically increase the speed and scope of data aggregation and quantitative number crunching. Automation tools alleviate rote computation, and enable analysts and management to focus on big picture initiatives. In �oor execution, software tools provide decision support and data driven recommendations to �oor sta�, enabling them to make good, defendable, decisions.
Advanced operators utilize specialized table yield management software to aggregate multiple sources of data, forecast patron demand, and to determine the optimal game mix, table spreads and betting limits - all with respect to operational constraints. These solutions also provide dashboards that dynamically update key performance metrics (number of tables open, pricing/utilization issues etc.) in real time.
While this article shares the techniques and tools that constitute industry best practices, the culture and attitude of the management team is of utmost importance. Irrespective of techniques or tools, management must foster a culture of ‘data-driven’ decision-making. Table games management is only partly about analyzing data. It also includes constructing a complete picture of the business and the market in which it operates. This is not the area of analysis, but of synthesis. It is important that every member of the organization, from executive management to �oor sta�, be integrated and involved in maximizing table game pro�t.
11
Rostering Gap
Integrated Solutions and the Use of Software Tools
About Tangam Systems
Tangam Systems develops business intelligence software that helps casinos of all sizes enhance their table games business in order to increase pro�ts, e�ciency and provide a better gaming experience for players.
Our �agship product – Table Games Yield Management (TYM) – is a breakthrough solution that changes the way casinos use data. TYM automatically analyzes headcount and gaming data and then provides intuitive visualizations, predictive analytics and actionable recommendations to align your game mix, spread and pricing with actual player demand in order to maximize your table games pro�t.
www.tangamsystems.com | [email protected]
Tang
am S
yste
ms,
Tabl
e G
ames
Spr
ead
Plan
ning