f entrainment and urbine mortality study - alabama power · the goals of this “desktop”...
TRANSCRIPT
FISH ENTRAINMENT AND TURBINE MORTALITY STUDY
HOLT PROJECT
(FERC PROJECT NO. 2203)
FINAL REPORT
Prepared for: ALABAMA POWER COMPANY
Prepared by:
FEBRUARY 2012

FISH ENTRAINMENT AND TURBINE MORTALITY STUDY
HOLT PROJECT
FINAL REPORT
Prepared for: ALABAMA POWER COMPANY
Prepared by:
FEBRUARY 2012
i
FISH ENTRAINMENT AND TURBINE MORTALITY STUDY
HOLT PROJECT
FINAL REPORT
ALABAMA POWER COMPANY
TABLE OF CONTENTS
EXECUTIVE SUMMARY .............................................................................................................1
1.0 INTRODUCTION ...............................................................................................................1 1.1 PROJECT DESCRIPTION ..............................................................................................2
2.0 METHODS ..........................................................................................................................3 2.1 ENTRAINMENT ..........................................................................................................3
2.1.1 DEFINE THE ENTRAINMENT DATABASE ........................................................3 2.1.2 FISH ENTRAINMENT RATES ...........................................................................4 2.1.3 SPECIES AND SIZE COMPOSITION ..................................................................4 2.1.4 TURBINE FLOWS ...........................................................................................5 2.1.5 CALCULATION OF ENTRAINMENT ESTIMATES ...............................................5
2.2 TURBINE MORTALITY ...............................................................................................6 2.2.1 TURBINE MORTALITY DATABASE .................................................................7 2.2.2 TURBINE MORTALITY RATE .........................................................................7 2.2.3 CALCULATION OF THE TURBINE MORTALITY ESTIMATE ..............................7
3.0 RESULTS ............................................................................................................................8 3.1 ENTRAINMENT ..........................................................................................................8
3.1.1 ESTIMATED TOTAL NUMBER OF FISH ENTRAINED BY MONTH AND SEASON .........................................................................................................8
3.1.2 NUMBER OF FISH ENTRAINED WITHIN EACH FAMILY GROUP BY SEASON .........................................................................................................8
3.1.3 NUMBER OF ENTRAINED FISH WITHIN EACH 25MM (1-INCH) LENGTH-GROUP FOR EACH FAMILY GROUP .................................................8
3.2 TURBINE MORTALITY ...............................................................................................8
4.0 DISCUSSION ......................................................................................................................9
5.0 LITERATURE CITED ......................................................................................................10
TABLE OF CONTENTS (CONT’D.)
ii
LIST OF TABLES TABLE 1 ENTRAINMENT RATE INFORMATION FROM THE 9-STUDY DATABASE
(FISH/MCF OF WATER) ..............................................................................................1 TABLE 2 SPECIES LIKELY TO OCCUR IN THE VICINITY OF HOLT LOCK AND DAM
GROUPED BY FAMILIES (SOURCE: CHRIS GREENE, PERSONAL COMMUNICATION, AS MODIFIED BY KLEINSCHMIDT) ...............................................2
TABLE 3 FAMILY GROUP ENTRAINMENT ESTIMATES (PERCENT) (FROM THE FROM THE 9-STUDY DATABASE) .........................................................................................5
TABLE 4 ANNUAL SIZE COMPOSITION OF FISH FAMILY/GENUS GROUPS IN THE ENTRAINMENT DATABASE (BY PERCENT) .................................................................8
TABLE 5 TOTAL MONTHLY FLOWS THROUGH THE HOLT PROJECT (MILLION CUBIC FEET) FROM 2000 THROUGH 2010 AND 10-YEAR AVERAGE. .....................................9
TABLE 6 SUMMARY OF MORTALITY RATES BY FAMILY/GENUS GROUP FOR KAPLAN/PROPELLER-TYPE TURBINE STUDIES ........................................................10
TABLE 7 TOTAL NUMBER OF FISH ENTRAINED BY MONTH AND BY SEASON .........................11 TABLE 8 ESTIMATED NUMBER OF FISH POTENTIALLY ENTRAINED WITHIN EACH
FAMILY GROUP BY SEASON ....................................................................................11 TABLE 9 ANNUAL SIZE COMPOSITION OF FISH FAMILY/GENUS GROUPS IN THE
ENTRAINMENT DATABASE ......................................................................................12 TABLE 10 WINTER SIZE COMPOSITION OF ENTRAINED FISH BY FAMILY/GENUS GROUP
FROM THE STUDY DATABASE .................................................................................13 TABLE 11 SPRING SIZE COMPOSITION OF ENTRAINED FISH BY FAMILY/GENUS GROUP
FROM THE STUDY DATABASE .................................................................................14 TABLE 12 SUMMER SIZE COMPOSITION OF ENTRAINED FISH BY FAMILY/GENUS
GROUP FROM THE STUDY DATABASE .....................................................................15 TABLE 13 FALL SIZE COMPOSITION OF ENTRAINED FISH BY FAMILY/GENUS GROUP
FROM THE STUDY DATABASE .................................................................................16 TABLE 14 ESTIMATED ANNUAL TOTAL NUMBER OF POTENTIALLY ENTRAINED FISH
KILLED DUE TO TURBINE MORTALITY AT THE HOLT PROJECT ...............................17 TABLE 15 ANNUAL SIZE COMPOSITION OF FISH KILLED BY FAMILY/GENUS GROUPS ............18 TABLE 16 WINTER SIZE COMPOSITION OF FISH KILLED BY FAMILY/GENUS GROUP ...............19 TABLE 17 SPRING SIZE COMPOSITION OF FISH KILLED BY FAMILY/GENUS GROUP ................20 TABLE 18 SUMMER SIZE COMPOSITION OF FISH KILLED BY FAMILY/GENUS GROUP ..............21 TABLE 19 FALL SIZE COMPOSITION OF FISH KILLED BY FAMILY/GENUS GROUP ...................22
LIST OF APPENDICES
APPENDIX A STUDY PLAN APPENDIX B SUPPORTING STUDY DATA APPENDIX C FRESHWATER DRUM INFORMATION APPENDIX D AGENCY QUESTIONS/COMMENTS AND ALABAMA POWER RESPONSE APPENDIX E ANNUAL AND MONTHLY FLOW DURATION CURVES APC - Holt\Studies\Entrainment\2012-2-3 Holt Entrainment Report Final.docx
ES-1
FISH ENTRAINMENT AND TURBINE MORTALITY STUDY
HOLT PROJECT
FINAL REPORT
ALABAMA POWER COMPANY
EXECUTIVE SUMMARY
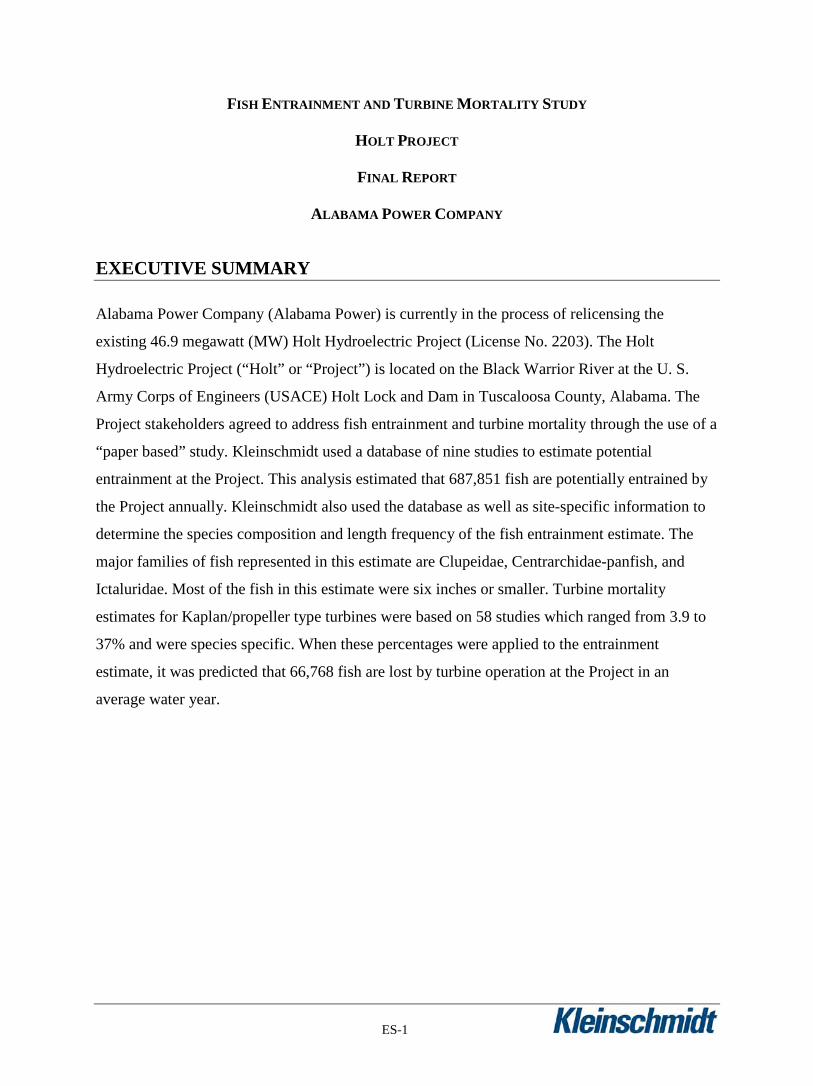
Alabama Power Company (Alabama Power) is currently in the process of relicensing the
existing 46.9 megawatt (MW) Holt Hydroelectric Project (License No. 2203). The Holt
Hydroelectric Project (“Holt” or “Project”) is located on the Black Warrior River at the U. S.
Army Corps of Engineers (USACE) Holt Lock and Dam in Tuscaloosa County, Alabama. The
Project stakeholders agreed to address fish entrainment and turbine mortality through the use of a
“paper based” study. Kleinschmidt used a database of nine studies to estimate potential
entrainment at the Project. This analysis estimated that 687,851 fish are potentially entrained by
the Project annually. Kleinschmidt also used the database as well as site-specific information to
determine the species composition and length frequency of the fish entrainment estimate. The
major families of fish represented in this estimate are Clupeidae, Centrarchidae-panfish, and
Ictaluridae. Most of the fish in this estimate were six inches or smaller. Turbine mortality
estimates for Kaplan/propeller type turbines were based on 58 studies which ranged from 3.9 to
37% and were species specific. When these percentages were applied to the entrainment
estimate, it was predicted that 66,768 fish are lost by turbine operation at the Project in an
average water year.

1
FISH ENTRAINMENT AND TURBINE MORTALITY STUDY
HOLT PROJECT
FINAL REPORT
ALABAMA POWER COMPANY
1.0 INTRODUCTION
Alabama Power Company (Alabama Power) is currently in the process of relicensing the
existing 46.9 megawatt (MW) Holt Hydroelectric Project (License No. 2203). The Holt
Hydroelectric Project (“Holt” or “Project”) is located on the Black Warrior River at the U. S.
Army Corps of Engineers (USACE) Holt Lock and Dam in Tuscaloosa County, Alabama. The
Holt powerhouse is connected to Holt Lock and Dam, and the lands and shoreline within the
Project Boundary are owned by the USACE, state, and private entities. Alabama Power has
easements on the land from the USACE and private interests. Holt Lock and Dam and Holt Lake
(hereinafter referred to as “Lake”, “reservoir” or “pool”) are owned and operated by the USACE
and are not licensed by FERC. The USACE controls the river flow at the Lock and Dam and the
Project utilizes the surplus water for generation of electricity.
Alabama Power’s existing FERC license for the Project expires on August 31, 2015; therefore
Alabama Power’s relicense application for a new operating license must be filed with the FERC
on or before August 31, 2013. Alabama Power is developing a new license application using the
Traditional Licensing Process (TLP) (18 C.F.R. § 5.6 and 16.8). Relicensing stakeholders
identified fish entrainment and turbine mortality as an issue to address during relicensing of the
Holt Project. Alabama Power proposed to perform a desktop entrainment and turbine mortality
analysis to address stakeholder concerns (see Study Plan, Appendix A).
2
The goals of this “desktop” Entrainment and Turbine Mortality Study were to:
a. Estimate the number, species composition, and length frequency distribution of fish potentially entrained at the Project annually; and
b. Estimate the number, species composition, and length frequency of fish potentially lost annually due to turbine mortality.
1.1 PROJECT DESCRIPTION
The Holt Project was placed into service in 1968 by Alabama Power. The powerhouse contains a
46,944 kilowatt (kW) generator connected to a fixed-blade propeller turbine rated at 61,333
horsepower (hp) with a net head of 60 feet and a 115 kilovolt (kV) substation. The turbine has a
minimum hydraulic capacity of 1,000 cubic foot per second (cfs), and maximum hydraulic
capacity of 11,200 cfs. The runner speed is 100 revolutions per minute (rpm) and the runner
diameter is 239.5 inches.
The Project has steel trashrack panels that cover the intake area that feeds water to the turbine.
The trashrack bar rack spacing is 6 inches wide. After flowing through the turbine, the water
releases directly back into the Black Warrior River.
The facility has 14 individually operated Tainter gates, which are used for pool level
management to support navigation and flood control. The maximum reservoir level for the
spillway design flood as determined by the USACE is El. 206.4', which is 0.6 feet below the top
of the embankment dam, gravity section, and intake.
The navigation lock was placed in operation in May 1966 (USACE, 2009a). The lock chamber
dimensions are 110 feet wide and 600 feet long (USACE, 2009b). The lock allows for water
vessels to pass both upstream and downstream at the dam. An average of three to five vessels
pass through the lock daily.

3
2.0 METHODS
2.1 ENTRAINMENT
Fish entrainment is the passage of fish through the trash rack, penstock, and turbines into the
tailrace of a development. The goal of this desktop study was to characterize and provide an
order-of-magnitude estimate of potential fish entrainment using existing literature and site
specific information. The primary steps in this analysis included:
a. Define the entrainment database that can be applied to the Holt Project; b. Use the entrainment database to develop potential fish entrainment rates, family, and size
composition; c. Determine the average monthly turbine flows for the Project; and d. Estimate the number, family, and size composition of fish potentially entrained through
the Holt Project.
These steps are described in the following sections. 2.1.1 DEFINE THE ENTRAINMENT DATABASE
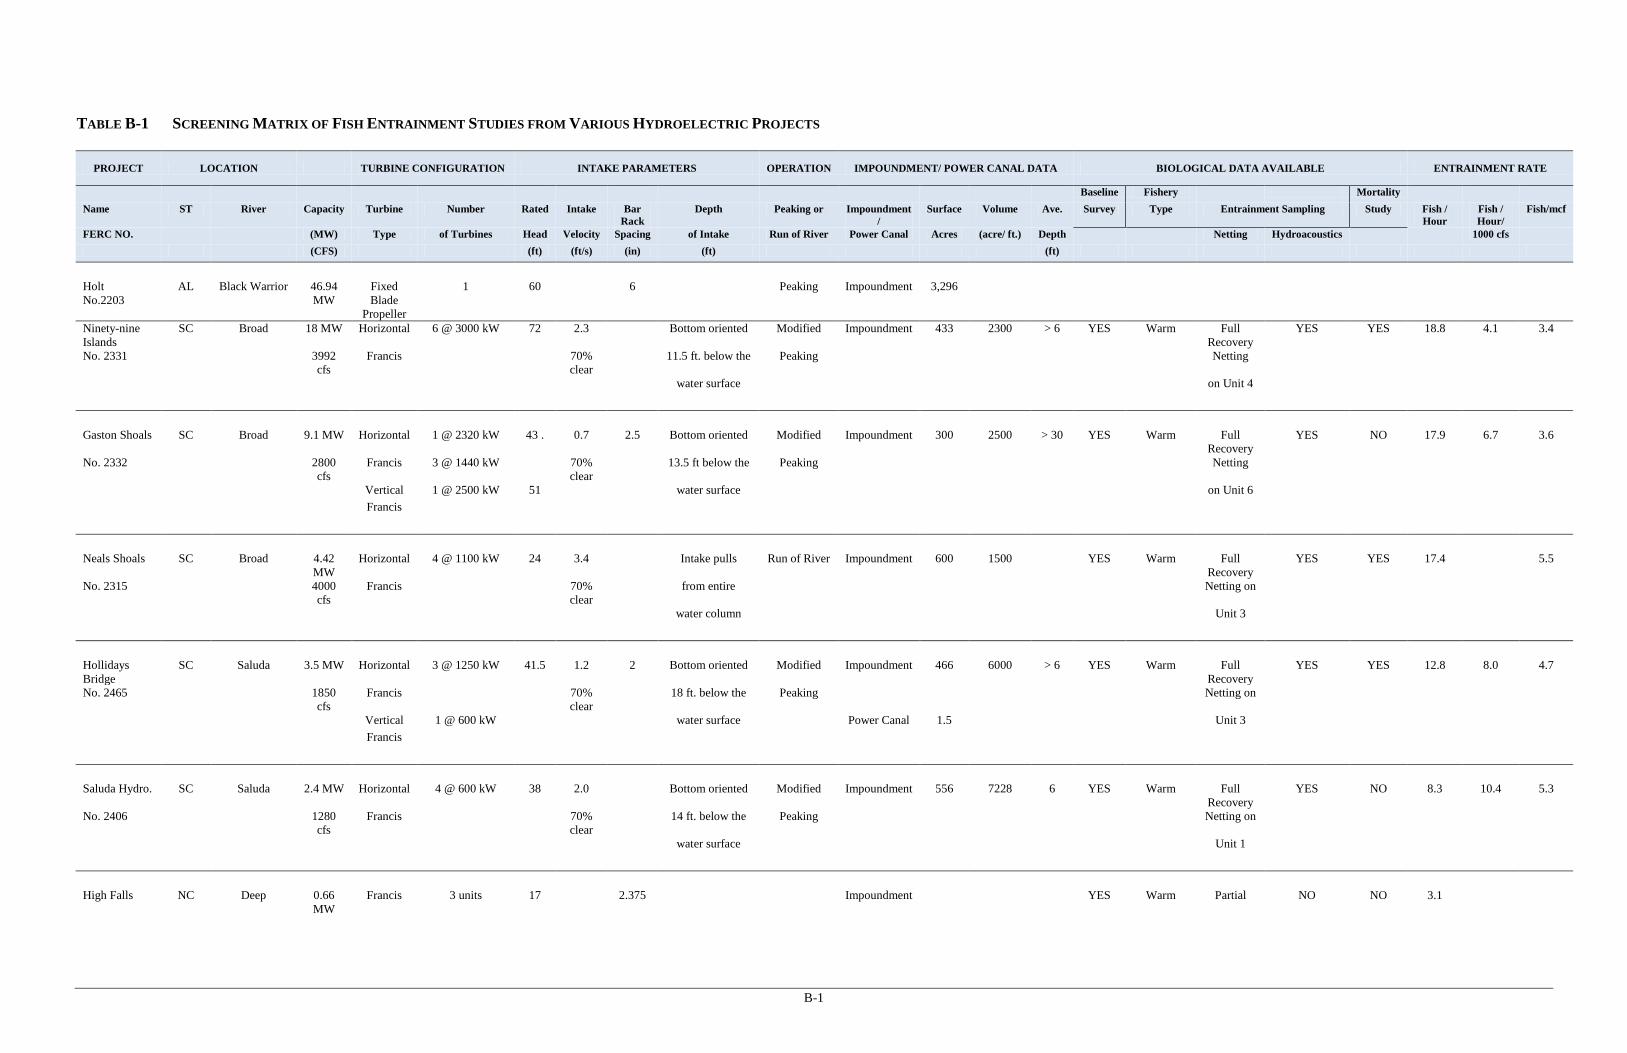
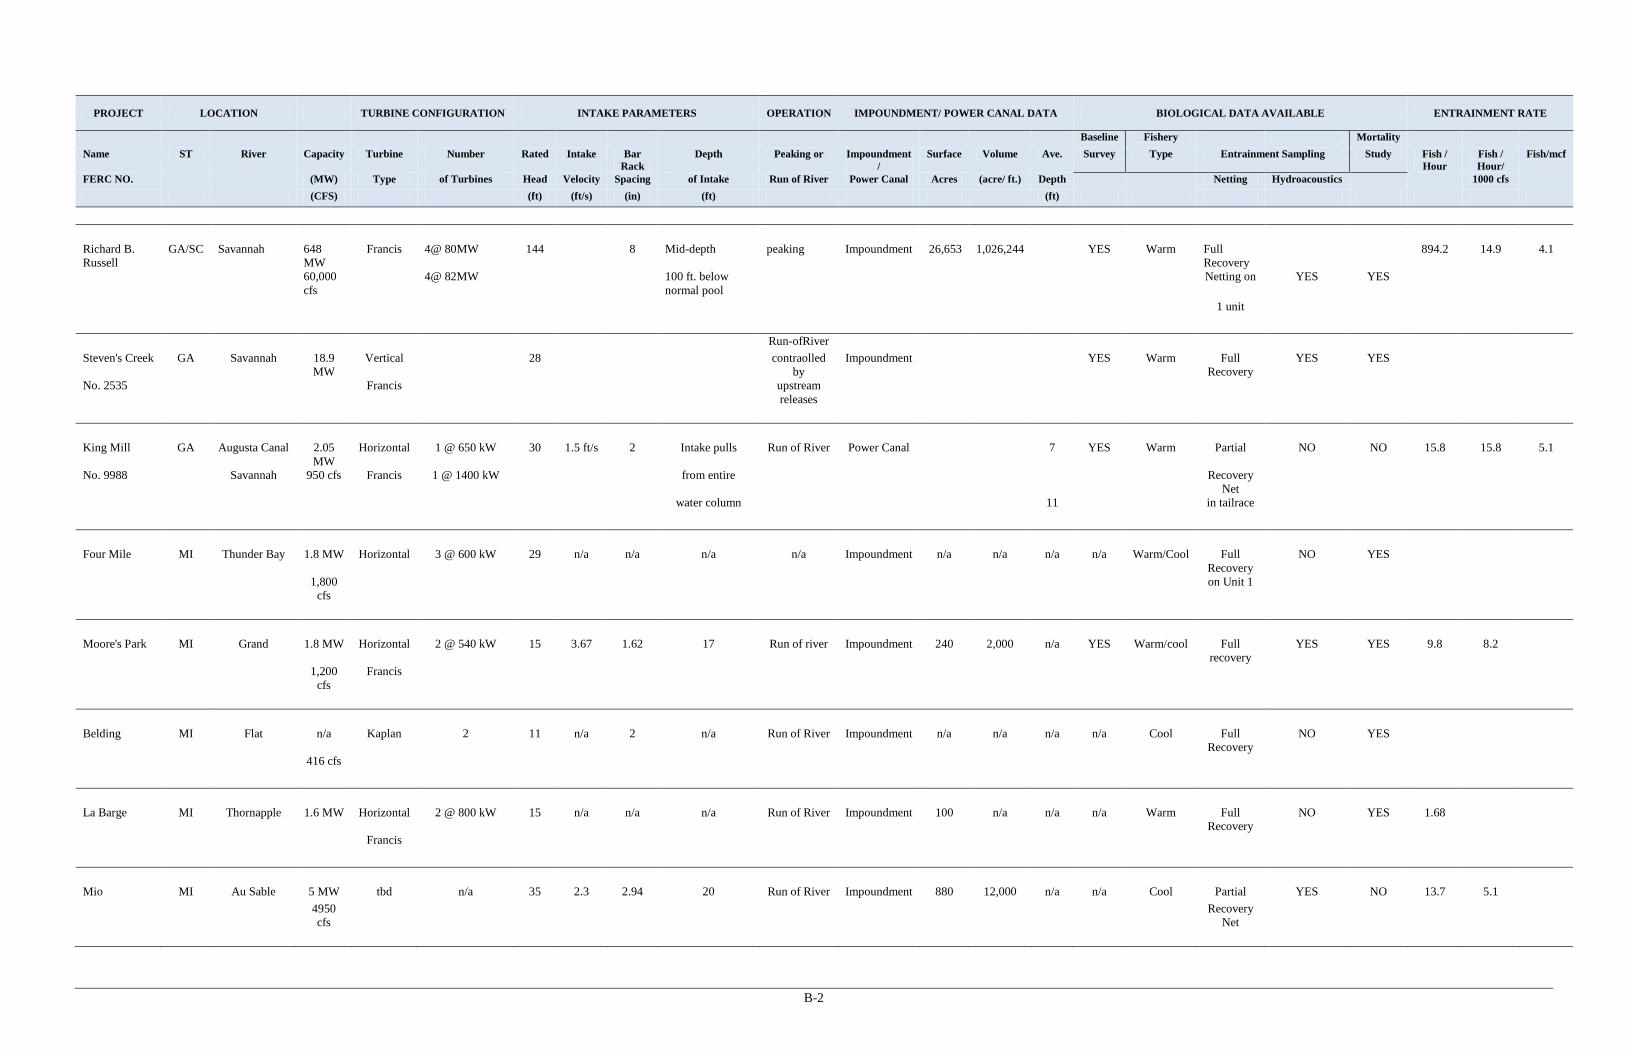
Over 70 site-specific studies of resident fish entrainment and mortality at hydroelectric sites in
the United States have been performed and reported on to date. These studies provide order-of-
magnitude estimates of annual fish entrainment (FERC, 1995). Table B-1 in Appendix B shows
information from 77 of these studies. Descriptive information gathered from each entrainment
study includes:
a. Project name and FERC project number; b. Location: state and river; c. Project size: discharge capacity and power production; d. Physical project characteristics: trash rack spacing, intake velocity, etc.; e. Project operation: e.g., peaking run-of-river, etc.; f. Biological factors: fishery type; and g. Impoundment characteristics: impoundment size, flow regime.
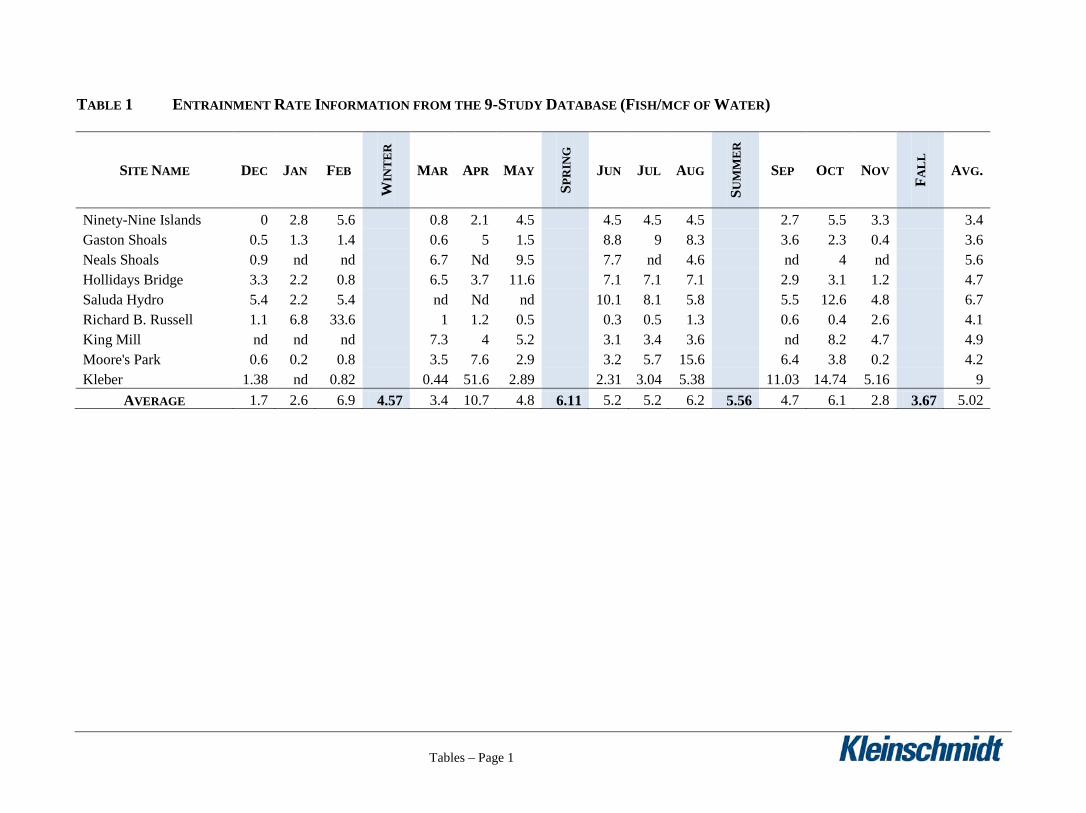
Using these criteria, the list of entrainment studies was reduced to nine sites. The entrainment
rate information from these nine studies is presented in Table 1 (Entrainment Rate Information
from the 9-Study Database) and Table 3 (Family Group Entrainment Estimates).
4
Freshwater Drum
Entrainment data from two studies where freshwater drum entrainment was experienced were
used to estimate potential freshwater drum entrainment at the Project. A summary of the two
studies and a table depicting characteristics of the original nine study sites, and two additional
freshwater drum study sites, is provided in Appendix C (Table C-1).
2.1.2 FISH ENTRAINMENT RATES
The monthly entrainment rate information from the selected entrainment studies was
consolidated to determine potential fish entrainment rates. All entrainment rates were converted
to fish per million cubic feet (mcf) of water passed through the Project turbines (Study Plan,
Appendix A). Because of gaps in monthly data, monthly rates were averaged to develop seasonal
entrainment rates (Table 1, Entrainment Rate Information from the 9-Study Database) for the
Holt Project.
Seasons were defined as follows:
Winter: December, January, February
Spring: March, April, May
Summer: June, July, August
Fall: September, October, November
2.1.3 SPECIES AND SIZE COMPOSITION
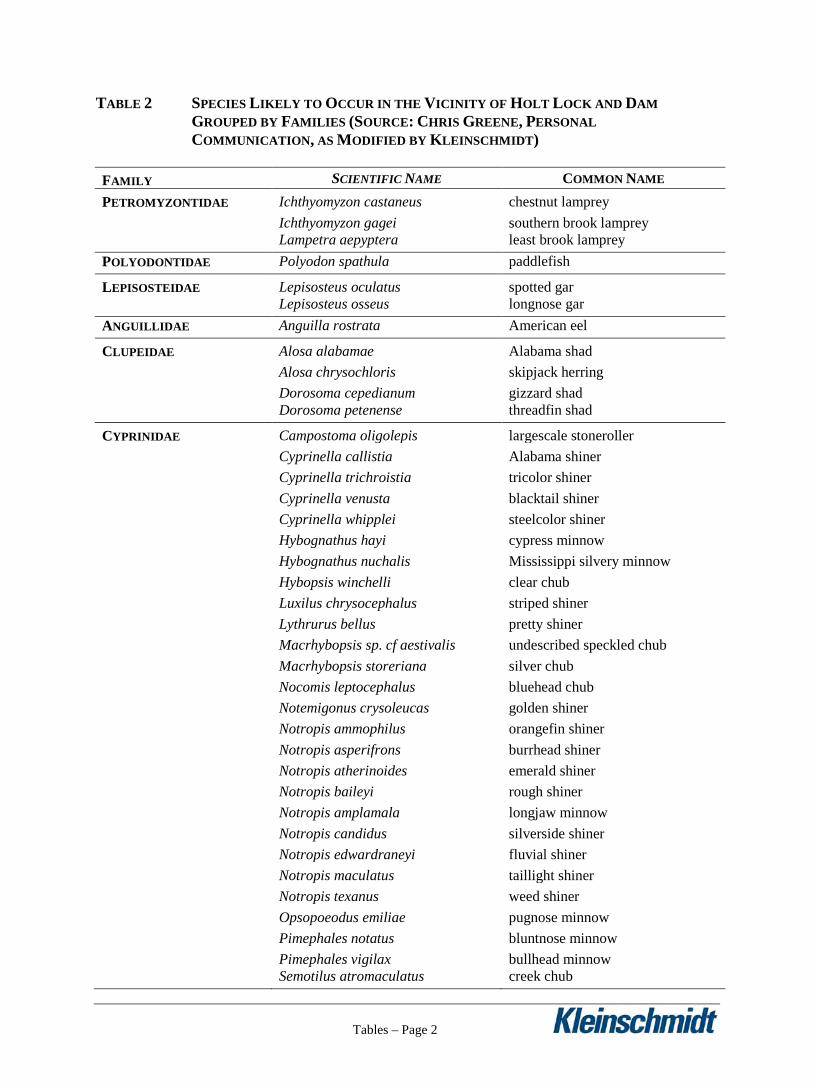
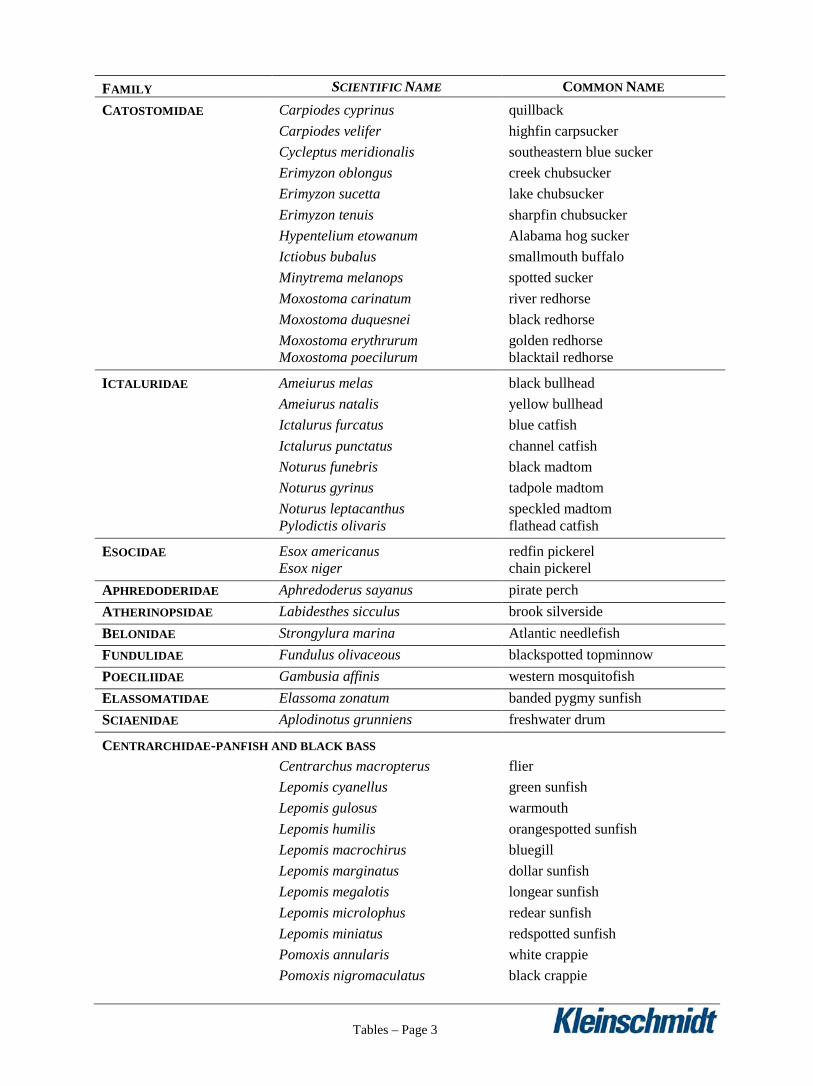
Chris Greene, Alabama Department of Conservation and Natural Resources (ADCNR), provided
a list of species likely to occur in the vicinity of the Project (personal communication, February
28, 2011) (Appendix D). The individual species were grouped into families (Table 2, Species
Likely to Occur in the Vicinity of Holt Lock and Dam Grouped by Families) to compare with the
families in the entrainment study database. Some families likely to occur in the Project Vicinity
were not included in the entrainment database. These species are more likely to prefer open
water habitat (Belonidae, specifically Atlantic needlefish), are not currently present
(Polyodontidae, specifically paddlefish), or are found in tributaries (Fundulidae,
Petromyzontidae, and Elassomatidae). Information was added to incorporate the family
Sciaenidae (freshwater drum), see Section 2.1.1.
5
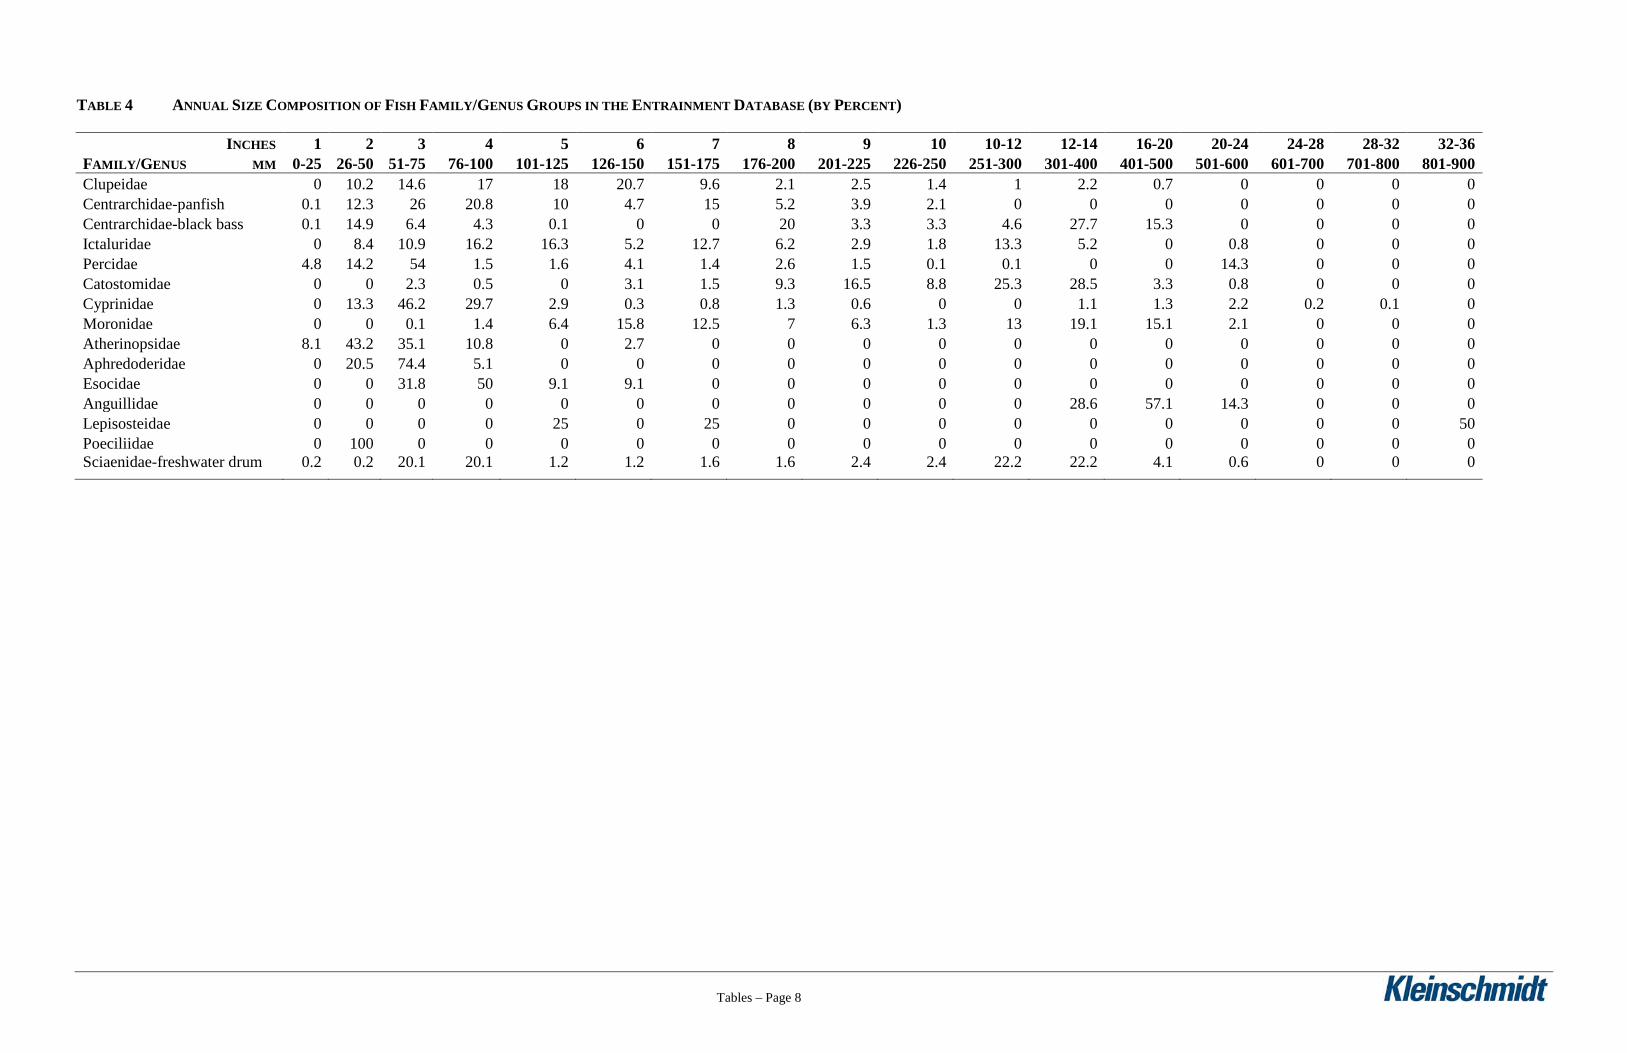
The species composition data from each accepted entrainment study was analyzed to determine
the general species and sizes of fish typically entrained at other hydroelectric projects in the
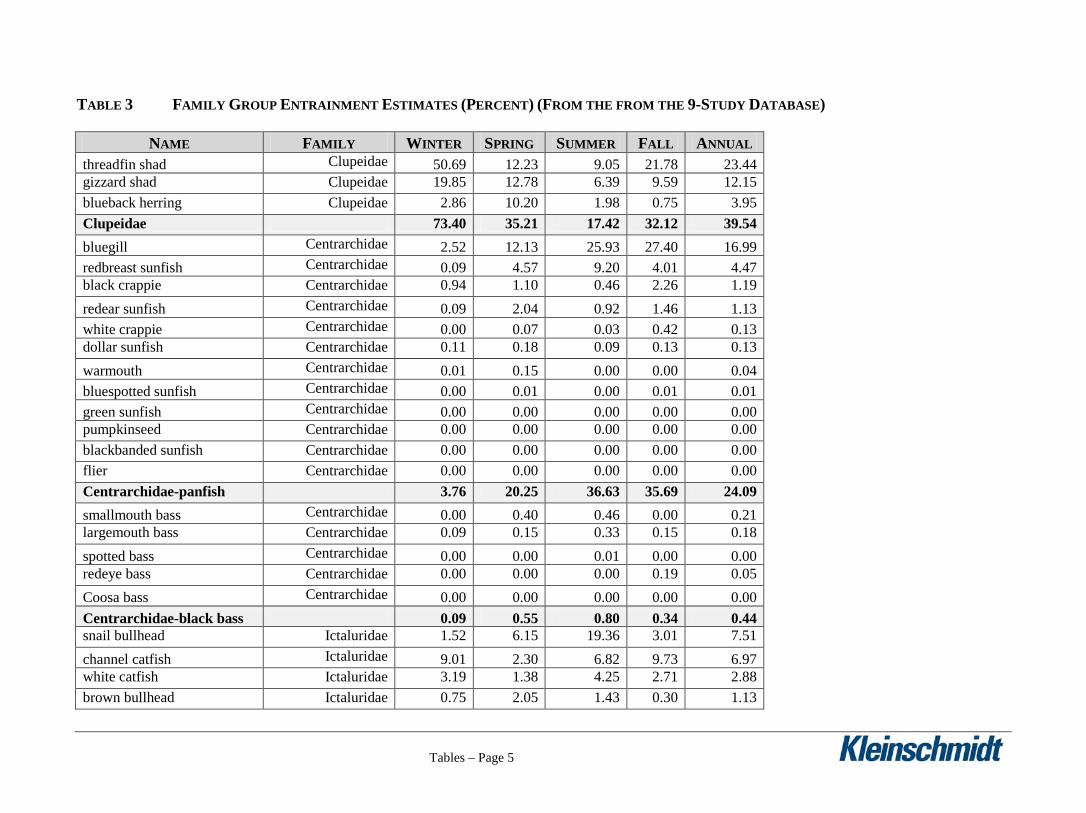
study database. This information was grouped to yield estimates of family group (Table 3,
Family Group Entrainment Estimates) and size composition (Table 4, Annual Size Composition
of Fish Family/Genus Groups in the Entrainment Database) for potentially entrained fish.
2.1.4 TURBINE FLOWS
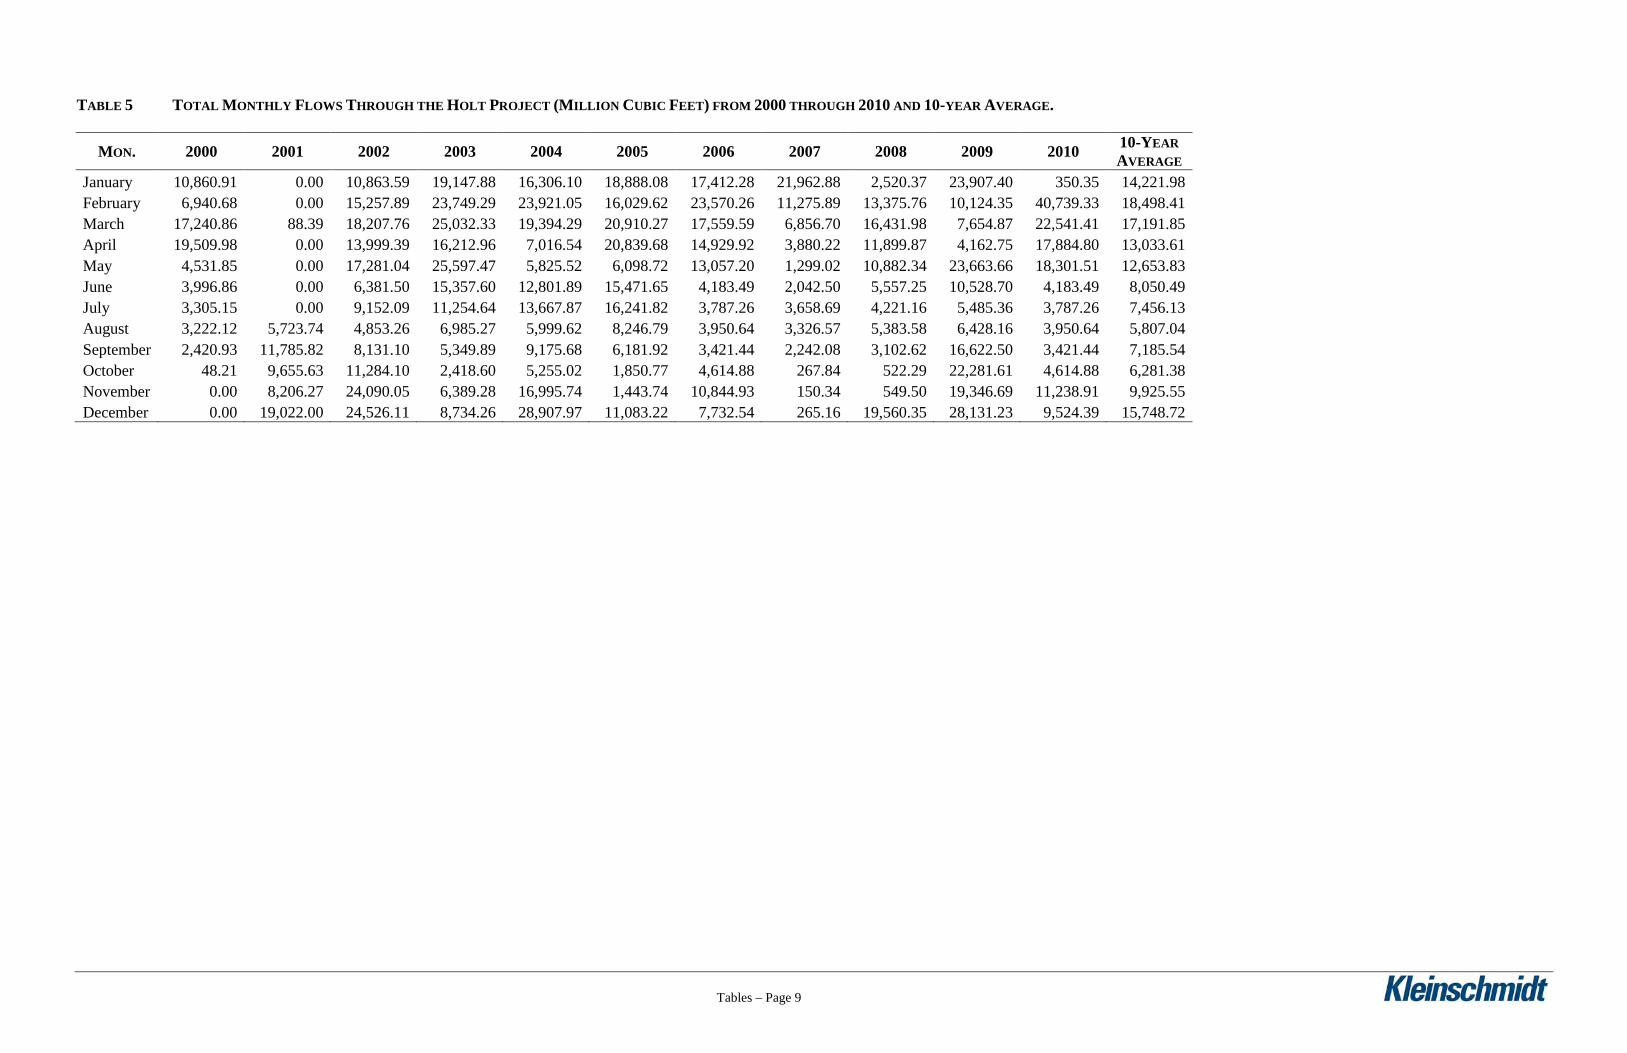
Average monthly turbine flows in day-second-feet (the flow rate measured in cfs averaged out
over one day) were provided by Alabama Power for the period 2000 through 2010 (Alabama
Power, 2011). In addition, as part of the Pre-Application Document (PAD) annual and monthly
flow duration curves for the Project were developed using inflow values into Holt Lock and Dam
which are calculated based on basin inflows and releases from the dam (see Appendix E). The
average monthly turbine flows were converted to total monthly flows in mcf (Table 5, Total
Monthly Flows Through the Holt Project). A day-second-foot is the volume of water
accumulated in one day by a flow of one cubic foot per second. One day-second-foot is
equivalent to approximately 1.9835 acre-feet (acre-ft). One acre-ft is equivalent to 43,560 cubic
feet. The average flows were multiplied by days in the month to calculate total monthly flows.
This flow data was used in combination with entrainment rate data from the nine study database
to estimate the number of fish potentially entrained at the Project (see Section 2.1.5).
2.1.5 CALCULATION OF ENTRAINMENT ESTIMATES
The calculation of entrainment estimates for the Project follow a stepwise process, utilizing the
inputs described in the previous sections. These steps are described below.
Step 1 – Total Number of Fish Entrained by Month and Season
The total number of fish entrained is based on two parameters: seasonal fish entrainment rate
(fish per mcf of water) and Project operation (mcf of water passed through the turbines). To
calculate the total number of fish entrained by month, the appropriate seasonal entrainment rate
was multiplied by the corresponding monthly turbine flow (see example below). Seasonal totals
6
were produced by simply adding the total number of fish entrained for each month within a
season.
Example: 5.0 fish/mcf of water * 1,000 mcf = 5,000 fish
Step 2 – Number of Entrained Fish Within Each Family Group by Season
The percentages for each family group are based on data from the entrainment study database
(see Section 2.1.3). The composition of entrained fish is represented as a percentage of the total
number of fish entrained for each season. To calculate the number of entrained fish within each
family group by season, the total number of entrained fish by season (from Step 1) was
multiplied by the family group seasonal composition percentages.
Example: Total number of fish entrained in Spring = 100,000
Spring composition percentage of Clupeidae = 35%
100,000 * 0.35 = 35,000 Clupeidae entrained in Spring
Step 3 – Number of Entrained Fish Within Each 25mm (1-inch) Length-Group for Each Family
Group
The size composition breakdown for each family group is based on data from the entrainment
study database. The size composition of each family group of entrained fish is represented as a
percentage for each season (see Section 2.1.3). To calculate the number of entrained fish within
each 25mm length-group for each family group, the total number of entrained fish estimated for
each family group was multiplied by the appropriate seasonal size composition percentage.
2.2 TURBINE MORTALITY
As fish are entrained through hydroelectric turbines, some percentages of those fish are killed
due to turbine mortality (i.e., blade strikes, shear forces, pressure changes, etc.). This assessment
included the following steps, as outlined in the Study Plan (Appendix A):
a. Define a mortality database; b. Develop mortality rates for each family group of fish; and c. Apply mortality rates to the entrainment estimate.

7
2.2.1 TURBINE MORTALITY DATABASE
Turbine passage survival studies have been performed at numerous hydroelectric projects
throughout the country over the past 15 or more years. Characteristics of these identified projects
were compared to the characteristics of the Holt Project and appropriate studies were selected for
the transfer of turbine mortality data.
Alabama Power reviewed other project mortality studies and narrowed the list down to the most
applicable studies for use in the Holt turbine mortality database (Study Plan, Appendix A).
Several criteria were applied during this process:
a. Turbine type b. Species of fish tested c. Detail of study information available or quality of the study
When these criteria were applied, 58 turbine mortality studies (for 13 projects) remained in the
database. Pertinent data from these studies is presented in tabular form in Appendix B (Table B-
2).
2.2.2 TURBINE MORTALITY RATE
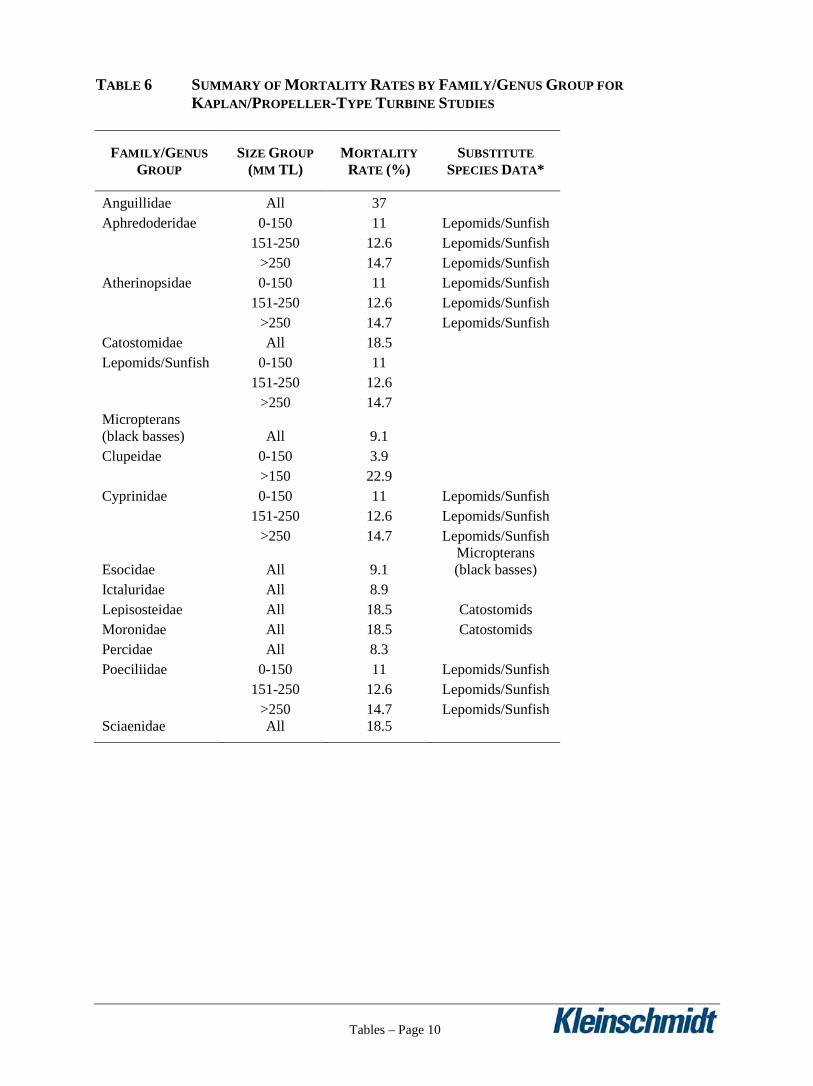
Information from each of the species/family groups tested in turbine mortality studies was
compiled and presented in Table 6 (Summary of Mortality Rates by Family/Genus Group for
Kaplan/Propeller-Type Turbine Studies). Within each species/family group, mortality rates for
similarly sized fish were averaged to produce a composite mortality rate. In cases where turbine
mortality test data was not available for certain species/family groups, mortality rates for fish
species with similar body types and size ranges were used.
2.2.3 CALCULATION OF THE TURBINE MORTALITY ESTIMATE
Estimates of turbine mortality at the Project were calculated by applying the mortality rates from
the study database to the entrainment estimates.

8
3.0 RESULTS
3.1 ENTRAINMENT
The mean seasonal entrainment rates used to estimate potential fish entrainment at the Project are
presented in Table 1 (Entrainment Rate Information from the 9-Study Database). The estimated
number of fish potentially entrained for each month was calculated by multiplying the ten-year
average monthly turbine flow for the Project (Table 7, Total Number of Fish Entrained by Month
and by Season) by the appropriate mean seasonal entrainment rate developed from the
entrainment study database.
3.1.1 ESTIMATED TOTAL NUMBER OF FISH ENTRAINED BY MONTH AND SEASON
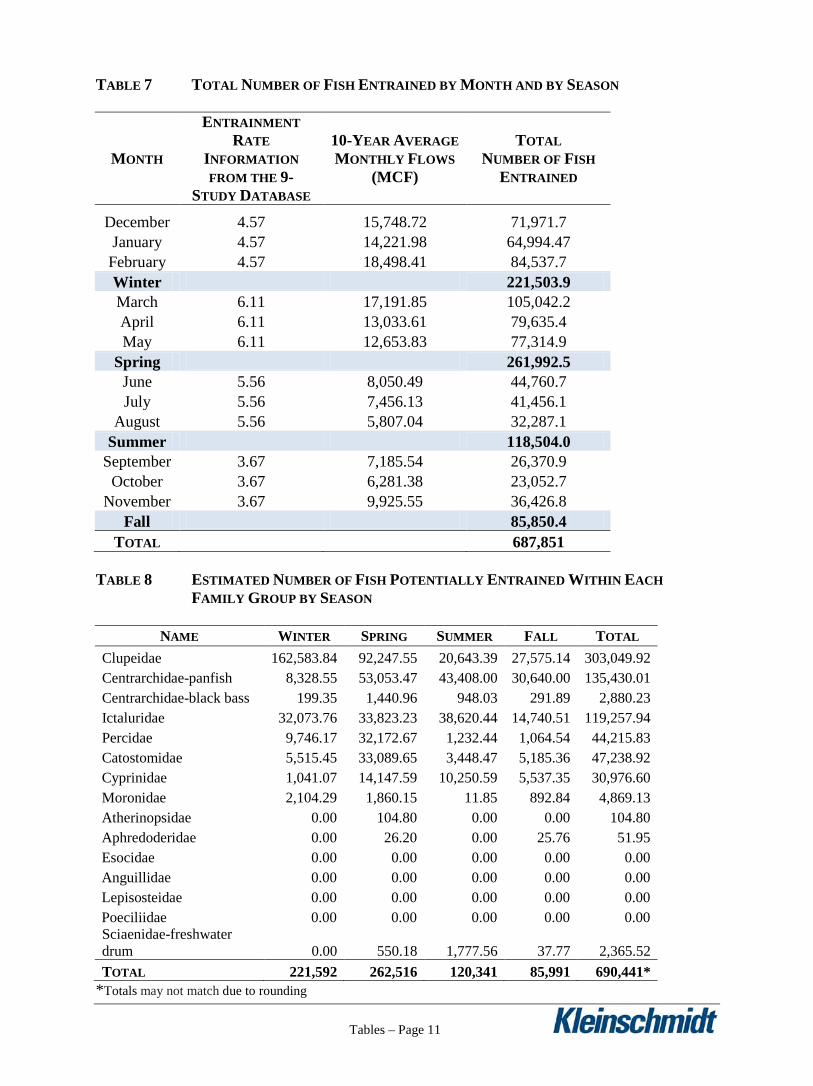
The estimated number of fish potentially entrained for each month and season at the Project is
presented in Table 7 (Total Number of Fish Entrained by Month and by Season). When all
monthly entrainment estimates were calculated and summed, the estimated annual fish
entrainment was 687,851.
3.1.2 NUMBER OF FISH ENTRAINED WITHIN EACH FAMILY GROUP BY SEASON
The estimated number of fish potentially entrained within each family group by season is
presented in Table 8 (Estimated Number of Fish Potentially Entrained Within Each Family
Group by Season). Three groups that accounted for a majority of the estimated entrainment were
the Clupeidae (44%), Centrarchidae-panfish (20%), and Ictaluridae (17%).
3.1.3 NUMBER OF ENTRAINED FISH WITHIN EACH 25MM (1-INCH) LENGTH-GROUP FOR
EACH FAMILY GROUP
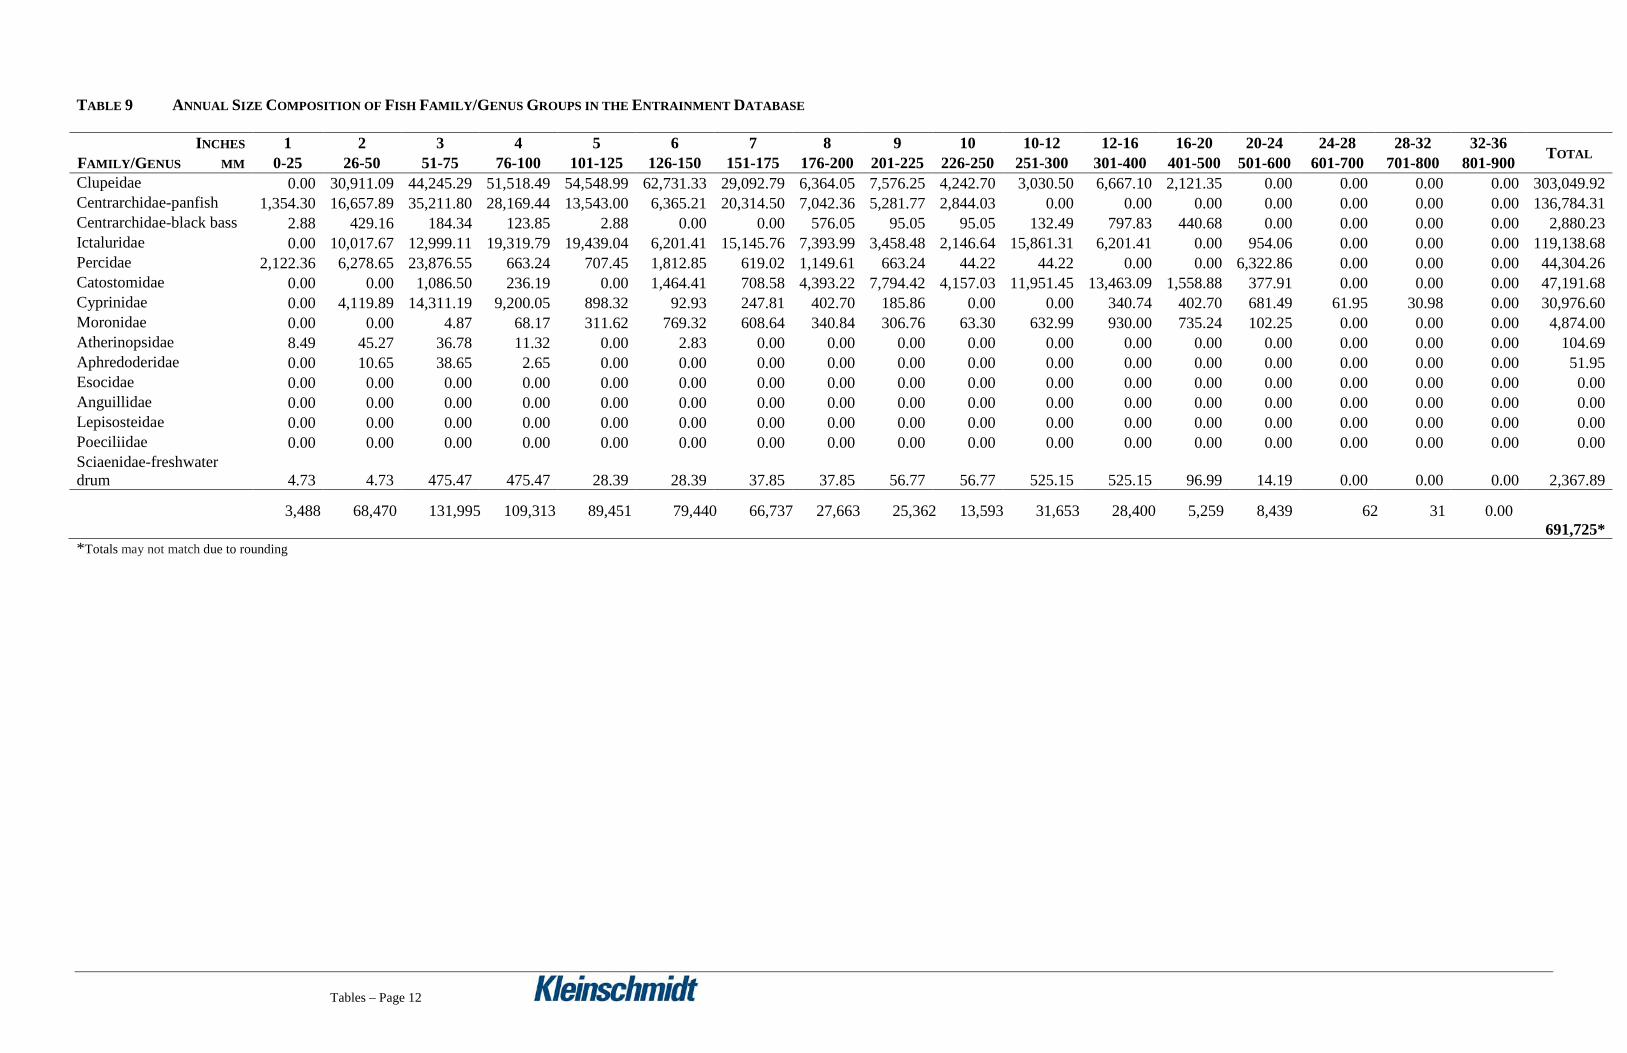
The estimated number of potentially entrained fish within each 25mm (1inch) length-group for
each family group annually and for each season is presented in Table 9 (Annual Size
Composition of Fish Family/Genus Groups in the Entrainment Database).
3.2 TURBINE MORTALITY

9
As noted in Section 2.2.2, mortality test data was unavailable for certain family groups estimated
to be entrained at the Project. As such, data from studies on similar fish species were used as a
substitute. Turbine mortality rates for each family group and length-group are presented in Table
6 (Summary of Mortality Rates by Family/Genus Group for Kaplan/Propeller-Type Turbine
Studies), including an indication of which groups lacked study data and which groups were used
as substitutes.
Table 6 (Summary of Mortality Rates by Family/Genus Group for Kaplan/Propeller-Type
Turbine Studies) depicts the summary of mortality rates for the Holt Project. When turbine
mortality rates were applied to the estimates of fish entrainment (Table 14, Estimated Annual
Total Number of Potentially Entrained Fish Killed Due to Turbine Mortality at the Holt Project),
a total of 66,768 fish are estimated to be killed annually due to turbine mortality.
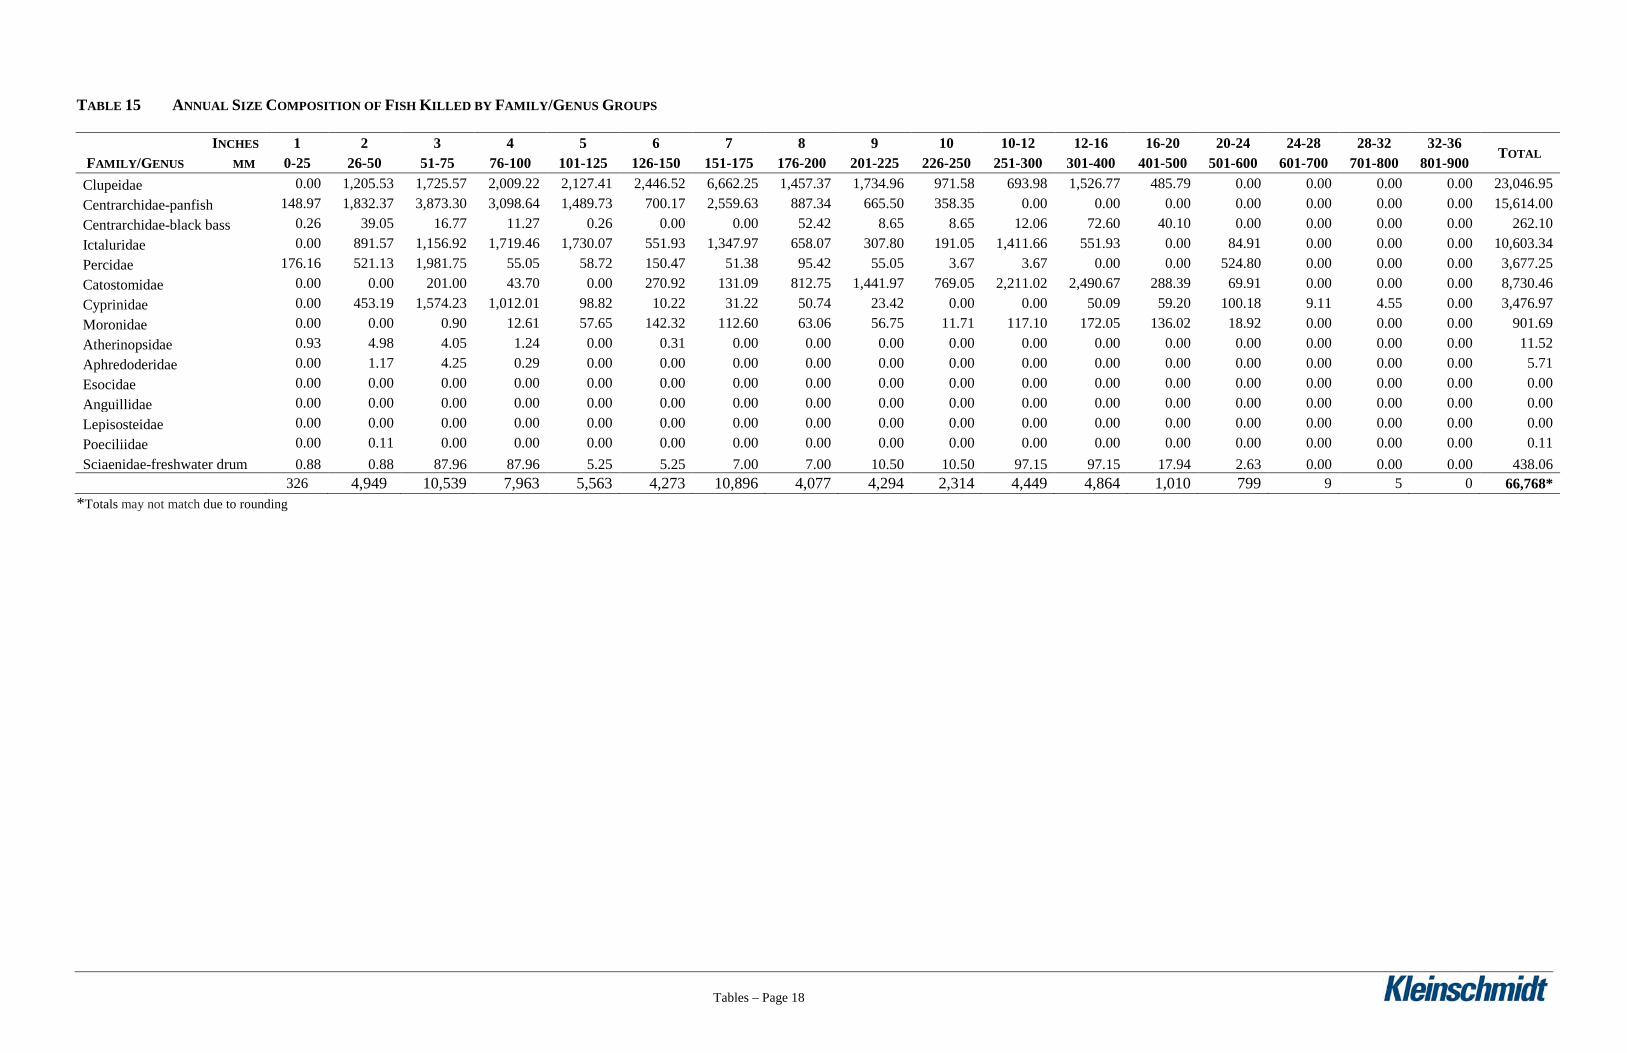
Table 15 (Annual Size Composition of Fish Killed by Family/Genus Groups) depicts the total
number of fish in each family group and length group estimated to be killed annually and for
each season.
4.0 DISCUSSION
The methodology used in this entrainment and turbine mortality study was based on similar
approaches used in other hydro relicensings and incorporated data from numerous FERC-
accepted studies. The study plan was developed with the input of Holt Stakeholders.
This report provides order-of-magnitude estimates of potential fish entrainment and turbine
mortality at the Holt Project. The results of this study will be used in the preparation of the Holt
Final License Application.
10
5.0 LITERATURE CITED
Alabama Power Company (Alabama Power). 2011. Water Use at the Holt Project. Birmingham, AL. 75pp.
Federal Energy Regulatory Commission (FERC). 1995. Preliminary assessment of fish entrainment at hydropower projects – volume 1 (Paper No. DPR-10). Office of Hydropower Licensing, FERC, Washington, DC.
United States Army Corps of Engineers (USACE). 2009a. Black Warrior-Tombigbee River Systems. [Online] URL: http://www.sam.usace.army.mil/op/tu/Project_Links.htm. Accessed on December 29, 2009.
United States Army Corps of Engineers (USACE). 2009b. Holt Lake: Overview. [Online] URL: http://bwt.sam.usace.army.mil/Holt/. Accessed on December 29, 2009.

TABLES
Tables – Page 1
TABLE 1 ENTRAINMENT RATE INFORMATION FROM THE 9-STUDY DATABASE (FISH/MCF OF WATER)
SITE NAME DEC JAN FEB
WIN
TE
R
MAR APR MAY
SPR
ING
JUN JUL AUG
SUM
ME
R
SEP OCT NOV
FAL
L
AVG.
Ninety-Nine Islands 0 2.8 5.6
0.8 2.1 4.5
4.5 4.5 4.5
2.7 5.5 3.3
3.4 Gaston Shoals 0.5 1.3 1.4
0.6 5 1.5
8.8 9 8.3
3.6 2.3 0.4
3.6
Neals Shoals 0.9 nd nd
6.7 Nd 9.5
7.7 nd 4.6
nd 4 nd
5.6 Hollidays Bridge 3.3 2.2 0.8
6.5 3.7 11.6
7.1 7.1 7.1
2.9 3.1 1.2
4.7
Saluda Hydro 5.4 2.2 5.4
nd Nd nd
10.1 8.1 5.8
5.5 12.6 4.8
6.7 Richard B. Russell 1.1 6.8 33.6
1 1.2 0.5
0.3 0.5 1.3
0.6 0.4 2.6
4.1
King Mill nd nd nd
7.3 4 5.2
3.1 3.4 3.6
nd 8.2 4.7
4.9 Moore's Park 0.6 0.2 0.8
3.5 7.6 2.9
3.2 5.7 15.6
6.4 3.8 0.2
4.2
Kleber 1.38 nd 0.82
0.44 51.6 2.89
2.31 3.04 5.38
11.03 14.74 5.16
9 AVERAGE 1.7 2.6 6.9 4.57 3.4 10.7 4.8 6.11 5.2 5.2 6.2 5.56 4.7 6.1 2.8 3.67 5.02
Tables – Page 2
TABLE 2 SPECIES LIKELY TO OCCUR IN THE VICINITY OF HOLT LOCK AND DAM
GROUPED BY FAMILIES (SOURCE: CHRIS GREENE, PERSONAL COMMUNICATION, AS MODIFIED BY KLEINSCHMIDT)
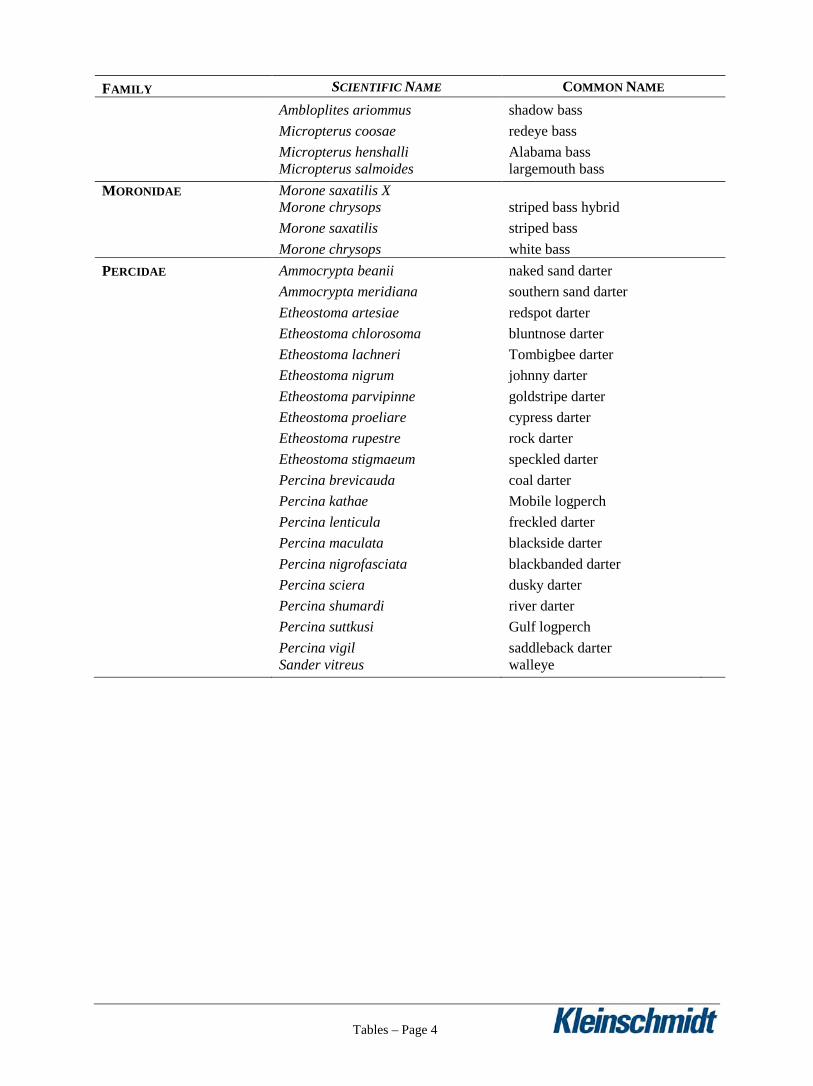
FAMILY SCIENTIFIC NAME COMMON NAME PETROMYZONTIDAE Ichthyomyzon castaneus chestnut lamprey Ichthyomyzon gagei southern brook lamprey Lampetra aepyptera least brook lamprey POLYODONTIDAE Polyodon spathula paddlefish
LEPISOSTEIDAE Lepisosteus oculatus spotted gar Lepisosteus osseus longnose gar ANGUILLIDAE Anguilla rostrata American eel
CLUPEIDAE Alosa alabamae Alabama shad Alosa chrysochloris skipjack herring Dorosoma cepedianum gizzard shad Dorosoma petenense threadfin shad
CYPRINIDAE Campostoma oligolepis largescale stoneroller Cyprinella callistia Alabama shiner Cyprinella trichroistia tricolor shiner Cyprinella venusta blacktail shiner Cyprinella whipplei steelcolor shiner Hybognathus hayi cypress minnow Hybognathus nuchalis Mississippi silvery minnow Hybopsis winchelli clear chub Luxilus chrysocephalus striped shiner Lythrurus bellus pretty shiner Macrhybopsis sp. cf aestivalis undescribed speckled chub Macrhybopsis storeriana silver chub Nocomis leptocephalus bluehead chub Notemigonus crysoleucas golden shiner Notropis ammophilus orangefin shiner Notropis asperifrons burrhead shiner Notropis atherinoides emerald shiner Notropis baileyi rough shiner Notropis amplamala longjaw minnow Notropis candidus silverside shiner Notropis edwardraneyi fluvial shiner Notropis maculatus taillight shiner Notropis texanus weed shiner Opsopoeodus emiliae pugnose minnow Pimephales notatus bluntnose minnow Pimephales vigilax bullhead minnow Semotilus atromaculatus creek chub
Tables – Page 3
FAMILY SCIENTIFIC NAME COMMON NAME CATOSTOMIDAE Carpiodes cyprinus quillback Carpiodes velifer highfin carpsucker Cycleptus meridionalis southeastern blue sucker Erimyzon oblongus creek chubsucker Erimyzon sucetta lake chubsucker Erimyzon tenuis sharpfin chubsucker Hypentelium etowanum Alabama hog sucker Ictiobus bubalus smallmouth buffalo Minytrema melanops spotted sucker Moxostoma carinatum river redhorse Moxostoma duquesnei black redhorse Moxostoma erythrurum golden redhorse Moxostoma poecilurum blacktail redhorse
ICTALURIDAE Ameiurus melas black bullhead Ameiurus natalis yellow bullhead Ictalurus furcatus blue catfish Ictalurus punctatus channel catfish Noturus funebris black madtom Noturus gyrinus tadpole madtom Noturus leptacanthus speckled madtom Pylodictis olivaris flathead catfish
ESOCIDAE Esox americanus redfin pickerel Esox niger chain pickerel APHREDODERIDAE Aphredoderus sayanus pirate perch ATHERINOPSIDAE Labidesthes sicculus brook silverside BELONIDAE Strongylura marina Atlantic needlefish FUNDULIDAE Fundulus olivaceous blackspotted topminnow POECILIIDAE Gambusia affinis western mosquitofish ELASSOMATIDAE Elassoma zonatum banded pygmy sunfish SCIAENIDAE Aplodinotus grunniens freshwater drum
CENTRARCHIDAE-PANFISH AND BLACK BASS Centrarchus macropterus flier
Lepomis cyanellus green sunfish Lepomis gulosus warmouth Lepomis humilis orangespotted sunfish Lepomis macrochirus bluegill
Lepomis marginatus dollar sunfish Lepomis megalotis longear sunfish Lepomis microlophus redear sunfish Lepomis miniatus redspotted sunfish Pomoxis annularis white crappie Pomoxis nigromaculatus black crappie
Tables – Page 4
FAMILY SCIENTIFIC NAME COMMON NAME Ambloplites ariommus shadow bass Micropterus coosae redeye bass Micropterus henshalli Alabama bass Micropterus salmoides largemouth bass MORONIDAE Morone saxatilis X
Morone chrysops striped bass hybrid Morone saxatilis striped bass Morone chrysops white bass PERCIDAE Ammocrypta beanii naked sand darter Ammocrypta meridiana southern sand darter Etheostoma artesiae redspot darter Etheostoma chlorosoma bluntnose darter Etheostoma lachneri Tombigbee darter Etheostoma nigrum johnny darter Etheostoma parvipinne goldstripe darter Etheostoma proeliare cypress darter Etheostoma rupestre rock darter Etheostoma stigmaeum speckled darter Percina brevicauda coal darter Percina kathae Mobile logperch Percina lenticula freckled darter Percina maculata blackside darter Percina nigrofasciata blackbanded darter Percina sciera dusky darter Percina shumardi river darter Percina suttkusi Gulf logperch Percina vigil saddleback darter Sander vitreus walleye
Tables – Page 5
TABLE 3 FAMILY GROUP ENTRAINMENT ESTIMATES (PERCENT) (FROM THE FROM THE 9-STUDY DATABASE)
NAME FAMILY WINTER SPRING SUMMER FALL ANNUAL threadfin shad Clupeidae 50.69 12.23 9.05 21.78 23.44 gizzard shad Clupeidae 19.85 12.78 6.39 9.59 12.15 blueback herring Clupeidae 2.86 10.20 1.98 0.75 3.95 Clupeidae 73.40 35.21 17.42 32.12 39.54 bluegill Centrarchidae 2.52 12.13 25.93 27.40 16.99 redbreast sunfish Centrarchidae 0.09 4.57 9.20 4.01 4.47 black crappie Centrarchidae 0.94 1.10 0.46 2.26 1.19 redear sunfish Centrarchidae 0.09 2.04 0.92 1.46 1.13 white crappie Centrarchidae 0.00 0.07 0.03 0.42 0.13 dollar sunfish Centrarchidae 0.11 0.18 0.09 0.13 0.13 warmouth Centrarchidae 0.01 0.15 0.00 0.00 0.04 bluespotted sunfish Centrarchidae 0.00 0.01 0.00 0.01 0.01 green sunfish Centrarchidae 0.00 0.00 0.00 0.00 0.00 pumpkinseed Centrarchidae 0.00 0.00 0.00 0.00 0.00 blackbanded sunfish Centrarchidae 0.00 0.00 0.00 0.00 0.00 flier Centrarchidae 0.00 0.00 0.00 0.00 0.00 Centrarchidae-panfish 3.76 20.25 36.63 35.69 24.09 smallmouth bass Centrarchidae 0.00 0.40 0.46 0.00 0.21 largemouth bass Centrarchidae 0.09 0.15 0.33 0.15 0.18 spotted bass Centrarchidae 0.00 0.00 0.01 0.00 0.00 redeye bass Centrarchidae 0.00 0.00 0.00 0.19 0.05 Coosa bass Centrarchidae 0.00 0.00 0.00 0.00 0.00 Centrarchidae-black bass 0.09 0.55 0.80 0.34 0.44 snail bullhead Ictaluridae 1.52 6.15 19.36 3.01 7.51 channel catfish Ictaluridae 9.01 2.30 6.82 9.73 6.97 white catfish Ictaluridae 3.19 1.38 4.25 2.71 2.88 brown bullhead Ictaluridae 0.75 2.05 1.43 0.30 1.13
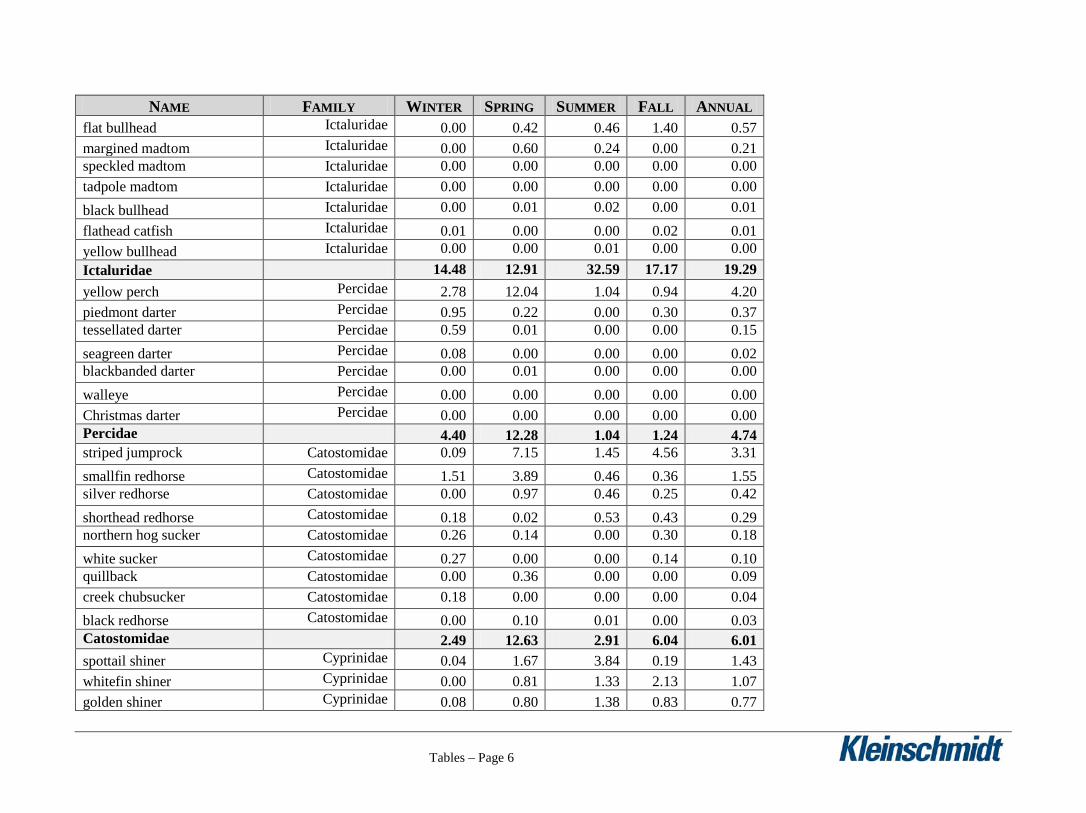
Tables – Page 6
NAME FAMILY WINTER SPRING SUMMER FALL ANNUAL flat bullhead Ictaluridae 0.00 0.42 0.46 1.40 0.57 margined madtom Ictaluridae 0.00 0.60 0.24 0.00 0.21 speckled madtom Ictaluridae 0.00 0.00 0.00 0.00 0.00 tadpole madtom Ictaluridae 0.00 0.00 0.00 0.00 0.00 black bullhead Ictaluridae 0.00 0.01 0.02 0.00 0.01 flathead catfish Ictaluridae 0.01 0.00 0.00 0.02 0.01 yellow bullhead Ictaluridae 0.00 0.00 0.01 0.00 0.00 Ictaluridae 14.48 12.91 32.59 17.17 19.29 yellow perch Percidae 2.78 12.04 1.04 0.94 4.20 piedmont darter Percidae 0.95 0.22 0.00 0.30 0.37 tessellated darter Percidae 0.59 0.01 0.00 0.00 0.15 seagreen darter Percidae 0.08 0.00 0.00 0.00 0.02 blackbanded darter Percidae 0.00 0.01 0.00 0.00 0.00 walleye Percidae 0.00 0.00 0.00 0.00 0.00 Christmas darter Percidae 0.00 0.00 0.00 0.00 0.00 Percidae 4.40 12.28 1.04 1.24 4.74 striped jumprock Catostomidae 0.09 7.15 1.45 4.56 3.31 smallfin redhorse Catostomidae 1.51 3.89 0.46 0.36 1.55 silver redhorse Catostomidae 0.00 0.97 0.46 0.25 0.42 shorthead redhorse Catostomidae 0.18 0.02 0.53 0.43 0.29 northern hog sucker Catostomidae 0.26 0.14 0.00 0.30 0.18 white sucker Catostomidae 0.27 0.00 0.00 0.14 0.10 quillback Catostomidae 0.00 0.36 0.00 0.00 0.09 creek chubsucker Catostomidae 0.18 0.00 0.00 0.00 0.04 black redhorse Catostomidae 0.00 0.10 0.01 0.00 0.03 Catostomidae 2.49 12.63 2.91 6.04 6.01 spottail shiner Cyprinidae 0.04 1.67 3.84 0.19 1.43 whitefin shiner Cyprinidae 0.00 0.81 1.33 2.13 1.07 golden shiner Cyprinidae 0.08 0.80 1.38 0.83 0.77
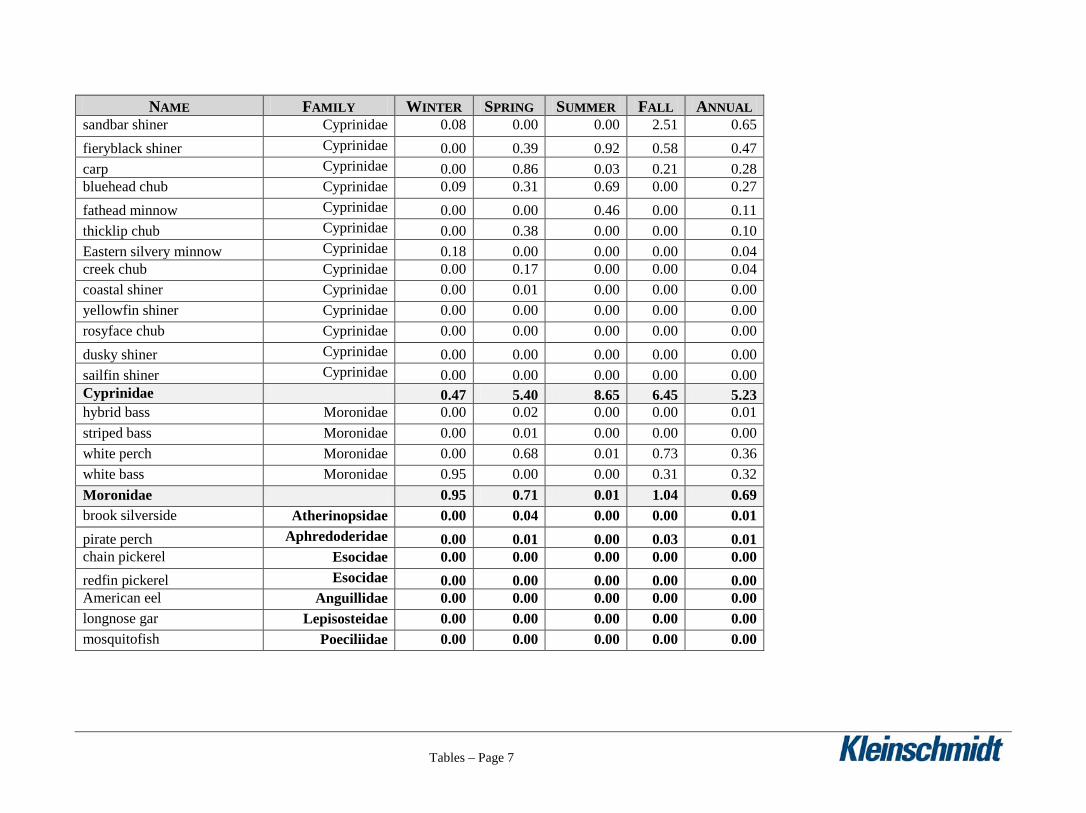
Tables – Page 7
NAME FAMILY WINTER SPRING SUMMER FALL ANNUAL sandbar shiner Cyprinidae 0.08 0.00 0.00 2.51 0.65 fieryblack shiner Cyprinidae 0.00 0.39 0.92 0.58 0.47 carp Cyprinidae 0.00 0.86 0.03 0.21 0.28 bluehead chub Cyprinidae 0.09 0.31 0.69 0.00 0.27 fathead minnow Cyprinidae 0.00 0.00 0.46 0.00 0.11 thicklip chub Cyprinidae 0.00 0.38 0.00 0.00 0.10 Eastern silvery minnow Cyprinidae 0.18 0.00 0.00 0.00 0.04 creek chub Cyprinidae 0.00 0.17 0.00 0.00 0.04 coastal shiner Cyprinidae 0.00 0.01 0.00 0.00 0.00 yellowfin shiner Cyprinidae 0.00 0.00 0.00 0.00 0.00 rosyface chub Cyprinidae 0.00 0.00 0.00 0.00 0.00 dusky shiner Cyprinidae 0.00 0.00 0.00 0.00 0.00 sailfin shiner Cyprinidae 0.00 0.00 0.00 0.00 0.00 Cyprinidae 0.47 5.40 8.65 6.45 5.23 hybrid bass Moronidae 0.00 0.02 0.00 0.00 0.01 striped bass Moronidae 0.00 0.01 0.00 0.00 0.00 white perch Moronidae 0.00 0.68 0.01 0.73 0.36 white bass Moronidae 0.95 0.00 0.00 0.31 0.32 Moronidae 0.95 0.71 0.01 1.04 0.69 brook silverside Atherinopsidae 0.00 0.04 0.00 0.00 0.01 pirate perch Aphredoderidae 0.00 0.01 0.00 0.03 0.01 chain pickerel Esocidae 0.00 0.00 0.00 0.00 0.00 redfin pickerel Esocidae 0.00 0.00 0.00 0.00 0.00 American eel Anguillidae 0.00 0.00 0.00 0.00 0.00 longnose gar Lepisosteidae 0.00 0.00 0.00 0.00 0.00 mosquitofish Poeciliidae 0.00 0.00 0.00 0.00 0.00
Tables – Page 8
TABLE 4 ANNUAL SIZE COMPOSITION OF FISH FAMILY/GENUS GROUPS IN THE ENTRAINMENT DATABASE (BY PERCENT)
INCHES 1 2 3 4 5 6 7 8 9 10 10-12 12-14 16-20 20-24 24-28 28-32 32-36 FAMILY/GENUS MM 0-25 26-50 51-75 76-100 101-125 126-150 151-175 176-200 201-225 226-250 251-300 301-400 401-500 501-600 601-700 701-800 801-900 Clupeidae 0 10.2 14.6 17 18 20.7 9.6 2.1 2.5 1.4 1 2.2 0.7 0 0 0 0 Centrarchidae-panfish 0.1 12.3 26 20.8 10 4.7 15 5.2 3.9 2.1 0 0 0 0 0 0 0 Centrarchidae-black bass 0.1 14.9 6.4 4.3 0.1 0 0 20 3.3 3.3 4.6 27.7 15.3 0 0 0 0 Ictaluridae 0 8.4 10.9 16.2 16.3 5.2 12.7 6.2 2.9 1.8 13.3 5.2 0 0.8 0 0 0 Percidae 4.8 14.2 54 1.5 1.6 4.1 1.4 2.6 1.5 0.1 0.1 0 0 14.3 0 0 0 Catostomidae 0 0 2.3 0.5 0 3.1 1.5 9.3 16.5 8.8 25.3 28.5 3.3 0.8 0 0 0 Cyprinidae 0 13.3 46.2 29.7 2.9 0.3 0.8 1.3 0.6 0 0 1.1 1.3 2.2 0.2 0.1 0 Moronidae 0 0 0.1 1.4 6.4 15.8 12.5 7 6.3 1.3 13 19.1 15.1 2.1 0 0 0 Atherinopsidae 8.1 43.2 35.1 10.8 0 2.7 0 0 0 0 0 0 0 0 0 0 0 Aphredoderidae 0 20.5 74.4 5.1 0 0 0 0 0 0 0 0 0 0 0 0 0 Esocidae 0 0 31.8 50 9.1 9.1 0 0 0 0 0 0 0 0 0 0 0 Anguillidae 0 0 0 0 0 0 0 0 0 0 0 28.6 57.1 14.3 0 0 0 Lepisosteidae 0 0 0 0 25 0 25 0 0 0 0 0 0 0 0 0 50 Poeciliidae 0 100 0 0 0 0 0 0 0 0 0 0 0 0 0 0 0 Sciaenidae-freshwater drum 0.2 0.2 20.1 20.1 1.2 1.2 1.6 1.6 2.4 2.4 22.2 22.2 4.1 0.6 0 0 0
Tables – Page 9
TABLE 5 TOTAL MONTHLY FLOWS THROUGH THE HOLT PROJECT (MILLION CUBIC FEET) FROM 2000 THROUGH 2010 AND 10-YEAR AVERAGE.
MON. 2000 2001 2002 2003 2004 2005 2006 2007 2008 2009 2010 10-YEAR AVERAGE
January 10,860.91 0.00 10,863.59 19,147.88 16,306.10 18,888.08 17,412.28 21,962.88 2,520.37 23,907.40 350.35 14,221.98 February 6,940.68 0.00 15,257.89 23,749.29 23,921.05 16,029.62 23,570.26 11,275.89 13,375.76 10,124.35 40,739.33 18,498.41 March 17,240.86 88.39 18,207.76 25,032.33 19,394.29 20,910.27 17,559.59 6,856.70 16,431.98 7,654.87 22,541.41 17,191.85 April 19,509.98 0.00 13,999.39 16,212.96 7,016.54 20,839.68 14,929.92 3,880.22 11,899.87 4,162.75 17,884.80 13,033.61 May 4,531.85 0.00 17,281.04 25,597.47 5,825.52 6,098.72 13,057.20 1,299.02 10,882.34 23,663.66 18,301.51 12,653.83 June 3,996.86 0.00 6,381.50 15,357.60 12,801.89 15,471.65 4,183.49 2,042.50 5,557.25 10,528.70 4,183.49 8,050.49 July 3,305.15 0.00 9,152.09 11,254.64 13,667.87 16,241.82 3,787.26 3,658.69 4,221.16 5,485.36 3,787.26 7,456.13 August 3,222.12 5,723.74 4,853.26 6,985.27 5,999.62 8,246.79 3,950.64 3,326.57 5,383.58 6,428.16 3,950.64 5,807.04 September 2,420.93 11,785.82 8,131.10 5,349.89 9,175.68 6,181.92 3,421.44 2,242.08 3,102.62 16,622.50 3,421.44 7,185.54 October 48.21 9,655.63 11,284.10 2,418.60 5,255.02 1,850.77 4,614.88 267.84 522.29 22,281.61 4,614.88 6,281.38 November 0.00 8,206.27 24,090.05 6,389.28 16,995.74 1,443.74 10,844.93 150.34 549.50 19,346.69 11,238.91 9,925.55 December 0.00 19,022.00 24,526.11 8,734.26 28,907.97 11,083.22 7,732.54 265.16 19,560.35 28,131.23 9,524.39 15,748.72
Tables – Page 10
TABLE 6 SUMMARY OF MORTALITY RATES BY FAMILY/GENUS GROUP FOR KAPLAN/PROPELLER-TYPE TURBINE STUDIES
FAMILY/GENUS GROUP
SIZE GROUP (MM TL)
MORTALITY RATE (%)
SUBSTITUTE SPECIES DATA*
Anguillidae All 37 Aphredoderidae 0-150 11 Lepomids/Sunfish
151-250 12.6 Lepomids/Sunfish
>250 14.7 Lepomids/Sunfish
Atherinopsidae 0-150 11 Lepomids/Sunfish
151-250 12.6 Lepomids/Sunfish
>250 14.7 Lepomids/Sunfish
Catostomidae All 18.5 Lepomids/Sunfish 0-150 11
151-250 12.6
>250 14.7 Micropterans
(black basses) All 9.1 Clupeidae 0-150 3.9
>150 22.9
Cyprinidae 0-150 11 Lepomids/Sunfish
151-250 12.6 Lepomids/Sunfish
>250 14.7 Lepomids/Sunfish
Esocidae All 9.1 Micropterans (black basses)
Ictaluridae All 8.9 Lepisosteidae All 18.5 Catostomids
Moronidae All 18.5 Catostomids Percidae All 8.3
Poeciliidae 0-150 11 Lepomids/Sunfish
151-250 12.6 Lepomids/Sunfish
>250 14.7 Lepomids/Sunfish
Sciaenidae All 18.5
Tables – Page 11
TABLE 7 TOTAL NUMBER OF FISH ENTRAINED BY MONTH AND BY SEASON
MONTH
ENTRAINMENT RATE
INFORMATION FROM THE 9-
STUDY DATABASE
10-YEAR AVERAGE MONTHLY FLOWS
(MCF)
TOTAL NUMBER OF FISH
ENTRAINED
December 4.57 15,748.72 71,971.7 January 4.57 14,221.98 64,994.47 February 4.57 18,498.41 84,537.7 Winter 221,503.9 March 6.11 17,191.85 105,042.2 April 6.11 13,033.61 79,635.4 May 6.11 12,653.83 77,314.9
Spring 261,992.5 June 5.56 8,050.49 44,760.7 July 5.56 7,456.13 41,456.1
August 5.56 5,807.04 32,287.1 Summer 118,504.0
September 3.67 7,185.54 26,370.9 October 3.67 6,281.38 23,052.7
November 3.67 9,925.55 36,426.8 Fall 85,850.4
TOTAL 687,851 TABLE 8 ESTIMATED NUMBER OF FISH POTENTIALLY ENTRAINED WITHIN EACH
FAMILY GROUP BY SEASON
NAME WINTER SPRING SUMMER FALL TOTAL Clupeidae 162,583.84 92,247.55 20,643.39 27,575.14 303,049.92 Centrarchidae-panfish 8,328.55 53,053.47 43,408.00 30,640.00 135,430.01 Centrarchidae-black bass 199.35 1,440.96 948.03 291.89 2,880.23 Ictaluridae 32,073.76 33,823.23 38,620.44 14,740.51 119,257.94 Percidae 9,746.17 32,172.67 1,232.44 1,064.54 44,215.83 Catostomidae 5,515.45 33,089.65 3,448.47 5,185.36 47,238.92 Cyprinidae 1,041.07 14,147.59 10,250.59 5,537.35 30,976.60 Moronidae 2,104.29 1,860.15 11.85 892.84 4,869.13 Atherinopsidae 0.00 104.80 0.00 0.00 104.80 Aphredoderidae 0.00 26.20 0.00 25.76 51.95 Esocidae 0.00 0.00 0.00 0.00 0.00 Anguillidae 0.00 0.00 0.00 0.00 0.00 Lepisosteidae 0.00 0.00 0.00 0.00 0.00 Poeciliidae 0.00 0.00 0.00 0.00 0.00 Sciaenidae-freshwater drum 0.00 550.18 1,777.56 37.77 2,365.52 TOTAL 221,592 262,516 120,341 85,991 690,441*
*Totals may not match due to rounding
Tables – Page 12
TABLE 9 ANNUAL SIZE COMPOSITION OF FISH FAMILY/GENUS GROUPS IN THE ENTRAINMENT DATABASE
INCHES 1 2 3 4 5 6 7 8 9 10 10-12 12-16 16-20 20-24 24-28 28-32 32-36 TOTAL FAMILY/GENUS MM 0-25 26-50 51-75 76-100 101-125 126-150 151-175 176-200 201-225 226-250 251-300 301-400 401-500 501-600 601-700 701-800 801-900 Clupeidae 0.00 30,911.09 44,245.29 51,518.49 54,548.99 62,731.33 29,092.79 6,364.05 7,576.25 4,242.70 3,030.50 6,667.10 2,121.35 0.00 0.00 0.00 0.00 303,049.92 Centrarchidae-panfish 1,354.30 16,657.89 35,211.80 28,169.44 13,543.00 6,365.21 20,314.50 7,042.36 5,281.77 2,844.03 0.00 0.00 0.00 0.00 0.00 0.00 0.00 136,784.31 Centrarchidae-black bass 2.88 429.16 184.34 123.85 2.88 0.00 0.00 576.05 95.05 95.05 132.49 797.83 440.68 0.00 0.00 0.00 0.00 2,880.23 Ictaluridae 0.00 10,017.67 12,999.11 19,319.79 19,439.04 6,201.41 15,145.76 7,393.99 3,458.48 2,146.64 15,861.31 6,201.41 0.00 954.06 0.00 0.00 0.00 119,138.68 Percidae 2,122.36 6,278.65 23,876.55 663.24 707.45 1,812.85 619.02 1,149.61 663.24 44.22 44.22 0.00 0.00 6,322.86 0.00 0.00 0.00 44,304.26 Catostomidae 0.00 0.00 1,086.50 236.19 0.00 1,464.41 708.58 4,393.22 7,794.42 4,157.03 11,951.45 13,463.09 1,558.88 377.91 0.00 0.00 0.00 47,191.68 Cyprinidae 0.00 4,119.89 14,311.19 9,200.05 898.32 92.93 247.81 402.70 185.86 0.00 0.00 340.74 402.70 681.49 61.95 30.98 0.00 30,976.60 Moronidae 0.00 0.00 4.87 68.17 311.62 769.32 608.64 340.84 306.76 63.30 632.99 930.00 735.24 102.25 0.00 0.00 0.00 4,874.00 Atherinopsidae 8.49 45.27 36.78 11.32 0.00 2.83 0.00 0.00 0.00 0.00 0.00 0.00 0.00 0.00 0.00 0.00 0.00 104.69 Aphredoderidae 0.00 10.65 38.65 2.65 0.00 0.00 0.00 0.00 0.00 0.00 0.00 0.00 0.00 0.00 0.00 0.00 0.00 51.95 Esocidae 0.00 0.00 0.00 0.00 0.00 0.00 0.00 0.00 0.00 0.00 0.00 0.00 0.00 0.00 0.00 0.00 0.00 0.00 Anguillidae 0.00 0.00 0.00 0.00 0.00 0.00 0.00 0.00 0.00 0.00 0.00 0.00 0.00 0.00 0.00 0.00 0.00 0.00 Lepisosteidae 0.00 0.00 0.00 0.00 0.00 0.00 0.00 0.00 0.00 0.00 0.00 0.00 0.00 0.00 0.00 0.00 0.00 0.00 Poeciliidae 0.00 0.00 0.00 0.00 0.00 0.00 0.00 0.00 0.00 0.00 0.00 0.00 0.00 0.00 0.00 0.00 0.00 0.00 Sciaenidae-freshwater drum 4.73 4.73 475.47 475.47 28.39 28.39 37.85 37.85 56.77 56.77 525.15 525.15 96.99 14.19 0.00 0.00 0.00 2,367.89
3,488 68,470 131,995 109,313 89,451 79,440 66,737 27,663 25,362 13,593 31,653 28,400 5,259 8,439 62 31 0.00 691,725*
*Totals may not match due to rounding
Tables – Page 13
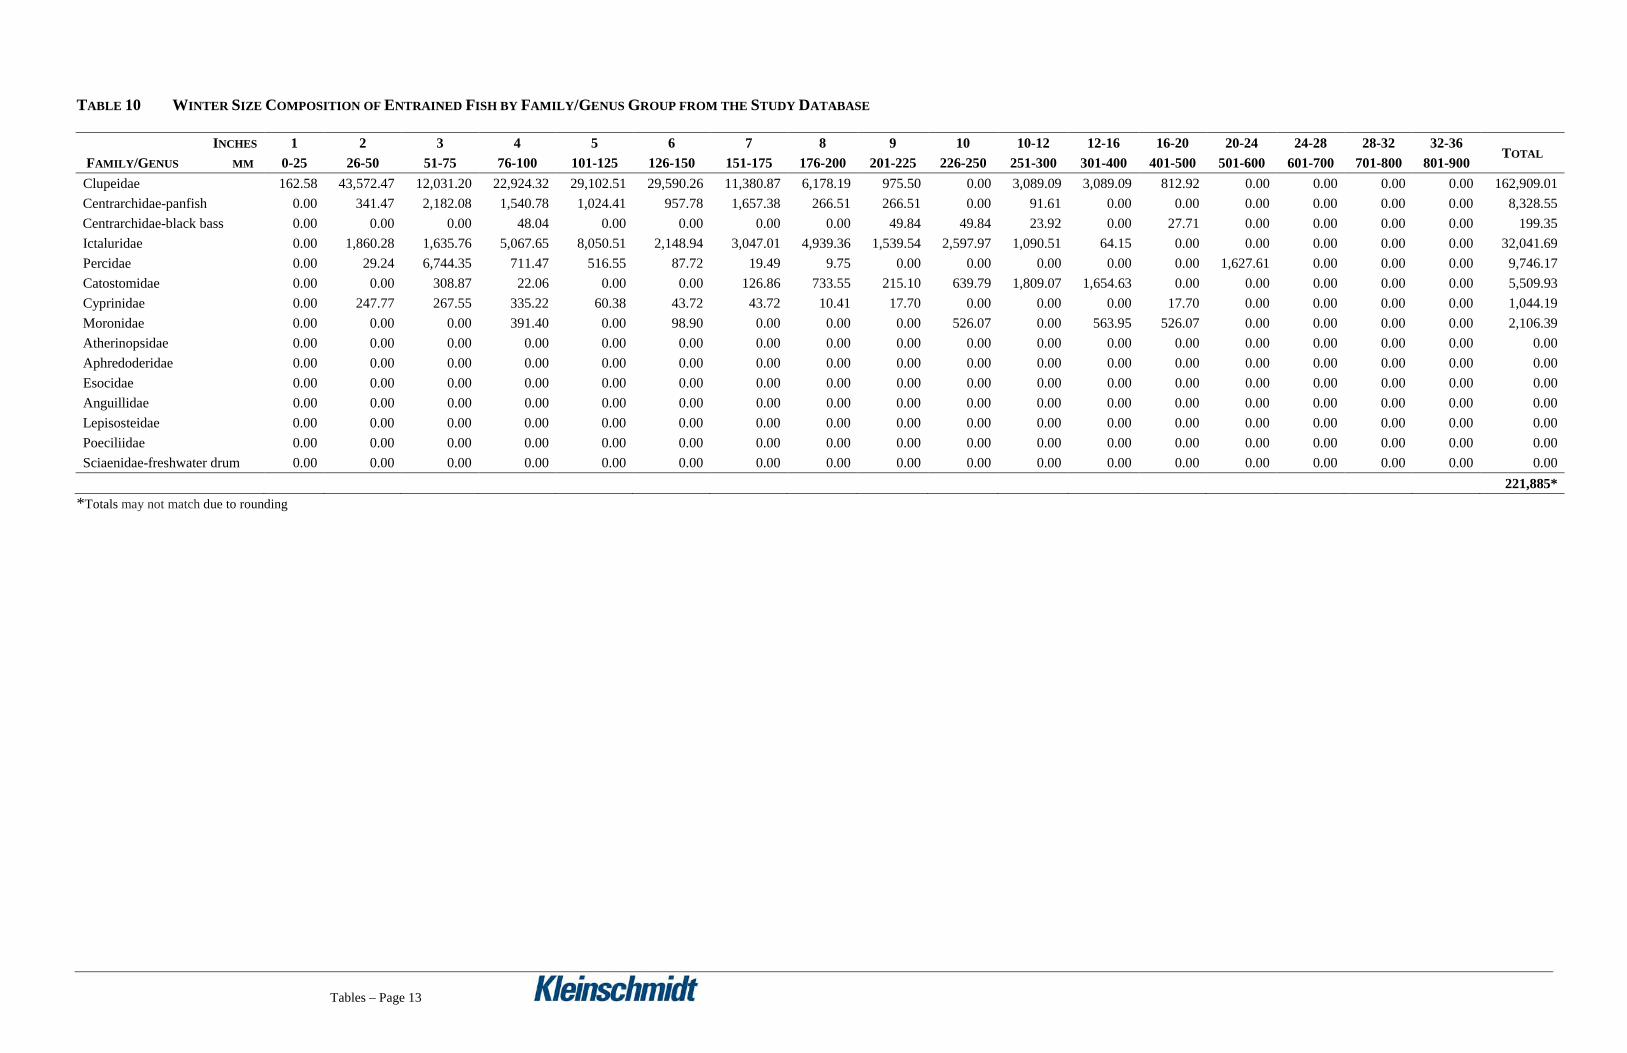
TABLE 10 WINTER SIZE COMPOSITION OF ENTRAINED FISH BY FAMILY/GENUS GROUP FROM THE STUDY DATABASE
INCHES 1 2 3 4 5 6 7 8 9 10 10-12 12-16 16-20 20-24 24-28 28-32 32-36 TOTAL
FAMILY/GENUS MM 0-25 26-50 51-75 76-100 101-125 126-150 151-175 176-200 201-225 226-250 251-300 301-400 401-500 501-600 601-700 701-800 801-900 Clupeidae 162.58 43,572.47 12,031.20 22,924.32 29,102.51 29,590.26 11,380.87 6,178.19 975.50 0.00 3,089.09 3,089.09 812.92 0.00 0.00 0.00 0.00 162,909.01 Centrarchidae-panfish 0.00 341.47 2,182.08 1,540.78 1,024.41 957.78 1,657.38 266.51 266.51 0.00 91.61 0.00 0.00 0.00 0.00 0.00 0.00 8,328.55 Centrarchidae-black bass 0.00 0.00 0.00 48.04 0.00 0.00 0.00 0.00 49.84 49.84 23.92 0.00 27.71 0.00 0.00 0.00 0.00 199.35 Ictaluridae 0.00 1,860.28 1,635.76 5,067.65 8,050.51 2,148.94 3,047.01 4,939.36 1,539.54 2,597.97 1,090.51 64.15 0.00 0.00 0.00 0.00 0.00 32,041.69 Percidae 0.00 29.24 6,744.35 711.47 516.55 87.72 19.49 9.75 0.00 0.00 0.00 0.00 0.00 1,627.61 0.00 0.00 0.00 9,746.17 Catostomidae 0.00 0.00 308.87 22.06 0.00 0.00 126.86 733.55 215.10 639.79 1,809.07 1,654.63 0.00 0.00 0.00 0.00 0.00 5,509.93 Cyprinidae 0.00 247.77 267.55 335.22 60.38 43.72 43.72 10.41 17.70 0.00 0.00 0.00 17.70 0.00 0.00 0.00 0.00 1,044.19 Moronidae 0.00 0.00 0.00 391.40 0.00 98.90 0.00 0.00 0.00 526.07 0.00 563.95 526.07 0.00 0.00 0.00 0.00 2,106.39 Atherinopsidae 0.00 0.00 0.00 0.00 0.00 0.00 0.00 0.00 0.00 0.00 0.00 0.00 0.00 0.00 0.00 0.00 0.00 0.00 Aphredoderidae 0.00 0.00 0.00 0.00 0.00 0.00 0.00 0.00 0.00 0.00 0.00 0.00 0.00 0.00 0.00 0.00 0.00 0.00 Esocidae 0.00 0.00 0.00 0.00 0.00 0.00 0.00 0.00 0.00 0.00 0.00 0.00 0.00 0.00 0.00 0.00 0.00 0.00 Anguillidae 0.00 0.00 0.00 0.00 0.00 0.00 0.00 0.00 0.00 0.00 0.00 0.00 0.00 0.00 0.00 0.00 0.00 0.00 Lepisosteidae 0.00 0.00 0.00 0.00 0.00 0.00 0.00 0.00 0.00 0.00 0.00 0.00 0.00 0.00 0.00 0.00 0.00 0.00 Poeciliidae 0.00 0.00 0.00 0.00 0.00 0.00 0.00 0.00 0.00 0.00 0.00 0.00 0.00 0.00 0.00 0.00 0.00 0.00 Sciaenidae-freshwater drum 0.00 0.00 0.00 0.00 0.00 0.00 0.00 0.00 0.00 0.00 0.00 0.00 0.00 0.00 0.00 0.00 0.00 0.00
221,885* *Totals may not match due to rounding
Tables – Page 14
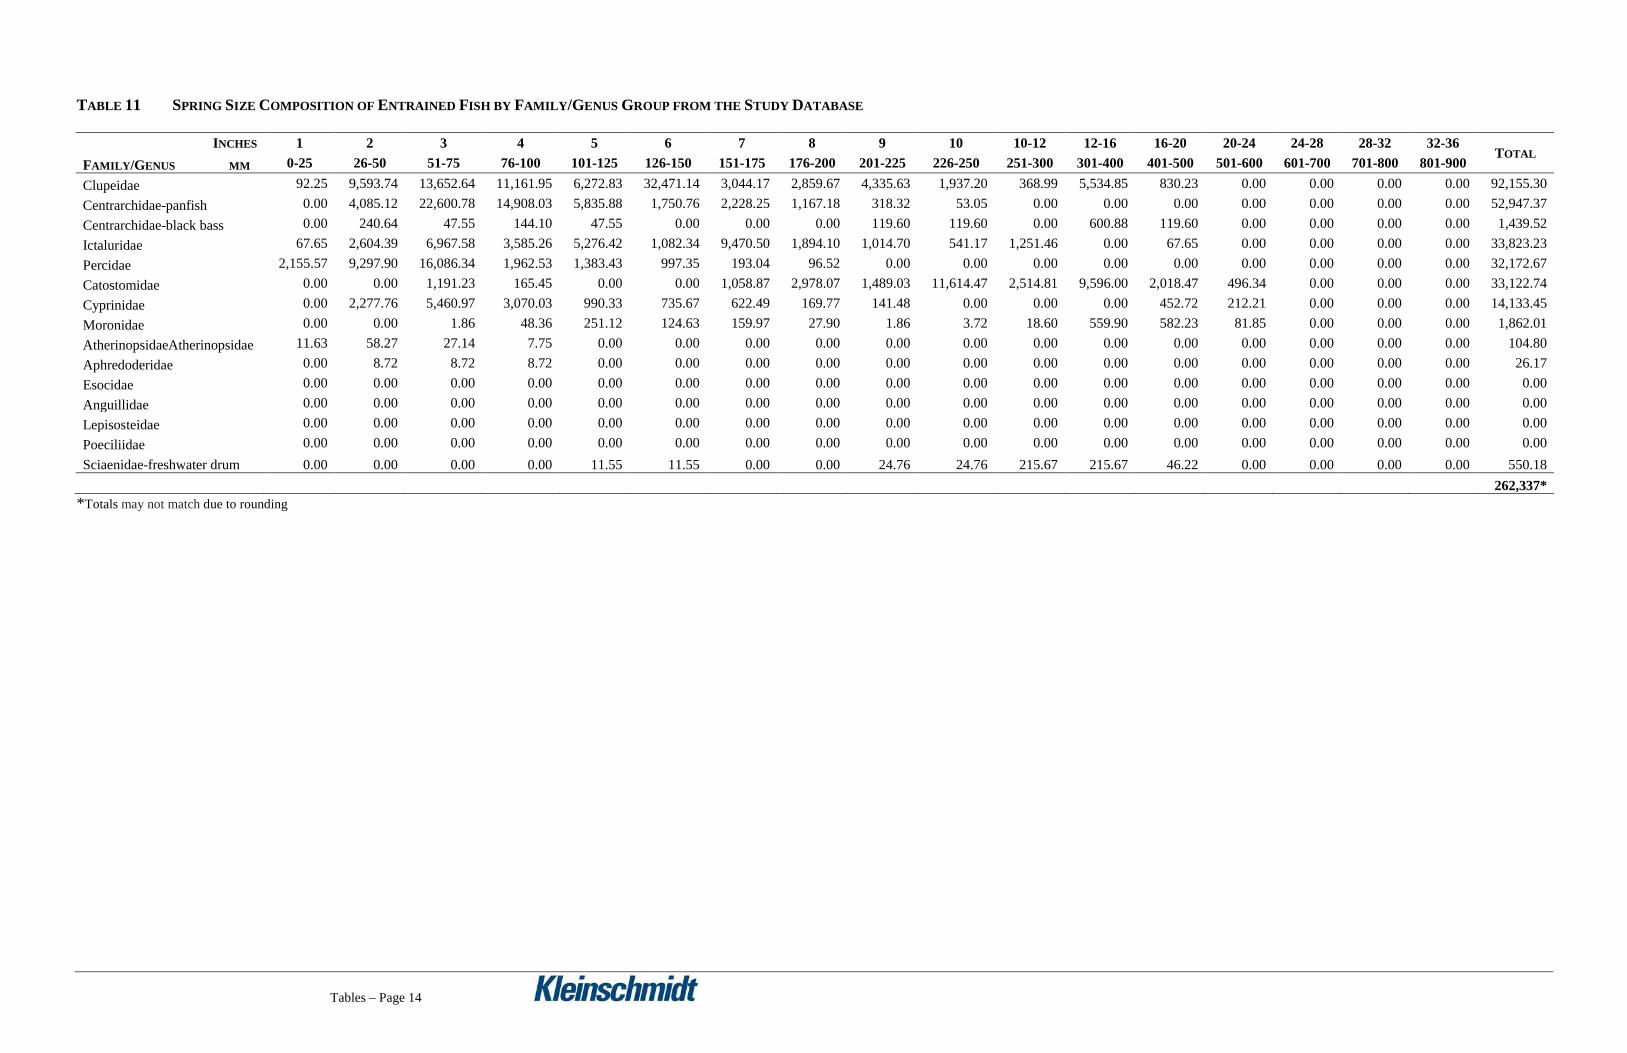
TABLE 11 SPRING SIZE COMPOSITION OF ENTRAINED FISH BY FAMILY/GENUS GROUP FROM THE STUDY DATABASE
INCHES 1 2 3 4 5 6 7 8 9 10 10-12 12-16 16-20 20-24 24-28 28-32 32-36 TOTAL
FAMILY/GENUS MM 0-25 26-50 51-75 76-100 101-125 126-150 151-175 176-200 201-225 226-250 251-300 301-400 401-500 501-600 601-700 701-800 801-900 Clupeidae 92.25 9,593.74 13,652.64 11,161.95 6,272.83 32,471.14 3,044.17 2,859.67 4,335.63 1,937.20 368.99 5,534.85 830.23 0.00 0.00 0.00 0.00 92,155.30 Centrarchidae-panfish 0.00 4,085.12 22,600.78 14,908.03 5,835.88 1,750.76 2,228.25 1,167.18 318.32 53.05 0.00 0.00 0.00 0.00 0.00 0.00 0.00 52,947.37 Centrarchidae-black bass 0.00 240.64 47.55 144.10 47.55 0.00 0.00 0.00 119.60 119.60 0.00 600.88 119.60 0.00 0.00 0.00 0.00 1,439.52 Ictaluridae 67.65 2,604.39 6,967.58 3,585.26 5,276.42 1,082.34 9,470.50 1,894.10 1,014.70 541.17 1,251.46 0.00 67.65 0.00 0.00 0.00 0.00 33,823.23 Percidae 2,155.57 9,297.90 16,086.34 1,962.53 1,383.43 997.35 193.04 96.52 0.00 0.00 0.00 0.00 0.00 0.00 0.00 0.00 0.00 32,172.67 Catostomidae 0.00 0.00 1,191.23 165.45 0.00 0.00 1,058.87 2,978.07 1,489.03 11,614.47 2,514.81 9,596.00 2,018.47 496.34 0.00 0.00 0.00 33,122.74 Cyprinidae 0.00 2,277.76 5,460.97 3,070.03 990.33 735.67 622.49 169.77 141.48 0.00 0.00 0.00 452.72 212.21 0.00 0.00 0.00 14,133.45 Moronidae 0.00 0.00 1.86 48.36 251.12 124.63 159.97 27.90 1.86 3.72 18.60 559.90 582.23 81.85 0.00 0.00 0.00 1,862.01 AtherinopsidaeAtherinopsidae 11.63 58.27 27.14 7.75 0.00 0.00 0.00 0.00 0.00 0.00 0.00 0.00 0.00 0.00 0.00 0.00 0.00 104.80 Aphredoderidae 0.00 8.72 8.72 8.72 0.00 0.00 0.00 0.00 0.00 0.00 0.00 0.00 0.00 0.00 0.00 0.00 0.00 26.17 Esocidae 0.00 0.00 0.00 0.00 0.00 0.00 0.00 0.00 0.00 0.00 0.00 0.00 0.00 0.00 0.00 0.00 0.00 0.00 Anguillidae 0.00 0.00 0.00 0.00 0.00 0.00 0.00 0.00 0.00 0.00 0.00 0.00 0.00 0.00 0.00 0.00 0.00 0.00 Lepisosteidae 0.00 0.00 0.00 0.00 0.00 0.00 0.00 0.00 0.00 0.00 0.00 0.00 0.00 0.00 0.00 0.00 0.00 0.00 Poeciliidae 0.00 0.00 0.00 0.00 0.00 0.00 0.00 0.00 0.00 0.00 0.00 0.00 0.00 0.00 0.00 0.00 0.00 0.00 Sciaenidae-freshwater drum 0.00 0.00 0.00 0.00 11.55 11.55 0.00 0.00 24.76 24.76 215.67 215.67 46.22 0.00 0.00 0.00 0.00 550.18
262,337*
*Totals may not match due to rounding
Tables – Page 15
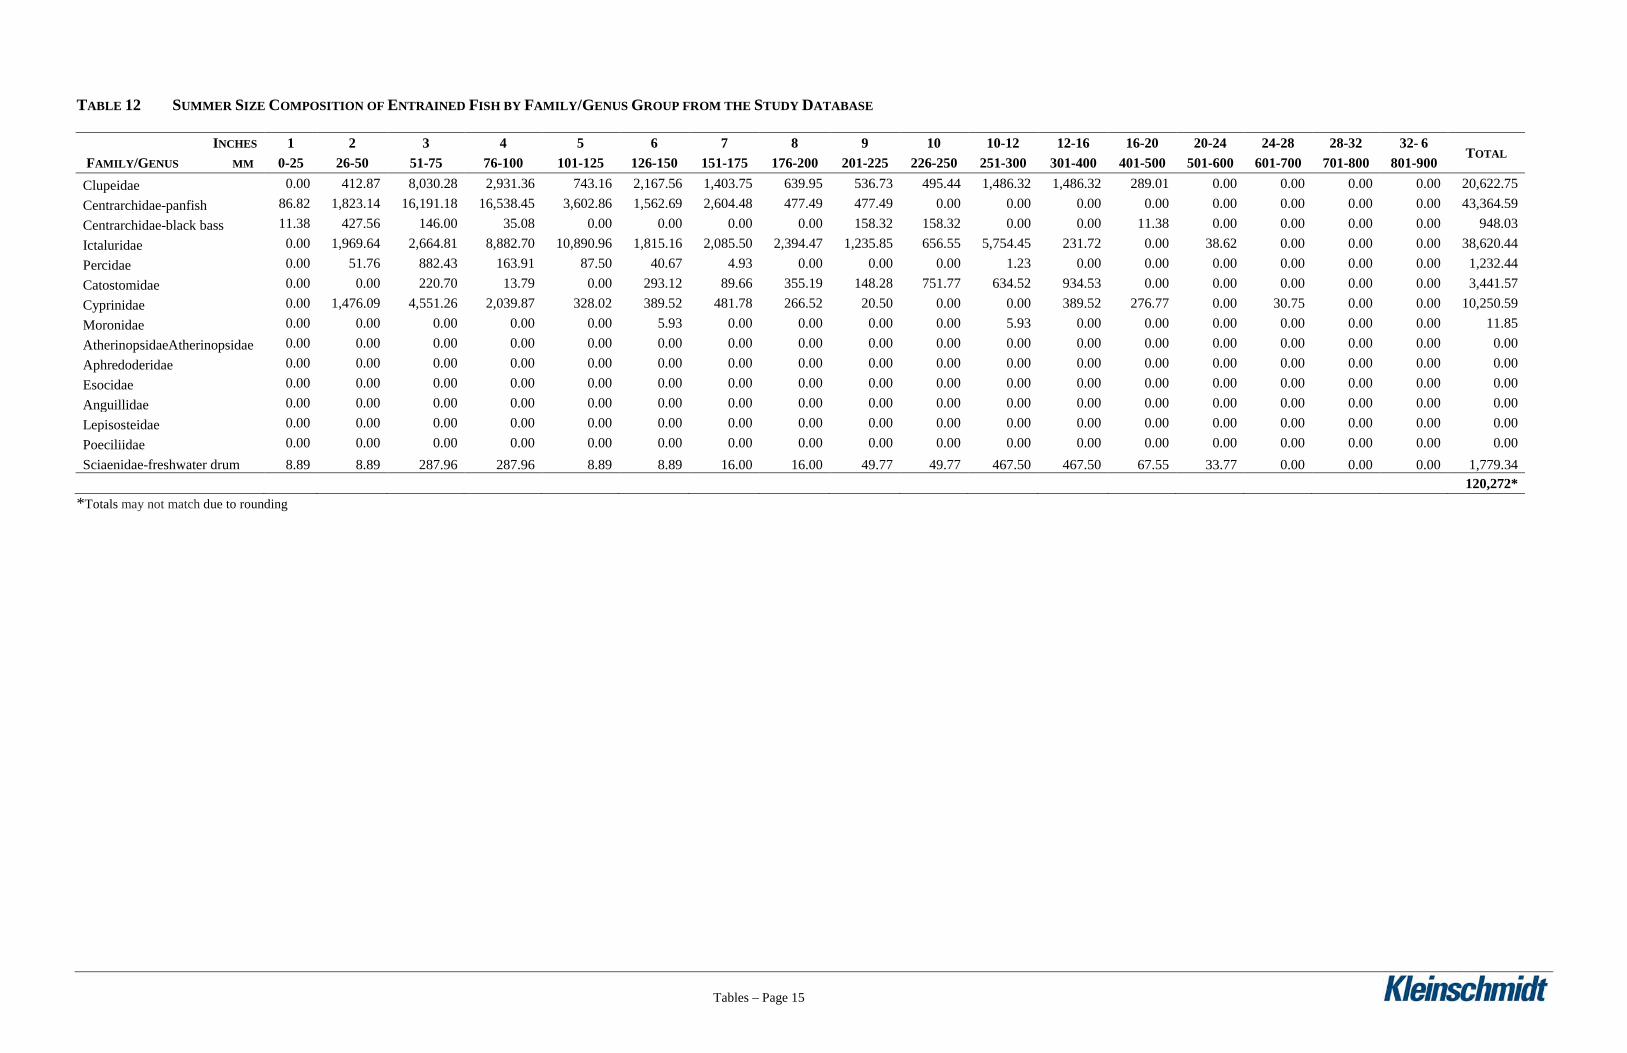
TABLE 12 SUMMER SIZE COMPOSITION OF ENTRAINED FISH BY FAMILY/GENUS GROUP FROM THE STUDY DATABASE
INCHES 1 2 3 4 5 6 7 8 9 10 10-12 12-16 16-20 20-24 24-28 28-32 32- 6 TOTAL
FAMILY/GENUS MM 0-25 26-50 51-75 76-100 101-125 126-150 151-175 176-200 201-225 226-250 251-300 301-400 401-500 501-600 601-700 701-800 801-900 Clupeidae 0.00 412.87 8,030.28 2,931.36 743.16 2,167.56 1,403.75 639.95 536.73 495.44 1,486.32 1,486.32 289.01 0.00 0.00 0.00 0.00 20,622.75 Centrarchidae-panfish 86.82 1,823.14 16,191.18 16,538.45 3,602.86 1,562.69 2,604.48 477.49 477.49 0.00 0.00 0.00 0.00 0.00 0.00 0.00 0.00 43,364.59 Centrarchidae-black bass 11.38 427.56 146.00 35.08 0.00 0.00 0.00 0.00 158.32 158.32 0.00 0.00 11.38 0.00 0.00 0.00 0.00 948.03 Ictaluridae 0.00 1,969.64 2,664.81 8,882.70 10,890.96 1,815.16 2,085.50 2,394.47 1,235.85 656.55 5,754.45 231.72 0.00 38.62 0.00 0.00 0.00 38,620.44 Percidae 0.00 51.76 882.43 163.91 87.50 40.67 4.93 0.00 0.00 0.00 1.23 0.00 0.00 0.00 0.00 0.00 0.00 1,232.44 Catostomidae 0.00 0.00 220.70 13.79 0.00 293.12 89.66 355.19 148.28 751.77 634.52 934.53 0.00 0.00 0.00 0.00 0.00 3,441.57 Cyprinidae 0.00 1,476.09 4,551.26 2,039.87 328.02 389.52 481.78 266.52 20.50 0.00 0.00 389.52 276.77 0.00 30.75 0.00 0.00 10,250.59 Moronidae 0.00 0.00 0.00 0.00 0.00 5.93 0.00 0.00 0.00 0.00 5.93 0.00 0.00 0.00 0.00 0.00 0.00 11.85 AtherinopsidaeAtherinopsidae 0.00 0.00 0.00 0.00 0.00 0.00 0.00 0.00 0.00 0.00 0.00 0.00 0.00 0.00 0.00 0.00 0.00 0.00 Aphredoderidae 0.00 0.00 0.00 0.00 0.00 0.00 0.00 0.00 0.00 0.00 0.00 0.00 0.00 0.00 0.00 0.00 0.00 0.00 Esocidae 0.00 0.00 0.00 0.00 0.00 0.00 0.00 0.00 0.00 0.00 0.00 0.00 0.00 0.00 0.00 0.00 0.00 0.00 Anguillidae 0.00 0.00 0.00 0.00 0.00 0.00 0.00 0.00 0.00 0.00 0.00 0.00 0.00 0.00 0.00 0.00 0.00 0.00 Lepisosteidae 0.00 0.00 0.00 0.00 0.00 0.00 0.00 0.00 0.00 0.00 0.00 0.00 0.00 0.00 0.00 0.00 0.00 0.00 Poeciliidae 0.00 0.00 0.00 0.00 0.00 0.00 0.00 0.00 0.00 0.00 0.00 0.00 0.00 0.00 0.00 0.00 0.00 0.00 Sciaenidae-freshwater drum 8.89 8.89 287.96 287.96 8.89 8.89 16.00 16.00 49.77 49.77 467.50 467.50 67.55 33.77 0.00 0.00 0.00 1,779.34
120,272* *Totals may not match due to rounding
Tables – Page 16
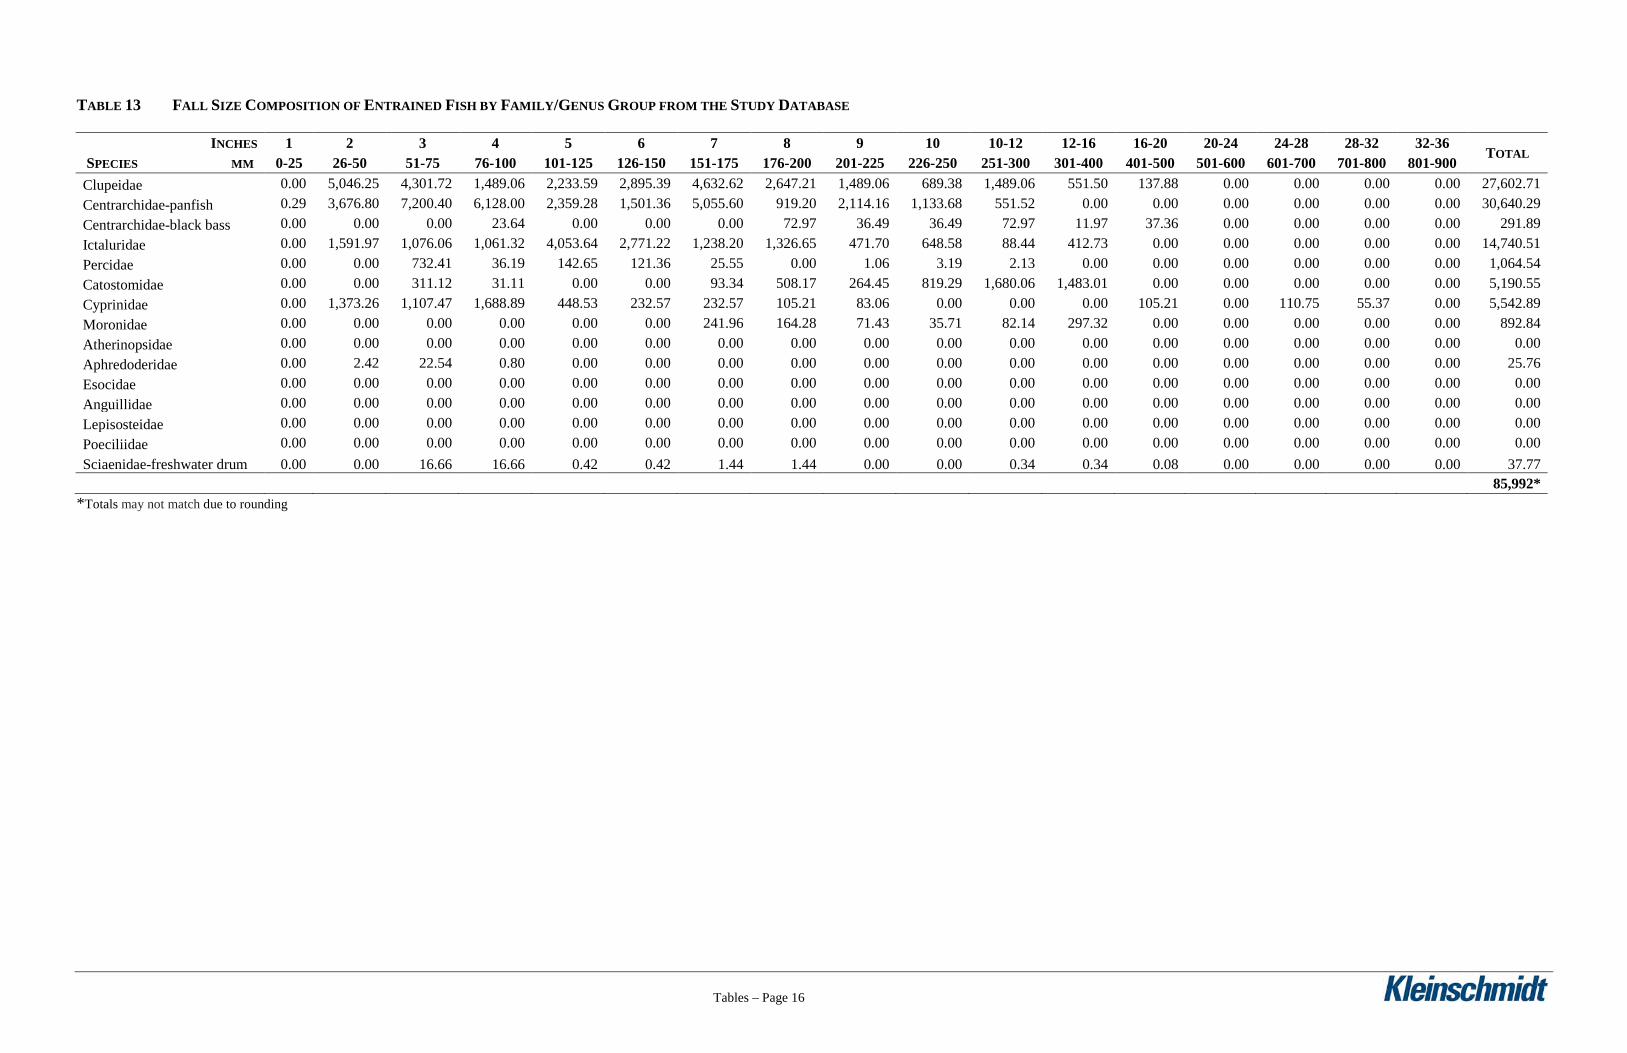
TABLE 13 FALL SIZE COMPOSITION OF ENTRAINED FISH BY FAMILY/GENUS GROUP FROM THE STUDY DATABASE
INCHES 1 2 3 4 5 6 7 8 9 10 10-12 12-16 16-20 20-24 24-28 28-32 32-36 TOTAL
SPECIES MM 0-25 26-50 51-75 76-100 101-125 126-150 151-175 176-200 201-225 226-250 251-300 301-400 401-500 501-600 601-700 701-800 801-900 Clupeidae 0.00 5,046.25 4,301.72 1,489.06 2,233.59 2,895.39 4,632.62 2,647.21 1,489.06 689.38 1,489.06 551.50 137.88 0.00 0.00 0.00 0.00 27,602.71 Centrarchidae-panfish 0.29 3,676.80 7,200.40 6,128.00 2,359.28 1,501.36 5,055.60 919.20 2,114.16 1,133.68 551.52 0.00 0.00 0.00 0.00 0.00 0.00 30,640.29 Centrarchidae-black bass 0.00 0.00 0.00 23.64 0.00 0.00 0.00 72.97 36.49 36.49 72.97 11.97 37.36 0.00 0.00 0.00 0.00 291.89 Ictaluridae 0.00 1,591.97 1,076.06 1,061.32 4,053.64 2,771.22 1,238.20 1,326.65 471.70 648.58 88.44 412.73 0.00 0.00 0.00 0.00 0.00 14,740.51 Percidae 0.00 0.00 732.41 36.19 142.65 121.36 25.55 0.00 1.06 3.19 2.13 0.00 0.00 0.00 0.00 0.00 0.00 1,064.54 Catostomidae 0.00 0.00 311.12 31.11 0.00 0.00 93.34 508.17 264.45 819.29 1,680.06 1,483.01 0.00 0.00 0.00 0.00 0.00 5,190.55 Cyprinidae 0.00 1,373.26 1,107.47 1,688.89 448.53 232.57 232.57 105.21 83.06 0.00 0.00 0.00 105.21 0.00 110.75 55.37 0.00 5,542.89 Moronidae 0.00 0.00 0.00 0.00 0.00 0.00 241.96 164.28 71.43 35.71 82.14 297.32 0.00 0.00 0.00 0.00 0.00 892.84 Atherinopsidae 0.00 0.00 0.00 0.00 0.00 0.00 0.00 0.00 0.00 0.00 0.00 0.00 0.00 0.00 0.00 0.00 0.00 0.00 Aphredoderidae 0.00 2.42 22.54 0.80 0.00 0.00 0.00 0.00 0.00 0.00 0.00 0.00 0.00 0.00 0.00 0.00 0.00 25.76 Esocidae 0.00 0.00 0.00 0.00 0.00 0.00 0.00 0.00 0.00 0.00 0.00 0.00 0.00 0.00 0.00 0.00 0.00 0.00 Anguillidae 0.00 0.00 0.00 0.00 0.00 0.00 0.00 0.00 0.00 0.00 0.00 0.00 0.00 0.00 0.00 0.00 0.00 0.00 Lepisosteidae 0.00 0.00 0.00 0.00 0.00 0.00 0.00 0.00 0.00 0.00 0.00 0.00 0.00 0.00 0.00 0.00 0.00 0.00 Poeciliidae 0.00 0.00 0.00 0.00 0.00 0.00 0.00 0.00 0.00 0.00 0.00 0.00 0.00 0.00 0.00 0.00 0.00 0.00 Sciaenidae-freshwater drum 0.00 0.00 16.66 16.66 0.42 0.42 1.44 1.44 0.00 0.00 0.34 0.34 0.08 0.00 0.00 0.00 0.00 37.77
85,992* *Totals may not match due to rounding

Tables – Page 17
TABLE 14 ESTIMATED ANNUAL TOTAL NUMBER OF POTENTIALLY ENTRAINED FISH KILLED DUE TO TURBINE MORTALITY AT THE HOLT PROJECT
WINTER SPRING SUMMER FALL ANNUAL
17,362 27,0656 12,595 10,014 66,768
Tables – Page 18
TABLE 15 ANNUAL SIZE COMPOSITION OF FISH KILLED BY FAMILY/GENUS GROUPS
INCHES 1 2 3 4 5 6 7 8 9 10 10-12 12-16 16-20 20-24 24-28 28-32 32-36 TOTAL
FAMILY/GENUS MM 0-25 26-50 51-75 76-100 101-125 126-150 151-175 176-200 201-225 226-250 251-300 301-400 401-500 501-600 601-700 701-800 801-900 Clupeidae 0.00 1,205.53 1,725.57 2,009.22 2,127.41 2,446.52 6,662.25 1,457.37 1,734.96 971.58 693.98 1,526.77 485.79 0.00 0.00 0.00 0.00 23,046.95 Centrarchidae-panfish 148.97 1,832.37 3,873.30 3,098.64 1,489.73 700.17 2,559.63 887.34 665.50 358.35 0.00 0.00 0.00 0.00 0.00 0.00 0.00 15,614.00 Centrarchidae-black bass 0.26 39.05 16.77 11.27 0.26 0.00 0.00 52.42 8.65 8.65 12.06 72.60 40.10 0.00 0.00 0.00 0.00 262.10 Ictaluridae 0.00 891.57 1,156.92 1,719.46 1,730.07 551.93 1,347.97 658.07 307.80 191.05 1,411.66 551.93 0.00 84.91 0.00 0.00 0.00 10,603.34 Percidae 176.16 521.13 1,981.75 55.05 58.72 150.47 51.38 95.42 55.05 3.67 3.67 0.00 0.00 524.80 0.00 0.00 0.00 3,677.25 Catostomidae 0.00 0.00 201.00 43.70 0.00 270.92 131.09 812.75 1,441.97 769.05 2,211.02 2,490.67 288.39 69.91 0.00 0.00 0.00 8,730.46 Cyprinidae 0.00 453.19 1,574.23 1,012.01 98.82 10.22 31.22 50.74 23.42 0.00 0.00 50.09 59.20 100.18 9.11 4.55 0.00 3,476.97 Moronidae 0.00 0.00 0.90 12.61 57.65 142.32 112.60 63.06 56.75 11.71 117.10 172.05 136.02 18.92 0.00 0.00 0.00 901.69 Atherinopsidae 0.93 4.98 4.05 1.24 0.00 0.31 0.00 0.00 0.00 0.00 0.00 0.00 0.00 0.00 0.00 0.00 0.00 11.52 Aphredoderidae 0.00 1.17 4.25 0.29 0.00 0.00 0.00 0.00 0.00 0.00 0.00 0.00 0.00 0.00 0.00 0.00 0.00 5.71 Esocidae 0.00 0.00 0.00 0.00 0.00 0.00 0.00 0.00 0.00 0.00 0.00 0.00 0.00 0.00 0.00 0.00 0.00 0.00 Anguillidae 0.00 0.00 0.00 0.00 0.00 0.00 0.00 0.00 0.00 0.00 0.00 0.00 0.00 0.00 0.00 0.00 0.00 0.00 Lepisosteidae 0.00 0.00 0.00 0.00 0.00 0.00 0.00 0.00 0.00 0.00 0.00 0.00 0.00 0.00 0.00 0.00 0.00 0.00 Poeciliidae 0.00 0.11 0.00 0.00 0.00 0.00 0.00 0.00 0.00 0.00 0.00 0.00 0.00 0.00 0.00 0.00 0.00 0.11 Sciaenidae-freshwater drum 0.88 0.88 87.96 87.96 5.25 5.25 7.00 7.00 10.50 10.50 97.15 97.15 17.94 2.63 0.00 0.00 0.00 438.06
326 4,949 10,539 7,963 5,563 4,273 10,896 4,077 4,294 2,314 4,449 4,864 1,010 799 9 5 0 66,768* *Totals may not match due to rounding
Tables – Page 19
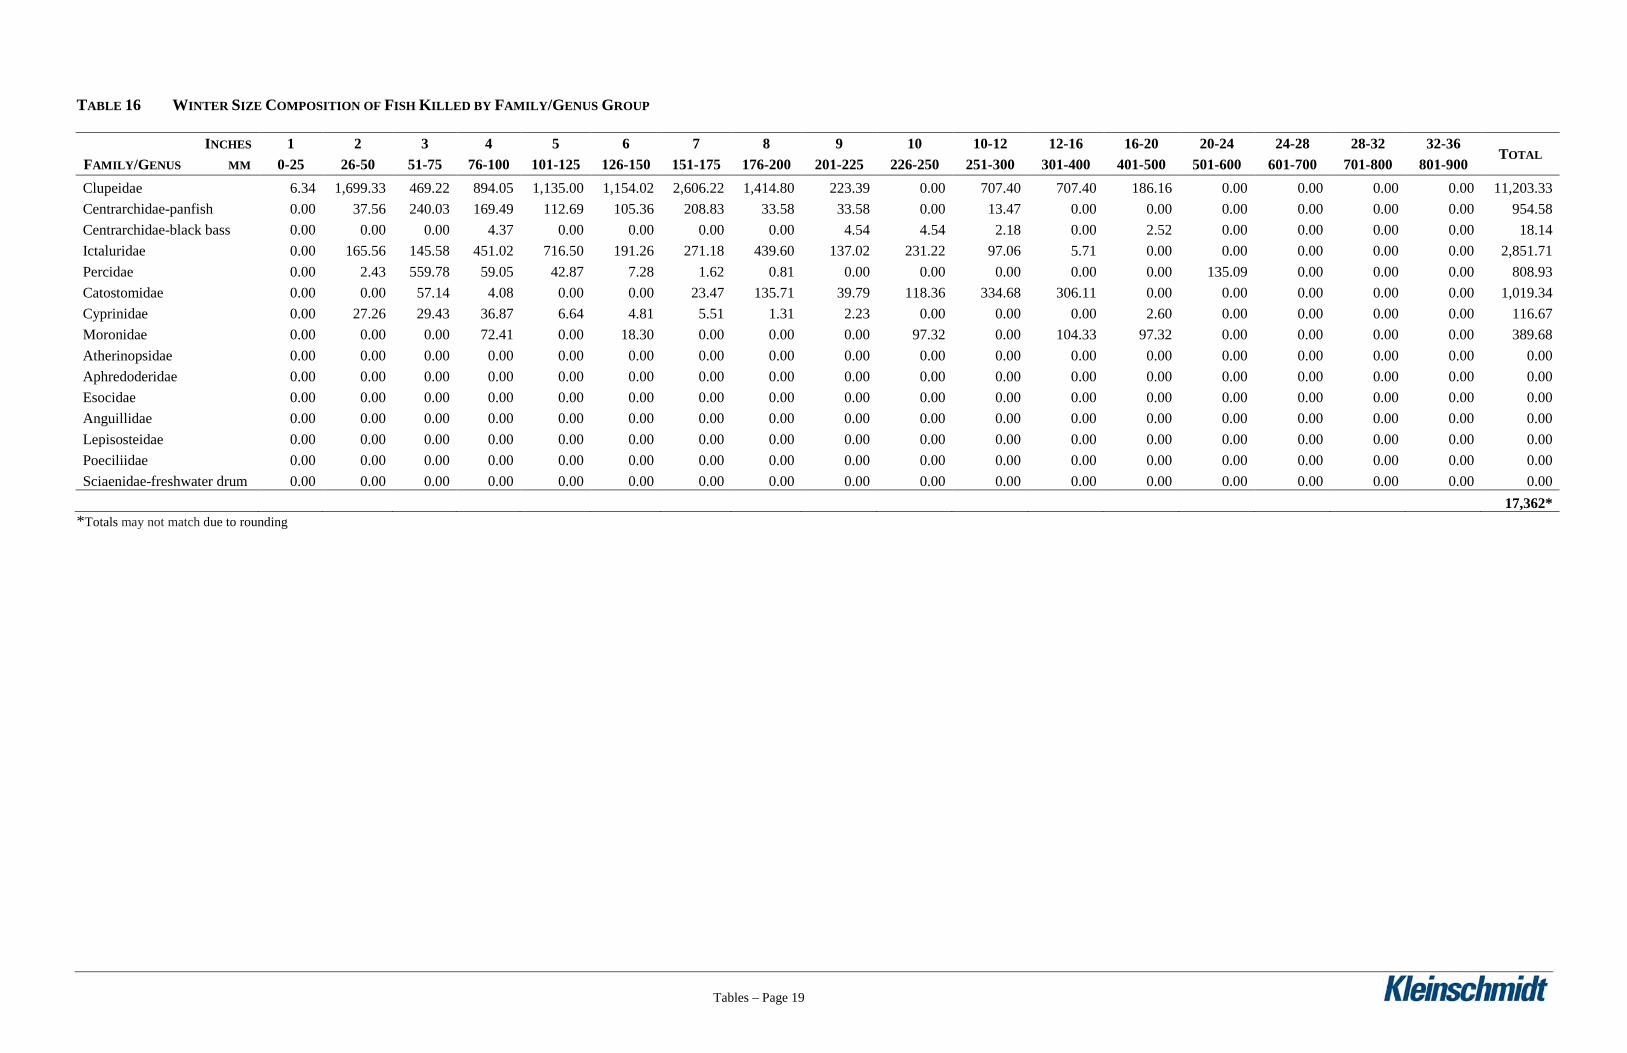
TABLE 16 WINTER SIZE COMPOSITION OF FISH KILLED BY FAMILY/GENUS GROUP
INCHES 1 2 3 4 5 6 7 8 9 10 10-12 12-16 16-20 20-24 24-28 28-32 32-36 TOTAL
FAMILY/GENUS MM 0-25 26-50 51-75 76-100 101-125 126-150 151-175 176-200 201-225 226-250 251-300 301-400 401-500 501-600 601-700 701-800 801-900 Clupeidae 6.34 1,699.33 469.22 894.05 1,135.00 1,154.02 2,606.22 1,414.80 223.39 0.00 707.40 707.40 186.16 0.00 0.00 0.00 0.00 11,203.33 Centrarchidae-panfish 0.00 37.56 240.03 169.49 112.69 105.36 208.83 33.58 33.58 0.00 13.47 0.00 0.00 0.00 0.00 0.00 0.00 954.58 Centrarchidae-black bass 0.00 0.00 0.00 4.37 0.00 0.00 0.00 0.00 4.54 4.54 2.18 0.00 2.52 0.00 0.00 0.00 0.00 18.14 Ictaluridae 0.00 165.56 145.58 451.02 716.50 191.26 271.18 439.60 137.02 231.22 97.06 5.71 0.00 0.00 0.00 0.00 0.00 2,851.71 Percidae 0.00 2.43 559.78 59.05 42.87 7.28 1.62 0.81 0.00 0.00 0.00 0.00 0.00 135.09 0.00 0.00 0.00 808.93 Catostomidae 0.00 0.00 57.14 4.08 0.00 0.00 23.47 135.71 39.79 118.36 334.68 306.11 0.00 0.00 0.00 0.00 0.00 1,019.34 Cyprinidae 0.00 27.26 29.43 36.87 6.64 4.81 5.51 1.31 2.23 0.00 0.00 0.00 2.60 0.00 0.00 0.00 0.00 116.67 Moronidae 0.00 0.00 0.00 72.41 0.00 18.30 0.00 0.00 0.00 97.32 0.00 104.33 97.32 0.00 0.00 0.00 0.00 389.68 Atherinopsidae 0.00 0.00 0.00 0.00 0.00 0.00 0.00 0.00 0.00 0.00 0.00 0.00 0.00 0.00 0.00 0.00 0.00 0.00 Aphredoderidae 0.00 0.00 0.00 0.00 0.00 0.00 0.00 0.00 0.00 0.00 0.00 0.00 0.00 0.00 0.00 0.00 0.00 0.00 Esocidae 0.00 0.00 0.00 0.00 0.00 0.00 0.00 0.00 0.00 0.00 0.00 0.00 0.00 0.00 0.00 0.00 0.00 0.00 Anguillidae 0.00 0.00 0.00 0.00 0.00 0.00 0.00 0.00 0.00 0.00 0.00 0.00 0.00 0.00 0.00 0.00 0.00 0.00 Lepisosteidae 0.00 0.00 0.00 0.00 0.00 0.00 0.00 0.00 0.00 0.00 0.00 0.00 0.00 0.00 0.00 0.00 0.00 0.00 Poeciliidae 0.00 0.00 0.00 0.00 0.00 0.00 0.00 0.00 0.00 0.00 0.00 0.00 0.00 0.00 0.00 0.00 0.00 0.00 Sciaenidae-freshwater drum 0.00 0.00 0.00 0.00 0.00 0.00 0.00 0.00 0.00 0.00 0.00 0.00 0.00 0.00 0.00 0.00 0.00 0.00
17,362*
*Totals may not match due to rounding
Tables – Page 20
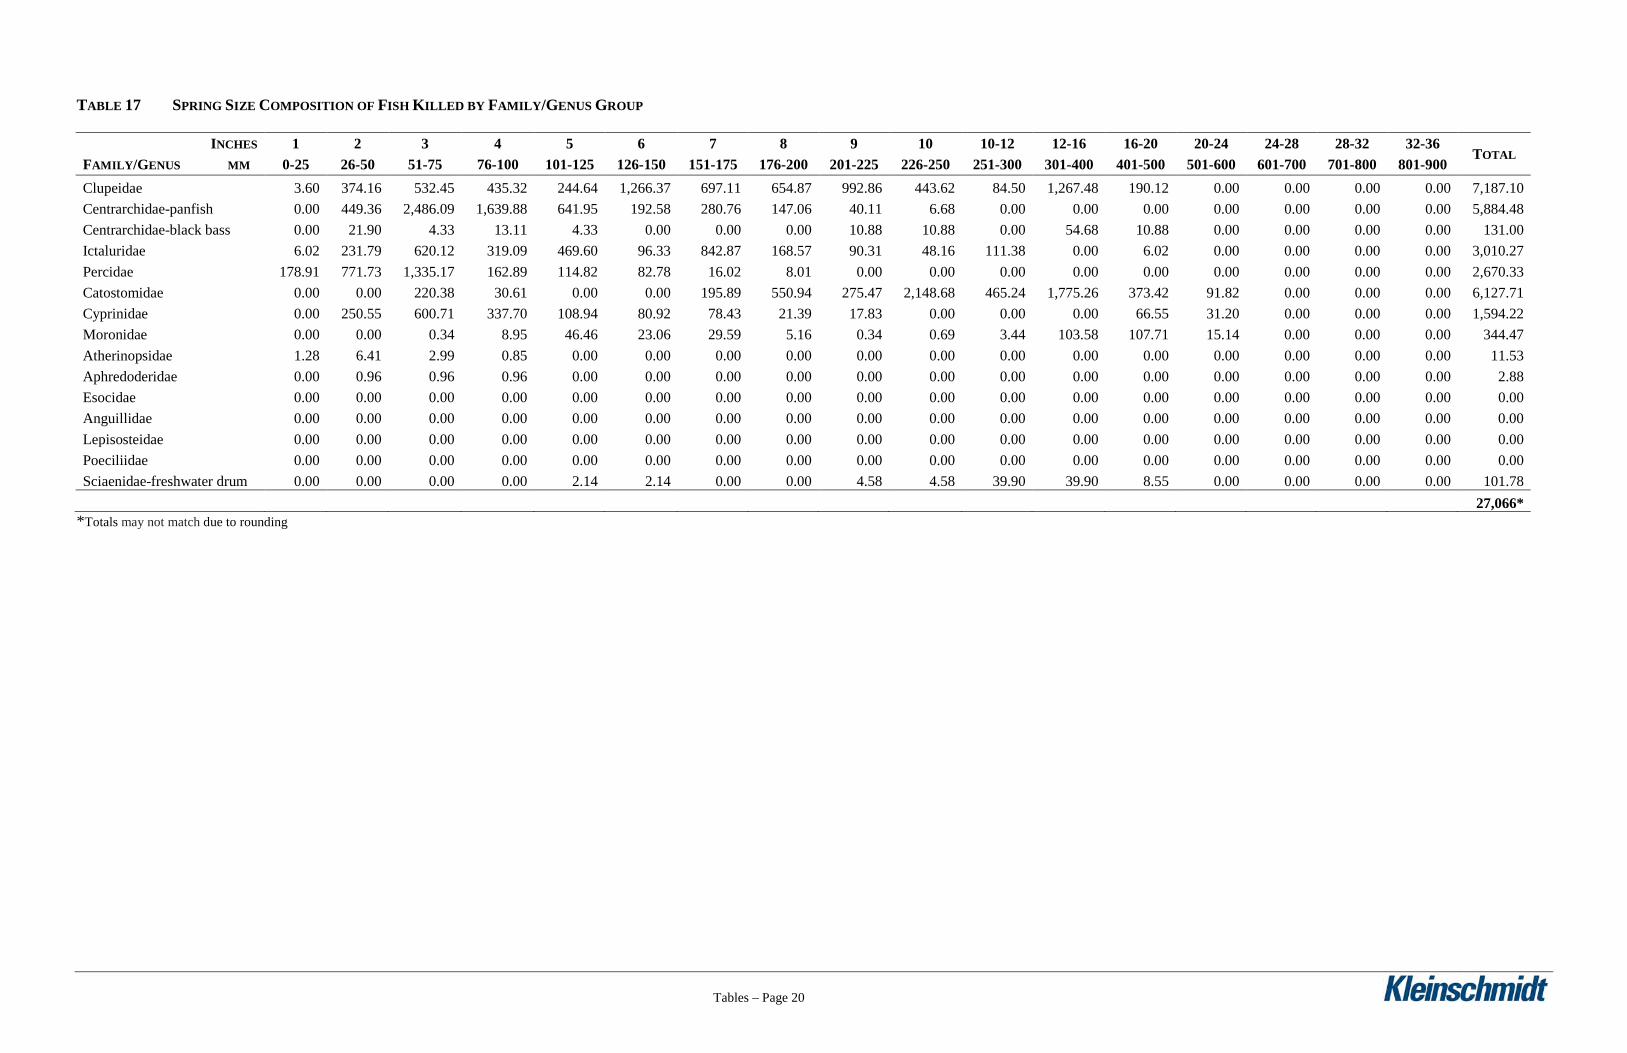
TABLE 17 SPRING SIZE COMPOSITION OF FISH KILLED BY FAMILY/GENUS GROUP
INCHES 1 2 3 4 5 6 7 8 9 10 10-12 12-16 16-20 20-24 24-28 28-32 32-36 TOTAL
FAMILY/GENUS MM 0-25 26-50 51-75 76-100 101-125 126-150 151-175 176-200 201-225 226-250 251-300 301-400 401-500 501-600 601-700 701-800 801-900 Clupeidae 3.60 374.16 532.45 435.32 244.64 1,266.37 697.11 654.87 992.86 443.62 84.50 1,267.48 190.12 0.00 0.00 0.00 0.00 7,187.10 Centrarchidae-panfish 0.00 449.36 2,486.09 1,639.88 641.95 192.58 280.76 147.06 40.11 6.68 0.00 0.00 0.00 0.00 0.00 0.00 0.00 5,884.48 Centrarchidae-black bass 0.00 21.90 4.33 13.11 4.33 0.00 0.00 0.00 10.88 10.88 0.00 54.68 10.88 0.00 0.00 0.00 0.00 131.00 Ictaluridae 6.02 231.79 620.12 319.09 469.60 96.33 842.87 168.57 90.31 48.16 111.38 0.00 6.02 0.00 0.00 0.00 0.00 3,010.27 Percidae 178.91 771.73 1,335.17 162.89 114.82 82.78 16.02 8.01 0.00 0.00 0.00 0.00 0.00 0.00 0.00 0.00 0.00 2,670.33 Catostomidae 0.00 0.00 220.38 30.61 0.00 0.00 195.89 550.94 275.47 2,148.68 465.24 1,775.26 373.42 91.82 0.00 0.00 0.00 6,127.71 Cyprinidae 0.00 250.55 600.71 337.70 108.94 80.92 78.43 21.39 17.83 0.00 0.00 0.00 66.55 31.20 0.00 0.00 0.00 1,594.22 Moronidae 0.00 0.00 0.34 8.95 46.46 23.06 29.59 5.16 0.34 0.69 3.44 103.58 107.71 15.14 0.00 0.00 0.00 344.47 Atherinopsidae 1.28 6.41 2.99 0.85 0.00 0.00 0.00 0.00 0.00 0.00 0.00 0.00 0.00 0.00 0.00 0.00 0.00 11.53 Aphredoderidae 0.00 0.96 0.96 0.96 0.00 0.00 0.00 0.00 0.00 0.00 0.00 0.00 0.00 0.00 0.00 0.00 0.00 2.88 Esocidae 0.00 0.00 0.00 0.00 0.00 0.00 0.00 0.00 0.00 0.00 0.00 0.00 0.00 0.00 0.00 0.00 0.00 0.00 Anguillidae 0.00 0.00 0.00 0.00 0.00 0.00 0.00 0.00 0.00 0.00 0.00 0.00 0.00 0.00 0.00 0.00 0.00 0.00 Lepisosteidae 0.00 0.00 0.00 0.00 0.00 0.00 0.00 0.00 0.00 0.00 0.00 0.00 0.00 0.00 0.00 0.00 0.00 0.00 Poeciliidae 0.00 0.00 0.00 0.00 0.00 0.00 0.00 0.00 0.00 0.00 0.00 0.00 0.00 0.00 0.00 0.00 0.00 0.00 Sciaenidae-freshwater drum 0.00 0.00 0.00 0.00 2.14 2.14 0.00 0.00 4.58 4.58 39.90 39.90 8.55 0.00 0.00 0.00 0.00 101.78
27,066*
*Totals may not match due to rounding
Tables – Page 21
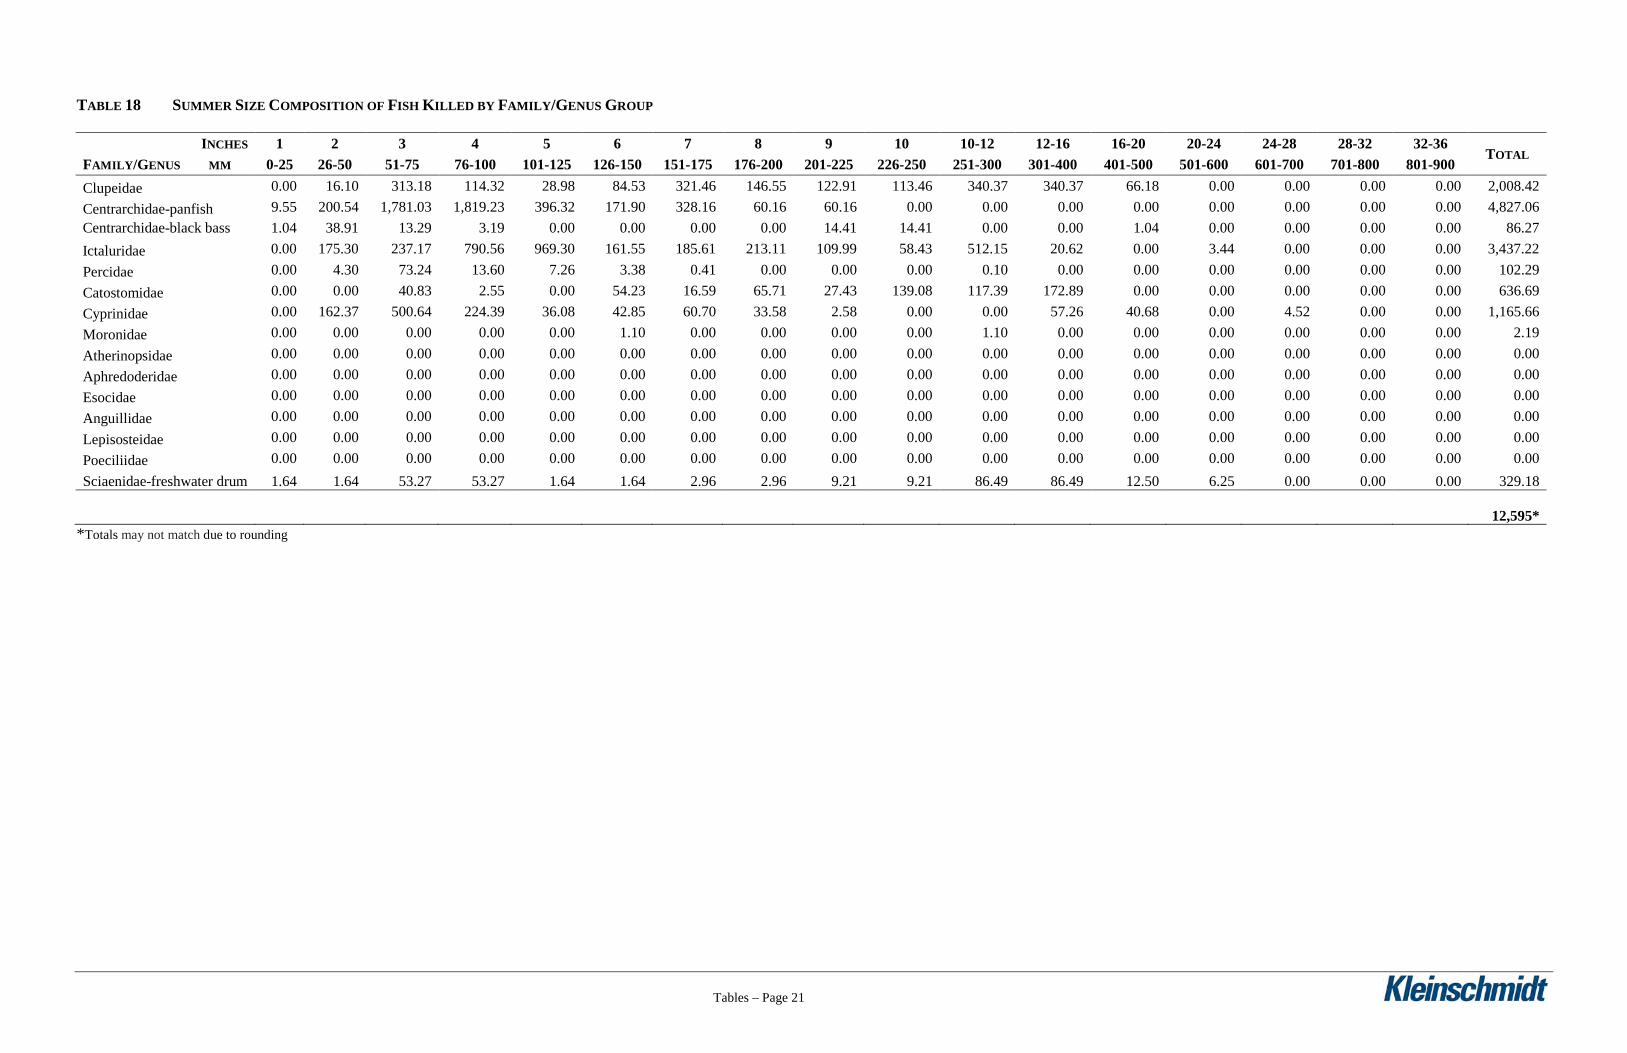
TABLE 18 SUMMER SIZE COMPOSITION OF FISH KILLED BY FAMILY/GENUS GROUP
INCHES 1 2 3 4 5 6 7 8 9 10 10-12 12-16 16-20 20-24 24-28 28-32 32-36 TOTAL
FAMILY/GENUS MM 0-25 26-50 51-75 76-100 101-125 126-150 151-175 176-200 201-225 226-250 251-300 301-400 401-500 501-600 601-700 701-800 801-900 Clupeidae 0.00 16.10 313.18 114.32 28.98 84.53 321.46 146.55 122.91 113.46 340.37 340.37 66.18 0.00 0.00 0.00 0.00 2,008.42 Centrarchidae-panfish 9.55 200.54 1,781.03 1,819.23 396.32 171.90 328.16 60.16 60.16 0.00 0.00 0.00 0.00 0.00 0.00 0.00 0.00 4,827.06 Centrarchidae-black bass 1.04 38.91 13.29 3.19 0.00 0.00 0.00 0.00 14.41 14.41 0.00 0.00 1.04 0.00 0.00 0.00 0.00 86.27 Ictaluridae 0.00 175.30 237.17 790.56 969.30 161.55 185.61 213.11 109.99 58.43 512.15 20.62 0.00 3.44 0.00 0.00 0.00 3,437.22 Percidae 0.00 4.30 73.24 13.60 7.26 3.38 0.41 0.00 0.00 0.00 0.10 0.00 0.00 0.00 0.00 0.00 0.00 102.29 Catostomidae 0.00 0.00 40.83 2.55 0.00 54.23 16.59 65.71 27.43 139.08 117.39 172.89 0.00 0.00 0.00 0.00 0.00 636.69 Cyprinidae 0.00 162.37 500.64 224.39 36.08 42.85 60.70 33.58 2.58 0.00 0.00 57.26 40.68 0.00 4.52 0.00 0.00 1,165.66 Moronidae 0.00 0.00 0.00 0.00 0.00 1.10 0.00 0.00 0.00 0.00 1.10 0.00 0.00 0.00 0.00 0.00 0.00 2.19 Atherinopsidae 0.00 0.00 0.00 0.00 0.00 0.00 0.00 0.00 0.00 0.00 0.00 0.00 0.00 0.00 0.00 0.00 0.00 0.00 Aphredoderidae 0.00 0.00 0.00 0.00 0.00 0.00 0.00 0.00 0.00 0.00 0.00 0.00 0.00 0.00 0.00 0.00 0.00 0.00 Esocidae 0.00 0.00 0.00 0.00 0.00 0.00 0.00 0.00 0.00 0.00 0.00 0.00 0.00 0.00 0.00 0.00 0.00 0.00 Anguillidae 0.00 0.00 0.00 0.00 0.00 0.00 0.00 0.00 0.00 0.00 0.00 0.00 0.00 0.00 0.00 0.00 0.00 0.00 Lepisosteidae 0.00 0.00 0.00 0.00 0.00 0.00 0.00 0.00 0.00 0.00 0.00 0.00 0.00 0.00 0.00 0.00 0.00 0.00 Poeciliidae 0.00 0.00 0.00 0.00 0.00 0.00 0.00 0.00 0.00 0.00 0.00 0.00 0.00 0.00 0.00 0.00 0.00 0.00 Sciaenidae-freshwater drum 1.64 1.64 53.27 53.27 1.64 1.64 2.96 2.96 9.21 9.21 86.49 86.49 12.50 6.25 0.00 0.00 0.00 329.18
12,595*
*Totals may not match due to rounding
Tables – Page 22
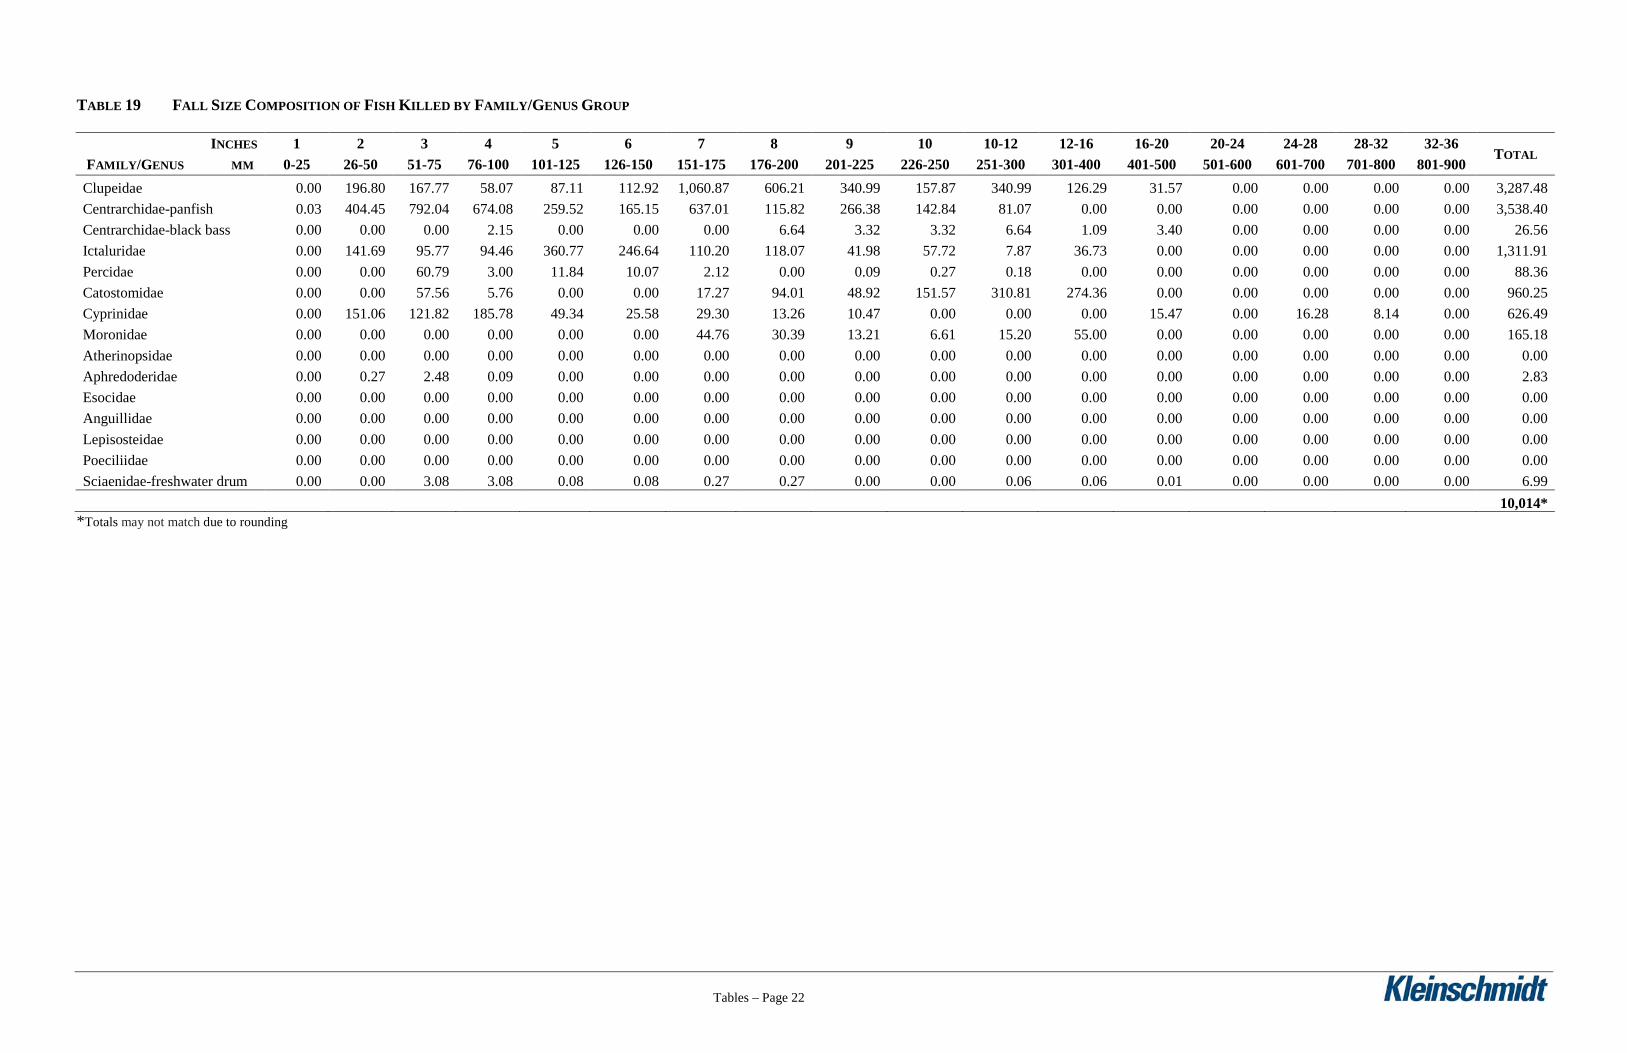
TABLE 19 FALL SIZE COMPOSITION OF FISH KILLED BY FAMILY/GENUS GROUP
INCHES 1 2 3 4 5 6 7 8 9 10 10-12 12-16 16-20 20-24 24-28 28-32 32-36 TOTAL
FAMILY/GENUS MM 0-25 26-50 51-75 76-100 101-125 126-150 151-175 176-200 201-225 226-250 251-300 301-400 401-500 501-600 601-700 701-800 801-900 Clupeidae 0.00 196.80 167.77 58.07 87.11 112.92 1,060.87 606.21 340.99 157.87 340.99 126.29 31.57 0.00 0.00 0.00 0.00 3,287.48 Centrarchidae-panfish 0.03 404.45 792.04 674.08 259.52 165.15 637.01 115.82 266.38 142.84 81.07 0.00 0.00 0.00 0.00 0.00 0.00 3,538.40 Centrarchidae-black bass 0.00 0.00 0.00 2.15 0.00 0.00 0.00 6.64 3.32 3.32 6.64 1.09 3.40 0.00 0.00 0.00 0.00 26.56 Ictaluridae 0.00 141.69 95.77 94.46 360.77 246.64 110.20 118.07 41.98 57.72 7.87 36.73 0.00 0.00 0.00 0.00 0.00 1,311.91 Percidae 0.00 0.00 60.79 3.00 11.84 10.07 2.12 0.00 0.09 0.27 0.18 0.00 0.00 0.00 0.00 0.00 0.00 88.36 Catostomidae 0.00 0.00 57.56 5.76 0.00 0.00 17.27 94.01 48.92 151.57 310.81 274.36 0.00 0.00 0.00 0.00 0.00 960.25 Cyprinidae 0.00 151.06 121.82 185.78 49.34 25.58 29.30 13.26 10.47 0.00 0.00 0.00 15.47 0.00 16.28 8.14 0.00 626.49 Moronidae 0.00 0.00 0.00 0.00 0.00 0.00 44.76 30.39 13.21 6.61 15.20 55.00 0.00 0.00 0.00 0.00 0.00 165.18 Atherinopsidae 0.00 0.00 0.00 0.00 0.00 0.00 0.00 0.00 0.00 0.00 0.00 0.00 0.00 0.00 0.00 0.00 0.00 0.00 Aphredoderidae 0.00 0.27 2.48 0.09 0.00 0.00 0.00 0.00 0.00 0.00 0.00 0.00 0.00 0.00 0.00 0.00 0.00 2.83 Esocidae 0.00 0.00 0.00 0.00 0.00 0.00 0.00 0.00 0.00 0.00 0.00 0.00 0.00 0.00 0.00 0.00 0.00 0.00 Anguillidae 0.00 0.00 0.00 0.00 0.00 0.00 0.00 0.00 0.00 0.00 0.00 0.00 0.00 0.00 0.00 0.00 0.00 0.00 Lepisosteidae 0.00 0.00 0.00 0.00 0.00 0.00 0.00 0.00 0.00 0.00 0.00 0.00 0.00 0.00 0.00 0.00 0.00 0.00 Poeciliidae 0.00 0.00 0.00 0.00 0.00 0.00 0.00 0.00 0.00 0.00 0.00 0.00 0.00 0.00 0.00 0.00 0.00 0.00 Sciaenidae-freshwater drum 0.00 0.00 3.08 3.08 0.08 0.08 0.27 0.27 0.00 0.00 0.06 0.06 0.01 0.00 0.00 0.00 0.00 6.99
10,014*
*Totals may not match due to rounding

APPENDIX A
STUDY PLAN

FISH ENTRAINMENT AND TURBINE MORTALITY STUDY
PLAN
HOLT HYDROELECTRIC PROJECT FERC NO. 2203
PREPARED BY:
JULY 2011

i
FISH ENTRAINMENT AND TURBINE MORTALITY STUDY PLAN
HOLT HYDROELECTRIC PROJECT
FERC NO. 2203
ALABAMA POWER COMPANY BIRMINGHAM, ALABAMA
TABLE OF CONTENTS
1.0 GOALS AND OBJECTIVES OF THE STUDY .................................................................1
2.0 RELEVANT RESOURCE MANAGEMENT GOALS ......................................................1
3.0 BACKGROUND AND EXISTING INFORMATION .......................................................1
4.0 PROJECT NEXUS ..............................................................................................................2
5.0 STUDY AREA AND STUDY SITES .................................................................................2
6.0 PROPOSED METHODOLOGY .........................................................................................2
7.0 CONSISTENCY WITH GENERALLY ACCEPTED SCIENTIFIC PRACTICE .............4
8.0 PRODUCTS .........................................................................................................................5
9.0 SCHEDULE .........................................................................................................................5
10.0 AGENCY COMMENTS .....................................................................................................5
11.0 REFERENCES ....................................................................................................................5
1
FISH ENTRAINMENT AND TURBINE MORTALITY STUDY PLAN
HOLT HYDROELECTRIC PROJECT
FERC NO. 2203
ALABAMA POWER COMPANY BIRMINGHAM, ALABAMA
GOALS AND OBJECTIVES OF THE STUDY
Operation of hydroelectric projects can result in the sporadic entrainment of fish into the Project
turbine. Passage through the turbines can result in some degree of mortality as well as movement
of fish from the Project reservoir downstream. The Alabama Department of Conservation and
Natural Resources (ADCNR) and U.S. Fish and Wildlife Service (USFWS) would like to
understand the potential impacts of entrainment and turbine mortality on fish that pass through
the Holt Project turbine.
RELEVANT RESOURCE MANAGEMENT GOALS
The ADCNR is charged with the regulation of recreational fishing in the Black Warrior River.
The ADCNR currently and historically has stocked hybrid striped bass into Holt Reservoir for
recreational fishing purposes. Knowledge of Project impacts to the local fishery associated with
entrainment and turbine mortality may allow them to adjust their management strategies of the
Holt Reservoir fishery.
BACKGROUND AND EXISTING INFORMATION
Over fifty site-specific studies of resident fish entrainment at hydroelectric sites in the United
States have been performed and reported on to date. These studies provide order-of-magnitude
estimates of annual fish entrainment (FERC, 1995). Along with the entrainment data, descriptive
information has also been gathered from each entrainment study and includes:
• Location: geographical proximity, river basin; • Project size: discharge capacity and power production; • Project operation: e.g., peaking run-of-river, etc.; • Biological factors: fish species composition; • Impoundment characteristics: general water quality, impoundment size, flow regime; and • Physical project characteristics: trash rack spacing, intake velocity, etc.

2
Extensive turbine mortality study data exists for a range of turbine types and physical
characteristics, which can be compared to the Holt Project turbine. These characteristics are
commonly attributed to turbine passage mortality (Cramer and Oligher, 1963; Bell, 1991; Eicher,
1987; EPRI, 1992). Descriptive data includes:
• Turbine design type; • Operating head; • Runner speed; • Diameter; and • Peripheral runner velocity.
Alabama Power will provide the descriptive data listed above for the Holt Project as well as
comparisons to similar projects.
Current information for Holt Reservoir fishery is available through the ADCNR Reservoir
Management Reports. The ADCNR has also provided a list of species that they believe may
inhabit the Holt Reservoir. Similar study information performed during Alabama Power’s
relicense of the Bankhead Development (located upstream on the Black Warrior River) is also
available for use (Alabama Power, 2003).
PROJECT NEXUS
The study will estimate the magnitude of impacts related to fish entrainment and turbine
mortality related to existing operation of the Holt Project.
STUDY AREA AND STUDY SITES
The study area for this issue will include the intake area of the Holt Project.
PROPOSED METHODOLOGY
The methodology for this study will involve developing an estimate of the magnitude of
entrainment and turbine mortality for the Holt Project through the performance of a Desktop
Entrainment Analysis. The methodology for this study follows standard methods previously
accepted by FERC or standard methodologies used by the Fisheries Management community.

3
DESKTOP ENTRAINMENT STUDY METHODS
Define the Entrainment Database
For this study, fish entrainment information from other hydroelectric projects will be assembled
into a database for analyzing the magnitude of potential entrainment. After review of the
database, the most similar projects will be selected and used to develop a Holt entrainment
estimate.
Calculate an Estimated Fish Entrainment Rate
The entrainment rate information from the selected entrainment studies will be consolidated to
develop fish entrainment rates for the Holt Project. The entrainment rates will be presented in
fish entrained by volume of water passed through the Project turbine (fish/million cubic feet).
The data will be grouped by season where appropriate to determine an entrainment rate for each
season of the year. The seasonal data will be used to develop an estimated seasonal mean
entrainment rate for the Holt Project.
Estimate Species Composition and Length Frequency Distribution
The species composition data from the Warrior Entrainment Study (Alabama Power, 2003), in
conjunction with ADCNR data for Holt Lake, will be used to develop species composition for
entrainment. The total number and total length (Length frequency) of fish entrained will be based
on information available from the entrainment database.
Estimate of Turbine Mortality
As fish move through hydroelectric turbines, a percentage are killed due to blade strikes, shear
forces, and pressure changes. Turbine passage survival studies have been performed at numerous
hydroelectric projects throughout the country. Characteristics of these projects will be compared
to the characteristics of the Holt Project and suitable studies will be selected for the transfer of
turbine mortality data for each development. Selected turbine survival rate data will be obtained
from the literature and used to estimate the number of fish killed due to turbine mortality. The
following turbine characteristics will be used as criteria for use in this analysis:
• Turbine design type; • Operating head; • Runner speed;
4
• Turbine diameter; • Blade number and spacing; and • Peripheral runner velocity.
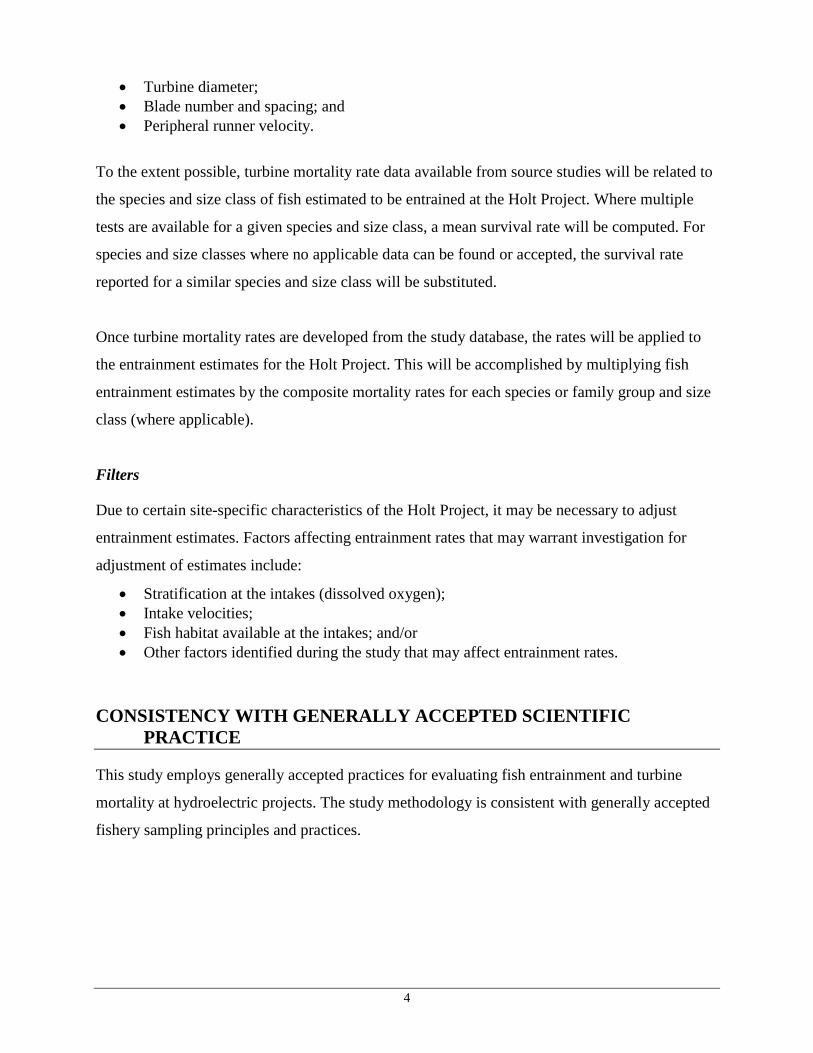
To the extent possible, turbine mortality rate data available from source studies will be related to
the species and size class of fish estimated to be entrained at the Holt Project. Where multiple
tests are available for a given species and size class, a mean survival rate will be computed. For
species and size classes where no applicable data can be found or accepted, the survival rate
reported for a similar species and size class will be substituted.
Once turbine mortality rates are developed from the study database, the rates will be applied to
the entrainment estimates for the Holt Project. This will be accomplished by multiplying fish
entrainment estimates by the composite mortality rates for each species or family group and size
class (where applicable).
Filters
Due to certain site-specific characteristics of the Holt Project, it may be necessary to adjust
entrainment estimates. Factors affecting entrainment rates that may warrant investigation for
adjustment of estimates include:
• Stratification at the intakes (dissolved oxygen); • Intake velocities; • Fish habitat available at the intakes; and/or • Other factors identified during the study that may affect entrainment rates.
CONSISTENCY WITH GENERALLY ACCEPTED SCIENTIFIC PRACTICE
This study employs generally accepted practices for evaluating fish entrainment and turbine
mortality at hydroelectric projects. The study methodology is consistent with generally accepted
fishery sampling principles and practices.
5
PRODUCTS
Data and analyses from this study will be included in a report to the ADCNR, USFWS, and
interested stakeholders. A draft report will be distributed for review and comment within 6
months of completion of the analysis. A final report will be provided as part of the draft license
application that will include raw data in tabular form, analysis performed, and results and
discussion.
SCHEDULE
This draft schedule generally corresponds to Alabama Power’s Process Plan and Schedule filed
with FERC as part of the PAD on August 27, 2010.
Stakeholder Review of Study Plan ................................................................... April 2011 Conduct Study .................................................................................................... June 2011 Draft Desktop Entrainment Report ................................................................ August 2011 Stakeholder Review and Comments ................................................................... Fall 2011 Final Entrainment Report & Recommendations ............................................. Spring 2012
AGENCY COMMENTS
Alabama Power distributed the Holt Fish Entrainment and Turbine Mortality study plan to the
ADCNR, USFWS, Alabama Department of Environmental Management (ADEM), and Nelson
Brooke (Black Warrior Riverkeeper) for review on May 3, 2011. Alabama Power received one
comment from Chris Greene, ADCNR Fisheries Section, regarding the stocking of hybrids in
Bankhead Lake, which was included in this study plan. Alabama Power held a conference call
with Jeff Powell (USFWS) on July 11, 2011; and Lynn Sisk (ADEM) and Chris Greene on July
21, 2011 to discuss the change.
REFERENCES
Alabama Power Company. 2003. Coosa and Warrior River Projects- E11 - Impingement, Entrainment, and Turbine Mortality Study. Alabama Power Company, Birmingham, AL.
Bell, M. C. 1991. Fisheries Handbook of Engineering Requirements and Biological Criteria. United States Army Corps of Engineers, Fish Passage Development and Evaluation Program, Portland, OR.

6
Cramer, F. K., and R. C. Oligher. 1963. Passing fish through hydraulic turbines. Transactions of the American Fisheries Society 93:243-259.
Eicher Associates, Inc. 1987. Turbine-related fish mortality: Review and evaluation of studies. Research Project 2694-4. Prepared for Electric Power Research Institute, Palo Alto, CA.
Electric Power Research Institute (EPRI). September 1992. Fish Entrainment and Turbine Mortality Review and Guidelines. TR-101231 Research Project 2694-01. Prepared by Stone & Webster Environmental Services.
Federal Energy Regulatory Commission (FERC). 1995. Preliminary assessment of fish entrainment at hydropower projects – volume 1 (Paper No. DPR-10). Office of Hydropower Licensing, FERC, Washington, DC.

APPENDIX B
SUPPORTING STUDY DATA
B-1
TABLE B-1 SCREENING MATRIX OF FISH ENTRAINMENT STUDIES FROM VARIOUS HYDROELECTRIC PROJECTS
PROJECT LOCATION TURBINE CONFIGURATION INTAKE PARAMETERS OPERATION IMPOUNDMENT/ POWER CANAL DATA BIOLOGICAL DATA AVAILABLE ENTRAINMENT RATE
Baseline Fishery Mortality Name ST River Capacity Turbine Number Rated Intake Bar
Rack Depth Peaking or Impoundment
/ Surface Volume Ave. Survey Type Entrainment Sampling Study Fish /
Hour Fish / Hour/
Fish/mcf
FERC NO. (MW) Type of Turbines Head Velocity Spacing of Intake Run of River Power Canal Acres (acre/ ft.) Depth Netting Hydroacoustics 1000 cfs (CFS) (ft) (ft/s) (in) (ft) (ft)
Holt No.2203
AL Black Warrior 46.94 MW
Fixed Blade
Propeller
1 60 6 Peaking Impoundment 3,296
Ninety-nine Islands
SC Broad 18 MW Horizontal 6 @ 3000 kW 72 2.3 Bottom oriented Modified Impoundment 433 2300 > 6 YES Warm Full Recovery
YES YES 18.8 4.1 3.4
No. 2331 3992 cfs
Francis 70% clear
11.5 ft. below the Peaking Netting
water surface on Unit 4 Gaston Shoals SC Broad 9.1 MW Horizontal 1 @ 2320 kW 43 . 0.7 2.5 Bottom oriented Modified Impoundment 300 2500 > 30 YES Warm Full
Recovery YES NO 17.9 6.7 3.6
No. 2332 2800 cfs
Francis 3 @ 1440 kW 70% clear
13.5 ft below the Peaking Netting
Vertical 1 @ 2500 kW 51 water surface on Unit 6 Francis Neals Shoals SC Broad 4.42
MW Horizontal 4 @ 1100 kW 24 3.4 Intake pulls Run of River Impoundment 600 1500 YES Warm Full
Recovery YES YES 17.4 5.5
No. 2315 4000 cfs
Francis 70% clear
from entire Netting on
water column Unit 3 Hollidays Bridge
SC Saluda 3.5 MW Horizontal 3 @ 1250 kW 41.5 1.2 2 Bottom oriented Modified Impoundment 466 6000 > 6 YES Warm Full Recovery
YES YES 12.8 8.0 4.7
No. 2465 1850 cfs
Francis 70% clear
18 ft. below the Peaking Netting on
Vertical 1 @ 600 kW water surface Power Canal 1.5 Unit 3 Francis Saluda Hydro. SC Saluda 2.4 MW Horizontal 4 @ 600 kW 38 2.0 Bottom oriented Modified Impoundment 556 7228 6 YES Warm Full
Recovery YES NO 8.3 10.4 5.3
No. 2406 1280 cfs
Francis 70% clear
14 ft. below the Peaking Netting on
water surface Unit 1 High Falls NC Deep 0.66
MW Francis 3 units 17 2.375 Impoundment YES Warm Partial NO NO 3.1
B-2
PROJECT LOCATION TURBINE CONFIGURATION INTAKE PARAMETERS OPERATION IMPOUNDMENT/ POWER CANAL DATA BIOLOGICAL DATA AVAILABLE ENTRAINMENT RATE
Baseline Fishery Mortality Name ST River Capacity Turbine Number Rated Intake Bar
Rack Depth Peaking or Impoundment
/ Surface Volume Ave. Survey Type Entrainment Sampling Study Fish /
Hour Fish / Hour/
Fish/mcf
FERC NO. (MW) Type of Turbines Head Velocity Spacing of Intake Run of River Power Canal Acres (acre/ ft.) Depth Netting Hydroacoustics 1000 cfs (CFS) (ft) (ft/s) (in) (ft) (ft)
Richard B. Russell
GA/SC Savannah 648 MW
Francis 4@ 80MW 144 8 Mid-depth peaking Impoundment 26,653 1,026,244 YES Warm Full Recovery
894.2 14.9 4.1
60,000 cfs
4@ 82MW 100 ft. below normal pool
Netting on YES YES
1 unit Run-ofRiver Steven's Creek GA Savannah 18.9
MW Vertical 28 contraolled
by Impoundment YES Warm Full
Recovery YES YES
No. 2535 Francis upstream releases
King Mill GA Augusta Canal 2.05
MW Horizontal 1 @ 650 kW 30 1.5 ft/s 2 Intake pulls Run of River Power Canal 7 YES Warm Partial NO NO 15.8 15.8 5.1
No. 9988 Savannah 950 cfs Francis 1 @ 1400 kW from entire Recovery Net
water column 11 in tailrace Four Mile MI Thunder Bay 1.8 MW Horizontal 3 @ 600 kW 29 n/a n/a n/a n/a Impoundment n/a n/a n/a n/a Warm/Cool Full
Recovery NO YES
1,800 cfs
on Unit 1
Moore's Park MI Grand 1.8 MW Horizontal 2 @ 540 kW 15 3.67 1.62 17 Run of river Impoundment 240 2,000 n/a YES Warm/cool Full
recovery YES YES 9.8 8.2
1,200 cfs
Francis
Belding MI Flat n/a Kaplan 2 11 n/a 2 n/a Run of River Impoundment n/a n/a n/a n/a Cool Full
Recovery NO YES
416 cfs La Barge MI Thornapple 1.6 MW Horizontal 2 @ 800 kW 15 n/a n/a n/a Run of River Impoundment 100 n/a n/a n/a Warm Full
Recovery NO YES 1.68
Francis Mio MI Au Sable 5 MW tbd n/a 35 2.3 2.94 20 Run of River Impoundment 880 12,000 n/a n/a Cool Partial YES NO 13.7 5.1 4950
cfs Recovery
Net
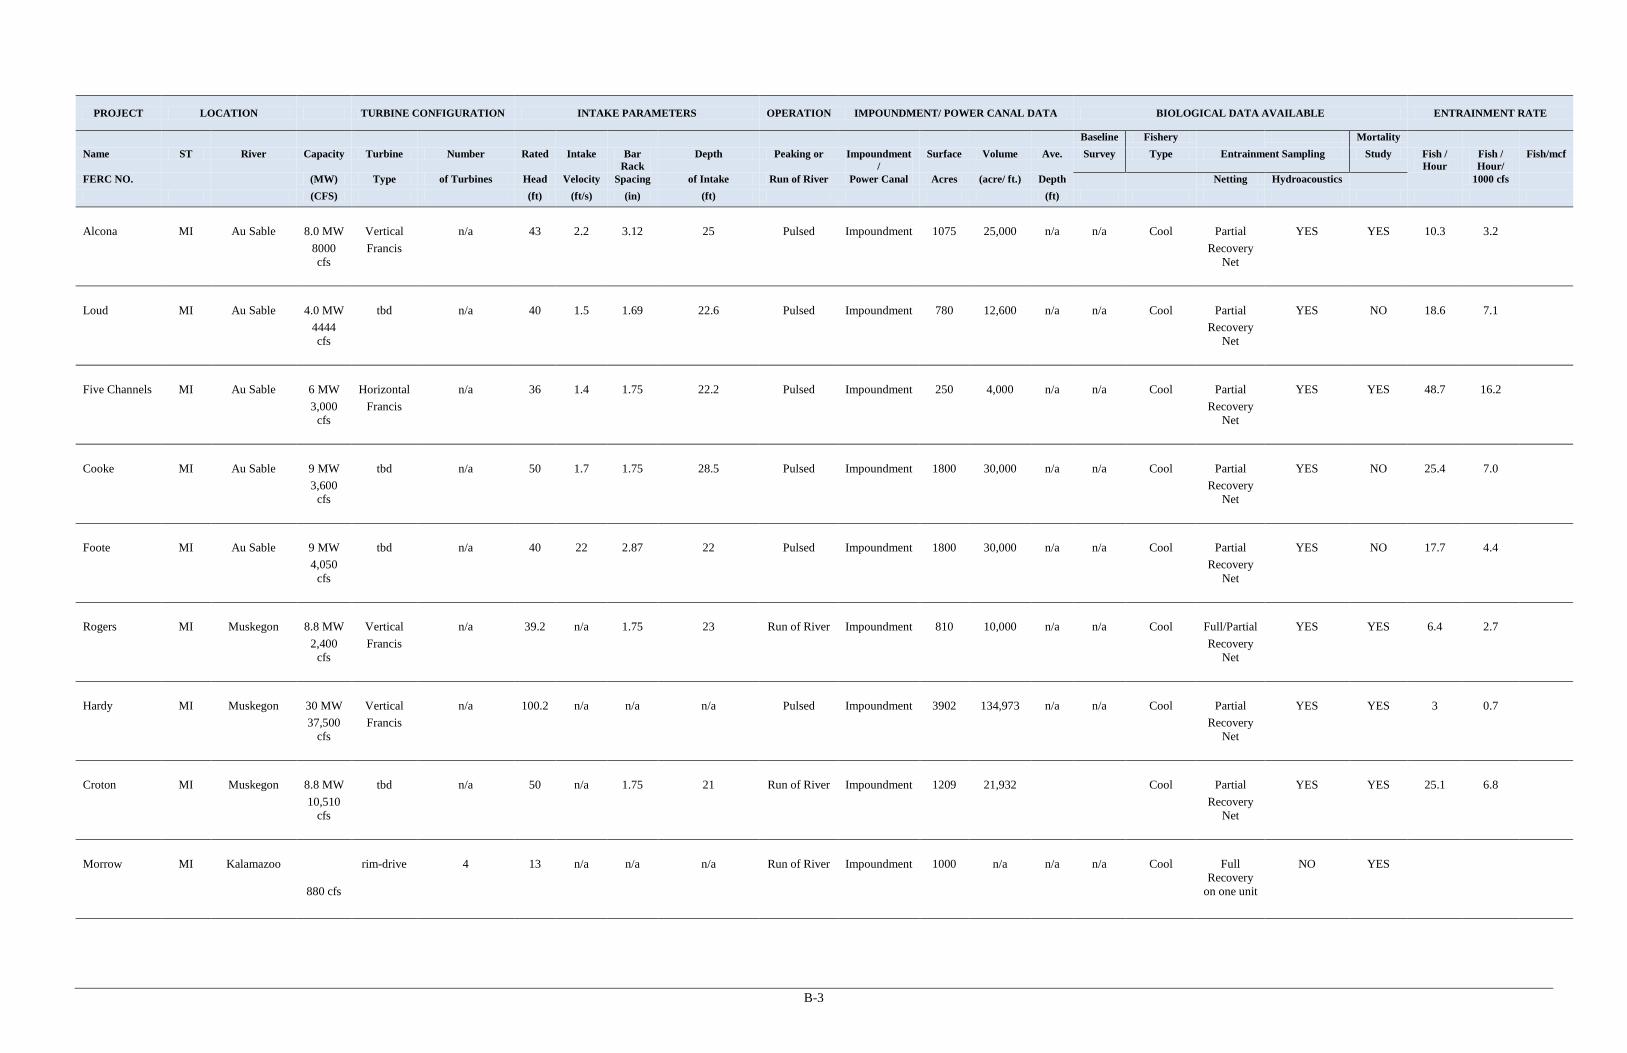
B-3
PROJECT LOCATION TURBINE CONFIGURATION INTAKE PARAMETERS OPERATION IMPOUNDMENT/ POWER CANAL DATA BIOLOGICAL DATA AVAILABLE ENTRAINMENT RATE
Baseline Fishery Mortality Name ST River Capacity Turbine Number Rated Intake Bar
Rack Depth Peaking or Impoundment
/ Surface Volume Ave. Survey Type Entrainment Sampling Study Fish /
Hour Fish / Hour/
Fish/mcf
FERC NO. (MW) Type of Turbines Head Velocity Spacing of Intake Run of River Power Canal Acres (acre/ ft.) Depth Netting Hydroacoustics 1000 cfs (CFS) (ft) (ft/s) (in) (ft) (ft)
Alcona MI Au Sable 8.0 MW Vertical n/a 43 2.2 3.12 25 Pulsed Impoundment 1075 25,000 n/a n/a Cool Partial YES YES 10.3 3.2 8000
cfs Francis Recovery
Net
Loud MI Au Sable 4.0 MW tbd n/a 40 1.5 1.69 22.6 Pulsed Impoundment 780 12,600 n/a n/a Cool Partial YES NO 18.6 7.1 4444
cfs Recovery
Net
Five Channels MI Au Sable 6 MW Horizontal n/a 36 1.4 1.75 22.2 Pulsed Impoundment 250 4,000 n/a n/a Cool Partial YES YES 48.7 16.2 3,000
cfs Francis Recovery
Net
Cooke MI Au Sable 9 MW tbd n/a 50 1.7 1.75 28.5 Pulsed Impoundment 1800 30,000 n/a n/a Cool Partial YES NO 25.4 7.0 3,600
cfs Recovery
Net
Foote MI Au Sable 9 MW tbd n/a 40 22 2.87 22 Pulsed Impoundment 1800 30,000 n/a n/a Cool Partial YES NO 17.7 4.4 4,050
cfs Recovery
Net
Rogers MI Muskegon 8.8 MW Vertical n/a 39.2 n/a 1.75 23 Run of River Impoundment 810 10,000 n/a n/a Cool Full/Partial YES YES 6.4 2.7 2,400
cfs Francis Recovery
Net
Hardy MI Muskegon 30 MW Vertical n/a 100.2 n/a n/a n/a Pulsed Impoundment 3902 134,973 n/a n/a Cool Partial YES YES 3 0.7 37,500
cfs Francis Recovery
Net
Croton MI Muskegon 8.8 MW tbd n/a 50 n/a 1.75 21 Run of River Impoundment 1209 21,932 Cool Partial YES YES 25.1 6.8 10,510
cfs Recovery
Net
Morrow MI Kalamazoo rim-drive 4 13 n/a n/a n/a Run of River Impoundment 1000 n/a n/a n/a Cool Full
Recovery NO YES
880 cfs on one unit
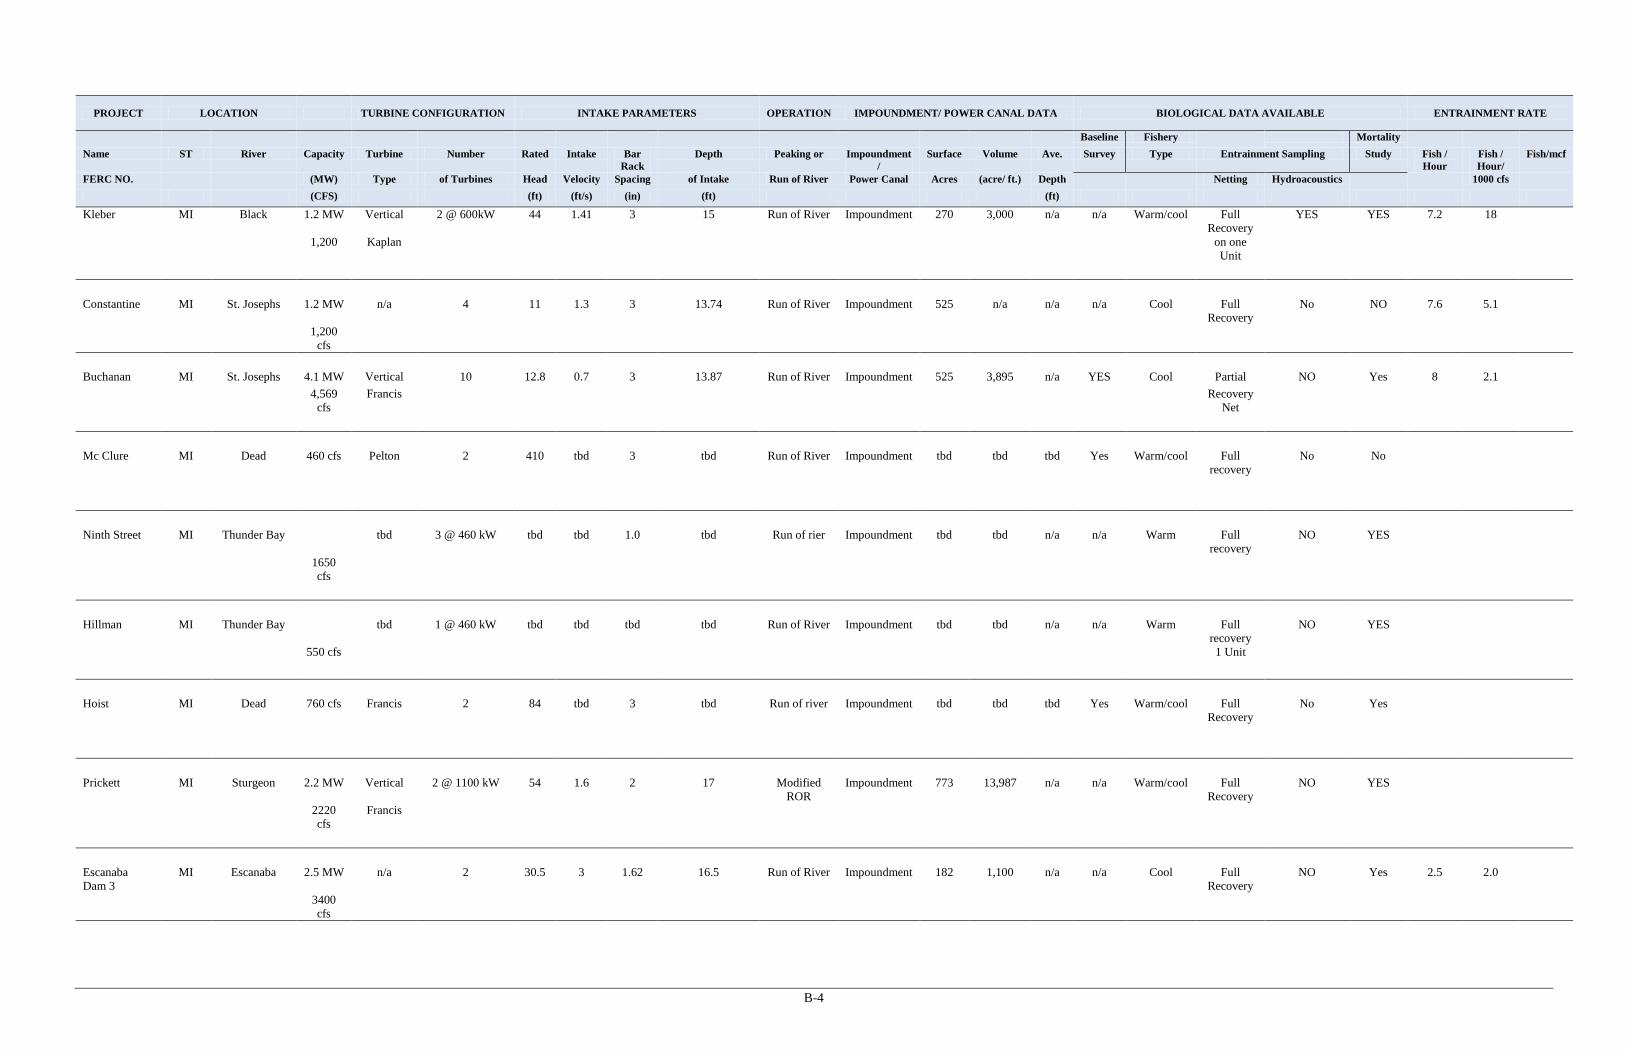
B-4
PROJECT LOCATION TURBINE CONFIGURATION INTAKE PARAMETERS OPERATION IMPOUNDMENT/ POWER CANAL DATA BIOLOGICAL DATA AVAILABLE ENTRAINMENT RATE
Baseline Fishery Mortality Name ST River Capacity Turbine Number Rated Intake Bar
Rack Depth Peaking or Impoundment
/ Surface Volume Ave. Survey Type Entrainment Sampling Study Fish /
Hour Fish / Hour/
Fish/mcf
FERC NO. (MW) Type of Turbines Head Velocity Spacing of Intake Run of River Power Canal Acres (acre/ ft.) Depth Netting Hydroacoustics 1000 cfs (CFS) (ft) (ft/s) (in) (ft) (ft)
Kleber MI Black 1.2 MW Vertical 2 @ 600kW 44 1.41 3 15 Run of River Impoundment 270 3,000 n/a n/a Warm/cool Full Recovery
YES YES 7.2 18
1,200 Kaplan on one Unit
Constantine MI St. Josephs 1.2 MW n/a 4 11 1.3 3 13.74 Run of River Impoundment 525 n/a n/a n/a Cool Full
Recovery No NO 7.6 5.1
1,200 cfs
Buchanan MI St. Josephs 4.1 MW Vertical 10 12.8 0.7 3 13.87 Run of River Impoundment 525 3,895 n/a YES Cool Partial NO Yes 8 2.1 4,569
cfs Francis Recovery
Net
Mc Clure MI Dead 460 cfs Pelton 2 410 tbd 3 tbd Run of River Impoundment tbd tbd tbd Yes Warm/cool Full
recovery No No
Ninth Street MI Thunder Bay tbd 3 @ 460 kW tbd tbd 1.0 tbd Run of rier Impoundment tbd tbd n/a n/a Warm Full
recovery NO YES
1650 cfs
Hillman MI Thunder Bay tbd 1 @ 460 kW tbd tbd tbd tbd Run of River Impoundment tbd tbd n/a n/a Warm Full
recovery NO YES
550 cfs 1 Unit Hoist MI Dead 760 cfs Francis 2 84 tbd 3 tbd Run of river Impoundment tbd tbd tbd Yes Warm/cool Full
Recovery No Yes
Prickett MI Sturgeon 2.2 MW Vertical 2 @ 1100 kW 54 1.6 2 17 Modified
ROR Impoundment 773 13,987 n/a n/a Warm/cool Full
Recovery NO YES
2220 cfs
Francis
Escanaba Dam 3
MI Escanaba 2.5 MW n/a 2 30.5 3 1.62 16.5 Run of River Impoundment 182 1,100 n/a n/a Cool Full Recovery
NO Yes 2.5 2.0
3400 cfs
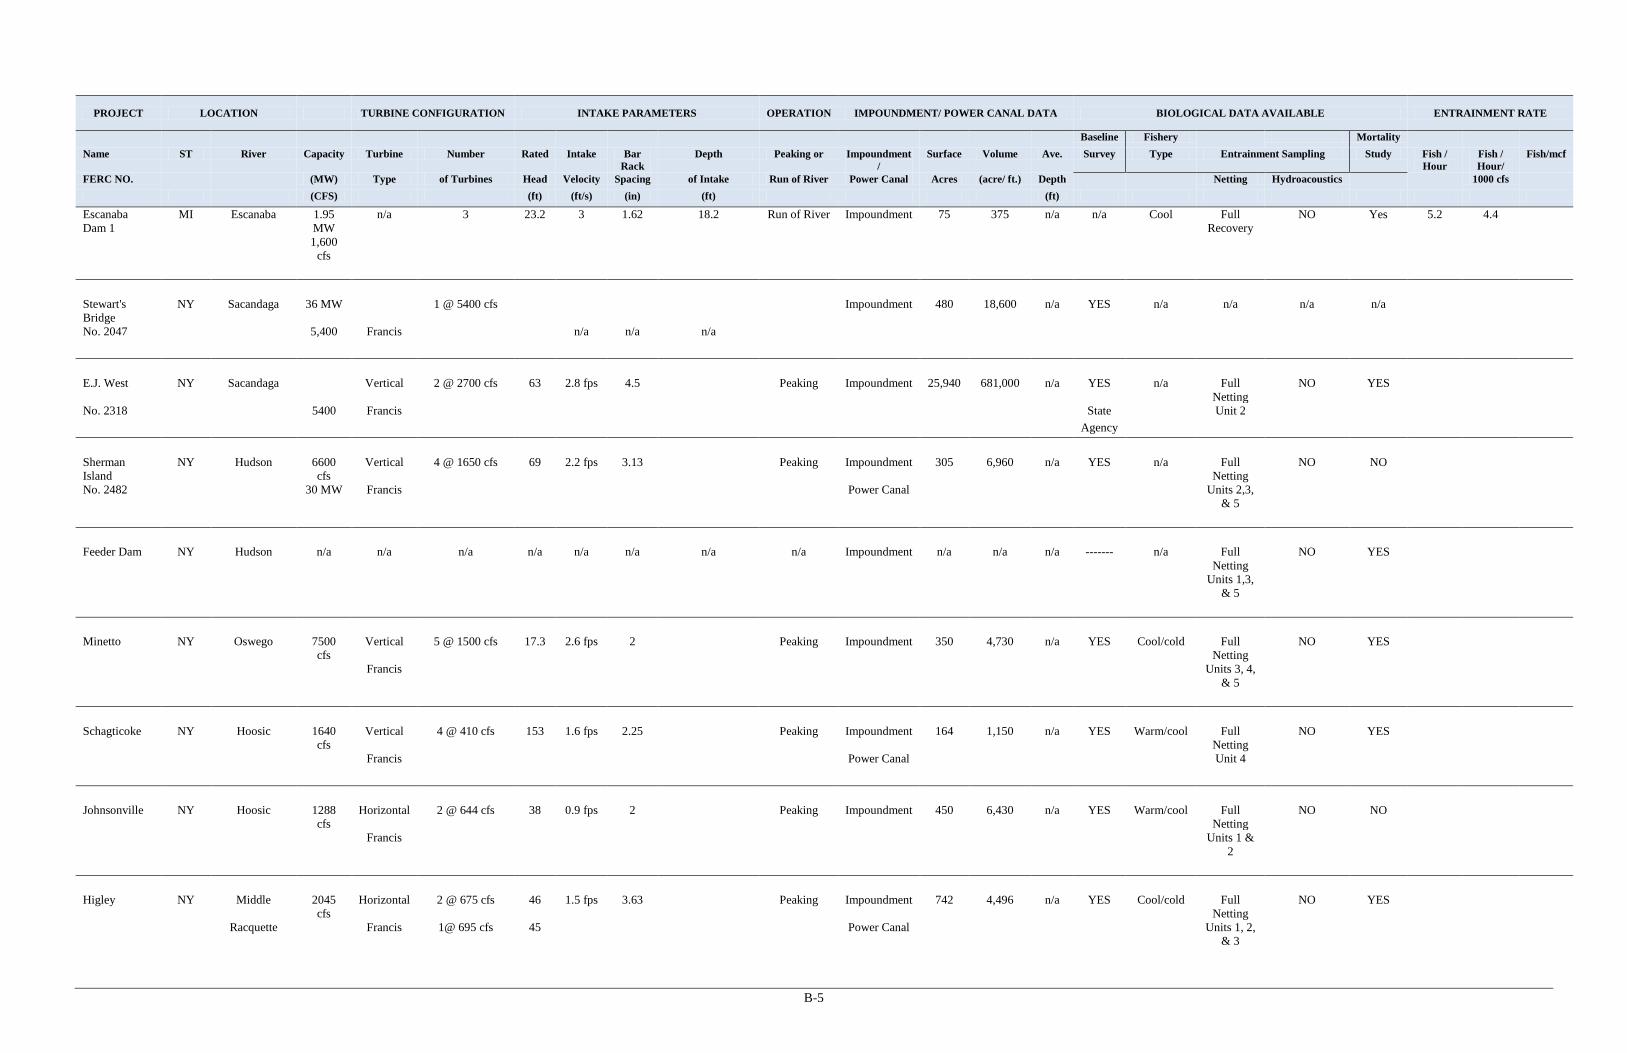
B-5
PROJECT LOCATION TURBINE CONFIGURATION INTAKE PARAMETERS OPERATION IMPOUNDMENT/ POWER CANAL DATA BIOLOGICAL DATA AVAILABLE ENTRAINMENT RATE
Baseline Fishery Mortality Name ST River Capacity Turbine Number Rated Intake Bar
Rack Depth Peaking or Impoundment
/ Surface Volume Ave. Survey Type Entrainment Sampling Study Fish /
Hour Fish / Hour/
Fish/mcf
FERC NO. (MW) Type of Turbines Head Velocity Spacing of Intake Run of River Power Canal Acres (acre/ ft.) Depth Netting Hydroacoustics 1000 cfs (CFS) (ft) (ft/s) (in) (ft) (ft)
Escanaba Dam 1
MI Escanaba 1.95 MW
n/a 3 23.2 3 1.62 18.2 Run of River Impoundment 75 375 n/a n/a Cool Full Recovery
NO Yes 5.2 4.4
1,600 cfs
Stewart's Bridge
NY Sacandaga 36 MW 1 @ 5400 cfs Impoundment 480 18,600 n/a YES n/a n/a n/a n/a
No. 2047 5,400 Francis n/a n/a n/a E.J. West NY Sacandaga Vertical 2 @ 2700 cfs 63 2.8 fps 4.5 Peaking Impoundment 25,940 681,000 n/a YES n/a Full
Netting NO YES
No. 2318 5400 Francis State Unit 2 Agency Sherman Island
NY Hudson 6600 cfs
Vertical 4 @ 1650 cfs 69 2.2 fps 3.13 Peaking Impoundment 305 6,960 n/a YES n/a Full Netting
NO NO
No. 2482 30 MW Francis Power Canal Units 2,3, & 5
Feeder Dam NY Hudson n/a n/a n/a n/a n/a n/a n/a n/a Impoundment n/a n/a n/a ------- n/a Full
Netting NO YES
Units 1,3, & 5
Minetto NY Oswego 7500
cfs Vertical 5 @ 1500 cfs 17.3 2.6 fps 2 Peaking Impoundment 350 4,730 n/a YES Cool/cold Full
Netting NO YES
Francis Units 3, 4, & 5
Schagticoke NY Hoosic 1640
cfs Vertical 4 @ 410 cfs 153 1.6 fps 2.25 Peaking Impoundment 164 1,150 n/a YES Warm/cool Full
Netting NO YES
Francis Power Canal Unit 4 Johnsonville NY Hoosic 1288
cfs Horizontal 2 @ 644 cfs 38 0.9 fps 2 Peaking Impoundment 450 6,430 n/a YES Warm/cool Full
Netting NO NO
Francis Units 1 & 2
Higley NY Middle 2045
cfs Horizontal 2 @ 675 cfs 46 1.5 fps 3.63 Peaking Impoundment 742 4,496 n/a YES Cool/cold Full
Netting NO YES
Racquette Francis 1@ 695 cfs 45 Power Canal Units 1, 2, & 3
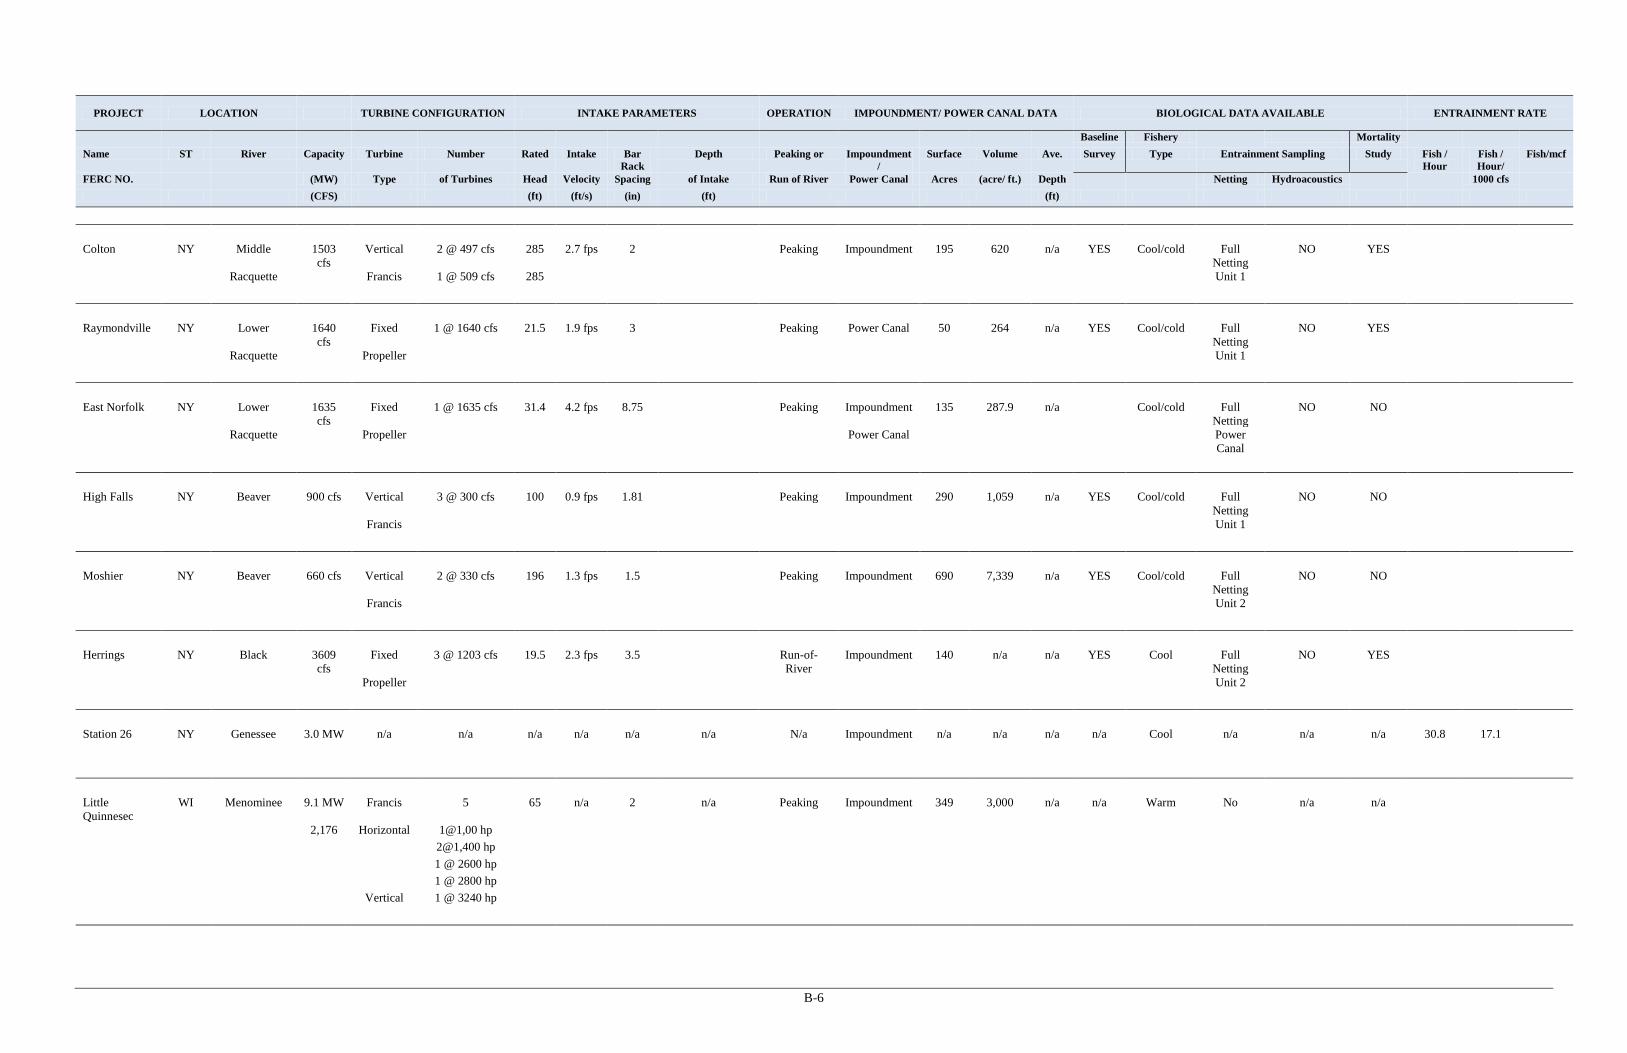
B-6
PROJECT LOCATION TURBINE CONFIGURATION INTAKE PARAMETERS OPERATION IMPOUNDMENT/ POWER CANAL DATA BIOLOGICAL DATA AVAILABLE ENTRAINMENT RATE
Baseline Fishery Mortality Name ST River Capacity Turbine Number Rated Intake Bar
Rack Depth Peaking or Impoundment
/ Surface Volume Ave. Survey Type Entrainment Sampling Study Fish /
Hour Fish / Hour/
Fish/mcf
FERC NO. (MW) Type of Turbines Head Velocity Spacing of Intake Run of River Power Canal Acres (acre/ ft.) Depth Netting Hydroacoustics 1000 cfs (CFS) (ft) (ft/s) (in) (ft) (ft)
Colton NY Middle 1503
cfs Vertical 2 @ 497 cfs 285 2.7 fps 2 Peaking Impoundment 195 620 n/a YES Cool/cold Full
Netting NO YES
Racquette Francis 1 @ 509 cfs 285 Unit 1 Raymondville NY Lower 1640
cfs Fixed 1 @ 1640 cfs 21.5 1.9 fps 3 Peaking Power Canal 50 264 n/a YES Cool/cold Full
Netting NO YES
Racquette Propeller Unit 1 East Norfolk NY Lower 1635
cfs Fixed 1 @ 1635 cfs 31.4 4.2 fps 8.75 Peaking Impoundment 135 287.9 n/a Cool/cold Full
Netting NO NO
Racquette Propeller Power Canal Power Canal
High Falls NY Beaver 900 cfs Vertical 3 @ 300 cfs 100 0.9 fps 1.81 Peaking Impoundment 290 1,059 n/a YES Cool/cold Full
Netting NO NO
Francis Unit 1 Moshier NY Beaver 660 cfs Vertical 2 @ 330 cfs 196 1.3 fps 1.5 Peaking Impoundment 690 7,339 n/a YES Cool/cold Full
Netting NO NO
Francis Unit 2 Herrings NY Black 3609
cfs Fixed 3 @ 1203 cfs 19.5 2.3 fps 3.5 Run-of-
River Impoundment 140 n/a n/a YES Cool Full
Netting NO YES
Propeller Unit 2 Station 26 NY Genessee 3.0 MW n/a n/a n/a n/a n/a n/a N/a Impoundment n/a n/a n/a n/a Cool n/a n/a n/a 30.8 17.1 Little Quinnesec
WI Menominee 9.1 MW Francis 5 65 n/a 2 n/a Peaking Impoundment 349 3,000 n/a n/a Warm No n/a n/a
2,176 Horizontal 1@1,00 hp 2@1,400 hp 1 @ 2600 hp 1 @ 2800 hp Vertical 1 @ 3240 hp
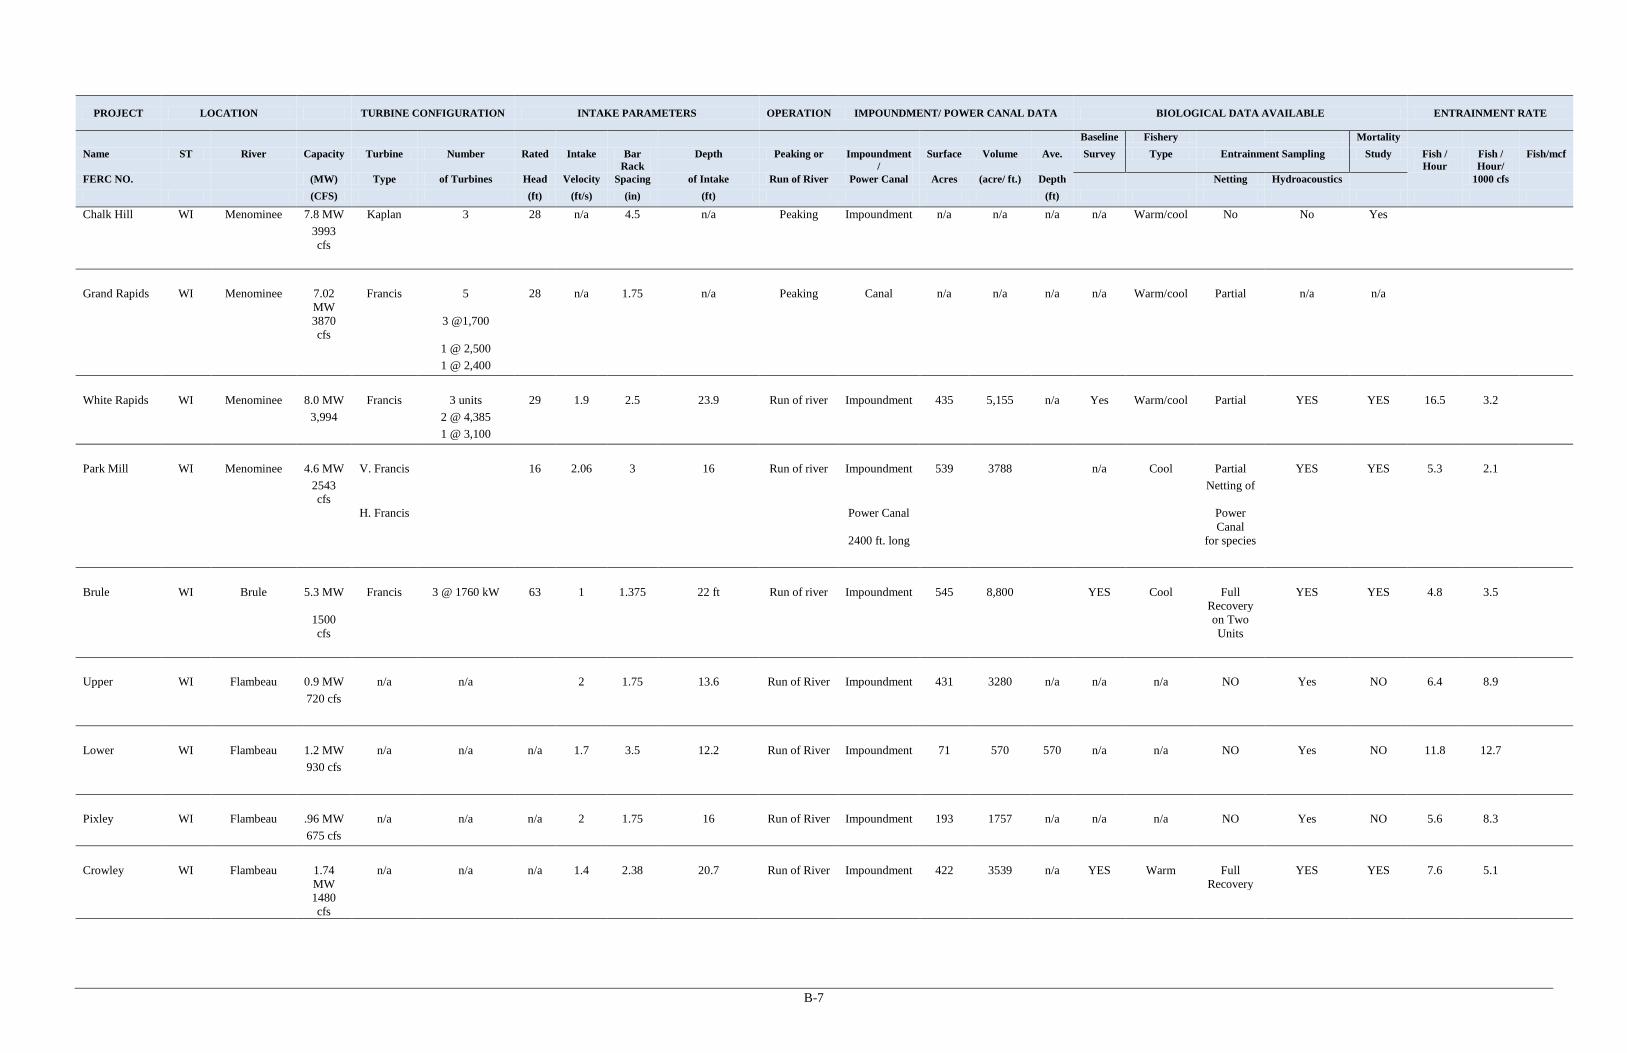
B-7
PROJECT LOCATION TURBINE CONFIGURATION INTAKE PARAMETERS OPERATION IMPOUNDMENT/ POWER CANAL DATA BIOLOGICAL DATA AVAILABLE ENTRAINMENT RATE
Baseline Fishery Mortality Name ST River Capacity Turbine Number Rated Intake Bar
Rack Depth Peaking or Impoundment
/ Surface Volume Ave. Survey Type Entrainment Sampling Study Fish /
Hour Fish / Hour/
Fish/mcf
FERC NO. (MW) Type of Turbines Head Velocity Spacing of Intake Run of River Power Canal Acres (acre/ ft.) Depth Netting Hydroacoustics 1000 cfs (CFS) (ft) (ft/s) (in) (ft) (ft)
Chalk Hill WI Menominee 7.8 MW Kaplan 3 28 n/a 4.5 n/a Peaking Impoundment n/a n/a n/a n/a Warm/cool No No Yes 3993
cfs
Grand Rapids WI Menominee 7.02
MW Francis 5 28 n/a 1.75 n/a Peaking Canal n/a n/a n/a n/a Warm/cool Partial n/a n/a
3870 cfs
3 @1,700
1 @ 2,500 1 @ 2,400 White Rapids WI Menominee 8.0 MW Francis 3 units 29 1.9 2.5 23.9 Run of river Impoundment 435 5,155 n/a Yes Warm/cool Partial YES YES 16.5 3.2 3,994 2 @ 4,385 1 @ 3,100 Park Mill WI Menominee 4.6 MW V. Francis 16 2.06 3 16 Run of river Impoundment 539 3788 n/a Cool Partial YES YES 5.3 2.1 2543
cfs Netting of
H. Francis Power Canal Power Canal
2400 ft. long for species Brule WI Brule 5.3 MW Francis 3 @ 1760 kW 63 1 1.375 22 ft Run of river Impoundment 545 8,800 YES Cool Full
Recovery YES YES 4.8 3.5
1500 cfs
on Two Units
Upper WI Flambeau 0.9 MW n/a n/a 2 1.75 13.6 Run of River Impoundment 431 3280 n/a n/a n/a NO Yes NO 6.4 8.9 720 cfs Lower WI Flambeau 1.2 MW n/a n/a n/a 1.7 3.5 12.2 Run of River Impoundment 71 570 570 n/a n/a NO Yes NO 11.8 12.7 930 cfs Pixley WI Flambeau .96 MW n/a n/a n/a 2 1.75 16 Run of River Impoundment 193 1757 n/a n/a n/a NO Yes NO 5.6 8.3 675 cfs Crowley WI Flambeau 1.74
MW n/a n/a n/a 1.4 2.38 20.7 Run of River Impoundment 422 3539 n/a YES Warm Full
Recovery YES YES 7.6 5.1
1480 cfs
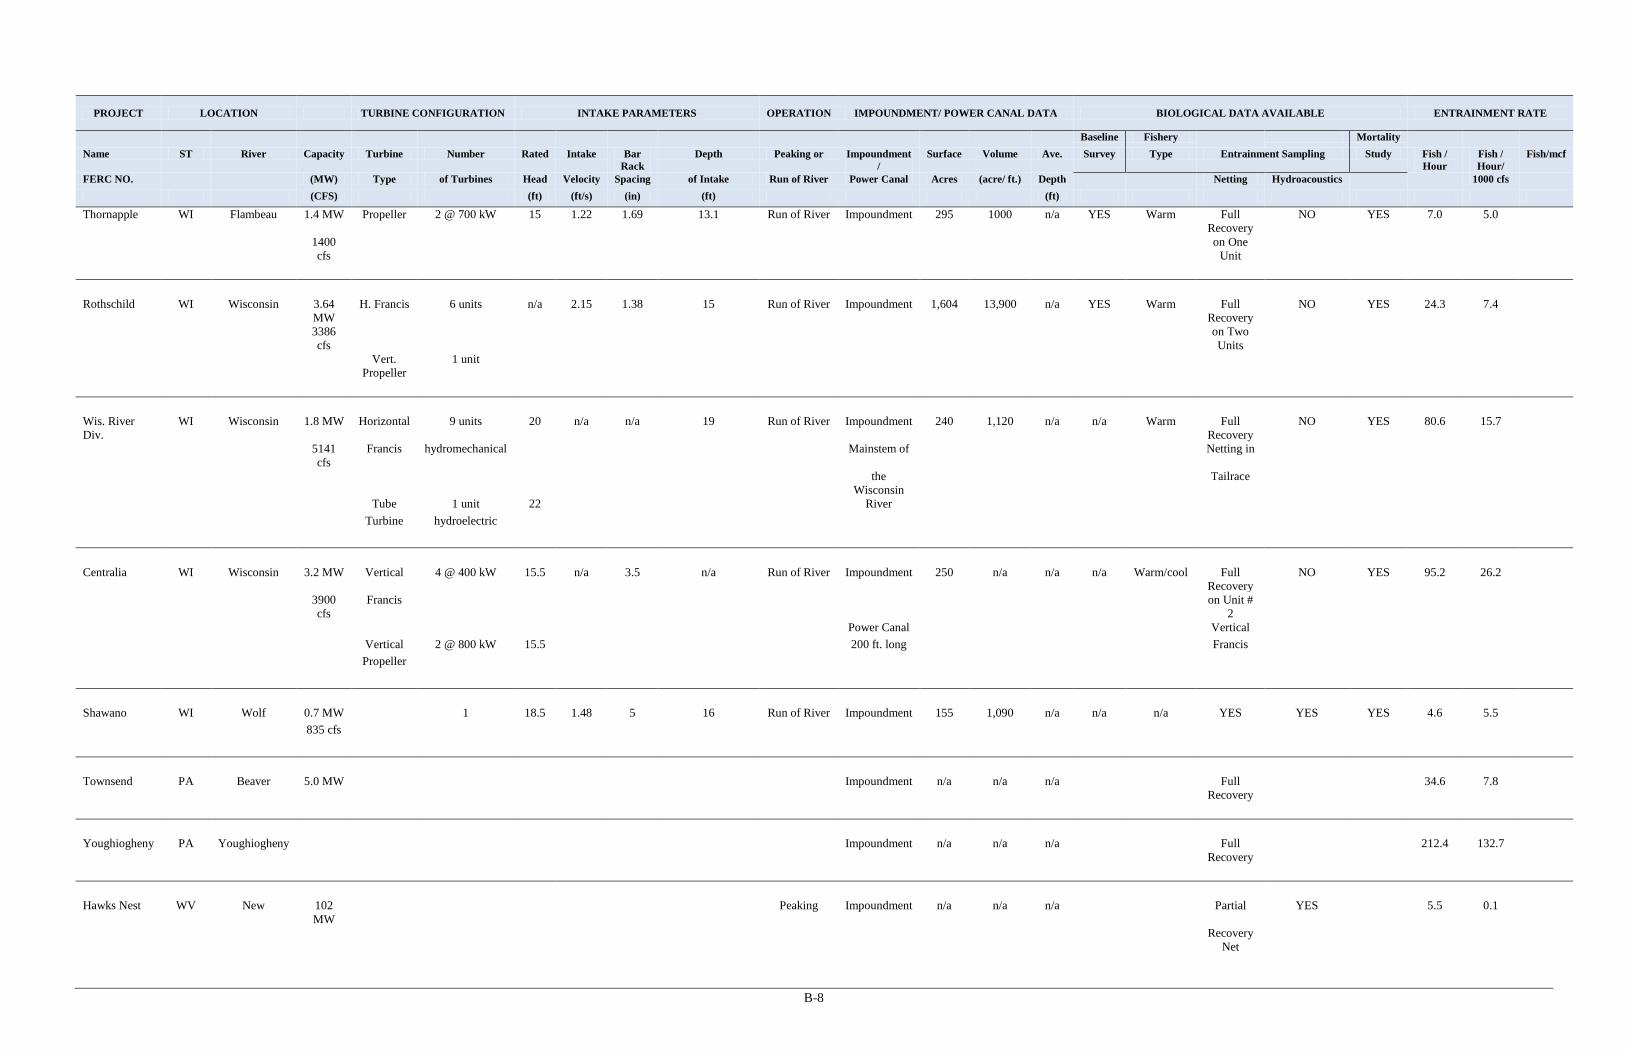
B-8
PROJECT LOCATION TURBINE CONFIGURATION INTAKE PARAMETERS OPERATION IMPOUNDMENT/ POWER CANAL DATA BIOLOGICAL DATA AVAILABLE ENTRAINMENT RATE
Baseline Fishery Mortality Name ST River Capacity Turbine Number Rated Intake Bar
Rack Depth Peaking or Impoundment
/ Surface Volume Ave. Survey Type Entrainment Sampling Study Fish /
Hour Fish / Hour/
Fish/mcf
FERC NO. (MW) Type of Turbines Head Velocity Spacing of Intake Run of River Power Canal Acres (acre/ ft.) Depth Netting Hydroacoustics 1000 cfs (CFS) (ft) (ft/s) (in) (ft) (ft)
Thornapple WI Flambeau 1.4 MW Propeller 2 @ 700 kW 15 1.22 1.69 13.1 Run of River Impoundment 295 1000 n/a YES Warm Full Recovery
NO YES 7.0 5.0
1400 cfs
on One Unit
Rothschild WI Wisconsin 3.64
MW H. Francis 6 units n/a 2.15 1.38 15 Run of River Impoundment 1,604 13,900 n/a YES Warm Full
Recovery NO YES 24.3 7.4
3386 cfs
on Two Units
Vert. Propeller
1 unit
Wis. River Div.
WI Wisconsin 1.8 MW Horizontal 9 units 20 n/a n/a 19 Run of River Impoundment 240 1,120 n/a n/a Warm Full Recovery
NO YES 80.6 15.7
5141 cfs
Francis hydromechanical Mainstem of Netting in
the Wisconsin
Tailrace
Tube 1 unit 22 River Turbine hydroelectric Centralia WI Wisconsin 3.2 MW Vertical 4 @ 400 kW 15.5 n/a 3.5 n/a Run of River Impoundment 250 n/a n/a n/a Warm/cool Full
Recovery NO YES 95.2 26.2
3900 cfs
Francis on Unit # 2
Power Canal Vertical Vertical 2 @ 800 kW 15.5 200 ft. long Francis Propeller Shawano WI Wolf 0.7 MW 1 18.5 1.48 5 16 Run of River Impoundment 155 1,090 n/a n/a n/a YES YES YES 4.6 5.5 835 cfs Townsend PA Beaver 5.0 MW Impoundment n/a n/a n/a Full
Recovery 34.6 7.8
Youghiogheny PA Youghiogheny Impoundment n/a n/a n/a Full
Recovery 212.4 132.7
Hawks Nest WV New 102
MW Peaking Impoundment n/a n/a n/a Partial YES 5.5 0.1
Recovery Net
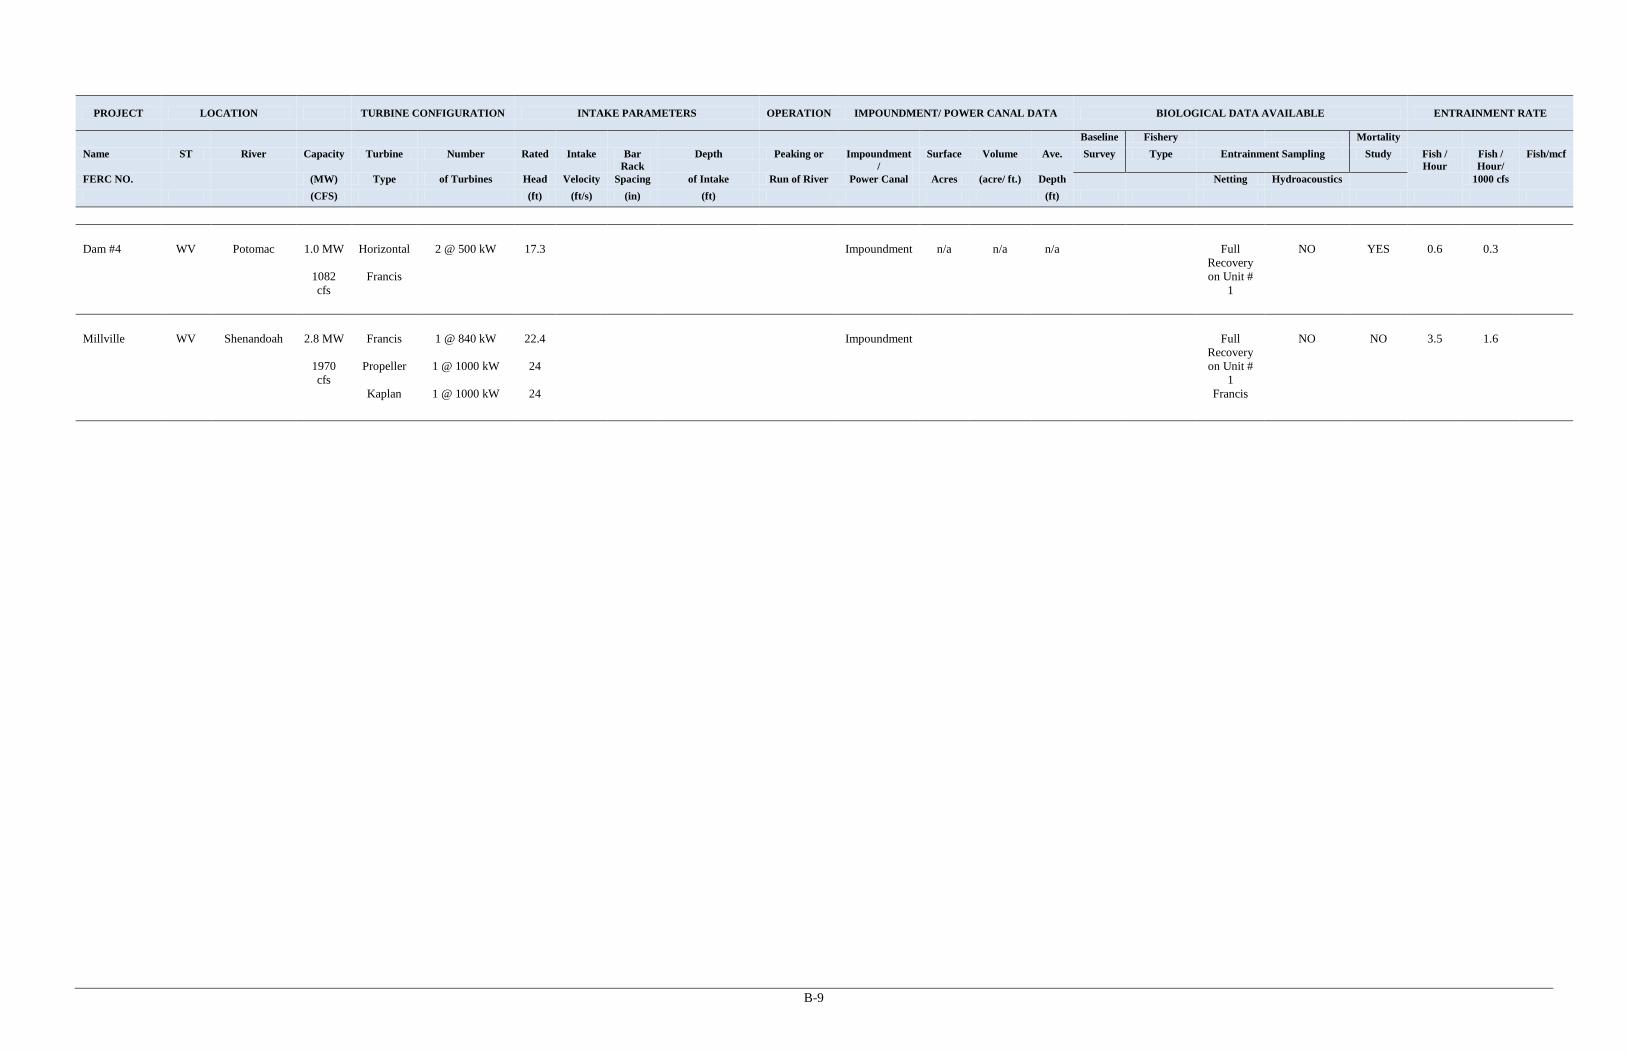
B-9
PROJECT LOCATION TURBINE CONFIGURATION INTAKE PARAMETERS OPERATION IMPOUNDMENT/ POWER CANAL DATA BIOLOGICAL DATA AVAILABLE ENTRAINMENT RATE
Baseline Fishery Mortality Name ST River Capacity Turbine Number Rated Intake Bar
Rack Depth Peaking or Impoundment
/ Surface Volume Ave. Survey Type Entrainment Sampling Study Fish /
Hour Fish / Hour/
Fish/mcf
FERC NO. (MW) Type of Turbines Head Velocity Spacing of Intake Run of River Power Canal Acres (acre/ ft.) Depth Netting Hydroacoustics 1000 cfs (CFS) (ft) (ft/s) (in) (ft) (ft)
Dam #4 WV Potomac 1.0 MW Horizontal 2 @ 500 kW 17.3 Impoundment n/a n/a n/a Full
Recovery NO YES 0.6 0.3
1082 cfs
Francis on Unit # 1
Millville WV Shenandoah 2.8 MW Francis 1 @ 840 kW 22.4 Impoundment Full
Recovery NO NO 3.5 1.6
1970 cfs
Propeller 1 @ 1000 kW 24 on Unit # 1
Kaplan 1 @ 1000 kW 24 Francis
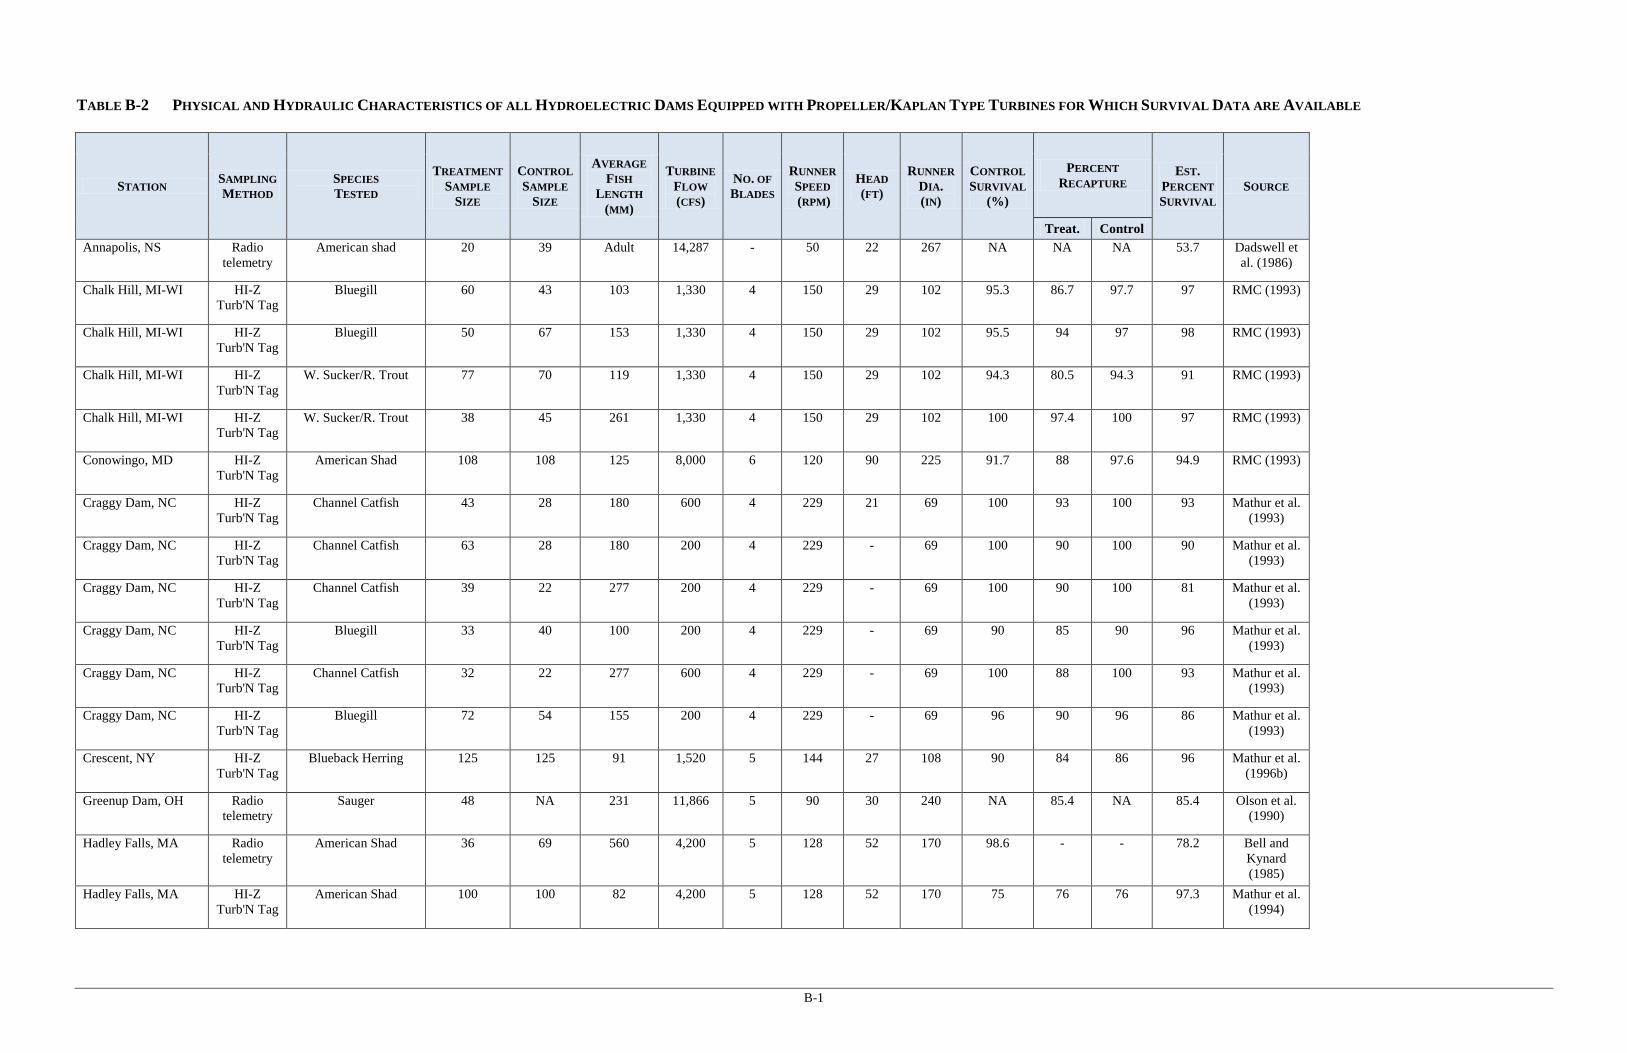
B-1
TABLE B-2 PHYSICAL AND HYDRAULIC CHARACTERISTICS OF ALL HYDROELECTRIC DAMS EQUIPPED WITH PROPELLER/KAPLAN TYPE TURBINES FOR WHICH SURVIVAL DATA ARE AVAILABLE
STATION SAMPLING METHOD
SPECIES TESTED
TREATMENT SAMPLE
SIZE
CONTROL SAMPLE
SIZE
AVERAGE FISH
LENGTH (MM)
TURBINE FLOW (CFS)
NO. OF BLADES
RUNNER SPEED (RPM)
HEAD (FT)
RUNNER DIA. (IN)
CONTROL SURVIVAL
(%)
PERCENT RECAPTURE
EST. PERCENT SURVIVAL
SOURCE
Treat. Control Annapolis, NS Radio
telemetry American shad 20 39 Adult 14,287 - 50 22 267 NA NA NA 53.7 Dadswell et
al. (1986)
Chalk Hill, MI-WI HI-Z Turb'N Tag
Bluegill 60 43 103 1,330 4 150 29 102 95.3 86.7 97.7 97 RMC (1993)
Chalk Hill, MI-WI HI-Z Turb'N Tag
Bluegill 50 67 153 1,330 4 150 29 102 95.5 94 97 98 RMC (1993)
Chalk Hill, MI-WI HI-Z Turb'N Tag
W. Sucker/R. Trout 77 70 119 1,330 4 150 29 102 94.3 80.5 94.3 91 RMC (1993)
Chalk Hill, MI-WI HI-Z Turb'N Tag
W. Sucker/R. Trout 38 45 261 1,330 4 150 29 102 100 97.4 100 97 RMC (1993)
Conowingo, MD HI-Z Turb'N Tag
American Shad 108 108 125 8,000 6 120 90 225 91.7 88 97.6 94.9 RMC (1993)
Craggy Dam, NC HI-Z Turb'N Tag
Channel Catfish 43 28 180 600 4 229 21 69 100 93 100 93 Mathur et al. (1993)
Craggy Dam, NC HI-Z Turb'N Tag
Channel Catfish 63 28 180 200 4 229 - 69 100 90 100 90 Mathur et al. (1993)
Craggy Dam, NC HI-Z Turb'N Tag
Channel Catfish 39 22 277 200 4 229 - 69 100 90 100 81 Mathur et al. (1993)
Craggy Dam, NC HI-Z Turb'N Tag
Bluegill 33 40 100 200 4 229 - 69 90 85 90 96 Mathur et al. (1993)
Craggy Dam, NC HI-Z Turb'N Tag
Channel Catfish 32 22 277 600 4 229 - 69 100 88 100 93 Mathur et al. (1993)
Craggy Dam, NC HI-Z Turb'N Tag
Bluegill 72 54 155 200 4 229 - 69 96 90 96 86 Mathur et al. (1993)
Crescent, NY HI-Z Turb'N Tag
Blueback Herring 125 125 91 1,520 5 144 27 108 90 84 86 96 Mathur et al. (1996b)
Greenup Dam, OH Radio telemetry
Sauger 48 NA 231 11,866 5 90 30 240 NA 85.4 NA 85.4 Olson et al. (1990)
Hadley Falls, MA Radio telemetry
American Shad 36 69 560 4,200 5 128 52 170 98.6 - - 78.2 Bell and Kynard (1985)
Hadley Falls, MA HI-Z Turb'N Tag
American Shad 100 100 82 4,200 5 128 52 170 75 76 76 97.3 Mathur et al. (1994)
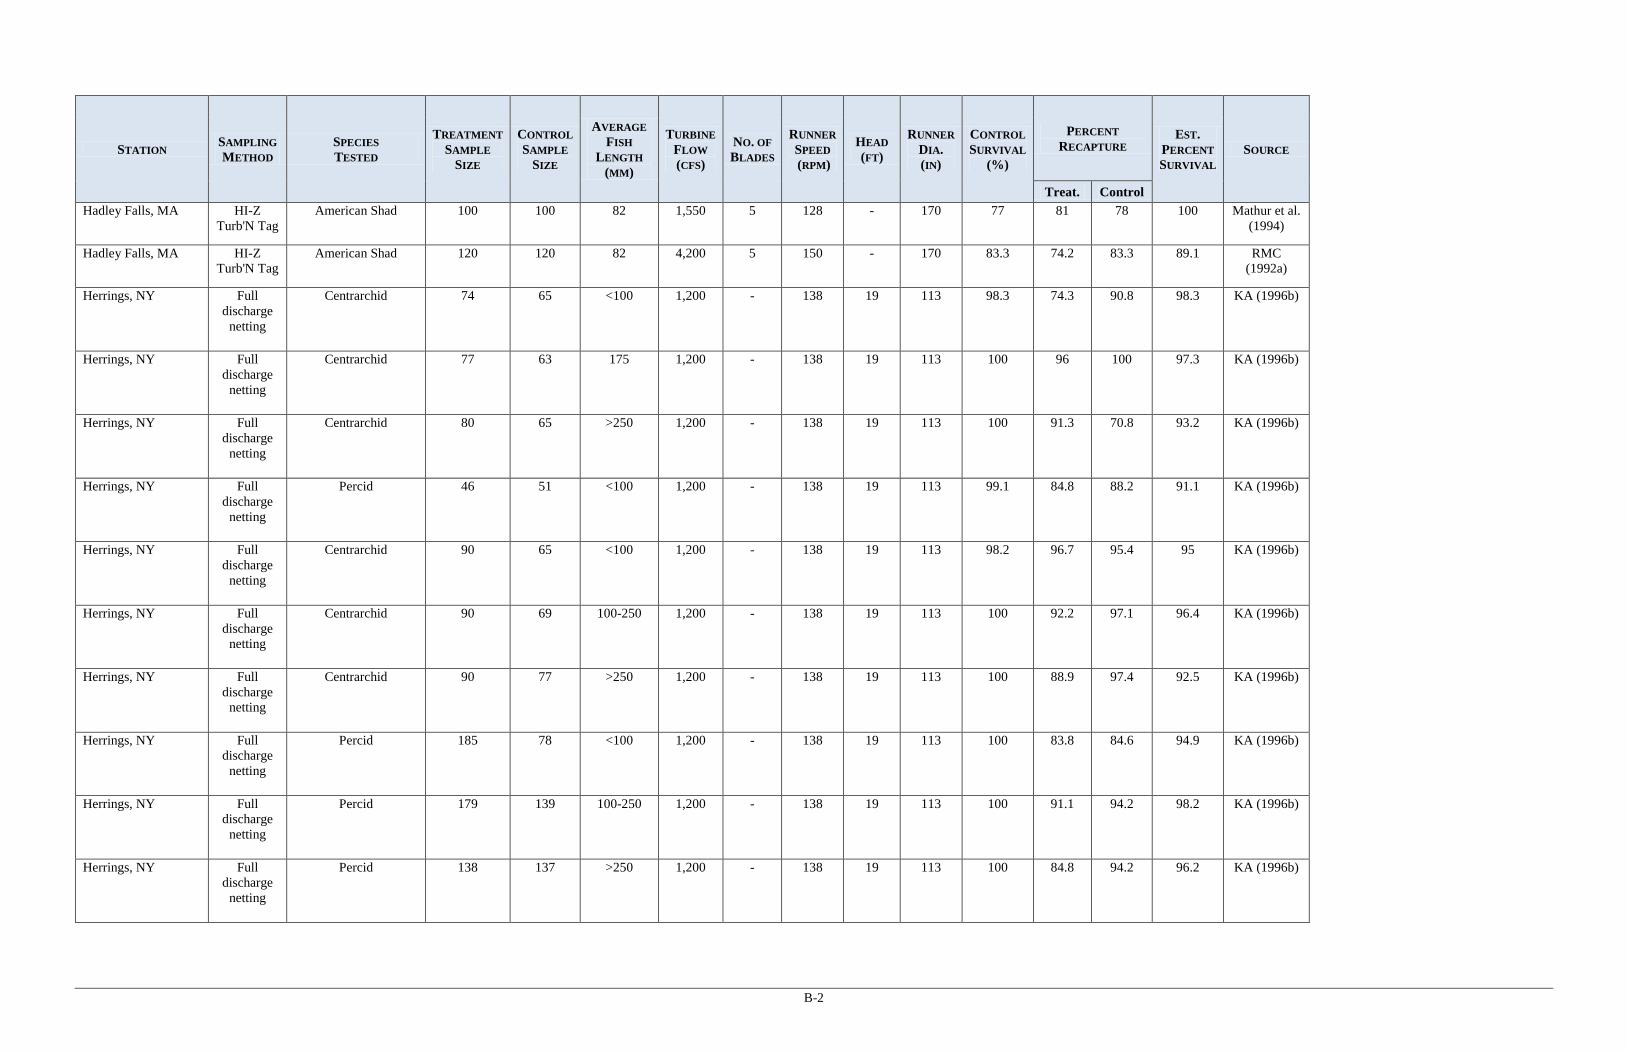
B-2
STATION SAMPLING METHOD
SPECIES TESTED
TREATMENT SAMPLE
SIZE
CONTROL SAMPLE
SIZE
AVERAGE FISH
LENGTH (MM)
TURBINE FLOW (CFS)
NO. OF BLADES
RUNNER SPEED (RPM)
HEAD (FT)
RUNNER DIA. (IN)
CONTROL SURVIVAL
(%)
PERCENT RECAPTURE
EST. PERCENT SURVIVAL
SOURCE
Treat. Control Hadley Falls, MA HI-Z
Turb'N Tag American Shad 100 100 82 1,550 5 128 - 170 77 81 78 100 Mathur et al.
(1994)
Hadley Falls, MA HI-Z Turb'N Tag
American Shad 120 120 82 4,200 5 150 - 170 83.3 74.2 83.3 89.1 RMC (1992a)
Herrings, NY Full discharge
netting
Centrarchid 74 65 <100 1,200 - 138 19 113 98.3 74.3 90.8 98.3 KA (1996b)
Herrings, NY Full discharge
netting
Centrarchid 77 63 175 1,200 - 138 19 113 100 96 100 97.3 KA (1996b)
Herrings, NY Full discharge
netting
Centrarchid 80 65 >250 1,200 - 138 19 113 100 91.3 70.8 93.2 KA (1996b)
Herrings, NY Full discharge
netting
Percid 46 51 <100 1,200 - 138 19 113 99.1 84.8 88.2 91.1 KA (1996b)
Herrings, NY Full discharge
netting
Centrarchid 90 65 <100 1,200 - 138 19 113 98.2 96.7 95.4 95 KA (1996b)
Herrings, NY Full discharge
netting
Centrarchid 90 69 100-250 1,200 - 138 19 113 100 92.2 97.1 96.4 KA (1996b)
Herrings, NY Full discharge
netting
Centrarchid 90 77 >250 1,200 - 138 19 113 100 88.9 97.4 92.5 KA (1996b)
Herrings, NY Full discharge
netting
Percid 185 78 <100 1,200 - 138 19 113 100 83.8 84.6 94.9 KA (1996b)
Herrings, NY Full discharge
netting
Percid 179 139 100-250 1,200 - 138 19 113 100 91.1 94.2 98.2 KA (1996b)
Herrings, NY Full discharge
netting
Percid 138 137 >250 1,200 - 138 19 113 100 84.8 94.2 96.2 KA (1996b)
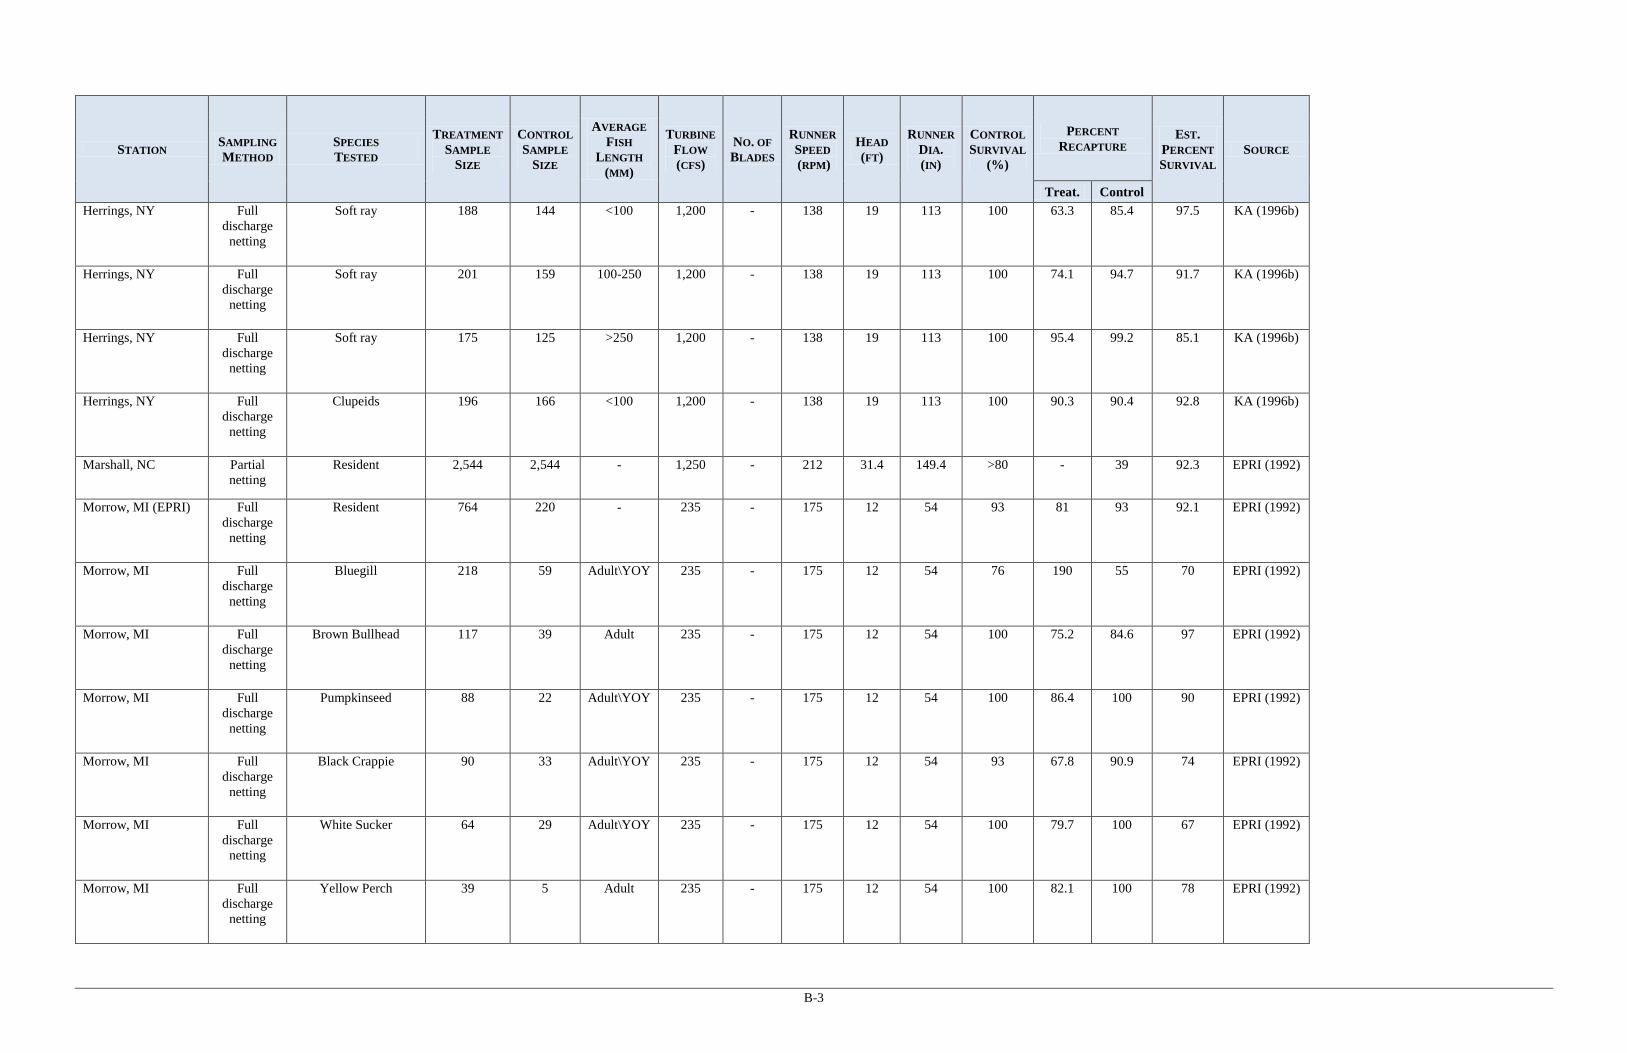
B-3
STATION SAMPLING METHOD
SPECIES TESTED
TREATMENT SAMPLE
SIZE
CONTROL SAMPLE
SIZE
AVERAGE FISH
LENGTH (MM)
TURBINE FLOW (CFS)
NO. OF BLADES
RUNNER SPEED (RPM)
HEAD (FT)
RUNNER DIA. (IN)
CONTROL SURVIVAL
(%)
PERCENT RECAPTURE
EST. PERCENT SURVIVAL
SOURCE
Treat. Control Herrings, NY Full
discharge netting
Soft ray 188 144 <100 1,200 - 138 19 113 100 63.3 85.4 97.5 KA (1996b)
Herrings, NY Full discharge
netting
Soft ray 201 159 100-250 1,200 - 138 19 113 100 74.1 94.7 91.7 KA (1996b)
Herrings, NY Full discharge
netting
Soft ray 175 125 >250 1,200 - 138 19 113 100 95.4 99.2 85.1 KA (1996b)
Herrings, NY Full discharge
netting
Clupeids 196 166 <100 1,200 - 138 19 113 100 90.3 90.4 92.8 KA (1996b)
Marshall, NC Partial netting
Resident 2,544 2,544 - 1,250 - 212 31.4 149.4 >80 - 39 92.3 EPRI (1992)
Morrow, MI (EPRI) Full discharge
netting
Resident 764 220 - 235 - 175 12 54 93 81 93 92.1 EPRI (1992)
Morrow, MI Full discharge
netting
Bluegill 218 59 Adult\YOY 235 - 175 12 54 76 190 55 70 EPRI (1992)
Morrow, MI Full discharge
netting
Brown Bullhead 117 39 Adult 235 - 175 12 54 100 75.2 84.6 97 EPRI (1992)
Morrow, MI Full discharge
netting
Pumpkinseed 88 22 Adult\YOY 235 - 175 12 54 100 86.4 100 90 EPRI (1992)
Morrow, MI Full discharge
netting
Black Crappie 90 33 Adult\YOY 235 - 175 12 54 93 67.8 90.9 74 EPRI (1992)
Morrow, MI Full discharge
netting
White Sucker 64 29 Adult\YOY 235 - 175 12 54 100 79.7 100 67 EPRI (1992)
Morrow, MI Full discharge
netting
Yellow Perch 39 5 Adult 235 - 175 12 54 100 82.1 100 78 EPRI (1992)
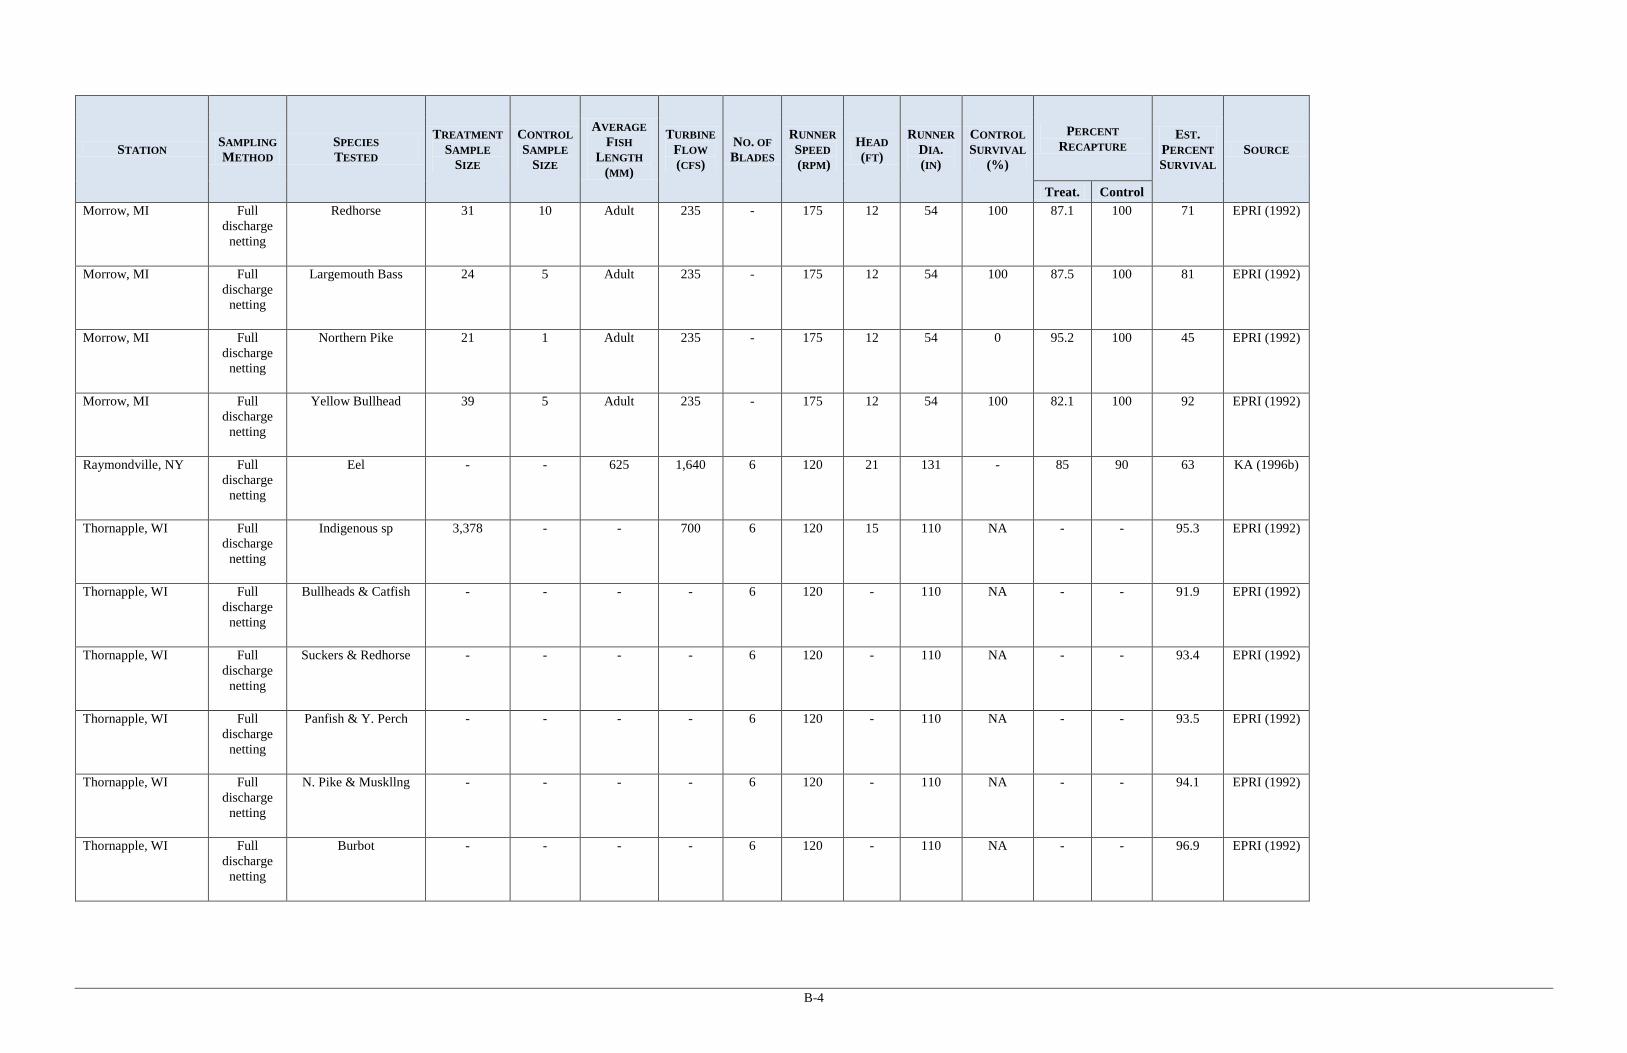
B-4
STATION SAMPLING METHOD
SPECIES TESTED
TREATMENT SAMPLE
SIZE
CONTROL SAMPLE
SIZE
AVERAGE FISH
LENGTH (MM)
TURBINE FLOW (CFS)
NO. OF BLADES
RUNNER SPEED (RPM)
HEAD (FT)
RUNNER DIA. (IN)
CONTROL SURVIVAL
(%)
PERCENT RECAPTURE
EST. PERCENT SURVIVAL
SOURCE
Treat. Control Morrow, MI Full
discharge netting
Redhorse 31 10 Adult 235 - 175 12 54 100 87.1 100 71 EPRI (1992)
Morrow, MI Full discharge
netting
Largemouth Bass 24 5 Adult 235 - 175 12 54 100 87.5 100 81 EPRI (1992)
Morrow, MI Full discharge
netting
Northern Pike 21 1 Adult 235 - 175 12 54 0 95.2 100 45 EPRI (1992)
Morrow, MI Full discharge
netting
Yellow Bullhead 39 5 Adult 235 - 175 12 54 100 82.1 100 92 EPRI (1992)
Raymondville, NY Full discharge
netting
Eel - - 625 1,640 6 120 21 131 - 85 90 63 KA (1996b)
Thornapple, WI Full discharge
netting
Indigenous sp 3,378 - - 700 6 120 15 110 NA - - 95.3 EPRI (1992)
Thornapple, WI Full discharge
netting
Bullheads & Catfish - - - - 6 120 - 110 NA - - 91.9 EPRI (1992)
Thornapple, WI Full discharge
netting
Suckers & Redhorse - - - - 6 120 - 110 NA - - 93.4 EPRI (1992)
Thornapple, WI Full discharge
netting
Panfish & Y. Perch - - - - 6 120 - 110 NA - - 93.5 EPRI (1992)
Thornapple, WI Full discharge
netting
N. Pike & Muskllng - - - - 6 120 - 110 NA - - 94.1 EPRI (1992)
Thornapple, WI Full discharge
netting
Burbot - - - - 6 120 - 110 NA - - 96.9 EPRI (1992)
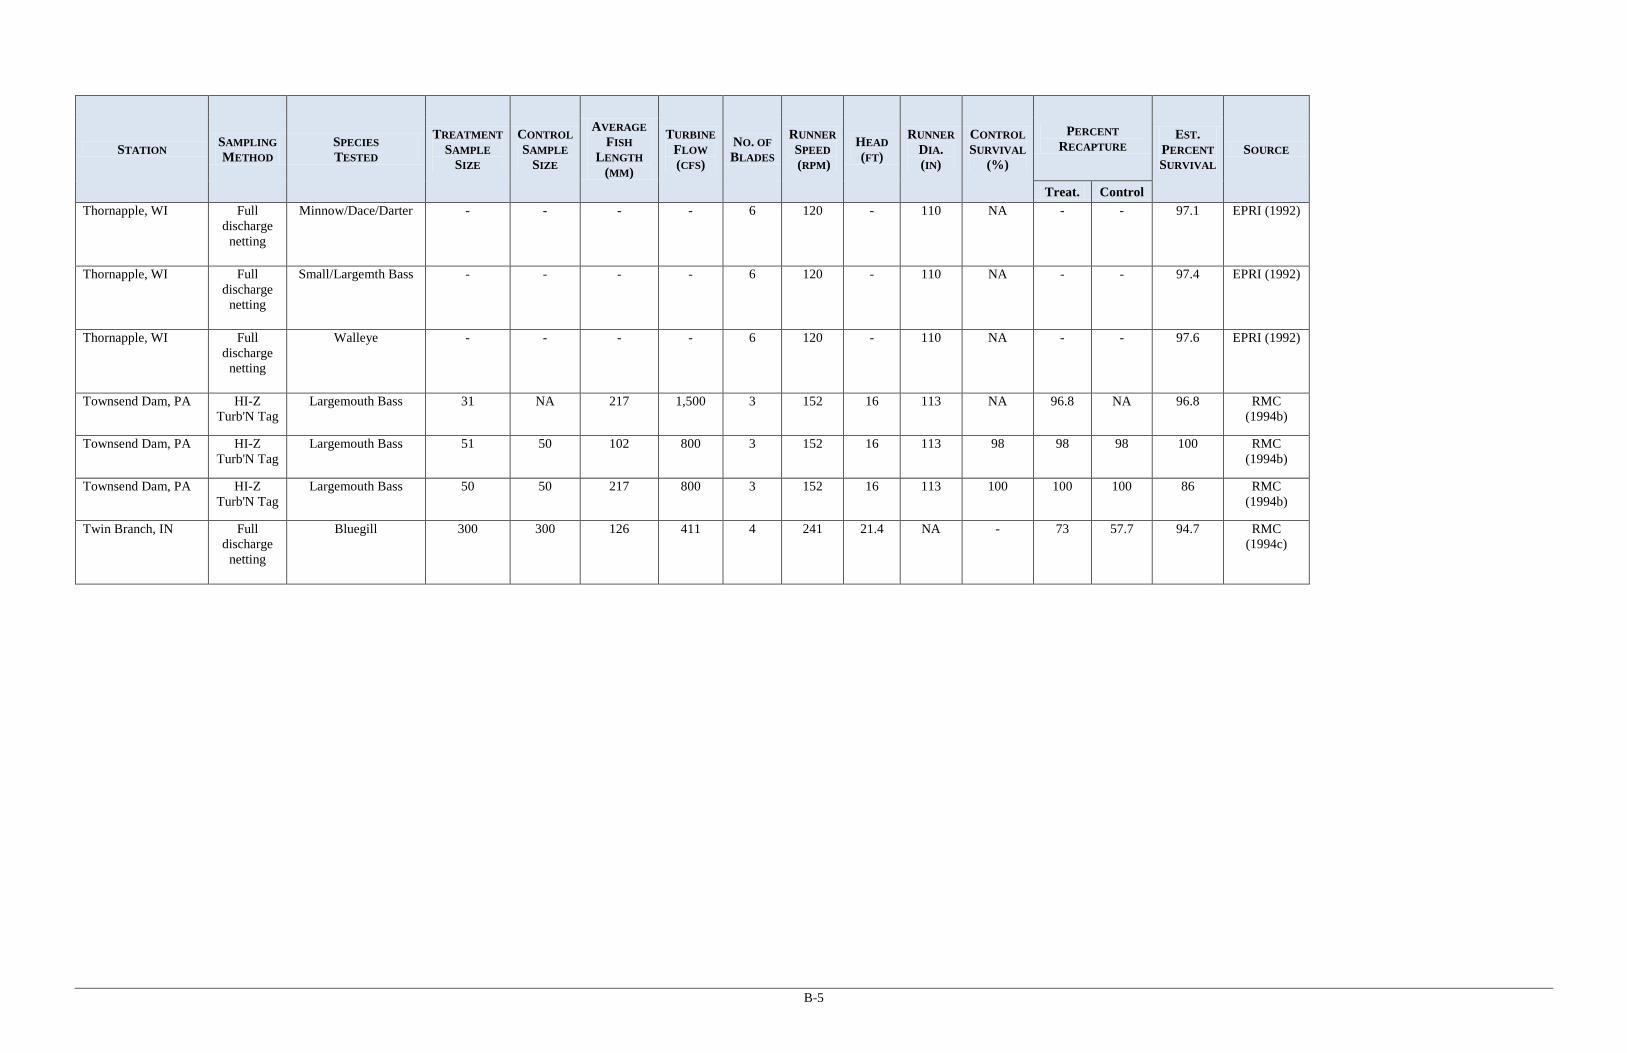
B-5
STATION SAMPLING METHOD
SPECIES TESTED
TREATMENT SAMPLE
SIZE
CONTROL SAMPLE
SIZE
AVERAGE FISH
LENGTH (MM)
TURBINE FLOW (CFS)
NO. OF BLADES
RUNNER SPEED (RPM)
HEAD (FT)
RUNNER DIA. (IN)
CONTROL SURVIVAL
(%)
PERCENT RECAPTURE
EST. PERCENT SURVIVAL
SOURCE
Treat. Control Thornapple, WI Full
discharge netting
Minnow/Dace/Darter - - - - 6 120 - 110 NA - - 97.1 EPRI (1992)
Thornapple, WI Full discharge
netting
Small/Largemth Bass - - - - 6 120 - 110 NA - - 97.4 EPRI (1992)
Thornapple, WI Full discharge
netting
Walleye - - - - 6 120 - 110 NA - - 97.6 EPRI (1992)
Townsend Dam, PA HI-Z Turb'N Tag
Largemouth Bass 31 NA 217 1,500 3 152 16 113 NA 96.8 NA 96.8 RMC (1994b)
Townsend Dam, PA HI-Z Turb'N Tag
Largemouth Bass 51 50 102 800 3 152 16 113 98 98 98 100 RMC (1994b)
Townsend Dam, PA HI-Z Turb'N Tag
Largemouth Bass 50 50 217 800 3 152 16 113 100 100 100 86 RMC (1994b)
Twin Branch, IN Full discharge
netting
Bluegill 300 300 126 411 4 241 21.4 NA - 73 57.7 94.7 RMC (1994c)

APPENDIX C
FRESHWATER DRUM INFORMATION

TOWNSEND DAM ENTRAINMENT STUDY SUMMARY
OSWEGO RIVER PROJECT ENTRAINMENT STUDY SUMMARY
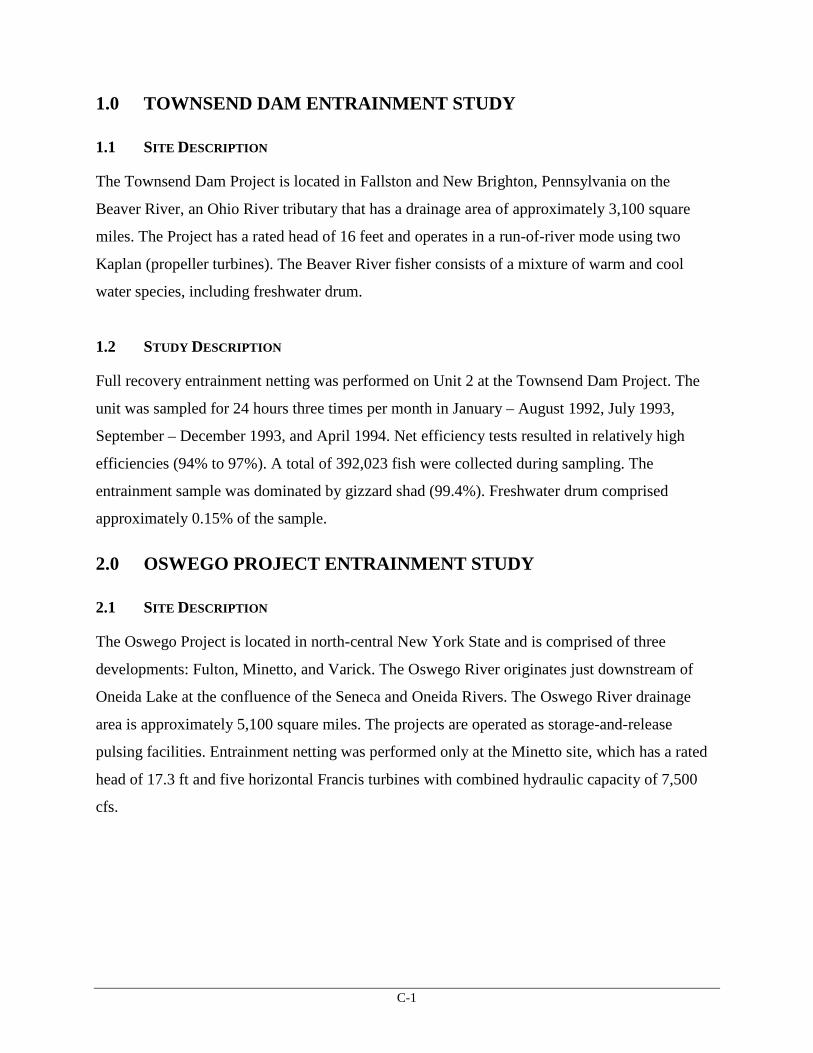
C-1
1.0 TOWNSEND DAM ENTRAINMENT STUDY
1.1 SITE DESCRIPTION
The Townsend Dam Project is located in Fallston and New Brighton, Pennsylvania on the
Beaver River, an Ohio River tributary that has a drainage area of approximately 3,100 square
miles. The Project has a rated head of 16 feet and operates in a run-of-river mode using two
Kaplan (propeller turbines). The Beaver River fisher consists of a mixture of warm and cool
water species, including freshwater drum.
1.2 STUDY DESCRIPTION
Full recovery entrainment netting was performed on Unit 2 at the Townsend Dam Project. The
unit was sampled for 24 hours three times per month in January – August 1992, July 1993,
September – December 1993, and April 1994. Net efficiency tests resulted in relatively high
efficiencies (94% to 97%). A total of 392,023 fish were collected during sampling. The
entrainment sample was dominated by gizzard shad (99.4%). Freshwater drum comprised
approximately 0.15% of the sample.
2.0 OSWEGO PROJECT ENTRAINMENT STUDY
2.1 SITE DESCRIPTION
The Oswego Project is located in north-central New York State and is comprised of three
developments: Fulton, Minetto, and Varick. The Oswego River originates just downstream of
Oneida Lake at the confluence of the Seneca and Oneida Rivers. The Oswego River drainage
area is approximately 5,100 square miles. The projects are operated as storage-and-release
pulsing facilities. Entrainment netting was performed only at the Minetto site, which has a rated
head of 17.3 ft and five horizontal Francis turbines with combined hydraulic capacity of 7,500
cfs.

C-2
2.2 STUDY DESCRIPTION
Full recovery entrainment netting was performed for a 48 hour duration on units 3, 4, and 5 at the
Minetto development between May 1994 and April 1995 on a bi-weekly interval. Net efficiency
tests were conducted on each unit and used to adjust entrainment netting data to provide total
entrainment estimates for each unit. Data from the sampled units was used to estimate
entrainment at the unsampled units (Units 1 and 2). A total of 3,519,061 fish were estimated as
entrained at Minetto during the study. Gizzard shad were the dominant species, comprising 62%
of all entrainment at the site. Freshwater drum were estimated to comprise less than 0.001%.
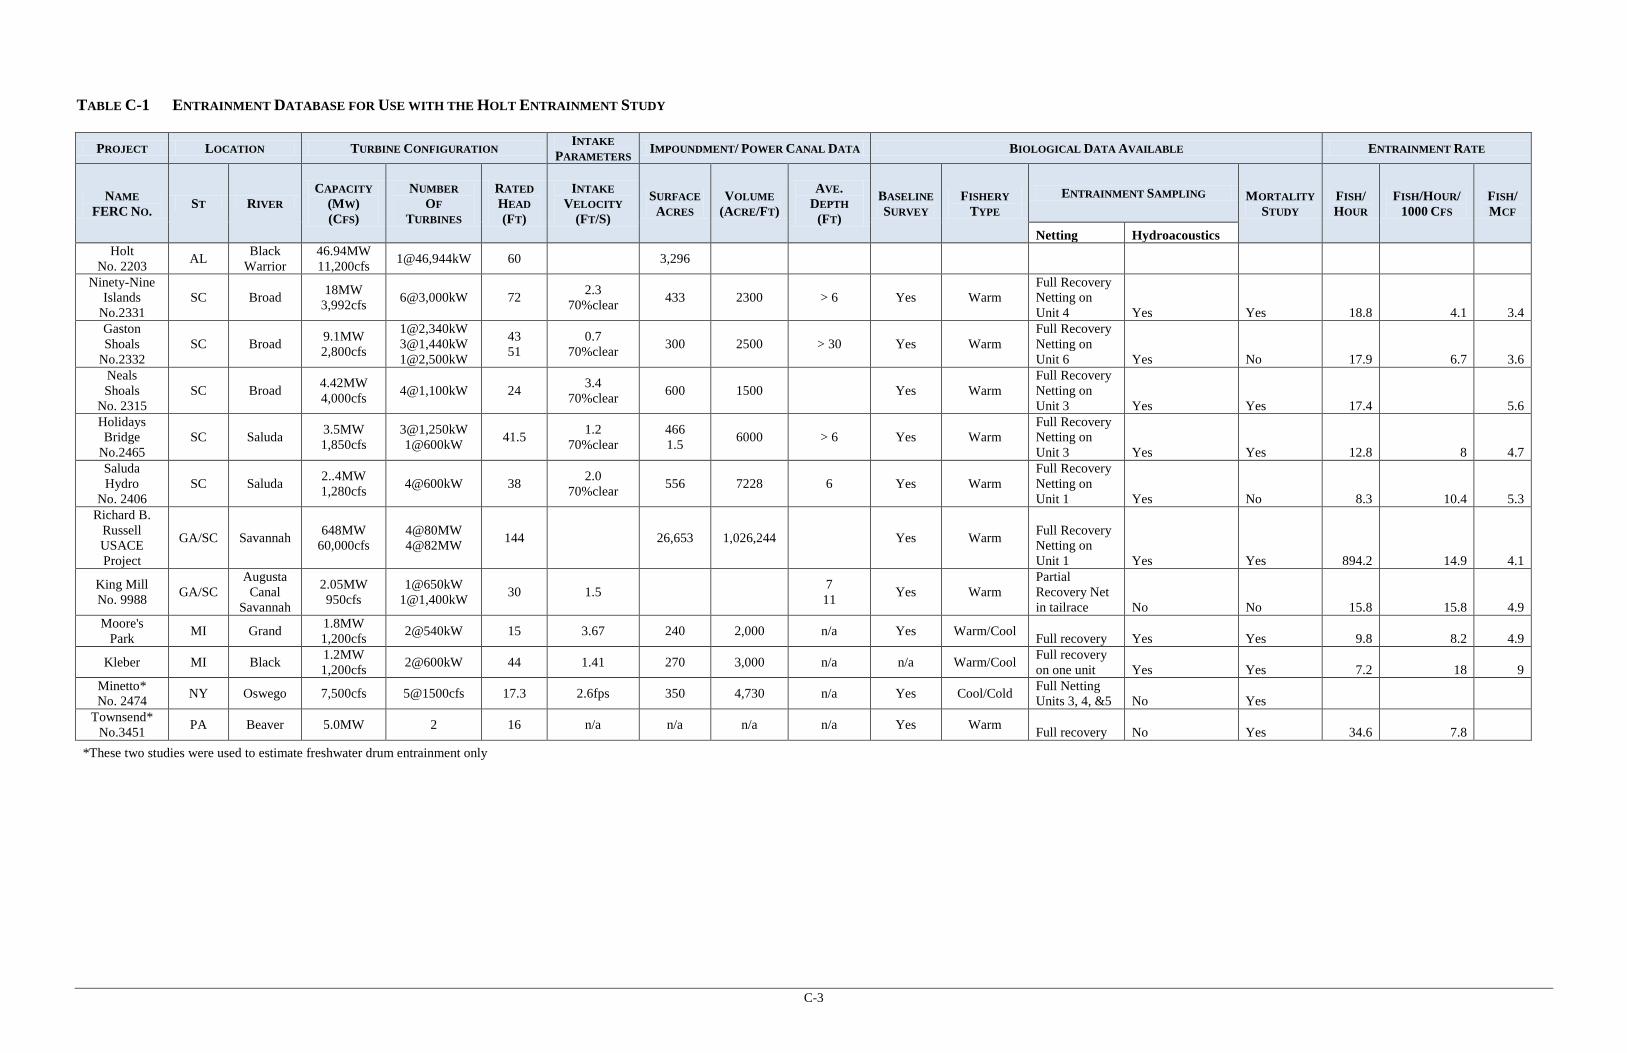
C-3
TABLE C-1 ENTRAINMENT DATABASE FOR USE WITH THE HOLT ENTRAINMENT STUDY
PROJECT LOCATION TURBINE CONFIGURATION INTAKE PARAMETERS IMPOUNDMENT/ POWER CANAL DATA BIOLOGICAL DATA AVAILABLE ENTRAINMENT RATE
NAME FERC NO. ST RIVER
CAPACITY (MW) (CFS)
NUMBER OF
TURBINES
RATED HEAD (FT)
INTAKE VELOCITY
(FT/S)
SURFACE ACRES
VOLUME (ACRE/FT)
AVE. DEPTH
(FT)
BASELINE SURVEY
FISHERY TYPE
ENTRAINMENT SAMPLING MORTALITY STUDY
FISH/ HOUR
FISH/HOUR/ 1000 CFS
FISH/ MCF
Netting Hydroacoustics Holt
No. 2203 AL Black Warrior
46.94MW 11,200cfs 1@46,944kW 60 3,296
Ninety-Nine Islands
No.2331 SC Broad 18MW
3,992cfs 6@3,000kW 72 2.3 70%clear 433 2300 > 6 Yes Warm
Full Recovery Netting on Unit 4 Yes Yes 18.8 4.1 3.4
Gaston Shoals
No.2332 SC Broad 9.1MW
2,800cfs
1@2,340kW 3@1,440kW 1@2,500kW
43 51
0.7 70%clear 300 2500 > 30 Yes Warm
Full Recovery Netting on Unit 6 Yes No 17.9 6.7 3.6
Neals Shoals
No. 2315 SC Broad 4.42MW
4,000cfs 4@1,100kW 24 3.4 70%clear 600 1500 Yes Warm
Full Recovery Netting on Unit 3 Yes Yes 17.4 5.6
Holidays Bridge
No.2465 SC Saluda 3.5MW
1,850cfs 3@1,250kW 1@600kW 41.5 1.2
70%clear 466 1.5 6000 > 6 Yes Warm
Full Recovery Netting on Unit 3 Yes Yes 12.8 8 4.7
Saluda Hydro
No. 2406 SC Saluda 2..4MW
1,280cfs 4@600kW 38 2.0 70%clear 556 7228 6 Yes Warm
Full Recovery Netting on Unit 1 Yes No 8.3 10.4 5.3
Richard B. Russell USACE Project
GA/SC Savannah 648MW 60,000cfs
4@80MW 4@82MW 144 26,653 1,026,244 Yes Warm Full Recovery
Netting on Unit 1 Yes Yes 894.2 14.9 4.1
King Mill No. 9988 GA/SC
Augusta Canal
Savannah
2.05MW 950cfs
1@650kW 1@1,400kW 30 1.5
7 11 Yes Warm
Partial Recovery Net in tailrace No No 15.8 15.8 4.9
Moore's Park MI Grand 1.8MW
1,200cfs 2@540kW 15 3.67 240 2,000 n/a Yes Warm/Cool Full recovery Yes Yes 9.8 8.2 4.9
Kleber MI Black 1.2MW 1,200cfs 2@600kW 44 1.41 270 3,000 n/a n/a Warm/Cool Full recovery
on one unit Yes Yes 7.2 18 9 Minetto* No. 2474 NY Oswego 7,500cfs 5@1500cfs 17.3 2.6fps 350 4,730 n/a Yes Cool/Cold Full Netting
Units 3, 4, &5 No Yes Townsend*
No.3451 PA Beaver 5.0MW 2 16 n/a n/a n/a n/a Yes Warm Full recovery No Yes 34.6 7.8 *These two studies were used to estimate freshwater drum entrainment only

APPENDIX D
AGENCY QUESTIONS/COMMENTS AND ALABAMA POWER RESPONSE

From: [email protected] [mailto:[email protected]] Sent: Wednesday, December 14, 2011 11:49 AM To: Powers, Jason Cc: Greene, Chris; [email protected]; Nix, Erica Shelton; Leslie, Fred; Moody, Gary; Wathen, John; Edwards, Jeanne; Takats, Judy (work); Takats, Judy (home); Sumner, Chuck; Sisk, Lynn; Reid, Mitch; Brooke, Nelson; [email protected]; Allen, Bob; Cook, Stan; [email protected]; [email protected] Subject: Re: Draft Holt Fish Entrainment and Turbine Mortality Study Jason, Thank you for the opportunity to review the Fish Entrainment and Turbine Mortality Study for the Holt Project. As for the fishes, your analysis appears to be accurate and well written. However, I suggest APCo also consider freshwater mussels as possible victims of entrainment /impingement. Although it's not typically a factor considered at hydropower projects around the country, as it is not documented in FERC (1995), I do believe it should be considered in areas that support freshwater mussels. Since mussels are benthic animals, they, or their host fish species, have the potential to be entrained/impinged at the project intakes. For example, on June 14, 2005, a juvenile Alabama (=inflated) heelsplitter (Potamilus inflatus) was apparently impinged and removed from the trash racks at APCo's Greene County Steam Plant (GCSP). Although this might have been a rare incident, it still warrants consideration. Even though the inflated heelsplitter was not reported during your recent surveys, we do believe it occurs in the vicinity of the Holt Project. I recommend that a comparison of flow rates, screen size, and other pertinent information be conducted between GCSP and the Holt Project, and incorporated into this analysis. I also recommend using information provided in Table 6 of this analysis to estimate potential levels of mortality (i.e., “take”) for the Freshwater Drum (Aplodinotus grunniens), which is the known host fish for the inflated heelsplitter (Roe et al. 1997). Thanks again for the opportunity to review this study. If you have any questions, please let me know. jeff Federal Energy Regulatory Commission (FERC). 1995. Preliminary assessment of fish entrainment at hydropower projects – volume 1 (Paper No. DPR-10). Office of Hydropower Licensing, FERC, Washington, DC. Roe, K.J., A.M. Simons, and P.D. Hartfield. 1997. Identification of a fish host of the inflated heelsplitter Potamilus inflatus (Bivalvia: Unionidae) with a description of its glochidium. The American Midland Naturalist 138(1):48-54. Jeff Powell Aquatic Biologist U.S. Fish and Wildlife Service Alabama Ecological Services Field Office ==================================== 1208-B Main Street Daphne, Alabama 36526 251.441.5858 http://daphne.fws.gov http://www.facebook.com/#!/usfwsalabama Alabama Power Response: Alabama Power respectfully disagrees with the US Fish and Wildlife Service (USFWS) assumption that individual mussels would be entrained at the Holt Project on a regular basis. We
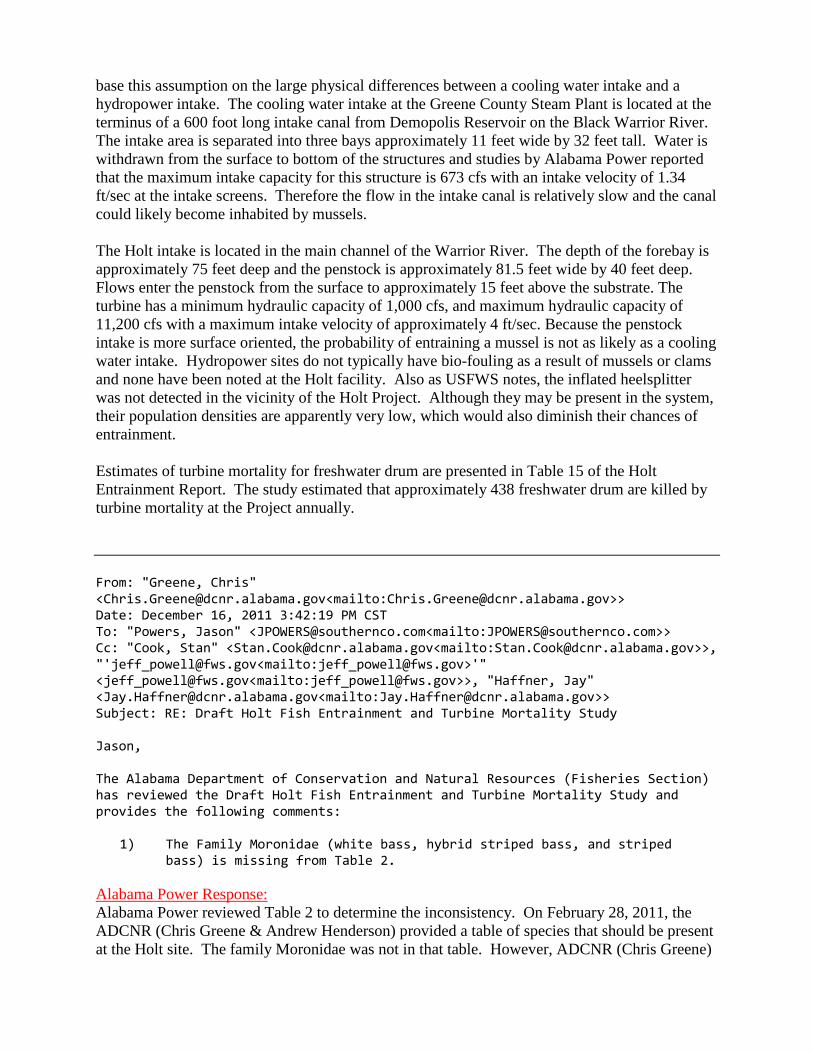
base this assumption on the large physical differences between a cooling water intake and a hydropower intake. The cooling water intake at the Greene County Steam Plant is located at the terminus of a 600 foot long intake canal from Demopolis Reservoir on the Black Warrior River. The intake area is separated into three bays approximately 11 feet wide by 32 feet tall. Water is withdrawn from the surface to bottom of the structures and studies by Alabama Power reported that the maximum intake capacity for this structure is 673 cfs with an intake velocity of 1.34 ft/sec at the intake screens. Therefore the flow in the intake canal is relatively slow and the canal could likely become inhabited by mussels. The Holt intake is located in the main channel of the Warrior River. The depth of the forebay is approximately 75 feet deep and the penstock is approximately 81.5 feet wide by 40 feet deep. Flows enter the penstock from the surface to approximately 15 feet above the substrate. The turbine has a minimum hydraulic capacity of 1,000 cfs, and maximum hydraulic capacity of 11,200 cfs with a maximum intake velocity of approximately 4 ft/sec. Because the penstock intake is more surface oriented, the probability of entraining a mussel is not as likely as a cooling water intake. Hydropower sites do not typically have bio-fouling as a result of mussels or clams and none have been noted at the Holt facility. Also as USFWS notes, the inflated heelsplitter was not detected in the vicinity of the Holt Project. Although they may be present in the system, their population densities are apparently very low, which would also diminish their chances of entrainment. Estimates of turbine mortality for freshwater drum are presented in Table 15 of the Holt Entrainment Report. The study estimated that approximately 438 freshwater drum are killed by turbine mortality at the Project annually. From: "Greene, Chris" <[email protected]<mailto:[email protected]>> Date: December 16, 2011 3:42:19 PM CST To: "Powers, Jason" <[email protected]<mailto:[email protected]>> Cc: "Cook, Stan" <[email protected]<mailto:[email protected]>>, "'[email protected]<mailto:[email protected]>'" <[email protected]<mailto:[email protected]>>, "Haffner, Jay" <[email protected]<mailto:[email protected]>> Subject: RE: Draft Holt Fish Entrainment and Turbine Mortality Study Jason, The Alabama Department of Conservation and Natural Resources (Fisheries Section) has reviewed the Draft Holt Fish Entrainment and Turbine Mortality Study and provides the following comments:
1) The Family Moronidae (white bass, hybrid striped bass, and striped bass) is missing from Table 2.
Alabama Power Response: Alabama Power reviewed Table 2 to determine the inconsistency. On February 28, 2011, the ADCNR (Chris Greene & Andrew Henderson) provided a table of species that should be present at the Holt site. The family Moronidae was not in that table. However, ADCNR (Chris Greene)
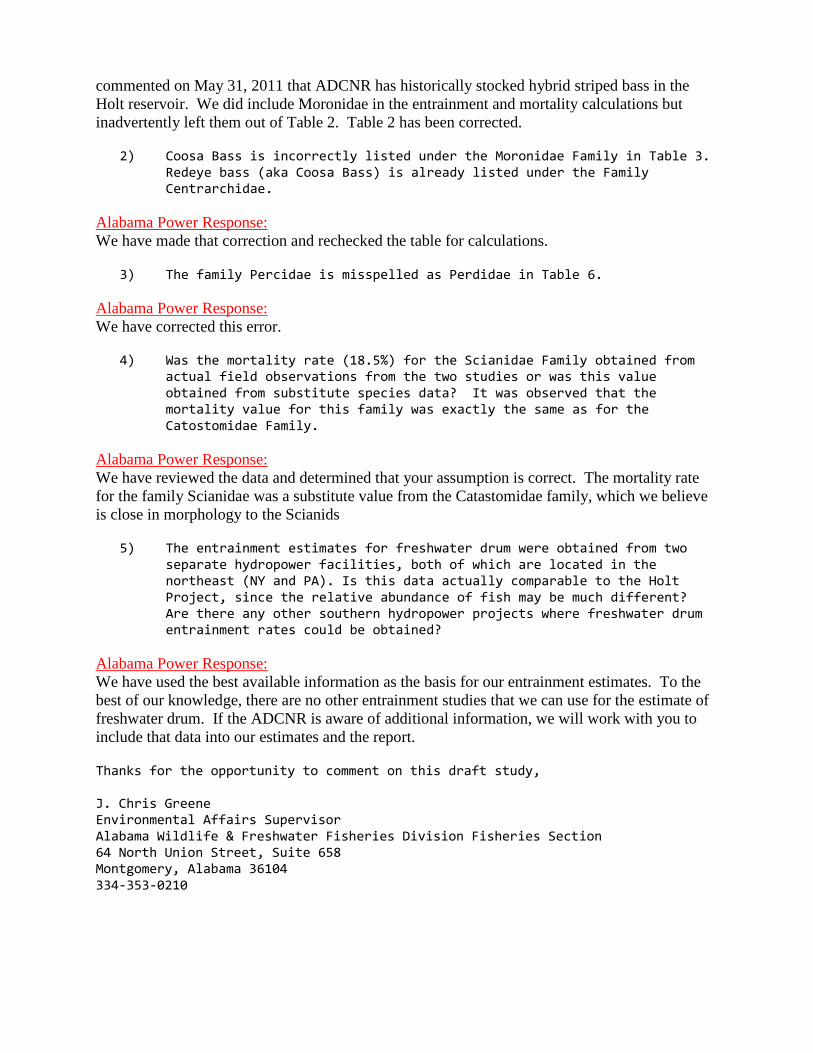
commented on May 31, 2011 that ADCNR has historically stocked hybrid striped bass in the Holt reservoir. We did include Moronidae in the entrainment and mortality calculations but inadvertently left them out of Table 2. Table 2 has been corrected.
2) Coosa Bass is incorrectly listed under the Moronidae Family in Table 3. Redeye bass (aka Coosa Bass) is already listed under the Family Centrarchidae.
Alabama Power Response: We have made that correction and rechecked the table for calculations.
3) The family Percidae is misspelled as Perdidae in Table 6.
Alabama Power Response: We have corrected this error.
4) Was the mortality rate (18.5%) for the Scianidae Family obtained from
actual field observations from the two studies or was this value obtained from substitute species data? It was observed that the mortality value for this family was exactly the same as for the Catostomidae Family.
Alabama Power Response: We have reviewed the data and determined that your assumption is correct. The mortality rate for the family Scianidae was a substitute value from the Catastomidae family, which we believe is close in morphology to the Scianids
5) The entrainment estimates for freshwater drum were obtained from two separate hydropower facilities, both of which are located in the northeast (NY and PA). Is this data actually comparable to the Holt Project, since the relative abundance of fish may be much different? Are there any other southern hydropower projects where freshwater drum entrainment rates could be obtained?
Alabama Power Response: We have used the best available information as the basis for our entrainment estimates. To the best of our knowledge, there are no other entrainment studies that we can use for the estimate of freshwater drum. If the ADCNR is aware of additional information, we will work with you to include that data into our estimates and the report. Thanks for the opportunity to comment on this draft study, J. Chris Greene Environmental Affairs Supervisor Alabama Wildlife & Freshwater Fisheries Division Fisheries Section 64 North Union Street, Suite 658 Montgomery, Alabama 36104 334-353-0210

APPENDIX E
ANNUAL AND MONTHLY FLOW DURATION CURVES
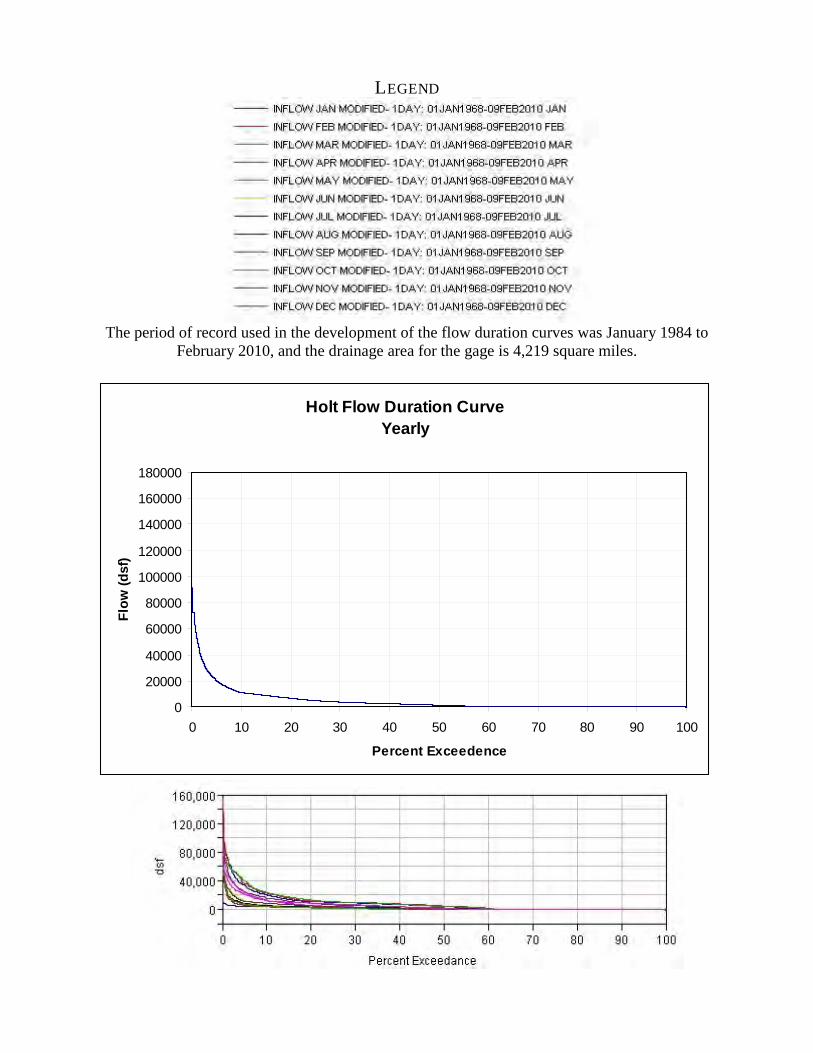
LEGEND
The period of record used in the development of the flow duration curves was January 1984 to
February 2010, and the drainage area for the gage is 4,219 square miles.
Holt Flow Duration CurveYearly
0
20000
40000
60000
80000
100000
120000
140000
160000
180000
0 10 20 30 40 50 60 70 80 90 100
Percent Exceedence
Flow
(dsf
)
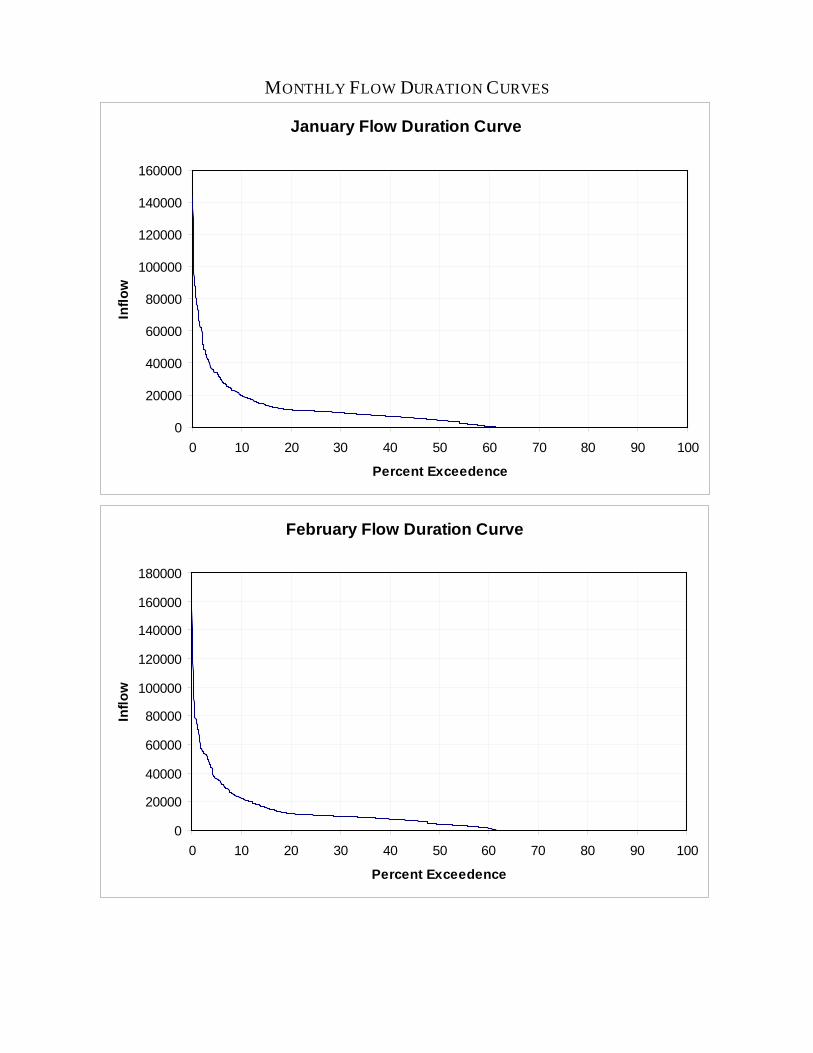
MONTHLY FLOW DURATION CURVES
January Flow Duration Curve
0
20000
40000
60000
80000
100000
120000
140000
160000
0 10 20 30 40 50 60 70 80 90 100
Percent Exceedence
Inflo
w
February Flow Duration Curve
0
20000
40000
60000
80000
100000
120000
140000
160000
180000
0 10 20 30 40 50 60 70 80 90 100
Percent Exceedence
Inflo
w
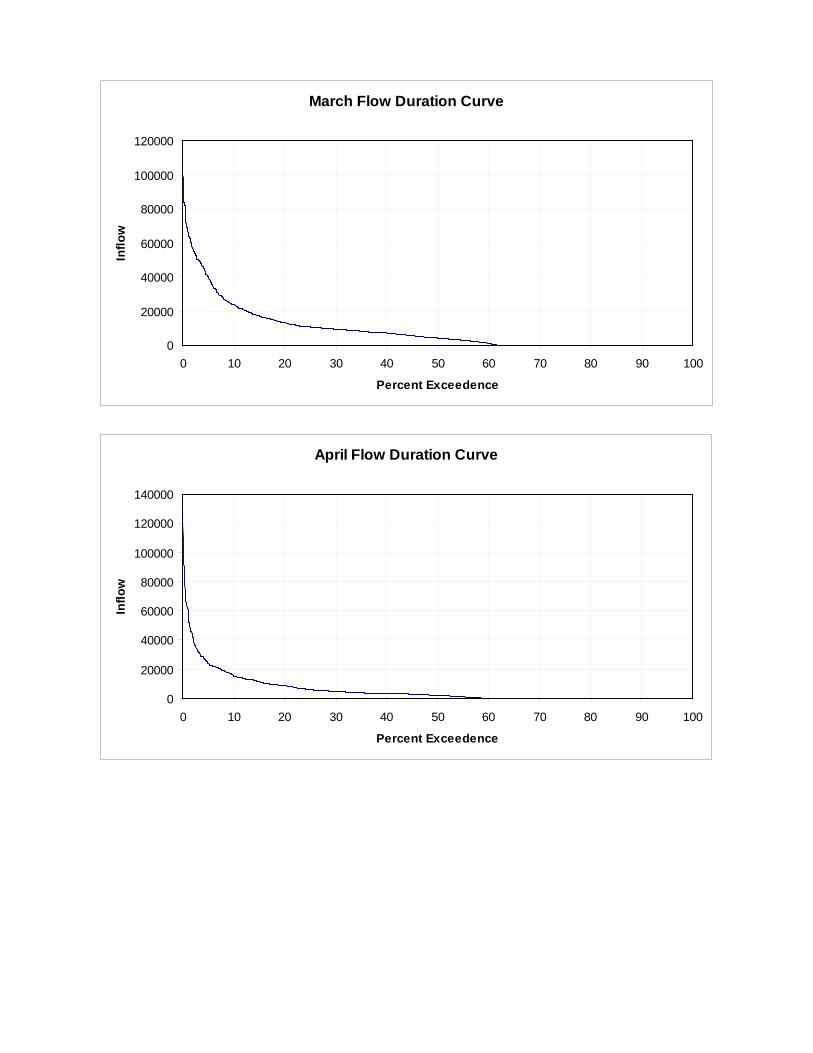
March Flow Duration Curve
0
20000
40000
60000
80000
100000
120000
0 10 20 30 40 50 60 70 80 90 100
Percent Exceedence
Inflo
w
April Flow Duration Curve
0
20000
40000
60000
80000
100000
120000
140000
0 10 20 30 40 50 60 70 80 90 100
Percent Exceedence
Inflo
w
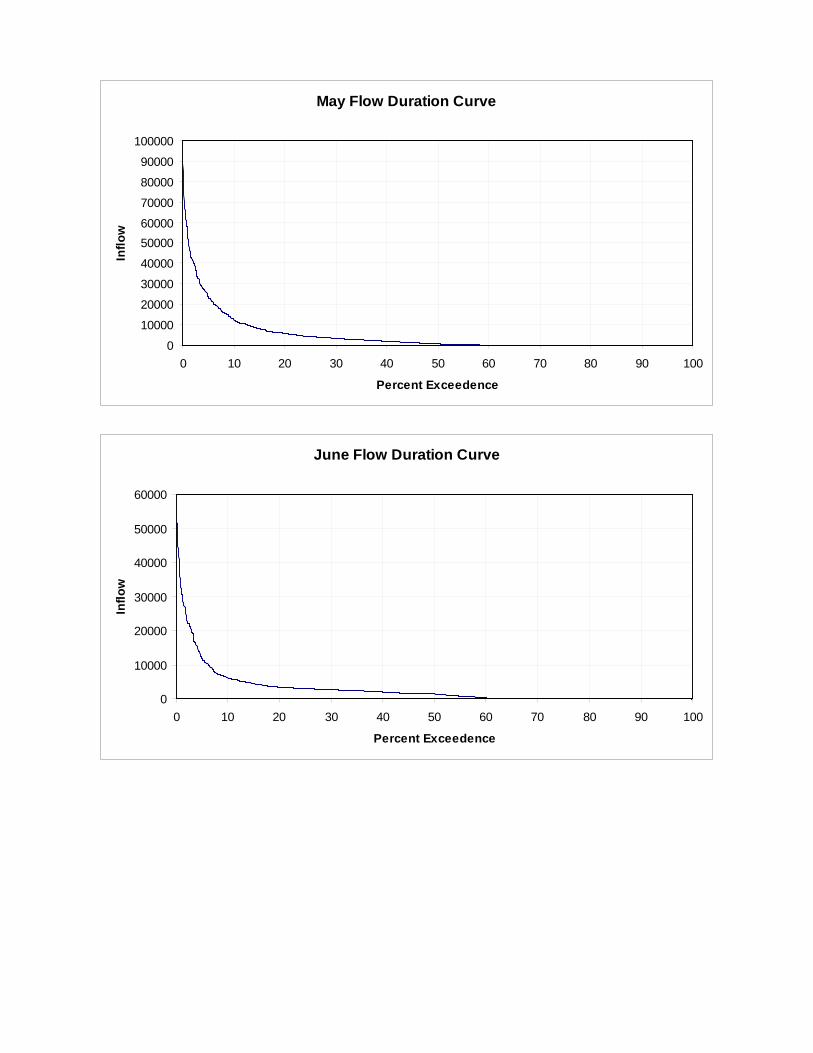
May Flow Duration Curve
0
10000
20000
30000
40000
5000060000
70000
80000
90000
100000
0 10 20 30 40 50 60 70 80 90 100
Percent Exceedence
Inflo
w
June Flow Duration Curve
0
10000
20000
30000
40000
50000
60000
0 10 20 30 40 50 60 70 80 90 100
Percent Exceedence
Inflo
w
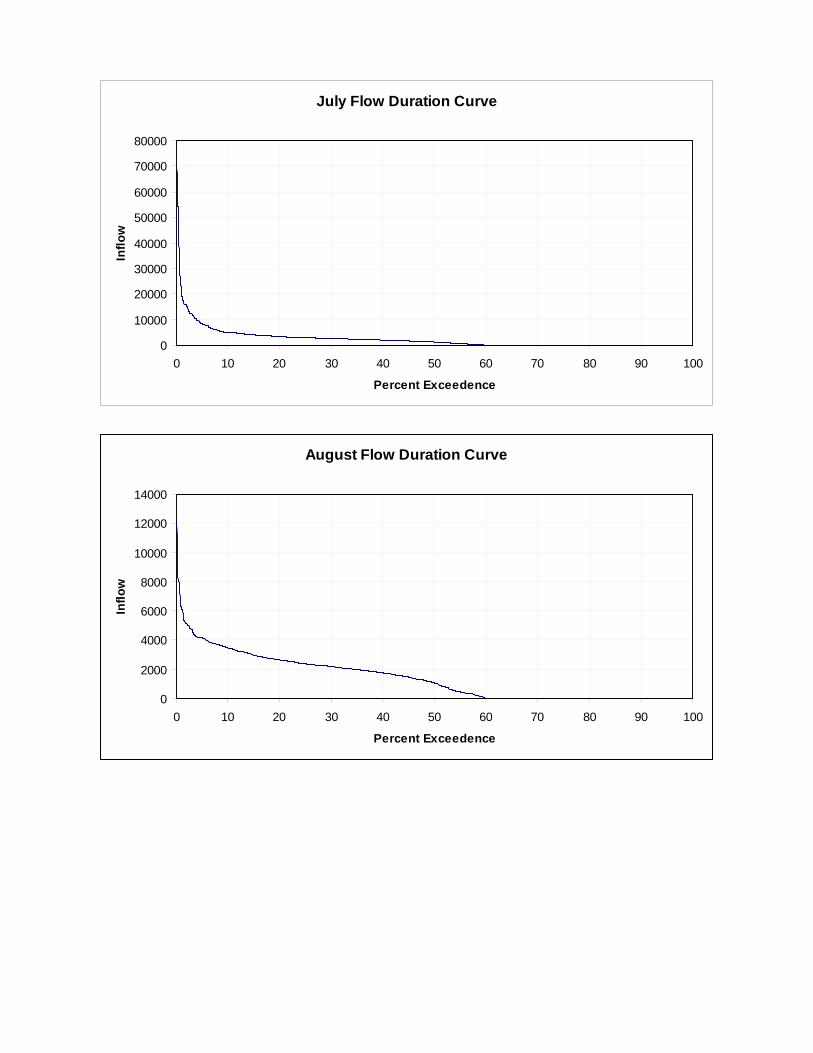
July Flow Duration Curve
0
10000
20000
30000
40000
50000
60000
70000
80000
0 10 20 30 40 50 60 70 80 90 100
Percent Exceedence
Inflo
w
August Flow Duration Curve
0
2000
4000
6000
8000
10000
12000
14000
0 10 20 30 40 50 60 70 80 90 100
Percent Exceedence
Inflo
w
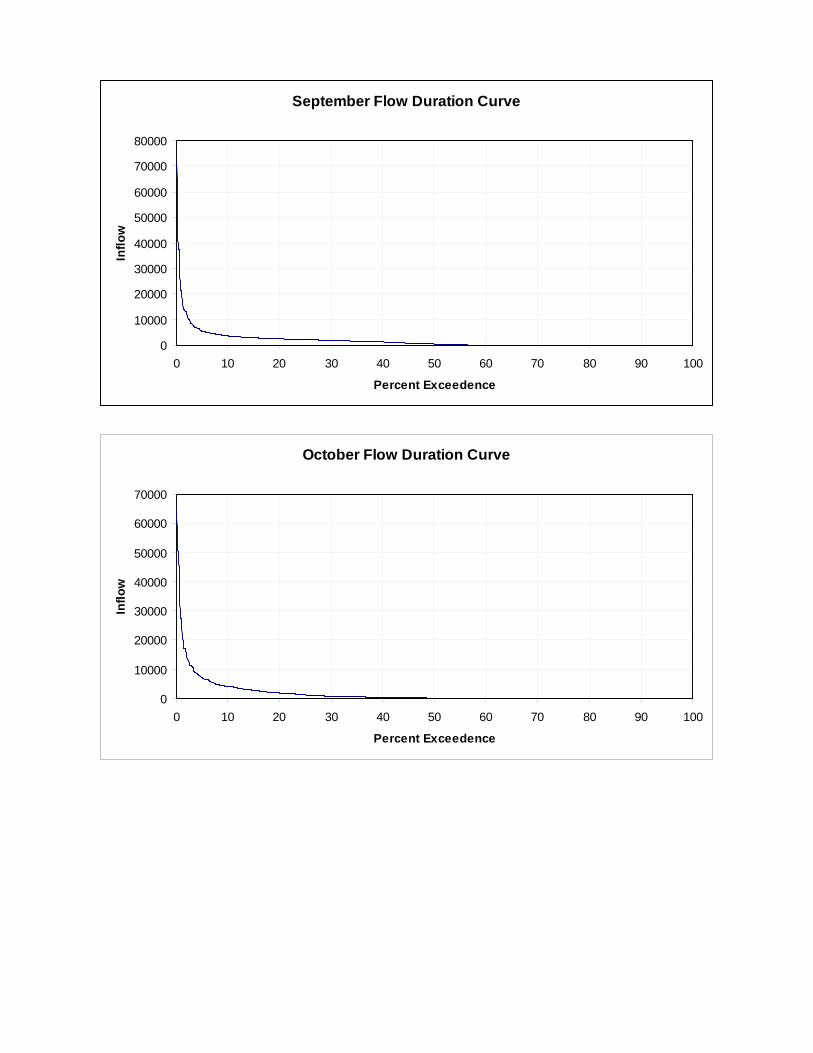
September Flow Duration Curve
0
10000
20000
30000
40000
50000
60000
70000
80000
0 10 20 30 40 50 60 70 80 90 100
Percent Exceedence
Inflo
w
October Flow Duration Curve
0
10000
20000
30000
40000
50000
60000
70000
0 10 20 30 40 50 60 70 80 90 100
Percent Exceedence
Inflo
w

November Flow Duration Curve
0
10000
20000
30000
40000
50000
60000
70000
80000
90000
0 10 20 30 40 50 60 70 80 90 100
Percent Exceedence
Inflo
w
December Flow Duration Curve
0
10000
20000
30000
40000
50000
60000
70000
80000
90000
0 10 20 30 40 50 60 70 80 90 100
Percent Exceedence
Inflo
w