f i n a n c i a l r e s u lt s - jpmorgan chase · 3q16 2q16 3q15 basel iii advanced fully...
TRANSCRIPT

F I N A N C I A L R E S U L T S
3Q16
October 14, 2016

1 See note 6 on slide 14 2 Represents estimated common equity Tier 1 (“CET1”) capital and ratio under the Basel III Fully Phased-In capital
rules to which the Firm will be subject as of January 1, 2019. See note 7 on slide 14 3 Last twelve months (“LTM”). Net of employee issuance
4 See note 1 on slide 14 5 See note 2 on slide 14 6 See note 8 on slide 14 7 Net of employee issuance
3Q16 net income of $6.3B and EPS of $1.58
Managed revenue of $25.5B4
Adjusted expense of $14.5B5 and adjusted overhead ratio of 57%5
Fortress balance sheet
Average core loans6 up 15% YoY and 2% QoQ
Basel III Fully Phased-In CET1 capital of $181B2, Advanced CET1 ratio of 11.9%2 and Standardized CET1
ratio of 12.1%2
Delivered strong capital return
$3.8B7 returned to shareholders in 3Q16, including $2.1B of net repurchases
Common dividend of $0.48 per share
ROTCE1
13%
Net payout LTM3
63%
Common equity Tier 12
11.9%
3Q16 Financial highlights
FIN
AN
CIA
L R
ES
UL
TS
1

Note: Totals may not sum due to rounding 1 See note 1 on slide 14 2 Actual numbers for all periods, not over/(under) 3 See note 6 on slide 14 4 See note 2 on slide 14
$B, excluding EPS
3Q16 Financial results1
Firm NII up $700mm YoY and $250mm QoQ with NIM relatively flat QoQ
FIN
AN
CIA
L R
ES
UL
TS
2
3Q16 ROE O/H ratio
CCB 16% 57%
CIB 17% 52%
CB 18% 40%
AM 24% 70%
$ O/(U)
3Q16 2Q16 3Q15
Net interest income $11.9 $0.3 $0.7
Noninterest revenue 13.6 – 1.3
Managed revenue1 25.5 0.3 2.0
Expense 14.5 0.8 (0.9)
Credit costs 1.3 (0.1) 0.6
Reported net income $6.3 $0.1 ($0.5)
Net income applicable to common stockholders $5.7 $0.1 ($0.5)
Reported EPS $1.58 $0.03 ($0.10)
ROE2 10% 10% 12%
ROTCE2,3 13 13 15
Overhead ratio – managed1,2 57 54 65
Memo: Adjusted expense4
$14.5 $0.5 $0.5
Memo: Adjusted overhead ratio1,2,4
57% 56% 60%
Change in reserves
3Q16: $150mm build
3Q15: $(281)mm release
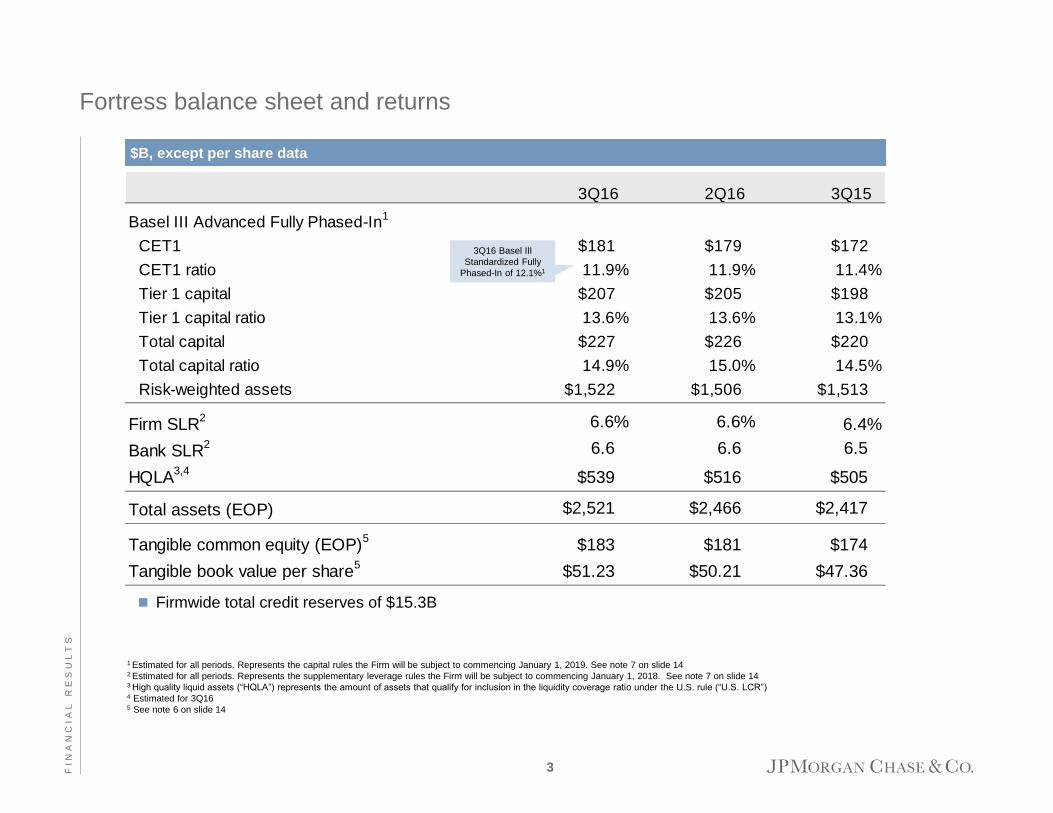
3Q16 2Q16 3Q15
Basel III Advanced Fully Phased-In1
CET1 $181 $179 $172
CET1 ratio 11.9% 11.9% 11.4%
Tier 1 capital $207 $205 $198
Tier 1 capital ratio 13.6% 13.6% 13.1%
Total capital $227 $226 $220
Total capital ratio 14.9% 15.0% 14.5%
Risk-weighted assets $1,522 $1,506 $1,513
Firm SLR2 6.6% 6.6% 6.4%
Bank SLR2 6.6 6.6 6.5
HQLA3,4
$539 $516 $505
Total assets (EOP) $2,521 $2,466 $2,417
Tangible common equity (EOP)5
$183 $181 $174
Tangible book value per share5
$51.23 $50.21 $47.36
$B, except per share data
Firmwide total credit reserves of $15.3B
1 Estimated for all periods. Represents the capital rules the Firm will be subject to commencing January 1, 2019. See note 7 on slide 14 2 Estimated for all periods. Represents the supplementary leverage rules the Firm will be subject to commencing January 1, 2018. See note 7 on slide 14
3 High quality liquid assets (“HQLA”) represents the amount of assets that qualify for inclusion in the liquidity coverage ratio under the U.S. rule (“U.S. LCR”) 4 Estimated for 3Q16 5 See note 6 on slide 14
3Q16 Basel III
Standardized Fully
Phased-In of 12.1%1
Fortress balance sheet and returns
FIN
AN
CIA
L R
ES
UL
TS
3
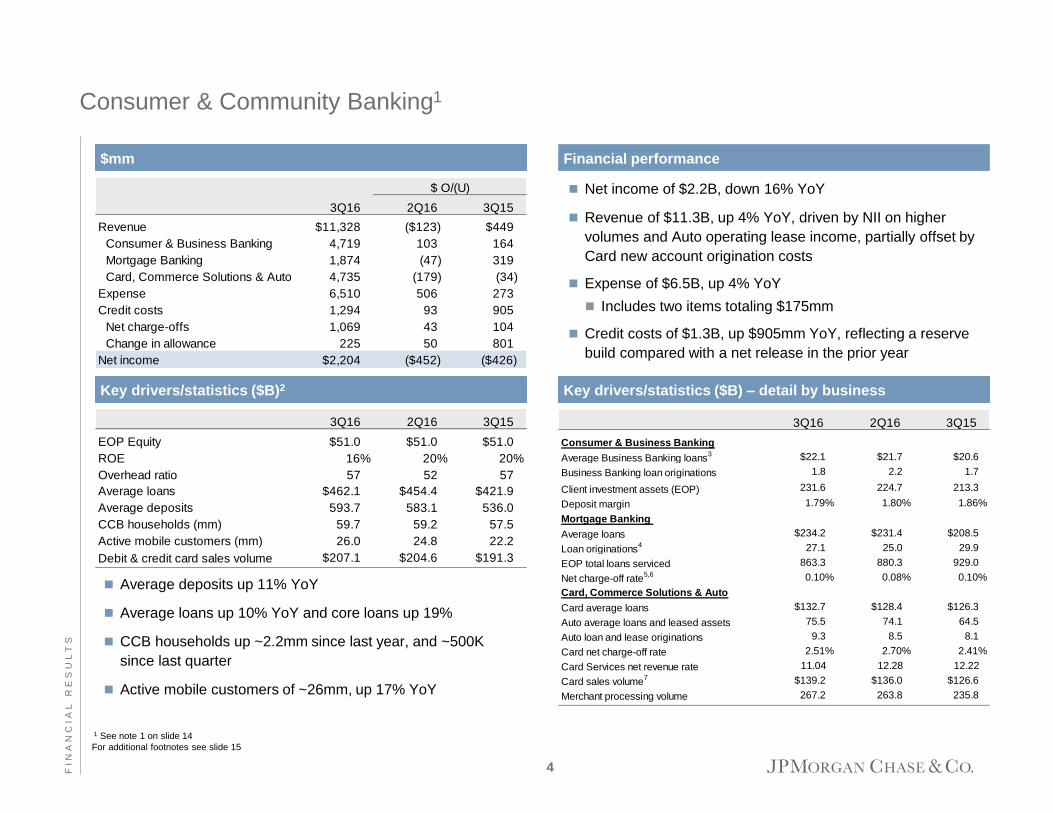
3Q16 2Q16 3Q15
Consumer & Business Banking
Average Business Banking loans3 $22.1 $21.7 $20.6
Business Banking loan originations 1.8 2.2 1.7
Client investment assets (EOP) 231.6 224.7 213.3
Deposit margin 1.79% 1.80% 1.86%
Mortgage Banking
Average loans $234.2 $231.4 $208.5
Loan originations4 27.1 25.0 29.9
EOP total loans serviced 863.3 880.3 929.0
Net charge-off rate5,6 0.10% 0.08% 0.10%
Card, Commerce Solutions & Auto
Card average loans $132.7 $128.4 $126.3
Auto average loans and leased assets 75.5 74.1 64.5
Auto loan and lease originations 9.3 8.5 8.1
Card net charge-off rate 2.51% 2.70% 2.41%
Card Services net revenue rate 11.04 12.28 12.22
Card sales volume7 $139.2 $136.0 $126.6
Merchant processing volume 267.2 263.8 235.8
3Q16 2Q16 3Q15
EOP Equity $51.0 $51.0 $51.0
ROE 16% 20% 20%
Overhead ratio 57 52 57
Average loans $462.1 $454.4 $421.9
Average deposits 593.7 583.1 536.0
CCB households (mm) 59.7 59.2 57.5
Active mobile customers (mm) 26.0 24.8 22.2
Debit & credit card sales volume $207.1 $204.6 $191.3
$ O/(U)
3Q16 2Q16 3Q15
Revenue $11,328 ($123) $449
Consumer & Business Banking 4,719 103 164
Mortgage Banking 1,874 (47) 319
Card, Commerce Solutions & Auto 4,735 (179) (34)
Expense 6,510 506 273
Credit costs 1,294 93 905
Net charge-offs 1,069 43 104
Change in allowance 225 50 801
Net income $2,204 ($452) ($426)
Key drivers/statistics ($B) – detail by business
Consumer & Community Banking1
$mm
Net income of $2.2B, down 16% YoY
Revenue of $11.3B, up 4% YoY, driven by NII on higher
volumes and Auto operating lease income, partially offset by
Card new account origination costs
Expense of $6.5B, up 4% YoY
Includes two items totaling $175mm
Credit costs of $1.3B, up $905mm YoY, reflecting a reserve
build compared with a net release in the prior year
Financial performance
Key drivers/statistics ($B)2
1 See note 1 on slide 14
For additional footnotes see slide 15
Average deposits up 11% YoY
Average loans up 10% YoY and core loans up 19%
CCB households up ~2.2mm since last year, and ~500K
since last quarter
Active mobile customers of ~26mm, up 17% YoY
FIN
AN
CIA
L R
ES
UL
TS
4

Corporate & Investment Bank1
$mm Financial performance
1 See note 1 on slide 14 2 Actual numbers for all periods, not over/(under) 3 Client deposits and other third party liabilities pertain to the Treasury Services and Securities Services
businesses 4 ALL/EOP loans as reported was 1.38%, 1.48%, and 1.19% for 3Q16, 2Q16, and 3Q15, respectively 5 See note 4 on slide 14 6 See note 8 on slide 15
Net income of $2.9B on revenue of $9.5B
ROE of 17%
Banking revenue
IB revenue of $1.7B, up 14% YoY, driven by strong
performance across all products
– Ranked #1 in Global IB fees for 3Q16
Treasury Services revenue of $917mm, up 2% YoY
Lending revenue of $283mm, down 15% YoY
Markets & Investor Services revenue
Markets revenue of $5.7B, up 33% YoY
– Fixed Income Markets of $4.3B, up 48% YoY, driven by
higher revenue in Rates, Credit and Securitized Products
– Equity Markets revenue of $1.4B, up 1% YoY
Securities Services revenue of $916mm, flat YoY
Credit Adjustments & Other, a loss of $149mm
Expense of $4.9B, down 20% YoY, driven by lower legal expense
Credit costs of $67mm driven by reserve builds in Oil & Gas
FIN
AN
CIA
L R
ES
UL
TS
5
$ O/(U)
3Q16 2Q16 3Q15
Corporate & Investment Bank revenue $9,455 $290 $1,287
Investment banking revenue 1,740 248 210
Treasury Services 917 25 18
Lending 283 6 (51)
Total Banking 2,940 279 177
Fixed Income Markets 4,334 375 1,401
Equity Markets 1,414 (186) 11
Securities Services 916 9 1
Credit Adjustments & Other (149) (187) (303)
Total Markets & Investor Services 6,515 11 1,110
Expense 4,934 (144) (1,197)
Credit costs 67 (168) (165)
Net income $2,912 $419 $1,448
Key drivers/statistics ($B)2
EOP equity $64.0 $64.0 $62.0
ROE 17% 15% 8%
Overhead ratio 52 55 75
Comp/revenue 27 30 30
IB fees ($mm) $1,855 $1,636 $1,612
Average loans 114.8 114.8 101.3
Average client deposits3 381.5 373.7 372.1
Assets under custody ($T) 21.2 20.5 19.7
ALL/EOP loans ex-conduits and trade4,5 2.02% 2.23% 1.85%
Net charge-off/(recovery) rate 0.01 0.32 0.01
Average VaR ($mm)6 $43 $44 $57

3Q16 2Q16 3Q15
Revenue2 $1,870 $53 $226
Middle Market Banking 716 18 48
Corporate Client Banking 612 13 128
Commercial Term Lending 350 8 32
Real Estate Banking 117 10 25
Other 75 4 (7)
Expense 746 15 27
Credit costs (121) (96) (203)
Net income $778 $82 $260
Key drivers/statistics ($B)3
EOP equity $16.0 $16.0 $14.0
ROE 18% 16% 14%
Overhead ratio 40 40 44
Gross IB Revenue ($mm) $600 $595 $382
Average loans 181.5 176.8 159.2
Average client deposits 173.7 170.7 180.9
Allowance for loan losses 2.9 3.0 2.8
Nonaccrual loans 1.2 1.3 0.4
Net charge-off/(recovery) rate4 0.10% 0.14% –
ALL/loans4 1.54 1.70 1.71
$ O/(U)
$mm
Commercial Banking1
Record net income of $778mm, up 50% YoY and 12% QoQ
Revenue of $1.9B, up 14% YoY and 3% QoQ
Gross IB Revenue of $600mm, up 57% YoY
Expense of $746mm, up 4% YoY and 2% QoQ
Credit costs net benefit of $121mm driven by reserve releases
largely in Oil & Gas
Net charge-off rate of 10 bps
Average loan balances of $181B, up 14% YoY and 3% QoQ
C&I5 loans up 10% YoY and 1% QoQ
CRE5 loans up 19% YoY and 5% QoQ
Average client deposits of $174B, down 4% YoY largely
reflecting the reduction in non-operating deposits
1 See note 1 on slide 14 2 Certain clients were transferred from Middle Market Banking to Corporate Client Banking and from
Real Estate Banking to Corporate Client Banking effective in the second quarter and third quarter of
2016, respectively. Prior period revenue was revised to conform with the current period presentation 3 Actual numbers for all periods, not over/(under) 4 Loans held-for-sale and loans at fair value were excluded when calculating the net charge-
off/(recovery) rate and loan loss coverage ratio 5 CB’s Commercial and Industrial (C&I) and Commercial Real Estate (CRE) groupings are generally
based on client segments and do not align with regulatory definitions
Financial performance
6 FIN
AN
CIA
L R
ES
UL
TS
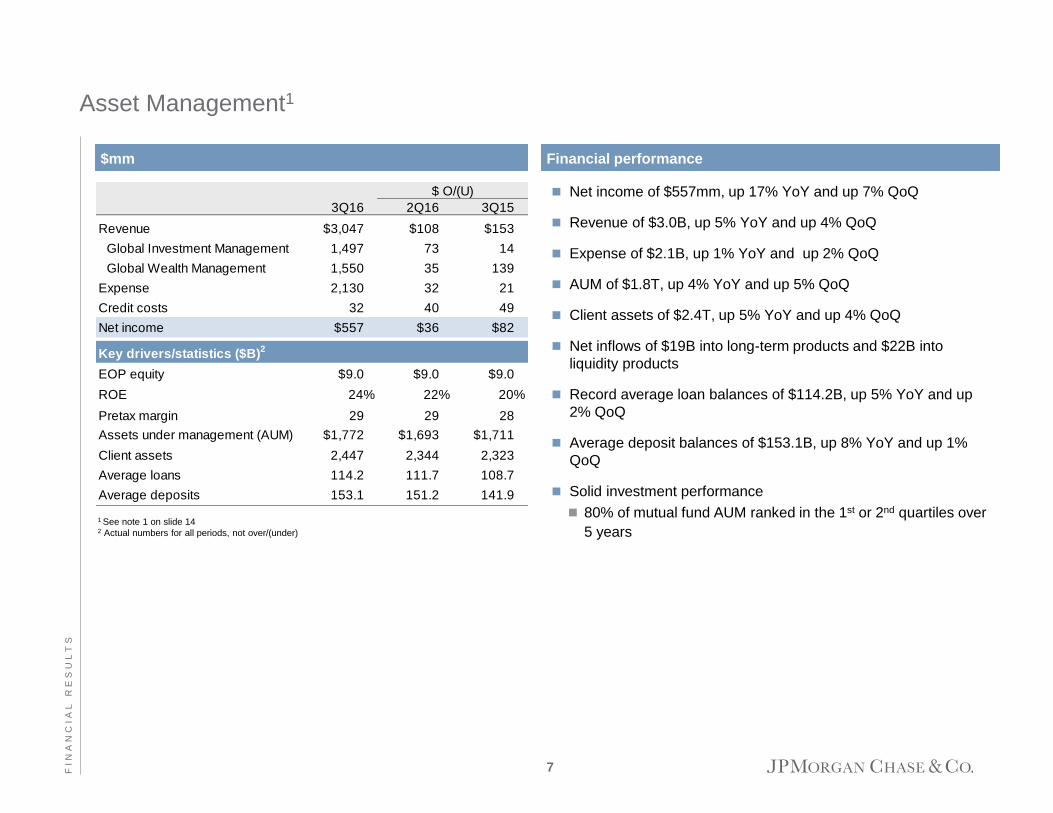
3Q16 2Q16 3Q15
Revenue $3,047 $108 $153
Global Investment Management 1,497 73 14
Global Wealth Management 1,550 35 139
Expense 2,130 32 21
Credit costs 32 40 49
Net income $557 $36 $82
Key drivers/statistics ($B)2
EOP equity $9.0 $9.0 $9.0
ROE 24% 22% 20%
Pretax margin 29 29 28
Assets under management (AUM) $1,772 $1,693 $1,711
Client assets 2,447 2,344 2,323
Average loans 114.2 111.7 108.7
Average deposits 153.1 151.2 141.9
$ O/(U)
Asset Management1
1 See note 1 on slide 14 2 Actual numbers for all periods, not over/(under)
Net income of $557mm, up 17% YoY and up 7% QoQ
Revenue of $3.0B, up 5% YoY and up 4% QoQ
Expense of $2.1B, up 1% YoY and up 2% QoQ
AUM of $1.8T, up 4% YoY and up 5% QoQ
Client assets of $2.4T, up 5% YoY and up 4% QoQ
Net inflows of $19B into long-term products and $22B into
liquidity products
Record average loan balances of $114.2B, up 5% YoY and up
2% QoQ
Average deposit balances of $153.1B, up 8% YoY and up 1%
QoQ
Solid investment performance
80% of mutual fund AUM ranked in the 1st or 2nd quartiles over
5 years
$mm Financial performance
7 FIN
AN
CIA
L R
ES
UL
TS

3Q16 2Q16 3Q15
Treasury and CIO ($208) ($9) ($168)
Other Corporate 43 10 (1,714)
Net income/(loss) ($165) $1 ($1,882)
$ O/(U)
Corporate1
Treasury and CIO
Net loss of $208mm, compared to a net loss of $199mm in 2Q16
Other Corporate
Net income of $43mm
Prior year results included tax benefits of $1.9B 1 See note 1 on slide 14
$mm Financial performance
8 FIN
AN
CIA
L R
ES
UL
TS

Outlook
FIN
AN
CIA
L R
ES
UL
TS
9
Firmwide
Expect 4Q16 net interest income to be up modestly QoQ
on continued strength in loan growth
Expect 2016 adjusted expense to be ~$56B with 4Q16
adjusted expense approximately flat YoY
Expect 2016 net charge-offs to be ≤$4.75B, with the YoY
increase driven by both loan growth and Oil & Gas
Corporate & Investment Bank
Expect 4Q16 Securities Services revenue to be
~$875mm, market dependent

Page
Agenda
FIN
AN
CIA
L R
ES
UL
TS
Appendix 10
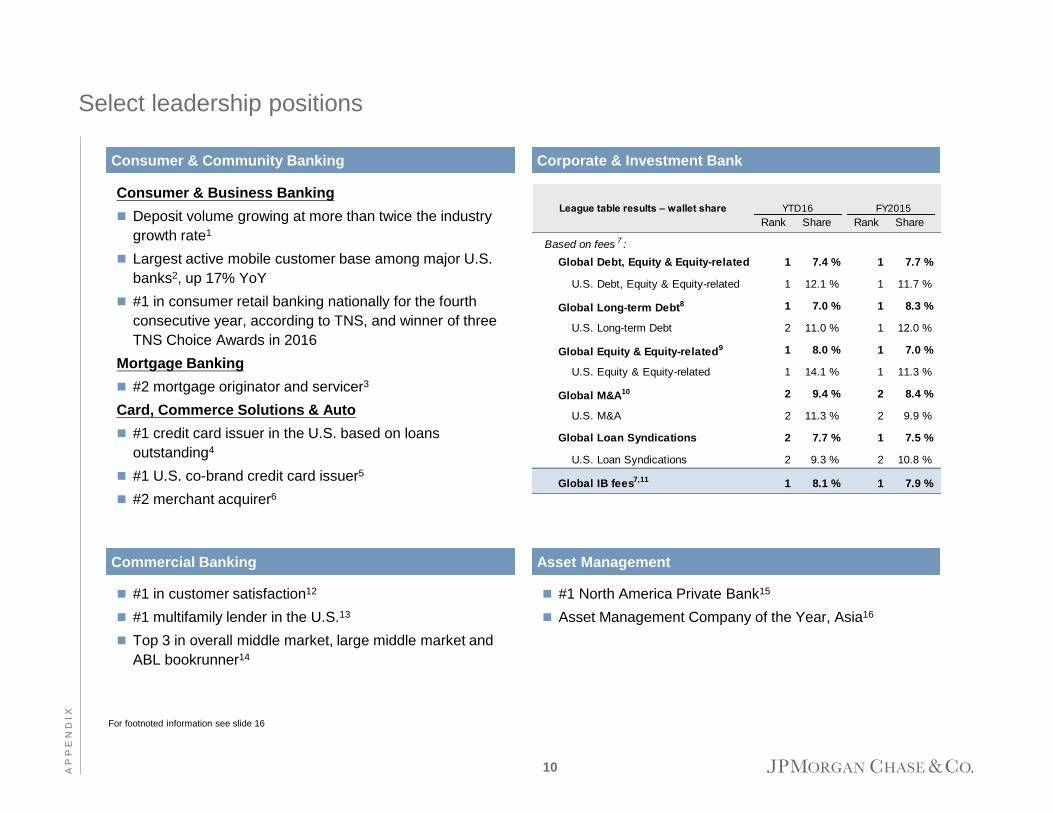
League table results – wallet share YTD16 FY2015
Rank Share Rank Share
Based on fees 7 :
Global Debt, Equity & Equity-related 1 7.4 % 1 7.7 %
U.S. Debt, Equity & Equity-related 1 12.1 % 1 11.7 %
Global Long-term Debt8 1 7.0 % 1 8.3 %
U.S. Long-term Debt 2 11.0 % 1 12.0 %
Global Equity & Equity-related9 1 8.0 % 1 7.0 %
U.S. Equity & Equity-related 1 14.1 % 1 11.3 %
Global M&A10 2 9.4 % 2 8.4 %
U.S. M&A 2 11.3 % 2 9.9 %
Global Loan Syndications 2 7.7 % 1 7.5 %
U.S. Loan Syndications 2 9.3 % 2 10.8 %
Global IB fees7,11 1 8.1 % 1 7.9 %
Select leadership positions
Corporate & Investment Bank Consumer & Community Banking
Consumer & Business Banking
Deposit volume growing at more than twice the industry
growth rate1
Largest active mobile customer base among major U.S.
banks2, up 17% YoY
#1 in consumer retail banking nationally for the fourth
consecutive year, according to TNS, and winner of three
TNS Choice Awards in 2016
Mortgage Banking
#2 mortgage originator and servicer3
Card, Commerce Solutions & Auto
#1 credit card issuer in the U.S. based on loans
outstanding4
#1 U.S. co-brand credit card issuer5
#2 merchant acquirer6
For footnoted information see slide 16
Asset Management Commercial Banking
#1 in customer satisfaction12
#1 multifamily lender in the U.S.13
Top 3 in overall middle market, large middle market and
ABL bookrunner14
#1 North America Private Bank15
Asset Management Company of the Year, Asia16
AP
PE
ND
IX
10

Consumer credit – Delinquency trends1
Note: Home equity and residential mortgage exclude Asset Management, Corporate and government-insured loans 1 Excluding purchased credit-impaired and held-for-sale loans 2 Residential mortgage includes prime (including option adjustable rate mortgages (“ARMs”)) and subprime loans 3 Excluding dealer commercial services and operating lease assets
Residential mortgage delinquency trend ($mm)2 Home equity delinquency trend ($mm)
Credit card delinquency trend ($mm)
AP
PE
ND
IX
$0
$500
$1,000
$1,500
$2,000
$2,500
Sep-12 Mar-13 Sep-13 Mar-14 Sep-14 Mar-15 Sep-15 Mar-16 Sep-16
30 – 149 day delinquencies
150+ day delinquencies
$0
$500
$1,000
$1,500
$2,000
$2,500
$3,000
$3,500
$4,000
Sep-12 Mar-13 Sep-13 Mar-14 Sep-14 Mar-15 Sep-15 Mar-16 Sep-16
30 – 149 day delinquencies
150+ day delinquencies
$0
$500
$1,000
$1,500
$2,000
$2,500
$3,000
$3,500
$4,000
$4,500
Sep-12 Mar-13 Sep-13 Mar-14 Sep-14 Mar-15 Sep-15 Mar-16 Sep-16
30+ day delinquencies 30-89 day delinquencies
11
Auto delinquency trend ($mm)3
$0
$500
$1,000
$1,500
$2,000
Sep-12 Mar-13 Sep-13 Mar-14 Sep-14 Mar-15 Sep-15 Mar-16 Sep-16
30+ day delinquencies 60-119 day delinquencies

O/(U)
3Q16 2Q16 3Q15 3Q15
Mortgage Banking (NCI)
Net charge-offs $49 $38 $41 $8
NCO rate 0.10% 0.08% 0.10% – bps
Allowance for loan losses $1,488 $1,488 $1,588 ($100)
ALL/annualized NCOs2759% 979% 968%
ALL/nonaccrual loans retained 36% 35% 33%
Card Services
Net charge-offs $838 $860 $759 $79
NCO rate 2.51% 2.70% 2.41% 10 bps
Allowance for loan losses $3,884 $3,684 $3,434 $450
ALL/annualized NCOs2116% 107% 113%
Mortgage Banking and Card Services – Coverage ratios1
Mortgage Banking and Card Services credit data ($mm)
1 See note 5 on slide 14
2 Net charge-offs annualized (NCOs are multiplied by 4)
3 2Q12 adjusted net charge-offs for Card Services were $1,254mm or 4.05%; excluding the effect of a change in charge-off policy for troubled debt restructurings, 2Q12 reported net charge-offs were $1,345mm or 4.35% 4 3Q12 adjusted net charge-offs for Mortgage Banking exclude the effect of an incremental $825mm of net charge-offs based on regulatory guidance 5 4Q12 adjusted net charge-offs for Mortgage Banking reflects a full quarter of normalized Chapter 7 Bankruptcy discharge activity, which exclude one-time adjustments related to the adoption of Chapter 7 Bankruptcy discharge regulatory guidance 6 4Q14 adjusted net charge-offs for Card Services were $797mm or 2.48% excluding losses from portfolio exits; 4Q14 reported net charge-offs were $858mm or 2.69%
AP
PE
ND
IX
NCOs ($mm)
877 808 697
599 534
452 293
206 168
177 112
81 113 104 81
41 59 60 38 49
1,390 1,386 1,254
1,116 1,097 1,082 1,014
892 891 888 885 798 797 789 800 759 774 830 860 838
$0
$1,000
$2,000
4Q11 1Q12 2Q12 3Q12 4Q12 1Q13 2Q13 3Q13 4Q13 1Q14 2Q14 3Q14 4Q14 1Q15 2Q15 3Q15 4Q15 1Q16 2Q16 3Q16
Mortgage Banking Card Services
3
4 5
6
12

3Q16 2Q16 3Q15
Consumer, ex. credit card
LLR/Total loans 0.93% 0.93% 1.06%
LLR/NPLs 62 59 55
Credit Card
LLR/Total loans 2.91% 2.80% 2.73%
Wholesale
LLR/Total loans 1.21% 1.31% 1.21%
LLR/NPLs 218 234 385
Firmwide
LLR/Total loans 1.37% 1.40% 1.40%
LLR/NPLs (ex. credit card) 109 110 109
LLR/NPLs 164 161 161
Firmwide – Coverage ratios1
$14.2B of loan loss reserves at September 30, 2016, up
$0.7B from $13.5B in the prior year. Both wholesale
and consumer credit quality are relatively stable
Nonperforming loan loss coverage ratio (ex. credit card)
of 109%1
1 See note 3 on slide 14
Comments JPM Credit Summary Comments JPM Credit Summary
AP
PE
ND
IX
$mm $mm
13
7,241 7,017 6,921 6,645 6,616 6,303 7,367 7,178 7,059
14,889 14,185 14,065 13,915 13,466 13,555 13,994 14,227 14,204
0.00%
1.00%
2.00%
3.00%
3Q14 4Q14 1Q15 2Q15 3Q15 4Q15 1Q16 2Q16 3Q16
0%
100%
200%
300%
400%Loan loss reserve Nonperforming retained
loans
Loan loss reserve/Total loans1 Loan loss reserve/NPLs1
Notes on non-GAAP financial measures 1. In addition to analyzing the Firm’s results on a reported basis, management reviews the Firm’s results, including the overhead ratio, and the results of the lines of business
on a “managed” basis, which are non-GAAP financial measures. The Firm’s definition of managed basis starts with the reported U.S. GAAP results and includes certain reclassifications to present total net revenue for the Firm (and each of the business segments) on a fully taxable-equivalent (“FTE”) basis. Accordingly, revenue from investments that receive tax credits and tax-exempt securities is presented in the managed results on a basis comparable to taxable securities and investments. These non-GAAP financial measures allow management to assess the comparability of revenue arising from both taxable and tax-exempt sources. The corresponding income tax impact related to tax-exempt items is recorded within income tax expense. These adjustments have no impact on net income as reported by the Firm as a whole or by the lines of business. For a reconciliation of the Firm’s results from a reported to managed basis, see page 7 of the Earnings Release Financial Supplement.
2. Adjusted expense and adjusted overhead ratio are non-GAAP financial measures. Adjusted expense excludes Firmwide legal expense/(benefit) of $(71) million, $(430) million and $1.3 billion for the three months ended September 30, 2016, June 30, 2016 and September 30, 2015, respectively. The adjusted overhead ratio measures the Firm’s adjusted expense as a percentage of managed revenues. Management believes this information helps investors understand the effect of these items on reported results and provides an alternate presentation of the Firm’s performance.
3. The ratios of the allowance for loan losses to end-of-period loans retained and allowance for loan losses to nonperforming loans exclude the following: loans accounted for at fair value and loans held-for-sale; purchased credit-impaired (“PCI”) loans; and the allowance for loan losses related to PCI loans. Additionally, net charge-offs and net charge-off rates exclude the impact of PCI loans.
4. The ratio of the allowance for loan losses to end-of-period loans is calculated excluding the impact of consolidated Firm-administered multi-seller conduits and trade finance loans, to provide a more meaningful assessment of CIB’s allowance coverage ratio.
5. Net charge-offs for Mortgage Banking and Card Services may be adjusted for significant items, as indicated. These adjusted charge-offs are non-GAAP financial measures used by management to facilitate comparisons with prior periods.
Notes on key performance measures
6. Tangible common equity (“TCE”), return on tangible common equity (“ROTCE”) and tangible book value per share (“TBVPS”), are considered key financial performance
measures. TCE represents the Firm’s common stockholders’ equity (i.e., total stockholders’ equity less preferred stock) less goodwill and identifiable intangible assets (other than MSRs), net of related deferred tax liabilities. For a reconciliation from common stockholders’ equity to TCE, see page 9 of the Earnings Release Financial Supplement. ROTCE measures the Firm’s net income applicable to common equity as a percentage of average TCE. TBVPS represents the Firm’s TCE at period-end divided by common shares at period-end. TCE, ROTCE, and TBVPS are meaningful to the Firm, as well as investors and analysts, in assessing the Firm’s use of equity.
7. Common equity Tier 1 (“CET1”) capital, Tier 1 capital, Total capital, risk-weighted assets (“RWA”) and the CET1, Tier 1 capital and total capital ratios and the supplementary leverage ratio (“SLR”) under the Basel III Fully Phased-In capital rules, to which the Firm will be subject commencing January 1, 2019, are considered key regulatory capital measures. These measures are used by management, bank regulators, investors and analysts to assess and monitor the Firm’s capital position. For additional information on these measures, see Capital Management on pages 149-158 of the Firm’s Annual Report on Form 10-K for the year ended December 31, 2015, and pages 63-69 of the Firm’s Quarterly Report on Form 10-Q for the quarter ended June 30, 2016.
8. Core loans include loans considered central to the Firm’s ongoing businesses; core loans exclude loans classified as trading assets, runoff portfolios, discontinued portfolios and portfolios the Firm has an intent to exit. For further information on total loans and core loans, see pages 3, 12, 16, 19, 21 and 23 of the Earnings Release Financial Supplement.
Notes
AP
PE
ND
IX
14

Additional Notes on slide 4 – Consumer & Community Banking
2. Actual numbers for all periods, not over/(under)
3. Includes predominantly Business Banking loans as well as deposit overdrafts
4. Firmwide mortgage origination volume was $30.9B, $28.6B and $32.2B, for 3Q16, 2Q16 and 3Q15, respectively
5. Excludes purchased credit-impaired (PCI) write-offs of $36mm, $41mm and $52mm for 3Q16, 2Q16, and 3Q15, respectively. See note 3 on slide 14
6. Excludes the impact of PCI loans. See note 3 on slide 14
7. Excludes Commercial Card
Additional Note on slide 5 – Corporate & Investment Bank
8. As part of the Firm’s continuous evaluation and periodic enhancement of its market risk measures, during the third quarter of 2016 the Firm refined the scope of positions
included in risk management VaR. In particular, certain private equity positions in CIB were removed from the VaR calculation. Commencing with the third quarter of 2016,
exposure arising from these positions is captured using other sensitivity-based measures, using a 10% decline in the market value, and will be separately reported in the
Firm's Quarterly Report on Form 10-Q for the quarterly period ended September 30, 2016. The Firm believes this refinement to its reported VaR measures more
appropriately captures the risk of its market risk sensitive positions. This refinement resulted in a reduction in average CIB VaR of $6 million for the three months ended
September 30, 2016.
Notes
AP
PE
ND
IX
15

Notes on slide 10 – Select leadership positions
1. Based on FDIC 2016 Summary of Deposits survey per SNL Financial – excludes branches with greater than $500mm of deposits or identified as non-retail
2. Based on disclosures by peers as of 2Q16
3. Based on Inside Mortgage Finance as of 2Q16 for Servicer and Originator rankings
4. Based on disclosures by peers and internal estimates as of 2Q16
5. Based on Phoenix Credit Card Monitor for 12-month period ending June 2016; based on card accounts, revolving balance dollars and spending dollars
6. Based on Nilson data as of 2015. Chase is the #1 wholly-owned merchant acquirer in the U.S. When volume from JVs and revenue share arrangements are included in
First Data’s volume, First Data holds #1 share position in the U.S.
7. Reflects ranking of revenue wallet and market share. Source: Wallet from Dealogic Media Manager Cortex as of October 3, 2016
8. Long-term debt rankings include investment-grade, high-yield, supranational, sovereigns, agencies, covered bonds, asset-backed securities (“ABS”) and mortgage-backed
securities (“MBS”); and exclude money market, short-term debt and U.S. municipal securities
9. Global Equity and equity-related ranking includes rights offerings and Chinese A-Shares
10. Global M&A reflects the removal of any withdrawn transactions. U.S. M&A revenue wallet represents wallet from client parents based in the U.S.
11. Global Investment Banking fees exclude money market, short-term debt and shelf deals
12. CFO Magazine’s Commercial Banking Survey 2015
13. SNL Financial based on FDIC data as of 2Q16
14. Thomson Reuters as of September 2016 YTD
15. Euromoney 2016 rankings
16. The Asset, June 2016
Notes
AP
PE
ND
IX
16
Forward-looking statements
This presentation contains forward-looking statements within the meaning of the Private Securities
Litigation Reform Act of 1995. These statements are based on the current beliefs and expectations
of JPMorgan Chase & Co.’s management and are subject to significant risks and uncertainties.
Actual results may differ from those set forth in the forward-looking statements. Factors that could
cause JPMorgan Chase & Co.’s actual results to differ materially from those described in the
forward-looking statements can be found in JPMorgan Chase & Co.’s Annual Report on Form 10-K
for the year ended December 31, 2015, and Quarterly Reports on Form 10-Q for the quarters ended
March 31, 2016, and June 30, 2016, which have been filed with the Securities and Exchange
Commission and are available on JPMorgan Chase & Co.’s website
(http://investor.shareholder.com/jpmorganchase/sec.cfm), and on the Securities and Exchange
Commission’s website (www.sec.gov). JPMorgan Chase & Co. does not undertake to update the
forward-looking statements to reflect the impact of circumstances or events that may arise after the
date of the forward-looking statements.
AP
PE
ND
IX
17