f17 investor presentation final final · machine learning frameworks in ios listing process...
TRANSCRIPT
DRAFT
For
per
sona
l use
onl
y

2
1 Operating EBITDA and Operating NPAT exclude one-off non operating items of $1.4m in F17 ($8.1m in F16). Reported NPAT is $94m, which is up 25.9% YoY.
We’ve had a good year – here’s our F17 financial resultF
or p
erso
nal u
se o
nly

3
We’ve grown revenue 7.7% to $235m with Jobs revenue up 25%
Motors
$63.6m up 8.2%
General Items
$70.4m up 7.1%
Property
$34.1m up 7.3%
Jobs
$27.8m up 25.0%
Advertising$18.8m up 3.8%
LifeDirect$5.3m down 11.3%
Payments$5.8m up 18.5%
Other1
$9.2m down 13.8%
1 Other down 13.8% in part due to the divestment of Travelbug and BookIt in December 2016
For
per
sona
l use
onl
y

4
Reinvesting has strengthened our business and value propositionSince F14 we have reinvested in the business to improve our product offering and the quality of the online experiences we offer.
During this time we have been able to consistently grow revenue.
F17 delivers on our ambitions of a return to good profit growth.
*YoY
$0m
$50m
$100m
$150m
$200m
$250m
F13 F14 F15 F16 F17
Revenue
0.0%
5.0%
10.0%
15.0%
20.0%
25.0%
30.0%
$0m
$15m
$30m
$45m
$60m
$75m
$90m
F13 F14 F15 F16 F17
Expenses
$60m
$65m
$70m
$75m
$80m
$85m
$90m
$95m
F13 F14 F15 F16 F17
Net operating profit1YoY Change
1 Net operating profit excludes one-off non operating items of $1.4m in F17 ($8.1m in F16).
For
per
sona
l use
onl
y

For
per
sona
l use
onl
y

6
Marketplace: good revenue growth and listing volumes
1 GMS = Gross Merchandise Sales is the total value of sales that Trade Me facilitates, excluding Classifieds and vehicles but including motors parts & accessories
7.4%
7.8%
8.2%
8.6%
9.0%
0
100
200
300
400
500
Jun 15 Dec 15 Jun 16 Dec 16 Jun 17
GMS ($m) and Take Rate (%)
Used New Take Rate
YoY GMS growth of
+7.3% in new goods+1.0% in used goods
YoY listings growth of
+23.6%Overall take rate is
8.4%
YoY GMS1 growth
+3.3% to $835m
Launch of buyer and seller protection programs
Continued shipping offer expansion – Book a courier continues to grow and now >1/3 of new goods range has free shipping
Machine learning frameworks in iOS listing process
Afterpay (a buy now pay later interest free offering) partnership announced and the launch is imminent
Google Shopping feed launched to increase traffic from Google searches
Increased supply via integrators e.g. Magento
in new goods+9.3% in used goods
YoY H2 used GMS growth
-1.9%
YoY H2 new GMS growth
+6.5%YoY H2 GMS growth
+1.1%
H2 Overall take rate is
8.5%
For
per
sona
l use
onl
y
7
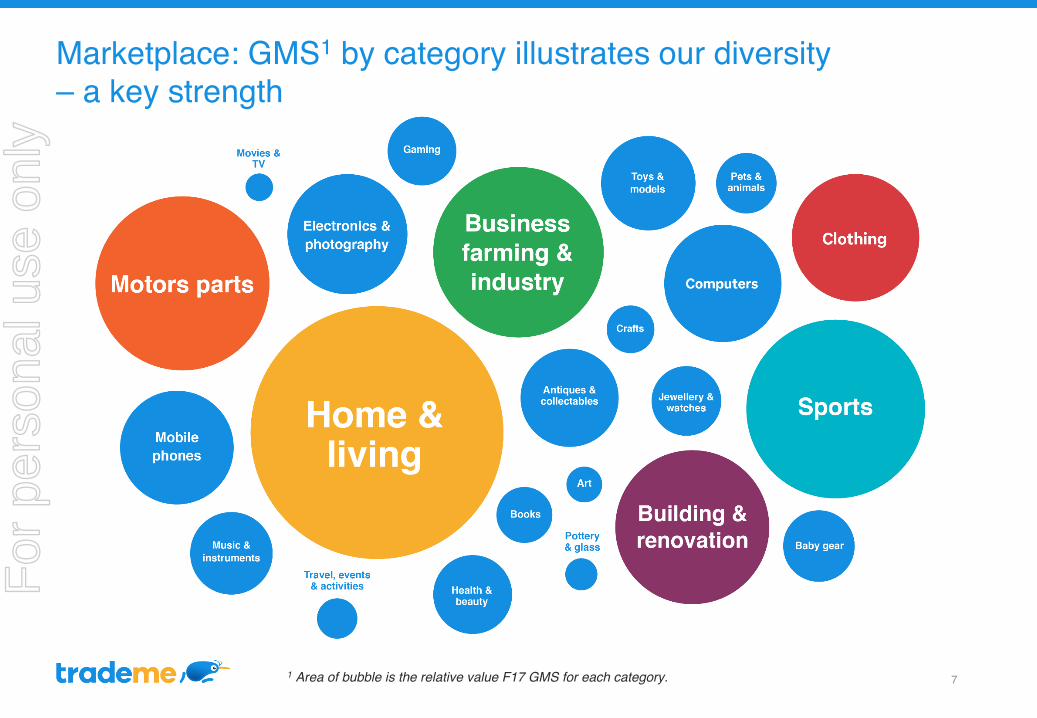
Marketplace: GMS1 by category illustrates our diversity – a key strength
1 Area of bubble is the relative value F17 GMS for each category.
For
per
sona
l use
onl
y

Motors: solid results with renewed momentum
8
$0.0m
$1.0m
$2.0m
$3.0m
$4.0m
$5.0m
$6.0m
$7.0m
F15 H1 F15 H2 F16 H1 F16 H2 F17 H1 F17 H2
Motors dealer premium revenueRevenue growth YoY
+8.2%(dealer revenue +12.6%)
Total listings growth YoY
+5.2%
Dealer premium revenue growth YoY
+26.8%
MotorWeb revenue growth YoY
+14.6%Total directs yield growth YoY
+5.8%Total dealers yield growth YoY
+3.2%
Improved premium products, including super-feature and recommendation stripes
Over 20% of new direct listings generated on mobile apps
Improved revenue growth momentum with H2 +8.9% YoY
Motorcentral acquisition pending Commerce Commission clearance. Motorcentral provide an inventory management system to car dealers.
For
per
sona
l use
onl
y

Property: revenue growth in softer market
9
$0.0m
$1.0m
$2.0m
$3.0m
$4.0m
$5.0m
$6.0m
F15 H1 F15 H2 F16 H1 F16 H2 F17 H1 F17 H2
Property agent for sale premium revenue
Revenue growth YoY
+7.3%Property agent revenue growth YoY
+13.7% Property agent premium revenue growth YoY
+32.4%
Total active native app users has grown by 50% YoY to ~870k
Including Property Insights, average monthly sessions are up 15.6% YoY
OneHub- 6k agents signed up (3x the same time last year)- 900 agents uploaded sales records within 5 weeks of feature release
For sale revenue YoY
+10.8% For sale listing volumes YoY
+5.6% Agent for sale revenue YoY
+16.2% Agent for sale yield YoY
+8.3%
For rent revenue YoY
-2.8% For rent listing volumes YoY
-5.9% Agent for rent revenue YoY
+4.2% Agent for rent yield YoY
+7.5%
For
per
sona
l use
onl
y
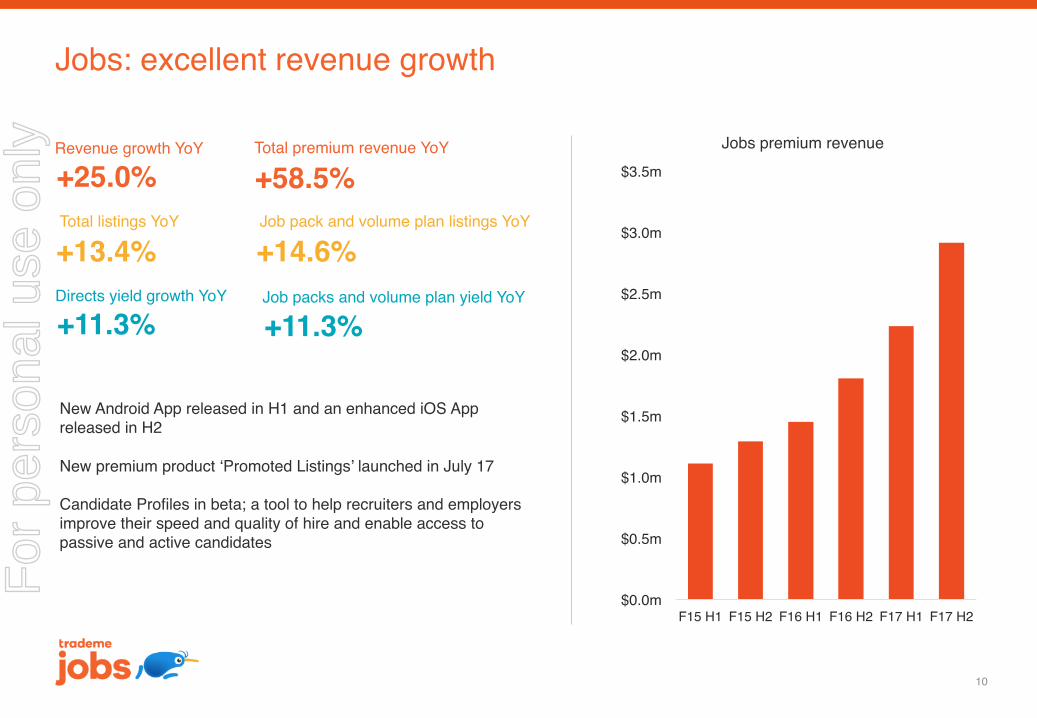
Jobs: excellent revenue growth
10
$0.0m
$0.5m
$1.0m
$1.5m
$2.0m
$2.5m
$3.0m
$3.5m
F15 H1 F15 H2 F16 H1 F16 H2 F17 H1 F17 H2
Jobs premium revenueRevenue growth YoY
+25.0%Total listings YoY
+13.4%
Total premium revenue YoY
+58.5%
Directs yield growth YoY
+11.3% Job packs and volume plan yield YoY
+11.3%
Job pack and volume plan listings YoY
+14.6%
New Android App released in H1 and an enhanced iOS App released in H2
New premium product ‘Promoted Listings’ launched in July 17
Candidate Profiles in beta; a tool to help recruiters and employers improve their speed and quality of hire and enable access to passive and active candidates
For
per
sona
l use
onl
y

Advertising
• Total advertising revenue growth was up 3.8% YoY with display income up 15.1% as we transition away from business partnership revenue.
• Programmatic growth driving display growth.
• Data driving better targeting also underpinning display growth.
• Mobile advertising inventory continues to grow offsetting the decline in desktop impressions.
• Yields across both desktop and mobile browser display showed solid growth YoY.
Our smaller businesses had mixed results
11
Insurance• LifeDirect revenue declined 11.3% YoY due to lower
traffic volumes.
Payments• Total revenue up 18.5% YoY.
• Pay Now up 18.9% and Paystation up 16.4% YoY.
• Ping (a more flexible way to pay for items on Trade Me) rolled out to ~55k enabled members and now available on ~500k listings.
For
per
sona
l use
onl
y

For
per
sona
l use
onl
y
13
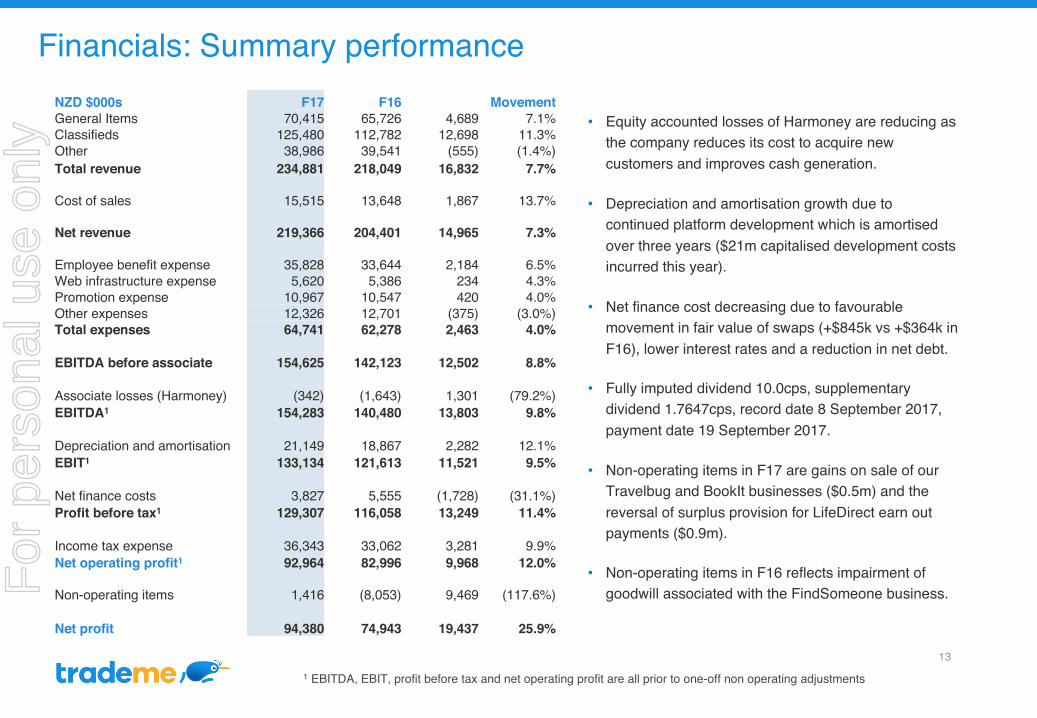
Financials: Summary performance
• Equity accounted losses of Harmoney are reducing as the company reduces its cost to acquire new customers and improves cash generation.
• Depreciation and amortisation growth due tocontinued platform development which is amortised over three years ($21m capitalised development costs incurred this year).
• Net finance cost decreasing due to favourable movement in fair value of swaps (+$845k vs +$364k in F16), lower interest rates and a reduction in net debt.
• Fully imputed dividend 10.0cps, supplementary dividend 1.7647cps, record date 8 September 2017, payment date 19 September 2017.
• Non-operating items in F17 are gains on sale of our Travelbug and BookIt businesses ($0.5m) and the reversal of surplus provision for LifeDirect earn out payments ($0.9m).
• Non-operating items in F16 reflects impairment of goodwill associated with the FindSomeone business.
1 EBITDA, EBIT, profit before tax and net operating profit are all prior to one-off non operating adjustments
NZD $000s F17 F16 MovementGeneral Items 70,415 65,726 4,689 7.1% Classifieds 125,480 112,782 12,698 11.3% Other 38,986 39,541 (555) (1.4%)Total revenue 234,881 218,049 16,832 7.7%
Cost of sales 15,515 13,648 1,867 13.7%
Net revenue 219,366 204,401 14,965 7.3%
Employee benefit expense 35,828 33,644 2,184 6.5% Web infrastructure expense 5,620 5,386 234 4.3% Promotion expense 10,967 10,547 420 4.0% Other expenses 12,326 12,701 (375) (3.0%)Total expenses 64,741 62,278 2,463 4.0%
EBITDA before associate 154,625 142,123 12,502 8.8%
Associate losses (Harmoney) (342) (1,643) 1,301 (79.2%)EBITDA1 154,283 140,480 13,803 9.8%
Depreciation and amortisation 21,149 18,867 2,282 12.1% EBIT1 133,134 121,613 11,521 9.5%
Net finance costs 3,827 5,555 (1,728) (31.1%)Profit before tax1 129,307 116,058 13,249 11.4%
Income tax expense 36,343 33,062 3,281 9.9% Net operating profit1 92,964 82,996 9,968 12.0%
Non-operating items 1,416 (8,053) 9,469 (117.6%)
Net profit 94,380 74,943 19,437 25.9%
For
per
sona
l use
onl
y

Financials: Demonstrated cost control
14
• Slower growth in headcount over the last 12 months than prior periods.
• Good PR levels and spend efficiencies meant advertising and promotional expenses were lower than originally planned.
• Reduction in other expenses was driven by lower rent costs and one-off costs incurred in F16.
NZD $000s F17 F16 MovementCost of sales 15,515 13,648 1,867 13.7%
Employee benefit expense 35,828 33,644 2,184 6.5%
Web infrastructure expense 5,620 5,386 234 4.3%
Promotion expense 10,967 10,547 420 4.0%
Other expenses 12,326 12,701 (375) (3.0%)
Total 80,256 75,926 4,330 5.7%
Excluding cost of sales 64,741 62,278 2,463 4.0%
-
100
200
300
400
500
F13 F14 F15 F16 F17
FTEs
For
per
sona
l use
onl
y

3.3 4.1 4.4 3.0 2.8
6.010.9 14.36.2
5.2
3.63.8
F14 F15 F16 F17
Core Cap-dev Acquisitions
Financials: Balance sheet highlights
15
Capital expenditure Depreciation & Amortisation
• Strong cash position; $53m cash as at 30 June 2017 and net debt reduced to $83m.
• Interest expense has reduced; reflecting lower interest rates, a reduction in net debt and the unwind of unhedged interest rate swaps.
• F18 capex expected to be circa $30m with depreciation and amortisation circa $26m.
$26.0m $20.6m $22.9m $24.8m $12.3m $15.3m $18.9m $21.1m
5.4 6.4 4.5 3.7
8.413.5 18.4 21.1
12.20.7
F14 F15 F16 F17
Core Cap-dev Acquisitions
For
per
sona
l use
onl
y

For
per
sona
l use
onl
y

We’re larger and stronger than we have ever been
17
We’ve delivered on our promises
We’ve grown to a great size
We’ve diversified our offer and revenue streams
We’ve increased relevance to Kiwis
We remain highly influential and trusted
F17 Operating NPAT +12%
We now employ over >550 staff in 3 locations
Classifieds and Other revenue >70% in F17
Average weekly logged in members now ~1m
Top 10 most loved brand (Colmar Brunton) and top 10 most influential brand (Ipsos)
For
per
sona
l use
onl
y

Whilst competition is intensifying, we’ve huge growth opportunities
18
• We have large addressable markets with structural tailwinds.
• We have further upside through improving our premium products and providing more utility to existing customers.
• We also have revenue opportunities in logical adjacencies (such as leads for finance, insurance, utilities, etc.).
$3.2b
$0.6b
$89m
$134m
$81m
1 BNZ Marketview, Statistics NZ, NZTA Stats, REINZ data, Competitor Websites, Third Party Research, Company Results
0% 20% 40% 60% 80% 100%
Jobs
Motors
Property
Marketplace Used
Marketplace New Online
Estimated Addressable Markets and Our Market Share1
TME Print and OtherFor
per
sona
l use
onl
y

We have excellent sources of competitive advantage and prospects
19
Local scale We have a large and engaged community of buyers, sellers and advertisers. This gives us brand awareness and affection, with the strength and value of our network proportionate to the number of participants - a key concept that underpins the attractiveness of leading marketplaces around the world.
Local trustWe work hard to earn the trust of New Zealanders, we’re open and considered with our approach to privacy as seen in our annual Transparency Report.
Local insightsWe have rare and comprehensive insight into the behaviour and preferences of Kiwis, which spans so many different stages of life. We’re using this information to improve the experience and value we offer Kiwis.
The breadth of our portfolioWe span a portfolio of sectors - retail, automotive, real estate, employment, insurance, services and others - with a single unified brand, platform and understanding of our customers. In other words, the whole is much greater than the sum of the parts.
Kiwi affectionWe have a special place in the hearts of Kiwis - everyone has their Trade Me story, where they’ve been surprised or delighted, through finding something they didn’t expect to find, selling something for a lot more cash than they expected, or meeting a like-minded person when completing a trade.
For
per
sona
l use
onl
y
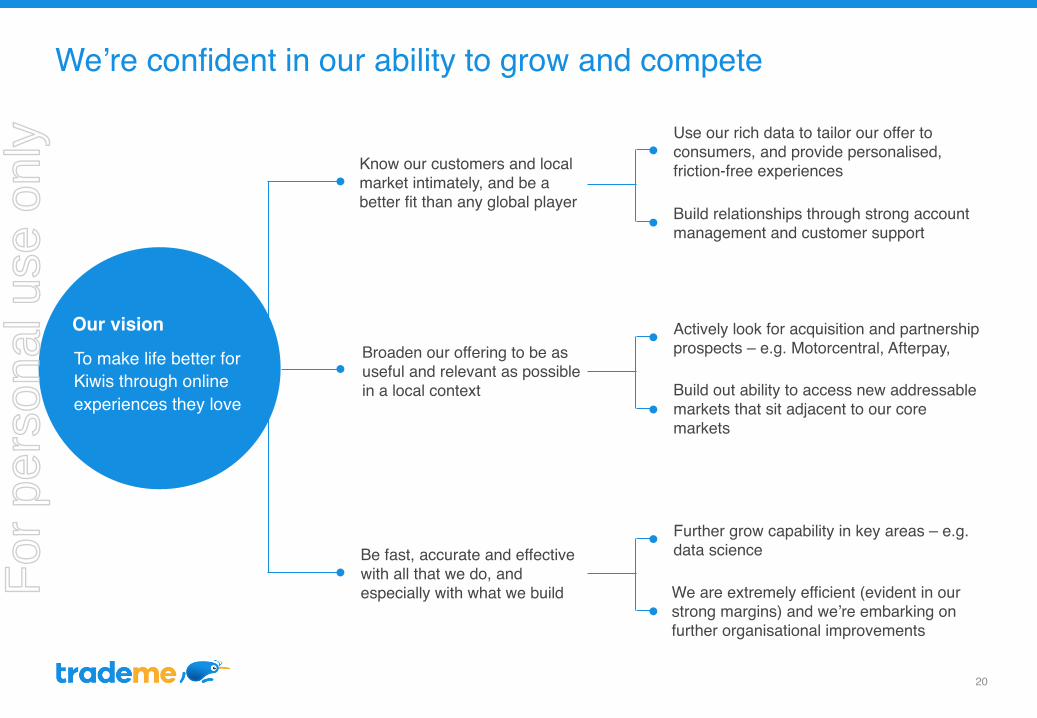
We’re confident in our ability to grow and compete
20
Know our customers and local market intimately, and be a better fit than any global player
Broaden our offering to be as useful and relevant as possible in a local context
Be fast, accurate and effective with all that we do, and especially with what we build
Use our rich data to tailor our offer to consumers, and provide personalised, friction-free experiences
Build relationships through strong account management and customer support
Actively look for acquisition and partnership prospects – e.g. Motorcentral, Afterpay,
Build out ability to access new addressable markets that sit adjacent to our core markets
We are extremely efficient (evident in our strong margins) and we’re embarking on further organisational improvements
Further grow capability in key areas – e.g. data science
To make life better for Kiwis through online experiences they love
Our vision
For
per
sona
l use
onl
y

We’re clear on our Marketplace proposition and priorities
21
Range (selection)A broad and unique range is due to our new/used mix and 200,000 monthly sellers. Our inventory includes uniquely local and hard-to-ship inventory.
Price A transparent platform encourages strong price competition, and the increasing number of international sellers means better access to great global pricing.
Buyer experienceWe’re improving buyer experience through big projects (i.e. like our book-a-courier offer) and many incremental improvements. We release improvements to our websites most days of the week.
TrustWe’ve further improved trust with our Buyer Protection programme, we have 24/7 customer support and strong relationships with the NZ government agencies.
We are clear on our consumer proposition across the four key retail pillars:
We’re improving each of these key retail pillars, in a way that is unique to us, and isn’t easily replicated.
We have three areas of focus:
New goods selectionInventory growth through sales effort, aggregator partnerships and integrations with the likes of Magento and Shopify. This will help strengthen range and price.
Core experienceEase-of-use and customer engagement are extremely powerful. We have a particular focus on search and “findability” which becomes increasingly important as we bring on more inventory.
Building preferencePlanning is under way regarding possible subscription and loyalty schemes to encourage buyers to think about Trade Me as their first option for online purchases. F
or p
erso
nal u
se o
nly

In F18 we expect continued revenue growth with slower profit growth
22
Revenue
In F18 we expect total revenue growth similar to that reported in F17 – however a soft property listing market means some downside risk.
Expenses
We intend to invest at a rate slightly above revenue growth in F18 (but not a return to the rates of F14 to F16). We have targeted investment plans focussed on continuing to strengthen our competitive advantages.
Operating profit
We expect to deliver year-on-year EBITDA and operating NPAT growth in F18, albeit at lower growth rates than F17 due to the higher level of investment.
For
per
sona
l use
onl
y
