fabrication of composite microparticles of artemisinin for dissolution enhancement
TRANSCRIPT

Powder Technology 203 (2010) 277–287
Contents lists available at ScienceDirect
Powder Technology
j ourna l homepage: www.e lsev ie r.com/ locate /powtec
Fabrication of composite microparticles of artemisinin for dissolution enhancement
Nanda Gopal Sahoo a, Mitali Kakran a, Lin Li a,⁎, Zaher Judeh b
a School of Mechanical and Aerospace Engineering, Nanyang Technological University, 50 Nanyang Avenue, 639798 Singaporeb School of Chemical and Biomedical Engineering, Nanyang Technological University, 62 Nanyang Drive, 637459 Singapore
⁎ Corresponding author. Tel.: +65 6790 6285; fax: +E-mail address: [email protected] (L. Li).
0032-5910/$ – see front matter © 2010 Elsevier B.V. Aldoi:10.1016/j.powtec.2010.05.019
a b s t r a c t
a r t i c l e i n f oArticle history:Received 2 February 2010Received in revised form 17 April 2010Accepted 14 May 2010Available online 21 May 2010
Keywords:ArtemisininCrystallinityDissolutionMicroparticlesSpray drying
The main aim of this study is to enhance the dissolution of a poorly water soluble antimalarial drug,artemisinin (ART) by fabricating its microparticles and composites with selected hydrophilic polymers usinga spray drier with a modified multi-fluid nozzle. We investigated the spray drying of ART withpolyvinylpyrrolidone (PVP) considering the effect of feed ratio (ART:PVP) on the physical properties anddissolution of spray dried ART. Other hydrophilic carriers such as polyethylene glycol (PEG) were selected forcomparing the dissolution with that of spray dried ART with PVP. The drug and polymer solutions weresupplied through different liquid passages of the modified four-fluid nozzle to fabricate ART and compositemicroparticles. Characterization of the original ART powder, spray dried ART microparticles and ART-polymer composite microparticles was carried out by scanning electron microscopy (SEM), Fouriertransform infrared (FTIR), differential scanning calorimetry (DSC), X-ray diffraction (XRD) and dissolutiontester. The DSC and XRD studies suggested that the crystallinity of ART decreased after spray drying anddepended on the weight ratio of drug to polymer. Percent dissolution efficiency (%DE); relative dissolution(RD); mean dissolution time (MDT); difference factor (f1) and similarity factor (f2) were calculated for thestatistical analysis. The dissolution of ART from the spray dried ART–PVP composite microparticles was morerapid than that from their respective physical mixture, spray dried ART–PEG composite microparticles andoriginal ART powder. In the mathematical modeling, the Weibull and Korsmeyer-Peppas model were foundto best fit to the in vitro dissolution data and the drug release kinetics could be recognized as Fickiandiffusion. This study demonstrated that the modified multi-fluid spray drier can be used for the preparationof drug microparticles to improve the dissolution ability of poorly water soluble drugs and overcome theproblem of finding a common solvent for drugs and carriers.
65 6791 1859.
l rights reserved.
© 2010 Elsevier B.V. All rights reserved.
1. Introduction
Recent drug discovery has led to an increasing number of newdrug molecules with low water solubility and hence poor bioavail-ability, especially those administered orally [1]. Poorly water solubledrugs tend to be eliminated from the gastrointestinal tract before theyget an opportunity to fully dissolve and be absorbed into the bloodcirculation. Since about 65% of the human body is made up of water, adrugmust have a certain hydrophilicity or polarity to be water solubleand thus possess an acceptable bioavailability level. Therefore, it is agreat challenge to develop reliable and efficient processing methodsto increase the oral bioavailability of poorlywater soluble drugs. Manyapproaches have been developed to enhance the solubility as well asbioavailability of poorly water soluble drugs, including both mod-ifications to the drug substance itself and the creation of specificformulations. Physical modifications to increase the surface area,solubility and wettability of the drug particles, therefore focus on
particle size reduction [2] or development of amorphous states [3,4].The most common method is to increase the surface area of a drug bymicronization. There are several methods for the production of drugmicro/nano particles such as pulverization of large particles using aball or jet mill, spray freezing, spray drying, supercritical antisolventtechnique (SAS) [5–10] etc. to improve drug solubility. Spray drying isthe most commonly used industrial process because the spray driedpowders meet the highest quality standards with respect to theparticle size distribution of products, homogeneity and shape.Different types of particles have been produced by this method, suchas conventional particles, encapsulated particles and porous particles[8,9]. By modifying the spray drying operation, it is possible to controlthe properties of spray dried particles towards enhancement of drugbioavailability and delivery. The present study is concerned with theimprovement of the dissolution of a poor water soluble drug by usingthis method.
Artemisinin is a potent antimalarial drug that remains effectiveagainst multidrug resistant strains of Plasmodium falciparum malaria. Ithas good intestinal permeability and can readily cross the intestinalmonolayers via passive diffusion [11]. Major problem with artemisinin(ART) is its poor aqueous solubility [12], resulting in poor absorption

278 N.G. Sahoo et al. / Powder Technology 203 (2010) 277–287
upon oral administration. This poor solubility, its short half life and highfirst-pass metabolism, might lead to incomplete clearance of theparasites resulting in recrudescence [13]. Few studies investigated theenhancement of the solubility and/or dissolution of ART using a carrierlike cyclodextrin [14,15]. They prepared β-cyclodextrin-ART complexesby using a slurry method at a molar ratio of 1:1 and showed that theβ-cyclodextrin-ART complex has a faster rate and higher extent ofdissolution andpossessed the enhancedbioavailability in vivo comparedwith a commercial preparation containing the normal form of the drug[14,15].
In our present study, attempts aremade to improve the dissolutionof ART by using an in-house modified multi-fluid nozzle spray drierthat allows co-spray drying of ART with polyvinylpyrrolidone (PVP)that acts as a hydrophilic carrier. We have also selected otherhydrophilic carriers such as polyethylene glycol (PEG) for comparingthe dissolution with that of spray dried ART with PVP. Characteriza-tion of the prepared drug particles has been carried out by scanningelectron microscopy (SEM), differential scanning calorimetry (DSC),Fourier transform infrared (FTIR) spectroscopy, X-ray diffraction(XRD) and dissolution study. We have also investigated themechanism of drug release through mathematical modeling ofdissolution data for all samples.
2. Materials and methods
2.1. Materials
Artemisinin was obtained from Kunming Pharmaceutical Corpo-ration (Kunming, China). The samples of PVP-K30 and PEG (averagemolecular weights of 40,000 and 4000, respectively) were boughtfrom Sigma-Aldrich. All reagents used were of technical grade.
2.2. Fabrication method
A modified multi-fluid nozzle pilot spray drier (PSD 52, AnhydroA/S, Denmark) was used to prepare ART microparticles in this work.The pilot spray drier is shown in Fig. 1. The drier consists of two mainunits, the drying chamber and the filter. The maximum evaporationcapacity at inlet/outlet temperatures of 350/90 °C is 9.3 kg/h, the airheater is electrical with a capacity of 12 KW, the controlled volumetricair flowrate is 125 m3/h. With the original nozzle setup, shown inFig. 2i, two fluids, one compressed air and the other product to bedried, can be fed simultaneously through the nozzle atomizer into the
Fig. 1. Engineering drawing of the pil
drying chamber. In this setup, the product to be dried is kept in thefeeding tank. From here the liquid is drip fed through the siphon hoseinto the nozzle atomizer. For regulation of the feed rate to theatomizer, a manually adjustable clamp is used around the feed hose.The drying air is drawn through an air filter mat and through theelectrical air heater and into the chamber. The temperature of thedrying air is controlled variably and monitored from the instrumentpanel. The dried powder exiting the chamber enters the cycloneseparator where it is collected into a bucket. The moist drying aircontinues and passes through a filter trapping any remaining particlesin a second bucket. For preparation of composite drug particles, it isnecessary to find a common solvent for the drug and the carrier. For apoorly water soluble drug, the drug is more hydrophobic while thedrug carrier is hydrophilic so it is very difficult to find common solventfor the drug and carrier. That's why this manufacturer's setup wasmodified as shown in Fig. 2ii, allowing for four fluids to be fedsimultaneously which is more advantageous to produce compositedrug particles compared to the existing spray drying process. Three ofthe fluids are for liquid while one remains as the compressed airstream. Three steel pipes with very small diameters (diameter 1/16″or 1.6 mm) were connected to the calibrated digital dosing pumps(Grundfos, Denmark) and the feed solutions. The original processstream feed port was modified to accommodate the three steel pipesfor liquids, whichwere inserted alongside each other inside the nozzlefeed pipe and joined at a point such that fluids come into contact withanother 5 mm before the nozzle tip. The atomizer head was alsoslightlymodified at the nozzle tip. In this setup, we are able to performexperiments under controlled feeding of solutions entering separatelyinto the nozzle, thereby avoiding solvent interaction effects associatedwith mixing upstream of the nozzle. A multi-fluid nozzle haspreviously been used by Beppu et al. [16] who recognized that withsuch an alternative multi-fluid nozzle design, it is possible to usedifferent liquid feed lines for the separate addition of solvents into thenozzle, thereby overcoming the problem of finding and using acommon solvent.
The original ART powder was dissolved in ethyl alcohol at a feedconcentration of 10 g/L and PVP was dissolved in water at differentconcentrations to maintain the composite feed ratios of 1:1, 1:2, 1:4and 1:6 (w/w). The drug and PVP solutions were supplied throughdifferent liquid passages of the modified four-fluid nozzle. Spraydrying was conducted at an inlet temperature of 140 °C. Only two ofthe three liquid feed lines were used. The flow rate for the ART andPVP solutions was 250 ml/h. The outlet temperature was maintained
ot spray drier used in this study.

Fig. 2. i. Original two-fluid nozzle atomizer for co-current atomization (left). Original setup for siphon or gravity feeding (right). ii. Modified 4-fluid nozzle pump-fed setup.
279N.G. Sahoo et al. / Powder Technology 203 (2010) 277–287
within the range 40–50 °Cwhile air pressurewas controlled at 1.4 bar.For comparing with the spray dried ART–PVP composite particles, wehave prepared ART–PEG composite particles with 1:6 ratio using thesame conditions. Single-component spray dried ART particles werealso prepared under the same conditions.
2.3. Particle morphology
The morphology of samples was observed using a scanningelectron microscope (JSM-6390LA-SEM, Jeol Co., Japan). The powdersamples were spread on a SEM stub and sputtered with gold beforethe SEM observations. For observation of ART particles in composites,PVP was removed by dissolving the ART–PVP composite particles in
water for only 5 min under sonication. The ART suspensions werefiltered to remove PVP and dried.
2.4. FTIR analysis
Fourier transform infrared (FTIR) spectroscopic measurementswere performed using a DIGILAB FTS 3100 system using the KBr diskmethod.
2.5. DSC analysis
Differential scanning calorimetric (DSC) measurements werecarried out using a PerkinElmer DSC 7 thermal analyzer in a

280 N.G. Sahoo et al. / Powder Technology 203 (2010) 277–287
temperature range of 30–250 °C at a heating rate of 10 °C/min innitrogen gas. The melting point and heat of fusion were calculatedusing the DSC software.
2.6. X-Ray diffraction analysis
X-ray diffractionwas studiedusing the Bruker AXSD8AdvanceX-raydiffractometer with Cu Kα — targets at a scanning rate of 0.010 2θ/s,applying 40 kV, 40 mA, to observe the crystallinity of samples.
2.7. Dissolution studies
The in vitro dissolution of the spray dried ART samples as well asthe original ART was determined using the paddle method (USPapparatus II) (Verkin Dissolution Tester DIS 8000) in 900 mL ofdistilled water, under nonsink conditions. The paddle rotation was setat 200 rpm. The temperature was maintained at 37±0.5 °C. Theoriginal ART, spray dried ART, ART–PEG and ART–PVP samplescontaining an equivalent 360 mg of ART were tested for theirdissolution in water. The dissolved solution samples of 1 ml werecollected at 0.5, 1, 2, 3 and 4 h of dissolution time. For each sample thedissolution test was done 3 times.
2.8. Analysis of ART concentration
The ART concentrations for the dissolution studies were deter-mined using a high performance liquid chromatography (HPLC)method with ultraviolet detection [17,18]. The HPLC used was Agilent1100 series. The column used was Kromasil C18 (150 mm×4.6 mmid×3.5 μm) (Eka Chemicals AB, Sweden). The mobile phase consistedof 75% of 0.01 M disodium hydrogen phosphate and 25% acetonitrile(HPLC grade) and the mobile phase was adjusted to pH 6.5 withglacial acetic acid. The flow rate was set at 0.8 mL/min. The detectorwas operated at a wavelength of 254 nm.
The samples were filtered through 0.45 μm polypropylene-reinforced Teflon membrane with polypropylene housing (Minis-tart-SRP 15, Saritorius, Germany). The samples were subjected topretreatment prior to injection into the HPLC system. 1 mL of samplewas added into 200 μL of 10 M sodium hydroxide and themixture washeated at 45 °C for 25 min, which was then cooled to roomtemperature. Finally, 150 μL of glacial acetic acid was added into theabove mixture before injection into the HPLC system.
2.9. Phase solubility study
The phase solubility study was performed using the methodreported by Higuchi and Connors [19]. Excess amount of ART wasadded into 6 solutions of PVP (or PEG) in screw capped vials. Theconcentrations of PVP and PEG used were 0, 2, 4, 6, 8 and 10 mM. Thevials were shaken continuously in a thermostatically controlled waterbath at 24, 37 and 52 °C for 72 h until equilibriumwas achieved. Afterequilibrium, a 1 mL sample of each solution was filtered through a0.45-μm polypropylene-reinforced Teflon membrane and dilutedwith water before HPLC analysis.
The stability constants at the three different temperatures werecalculated from the linear section of the phase solubility diagrams.The stability constant Ks was calculated using the followingrelationship:
Ks =slope
S0 1−slopeð Þ ð1Þ
Where So is the intrinsic solubility of ART in the absence ofpolymers, and the slope refers to the gradient of the plot of ARTsolubility (mM) vs. polymers concentration (mM).
Furthermore, the enthalpy change (ΔH) for the ART–PVP and ART–PEG binary systems were investigated using the temperaturedependent characteristic of the stability constant based on the van'tHoff equation [15,20] as shown below:
lnKs = −ΔHRT
ð2Þ
where Ks is as defined above, T is the absolute temperature (Kelvin),and R is the gas constant (8.314 J/mol/K). The ΔH (enthalpy change)was calculated from the slope of the plot of ln Ks vs. 1/T after leastsquare linear regression analysis.
The Gibbs free energy of transfer (ΔG) of ART from pure water toaqueous solution of a polymer was calculated using the followingequation [21]:
ΔG = −2:303RT logSSSO
� �ð3Þ
where SS/S0 is the ratio of molar solubility of ART in aqueous solutionof a polymer to that of the pure water.
2.10. In vitro dissolution/statistical analysis
Percent dissolution efficiency (%DE) was calculated to compare therelative performance of the spray dried ART–PVP, ART–PEG compositeswith the spray dried ART and original ART powder. The %DE at 30 min(%DE30 min) and 1 h (%DE1 h) for each formulation was computed asthe percent ratio of area under the dissolution curve up to the time t,to that of the area of the rectangle described by 100% dissolution atthe same time [22].
%DE =∫t
0y⋅dt
y100⋅t
0BBB@
1CCCA100 ð4Þ
The mean dissolution time (MDT) was calculated by the followingexpression [22]:
MDT =∑n
i = 1tmidΔM∑n
i = 1ΔMð5Þ
where i is the dissolution sample number, n is the number ofdissolution times, tmid is the time at themidpoint between times ti andti−1, andΔM is the amount of ART dissolved (μg) between times ti andti−1.
The difference factor (f1), evaluating the percent error betweentwo curves over all time points [22]:
f1 =∑n
i = 1jRi−Tij∑n
i = 1Ri× 100 ð6Þ
where i is the dissolution sample number, n is the number ofdissolution times, Ri and Ti are the amounts dissolved of the referencedrug and the test drug at each time point i. The percent error is zerowhen the test drug and reference profiles are identical and increaseproportionally with the dissimilarity between the two dissolutionprofiles.
The similarity factor (f2) is a logarithmic transformation of thesum-squared error of differences between the test Ti and reference Riover all time points [22]:
f2 = 50 × log 1 + 1=nð Þ∑ni=1jRi−Tij2
h i−0:5× 100
� �ð7Þ

281N.G. Sahoo et al. / Powder Technology 203 (2010) 277–287
It is 100 when the test and reference profiles are identical andtends to 0 as the dissimilarity increases.
2.11. Mathematical modeling of release kinetics
The in vitro drug release data were fitted to various release kineticmodels viz. Higuchi, Korsmeyer-Peppas and Weibull model employ-ing the following set of equations [22]:
Higuchi model
Mt = Kffiffit
pð8Þ
Korsmeyer-Peppas model
Mt
M∞= ktn ð9Þ
Weibull model
Mt
M∞= 1− exp −ks⋅t
n� � ð10Þ
where Mt and M∞ correspond to the drug amount dissolved at aparticular time t and at infinite time, respectively. Various other termsviz. K, k, and ks refer to the release kinetic constants obtained from thelinear curves of Higuchi, Korsmeyer-Peppas, and Weibull model,respectively. Model fitting using Eqs. (8)–(10) was accomplishedusing the Sigma plot software.
3. Results and discussion
3.1. Particle morphology
SEM microphotographs of the original ART powder, spray driedART particles, spray dried ART–PVP and ART–PEG composite particlesare shown in Fig. 3. It was observed that the particle size of spray driedART was in the range 1–5 µm with rods and cubic morphology. Theoriginal ART powder exhibited particles lacking uniformity in size andbeing relatively larger than the spray dried ones and had differentmorphology. The spray dried particles are more uniform. Fig. 3(c)–(f)shows that the ART and PVP or ART and PEG were not mixedhomogeneously but both could clearly be observed in all particles forall of the ART–PVP and ART–PEG co-spray dried products. Ozeki et al.reported the same observation in flurbipron (FP) and sodiumsalicylate (SS) spray dried composite particles [23]. The feed ratiowas influential on the particle size of the spray dried particles. Fig. 4(a) and (b) shows the SEM photographs of ART micro particlesdispersed in composites after removal of PVP by complete dissolutionin water. The ART particles in the composites were similar in shapebut much lower in size than the spray dried ART particles. The ARTparticle size decreased as the ART concentration decreased in thecomposites as shown by the smaller particle size of ART particles inART–PVP composites at 1:4 ratio in Fig. 4(b) as compared to the sameat 1:2 ratio in Fig. 4(a). The outlet spray drier temperature was notfound to influence the morphology of produced particles.
3.2. FTIR study
The FTIR spectra of original ART powder, PVP, PEG, spray driedcomposite particles and the corresponding physical mixture areshown Fig. 5i and ii. The FTIR spectrum of ART powder (Fig. 5i) showsthe absorption peaks at 1736 cm−1, the stretching vibrations of C=Odue to the lactone and at 832, 883, 1117 cm−1 due to the peroxide.The spectrum of PVP showed an important band at 1652 cm−1 due tothe presence of C=O stretching. A very broad band was also visible at3430 cm−1 which was attributed to the presence of water as PVP is a
hygroscopic polymer and absorbs moisture from the environment.The spectrum of PEG (Fig. 5ii) showed a broad band at 3450 cm−1,which was attributed to the presence of –OH stretching. Otherimportant band was observed at 1105 cm−1 due to the presence of C–O stretching. Comparison of the spectra of spray dried composites ofART with both polymers showed no differences in the position of theabsorption peak. The absences of shifts in the wavenumbers of theFTIR peaks of the spray dried composites and the physical mixtureindicated the lack of significant interaction between the ART and bothpolymers in the spray dried composites.
3.3. X-ray diffraction
The X-ray diffraction patterns of the original ART powder, spraydried ART particles, PVP, PEG, spray dried composite particles and thecorresponding physical mixture are shown in Fig. 6. The figures reflectthe changes in the drug crystal structure. The X-ray patterns of theoriginal ART powder in Fig. 6i (a) displayed the presence of numerousdistinct peaks at 2θ of 7.29°, 11.78°, 14.65°, 15.63°, 16.64°, 18.23°,20.0°, and 22.1°, which suggests that the drug was of a crystallineform. On the other hand, the diffraction spectrum of PVP in Fig. 6i (h)showed no prominent peak, indicating the amorphous nature of thePVP. The diffraction spectrum of PEG in Fig. 6ii (a) showed twoprominent peaks with the highest intensity at 2θ of 19.2° and 23.3°.The spray dried ART particles in Fig. 6i (a) showed the similardiffraction pattern with a lower peak intensity, suggesting that thecrystallinity of the spray dried ART particles decreased during thespray drying process. For the ART–PVP physical mixture, all the peaksfrom ART were present with slightly lower intensity and no newpeaks were observed, suggesting the absence of interaction betweenthe drug and the PVP in their physical mixture. However, in the spraydried composite samples in Fig. 6i (c–g), all the diffraction peaks ofART were observed with remarkably decreased intensity compared tooriginal ART powder and their corresponding physical mixture inFig. 6i (b). It is very interesting to note in Fig. 6ii (b) that the newdiffraction peak appeared at 2θ=9.24° for the spray dried ART–PEGcomposite sample at 1:6 ratio as compared to other compositesamples. These results suggest a change in the crystal structure of ARTin ART–PEG composite.
According to the XRD data, the decrease in XRD peak intensity inthe case of ART–PVP composite (1:6) (Fig. 6ii) was greater than that ofART–PEG composite (1:6), suggesting that the lower crystallinity ofthe spray dried ART–PVP compared to the spray dried ART–PEGcomposite. The new peaks observed in case of spray dried ART–PEGcomposite suggested some physical interaction between the drug andthe carrier, which led to the change in the crystal structure. The FTIRspectra showed no chemical interaction between ART and the carrier,but XRD data suggested that the addition of the carrier introducedsome changes in the crystal structure of ART.
From XRD observations, we can conclude that the crystallinenature of the drug was still maintained, but the relative reduction ofdiffraction intensity of ART in the spray dried composite suggests thatthe quality of the crystals was reduced.
3.4. Thermal properties
In order to understand the effect of spray drying on the thermalproperties of ART, DSC was conducted. The DSC thermograms of theoriginal ART powder, PVP, spray dried composite particles and thecorresponding physical mixtures are presented in Fig. 7. The meltingtemperature (Tm) and heat of fusion (ΔHf) obtained from the DSCstudy are summarized in Table 1. The original ART powder used in thisstudy had a sharp melting endothermic peak at 156 °C. As anamorphous and hygroscopic polymer, PVP did not show any meltingpeak or phase transition, apart from a broad endotherm due todehydration, which lies between 80 and 120 °C (not shown in the

Fig. 3. SEM photographs of (a) original ART powder, (b) spray dried ART particles, (c)–(e) spray dried ART–PVP and (f) ART–PEG composite particles.
282 N.G. Sahoo et al. / Powder Technology 203 (2010) 277–287
figure). The endothermicmelting peak of the spray dried ART particlesslightly shifted to the lower temperature side. For the spray driedART–PVP composite particles, the ART endothermic peak wasobserved at lower temperature compared to the original ART powder,spray dried ART particles and their corresponding physical mixtures,which was indicative of a certain loss of crystallinity. The heat offusion of the original ART powder was higher than that of the spraydried ART particles. The heat of fusion of the spray dried compositeART–PVP particles depended on feed ratio. From Table 1, it is clearly
seen that the heat of fusion of the spray dried composite ART–PVPparticles decreased with increasing polymer concentration. FromFig. 7 and Table 1, it is observed that the heat of fusion of the spraydried ART–PVP composites was lower than their correspondingphysical mixtures. The heat of fusion of spray dried ART–PVPcomposite (1:6) was lower than that of the ART–PEG composite(1:6). Since heat of fusion is proportional to the amount ofcrystallinity in the samples, these results suggest that the crystallinityof ART was decreased when they were dispersed in the spray dried

Fig. 4. SEM photographs of ART micro particles dispersed in composites (a) ART–PVP=1:2 (b) ART–PVP=1:4, after removal of PVP.
283N.G. Sahoo et al. / Powder Technology 203 (2010) 277–287
composite particles. Therefore, we conclude that the spray dried ART–PVP composites were less crystalline than the ART–PEG composites,which was supported by the XRD analysis.
Fig. 5. i. FTIR spectra of (a) PVP, (b) physical mixing of ART-PVP1:1, (c) spray driedART–PVP composite particles 1:1, (d) spray dried ART–PVP composite particles1:2 and(e) original ART powder; ii. FTIR spectra of (a) PEG, (b) spray dried ART–PEG compositeparticles1:6 and (c) original ART powder.
3.5. Phase solubility studies
The phase solubility profiles of ART in the presence of PVP and PEGare shown in Fig. 8. The phase solubility of ART increased linearly with
Fig. 6. i. X-ray diffractograms of (a) Original ART, (b) spray dried ART, (c) physical mixingofART–PVP1:1, spraydriedART–PVP composite particles of (d) 1:1, (e) 1:2, (f) 1:4, (g) 1:6,and (h) PVP; ii. X-ray diffractograms of (a) PEG, (b) spray dried ART–PEG compositeparticles 1:6 (b), and (c) spray dried ART–PVP composite particles 1:6.
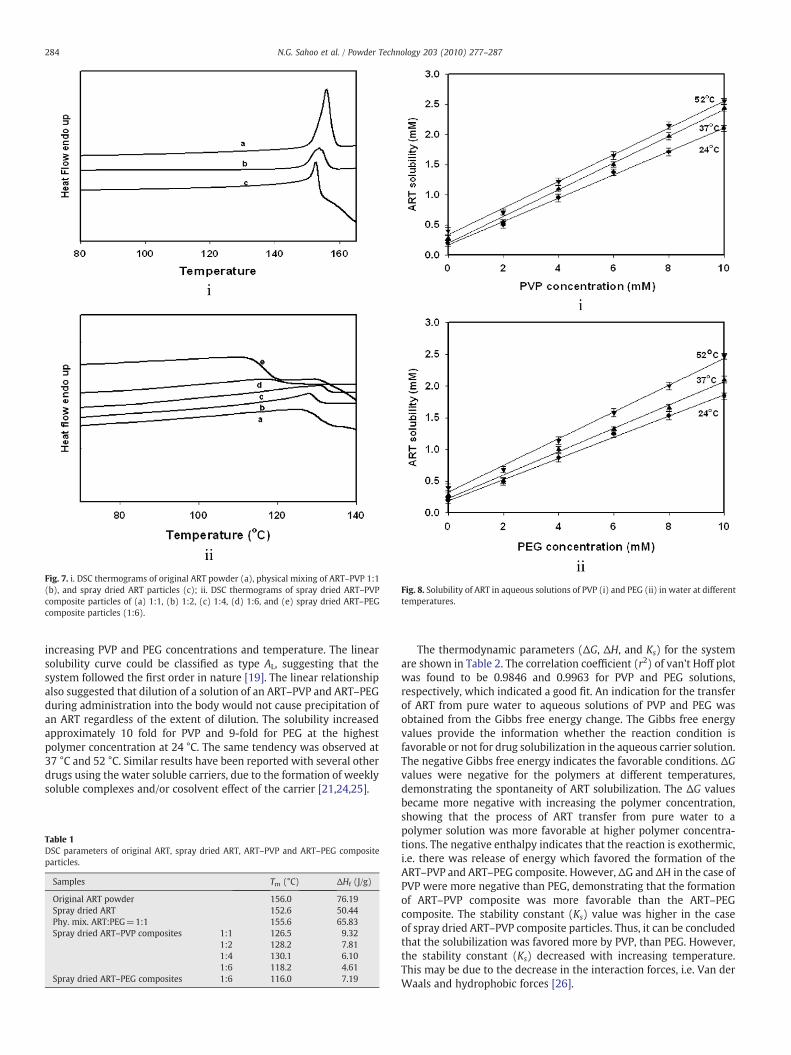
Fig. 7. i. DSC thermograms of original ART powder (a), physical mixing of ART–PVP 1:1(b), and spray dried ART particles (c); ii. DSC thermograms of spray dried ART–PVPcomposite particles of (a) 1:1, (b) 1:2, (c) 1:4, (d) 1:6, and (e) spray dried ART–PEGcomposite particles (1:6).
Fig. 8. Solubility of ART in aqueous solutions of PVP (i) and PEG (ii) in water at differenttemperatures.
284 N.G. Sahoo et al. / Powder Technology 203 (2010) 277–287
increasing PVP and PEG concentrations and temperature. The linearsolubility curve could be classified as type AL, suggesting that thesystem followed the first order in nature [19]. The linear relationshipalso suggested that dilution of a solution of an ART–PVP and ART–PEGduring administration into the body would not cause precipitation ofan ART regardless of the extent of dilution. The solubility increasedapproximately 10 fold for PVP and 9-fold for PEG at the highestpolymer concentration at 24 °C. The same tendency was observed at37 °C and 52 °C. Similar results have been reported with several otherdrugs using the water soluble carriers, due to the formation of weeklysoluble complexes and/or cosolvent effect of the carrier [21,24,25].
Table 1DSC parameters of original ART, spray dried ART, ART–PVP and ART–PEG compositeparticles.
Samples Tm (°C) ΔHf (J/g)
Original ART powder 156.0 76.19Spray dried ART 152.6 50.44Phy. mix. ART:PEG=1:1 155.6 65.83Spray dried ART–PVP composites 1:1 126.5 9.32
1:2 128.2 7.811:4 130.1 6.101:6 118.2 4.61
Spray dried ART–PEG composites 1:6 116.0 7.19
The thermodynamic parameters (ΔG, ΔH, and Ks) for the systemare shown in Table 2. The correlation coefficient (r2) of van't Hoff plotwas found to be 0.9846 and 0.9963 for PVP and PEG solutions,respectively, which indicated a good fit. An indication for the transferof ART from pure water to aqueous solutions of PVP and PEG wasobtained from the Gibbs free energy change. The Gibbs free energyvalues provide the information whether the reaction condition isfavorable or not for drug solubilization in the aqueous carrier solution.The negative Gibbs free energy indicates the favorable conditions. ΔGvalues were negative for the polymers at different temperatures,demonstrating the spontaneity of ART solubilization. The ΔG valuesbecame more negative with increasing the polymer concentration,showing that the process of ART transfer from pure water to apolymer solution was more favorable at higher polymer concentra-tions. The negative enthalpy indicates that the reaction is exothermic,i.e. there was release of energy which favored the formation of theART–PVP and ART–PEG composite. However,ΔG and ΔH in the case ofPVP were more negative than PEG, demonstrating that the formationof ART–PVP composite was more favorable than the ART–PEGcomposite. The stability constant (Ks) value was higher in the caseof spray dried ART–PVP composite particles. Thus, it can be concludedthat the solubilization was favored more by PVP, than PEG. However,the stability constant (Ks) decreased with increasing temperature.This may be due to the decrease in the interaction forces, i.e. Van derWaals and hydrophobic forces [26].

Table 2Thermodynamic parameters for solubilization process of ART in aqueous solutions of PEG and PVP at 24 °C, 37 °C and 52 °C.
a.
Concentration(mM)
ΔG (J/mol)
PEG PVP
24 °C 37 °C 52 °C 24 °C 37 °C 52 °C
2 −2213.07 −1545.71 −1434.04 −2262.97 −1693.05 −1550.724 −3630.90 −3281.46 −2830.42 −3848.15 −3527.15 −3013.716 −4506.09 −3997.14 −3712.52 −4752.32 −4326.67 −3829.678 −5025.12 −4587.93 −4349.57 −5299.81 −5029.29 −4545.0110 −5480.77 −5194.03 −4919.99 −5807.20 −5580.85 −5006.14
b.
Temperature(°C)
ΔH (kJ/mol) Ks (M−1) r2
PEG PVP PEG PVP PEG PVP
24 −11.648 −15.069 1002.4010 1200.3970 0.9963 0.984637 804.7858 1014.9752 667.3635 710.8913
Fig. 9. i. In vitro dissolution profiles of (a) original ART powder, (b) physical mixture ofART–PVP 1:1, (c) physical mixture of ART–PVP 1:6, (d) spray dried ART, (e) spray driedART–PVP 1:6, and (f) ART–PEG composite particles at 1:6 ratio; ii. Weibull releasemodel fit to the dissolution profiles of the original ART powder, Spray dried ART andART/PVP composites.
285N.G. Sahoo et al. / Powder Technology 203 (2010) 277–287
3.6. Dissolution study
Fig. 9i shows the dissolution profiles of original ART powder, spraydried ART particles, ART–PEG, and spray dried ART–PVP compositeparticles, and the corresponding physical mixture of ART–PVP. Thedissolution parameters such as DC (concentration of drug dissolved atparticular time), %DE (percent dissolution efficiency at particulartime), RD (relative dissolution rate at particular time), and MDT(mean dissolution time) are presented in Table 3. It is evident fromFig. 9i and Table 3 that the dissolution of original ART was very low(DC30 min=20 μg/ml). However, the spray dried ART particlesenhanced the dissolution (DC30 min=55.45 μg/ml) within 30 min ascompared to the original ART powder. The dissolution of ART from allspray dried ART–PVP composite particles was markedly increasedcompared to the original ART powder and spray dried ART particles.The dissolution profile of ART from the physical mixture of ART andPVP at ART–PVP ratio of 1:1 was measured. The dissolution of ARTfrom the physical mixture was slightly higher (DC30 min=30.3 μg/ml)as that from original ART. The drug dissolution was increased withincreasing the amount of drug carrier in the spray dried ART–PVPcomposite particles. The highest improvement (235.97 μg/ml) wasobserved at the highest carrier level i.e. ART–PVP=1:6. Comparingwith enhancement in the dissolution of ART using PEG as a carrier, themaximum amount dissolved for the spray dried ART–PEG compositeparticles at the ratio of 1:6 was 216.83 μg/ml after 4 h, which wasmuch higher than the original ART powder and spray dried ART, butlower than that of the spray dried ART–PVP composite particles at thesame ratio.
The value of %DE30min was enhanced from 2.5 for original ART to6.9 for the spray dried ART, then to 19.4 for the spray dried ART–PVPcomposite at 1:6 ratio. Similar to %DE30min values, the value ofRD30min was the lowest for the spray dried ART (2.67) and thehighest for the spray dried ART–PVP composite (7.76) at 1:6 ratio.Both %DE30min and RD30min values for the physical mixture of ARTand PVP at an ART-PVP ratio of 1:1 were lower (3.78 and 1.51respectively) than the spray dried ART and the spray dried ART–PVP494 composite at 1:1 ratio (11.95 and 4.78 respectively). The highestdissolution improvement with the spray dried ART–PVP compositewas observed at the highest PVP concentration. The spray dried ART–PEG composite particles at ratio 1:6 also showed improvement in drugdissolution, but lower than the corresponding spray dried ART–PVPcomposite particles.
It is also verified that the dissolution of the ART can be influencedby PVP and PEG. The calculated MDT values for all the samples

Table 3Dissolution parameters of ART and spray dried composites.
Dissolutionparameters
OriginalART
Physical mixingART–PVP=1:1
Spray driedART
Spray dried ART–PVP composites Spray dried ART–PEG composite
1:1 1:2 1:4 1:6 1:6
DC30mina 20.00 30.30 55.45 95.65 115.65 130.45 155.31 130.45
DC1 h 30.10 41.10 80.95 148.76 168.23 180.34 190.67 175.97DC2 h 41.10 59.20 110.23 166.31 182.43 198.12 210.87 198.93DC3 h 48.84 65.50 118.60 176.78 190.34 210.72 225.57 208.78DC4 h 52.40 68.60 128.56 182.43 198.57 218.56 235.97 216.83%DE30min
b 2.50 3.78 6.93 11.95 14.45 16.31 19.41 16.31RD30min
c – 1.51 2.68 4.78 5.78 6.52 7.76 6.30MDTd 0.99 0.89 0.84 0.65 0.60 0.58 0.57 0.58f1e – 42.51 172.26 387.84 466.63 520.34 590.58 481.99
f2f – 44.14 20.85 11.66 10.14 9.32 8.46 9.54
a DC: concentration of drug dissolved at particular time (μg/ml).b %DE: percent dissolution efficiency at particular time.c RD: relative dissolution rate at particular time.d MDT: mean dissolution time (hour) at 3 h.e f1: difference factor at 1 h.f f2: similarity factor at 1 h.
286 N.G. Sahoo et al. / Powder Technology 203 (2010) 277–287
investigated (Table 3) support this finding. MDT reflects the time forthe drug to dissolve and is the first statistical moment for thecumulative dissolution process that provides an accurate drug releaserate [27]. A higherMDT value indicates a greater drug retarding ability[28]. The MDT values of original ART at 3 h were higher than that ofthe spray dried ART, ART–PEG and ART–PVP composite particles,which suggested a lower dissolution rate. The lowest MDT value wasobserved in the case of the spray dried ART–PVP composite particlesat 1:6 ratios, which reflected a higher dissolution rate compared toother ART–PVP samples and ART–PEG composite particles at the sameratio.
Furthermore, comparison between the dissolution profiles of ARTfrom different formulations wasmade by the difference factor (f1) andsimilarity factor (f2). According to the FDA's guidelines, f1 values lowerthan 15 (0–15) and f2 values greater than 50 (50–100) show thesimilarity of the dissolution profiles [29]. The calculated f1 and f2values are reported in Table 3. It was observed that the dissolutionprofiles of ART from all the samples (i.e. spray dried ART, spray driedART–PVP composite particles at all ratios and spray dried ART–PEGcomposite particles at 1:6) and from original ART were not similar asf1 values for all these formulations were higher than 15, where as theirf2 values were lower than 50. But in the case of the physical mixing ofART–PVP at 1:1 ratio, the f1 value was slightly higher than 15 and f2value was close to 50. The dissolution profiles of ART from the spraydried ART–PVP at different ratios were not similar. From these studies,we can conclude that the spray dried ART–PVP at 1:6 ratio showed thebetter in vitro dissolution profile and lower MDT, so the dissolution ofART from this sample was the highest as compared to the rest of thesamples.
According to the Noyes–Whitney equation, the saturation solubil-ity and dissolution rate of a drug can be increased by reducing theparticle size to increase the particle surface area [30,31]. The particlesize of original ART powder was reduced to a size in a range of
Table 4Statistical parameters of various samples obtained after fitting the drug release data to vari
Samples Korsmeyer-Peppas
k n r2
Original ART 0.0736 0.4383 0.9Spray dried ART 0.1979 0.3716 0.9Phy. mix. ART:PVP=1:1 0.1052 0.3838 0.9Spray dried ART–PVP composites 1:1 0.3330 0.2568 0.9
1:2 0.3795 0.2153 0.91:4 0.4161 0.2159 0.91:6 0.4592 0.1882 0.9
Spray dried ART–PEG composite 1:6 0.4126 0.2172 0.9
approximately 1–5 µm in the composites prepared by the spray drier,which resulted in the increased dissolution of ART. The DSC and XRDstudies also revealed that the crystallinity of ART in the compositeswas lower, especially in the case of the spray dried ART–PVPcomposite at ratio of 1:6. The extent of crystallinity also influencesthe dissolution of the drug. An amorphous or metastable form willdissolve at the faster rate because of its higher internal energy andgreater molecular motion, as compared to crystalline materials[32,33]. From the above results, it was also observed that thedissolution of ART from the spray dried ART–PVP composite particleswas higher than from the spray dried ART–PEG composite particles.This may be due to the higher amorphizing properties of PVP than thePEG, as reported in an earlier study [21]. Our spray dried ART with theincreased dissolution rate could translate into an enhanced bioavail-ability upon oral administration.
3.7. Kinetic mechanism
To understand the mechanism of drug release, various modelswere used to fit the dissolution kinetics of the ART. The regressionparameters obtained after fitting various release kinetic models to thein vitro dissolution data are shown in Table 4. In our studies for thespray dried ART–PVP and ART–PEG composites, the best fit to variousmodels followed the order of Korsmeyer-Peppas=WeibullNHiguchi.The analysis of experimental data in the light of the Korsmeyer-Peppas equation [33], as well as the interpretation of the corre-sponding release exponent values (n) leads to a better understandingof the balance between the purely diffusional and purely erosion-controlled mechanisms. The values of diffusional exponent ‘n’,obtained from the slopes of the fitted Korsmeyer-Peppas model,ranged from 0.217 to 0.438. From these values, we can conclude thatall of our samples tended to exhibit the Fickian diffusionalcharacteristic which was more prominent for the spray dried ART–
ous release kinetic models.
Higuchi Weibull
K r2 ks n r2
954 27.79 0.9901 0.0765 0.4614 0.9959904 70.34 0.9644 0.2209 0.4306 0.9920900 37.8 0.9692 0.1112 0.4128 0.9908755 106.9 0.8607 0.4058 0.3333 0.9781799 117.6 0.8120 0.4782 0.2903 0.9819878 129.0 0.8208 0.5398 0.3027 0.9897976 139.2 0.7899 0.6175 0.2733 0.9983899 128.1 0.8244 0.5338 0.3033 0.9917

287N.G. Sahoo et al. / Powder Technology 203 (2010) 277–287
PVP composite at 1:6, as the corresponding values of ‘n’ were alwayslower than the standard value of 0.45 for the Fickian release behavior[34].
The Weibull model also showed the excellent level of fitting withthe experimental data as shown in Fig. 9ii and hence can be used toanalyze the drug release kinetics. The n values obtained for all thesamples were smaller than 1, which implied the parabolic shape of thedissolution curve with a higher initial slope and after that becomingconsistent with the exponential [22]. From Table 4, the releaseconstant ks values for the spray dried ART and the ART/PVPcomposites were smaller than 1 and in both cases greater than thatfor the original ART and the physical mixture, indicating a fasterdissolution rate for the spray dried ART and the ART/PVP composites.
Our spray dried formulations were also observed to yieldstatistically valid correlations with the Higuchi model. The resultsreflected the prevalence of diffusional mechanistic phenomena, inconsonance with the results obtained while fitting to the Korsmeyer-Peppas model. As can be seen from Table 4, the values of k, K and ksrelease kinetic constants increased from those for the spray driedART tothe significantly higher values for the ART composites. The increasesin those values were greater in the case of ART–PVP composites than inthe ART–PEG composites, suggesting a higher dissolution rate for theART–PVP composites than the ART–PEG composites.
4. Conclusions
This study demonstrated that our modified multi-fluid nozzlespray drier is able to prepare ART–PVP and ART–PEG compositemicroparticles with significantly higher dissolution without theproblem of finding and using a common solvent for a drug and acarrier. The dissolution of ART in the composite particles depended onthe type of drug carrier, carrier concentration and crystallinity. Thehighest improvement in dissolution was observed in the case of thespray dried ART–PVP composite microparticles with the higherpolymer concentration. The Weibull and Korsmeyer-Peppas modelmost fitted the in vitro dissolution data and showed the drug releasekinetics as the Fickian diffusion. ART microparticles fabricated usingour systematic methods could have a high potential for delivery inmuch smaller doses compared with commercial preparation contain-ing the normal form of the drug.
Acknowledgement
Authors acknowledge the financial support from Lee Kuan YewPostdoctoral Fellowship and SUG grant M58050023, NTU, Singapore.
References
[1] C.A. Lipinsk, F. Lombardo, B.W. Dominy, P.J. Feeney, Experimental and computa-tional approaches to estimate solubility and permeability in drug discovery anddevelopment settings, Adv. Drug Deliv. Rev. 46 (2001) 3–26.
[2] B. Subramaniam, R.A. Rajewski, K. Snavely, Pharmaceutical processing withsupercritical carbon dioxide, J. Pharm. Sci. 86 (1997) 885–890.
[3] B.C. Hancock, G. Zografi, Characteristics and significance of the amorphous state inpharmaceutical systems, J. Pharm. Sci. 86 (1997) 1–12.
[4] M.J. Grau, O. Kayser, R.H. Muller, Nanosuspensions of poorly soluble drugs-reproducibility of small scale production, Int. J. Pharm. 196 (2000) 155–157.
[5] E. Merisko-Liverside, G.G. Liversidge, E.R. Cooper, Nonosizing: a formulationapproach for poorly-water soluble compounds, Eur. J. Pharm. Sci. 18 (2003)113–120.
[6] N. Rasenack, H. Hartenhauer, B.W. Muller, Microcrystals for dissolution rateenhancement of poorly water-soluble drugs, Int. J. Pharm. 254 (2003) 137–145.
[7] T.L. Rogers, K.A. Overhoff, P. Shah, P. Santiago, M.J. Yacaman, K.P. Johnson, R.O.William III, Micronized powders of a poorly water soluble drug produced by aspray-feezing into liquid-emulsion process, Eur. J. Pharm. Biopharm. 55 (2003)161–172.
[8] H. Takeuchi, S. Nagira, H. Yamamoto, Y. Kawashima, Solid dispersion particles ofamorphous indomethacin with fine porous silica particles by using spray-dryingmethod, Int. J. Pharm. 293 (2005) 155–164.
[9] M.D.L. Moretti, E. Gavini, C. Juliano, G. Pirisino, P. Giunchedi, spray driedmicrospheres coantaining ketoprofen formulated into capsules and tablets, J.Microencapsul. 18 (2001) 111–121.
[10] J. Jung, M. Perrut, Particle design using supercritical fluids: literature and patentsurvey, J. Super. Fluids. 20 (2001) 179–219.
[11] P. Augustijns, A. D'Hulst, J.V. Daele, R. Kinget, Transport of artemisinin and sodiumarsenate in caco-2 intestinal epithelial cells, J. Pharm. Sci. 85 (1996) 577–579.
[12] L.B. Barradell, A. Fitton, Artesunate, a review of its pharmacology and therapeuticefficacy in the treatment of malaria, Drugs 50 (1995) 714–741.
[13] H.A.C. Titulaer, J. Zuidema, C.B. Lugt, Formulation and pharmacokinetics ofarthemisinin and its derivatives, Int. J. Pharm. 69 (1991) 83–92.
[14] J.W. Wong, K.H. Yuen, Improved oral bioavailability of artemisinin throughinclusion complexation with β-, and γ-cyclodextrins, Int. J. Pharm. 227 (2001)177–185.
[15] J.W. Wong, K.H. Yuen, Inclusion complexation of artemisinin with α-, β-, and γ-cyclodextrins, Drug Dev. Ind. Pharm. 29 (2003) 1035–1044.
[16] B. Beppu, T. Ozeki, Y. Sasaki, T. Mizoe, Y. Takashima, H. Yuasa, H. Okada,Preparation of particles for dry powder inhalation using a novel 4-fluid nozzlespray drier, J. Pharm. Sci. Technol., Jpn. 63 (2003) 228–237.
[17] N.G. Sahoo, A. Abbas, Z. Judeh, C.M. Li, K.H. Yuen, Solubility enhancement of apoorly water-soluble anri-malarial drug: experimental design and use of amodified multifluid nozzle pilot spray drier, J. Pharm. Sci. 98 (2009) 281–296.
[18] S.S. Zhao, High-performance liquid chromatographic determination of artemisi-nin (qinghaosu) in human plasma and saliva, Analyst 112 (1987) 661–664.
[19] T. Higuchi, K. Connors, Phase solubility techniques, Adv. Anal. Chem. Instrum. 4(1965) 17–123.
[20] A. Martin, Physical Pharmacy, Physical Chemical Principles in the PharmaceuticalSciences4th ed., Lea and Febiger, Philadelphia, 1993.
[21] N. Ahuja, O.M. Katare, B. Singh, Studies on dissolution enhancement andmathematical modeling of drug release of a poorly water-soluble drug usingwater-soluble carriers, Eup. J. Pharm. Biopharm. 65 (2007) 26–38.
[22] P. Costa, J.M.S. Lobo, Modeling and comparison of dissolution profiles, Eur. J.Pharm. Sci. 13 (2001) 123–133.
[23] T. Ozeki, S. Beppu, T. Mizoe, Y. Takashima, H. Yuasa, H. Okada, Preparation of two-drug composite microparticles to improve the dissolution of insoluble drug inwater for use with a 4-fluid nozzle spray drier, J. Control. Release 107 (2005)387–394.
[24] M. Cirri, P. Mura, A.M. Rabasco, J.M. Ginés, J.R. Moyano, M.L. Gònzalez-Rodrìguez,Characterization of ibuproxam binary and ternary dispersions with hydrophiliccarriers, Drug Dev. Ind. Pharm. 30 (2004) 65–74.
[25] M. Shahjahan, R.P. Enever, Investigation of the nature of the interaction ofnitrofurazone with urea, Int. J. Pharm. 82 (1992) 229–232.
[26] A.C. Jain, M.C. Adeyeye, Hygroscopicity, phase solubility and dissolution of varioussubstituted sulfobutylether-β-cyclodextrins (SBE) and danazol-SBE inclusioncomplexes, Int. J. Pharm. 212 (2001) 177–186.
[27] C. Reppas, E. Nicolaides, Oral Drug Absorption Prediction and Assessment, in: J.B.Dressman, H. Lennernäs (Eds.), Marcel Dekker, Inc, New York, 2000, pp. 229–254.
[28] M.L. Vueba, L.A.E. Batista de Carvalho, F. Veiga, J.J. Sousa, M.E. Pina, Influence ofcellulose ether polymers on ketoprofen release from hydrophilic matrix tablets,Eur. J. Pharm. Biopharm. 58 (2004) 51–59.
[29] E. Demirtürk, L. Öner, Evaluation of in vitro dissolution profile comparisonmethods of immediate release gliclazide tablet formulations, J. Facul. Pharm. 25(2005) 1–10.
[30] A.A. Noyes, W.R. Whitney, The rate of solution of solid substances in their ownsolutions, J. Am. Chem. Soc. 19 (1897) 930–934.
[31] R.H. Müller, C. Jacobs, O. Kayser, Nanosuspensions as particulate drug formula-tions in therapy rationale for development and what we can expect for the future,Adv. Drug. Deliv. Rev. 47 (2001) 3–19.
[32] B.C. Hancock, G. Zografi, Characteristic and significance of the amorphous state inpharmaceutical systems, J. Pharm. Sci. 86 (1997) 1–12.
[33] H. Valizadeh, A. Nokhodchi, N. Qarakhani, P. Zakeri-Milani, S. Azarmi, D.Hassanzadeh, R. Lobenberg, Physicochemical characterization of solid dispersionsof indomethacin with PEG 6000, Myrj 52, lactose, sorbitol, dextrin, and eudragit®
E100, Drug Dev. Ind. Pharm. 30 (2004) 303–317.[34] R.W. Korsmeyer, R. Gurney, E. Doelker, P. Buri, N.A. Peppas, Mechanisms of solute
release from porous hydrophilic polymers, Int. J. Pharm. 15 (1983) 25–35.