fabrication of fiber bragg gratings using … thesis.pdf · fabrication of fiber bragg gratings...
TRANSCRIPT
Ministry of Higher Education &
Scientific Research
University of AL-Nahrain
College of Engineering
FABRICATION OF FIBER BRAGG GRATINGS USING
INFILTRATED HOLLOW CORE PHOTONIC CRYSTAL
FIBERS
A Thesis
Submitted to the College of Engineering of
Al-Nahrain University in Partial Fulfillment
of the Requirernents for the Degree of Master of Science
in
Laser and Optoelectronics Engineering
by
Farah Salim Hanash Ali
(B.Sc, 2014)
Rabia’a Ul-Thani 1438
January 2017


I
ABSTRACT
In this work, four fibers Bragg gratings were fabricated by infiltration different
volumes of liquids (star line Glass Mechanix optical adhesive material, olive oil
diluted with ethanol) into the hollow core photonic crystal fiber (HC19-1550
(Thorlab company)). The amplitude splitting interferometric technique with a high
resolution specially designed translation stage was used for the fabrication process.
This stage is capable of moving the fibers in micrometer resolution steps. The
fabrication was carried out using blue laser operated at wavelength of 405 nm. The
infiltrated four photonic crystal fibers were exposed to the blue laser beam of 405
nm forming periodic fringes for Bragg grating generation. These fringes were
generated from the interference of two splitted laser beams. The fabricated Bragg
fiber was about 3.8 cm in length and the average grating period was about 0.224
μm.
The four fibers were analyzed by an optical microscope which displayed the areas
that were cured using blue laser. The fabricated fibers also were tested by putting
laser beam at one end of the fiber and determining the transmittance at the other
fiber end by optical signal analyzer (Thorlabs-CCS200). The resulted Bragg grating
fibers have 653.3 nm Bragg reflected wavelength. The results also showed that fiber
with higher volume of olive oil has the highest reflection peak about 96.09647 %
with the greatest FWHM (full width at a half maximum) about 0.74 nm.
Three of the fabricated fibers (B, C and D) that contained olive oil were prepared
for testing magnetic field sensor. The tsot ro osg st rser all the fibers shifted to
near infrared range. The results also showed that fiber with higher volume of olive
oil has the greatest magnetic wavelength shift about 653.4 nm, the highest fiber
sensitivity about 0.000494623656 nm/ Gauss, the highest reflection peak about
96.91827 %, and the greatest FWHM eogtt 0.98 nm.

II
List of Contents
Content Page
Abstract I
List of Contents II
Notations V
List of Tables VIII
List of Figures
IX
CHAPTER ONE: Introduction
1.1 Introduction 1
1.2 Liquid Crystal Bragg Grating 2
1.3 Literature Survey 3
1.4 Aims of the Project
6
CHAPTER TWO: Theory of Fiber Bragg Grating
2.1 Optical Fibers 7
2.2 Photonic Crystal Fiber 8
2.3 Fiber Bragg Gratings Principles 9
2.4 Photosensitivity in Polymer Adhesives 14
2.5 Fiber Bragg Grating Fabrication Techniques 16
2.5.1. Internally Inscription FBGs Technique 17
2.5.2. Externally Inscription FBGs Techniques 18
2.5.2.1 Amplitude Splitting Interferometry Technique 19
2.5.2.2 Wavefront Splitting Interferometry Technique 21
2.5.2.3 Phase Mask Technique 22
2.5.2.4 Point by Point Inscription Technique 25
2.6 Olive Oil 25

III
2.7 Capillary Action 25
2.8 FBG Magnetic Field Sensor
26
CHAPTER THREE: Experimental Preparation and Arrangement of
Bragg Infiltrated Materials Inside PCFs
3.1 Preparation for Fabrication FBG 28
3.2 Photo Polymer Adhesive Photosensitive Material 30
3.3 Olive Oil 31
3.4 Fiber Infiltration 32
3.4.1 Theoretical Calculations for Infiltration Liquid Mixture
Inside the Air Holes of the PCF
33
3.5 Inscriptions on the Fiber 35
3.5.1 Experimental Arrangement of the Fabrication Process 37
3.5.2 Experimental Set up of the Fabrication Process 38
3.5.2.1 The Optical System 39
3.5.2.2 The Linear Translation Stage 41
3.5.2.3 The Control Unit 43
3.6 FBG Testing Setup for Output Detection and Data Recording 47
3.7 Microscopic Images of the Inscription PCFs 49
3.8 The Optical Properties 52
3.8.1 FBG Inscribted on PCF (A) Optical Properties 52
3.8.2 FBG Inscribted on PCF (B) Optical Properties 54
3.8.3 FBG Inscribted on PCF (C) Optical Properties 55
3.8.4 FBG Inscribted on PCF (D) Optical Properties 56
3.8.5 The Differences between the Four Graphs of Output
Spectrums
57
3.9 Reflected Bragg Wavelength Simulation
59

IV
CHAPTER FOUR: Application of Fiber Bragg Grating in Magnetic
Sensing Technology
4.1 Fiber Preparation 64
4.2 Experimental Arrangement Diagram and Setup of Magnetic
Field Sensor
64
4.3 The Optical Properties Results of Bragg Reflected Wavelengths Shifts
67
CHAPTER FIVE: Conclusions and Future Work
5.1 Conclusions 73
5.2 Future Work 74
References 75
APPENDIX (A) A
APPENDIX (B) B
APPENDIX (C) C
APPENDIX (D) D
APPENDIX (E) E
APPENDIX (F) F
APPENDIX (G) G
APPENDIX (H) H
APPENDIX (I) I

V
Notations
Symbols
The numerical aperture
Fiber core refractive index
Fiber cladding refractive index
The incident angle
The normalized frequency
Incident light wavelength
The core radius
The grating Period
The angle between the scattering planes and the incident planes
Integer
ℏωf The reflected radiation frequency
ℏωi The incident frequency
The incident wave vector
The grating wave vector
The scattering radiation wave vector
Pi
The effective refractive index of the fiber core
The Bragg Wavelength
The number of grating planes
Bragg grating Length
Index of refraction profile
The amplitude of the refractive index perturbation
The distance along the fiber longitudinal axis
The grating reflectivity
The coupling coefficient

VI
The wave vector detuning
The propagation constant
Function of the normalized frequency
The inscription UV laser beam
Half the angle separation between the two beams when recombining
Diffracted beam orders
The relief pattern period or phase mask period
The angle of diffraction
The incident angle of the UV inscription beam
The height of the liquid
The surface tension
The contact angle
The density of liquid
Acceleration gravity
The capillary radius
The velocity of the liquid in the capillary tube
The coefficient of viscosity
The time that the liquid takes to rise inside the capillary tube
Capillary tube volume
The rotation angle of the polarized light
The path length
The magnetic field component
Verdet constant

VII
Abbreviations
UV Ultraviolet
HPDLC Holographic polymer dispersed liquid crystal
LC Liquid crystal
FBGs Fiber Bragg gratings
NIR Near infrared
FWHM Full width at a half maximum
FBG Fiber Bragg grating
PCF Photonic crystal fiber
PCFs Photonic crystal fibers
H2 Hydrogen
Ge Germanium
PMMA Poly methyl methacrylate
mPOFs Micro structured Polymer Optical Fibers
SI Step index
GI Graded index
IG-PCF The index guided photonic crystal fiber
PBG-PCF Photonic bandgap photonic crystal fiber
PBG Photonic bandgap
NOA Norland Optical Adhesives
POFBGs polymer optical fiber Bragg gratings
POF Polymer optical fiber
WDM Wavelength division multiplexing
UV-VIS-IR Ultraviolet-Visible-Infrared
PC Personal computer
PWM Pulse width modulation
CW Continuous wave
TTL Time to live
OSA Optical signal analyzer

VIII
CCD Charge coupled device
TMM Transfer matrix method
DGM Digital Gauss-meter
List of Tables
Table Title Page
Table (3.1) The variations between the four PCFs 58
Table (4.1) The numerical examination of PCF (B) 68
Table (4.2) The numerical examination of PCF (C) 69
Table (4.3) The numerical examination of PCF (D) 70

IX
List of Figures
Figure Title Page
Figure (1.1) HPDLC fabrication process 3
Figure (2.1) Fiber Principles 8
Figure (2.2) (a) solid core PCF, (b) hollow core PCF 9
Figure (2.3) Illustration of uniform Bragg grating inside a fiber 10
Figure (2.4) The simulation of reflection spectrum of FBG as a function
of wavelength detuning
13
Figure (2.5) A typical FBG transmission spectrum 14
Figure (2.6) UV light cure in case of photoinitiators compounds adding 15
Figure (2.7) Free cationic and radical photoinitiators and their activation
reaction
16
Figure (2.8) Experimental setup of single beam internal technique 18
Figure (2.9) A typical arrangement of amplitude splitting
interferometer technique
19
Figure (2.10) (a) Lloyd’s mirror wavefront splitting interferometer
technique arrangement, (b) prism wavefront splitting
interferometer technique arrangement
21
Figure (2.11) A UV laser beam launching into a phase mask, representing
different orders of the splitted laser
22
Figure (2.12) Interference pattern generated from –1 and +1 diffraction
orders of the phase mask
24
Figure (3.1) The flow chart of preparation to fabricate FBG 29
Figure (3.2) Illustrate the absorption of the polymer star line 30
Figure (3.3) Laser diode spectrum of 405 nm 31
Figure (3.4) Olive oil transmission spectrum 32
Figure (3.5) The velocity of liquid mixture inside the optical fiber 33
Figure (3.6) The Time that liquid mixture takes to rise inside the fiber. 34
Figure (3.7) The flow chart of inscription on the fiber 36

X
Figure (3.8) Experimental Arrangement diagram 37
Figure (3.9) Experimental Fabrication set up 39
Figure (3.10) The path of the laser beam in the optical setup 40
Figure (3.11) The two laser beams are interfering to make the fringes
pattern
41
Figure (3.12) A translation stage that is moves linearly in z-axis 42
Figure (3.13) The bipolar stepper motor and the lead screw 42
Figure (3.14) The control unit of the system 43
Figure (3.15) A3967 micro stepping easy driver board 43
Figure (3.16) Arduino Uno R3 microcontroller board 44
Figure (3.17) The schematic of the control unit circuit 46
Figure (3.18) Setup to test FBG 48
Figure (3.19) FBG of PCF (A) under optical microscope with average
grating period 0.2241250652 μm
49
Figure (3.20) FBG of PCF (B) under optical microscope with average
grating period 0.2241250653 μm
50
Figure (3.21) FBG of PCF (C) under optical microscope with average
grating period 0.2241250653 μm
51
Figure (3.22) FBG of PCF (A) under optical microscope with average
grating period 0.2241249966 μm
51
Figure (3.23) Transmission spectrum of 651.3 nm diode laser guided
inside a hollow core PCF (HC19-1550 (Thorlab company))
without any infiltrated material
52
Figure (3.24) The transmission spectrum of the laser diode after coupling
with the fabricated FBG in PCF (A)
54
Figure (3.25) The transmission spectrum of the laser diode after coupling
with the fabricated FBG in PCF (B)
55
Figure (3.26) The transmission spectrum of the laser diode after coupling
with the fabricated FBG in PCF (C)
56

XI
Figure (3.27) The transmission spectrum of the laser diode after coupling
with the fabricated FBG in PCF (D)
57
Figure (3.28) The transmission spectrums of the fabricated FBGs in four
PCFs
58
Figure (3.29) Reflection/Transmission of PCF (A) with grating length of
3.8 cm
59
Figure (3.30) Reflection/Transmission of PCF (A) with grating length
about 9.8 cm
60
Figure (3.31) Reflection/Transmission of PCF (B) 61
Figure (3.32) Reflection/Transmission of PCF (C) 62
Figure (3.33) Reflection/Transmission of PCF (D) 63
Figure (3.34) The absorbance peak of olive oil appears at wavelength 669
nm and its emission peak when the material excited at that
wavelength
63
Figure (4.1) (a) The experimental arrangement diagram of magnetic field
sensor (,o) The experimental set up of magnetic field sensor
65
Figure (4.2) The spectrums of different Bragg reflected
wavelengths shifts of PCF (B)
67
Figure (4.3) The spectrums of different Bragg reflected
wavelengths shifts of PCF (C)
68
Figure (4.4) The spectrums of different Bragg reflected
wavelengths shifts of PCF (D)
69
Figure (4.5) Comparison curves of the electrical current versus magnetic
flux density of three PCFs (B, C, and D)
70
Figure (4.6) Comparison curves of the magnetic flux density versus
Bragg reflected wavelengths shifts of three PCFs (B, C, and
D)
71
1
CHAPTER ONE
Introduction
1.1 Introduction
The discovery of optical fibers has developed the field of
telecommunications. Over the past three decades, the developments in optical fiber
has certainly improved and reshaped fiber optic technology. In addition to
applications in telecommunications, optical fibers are also used in the fields of fiber
optics sensors, fiber lasers, and fiber amplifiers. Despite the enhancements in optical
fiber manufacturing and progressions in the field in general, basic optical
components have been a challenge to integrate with fiber optics, such as mirrors,
wavelength filters, and partial reflectors. In recent times, all these have been
improved with the ability to change the core refractive index in an optical fiber
using optical absorption of ultraviolet (UV) light. This photosensitivity of optical
fibers allows the fabrication of grating planes in the core of fibers. These gratings
planes are obtained by permanently varying the refractive index in a periodic form
along the core of the fiber. A periodic variation of the refractive index in the fiber
core acts like a wavelength selective mirror that satisfies the Bragg condition i.e. it
forms a fiber Bragg grating. The grating period and length of the grating, together
with the strength of the variation of the refractive index, limited whether the grating
had a high or low reflection over a wide or narrow range of wavelengths [1].
The first explanations of the refractive index variations in germanosilica
fibers were noticed and reported by Hill and co-workers [2-3] in 1978. They
designed a permanent grating written in the core of the fibers by launching it into
the fiber the argon ion laser line at 488 nm. This specific grating had a very weak
index variation, which was valued to be of the order of 10-6
causing in a narrow
band reflection filter at the inscription wavelength. Photosensitivity in optical fibers
remained dormant for years after its discovering it by Hill et al. [2] essentially as a

2
result of limitations of the fabricating technique. However, an improved interest has
grown with the demonstration of the side fabricating technique by Meltz et al. [4]
nearly ten years later. In the past few years, international groups achieved
developments in direct optical fabrication of high quality gratings into the core of
optical fibers by different techniques such as the amplitude splitting interferometry,
wave front splitting interferometry, phase mask, and point by point exposure to
ultraviolet laser light. Photosensitivity of optical fibers has, certainly, opened a new
area in the field of fiber-optic based devices [5-7].Inventing new Bragg grating
structures leads to their way in the fields of telecommunication and sensor devices.
1.2 Liquid Crystal Bragg Grating
Electrical and magnetic fields are effecting on liquid crystals and these
effects have several applications , therefore it’s used as Bragg grating when mixing
with photo polymer phases to form holographic polymer dispersed liquid crystal
(HPDLC), and HPDLC refractive index can be spatially and periodically varied.
This refractive index variation offers a great promise for electrically, magnetically
and optically switchable holographic devices. HPDLC structure is typically formed
by using interferometric photoirradiation. This irradiation induces polymerization
and subsequent phase separation in a mix of a photoreactive monomer and liquid
crystal (LC). During the exposure, in the regions of the mix that receive more
intense irradiation, the monomer is polymerized more efficiently, while LC
molecules are pushed out into the regions that receive a smaller amount of intense
irradiation. Hence, LC molecules are considered to be spontaneously oriented along
the grating vector to form an LC-rich phase. When the applied external voltage goes
beyond the critical voltage, LC molecules go in the same direction of the electric
field and vary the refractive index [8]. Figure (1.1) shows the fabrication process of
HPDLC.

3
Figure (1.1): HPDLC fabrication process [9].
The strong polarization state in the diffraction grating is considered to arise
from the highly ordered orientation of LC molecules in the droplets. Droplets
morphology and distribution are strongly effect the orientation order of the LC
molecules, particularly when the droplet dimension is some tens or hundreds of
nanometres [10, 11].
1.3 Literature Survey
Several researches study fabrication techniques of fiber Bragg grating using
Photonic crystal fiber and optical adhesive material and test it in sensing
applications. Some of these researches are:
In 2006, E. Wikszak et. al. [12], had fabricated fiber Bragg gratings
(FBGs) using a phase mask technique with near infrared (NIR) femtosecond laser
pulses into a non-photosensitive Erbium doped fiber. A grating length of 40 mm
with a grating period of 1.075 𝜇m was realized. Transmission losses was measured
and it’s about −18.9 dB at =1554.5 nm with a full width at a half maximum
(FWHM) bandwidth of 0.15 nm. The fiber containing the fabricated fiber Bragg
grating (FBG) using pumping, fiber laser with an output power of 38 mW was
possible to achieve.
In 2007, Y. Lai et. al. [13], had fabricated fiber Bragg gratings with a point
by point technique by a femtosecond laser. Fiber Bragg gratings with
spectral quality and first-order Bragg resonances within the C-band are realized

4
by optimizing the fabrication process. The birefringence about (1.2×10⁻⁴) and
a degree of polarization dependent index variation are perceived in these
gratings. Applications of these gratings in resonators are also demonstrated.
In 2008, B. Guan et. al. [14], fiber Bragg gratings were fabricated by use
of two photon ultra violet excitation and characterized for temperature responses,
axial strain, and hydrostatic pressure in pure-silica polarization-maintaining
photonic crystal fiber.
In 2009, Y. Wang et. al. [15], fiber Bragg gratings (FBGs) were fabricated
in pure-silica and Ge-doped photonic crystal fibers (PCFs) with a dual-beam
interference technique and a femtosecond or excimer laser. High flexibility was
observed by such a technique because it allows the fabrication of FBGs for different
Bragg wavelengths. Effects of H2 (Hydrogen)-loading and Ge (Germanium) doping
on the efficiency of grating inscription were investigated by determining the
improvement of Bragg wavelength and attenuation in the transmission spectrum
with an increased exposure dose.
H2-loading dramatically improved the laser-induced index variation not only in Ge-
doped PCFs but also in pure-silica PCFs. A reversible Bragg wavelength shift
during femtosecond pulse irradiation was observed, which showed an internal
temperature rise of about 77 °C.
In 2010, Z. Zhang et. al. [16], had fabricated fiber Bragg grating with
Bragg wavelength of 962 nm in trans-4-stilbenemethanol doped poly(methyl
methacrylate) polymer optical fibers by a phase mask technique with 17% zeroth-
order diffraction for the fabrication wavelength of 325 nm. The zeroth-order
diffraction effect of the phase masks on fiber Bragg grating in polymer optical fiber
was observed by perceiving micrographs of the gratings.
In 2011, Y. Wang et. al. [17], had fabricated fiber Bragg gratings (FBGs)
in two various types of small-core Ge-doped photonic crystal fibers with a UV
laser. FBGs sensing applications were methodically investigated by means of
5
demonstrating the Bragg wavelengths responses to temperature, strain, bending, and
transverse-loading.
In 2012, C. M. Rollinson et. al. [18], had fabricated fiber Bragg gratings
using the phase mask technique. The reflectance peaks from fiber Bragg gratings
have been studied to obtain the relative importance of the grating features. Spectra
measurements of two different fibers with two different phase masks allowed the
contribution from grating features of half the periodicity of a phase mask and of the
periodicity of a phase mask at the Bragg reflected wavelength to be obtained. The
dominance of the phase mask periodicity was qualified to either the small
diameter of the fiber core that limited the diffraction pattern extent, or to the
improved ±2 diffraction orders using a custom made phase mask.
In 2013, T. Elsmann et. al. [19], had fabricated fiber Bragg gratings with
interferometer technique by femtosecond laser pulses of 400 nm wavelength. The
interferometer technique for the fabrication process makes multiplexing practicable.
In 2014, I. Bundalo et. al. [20], fiber Bragg grating (FBG) had written in
Poly methyl methacrylate (PMMA) Micro structured Polymer Optical Fibers
(mPOFs) using UV Phase Mask technique with writing times shorter than 10 min
was demonstrated. The shortest writing time was 6 minutes and 50 seconds and the
longest writing time was 8 min and 50 sec. The FBGs were written in a 125 µm
PMMA mPOF having three rings of holes; Bragg reflection peaks were centred at
632.6 nm and have high reflection as high as 26 dB. It also confirmed how the
writing dynamics depends on the intensity of the writing beam.
In 2015, A. Engad et. al. [21], FBG using hollow core PCF filled with
liquid mixture of olive oil and optical adhesive was designed and constructed using
two-beam interferometric technique. Diode laser 405 nm used to write on fiber to
make FBG with Bragg reflected wavelength (λB) of 806 nm. The optical adhesive
material properties and ability to work as Bragg grating are studied too.
It concluded from these studies that Bragg grating can be fabricated in a
PCF. Polymers optical adhesives after exposing to laser radiation can be used to

6
fabricate Bragg grating and the PCF can be filled with olive oil material as liquid
photonic crystal.
In this research, FBGs will be fabricated in hollow core PCFs (HC19-1550
(Thorlab company)) filled with different volumes of liquid mixture consisting from
olive oil, ethanol and optical adhesive material using amplitude splitting
interferometric technique, and then testing these PCFs for magnetic sensing
application.
1.4 Aims of the Project:
This project aims to:
Design and construct a liquid crystal fiber Bragg grating.
Study the application of the fabricated fiber Bragg grating for magnetic
sensing technology.

7
CHAPTER TWO
Theory of Fiber Bragg Grating
In this chapter, several basic concepts of optical fibers, photonic crystal
fibers, fiber Bragg gratings principles are introduced. The photosensitivity in
polymers, fiber Bragg grating fabrication techniques, olive oil, capillary action and
FBG magnetic field sensor are then conducte.
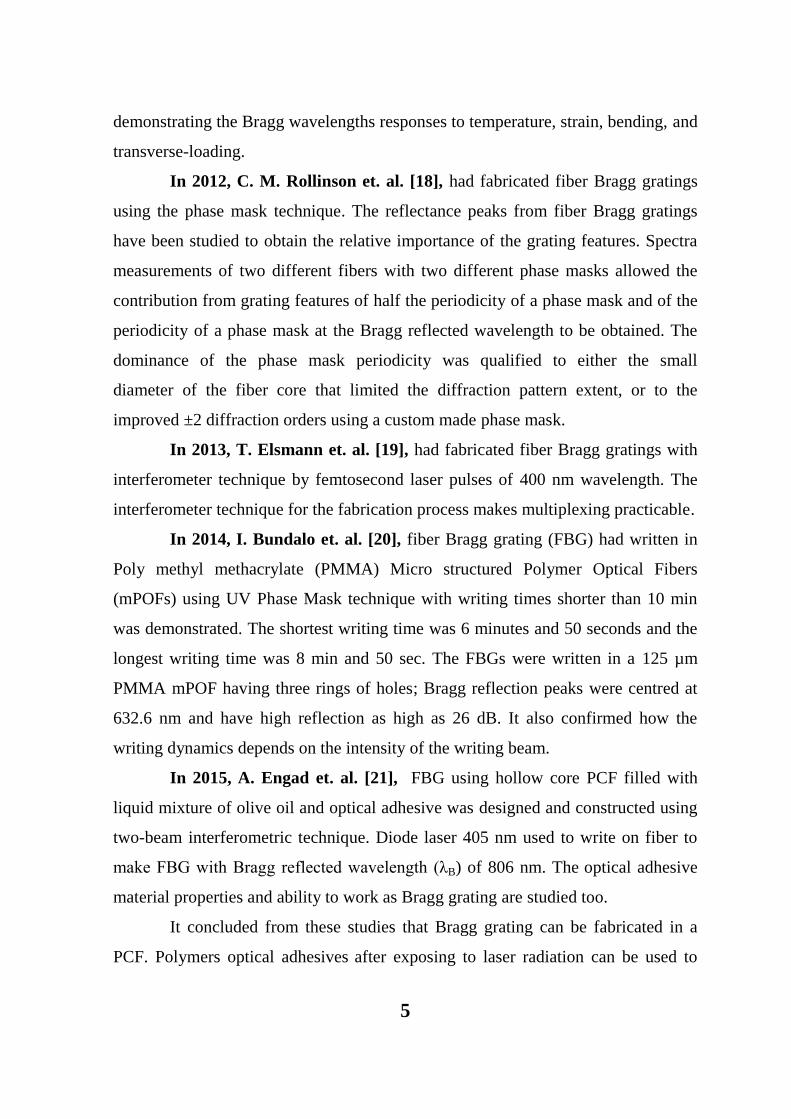
2.1 Optical Fibers
An optical fiber is a cylinder shaped dielectric waveguide. The fiber
consists of a core with an index of refraction nCore and a surrounding cladding layer
with an index of refraction nClad (Figure 2.1). If the refractive index of the core is
larger than the refractive index of the cladding material, the light will be guided in
the fiber core as a result of total internal reflection at the core cladding interface.
The numerical aperture NA, which is the acceptance angle of the fiber, is defined by
these two indices, and it is given by :
√
If the incident angle ( is within the NA, light coupled into the fiber
core is guided . If the incident angle ( is larger, then the light ray will leave the
core of the fiber into the cladding.
Core and cladding boundary may either be abrupt, in step index (SI) fiber,
or gradual, in graded index (GI) fiber.
As a waveguide, the optical fiber supports one or more transverse modes by
which light can be directed along the fiber. Modes number (or the mode volume) is
related to the normalized frequency, , which is a measure to know if the fiber is
8
single mode fiber ( < 2.405) or multimode fiber. The number is given by
equation 2.3 [22]:
Figure (2.1): Fiber Principles [22].
where is incident light wavelength, r is the core radius.
2.2 Photonic Crystal Fiber
Photonic crystal fiber is distinguished by a periodic arrangement of
air holes along the fiber length, centred either on a solid core called index guiding
photonic crystal fiber (IG-PCF) or a hollow core called photonic bandgap photonic
crystal fiber (PBG-PCF). The main difference between conventional fibers and
PCFs depends on the fact is that the PCFs waveguide properties are not from
spatially varying glass composition like in conventional fibers, but from very
tiny arrangement and closely spaced air holes which directed through the whole
fiber length. In contrast with conventional fibers, PCFs can be prepared of a
single material and have some geometric parameters that can be manipulated
presenting large design flexibility. Moreover, these PCFs present also the
opportunity of light guiding in a hollow core, opening new viewpoints in fields for
instance fiber lasers, nonlinear fiber optics, particle guidance, supercontinuum

9
generation, and fiber sensors. So, there is a high concentration of the scientific
community on using PCFs in different field [23].
The main difference between PCFs types is that IG-PCF has a solid core
that is surrounded by micro structured periodic air holes in the clad of the fiber.
These air holes decrease cladding refractive index. IG-PCF guides the light in the
solid core by total internal reflection like the conventional fibers as shown in figure
(2.2 a). In PBG-PCF the light guided in the hollow core that is surrounded by
a micro structured periodic cladding based on a photonic bandgap (PBG) effect
which make the core refractive index lower than the cladding refractive index as
shown in figure (2.2 b) [24] .
Figure (2.2): (a) solid core PCF, (b) hollow core PCF [25].
2.3 Fiber Bragg Gratings Principles
Gratings in a fiber are fabrication result of periodic perturbations within the
fiber core. The perturbations known as grating planes are generally formed by
exposing the fiber core to a UV light interference pattern, which increases the core
refractive index (n Core) at the points of exposure. In the simplest form, the grating
planes are perpendicular to the fiber length and have a constant grating period as the
assumption is made and it’s shown in figure (2.3) [26].

10
Figure (2.3): Illustration of uniform Bragg grating inside a fiber [27].
Phase match between the incident light that is directed along the fiber and
the grating planes is required in order to reflect the light back within the core of the
waveguide along counter propagating modes to meet the Bragg condition and it's
defined by equation 2.4 [26]:
where Λ is the grating planes period, is the angle between the scattering
planes and the incident light , is an integer and λ is the incident light wavelength.
No reflection from the Bragg grating can be detected, if the Bragg condition
is not met i.e. the incident irradiation light is out of phase with the grating planes.
However, if the Bragg condition is satisfied, the light that is reflected from each
grating plane is in phase and constructively interferes, as a result together are added
in a reverse backwards way to the incident irradiation light generating a reflected
back signal called reflected Bragg response. This reflected Bragg response has a

11
center wavelength known as the Bragg reflected wavelength ( ) that is identified
by the Bragg grating parameters. The grating planes are shown in the illustration of
figure (2.3) as steps of index variation; however a factual illustration would look
like nearer to a sinusoidal variation of refractive index along the waveguide core.
The Bragg condition is met if energy and momentum is preserved. Energy
preservation (ℏωf = ℏωi) needs that the reflected radiation frequency to be equal to
the incident frequency. Momentum preservation requests that the summation of the
incident wave vector ( ) and the grating wave vector ( ) is equivalent to the
scattered radiation wave vector ( ) as given in equation 2.5 [26]:
When the grating wave vector ( ) is perpendicular to the grating planes,
then it will be equivalent to . Incident wave vector and diffracted wave
vector are the same in the magnitude but reverse in the direction, so the momentum
preservation condition will be as follow [26]:
(
)
Equation 2.6 is simplified to give Bragg condition for the first order as follow:
Where is the Bragg wavelength, which is the center wavelength of the
reflected response and neff is the effective refractive index of the fiber core along
Bragg grating length [26].
Equation 2.8 is used to obtain the number of grating planes N [28]:
where: is Bragg grating length.

12
For a uniform FBG inscribed in the optical fiber core with a index of
refraction neff, the index of refraction profile is given as follow [29]:
(
)
where is the amplitude of the refractive index perturbation and is the
distance along the fiber longitudinal axis. The grating reflectivity with constant
amplitude modulation and period can be described as follow [29]:
where is the reflectivity, which is a function of Bragg grating
length and incident light wavelength , is the coupling coefficient,
is the wave vector detuning, is the propagation constant,
and √ . The coupling coefficient Ω for the sinusoidal variation of
index perturbation along the fiber longitudinal axis has been found as follow:
where is a function of the normalized frequency of the optical fiber
that represents the fraction of the fiber mode power contained in the fiber core,
[29]. The normalized frequency was given previously in
Equation 2.3.
At the Bragg wavelength, there is no wave vector detuning i.e. equals
zero,so the reflectivity becomes [29]:

13
Figure (2.4): The simulation of reflection spectrum of FBG as a function of
wavelength detuning [29].
The reflection increases by increasing the variation of the refractive index
and Bragg grating length. A simulation of reflection spectrum go FBG as a function
of the wavelength detuning is given in figure (2.4), in which the resonance side
lobes are caused by multiple reflections and from opposed ends of the Bragg grating
zone [29].
Inscription of Bragg grating in a highly photosensitive fiber shows an
obvious transmission feature on the short wavelength side of the Bragg transmitted
peak figure (2.5). This feature is noticeable in the transmission spectrum only and
only the central peak is visible in the reflection spectrum, which is happen as a
result of the light leaving the fiber from the side. Radiation-mode coupling as a loss
mechanism on core-mode transmission has been suggested to explain this
phenomenon . For the cylindrical cladding air boundary, the transmission spectrum
of Bragg grating has many sharp peaks which modulate the radiation mode
coupling. The energy of the light in Bragg grating will be coupled at shorter
wavelengths to other modes, some will be absorbed or reflected, and the rest will
leave the optical fiber. These interactions are shown in the spectrum at wavelengths
that are shorter than the Bragg central wavelength as a series of several transmission
dips [30-31].

14
Figure (2.5): A typical FBG transmission spectrum [31].
2.4 Photosensitivity in Polymer Adhesives
The term photosensitivity refers to the variation of the optical properties
when it exposed to light irradiation of specific wavelength and intensity. It can be
considered in an optical fiber as a measure of the amount of the variation of the
index of refraction in the core of the fiber when it exposed to light irradiation. In
fibers, photosensitivity has significant importance in FBGs fabrication for
telecommunications and sensors applications. Polymer Adhesives systems, which
use UV light range from 315nm to 400nm or visible light range from 400nm to
460nm, to begin curing are very attractive systems to the industrialization engineers,
allowing components assembly and then curing on command by exposing to the UV
light. Many successful applications have been marketed for 30 years by curing of
UV light [32].
Curing by UV radiation is the most effective technique for producing highly
cross-linked-polymer materials. Because of the advantage of this technique in
solvent free formulation gives excellent physical properties and fast reaction rates.
This technology was used in many industrial applications, such as printing plates,
optical fibers, electronic components and fast drying varnishes and ink [33].

15
Moreover, systems that are UV cured are based on cure polymerization
adding, where by adding a cationic or free radical to a double bond of carbon-
carbon or ring of an oxirane, this chain reaction leads to the polymer generation.
Crosslinking reaction is rise by the combination of multifunctional and
monofunctional monomers, which contribute to the strength formulations and heat
resistance. In photoinitiators compounds adding case, UV light cure consists from a
polymerization of multifunctional monomers that are transformed to a polymer
network (tridimensional) as stated as in next reaction scheme (2.6) [34]:
Figure (2.6): UV light cure in case of photoinitiators compounds adding [34].
In order to absorb UV light and make splitting in the reactive species, a
photoinitiator was used (free radical or protonic acid), which initiated a reaction of
the crosslinking polymerization respectively consistent with a cationic or radical
mechanism [34].
The steps of chain termination and propagation basically will be similar in
the polymerization when radicals or ions initiating have been produced, except for
the larger initiation rate that is produced using UV intense light. A liquid polymer
resin could convert within a fraction of a second into a solid polymer . UV curing
technology has a unique advantage which is providing an accurate control of the
setting process temporally and spatially, which will occur on order, in the
illuminated areas selectively [35]. Figure (2.7) shows two types of photoinitiator .

16
Figure (2.7): Free cationic and radical photoinitiators and their activation reaction
[36].
UV irradiation curing adhesives, which are used for glass to glass bonding,
have several types such as Norland Optical Adhesives type NOA 68, NOA 72,
NOA 74, CF-thin Poly-Lite windshield resin type, star line Glass mechanix type
and DYMAX. These polymers adhesives can be used for fabricating photonic
crystal Bragg grating [37] by mixing two different materials of different quantities
for example liquid-crystal material mixed with polymer adhesive material [38] this
is done in order to get large variation in refractive index between the mixed
materials.
2.5 Fiber Bragg Grating Fabrication Techniques
This section refers to the different methods of fabricating FBGs; all were
first applied in silica fiber. The fabrication methods can be classified as two classes:

17
internally inscription and externally inscription methods. Because of the
impracticalities, the internal inscription method is not usually active . It is presented
first owing to its importance in the history of FBGs. Then, externally inscription
methods will be detailed later, externally inscription methods such as amplitude
splitting interferometry, wavefront splitting interferometry, phase mask and point by
point inscription. Externally inscription methods are considered a practical method
to design FBGs; the practicality of each method is explained for polymer optical
fiber Bragg gratings POFBGs inscription [27].
2.5.1. Internally Inscription FBGs Technique
This technique demonstrated the fabrication of internally inscription FBGs
by Hill et. al. in 1978 [2-3]. The periodic variations were made by directing a single
mode laser argon ion type operating at 488 nm or 514.5 nm wavelengths, into fiber
core made of germanium doped with silica. The laser directed through the fiber core
interfered with 4% of reflected backword light from the other end of the optical
fiber. A standing wave within the fiber core is formed due to the interference. At the
high intensity of the laser interference pattern, the index of refraction of the fiber
core was eternally varied and then created periodic variations of the index of
refraction along the fiber. Internally FBG inscription isn’t a useful solution mainly
in polymer optical fiber (POF). Reflected Bragg wavelength will be limited only to
the inscription wavelength, so in the case of fabrication of fiber Bragg grating in
POF, Bragg reflected wavelength will be approximately 325 nm. So, the absorption
of the polymer at this wavelength will limit the transmission of laser light into core
to a few centimetres consequently avoiding any practical fabrication of fiber Bragg
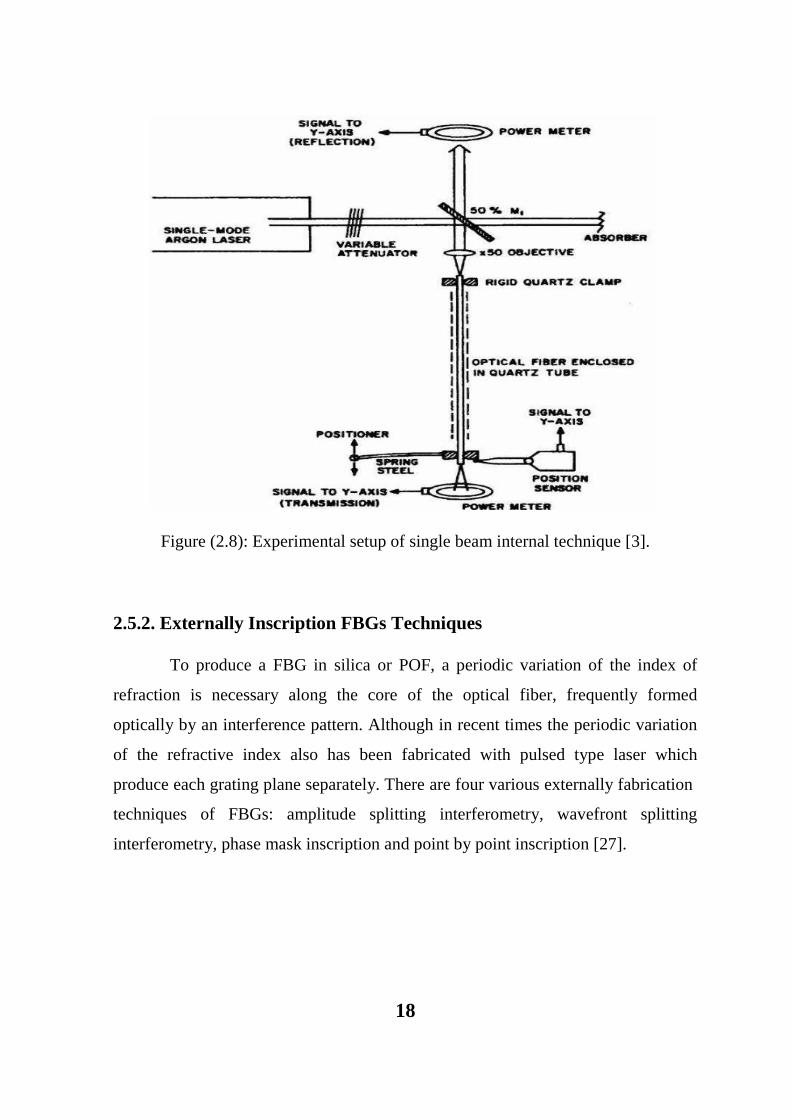
grating in POF by this method. Experimental setup of single beam internal
technique is shown in figure (2.8) [3].
18
Figure (2.8): Experimental setup of single beam internal technique [3].
2.5.2. Externally Inscription FBGs Techniques
To produce a FBG in silica or POF, a periodic variation of the index of
refraction is necessary along the core of the optical fiber, frequently formed
optically by an interference pattern. Although in recent times the periodic variation
of the refractive index also has been fabricated with pulsed type laser which
produce each grating plane separately. There are four various externally fabrication
techniques of FBGs: amplitude splitting interferometry, wavefront splitting
interferometry, phase mask inscription and point by point inscription [27].
19
2.5.2.1 Amplitude Splitting Interferometry Technique [4]
This technique was first used by Meltz et. al. who proved FBG fabrication
results when the fiber exposed with UV interference pattern vertically on its axis.
This fabrication was done as a result of splitting the UV inscription beam into two
equal intensity UV beams, and these two UV beams recombined generating UV
interference pattern. Then this interference pattern was focussed using a cylindrical
lens into the fiber core , using a cylindrical lens effect on increasing the pattern
intensity and this improves the fabrication.
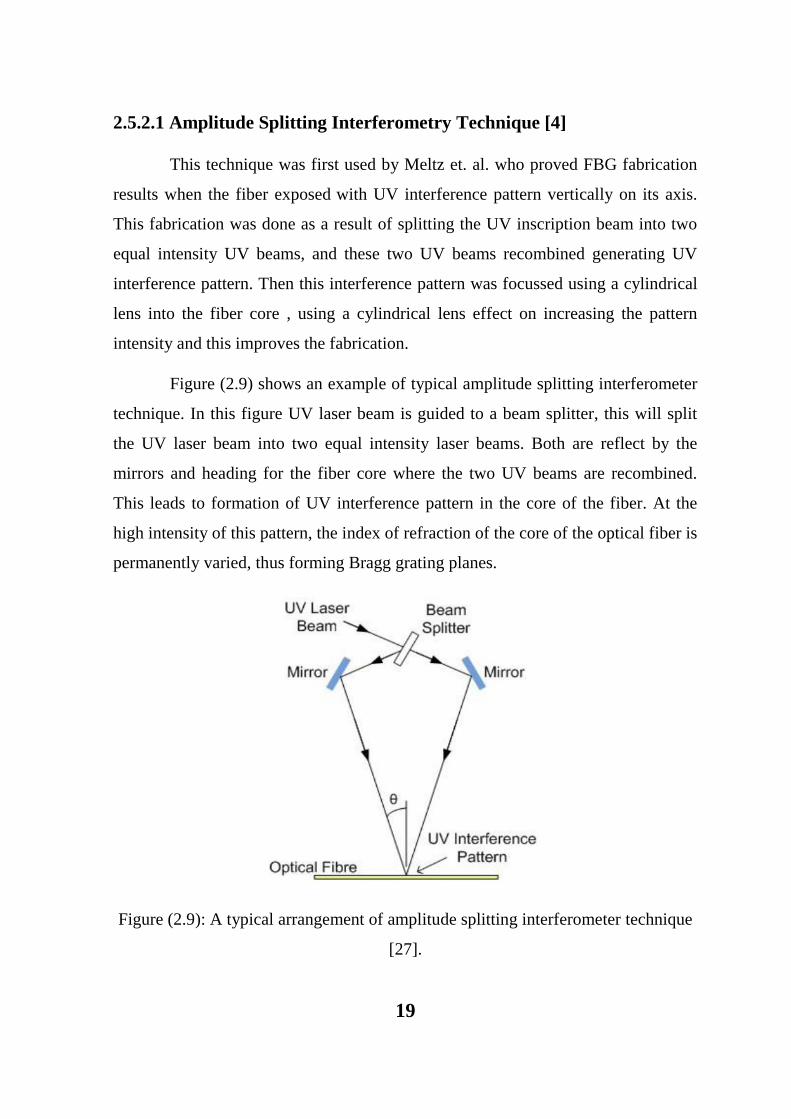
Figure (2.9) shows an example of typical amplitude splitting interferometer
technique. In this figure UV laser beam is guided to a beam splitter, this will split
the UV laser beam into two equal intensity laser beams. Both are reflect by the
mirrors and heading for the fiber core where the two UV beams are recombined.
This leads to formation of UV interference pattern in the core of the fiber. At the
high intensity of this pattern, the index of refraction of the core of the optical fiber is
permanently varied, thus forming Bragg grating planes.
Figure (2.9): A typical arrangement of amplitude splitting interferometer technique
[27].
20
The period ( ) between the grating planes is known via the inscripting laser
wavelength ( ) and half the angle separation ( ) between the two recombining
UV laser beams and it’s given as follow:
Combining Equation 2.7 and Equation 2.13 the Bragg wavelength ( ) of
the fabricated FBG can be known via the inscription laser wavelength ( ) and
half the angle separation ( ) between the two recombining UV laser beams and it’s
given as follow:
The choice of the UV inscription laser beam is known by the
photosensitivity of the used fiber core (silica or polymer). This inscription
wavelength is restricted to a small region of the UV wavelength range, which limits
its control on the Bragg reflected wavelength ( ). This makes half the angle
separation between the two recombining UV beams ( ) controls the Bragg reflected
wavelength ( ). This feature has no limit and can be used to determine the Bragg
reflected wavelength which considered as advantage when this technique is used.
The disadvantage of this technique is the susceptibility of the optical components to
mechanical vibrations . Any slightest movements of the optical components could
effect on the generated interference pattern of the two recombining UV laser beams,
causing a poor quality response of FBG.

21
2.5.2.2 Wavefront Splitting Interferometry Technique
This technique has two typical arrangements shown in figure (2.10) for
FBGs in optical fibers: the prism interferometer arrangement [39] and the Lloyd’s
mirror interferometer arrangement [40].
The principle of this technique is as follow, if a UV collimated beam is
incident on any reflective surface like a prism edge or a mirror, thus half of the
beam is reflected through the incident beam path. Interference occurs in the region
where both the reflected beam and unreflected beam are interfering by overlapping.
The fringe pattern generated from the interference is focused by a cylindrical lens to
the fiber core. Using this technique makes the grating quality is affected fewer by
the surrounding environment due to the reduced optical components used in this
system this will lead to the reduction of the optical path when using this technique.
It is easy to fabricate FBG at a tuneable wavelength; nevertheless the tuneable
wavelength range limited by the used interferometric arrangement. Additionally, the
length of the fabricated Bragg grating with this technique is limited to the half of the
incident UV laser beam width.
Figure (2.10): (a) Lloyd’s mirror wavefront splitting interferometer technique
arrangement (b) prism wavefront splitting interferometer technique arrangement
[27].

22
2.5.2.3 Phase Mask Technique
It’s a very common technique as a result of the high dependability and
simplicity of FBGs fabrication. This technique was first reported in 1993[41-42]
and since that time has exceeded the amplitude and the wavefront splitting
interferometry techniques. This technique involves of launching an inscription UV
laser into a phase mask (which is a single diffracting optical element), this results in
the formation of an interference fringe pattern similar to that obtained in previous
techniques.
Figure (2.11): A UV laser beam launching into a phase mask, representing different
orders of the splitted laser [27].
Phase mask is plate made from a fused silica; this plate is transparent to the
inscription UV laser. Surface relief pattern is on one side of the mask with a square
wave profile which has been impressed into the surface by electron beam
lithography or holographically. When UV laser directed from the top surface of a
phase mask , the light is diffracted on the bottom surface of the mask by the
periodic relief pattern. The UV beam is diffracted and split into various laser beams
and then these splitted beams travel in different directions, identified as orders,
precisely = 0, ±1, ±2, ±3 and so on as presented in figure (2.11). The diffraction
angle ( ) can be obtained for each order as follow:
23
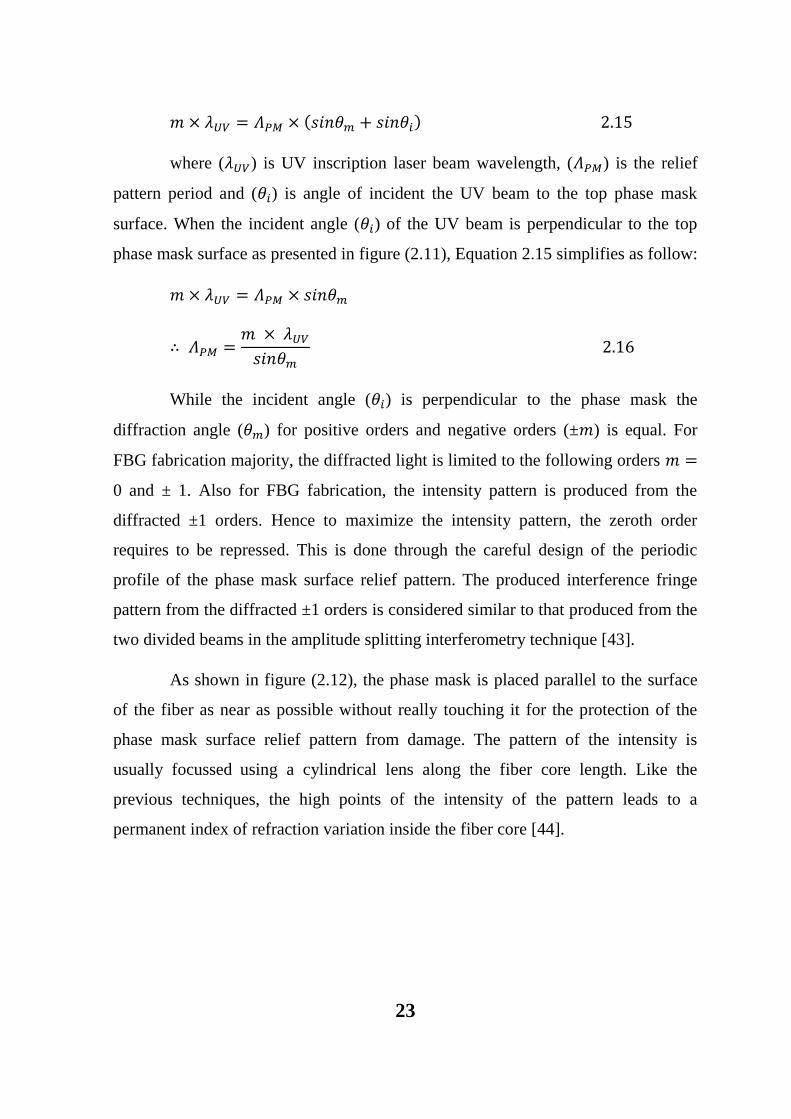
where ( ) is UV inscription laser beam wavelength, ( ) is the relief
pattern period and ( ) is angle of incident the UV beam to the top phase mask
surface. When the incident angle ( ) of the UV beam is perpendicular to the top
phase mask surface as presented in figure (2.11), Equation 2.15 simplifies as follow:
While the incident angle ( ) is perpendicular to the phase mask the
diffraction angle ( ) for positive orders and negative orders (± ) is equal. For
FBG fabrication majority, the diffracted light is limited to the following orders
0 and ± 1. Also for FBG fabrication, the intensity pattern is produced from the
diffracted ±1 orders. Hence to maximize the intensity pattern, the zeroth order
requires to be repressed. This is done through the careful design of the periodic
profile of the phase mask surface relief pattern. The produced interference fringe
pattern from the diffracted ±1 orders is considered similar to that produced from the
two divided beams in the amplitude splitting interferometry technique [43].
As shown in figure (2.12), the phase mask is placed parallel to the surface
of the fiber as near as possible without really touching it for the protection of the
phase mask surface relief pattern from damage. The pattern of the intensity is
usually focussed using a cylindrical lens along the fiber core length. Like the
previous techniques, the high points of the intensity of the pattern leads to a
permanent index of refraction variation inside the fiber core [44].

24
Figure (2.12): Interference pattern generated from –1 and +1 diffraction orders of
the phase mask [27].
The advantage of this technique over the two previous techniques is the
higher mechanical stability. Also the diffracted beams have to travel only a small
distance from the relief pattern of the mask to the fiber. Moreover, the simplicity of
using one optical component adds stability to this setup, at the same time it permits
for a simpler and reliable technique. However, This technique has a major
disadvantage which is that a new phase mask is necessary for each designed FBG
with a various Bragg reflected wavelength as shown by combining Equation 2.7 and
Equation 2.16, where the Bragg reflected wavelength ( ) is relies on the phase
mask period ( ):
This may lead to expensive tooling, mainly if wavelength division
multiplexing (WDM) sensors are needed where a new phase mask would be
required for each FBG with a various Bragg reflected wavelength [44].

25
2.5.2.4 Point by Point Inscription Technique
This technique was first described by Malo et. al. [45]. A UV pulse laser or
a femtosecond laser is used to inscript grating planes separately, each step at a time
along the core of the optical fiber. A single pulse light directed through a slit then it
focused on the fiber core. After the refractive index is varied at the irradiation
point , the fiber is translated from its original place using a precision translation
stage to a distance equal to , which is Bragg grating period. This process is
repeated till the desired FBG fabrication is achieved. The grating parameters can be
adjusted flexibly (such as grating period, grating length, etc.) which considered as
advantage when using this technique. However, control accurateness of the
movement of the translation stage is critical [45].
2.6 Olive Oil
Olive oil can be categorized as an organic dye compound; it has good
nonlinear optical properties with high coefficient of nonlinearity, high damage
threshold and good transparency at short wavelengths that candidate to be applied in
nonresonant photonic applications. Olive oil is made of many organic compounds
such as cholesterol, phospholipids, fatty acids, and glycolipids, which are able to act
as lyotropic liquid crystal (which is one of liquid crystal determined by changing the
temperature or concentration when an appropriate concentration of material is
dissolved in some solvent). Therefore, these compounds are characterized by varied
photonic applications [46].
2.7 Capillary Action
In the capillary action, a capillary tube is immersed into the liquid and then
the liquid usually rises to a certain height in the tube. The height of the liquid in the

26
capillary tube is related proportionally to the surface tension and it is obtained by
the formula [47]:
where is the height of the liquid, is the surface tension, is the contact
angle, ρ is density of liquid, is acceleration gravity, is the capillary radius.
Maximum velocity of the liquid in the capillary tube is related inversely
proportional to the coefficient of viscosity is calculated by [48]:
where is the coefficient of viscosity
The time that the liquid takes to rise inside the capillary tube is
obtained by:
Capillary tube volume is calculated by equation (2.21):
2.8 FBG Magnetic Field Sensor
Fiber Bragg gratings have confirmed as highly efficient sensors for
strain, temperature and chemicals. Using these primary measured
secondary parameters such as acceleration [49], tilt [50], pressure [51], shear
force [52], vibration [53], and chemical species [54] have been sensed.
Sensing magnetic field is essential in situations such as defence,
geophysics, medicine and industries. Techniques for measuring magnetic field

27
are search-coil magnetometer, flux-gate magnetometer, Hall-effect sensor, fiber-
optic magnetometer and magnetooptical sensor [55]. Fiber optics based magnetic
field sensors primarily exploit variations in the intensity, phase, polarization and
wavelength of the guided electromagnetic wave as a result of the magnetic field.
Measurement of magnetic field has been established with the optical fiber
using Faraday Effect [56], Lorentzian force [57], and magnetostrictive effects [58],
[59], [60] in an interferometric configuration. Typically, the information encoded as
the perturbed polarization state of the light is changed to intensity based data
which can then be easily sensed using a photodetector. Since the Verdet constant
(which is an optical constant that refer to the strength of the Faraday effect
for a particular material and it can be determined using equation (2.22) [61]) of the
optical fibers is small, more fiber length has to be exposed to the magnetic field
when Faraday Effect sensors are used. Consequently, long fibers present
birefringence (i.e., different refractive index) and increased transit time. In order to
reduce the fiber length, multiple reflections [62] of the light is used.
where is the rotation angle of the polarized light measured in (radian), is the
path length where the light and magnetic field interact measured in (meter), is the
magnetic field component in the direction of the light propagation measured in
(Tesla) and is Verdet constant measured in (radian / Tesla . meter).

28
CHAPTER THREE
Experimental Preparation and Arrangement of Bragg
Infiltrated Materials Inside PCFs
This chapter describes the optical properties and the experimental
preparation of the liquid mixture infiltrated inside four hollow core photonic crystal
fibers with different concentrations of the liquid mixture for each fiber. It also
describes the experimental arrangement that is used to fabricate FBGs inside the
PCFs, FBG testing setup for output detection and data recording, microscopic
images of inscription PCFs, optical properties and the simulation of Bragg reflected
wavelength is then presented.
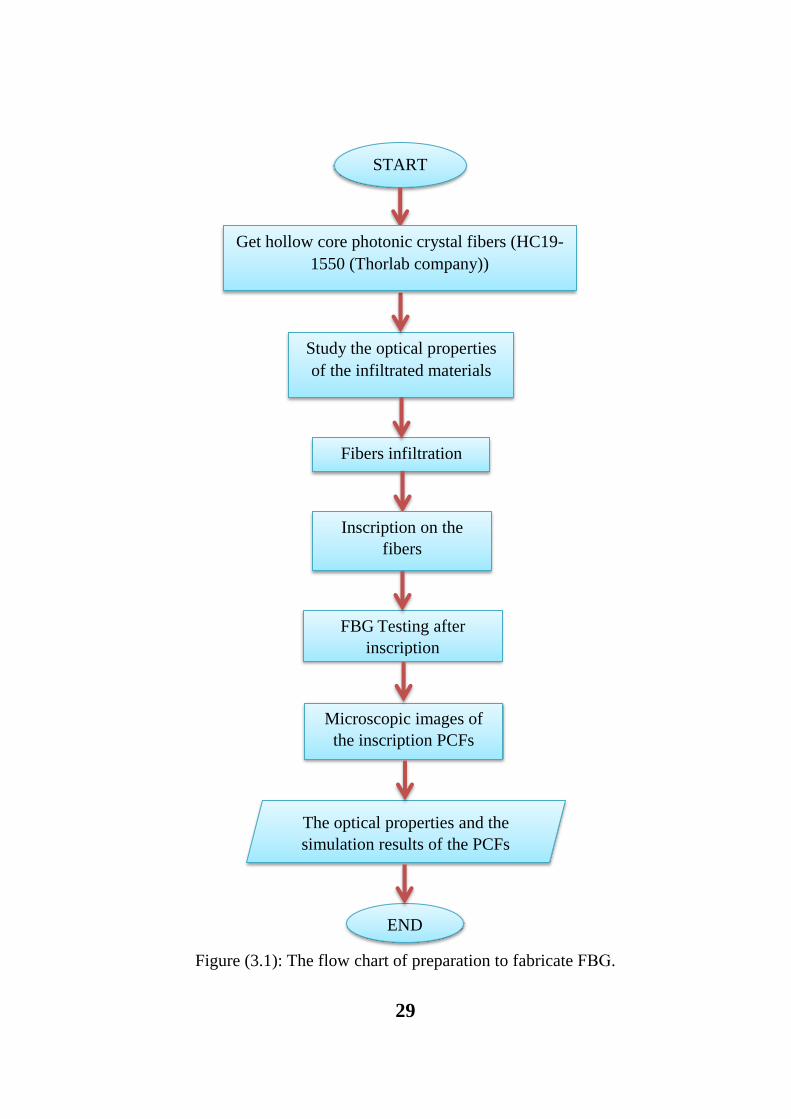
3.1 Preparation for Fabrication FBG
Figure (3.1) shows the flow chart for the preparation of the infiltrated materials in
order to fabricate fiber Bragg grating for four hollow core photonic crystal fibers.
29
Figure (3.1): The flow chart of preparation to fabricate GBF.
Study the optical properties
of the infiltrated materials
Fibers infiltration
Inscription on the
fibers
FBG Testing after
inscription
Microscopic images of
the inscription PCFs
The optical properties and the
simulation results of the PCFs
END
START
Get hollow core photonic crystal fibers (HC19-
1550 (Thorlab company))

30
3.2 Photo Polymer Adhesive Photosensitive Material
The key step used in this research is the chemical reaction of laser light
effects on the photosensitive material (polymer adhesive material). The cure process
of polymer adhesive depends on the intensity and the wavelength of the laser. This
reaction causes optical variation in the properties of the adhesive material as well as
in the index of refraction. The adhesive resin is in liquid state because the
monomers and photoinitiators will not react chemically with each other before laser
light irradiation , but when exposing to laser radiation, then photoinitiators subject
to the variation process which create free radicals that is chemically react with
monomers, creating chains of monomers. Monomer chains are changed to chains of
cross linked polymer at the cured state. The material used in this process is star line
Glass Mechanix adhesive, it is a colourless, clear liquid photo polymer adhesive and
it has medium viscosity for bonding glass. This material is affected by the UV
irradiation in a process termed "curing process", which is a converting process from
liquid state into solid material state.
Ultraviolet-Visible-Infrared (UV-VIS-IR) spectrophotometer is used to
obtain the absorption spectrum of star line Glass Mechanix adhesive material which
is shown in figure (3.2).
Figure (3.2): Illustrate the absorption of the polymer star line.

31
Figure (3.2) shows that the adhesive material star line Glass Mechanix gives
maximum absorption till 385 nm wavelength. i.e. the fastest curing occurs at such
maximum wavelength. Also the process of curing requires more time after 385 nm
wavelength. Hence, the time of cure depends on the material absorption. So, the
nearest and appropriate laser at wavelength 405 nm is used ogtrssoeotrherrgf . Laser
diode transmittance spectrum that used in the process of curing is given in figure
(3.3).
Figure (3.3): Laser diode spectrum of 405 nm.
As given in figure (3.2), the adhesive material has 10% absorption at a laser
wavelength 405 nm which makes it functional in this project but it needs extra time
for cure. Additionally, the star line optical adhesive has a medium viscosity.
3.3 Olive Oil
It is an organic composite, it candidates to be used in photonics applications
because it has a good nonlinear optical properties [46]; It is used as a mixture with
star line optical adhesive material. In this research, the type of olive oil is virgin.

32
UV-VIS-IR spectrophotometer is used for measuring the optical
transmission of olive oil. Figure (3.4) shows olive oil transmission spectrum.
Figure (3.4): Olive oil transmission spectrum.
3.4 Fiber Infiltration
The next step after choosing the star line adhesive for making Bragg gating,
a PCF (HC19-1550 (Thorlab company)) hollow core type has been used. This PCF
consists of fiber core diameter about (20 2µm), and there are air holes surrounding
this fiber core, each hole has a diameter around (70 5µm) and cladding diameter of
(115 3µm) as shown in Appendix (A). Bragg grating is made by exposing the PCF
(which is infiltrated with liquid mixture of adhesive material, olive oil and ethanol)
to blue laser. Olive oil has higher viscosity as compared with the star line Glass
Mechanix adhesive material and it must be diluted to mix with it. Therefore, ethanol
is used with the liquid mixture because of the hydrophobic interactions between the
hydrocarbon chains in olive oil and ethanol causes the one with higher viscosity to
dissolve. The olive oil is diluted with ethanol before being added to the photo
adhesive material. Capillary action technique is being used for infiltration the fiber
in this research.

33
3.4.1 Theoretical Calculations for Infiltration Liquid Mixture Inside the
Air Holes of the PCF
Theoretical calculations have been done for the infiltration of liquid mixture (olive
oil, star line Glass Mechanix and ethanol) inside the optical fiber:
The density and viscosity of the liquid mixture were measured by densitometer and
viscometer and are equal to (2787.114 Kg/m3), (0.08994385604 Kg/m.s) at (20 C)
respectively. Assumed that PCF core radius range from 5 µm to 25 µm (the radius
of the hollow core PCF (HC19-1550 (Thorlab company)) that is used in this
research equal to (10 1 μm), i.e. its within the range of the assumption), then the
velocity of liquid mixture was calculated by applying equation (2.19) as shown in
figure (3.5)
Figure (3.5): The velocity of liquid mixture inside the optical fiber.

34
Assuming that the height of the liquid mixture would rise from 10 cm to 50
cm, and by knowing the velocity of the liquid mixture from the previous
calculations, then the time that liquid mixture takes to rise inside the optical fiber
was calculated by applying equation (2.20) and is shown in figure (3.6):
Figure (3.6): The Time that liquid mixture takes to rise inside the fiber.
In this research the average radius of the optical fiber core is equal to 10 µm
and the optical fiber length (which is considered as the height of the liquid mixture
inside a PCF) was choosed to be 15 cm, this length was choosed because a large
angle (which separate the two interfering blue laser beams) is needed to fabricate
FBG at the required wavelength. By applying equations (2.19) and (2.20), the
average velocity of the liquid mixture inside this fiber is equal to (3.798260325
µm/s) and the average time that liquid mixture takes to rise inside this fiber is equal
to (10.969934 hours) respectively. The average volume of the liquid mixture for this
fiber was also calculated by applying equation (2.21) and it’s equal to (4.71238898
* 10-5
ml).

35
Four hollow core photonic crystal fibers were used.
PCF (A): was infiltrated with only star line Glass Mechanix adhesive
material of volume (0.12 ml/cc).
PCF (B): was infiltrated with a volume (0.12 ml/cc) of liquid mixture
consists from (0.06 ml/cc) star line Glass Mechanix adhesive material, (0.03
ml/cc) olive oil and (0.03 ml/cc) ethanol.
PCF (C): was infiltrated with a volume (0.12 ml/cc) of liquid mixture
consists from (0.04 ml/cc) star line Glass Mechanix adhesive material, (0.04
ml/cc) olive oil and (0.04 ml/cc) ethanol.
PCF (D): was infiltrated with a volume (0.12 ml/cc) of liquid mixture
consists from (0.03 ml/cc)star line Glass Mechanix adhesive material, (0.06
ml/cc) olive oil and (0.03 ml/cc) ethanol.
As it’s seen the volume of the liquid mixture of four fibers is greater than the
required volume because it’s the smallest scale available.
3.5 Inscriptions on the Fiber
The experimental setup depends on Amplitude splitting interferometric
technique, which is used to fabricate Fiber Bragg grating at Bragg wavelength ( =
651.3 nm) reflected from the core of the PCF. (405 nm) blue laser will be used
instead of UV laser for the fabrication process.
Half the angle separation between the interference of the two beams of blue
laser 405 nm ( ) is affected by the reflected Bragg wavelength ( ). This
wavelength is obtained theoretically using equation (2.14). Therefore, the value of
( ) between the interference of the two blue laser beams must be (65 ) in order to
reflect a wavelength of (651.3) nm from the core of the PCF. Figure (3.7) shows the
flow chart of inscription on the fiber.

36
0
Figure (3.7): The flow chart of inscription on the fiber.
Select the
Inscription
Wavelength
Interferes the laser beam
using amplitude splitting
fabrication set up
Obtain the grating
period by varying 𝜃
Reshape the laser beam
using a pinhole
Control the linear
translation stage to move
the fiber in Z direction
Inscription on
fiber
END
START

37
3.5.1 Experimental Arrangement of the Fabrication Process
The diagram for the experimental arrangement of fiber Bragg grating
fabrication shown in figure (3.8) and it consisting of three parts:
Figure (3.8): Experimental Arrangement diagram.
1. Optical system, which consists of:
Laser diode 405 nm used for fabricating Bragg grating in the fiber.
Beam splitter used for splitting the laser beam into two beams.
Two pin holes used for changing laser spot shape from elliptical to circular
shape.
Two mirrors to reflect the laser beams at certain point on the fiber with
specific angle .

38
Optical fiber, hollow core photonic crystal fiber type is used for fabricate
Bragg grating inside it.
2. Linear translation stage, which consists of:
Two fiber clamps used to hold the fiber.
Bipolar stepper motor used for moving the fiber on a movement base in
specific steps and direction.
3. Control unit, which consists of:
Circuit board with easy driver A3967 and microcontroller used for
controlling bipolar stepper motor steps and direction.
Power supply used for supplying the circuit with power.
Personal computer (PC) used for programming the circuit.
3.5.2 Experimental Set up of the Fabrication Process
The experimental setup of the fabrication process is classified mainly into
stages: the linear translation stage, the control unit and the optical system; It will be
explained later in details. The experimental fabrication setup is shown in figure
(3.9).
39
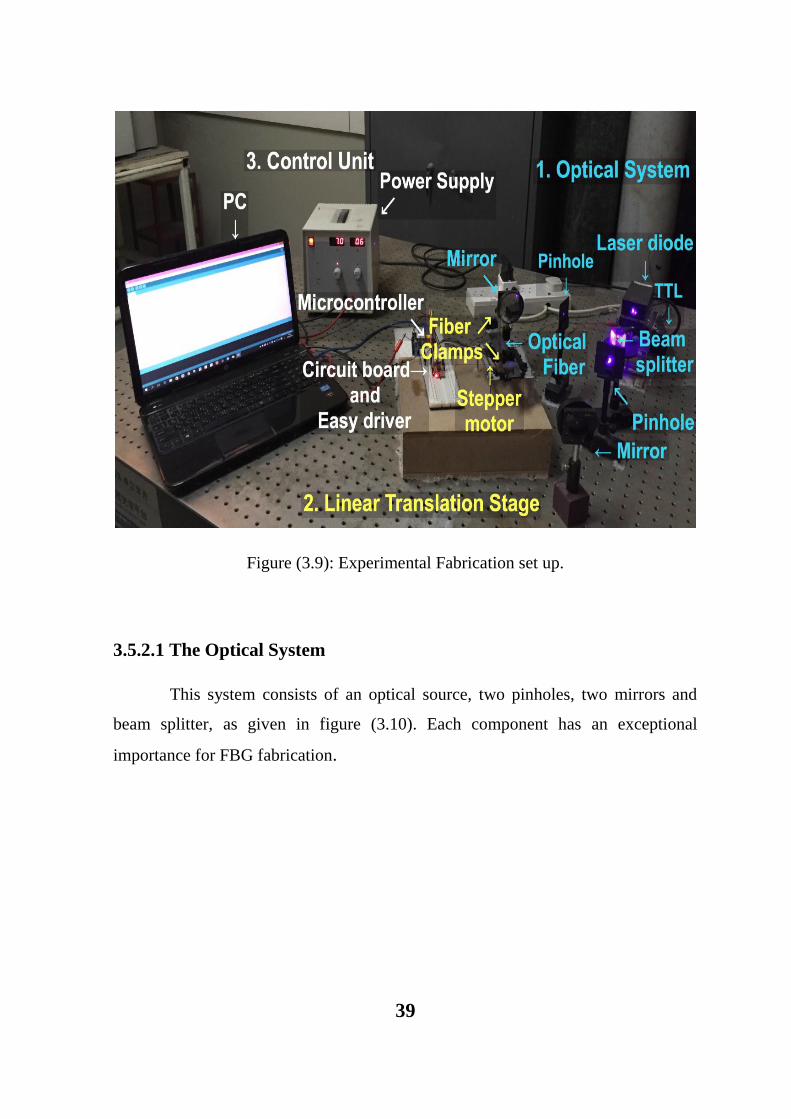
Figure (3.9): Experimental Fabrication set up.
3.5.2.1 The Optical System
This system consists of an optical source, two pinholes, two mirrors and
beam splitter, as given in figure (3.10). Each component has an exceptional
importance for FBG fabrication.

40
Figure (3.10): The path of the laser beam in the optical setup.
The optical source used for fabrication fiber Bragg grating is a continuous
wave diode laser type (SDL-405-100T) emitting at 405 nm wavelength and 100
mW output power as shown in Appendix (B). It has a control unit used to switch it
ON/OFF.
The purpose of choosing this wavelength depends on the photosensitivity of
the infiltrated material inside the hollow core photonic crystal optical, i.e. this laser
wavelength nearly matched the spectrum of absorption of the star line adhesive that
was infiltrated in the PCF.
The profile beam of the laser diode source used has elliptical shape. So,
focusing this laser beam required reshaping the laser beam into circular shape.
If the laser source is switched on, the path of the laser beam is followed
through the optical elements as shown in figure (3.10).
The laser beam is directed to a beam splitter, where it is splitted into two
laser beams of the same power. The beam splitter that is used has an incident angle
about in order to split the laser beam.

41
After that these beams are directed to a dielectric mirrors to be reflected.
These dielectric mirrors control the paths of the beams by adjusting these mirrors in
x and in y axes. Then, these beams are recombined and creating interference fringes
pattern inside the PCF core as presented in figure (3.11).
Figure (3.11): The two laser beams are interfering to make the fringes pattern.
3.5.2.2 The Linear Translation Stage
It is a stage moves linearly in z-axis only and it’s consists of two fiber
clamps and bipolar stepper motor as given in figure (3.12).

42
Figure (3.12): A translation stage that is moves linearly in z-axis.
The fiber is fixed on the stage and held by the fiber clamps. The distance
separation between these clamps is 10 cm.
The motor used in this stage is a bipolar Micro stepper motor, its two phase
four wire hybrid type, this motor requires dc voltage supplier about 4-6 volt. The
motor has a 15 mm diameter with SM15DD screw type and 9 mm height. The rod
diameter and length are 3 mm and 52.5 mm respectively as shown in Appendix (C).
The total distance of the movable stage is 3.8 cm in one direction and the motor is
moved 158 full steps to complete this distance. Motor resolution is 240 µm for each
step of the stepper motor. Stepper motor is shown in Figure (3.13).
Figure (3.13): The bipolar stepper motor and the lead screw.

43
3.5.2.3 The Control Unit
The control unit consists of motor driver board, microcontroller board,
power supply and personal computer as shown in figure (3.14).
Figure (3.14): The control unit of the system.
A3967 micro stepping easy driver V4.4 board is a stepper motor controller as
shown in figure (3.15).
Figure (3.15): A3967 micro stepping easy driver board.

44
It’s a simple and compatible with anything that can output a digital pulse
(from 0 to 5V) pulse or (from 0 to 3.3V) pulse. A3967 easy driver drives bipolar
stepper motors, and motors wired as bipolar (4, 6, or 8 wired stepper motors), it has
four ports (A1, A2, B1, and B2) that can be connected directly to the bipolar stepper
motor.
This driver requires operation voltage (from 7V to 30V) to power the
stepper motor at any voltage. The higher voltage means the higher torque at high
speeds. The easy driver has voltage regulator on the board for the digital interface
that can be set to (5V) or (3.3V) and has adjustable current control (from
150mA/phase to 750mA/phase).
The direction pin (dir.) controls the direction of the stepper motor and step
pin (step) controls the number of steps of the motor. The microstep select (MS1 and
MS2) pins of the A3967 can change micro stepping resolution to full, half, quarter
and eighth steps. This Easy Driver version provides much more flexibility and
control over the stepper motor, when compared to older versions; also in this
version the silk error on the min/max adjustment was fixed.
The main advantage of using the A3967 easy driver is for the protection of
the microcontroller since the current quantity needed to supply a stepper motor
passes the quantity of the supply current limit of the microcontroller. Figure (3.16)
shows the microcontroller board.
Figure (3.16): Arduino Uno R3 microcontroller board.

45
The Arduino Uno R3 is a microcontroller board based on the ATmega328
chip. It has a fourteen digital input/output pins (six of it can be used as pulse width
modulation PWM outputs), a six analog inputs, a sixteen megahertz crystal
oscillator, a USB connection and a reset button. Simply it can be connected to a
computer with a USB cable or power it with an AC-to-DC adapter or battery to
start. It’s programmed using C/C++ software language.
The power supply is used for supplying the Easy driver with 7 volts. The
personal computer (PC) is used for supplying the microcontroller through the USB
connection and for software programming of the easy driver and microcontroller in
order to specify the steps, direction and speed of the stepper motor. Figure (3.17)
shows the schematic of the control unit circuit.

46
Figure (3.17): The schematic of the control unit circuit.

47
The Arduino is programmed to switch the laser diode ON and OFF by TTL
function of the laser drive and to control a bipolar stepper motor by sending signal
to the bipolar stepper motor through A3967 easy driver. These signals control the
stepper motor speed, steps, and direction. After sending these signals to the A3967
easy driver input signal port, then these signals pass from A3967 easy driver to the
input ports bipolar stepper motor (A1, A2, B1, B2).
Arduino Uno R3 is programmed to do the following sequence:
1. The laser is switched on by TTL function to script on the fiber for 3
minutes. To ensure that no movement or vibration occurs in place, the fiber
is held firmly during this time.
2. The laser is switched OFF to stop the inscription process.
3. The fiber is moved by step resolution 240 µm. Then, the laser is switched
ON again.
This procedure is repeated again until it covers the distance of 3.8 cm. The
laser is still off for two seconds after each step to make sure that no additional
inscription on the fiber happens through the steps movement. The total time of the
inscription process of four fibers is about 32:30 hours. Appendix (D) shows more
information about the programming language.
3.6 FBG Testing Setup for Output Detection and Data Recording
It is essential to detect and record the output data of Bragg reflected
response from the PCFs to makes sure if the inscription of the FBG is completed
correctly and also to obtain the value of reflected Bragg wavelength. The setup that
is used to test the FBG is presented in figure (3.18). It consists of a laser of 651.3
nm, an accurate metric ruler, two fiber clamps, optical signal analyzer (OSA) and
PC.

48
Figure (3.18): Setup to test FBG.
Each component has its own function in this setup. The 651.3 nm laser
source is used for testing the functionality of the PCF. The end of the PCF is placed
in front of the laser source and the other end in front of an OSA (Thorlabs-CCS200)
for data analysis and recording.
The OSA (Thorlabs-CCS200) is a wavelength scanning device that can
record the output detected power for each wavelength. It has internal charge
coupled device (CCD) line array with 3648 pixel. It is also auto compensated for
dark current noise and amplitude corrected. This OSA (Thorlabs-CCS200) is
sensitive to wavelengths ranges from 200 nm to 1000 nm. Different parameters can
be varied for optimizing the output detected power. The output power of the desired
wavelength before and after FBG fabrication has been measured using
OSA (Thorlabs-CCS200). The resolution of this OSA gives the reflection of the
FBG.
When the light from the laser source entered the PCF, The fabricated Bragg
grating in the PCF will reflect the desired Bragg wavelength, so the OSA (Thorlabs-
CCS200) from the other end of the PCF will show the exact amount of power that is
transmitted from these Bragg grating; therefore Bragg reflected wavelength can be
obtained from the transmission spectrum.

49
3.7 Microscopic Images of the Inscription PCFs
The next step after the process of inscription is to check PCFs visually,
typically through an optical microscope. The images of the microscope shows
different essential information about the PCFs properties, for example the optical
examination shows if the process of inscription is completed successfully.
Furthermore, it displays the defects that might occur during the process of
inscription. The inscription results on the four PCFs are illustrated in figures (3.19-
3.22).The Bragg grating appears in the cores of the four PCFs.
Figure (3.19) shows PCF (A) with a 40X microscope image of fabricated
FBG. It shows that PCF (A) didn’t experience any break through the process of
inscription. If any break happened, it could be presented in the section of the fiber
core. The image that is magnified displays a nearer view of PCF core. It shows the
regions that are exposed to blue light successfully. These regions illustrate the
fabricated Bragg grating inside the fiber core which is resulted from the interference
of the two blue laser beams.
Figure (3.19): FBG of PCF (A) under optical microscope with average grating
period 0.2241250652 μm.

50
Figure (3.20) shows PCF (B) with a 40X microscope image of
fabricated FBG. It shows that PCF (B) core didn’t experience any break. It displays
the regions that exposed to blue light gives less clear view than PCF (A) due to the
density of olive oil.
Figure (3.20): FBG of PCF (B) under optical microscope with average grating
period 0.2241250653 μm.
Figure (3.21) shows PCF (C) with a 40X microscope image of fabricated
FBG. It show the regions that are cured by blue light are recognized hardly due to
the higher density of olive oil than PCF (A) and PCF (B).
51
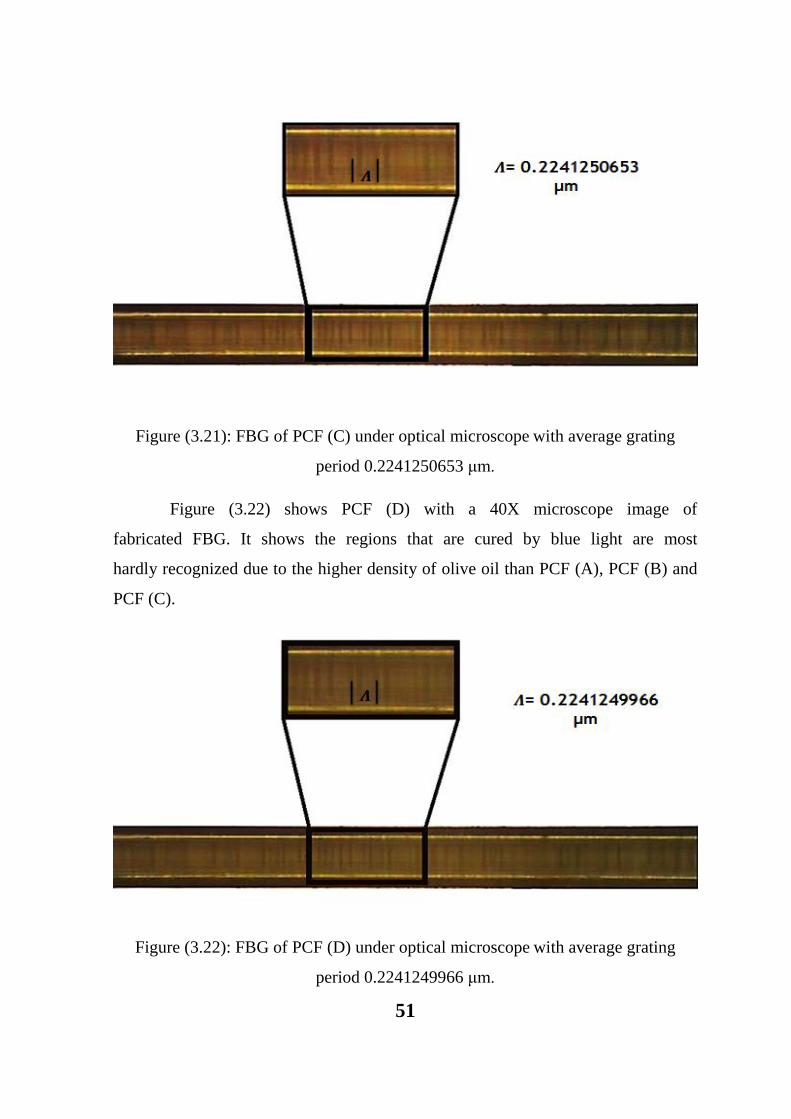
Figure (3.21): FBG of PCF (C) under optical microscope with average grating
period 0.2241250653 μm.
Figure (3.22) shows PCF (D) with a 40X microscope image of
fabricated FBG. It shows the regions that are cured by blue light are most
hardly recognized due to the higher density of olive oil than PCF (A), PCF (B) and
PCF (C).
Figure (3.22): FBG of PCF (D) under optical microscope with average grating
period 0.2241249966 μm.

52
PCF (A) shows clearer grating period than PCF (D) because the
photosensitive material is higher in PCF (A).
3.8 The Optical Properties
It is a process that gives the wavelength bands of the tested FBG inside the
PCF. This is done by directing the laser light inside the PCFs. In this research, laser
at wavelength 651.3 nm is used for the testing process.
The output spectrum of a PCF without any grating inscription is shown in
figure (3.23) . It shows that, the laser directed through the PCF without any
variation laser spectrum i.e. no reflection happens. This result is very important for
comparison with inscrpited PCFs spectrums.
Figure (3.23): Transmission spectrum of 651.3 nm diode laser guided inside a
hollow core PCF (HC19-1550 (Thorlab company)) without any infiltrated material.
3.8.1 FBG Inscribed on PCF (A) Optical Properties
The fabricated FBG using star line adhesive is verified by optical
properties. The output of the fabricated PCF is presented in figure (3.24). FBG

53
length of all PCFs is 3.8 cm. As shown in figure (3.24) the output laser peak shifts
and reduce at 653.3551 nm, this wavelength shift from the setting wavelength 651.3
nm with half angle separation is due to the setting error of the half angle
separation ( ) between two interfering blue laser (405 nm) correctly about 0.588 %
calculated from the following equation:
|
|
The experimental half angle separation is about , the theoretical
half angle separation calculated using equation (2.14) by applying the values of the
fabrication laser beam 405 nm, the effective refractive index of PCF (A), and the
reflected Bragg wavelength of fiber (A). The effective refractive index of PCF (A)
and the reflected Bragg wavelength are given in table (3.1) .
This reduction of Bragg wavelength is because of the reflection from the
periodic Bragg grating layers in the PCF core.
As mentioned previously, the index of refraction and the grating period
between layers determine the Bragg reflected wavelength. So, by changing the
period, the peak of Bragg reflected wavelength can be blue shifted or red shifted.
However, the grating period is obtained using equation (2.13) using the interference
created by the two blue laser beams 405 nm that is used in FBG fabrication and
using the half angle separation ( ) between two interfering blue laser (405 nm).
The FBG quality is obtained via the sharpness or the width of the reflected
Bragg wavelength. Figure (3.24) shows a sharp drop at wavelength 653.3551 nm
expressing a high precision reflection and FWHM about 0.5 nm.

54
Figure (3.24): The transmission spectrum of the laser diode after coupling with the
fabricated FBG in PCF (A).
3.8.2 FBG Inscribed on PCF (B) Optical Properties
The second test of the fabricated FBG made from this liquid mixtureshows
a higher reflection from the periodic Bragg layers at 653.3555438 nm with
more sharpness than the previous fabricated PCF and with FWHM about 0.53 nm as
shown in figure (3.25).The strength of reflection resulting from the fact that liquid
mixture is strongly cured when PCF core is irradiated by the blue laser.

55
Figure (3.25): The transmission spectrum of the laser diode after coupling with the
fabricated FBG in PCF (B).
3.8.3 FBG Inscribed on PCF (C) Optical Properties
The third test of the fabricated FBG made from this liquid mixture shows a
higher reflection from the periodic Bragg layers at 653.3565367 nm
with more sharpness than the previous two fabricated PCFs with FWHM about 0.7
nm as shown in figure (3.26).
The strength of reflection comes from the fact that this mixture is
much strongly cured when PCF core is irradiated by the blue laser.

56
Figure (3.26): The transmission spectrum of the laser diode after coupling with
fabricated FBG in PCF (C).
3.8.4 FBG Inscribed on PCF (D) Optical Properties
The fourth test of the fabricated FBG made from this liquid mixture shows
the highest reflection from the periodic Bragg layers at 653.3582 nm with
much more sharpness than the previous fabricated PCFs with FWHM about 0.74
nm as shown in figure (3.27).
The strength of reflection comes from the fact that this mixture is much
egts strongly cured when PCF core is exposed to the laser irradiation.
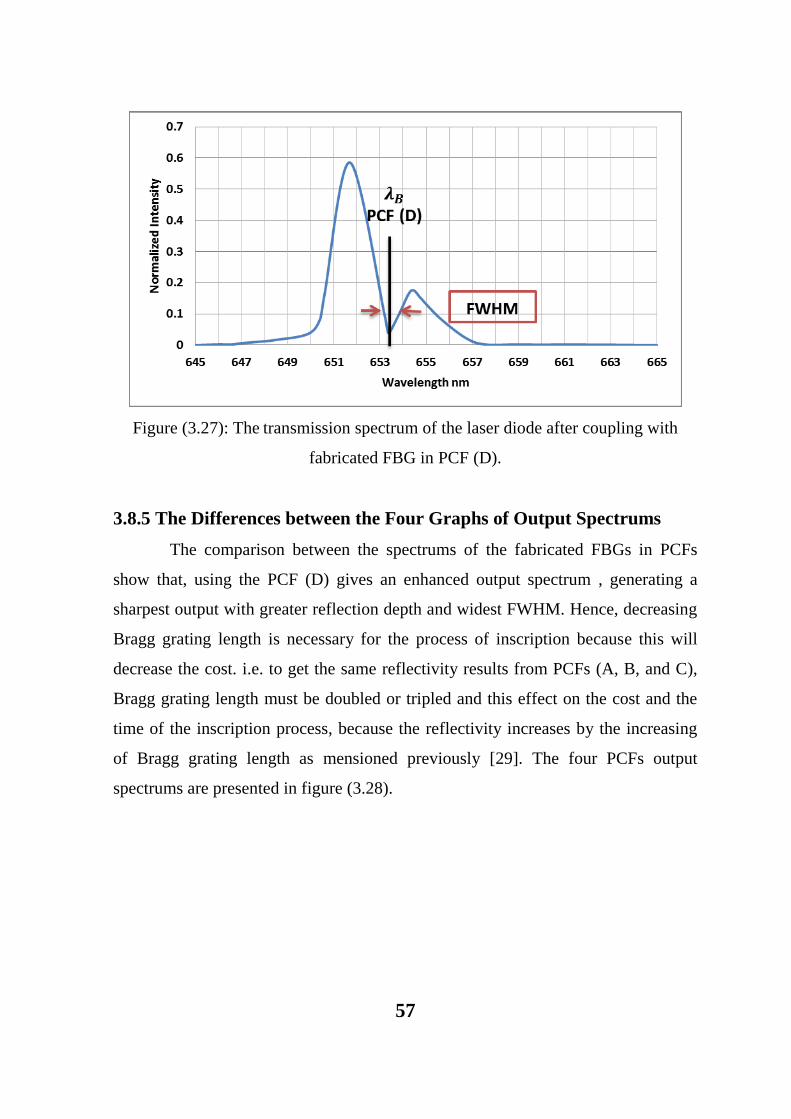
57
Figure (3.27): The transmission spectrum of the laser diode after coupling with
fabricated FBG in PCF (D).
3.8.5 The Differences between the Four Graphs of Output Spectrums
The comparison between the spectrums of the fabricated FBGs in PCFs
show that, using the PCF (D) gives an enhanced output spectrum , generating a
sharpest output with greater reflection depth and widest FWHM. Hence, decreasing
Bragg grating length is necessary for the process of inscription because this will
decrease the cost. i.e. to get the same reflectivity results from PCFs (A, B, and C),
Bragg grating length must be doubled or tripled and this effect on the cost and the
time of the inscription process, because the reflectivity increases by the increasing
of Bragg grating length as mensioned previously [29]. The four PCFs output
spectrums are presented in figure (3.28).

58
Figure (3.28): The transmission spectrums of the fabricated FBGs in four PCFs.
Table (3.1) gives the numerical examination of the four PCFs spectrums
using the equations of the previous chapter. It’s obvious that the Bragg reflected
wavelength shift for the four PCFs are approximately similar with 0.001 nm
difference. However, the variation of the indices of refraction is changes with little
quantity for the four PCFs. The liquid mixtures FWHM is more than of the PCF
(A).
Table (3.1): The variations between the four PCFs.
Injected
material
λB
(nm)
Δn
10-6
neff Δλ
(nm)
Reflectivity
%
FWHM
(nm)
PCF (A) 653.3551 7.623 1.45756812 2.017872
3
76.20 0.5
PCF (B) 653.3555
438
8.613 1.45756911 2.018316
1
82.87532 0.53
PCF (C) 653.3565
367
10.828 1.45757132
50
2.019309 91.49684 0.7
PCF (D) 653.3582 14.985 1.45757548
2
2.020972
3
96.09647 0.74

59
3.9 Reflected Bragg Wavelength Simulation
Investigating FBG further, a MATLAB program is used to simulate the
reflection/transmission spectrum of Bragg reflected wavelength of PCF (A) using
the same parameters that used in the process of inscription, the result of simulation
is shown in figure (3.29).
Figure (3.29): Reflection/Transmission of PCF (A) with grating length of 3.8 cm.
The figure displays the reflection/transmission spectrum of the FBG by the
coupled mode theory and the transfer matrix method (TMM) using equation (2.10)
[29]. It also displays that the center wavelength of the reflection/transmission is at
653.3551 nm. The effective index of refraction used in this code is very similar to
that in table (3.1) which is obtained using experimental measurements. It also shows
that, the reflectivity and transmissivity is about 77.81 % and 22.19 % respectively.
Appendix (E) shows the simulation code to find the reflection/transmission
spectrum of star line Glass Mechanix optical adhesive material. If the grating length
is increased about 9.8 cm then the reflectivity of PCF (A) will reach 100 % as
shown in figure (3.30). Appendix (F) shows the simulation code to find the

60
reflection/transmission spectrum of star line Glass Mechanix optical adhesive
material rrstterrft sftrs 9.8 cm.
Figure (3.30): Reflection/Transmission of PCF (A) with grating length about 9.8
cm.
Figure (3.31) shows the reflection/transmission spectrum using the
parameters of PCF (B).Simulation results show that Bragg reflected wavelength of
the reflection/transmission is at 653.3555438 nm. The effective refractive
index used in the simulation code is very similar to that given in table (3.1) which
are obtained using experimental determinations. Figure (3.31) also shows that, the
reflectivity and transmissivity is about 83.97 % and 16.03 % respectively for exact
number of periods. Appendix (G) shows the simulation code to find the
reflection/transmission of PCF (B).

61
Figure (3.31): Reflection/Transmission of PCF (B).
Figure (3.32) shows the reflection/transmission spectrum using the
parameters of the PCF (C). Simulation results show that Bragg reflected wavelength
of the reflection/transmission is at 653.3565367 nm.
The effective refractive index used in the simulation code is very similar
to that given in table (3.1) which is obtained by experimental determinations. It also
shows that, the reflectivity and transmissivity is about 92.5 % and 7.5 %
respectively for exact number of periods. Appendix (H) shows the simulation code
to find the reflection/transmission of PCF (C).

62
Figure (3.32): Reflection/Transmission of PCF (C).
Figure (3.33) shows the reflection/transmission spectrum using the
parameters of the PCF (D). Simulation results show that Bragg reflected wavelength
of the reflection/transmission is at 653.35582 nm.
The effective refractive index that is used in the simulation code is very
similar to that given in table (3.1) which is obtained by
by experimental determinations. It also shows that, the reflectivity
and transmissivity is about 98.28 % and 1.72 % respectively for exact number of
periods. Appendix (I) shows the simulation code to find the reflection/transmission
of PCF (D).

63
Figure (3.33): Reflection/Transmission of PCF (D).
It can be noticed from the previous results that PCF (D) has the highest reflection
due the concetration of olive oil because the absorbance peak of olive oil appears at
the reflected Bragg wavelength and its emission peak when the material excited at
the same wavelength as shown in figure (3.34) [63].
Figure (3.34): The absorbance peak of olive oil appears at wavelength 669 nm and
its emission peak when the material excited at that wavelength [63].
64
CHAPTER FOUR
Application of Fiber Bragg Grating in Magnetic Sensing
Technology
Many applications can be done on the FBG that would be constructed in
previous chapter. One of these applications used FBG as magnetic field sensor.
This chapter describes the experimental setup and results of magnetic field
sensing on three PCFs with different volumes of the liquid mixture.
4.1 Fiber Preparation
Three types of FBG are being prepared for magnetic field sensor:
PCF (B): the first PCF with liquid mixture volume (0.12 ml/cc) consists
of (0.06 ml/cc) Star line Glass Mechanix adhesive material, (0.03 ml/cc)
Olive oil, (0.03 ml/cc) Ethanol.
PCF (C): the second PCF with liquid mixture volume (0.12 ml/cc)
consists of (0.04 ml/cc) Star line Glass Mechanix adhesive material,
(0.04 ml/cc) Olive oil, (0.04 ml/cc) Ethanol.
PCF (D): the third PCF with liquid mixture volume (0.12 ml/cc) consists
of (0.03 ml/cc) Star line Glass Mechanix adhesive material, (0.06
ml/cc) Olive oil, (0.03 ml/cc) Ethanol.
4.2 Experimental Arrangement Diagram and Setup of Magnetic
Field Sensor :
The experimental arrangement diagram and setup of the magnetic field
sensor as shown in figures (4.1. a and 4.1. b) are used to test the magnetic field
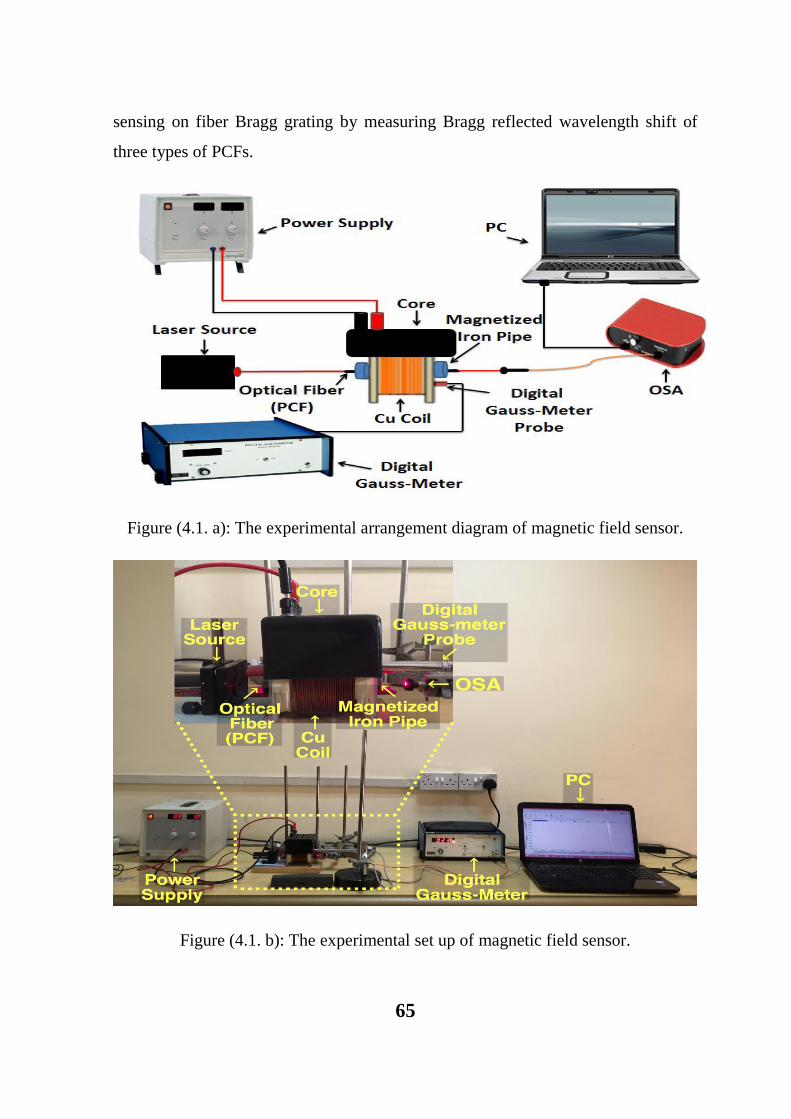
65
sensing on fiber Bragg grating by measuring Bragg reflected wavelength shift of
three types of PCFs.
Figure (4.1. a): The experimental arrangement diagram of magnetic field sensor.
Figure (4.1. b): The experimental set up of magnetic field sensor.

66
The experimental set up shown in figure (4.1. b) consists of:
1. Laser diode source of 650 nm wavelength is used to pass the light inside
hollow core photonic crystal fiber (HC19-1550 (thorlab company)) .
2. Magnetic field source:
A. Power supply is used to provide the electrical current needed to
generate the magnetic field by changing the electrical current values
from 1A to 5 A at a certain voltages.
B. Core with a copper coil is connected to the power supply in order to
provide the electrical current needed to generate the the magnetic field
inside an iron pipe of 10 cm length.
3. Hollow core photonic crystal fiber (HC19-1550 (thorlab company)) held
inside the magnetized iron pipe is used to test magnetic sensitivity i.e.
measuring Bragg reflected wavelength shift in the presence of the
magnetic field.
4. Digital Gauss-meter (DGM-202) with an axial probe.
5. Optical spectrum analyzer (OSA) (Thorlabs-CCS200) is used for data
analysis and recording.
6. PC is used to display the data analysis and recording.
First, the power supply was set at voltage value where the current reaches
1A, then the magnetic flux density value is measured with the digital Guass-meter
axial probe, and then the light had coming out from PCF (B) was visualized by
OSA to measure Bragg reflected wavelength. After that the current was set at values
of (2, 3, 4, and 5 A) and the previous procedures of measuring the magnetic flux
density and Bragg reflected wavelength shift for each current value were repeated
for PCF (B). The two others PCFs (C) and (D) followed the same procedure of the
PCF (B).

67
4.3 The Optical Properties Results of Bragg Reflected Wavelengths
Shifts:
The experimental set up of magnetic field sensor in figure (4.1.b) was used
to measure the optical properties of Bragg reflected wavelengths shifts spectrums by
generating a magnetic field around the PCF as given in figures (4.2-4.4).
These spectrums are obtained by changing the electrical current from 1 A to 5 A,
where the magnetic flux density was measured for each current value within a range
of (0-93) Gauss, more details in tables (4.1-4.3). The magnetic flux density and
Bragg reflected wavelengths shifts were measured using axial probe and OSA
respectively.
1. PCF (B)
Figure (4.2) shows the spectrums of different Bragg reflected wavelengths shifts of
PCF (B). Table (4.1) gives more information about the numerical examination of
these spectrums.
Figure (4.2): The spectrums of different Bragg reflected wavelengths shifts of PCF
(B) .

68
eeo s (4.1): The numerical examination of PCF (B).
Electrcal
Current
(A)
Magnetic
Flux density
(Gauss)
λB
(nm)
Reflectivity % FWHM
(nm)
0 0 653.3555438 82.87532 0.53
1 21 653.3617 82.95165 0.5302
2 39 653.3714 83.07888 0.5305
3 60 653.3808 83.20611 0.5308
4 76 653.3894 83.50120 0.5312
5 92 653.3975 83.62341 0.5315
2. PCF (C)
Figure (4.3) shows the spectrums of different Bragg reflected wavelengths shifts of
PCF (C). Table (4.2) gives more information about the numerical examination of
these spectrums.
Figure (4.3): The spectrums of different Bragg reflected wavelengths shifts of PCF
(C).

69
eeo s (4.2): The numerical examination of PCF (C).
Elecrtical
Current
(A)
Magnetic
Flux density
(Gauss)
λB
(nm)
Reflectivity % FWHM
(nm)
0 0 653.3565367 91.49684 0.7
1 22 653.3625 92.13524 0.8
2 42 653.3723 92.4878 0.85
3 58.5 653.3813 92.54204 0.88
4 77 653.3899 92.58724 0.92
5 93 653.3980 92.67764 0.97
3. PCF (D)
Figure (4.4) shows the spectrums of different Bragg reflected wavelengths shifts of
PCF (D). Table (4.3) gives more information about the numerical examination of
these spectrums.
Figure (4.4): The spectrums of different Bragg reflected wavelengths shifts of PCF
(D) .
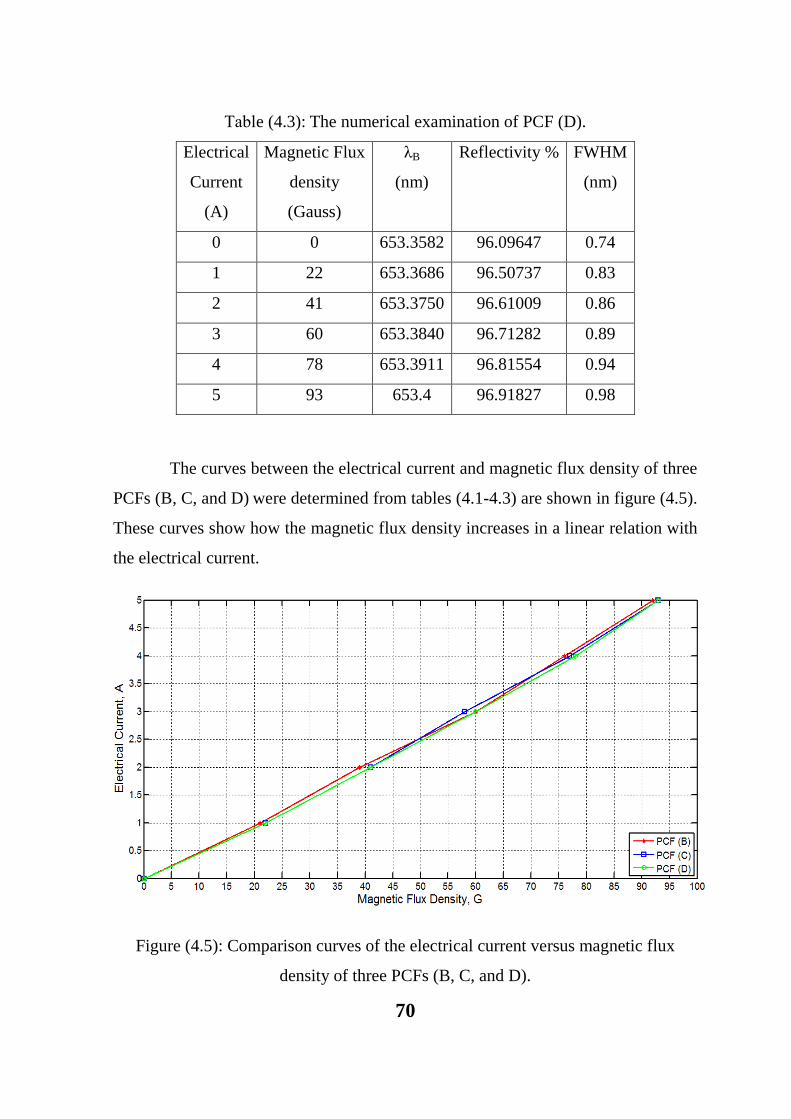
70
eeo e (4.3): The numerical examination of PCF (D).
Electrical
Current
(A)
Magnetic Flux
density
(Gauss)
λB
(nm)
Reflectivity % FWHM
(nm)
0 0 653.3582 96.09647 0.74
1 22 653.3686 96.50737 0.83
2 41 653.3750 96.61009 0.86
3 60 653.3840 96.71282 0.89
4 78 653.3911 96.81554 0.94
5 93 653.4 96.91827 0.98
The curves between the electrical current and magnetic flux density of three
PCFs (B, C, and D) were determined from tables (4.1-4.3) are shown in figure (4.5).
These curves show how the magnetic flux density increases in a linear relation with
the electrical current.
Figure (4.5): Comparison curves of the electrical current versus magnetic flux
density of three PCFs (B, C, and D).
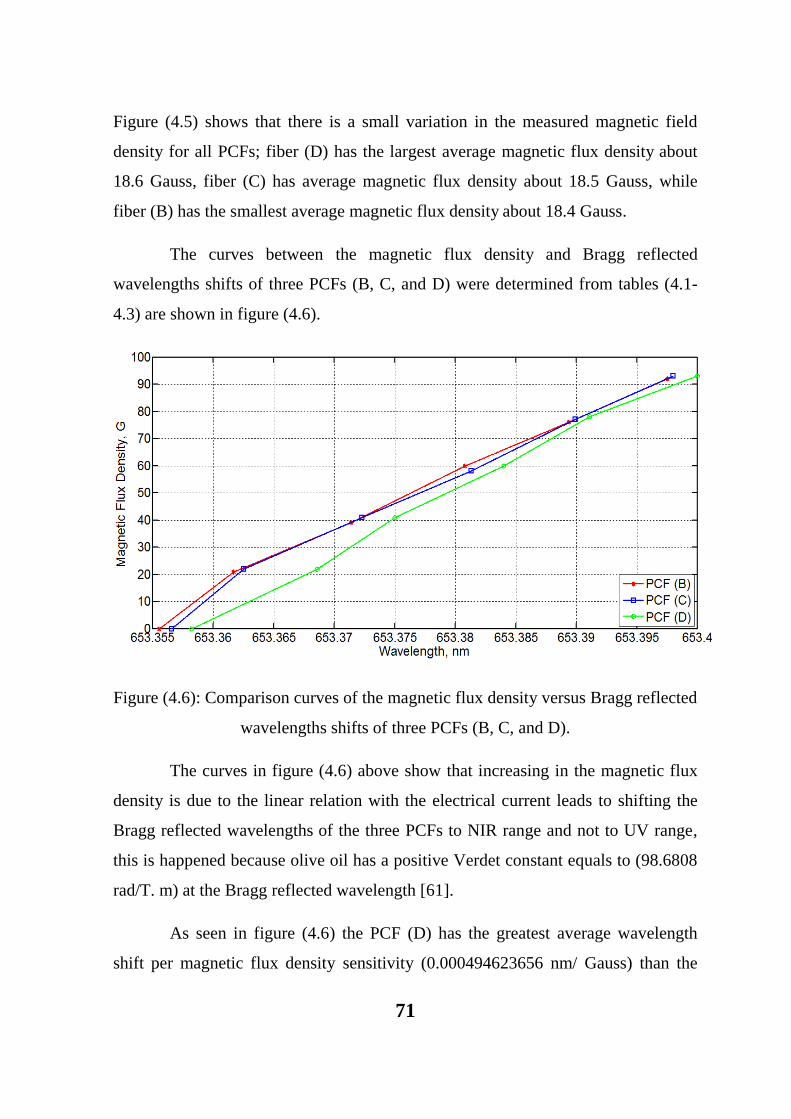
71
Figure (4.5) shows that there is a small variation in the measured magnetic field
density for all PCFs; fiber (D) has the largest average magnetic flux density about
18.6 Gauss, fiber (C) has average magnetic flux density about 18.5 Gauss, while
fiber (B) has the smallest average magnetic flux density about 18.4 Gauss.
The curves between the magnetic flux density and Bragg reflected
wavelengths shifts of three PCFs (B, C, and D) were determined from tables (4.1-
4.3) are shown in figure (4.6).
Figure (4.6): Comparison curves of the magnetic flux density versus Bragg reflected
wavelengths shifts of three PCFs (B, C, and D).
The curves in figure (4.6) above show that increasing in the magnetic flux
density is due to the linear relation with the electrical current leads to shifting the
Bragg reflected wavelengths of the three PCFs to NIR range and not to UV range,
this is happened because olive oil has a positive Verdet constant equals to (98.6808
rad/T. m) at the Bragg reflected wavelength [61].
As seen in figure (4.6) the PCF (D) has the greatest average wavelength
shift per magnetic flux density sensitivity (0.000494623656 nm/ Gauss) than the

72
PCFs (B and C) which are of average wavelength shift per magnetic
flux density sensitivity (0.0004560456522 nm/Gauss) eft
(0.000482518919 nm/Gauss) respectively, this is happened due to the different
concetrations of olive oil in the three PCFs. Since olive oil is a photonic crystal
material, therefore a PCF with larger concetration of olive oil has the greatest
sensitivity.

73
CHAPTER FIVE
Conclusions and Future Work
5.1 Conclusions
The important facts concluded from the obtained results of this work can be given
as follow:
1. The fabrication setup is able to fabricate Bragg grating in four PCFs filled with
liquids of different consetrations consisting of olive oil, star line Glass Mechanix
adhesive material and ethanol using amplitude interferometric technique with Bragg
reflected wavelength ( ) of 653.3 nm and reflectivity ranges equal to
(PCF(A)=76.20 %, PCF (B) =82.87532 %, PCF (C) =91.49684 %, PCF (D) =
96.09647 %). It is designed and implemented successfully comparable to the
fabricated FBG using two PCFs filled with mixture of olive oil and optical adhesive
material and acetone or with only optical adhesive material using the same
technique with Bragg reflected wavelength ( ) of 806 nm and reflectivity ranges
approximately equal to 50 % and 80 % respectively [21].
2. Increasing the concentration of olive oil in the liquid mixture that rfor rterst
inside PCFs gives a remarkable shift in the fabricated Bragg
reflected wavelength due to the nonlinearity of olive oil [63].
3. The results show that increasing the concentration of olive oil in the liquid
mixture that infiltrated inside PCFs giving the highest reflectivity because olive oil
has an absorption and an emission peaks when it excited at the fabricated Bragg
reflected wavelength (653.3 nm)[63].
4. The Bragg fibers that fabricated can be used as magnetic sensor.
5. The results of applying FBG in magnetic field sensing show that increasing the
magnetic flux density will increase the shift of Bragg reflected wavelength. As well

74
as increasing olive oil concentration in the liquid mixture that infiltrated inside
PCFs giving a remarkable wavelength shift to NIR range because olive oil at this
fabricated Bragg wavelength has positive Verdet constant equals to (98.6808 rad/T.
m) [61], so PCF (D) is more sensitive compared to other PCFs (B and C).
6. Increasing olive oil concentration in the liquid mixture that infiltrated inside PCF
(D) gives a noticeable wavelength shift sensitivity about (0.000494623656 nm/
Gauss).
7. The sensitivity of the three PCFs (B, C, and D) is higher compared to
the sensitivity of a PCF without Bragg grating and filled with only olive oil
about (0.0003509 rad/Gauss) at 650 nm wavelength by dividing the rotation angle
per the magnetic flux density [61].
8. The FWHM is increased linearly with the increasing of Bragg reflected
wavelength for all PCFs due to their direct proportional relation [28].
9. The shift in wavelength due to the magnetic field is a linear shift.
10. The reflectivity increases linearly with the increasing in magnetic flux density.
5.2 Future Work
A number of future works can be proposed relying on the practical results of this
thesis as follows:
1. Using a higher resolution translation stage to produce more precise Bragg grating
for the same fiber length.
2. Fabricating multi functionality sensors on the same fiber such as pressure, strain,
temperature, acceleration sensors.
3. Use UV grating instead of interferometric technique to fabricate FBG.

75
REFERENCES
[1] A. Othonos," Review of Scientific Instruments: Fiber Bragg Gratings", Vol. 68,
No. 12, PP. 4309-4341, December 1997.
[2] K.O. Hill, Y. Fujii, D.C. Johnson and B.S. Kawasaki, "Photosensitivity in
Optical Fiber Waveguides: Application to Reflection Filter Fabrication", Applied
Physics Letters, Vol. 32, No. 10, PP. 647-649, May 1978.
[3] B. S. Kawasaki, K. O. Hill, D. C. Johnson, and Y. Fujii, "Narrow-Band Bragg
Reflectors in Optical Fibers", Optics Letters, Vol. 3, No. 2, PP. 66-68, 1978.
[4] G. Meltz, W.W. Morey and W. H. Glenn, "Formation of Bragg Gratings in
Optical Fibers by a Transverse Holographic Method", Optics Letters, Vol. 14, No.
15, PP. 823-825, Aug 1989.
[5] K. O. Hill, B. Malo, F. Bilodeau, and D. C. Johnson, "Photosensitivity in
Optical Fibers", Annu. Rev. Mater. Sci.,Vol. 23, PP. 125-157,1993.
[6] R. J. Campbell and R. Kashyap, "The Properties and Applications of Photo
Sensitive Germanosilicate Fiber", Int. J. Optoelectron, Vol. 9, No. 1, PP. 33-
57, 1994.
[7] R. KASHYAP, "Photosensitive Optical Fibers: Devices and Applications", Opt.
Fiber Technol, Vol. 1, No.1, PP.17–34, Oct 1994.
[8] M. Green, And S. J. Madden, "Low Loss Nematic Liquid Crystal Cored Fiber
Waveguides", Appl. Opt., Vol. 28, No. 24 PP. 5202–5203, 1989.
[9] Abby Juhl,"Holographic Polymer Dispersed Liquid Crystal", Braun Group
People, University of Illinois,
Site:http://braungroup.beckman.illinois.edu/AbbyGriffith.html.

76
[10] F. Bruyneel, H. De Smet, J. Vanfleteren, A. Van Calster, "Cell Gap
Optimization and Alignment Effects in Reflective PDLC Microdisplays", Liquid
Crystals, Vol. 28, No. 8, PP. 1245-1252,2001.
[11] Y. J. Liu and X. W. Sun, "Holographic Polymer-Dispersed Liquid Crystals:
Materials, Formation, and Applications", Hindawi Publishing Corporation,
Advances in OptoElectronics, Vol. 2008, 2008.
[12] E. Wikszak, J. Thomas, J. Burghoff, B. Ortaç, J. Limpert, S. Nolte,
"Erbium Fiber Laser Based on Intracore Femtosecond-Written Fiber Bragg
Grating", Optics Letters Vol. 31, No.16, PP. 2390-2392, 2006.
[13] Y. Lai, K. Zhou, K. Sugden, and I. Bennion, " Point-by-point Inscription of
First Order Fiber Bragg Grating for C-Band Applications " , Optics Express, Vol.
15, No. 26, Dec 2007.
[14] B. Guan, D. Chen, Y. Zhang, H. Wang, H. Tam, "Bragg Gratings in Pure-
Silica Polarization Maintaining Photonic Crystal Fiber", IEEE
photonics technology letters, Vol. 20, No. 23, December 2008.
[15] Y. Wang, H. Bartelt, M. Becker, S. Brueckner, J. Bergmann, J.
Kobelke, M. Rothhardt, "Fiber Bragg grating Inscription in Pure-Silica and Ge-
Doped Photonic Crystal Fibers", Applied Optics, Vol. 48, No. 11, April 2009.
[16] Z. Zhang, C. Zhang, X. Tao, G. Wang, and G. Peng, Inscription of "
Polymer Optical Fiber Bragg Grating at 962 nm and Its Potential in Strain Sensing " ,
IEEE Photonics Technology Letters, Vol. 22, No.21, Nov 2010.
[17] Y. Wang, H. Bartelt, W. Ecke, R. Willsch, J. Kobelke, "UV-Laser-Inscribed
Fiber Bragg Gratings in Photonic Crystal Fibers and Sensing Applications", Proc.
SPIE 8201, International Conference on Optical Instruments
and Technology: Optoelectronic Measurement Technology and Systems, lg .
8201, November 2011.
77
[18] C. M. Rollinson, S. A. Wade, B. P. Kouskousis, D. J. Kitcher, G. W.
Baxter, and S. F. Collins, Variations of the Growth of Harmonic Reflections in "
Fiber Bragg Gratings Fabricated Using Phase Masks " , J. Opt. Soc. Am. A, Vol. 29,
No. 7, July 2012.
[19] T. Elsmann, T. Habisreuther, A. Graf, M. Rothhardt, and H.
Bartelt, " Inscription of First-Order Sapphire Bragg Gratings Using 400 nm
Femtosecond Laser Radiation " , Optics Express, Vol. 21, No. 4, Feb 2013.
[20] I. Bundalo, K. Nielsen, C. Markos, O. Bang, "Bragg Grating Writing in
PMMA Microstructured Polymer Optical Fibers in Less Than 7 Minutes ", Optics
Express, Vol. 22, No. 5, 10 March 2014.
[21] A. Engad, H. M. Ahmed and A. A. Al- Dergazly," Photonic Crystal Fiber
Bragg grating Using Olive Oil as Liquid Photonic Crystal and Adhesive Material
for Construction", IJISET - International Journal of Innovative Science,
Engineering & Technology, Vol. 2, No. 3, March 2015.
[22] D. Marcuse, " Loss Analysis of Single-Mode Fiber Splices " , the Bell System
Technical Journal, Vol. 56, No. 5, PP. 703-718, 1977.
[23] S. Arismar Cerqueira, "Recent Progress and Novel Applications of Photonic
Crystal Fibers", Reports on Progress in Physics, Vol. 73, No. 2, 2010.
[24] M.Yasin, S.W. Harun, and H. Arof, "Recent Progress in Optical
Fiber Research", InTech, PP. 3-25, 2012.
[25] T. Ritari, "Novel Sensor and Telecommunication Applications of Photonic
Crystal Fibers", Ph.D thesis, Helsinki University of Technology, Department of
Electrical and Communications Engineering,Optics and Molecular Materials, 2006.
[26] A. Othonos and K. Kalli, "Fiber Bragg
Gratings: Fundamentals and Applications in Telecommunications and
Sensing", Artech House, Norwood, MA, 1999.
78
[27] I. P. Johnson, ''Grating Devices in Polymer Optical Fibre'', Aston University,
August 2011.
[28] R. C. S. B. Allil, Marcelo M. Werneck, B. A. Ribeiro, F. V. B. de Nazaré, ''
A Guide to Fiber Bragg Grating Sensors'', PP. May 15, 2013.
[29] D. K. W. Lam and B. K. Garside, "Characterization of Single-Mode Optical
Fiber Filters", Appl. Opt., Vol. 20, No.3, PP. 440-445, 1981.
[30] V. Mizrahi and J. E. Sipe, "Optical Properties of Photosensitive Fiber Phase
Gratings", J. Light wave Technol., Vol. 11, No. 10, PP. 1513-1517, 1993.
[31] T. Erdogan, J. E. Sipe, ''Tilted Fiber Phase Gratings'', J. Optical Society of
America A, Vol. 13, No.2, PP. 296-313, 1996.
[32] D.J. Dunn, "Adhesives and Sealants: Technology, Applications and Markets",
Rapra Technology Limited, 2003 .
[33] H. Liu, F. Lin, M. Chen, and K. Xu, "Preparation and Properties of New UV-
curable Naphthyl Epoxy Acrylates", Journal of Functional Polymers, Vol. 19, No.
3, March 2010.
[34] P. Cognard, "Handbook of Adhesives and Sealants:
General Knowledge, Application of Adhesives, New Curing Techniques", Elsevier
Science, 2006.
[35] S. Ebnesajjad, "Handbook of Adhesives and Surface Preparation: Technology,
Applications and Manufacturing", Elsevier Science, 2010 .
[36] P. Glöckner, "Radiation Curing: Coatings and Printing Inks; Technical Basics,
Applications and Trouble Shooting", Vincentz Network, 2008 .
[37] R. Sutherland, V. Tondiglia, L. Natarajan, P. Lloyd, and T. Bunning,
"Liquid Crystal Bragg Gratings for High-Brightness Spatial Light Modulators",

79
Proceedings of the society of photo-optical instrumentation engineers (SPIE)
Newsroom, November, 2007.
[38] R.L. Sutherland, V.P. Tondiglia, L.V. Natarajan, P.F.
Lloyd, T.J. Bunning, "Coherent Diffraction and Random Scattering in Thiol-
Ene Based Holographic Polymer-Dispersed Liquid Crystal
Reflection Gratings," Journal of Applied Physics, Vol. 99, No. 12, June 2006.
[39] R. Kashyap, J. R. Armitage, R. W. Wyatt, S. T. Davey, and
D. L. Williams, "All-Fibre Narrow-Band Reflection Gratings at
1500 nm", Electron. Lett., Vol. 26, No. 11, PP. 730-731, 1990.
[40] R. Kashyap, "Fiber Bragg Gratings", Academic Press, 1999.
[41] K. O. Hill, B. Malo, F. Bilodeau, D. C. Johnson, J. Albert, "Bragg Gratings
Fabricated in Monomode Photosensitive Optical Fiber by UV Exposure through
a Phase Mask", Applied Physics Letters, Vol. 62, No. 10, PP. 1035-1037, 1993.
[42] D. Z. Anderson, D. Z. Anderson, V. Mizrahi, T. Erdogan, A. E. White,
"Production of In-Fiber Gratings Using A Diffractive Optical-Element", Electronics
Letters, Vol. 29, No.6, PP. 566-568, 1993.
[43] Z. Xiong, G. D. Peng, B. Wu, and P. L. Chu, "Effects of the Zeroth-Order
Diffraction of a Phase Mask on Bragg Gratings", Journal of Lightwave Technology,
Vol. 17, No. 11, PP. 2361-2365, Nov 1999.
[44] Q. Zhang, D. A. Brown, L. Reinhart, T. F. Morse, J. Q. Wang, G. Xiao,
"Tuning Bragg Wavelength by Writing Gratings on Prestrained Fibers", IEEE
Photonics Technology Letters, Vol. 6, No. 7,PP. 839-841, 1994.
[45] B. Malo, K. O. Hill, F. Bilodeau, D. C. Johnson, and J. Albert, "Point-by-
Point Fabrication of Micro-Bragg Gratings in Photosensitive Fiber Using Single
Excimer Pulse Refractive Index Modification Techniques", Electron. Let., Vol. 29,
No. 18, PP. 1668-1669, 1993.

80
[46] A. Al-dergazly, A. Fadhel, "Investigation of Olive Oil as a New Photonic
Liquid Crystal for Optical Communication Systems", World Scientific and
Engineering Academy and Society (WSEAS) Stevens Point, Wisconsin, USA,
2010.
[47] S. Serpil, S. G. Sumnu, " Physical Properties of Food " , Journal of Food
Processing and Preservation, Vol. 31, No. 1, February 2007.
[48] N. Siddiqui and A. Ahmad, " A Study on Viscosity, Surface Tension and
Volume Flow Rate of Some Edible and Medicinal Oils " , International Journal of
Science, Environment and Technology, Vol. 2, No. 6, 2013.
[49] T. A. Berkoff and A. D. Kersey, "Experimental Demonstration of a Fiber
Bragg Grating Acceleration sensor", IEEE Photon. Technol. Lett., Vol. 8, No. 12,
PP. 1677-1679, 1996.
[50] B. Guan, H. Tam, S. Liu, "Temperature- Independent Fiber Bragg Grating
Tilt Sensor", IEEE Photon. Technol. Lett., Vol. 16, No.1, PP. 224-226, January
2004.
[51] H. Sheng, M. Fu, T. Chen, W. Liu, and S. Bor, "A Lateral Pressure Sensor
Using a Fiber Bragg Grating", IEEE Photon. Technol. Lett., Vol. 16, PP. 1146-
1148, April 2004.
[52] S. C. Tjin, R. Suresh, and N. Q. Ngo, "Fiber Bragg Grating Based Shear-
Force Sensor: Modeling and Testing", IEEE J. Lightwave Technol., Vol. 22, No. 7,
PP. 1728-1730, July 2004.
[53] W. Thongnum, N. Takahashi, S. Takahashi, "Temperature Stabilization of
Fiber Bragg Grating Vibration Sensor", 15th Int. conf. on Optical Fiber Sensors, PP.
223-226, 2002.

81
[54] A. N. Chryssis, S. M. Lee, S. B. Lee, S. S. Saini, M. Dagenais, "High
Sensitivity Evanescent Field Fiber Bragg Grating Sensor", IEEE Photon. Technol.
Lett., Vol. 17, No. 6, PP. 1253-1255, June 2005.
[55] J. E. Lenz, "A Review of Magnetic Sensors", Proc. of the IEEE, Vol. 78, No.
6, PP. 973-989, 1990.
[56] G. W. Day, D. N. Payne, A. J. Barlow and J. J. Ramskov-Hansen, "Faraday
Rotation in Coiled, Monomode Optical Fibers: Isolators, Filters, and Magnetic
Sensors", Opt. Lett., Vol. 7, No.5, PP. 238-240, May 1982.
[57] H. Okamura, "Fiber-Optic Magnetic Sensor Utilizing the Lorentzian Force",
IEEE J. Lightwave Technol, Vol. 8, No. 10, PP. 1558-1560, October 1990.
[58] A. Yariv, H. V. Winsor, "Proposal for Detection of Magnetic Fields Through
Magnetostrictive Perturbation of Optical Fibers" Opt. Lett., Vol. 5, No. 3, PP. 87-
89, March 1980.
[59] N. Hartman, D. Vahey, R. Kidd, and M. Browning, "Fabrication and
Testing of a Nickel-Coated Single-Mode Fiber Magnetometer", Electron. Lett., Vol.
18, No. 5, pp. 224-226, 1982.
[60] A. Dandridge, A. B. Tveten, G. H. Sigel, E. J. West and T. G. Giallorenzi,
"Optical Fiber Magnetic Field Sensors", Electron. Lett., Vol. 16, PP. 408-409,
1980.
[61] A. Shakir, R.D. AL-Mudhafa and A. Al-
Dergazly, "Verdet Constant Measurement of Olive Oil for Magnetic Field
Sensor ", International Journal of Advances in Electrical & Electronics Engineering,
Vol. 2, No. 2, PP. 362-368, 2013.
[62] Y. N. Ning, B. C. Chu and D. A. Jackson, "Miniature Faraday Current Sensor
Based on Multiple Critical Angle Reflections in a Bulk-Optic Ring", Optics Letters,
Vol. 16, No. 24, PP. 1996-1998, 1991.

82
[63] O. N. Mohammed and A. A. AL – Dergazly," Measurement the Fluorescence
Parameters of the Olive Oil and Comparing it with Some Laser Dye Materials",
Baghdad university, Journal of Engineering, Vol. 16, No.1, PP. 4527-4534, March
2010.


B
APPENDIX (B)


D
APPENDIX (D)
#define step_pin 3
#define dir_pin 2
#define MS1 5
#define MS2 4
#define ld 9
int dir;
int steps =158 ;
void setup() {
pinMode(MS1, OUTPUT);
pinMode(MS2, OUTPUT);
pinMode(dir_pin, OUTPUT);
pinMode(step_pin, OUTPUT);
pinMode(ld,OUTPUT);
digitalWrite(MS1, LOW);
digitalWrite(MS2, LOW);
digitalWrite(dir_pin, HIGH);
}
void loop() {
while(steps>=0) {
digitalWrite(step_pin, HIGH);
delay(1000);
digitalWrite(step_pin, LOW);
delay(1000);
digitalWrite(ld,HIGH);
delay(180000);
digitalWrite(ld,LOW);
steps--;
}
}

E
APPENDIX (E)
clear all; clc; close all
lamda_Bragg = 653.3551e-9;
L=0.038;
deltan=7.623e-6;
bitch=2.241250653e-7;
neff=1.45756812;
j(v)=0.995086161;
% A=lamda_Bragg/(2*neff); neff=lamda_Bragg/(2*bitch);
lambda=(653.31e-9:0.0005e-9:653.4e-9);
%lambda=(1.0:0.1:1.5);
for i = 1:length (lambda);
% beta(i)=(2*pi*neff)/lambda(i);
% deltab(i)=beta(i)-(pi/bitch);
deltab(i) = 2*pi*neff*(1/lambda(i) - 1/lamda_Bragg) ;
k(i)=(pi/lambda(i))*deltan*j(v); gamma(i)=sqrt(k(i)^2-deltab(i)^2);
sinhp=sinh(gamma(i)*L);
coshp=cosh(gamma(i)*L);
% R(i)=abs(sinhp^2/(coshp^2-(deltab(i)^2/k(i)^2)));
R(i)=sinhp^2/(coshp^2-deltab(i)^2/k(i)^2);
end;
plot (lambda,R);
axis( [653.31e-9, 653.4e-9, 0, 1]);
hold on
plot (lambda,(1-R));
axis([653.31e-9, 653.4e-9, 0, 1]);

F
APPENDIX (F)
clear all; clc; close all
lamda_Bragg = 653.3551e-9;
L=0.098;
deltan=7.623e-6;
bitch=2.241250653e-7;
neff=1.45756812;
j(v)=0.995086161;
% A=lamda_Bragg/(2*neff); neff=lamda_Bragg/(2*bitch);
lambda=(653.31e-9:0.0005e-9:653.4e-9);
%lambda=(1.0:0.1:1.5);
for i = 1:length (lambda);
% beta(i)=(2*pi*neff)/lambda(i);
% deltab(i)=beta(i)-(pi/bitch);
deltab(i) = 2*pi*neff*(1/lambda(i) - 1/lamda_Bragg) ;
k(i)=(pi/lambda(i))*deltan*j(v); gamma(i)=sqrt(k(i)^2-deltab(i)^2);
sinhp=sinh(gamma(i)*L);
coshp=cosh(gamma(i)*L);
% R(i)=abs(sinhp^2/(coshp^2-(deltab(i)^2/k(i)^2)));
R(i)=sinhp^2/(coshp^2-deltab(i)^2/k(i)^2);
end;
plot (lambda,R);
axis( [653.31e-9, 653.4e-9, 0, 1]);
hold on
plot (lambda,(1-R));
axis([653.31e-9, 653.4e-9, 0, 1]);

G
APPENDIX (G)
clear all; clc; close all
lamda_Bragg = 653.3555438e-9;
L=0.038;
deltan=8.613e-6;
bitch=2.241250653e-7;
neff=1.45756911;
j(v)=0.9950867987;
% A=lamda_Bragg/(2*neff); neff=lamda_Bragg/(2*bitch);
lambda=(653.31e-9:0.0005e-9:653.4e-9);
%lambda=(1.0:0.1:1.5);
for i = 1:length (lambda);
% beta(i)=(2*pi*neff)/lambda(i);
% deltab(i)=beta(i)-(pi/bitch);
deltab(i) = 2*pi*neff*(1/lambda(i) - 1/lamda_Bragg) ;
k(i)=(pi/lambda(i))*deltan*j(v); gamma(i)=sqrt(k(i)^2-deltab(i)^2);
sinhp=sinh(gamma(i)*L);
coshp=cosh(gamma(i)*L);
% R(i)=abs(sinhp^2/(coshp^2-(deltab(i)^2/k(i)^2)));
R(i)=sinhp^2/(coshp^2-deltab(i)^2/k(i)^2);
end;
plot (lambda,R);
axis( [653.31e-9, 653.4e-9, 0, 1]);
hold on
plot (lambda,(1-R));
axis([653.31e-9, 653.4e-9, 0, 1]);

H
APPENDIX (H)
clear all; clc; close all
lamda_Bragg = 653.3565367e-9;
L=0.038;
deltan=10.828e-6;
bitch=2.241250653e-7;
neff=1.4575713250;
j(v)=0.9950882248;
% A=lamda_Bragg/(2*neff); neff=lamda_Bragg/(2*bitch);
lambda=(653.31e-9:0.0005e-9:653.4e-9);
%lambda=(1.0:0.1:1.5);
for i = 1:length (lambda);
% beta(i)=(2*pi*neff)/lambda(i);
% deltab(i)=beta(i)-(pi/bitch);
deltab(i) = 2*pi*neff*(1/lambda(i) - 1/lamda_Bragg) ;
k(i)=(pi/lambda(i))*deltan*j(v); gamma(i)=sqrt(k(i)^2-deltab(i)^2);
sinhp=sinh(gamma(i)*L);
coshp=cosh(gamma(i)*L);
% R(i)=abs(sinhp^2/(coshp^2-(deltab(i)^2/k(i)^2)));
R(i)=sinhp^2/(coshp^2-deltab(i)^2/k(i)^2);
end;
plot (lambda,R);
axis( [653.31e-9, 653.4e-9, 0, 1]);
hold on
plot (lambda,(1-R));
axis([653.31e-9, 653.4e-9, 0, 1]);

I
APPENDIX (I)
clear all; clc; close all
lamda_Bragg = 653.3582e-9;
L=0.038;
deltan=14.985e-6;
bitch=2.241249966e-7;
neff=1.457575482;
j(v)=0.9950909022;
% A=lamda_Bragg/(2*neff); neff=lamda_Bragg/(2*bitch);
lambda=(653.31e-9:0.0005e-9:653.4e-9);
%lambda=(1.0:0.1:1.5);
for i = 1:length (lambda);
% beta(i)=(2*pi*neff)/lambda(i);
% deltab(i)=beta(i)-(pi/bitch);
deltab(i) = 2*pi*neff*(1/lambda(i) - 1/lamda_Bragg) ;
k(i)=(pi/lambda(i))*deltan*j(v); gamma(i)=sqrt(k(i)^2-deltab(i)^2);
sinhp=sinh(gamma(i)*L)
coshp=cosh(gamma(i)*L);
% R(i)=abs(sinhp^2/(coshp^2-(deltab(i)^2/k(i)^2)));
R(i)=sinhp^2/(coshp^2-deltab(i)^2/k(i)^2);
end;
plot (lambda,R);
axis( [653.31e-9, 653.4e-9, 0, 1]);
hold on
plot (lambda,(1-R));
axis([653.31e-9, 653.4e-9, 0, 1]);

شكر وتقدير
والعافية. شاكرين فضمو سائمين منو جل وعال أن ينعم عمينا بالصحة الحمد هلل الذي وفقني ألتمام ىذا البحث
البحث كما أود أن أشكر ُمشرفتي الدكتورة أنوار عبد الستار لتوجيياتيا العممية الميمة وتعاونيا ألكمال ىذا
فجزاىا اهلل عني خير الجزاء.
لما قسم ىندسة الميزر واأللكترونيات البصرية كما يسُرني أن أتقدم بالشكر والتقديم الى رئيس وأساتذة وموظفي
جامعة أبدوه من مساعدة وتعاون، وكذلك أود أن اشكر الدكتورة تحرير في معيد الميزر لمدراسات العميا في
اليا وتعاونيا ألتمام ىذا البحث.بغداد ِلُحسن أستقب
ء عمى ما قدموه لي خالل مسيرتي از األع كفاح و والدتي سالم و والدي حنش كما أقدم شكري الجزيل الى جدي
و زوجتو محمد وأخي منى وشيد الدارسية والتي تعجز الكممات واألفعال عن رد جميل فضميم ، والى أخواتي
ء زاي عز وجل أن يجزييم عني خير الجء عمى قمبي أقدم لكم كل الشكر والتقدير و أسال البار از األعفاطمة
ر.وأن يوفقيم لما فيو كل الخي
عمى مساندتيم لي خالل فترة البحث والى رًا أتقدم بوافر الشكر والتقدير الى صديقاتي المطيفات جميعًا أخي
.زميالتي و زمالئي والى من فاتني ذكره و أتمنى من أهلل أن يوفق الجميع لما فيو الخير
فرح سالم حنش عمي الذهبي

الخالصة
المادة م من السوائل )براك المحززة وذلك بحقنيا بمختمف االحجا تم في ىذا البحث تصنيع أربعة ألياف
، زيت الزيتون مذوب مع االيثانول( بداخل الجوف لتمك star line Glass Mechanix الصمغية البصرية
منصة تقنية تداخل تقسيم السعة مع .(HC19-1550 (Thorlab company))االلياف البمورية الفوتونية
يعمل دام ليزر أزرق عممية التصنيع. التصنيع تم بأستخممة خصيصًا وبدقة عالية أستخدمت في انتقالية مص
ألشعة الميزر ونية األربعة المحقونة تم تعريضيانانو متر. األلياف البمورية الفوت 504عند الطول الموجي
ذه األىداب اىدابًا متكررة بشكل دوري لتوليد حزوز براك. ى نانو متر ُمكونة 504الطول الوجي ذو األزرق
براك المصنع النانو متر. طول 504الطول الموجي يالمنقسمين ذو األزرق الميزر تولدت من تداخل شعاعي
مايكرو متر. 5,,02معدل فترة الحزوز تساوي و سم 8.3 يساوي لمميف
ت معالجتيا بأستعمالصري والذي أظير المناطق التي تمة المجير الباأللياف األربعة تم تحميميا بوساط
عن طريق وضع ليزر عند احدى نيايتي الميف وقياس أيضاً . األلياف المصنعة تم فحصيااألزرق ميزرال
لياف براك المحززة أ. (Thorlabs-CCS200)النفاذية عند النياية األخرى بأستخدام ُمحمل األشارة البصرية
الحجم األعمى من أن الميف ذي نانو متر. وكذلك أظيرت النتائج 348.8الموجي لبراك عند الطول ُصنعت
عند الحد أكبر عرض كامل و % نانو متر 03200359 عمى قمة أنعكاسية حوالين يمتمك أزيت الزيتو
نانو متر. 0295األعمى لممنتصف حوالي
والتي تحتوي عمى زيت الزيتون تم فحصيا كُمتحسس PCF (B, C, and D )ثالثة من األلياف المصنعة
لممجال المغناطيسي. أظيرت النتائج بأن كل األلياف تتحرك نحو األشعة تحت الحمراء القريبة. وكذلك
يمتمك أعمى تحسس مغناطيسي في الطول عمى من زيت الزيتونالحجم األ يذأظيرت النتائج بأن الميف
، جاوس\نانو متر 0.0005053,8343قدار عمى األلياف حساسية بمأ ،نانو متر 348.5الموجي حوالي

لي حوا أكبر عرض كامل عند الحد األعمى لممنتصفو نانو متر %032093,9 عمى قمة أنعكاسية حواليأ
. نانو متر 0203

وزارة التعميم العالي والبحث العممي جامعة النيرين/ كمية اليندسة
المجوفة المحقونة ألياف براك المحززة بأستخدام األلياف البمورية الفوتونيةتصنيع
رسالة مقدمة
ىندسة الميزر واأللكترونيات البصرية في جامعة النيرينالى قسم
متطمبات نيل شيادة ماجستير عموم جزء منوىي
في
ىندسة الميزر واأللكترونيات البصرية
من قبل
فرح سالم حنش عمي
(095, ،لوريوسا)بك
9583 ربيع الثاني 099, كانون الثاني