faces of joblessness
TRANSCRIPT

FACES OF JOBLESSNESS
A PEOPLE-CENTRED PERSPECTIVE ON
EMPLOYMENT BARRIERS AND POLICIES
Moving from Welfare to Work
NESC Seminar to Launch NESC Report No. 146
Dublin, 29 June 2018
Herwig Immervoll
Directorate for Employment, Labour and Social Affairs
www.oecd.org/social/faces-of-joblessness.htm
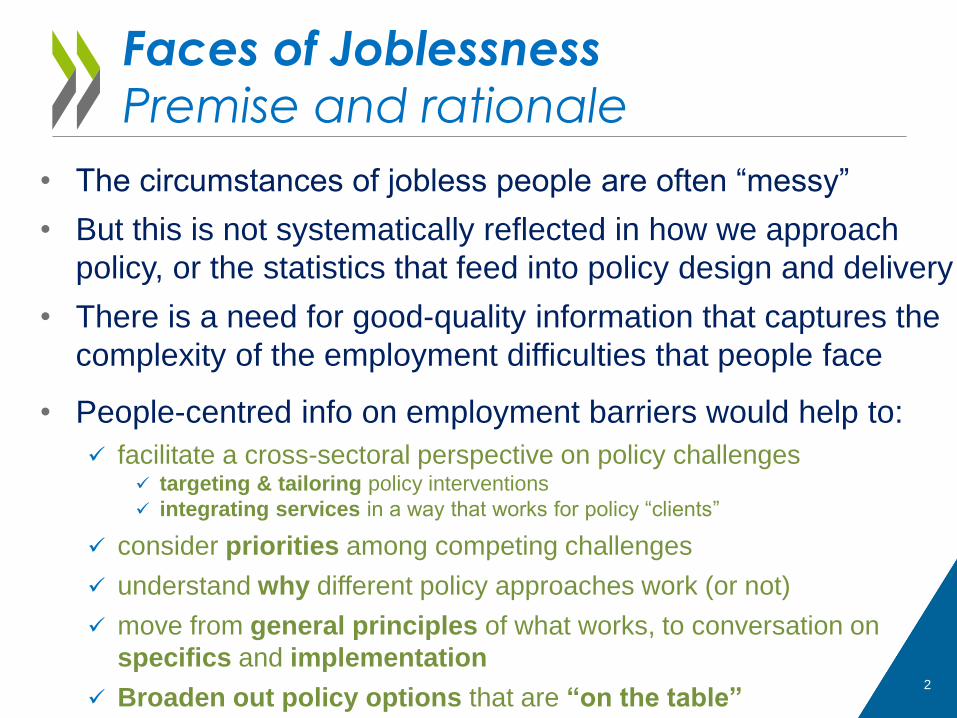
Faces of JoblessnessPremise and rationale
• The circumstances of jobless people are often “messy”
• But this is not systematically reflected in how we approach
policy, or the statistics that feed into policy design and delivery
• There is a need for good-quality information that captures the
complexity of the employment difficulties that people face
• People-centred info on employment barriers would help to:
facilitate a cross-sectoral perspective on policy challenges targeting & tailoring policy interventions
integrating services in a way that works for policy “clients”
consider priorities among competing challenges
understand why different policy approaches work (or not)
move from general principles of what works, to conversation on
specifics and implementation
Broaden out policy options that are “on the table”2

Faces of JoblessnessObjectives
Provide a systematic view on complex circumstances
Align statistics & indicators with real-world experience of
joblessness
Map of “disadvantaged”, “vulnerable” groups. Who are they ?
What employment barriers do they face ?
What policy levers to tackle those barriers ?
3

Faces of JoblessnessLinking policy debates with circumstances “on the ground”
4
activation & employment
support policies
?

5
activation & employment
support policies
1 2 3 4
Faces of JoblessnessLinking policy debates with circumstances “on the ground”

Gaps in existing information
Existing high-level labour-market indicators contain little
information on relevant employment barriers…standard breakdowns (age, sex, …)
no clear link with problems to be addressed(“being young is not a barrier”)
largely individual-based, little family context
Existing in-depth profiling systems designed for needs of
specific process / institution (e.g., PES)…
generally not used for higher-level policy dialogue
may not capture circumstances relevant for key policy
areas, eg. care responsibilities, incentives
miss big parts of jobless, eg. only registered unemployed66

Filling the gap: Main steps People-centred, “bottom-up” approach
1
• Select population of interest here: jobless + low-intensity / unstable employment
(household data: EU-SILC)
2
• Measure employment barriers(i) capabilities, (ii) motivation, (iii) opportunities
3
• Identify policy-relevant groups individuals with similar sets of barriers
(statistical clustering method)
4
• Policy inventory & gap analysis are existing programmes accessible for those groups? are they well-aligned with their main barriers ?
Co
un
try
dia
log
ue

• Initially a 2-year project 2016/2017, innovative partnership:
• Unified method and broadly similar process / outputs
• Extensions @OECD: eg Australia, Finland, France, Ireland, Italy, Lithuania
• Main findings
employment difficulties very different across countries & groups
indicates different needs for support, even in demographically similar
population segments (“older workers”, “youth”, “mothers”)
traditional ways of presenting LM statistics cannot capture this
large majority face multiple barriers
existing programmes sometimes of right type but poor access, coordination
input into OECD country policy reviews, European Semester
A joint effort
8
Estonia Ireland Italy Portugal SpainLithuania
Bulgaria Croatia RomaniaGreece Hungary Poland

Scope for labour-market integration measuresUntapped sources of employment growth
% o
f w
ork
ing
-ag
e p
op
ula
tio
n
0
10
20
30
40
50
Inactive Persistently unemployed Weak labour market attachment
Sources: Australia, Estonia, Ireland, Italy, Lithuania, Portugal, Spain: OECD project “Faces of Joblessness”.
Bulgaria, Croatia, Greece, Hungary, Poland, Romania: World Bank project “Portraits of Labor Market Exclusion”.
Links to all studies are in final slide.

18-64, excluding students, military serviceSource: EU SILC 2014
10
Individuals with potential
employment difficulties
Out of work32% of working-age individuals
Weak labour-market attachment
14% of working-age individuals
Unemployed
Retired
Domestic tasks
Other
inactive
Unfit to work
Restricted
hours
Near-zero
earnings
Unstable
jobs

What difficulties?
A typology of employment barriers
Adapted from Immervoll and Scarpetta, 2012
11
Work-relatedcapabilities• Education / skills
• Work experience
• Health problems
• Care responsibilities
Motivation / Incentives• Out-of-work
benefits
• Tax burdens on in-work earnings
• Non-labourincomes
• Earnings of other family members
Opportunities• Cyclical labour-
market weakness
• Limited hiring in relevant labour-market segment(eg, region, education)

Employment barriersIncidence across countries
12
% of individuals with potential labour market difficulties
0
10
20
30
40
50
60
70
80
90
capabilities incentives opportunity
Sources: OECD, “Faces of Joblessness” country studies. Links to studies are in final slide.

13
Most face multiple barriers
0
10
20
30
40
50
60
70
80
90
100
4 or more barriers 3 barriers 2 barriers single barrier No major barrier
% o
f job
less
& p
artia
lly e
mpl
oyed
Sources: Australia, Estonia, Ireland, Italy, Lithuania, Portugal, Spain: OECD project “Faces of Joblessness”.
Bulgaria, Croatia, Greece, Hungary, Poland, Romania: World Bank project “Portraits of Labor Market Exclusion”.
Links to all studies are in final slide.

« Messy » circumstances …
14
Lower-income
rural mothersexperience,
care, skills,
incentives
10%
14
Older
inactive menhealth, skills,
experience
low income
incentives
14%
Older inactive
womenexperience,
skills, access to
other incomes
14%
Unemployed
prime-age menopportunities,
recentexperience
skills, low income
10%
Well-educated
jobbing
mothers
care, access to
other incomes
9%
Unemployed
fathersopportunities
low income
incentives
6%
Younger part-
time jobbersaccess to other
incomes
17%
Poor
mothersskills, care,
no experience
opportunity
4%
Older
womenno expernce,
skills, health,
opportunity
3%
Early retirees
incentives
health
no recent
experience
5%
Unemployed
educated
youthno experience
skills
opportunities
8%
Sources: see previous slides
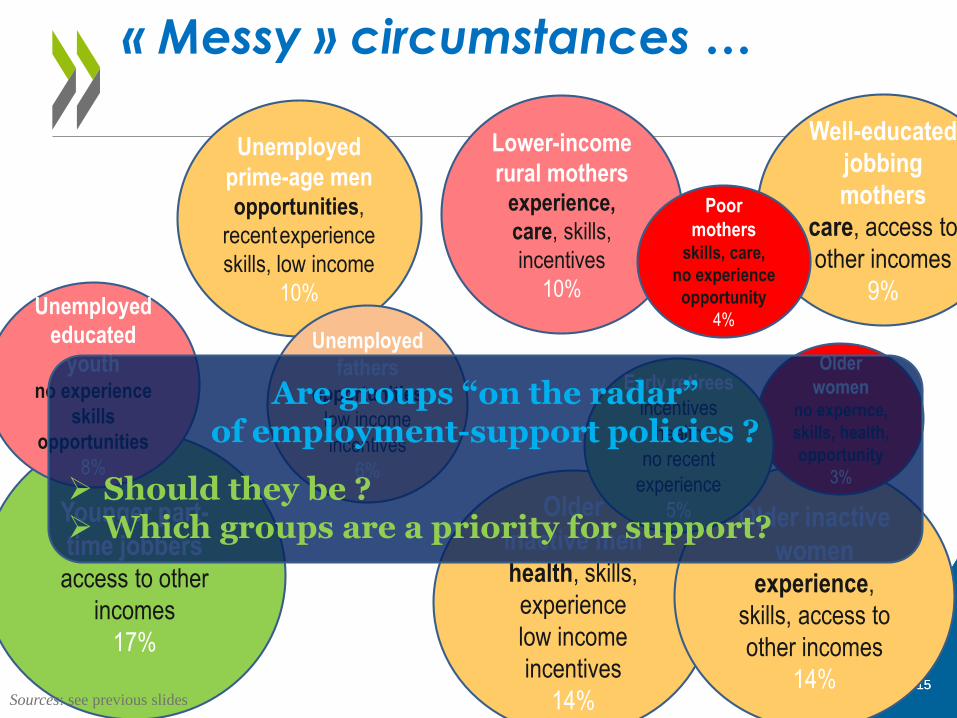
« Messy » circumstances …
15
Lower-income
rural mothersexperience,
care, skills,
incentives
10%
15
Older
inactive menhealth, skills,
experience
low income
incentives
14%
Older inactive
womenexperience,
skills, access to
other incomes
14%
Unemployed
prime-age menopportunities,
recentexperience
skills, low income
10%
Well-educated
jobbing
mothers
care, access to
other incomes
9%
Unemployed
fathersopportunities
low income
incentives
6%
Younger part-
time jobbersaccess to other
incomes
17%
Poor
mothersskills, care,
no experience
opportunity
4%
Older
womenno expernce,
skills, health,
opportunity
3%
Early retirees
incentives
health
no recent
experience
5%
Unemployed
educated
youthno experience
skills
opportunities
8%
Sources: see previous slides
Are groups “on the radar”of employment-support policies ?
Should they be ? Which groups are a priority for support?

16
Lower-income
rural mothers
experience,
care, skills,
incentives
10%
16
Older
inactive men
health, skills,
experience
low income
incentives
14%
Older inactive
women
experience,
skills, access to
other incomes
14%
Unemployed
prime-age menopportunities,
recentexperience
skills, low income
10%
Well-educated
jobbing
mothers
Care, access to
other incomes
9%
Unemployed
fathers
opportunities
low income
incentives
6%
Younger part-
time jobbers
access to other
incomes
17%
Poor
mothers
skills, care,
no
experience
opportunity
4%
Older
women
no
experience,
skills, health,
opportunity
3%
Early
retirees
incentives
health
no recent
experience
5%
Unemployed
educated
youth
no experience
skills
opportunities
8%
16
Sources: see previous slides
On-the-job training,
subsidised
employment
Workplace
adaptation, anti-
discrimination
Income support More accessible &
“active”
Facilitate
part-time
work
Combat
informal
work
On-the-job training,
subsidised
employment
Apply
activation
Incentives for
2nd earners
Tackle support
fragmentation
Childcare
affordable,
accessible
Flexible maternity
& parental leave
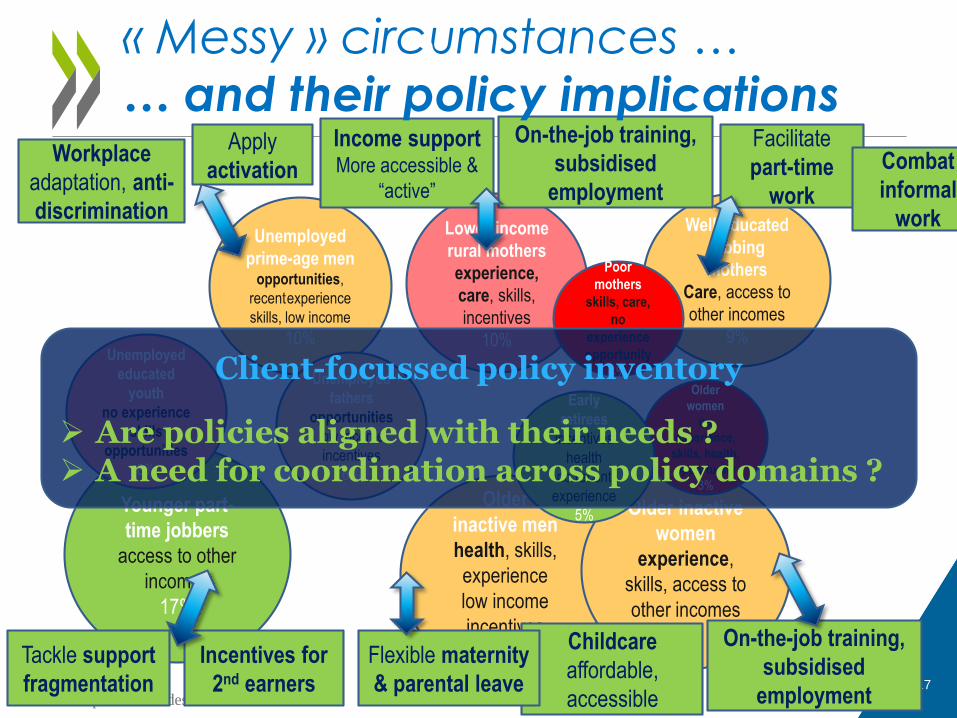
« Messy » circumstances …
… and their policy implications
17
Lower-income
rural mothers
experience,
care, skills,
incentives
10%
17
Older
inactive men
health, skills,
experience
low income
incentives
14%
Older inactive
women
experience,
skills, access to
other incomes
14%
Unemployed
prime-age menopportunities,
recentexperience
skills, low income
10%
Well-educated
jobbing
mothers
Care, access to
other incomes
9%
Unemployed
fathers
opportunities
low income
incentives
6%
Younger part-
time jobbers
access to other
incomes
17%
Poor
mothers
skills, care,
no
experience
opportunity
4%
Older
women
no
experience,
skills, health,
opportunity
3%
Early
retirees
incentives
health
no recent
experience
5%
Unemployed
educated
youth
no experience
skills
opportunities
8%
17
Sources: see previous slides
On-the-job training,
subsidised
employment
Workplace
adaptation, anti-
discrimination
Income support More accessible &
“active”
Facilitate
part-time
work
Combat
informal
work
On-the-job training,
subsidised
employment
Apply
activation
Incentives for
2nd earners
Tackle support
fragmentation
Childcare
affordable,
accessible
Flexible maternity
& parental leave
« Messy » circumstances …
… and their policy implications
Client-focussed policy inventory
Are policies aligned with their needs ? A need for coordination across policy domains ?

• Patterns of LM problems both heterogeneous and evolving
• Need for high-level monitoring on a regular basis
• A people-centred perspective helps to – assess potential sources of employment growth
– complement existing institution/sector-specific profiling
– identify policy gaps, access problems
– highlight incidence of simultaneous barriers, and need for
coordination, suitable sequencing
• “Bird’s-eye” or “microscope”?
• Need both: Additional insights from qualitative data– What personal and family histories precede joblessness?
– What quantitative information do we need to collect systematically ?
– What are subjective perceptions of support services?
(Why) do they differ between service providers & clients?
What next? Summary and outlook
18

Contact: [email protected]
Links & further information:
All country studies on the project website: http://www.oecd.org/social/faces-of-joblessness.htm.
Connecting People with Good Jobs
www.oecd.org/social/benefits-and-wages.htm
Skills and Work
Investing in Youth
Ageing and Employment Policy
Displaced Workers
Mental Health and Work
Follow us: @OECD_Social
Thank you

Additional slides

Participation in education and training
21
Economically inactive mothers with young children, %
Sources: OECD, “Faces of Joblessness” country studies. Links to studies are in final slide.
0
2
4
6
8
10
12
14

Pre-school coverage
22
2014, %
Sources: OECD, “Faces of Joblessness” country studies. Links to studies are in final slide.
0
10
20
30
40
50
60
70
80
90
100
Less than 30 hours 30 hours or over
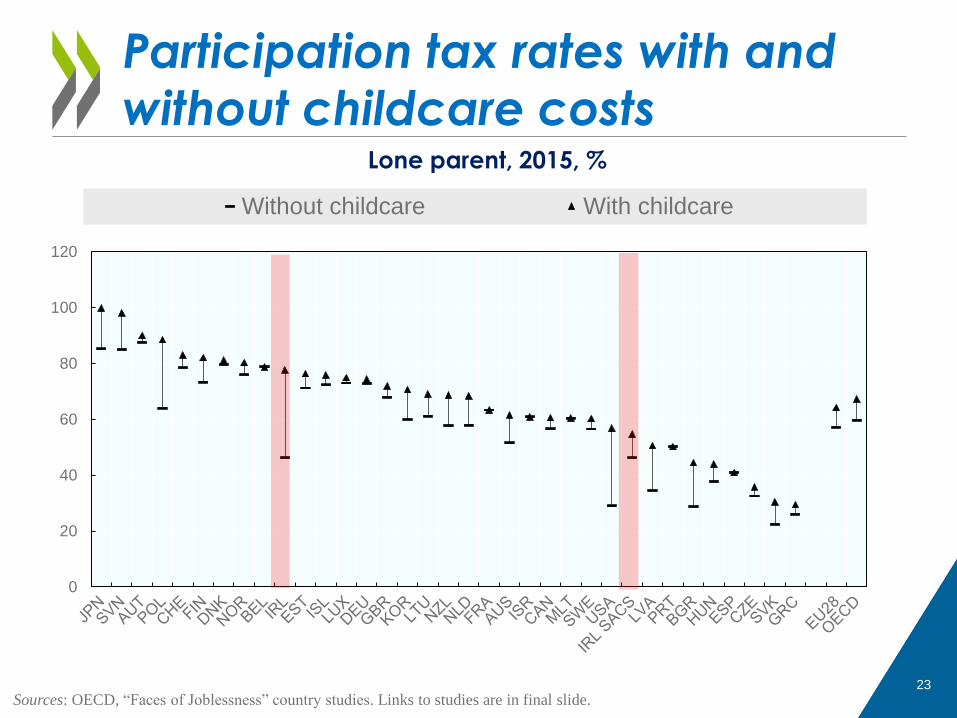
Participation tax rates with and without childcare costs
23
Lone parent, 2015, %
Sources: OECD, “Faces of Joblessness” country studies. Links to studies are in final slide.
0
20
40
60
80
100
120
Without childcare With childcare

Participation tax rates with and without childcare costs
24
Low-earning couple 2015, %
Sources: OECD, “Faces of Joblessness” country studies. Links to studies are in final slide.
0
20
40
60
80
100
120
Without childcare With childcare
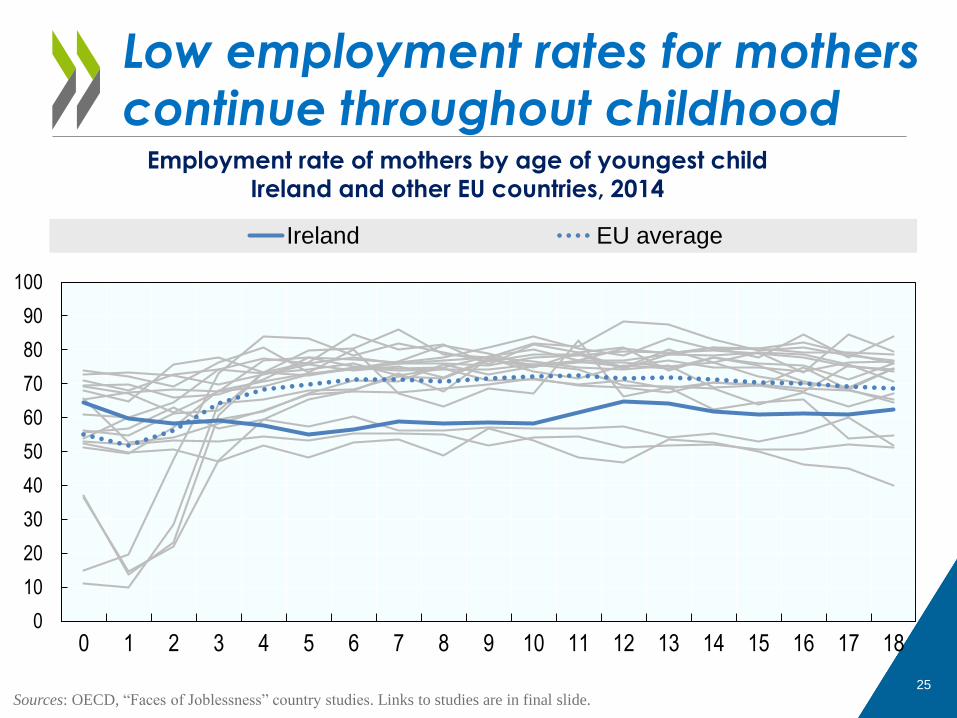
Low employment rates for mothers continue throughout childhood
25
Employment rate of mothers by age of youngest childIreland and other EU countries, 2014
Sources: OECD, “Faces of Joblessness” country studies. Links to studies are in final slide.
0
10
20
30
40
50
60
70
80
90
100
0 1 2 3 4 5 6 7 8 9 10 11 12 13 14 15 16 17 18
Ireland EU average

Contact: [email protected]
Links & further information:
All country studies on the project website: http://www.oecd.org/social/faces-of-joblessness.htm.
Connecting People with Good Jobs
www.oecd.org/social/benefits-and-wages.htm
Skills and Work
Investing in Youth
Ageing and Employment Policy
Displaced Workers
Mental Health and Work
Follow us: @OECD_Social
Thank you