facility demand escalation flow indicators · 2019-10-11 · facility demand escalation matrix...
TRANSCRIPT

Prepared by Damian Miners
Senior Systems Support Specialist
MoH
4 February 2016
Facility Demand Escalation
Flow Indicators

Agenda
• Recognise your Flow Indicators
• Setting your tipping point / thresholds
• Applying your Flow Indicators to your
escalation matrix

Flow Indicators
The Flow Indicators provide you with the ability to better understand
your business and where there may be constraints impacting on
your capacity.
Act early to preserve capacity

Flow Indicators
Engage local managers and clinical leaders in identifying the demand
and capacity flow indicators and thresholds that indicate an escalating
mismatch is occurring.

Recognising your Hospitals Flow Indicators

Recognising your Hospitals Flow Indicators

Recognising your Hospitals Flow Indicators

Recognising your Hospitals Flow Indicators

Adding Flow Indicators

Adding Flow Indicators

Potential Flow Indicators
Available ED Accessible bed capacity - either % or bed numbers
Critical Care capacity
Cardiology / Monitored bed capacity
Single room capacity / ability to clear single room
Number of IHT awaiting transfer to spoke hospital
Staffing / skill mix / changeover

Potential Flow Indicators
Available ED capacity - either % or bed numbers
Available Resus Capacity
Unplaced admitted pts in ED
Ambulance Transfer of Care delays – number of pts / time delayed
Predicted admissions via ED
% of admissions / hour of the day

Potential Flow Indicators
Identified discharges v Predicted discharges

Potential Flow Indicators
Identified discharges v Predicted discharges

Potential Flow Indicators
Identified discharges v Predicted discharges

Potential Flow Indicators
Identified discharges v Predicted discharges

Potential Flow Indicators
Identified discharges v Predicted discharges

Potential Flow Indicators
Identified discharges v Predicted discharges = 78%

Potential Flow Indicators
Identified discharges v Predicted discharges = 78%

Potential Flow Indicators
Identified discharges v Predicted discharges - Surgery = 40%

Potential Flow Indicators
Identified discharges v Predicted discharges
Specialty Specific
Setting the expected discharge target
Ability to pinpoint specialty / ward
Escalate early to the right stakeholders

Tracking Flow Indicators
Track and monitor your flow indicators daily via the PFP predictive
tool Flow indicators table
Track and monitor your flow indicators in the live environment via
the following:
• PFP BedBoard
• Dashboard
• Ambulance Arrivals Board
• Your local Demand and Capacity table / spreadsheet

Setting your tipping point or thresholds
Understanding your core business
Corporate knowledge
Thresholds will be site specific
Use your own data
Test your thresholds
Adjust thresholds as required

Setting your tipping point or thresholds
Patients LOS > 9 Days
Includes: all patients in ED accessible beds
Excludes: Patients who are in beds flagged as "Well baby", "On Leave"
or "Boarder“
ED accessible bed base – number of beds, are the correct wards
flagged as ED accessible.
ED accessible ward profiles –
Aged Care, Critical Care, Neuro, Spinal, Complex Vascular &
Ortho will directly influence the threshold.

Setting your tipping point or thresholds
Patients LOS > 9 Days
Review your current data
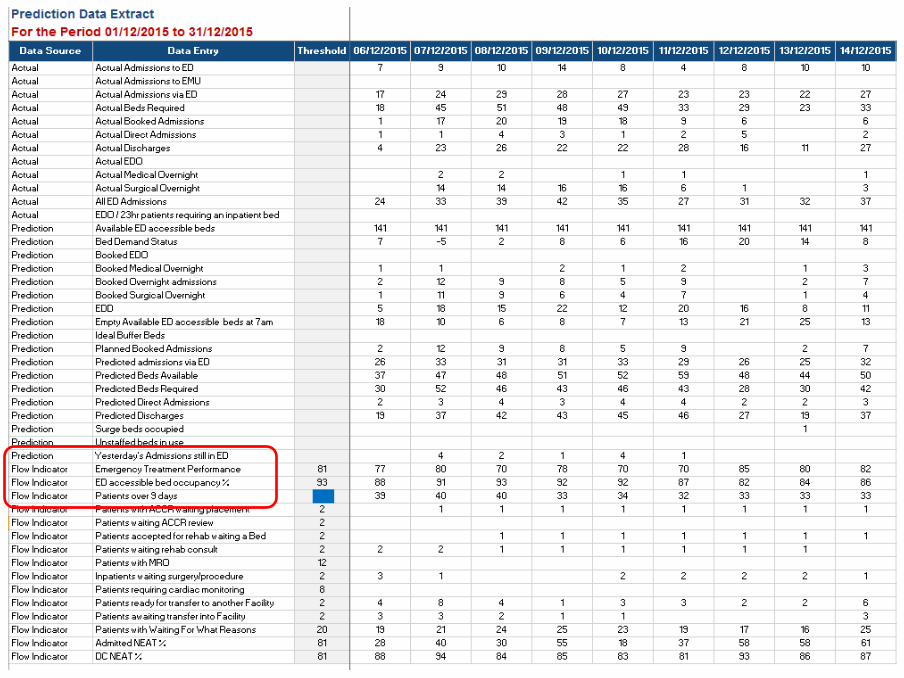
Predictive Tool
Flow Indicators Control Charts tab
Reports Module
Facility Reports
Prediction Data Extract

What were the challenges?
What were the challenges?

What were the challenges?

What were the challenges?

What were the challenges?

What were the challenges?

Setting your tipping point or thresholds
Patients LOS > 9 Days
Review your Threshold
Review your local Flow data
Adjust your Threshold if required
Setting your tipping point or thresholds
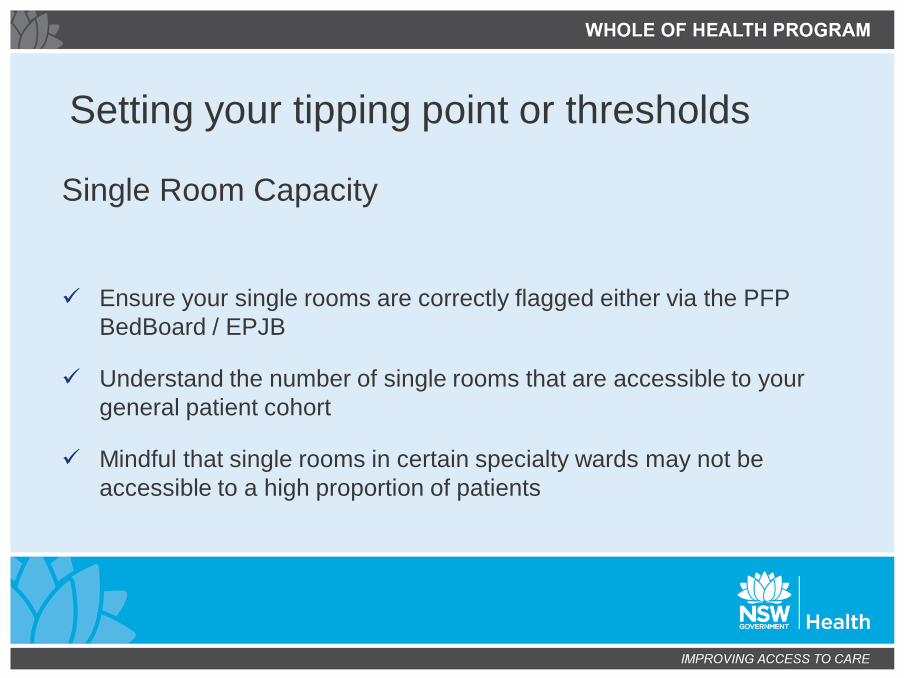
Single Room Capacity
Ensure your single rooms are correctly flagged either via the PFP
BedBoard / EPJB
Understand the number of single rooms that are accessible to your
general patient cohort
Mindful that single rooms in certain specialty wards may not be
accessible to a high proportion of patients

Setting your tipping point or thresholds
Single Room Capacity
Example:
ICU / HDU / CCU
Rehabilitation Units
Paediatrics
Mental Health
Spinal Units

Setting your tipping point or thresholds
Single Room Capacity
Agree on the Hospitals single room bed base
Track single room utilisation to understand the daily demand
• BedBoard filter
• EPJB single room column
• Bed Management Running sheets

Setting your tipping point or thresholds
Single Room Capacity
18 available single rooms
Average 3 new admissions requiring single rooms per day
Threshold to be set at 4
Combination of available single rooms
and single rooms to be cleared

Setting your tipping point or thresholds
Single Room Capacity
Clinical NUM’s / in-charges to provide feedback re: Single Room
capacity during usual bed management communications
• Bed Management Meeting
• EPJB – Isolation Requirement (IR) column
ID teams / Infection Control CNC engaged to provide daily reviews /
education regarding single room utilisation

Setting your tipping point or thresholds
Admitted unplaced Patients in the Emergency
Department
Engage with ED Senior Managers
Review your ED admission data
• Predicted daily admissions
• Variations to admissions across the days of the week
• Peak times for admissions throughout the day
Identify your ED capacity bed base

Setting your tipping point or thresholds
Admitted unplaced Patients in the Emergency
Department
Other factors to consider
• Understand other current ED strategies re: placement of
admitted patients within the ED
• Understand ED staffing capabilities during and after business
hours
• Available ED capacity
• Unplaced Mental Health Admissions

Setting your tipping point or thresholds
Admitted unplaced Patients in the Emergency
Department
Threshold may contain multiple criteria
• ED staff shortages
• Increase in ED workload
• Ambulance Transfer of Care delays
• Specialty dependent (i.e. Admitted Mental Health load)
• Available ED capacity
• Available Resus capacity
• Shift dependent due to rostered staffing

Setting your tipping point or thresholds
Admitted unplaced Patients in the Emergency
Department
Threshold Example
• 5 admitted patients unplaced pts and/or
• No vacant beds in the ED with 1 Resus bed available and/or
• Transfer of Care x 1 pt at >20 minutes

Applying your tipping points to your
Facility Demand Escalation Matrix
Engage local managers and clinical leaders in identifying the demand
and capacity triggers that indicate an escalating mismatch is
occurring.
These triggers will make up the score to apply to the Facility Demand
Escalation Matrix.
The Matrix provides uniformed criteria that support consistent
communication and timely targeted action in response to local
escalation.

Applying your tipping points to your
Facility Demand Escalation Matrix

Applying your tipping points to your
Facility Demand Escalation Matrix

Applying your tipping points to your
Facility Demand Escalation Matrix

Applying your tipping points to your
Facility Demand Escalation Matrix

Applying your tipping points to your
Facility Demand Escalation Matrix


Summary
Engage managers and clinical leaders in identifying the local
demand and capacity triggers
Use your data to assist with allocating a threshold
Test and adjust your thresholds as required
Apply to the Facility Demand Escalation Matrix.
The Matrix provides uniformed criteria that support consistent
communication and timely targeted action in response to local
escalation.
Questions