fact book - college of dupage · vision. therefore, this fact book is but one document in a...
TRANSCRIPT

FACT BOOK2016-2017


FACT BOOK 2016-2017
Office of Planning and Institutional Effectiveness
James R. Benté, Vice President
College of DuPage
425 Fawell Blvd.
Glen Ellyn, IL 60137
The mission of College of DuPage is to be a center for excellence in teaching, learning and
cultural experiences by providing accessible, affordable and comprehensive education.
2 FACT BOOK 2016-2017
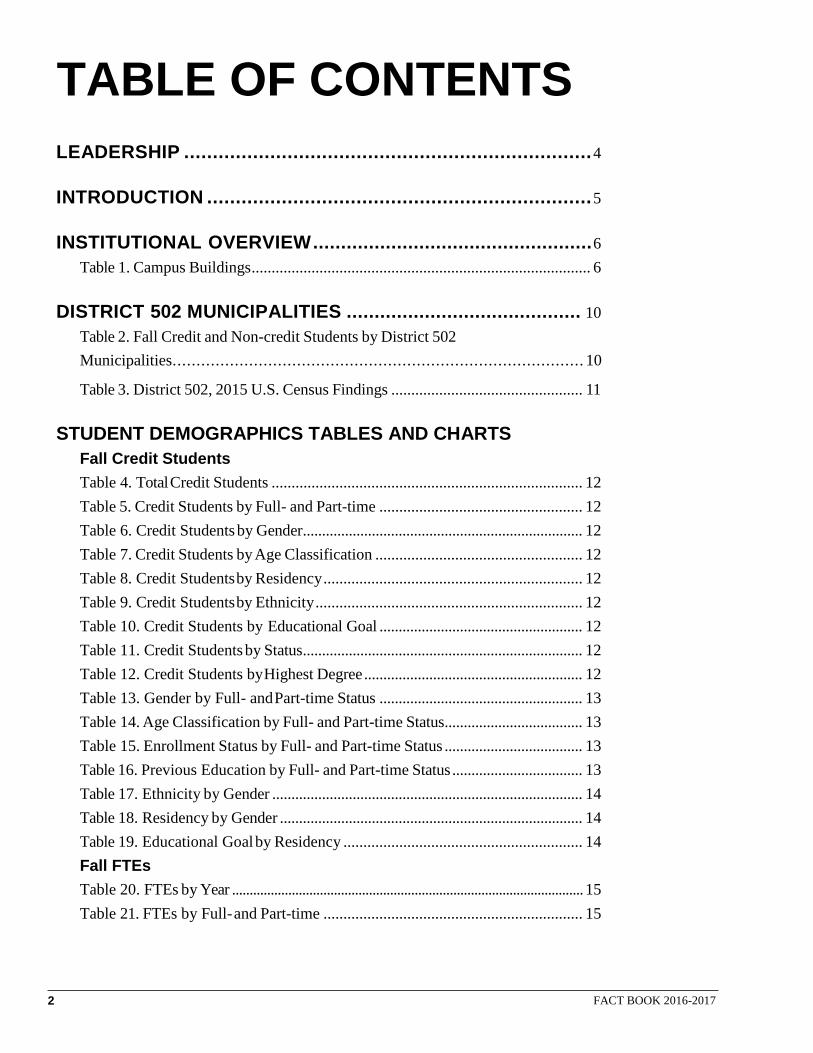
TABLE OF CONTENTS
LEADERSHIP ....................................................................... 4
INTRODUCTION ................................................................... 5
INSTITUTIONAL OVERVIEW .................................................. 6
Table 1. Campus Buildings ..................................................................................... 6
DISTRICT 502 MUNICIPALITIES .......................................... 10
Table 2. Fall Credit and Non-credit Students by District 502
Municipalities ...................................................................................... 10
Table 3. District 502, 2015 U.S. Census Findings ................................................ 11
STUDENT DEMOGRAPHICS TABLES AND CHARTS
Fall Credit Students
Table 4. Total Credit Students .............................................................................. 12
Table 5. Credit Students by Full- and Part-time ................................................... 12
Table 6. Credit Students by Gender ......................................................................... 12
Table 7. Credit Students by Age Classification .................................................... 12
Table 8. Credit Students by Residency ................................................................. 12
Table 9. Credit Students by Ethnicity ................................................................... 12
Table 10. Credit Students by Educational Goal ..................................................... 12
Table 11. Credit Students by Status ......................................................................... 12
Table 12. Credit Students by Highest Degree ......................................................... 12
Table 13. Gender by Full- and Part-time Status ..................................................... 13
Table 14. Age Classification by Full- and Part-time Status.................................... 13
Table 15. Enrollment Status by Full- and Part-time Status .................................... 13
Table 16. Previous Education by Full- and Part-time Status .................................. 13
Table 17. Ethnicity by Gender ................................................................................. 14
Table 18. Residency by Gender ............................................................................... 14
Table 19. Educational Goal by Residency ............................................................ 14
Fall FTEs
Table 20. FTEs by Year .................................................................................................... 15
Table 21. FTEs by Full- and Part-time ................................................................. 15

OFFICE OF PLANNING AND INSTITUTIONAL EFFECTIVENESS 3
Table 22. FTEs by Gender ....................................................................................... 15
Table 23. FTEs by Age Classification .................................................................. 15
Table 24. FTEs by Residency .............................................................................. 15
Table 25. FTEs by Ethnicity ................................................................................ 15
Table 26. FTEs by Educational Goal ................................................................... 15
Table 27. FTEs by Enrollment Status. .................................................................. 15
Table 28. FTEs by Previous Education .................................................................. 15
Table 29. FTEs by Location ................................................................................. 15
Table 30. Gender by Full- and Part-Time Status ..................................................... 16
Table 31. Age Classification by Full- and Part-Time Status .................................. 16
Table 32. Enrollment Status by Full- and Part-Time Status. ................................. 16
Table 33. Highest Degree by Full- and Part-time Status ........................................ 16
Table 34. Ethnicity by Gender ................................................................................. 16
Table 35. Residency by Gender ............................................................................... 17
Table 36. Educational Goal by Residency ............................................................ 17
Degrees and Certificates Awarded
Table 37. Primary Degrees and Certificates Awarded ................................................ 18
Table 38. Types of Degrees Awarded ............................................................................. 18
Table 39. Number of Associate in Applied Science Degrees and
Certificates Awarded by Program ......................................................................... 18
Non-Credit Annual Enrollment
Table 40. Non-Credit Enrollment by Age (Headcount) ....................................... 23
Table 41. Non-Credit Enrollment by Age (Seats) ................................................ 23
Table 42. Non-Credit Enrollment by Activity (Headcount) ................................. 23
Table 43. Non-Credit Enrollment by Activity (Seats) .......................................... 23
FACULTY AND STAFF DEMOGRAPHICS
Table 44. Employee Groups. ................................................................................ 24
Table 45. Highest Degree by Employee Group .................................................... 24
Table 46. Ethnicity by Employee Group .............................................................. 24
Table 47. Full-and Part-time by Employee Group ............................................... 25
Table 48. Gender by Employee Group. ................................................................... 26
4 FACT BOOK 2016-2017
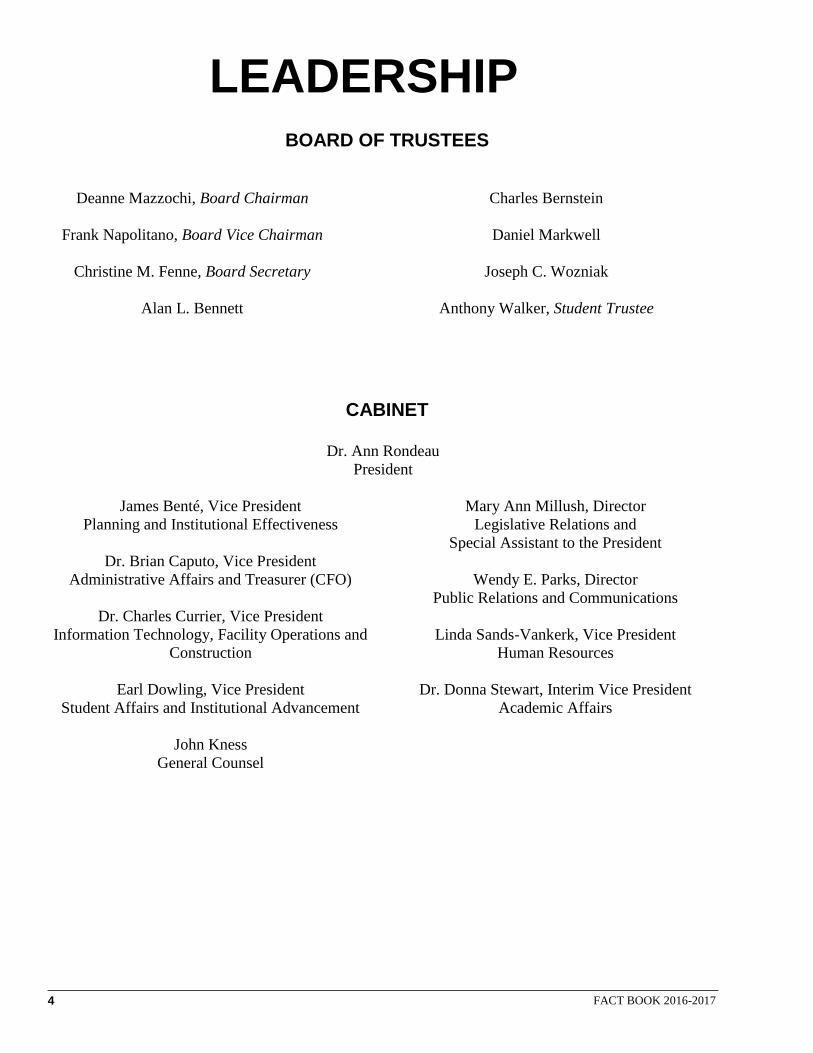
LEADERSHIP
BOARD OF TRUSTEES
Deanne Mazzochi, Board Chairman
Frank Napolitano, Board Vice Chairman
Christine M. Fenne, Board Secretary
Alan L. Bennett
Charles Bernstein
Daniel Markwell
Joseph C. Wozniak
Anthony Walker, Student Trustee
CABINET
Dr. Ann Rondeau
President
James Benté, Vice President
Planning and Institutional Effectiveness
Dr. Brian Caputo, Vice President
Administrative Affairs and Treasurer (CFO)
Dr. Charles Currier, Vice President
Information Technology, Facility Operations and
Construction
Earl Dowling, Vice President
Student Affairs and Institutional Advancement
John Kness
General Counsel
Mary Ann Millush, Director
Legislative Relations and
Special Assistant to the President
Wendy E. Parks, Director
Public Relations and Communications
Linda Sands-Vankerk, Vice President
Human Resources
Dr. Donna Stewart, Interim Vice President
Academic Affairs

OFFICE OF PLANNING AND INSTITUTIONAL EFFECTIVENESS 5
INTRODUCTION Strategic planning at College of DuPage is a continuous process that guides the direction of the institution
and provides quantitative evidence of progress made towards advancing our mission and achieving our
vision. Therefore, this Fact Book is but one document in a “family” of College of DuPage planning
documents:
• The Fact Book provides an evidential base for the planning process by identifying statistical and trend
data related to district demographics, student enrollment, retention and success, degree and certificates
offered, employee numbers and demographics, and other pertinent information.
• The Strategic Long Range Plan (SLRP) is the key document in the family of planning documents. By
identifying strategic goals and related objectives, it provides a clear and concise five- year road map for
the College.
• Since implementing strategies requires resources, the last document in the family of planning
documents is a five-year financial plan that resides within the College of DuPage Budget for the fiscal
year. Using realistic and conservative assumptions, resources are projected and allocated to fund the
various divisional and departmental strategies.
These documents are all available on the College of DuPage website on the Office of the President’s page
at http://www.cod.edu/about/office_of_the_president/index.aspx
Office of Planning and Institutional Effectiveness
James R. Benté, Vice President
January 2016
College of DuPage
425 Fawell Blvd.
Glen Ellyn, IL 60137

6 FACT BOOK 2016-2017
INSTITUTIONAL OVERVIEW
HISTORY College of DuPage’s origins can be traced to two signature events. First was the Illinois General Assembly adoption of the Public Community College Act of 1965. Second was the approval by DuPage high school district voters of a 1965 referendum. Their foresight created a new community college to serve the dynamically growing and prospering DuPage area.
On September 25, 1967, College of DuPage opened under the leadership of President Rodney Berg and Board of Trustees Chairman George Seaton. Classes were held in office trailers and at leased suburban sites throughout the newly formed Community College District 502. Driving from class to class, the students, faculty and staff of this “campus-less” community college became affectionately known as roadrunners, hence the school’s nickname, “Chaparrals.”
In 1968, a 273-acre Glen Ellyn campus site was acquired, and a year later, three interim buildings were constructed. The first permanent building, today’s Rodney K. Berg Instructional Center, opened in 1973. Four years later, the top floor of the Rodney K. Berg Instructional Center was completed, and in 1983, the Student Resource Center and Physical Education and Community Recreation Center opened.
The population of the district served by College of DuPage has grown significantly over the years. Originally formed from 10 high school districts, District 502 has become the most populous in Illinois, outside of Chicago. More than one million residents from all or part of 51 communities comprise today’s District 502, with boundaries encompassing the majority of DuPage County and parts of Cook and Will counties.
Today, with a fall credit enrollment of approximately 27,000 students, College of DuPage is the largest of 48 publicly funded Illinois community colleges and the second largest provider of undergraduate education in the state of Illinois.
FACILITIES Located 25 miles west of downtown Chicago,
College of DuPage’s Glen Ellyn campus
includes 13 main buildings.
Table 1. Campus Buildings
Building Size in square feet (rounded)
Culinary and Hospitality Center (CHC) LEED Certified
61,600
Campus Maintenance Center (CMC) LEED Gold
35,800
Early Childhood Center (ECC) 22,500
George L. Seaton Computing Center (SCC) LEED Silver
18,100
Harold D. McAninch Arts Center (MAC) LEED Certified
168, 300
Health and Science Center (HSC) LEED Gold
189,800
Homeland Security Training Center (HTC) LEED Certified
39,700
Physical Education Center (PEC) LEED Gold
147,400
Robert J. Miller Homeland Security Education Center (HEC) LEED Certified
67,000
Rodney K. Berg Instructional Center (BIC) and Student Services Center (SSC) LEED Certified
569,300
Student Resource Center (SRC) LEED goal of Silver
384,300
Technical Education Center (TEC) LEED Silver
179,100
In order to create a greater presence in the community, making programs and services more accessible to District 502 residents, College of DuPage operates four strategically placed sites in Addison, Carol Stream, Naperville and Westmont.
In addition, College of DuPage has one of the premier outdoor athletic complexes in the nation. The complex includes a football field, baseball field and three soccer fields.

OFFICE OF PLANNING AND INSTITUTIONAL EFFECTIVENESS 7
BOARD OF TRUSTEES The Board of Trustees is charged with establishing
policy for the financing, governance, operation and
administration of the College. Seven voting
members are elected from the district at large and a
non-voting student trustee is elected by student
referendum during spring semester to serve from
April to April.
CORE STATEMENTS College of DuPage is guided by its institutional
philosophy, vision, mission and values.
Institutional Philosophy
College of DuPage believes in the power of
teaching and learning. We endorse the right of
each person to accessible and affordable
opportunities to learn and affirm the innate value
of the pursuit of knowledge and its application to
life. Our primary commitment is to facilitate and
support student success in learning.
College of DuPage is committed to excellence. We
seek quality in all that we do. To ensure quality, we
are committed to continual assessment and self-
evaluation.
College of DuPage values diversity. We seek to
reflect and meet the educational needs of the
residents of our large, multicultural district.
We recognize the importance of embracing
individual differences and cultures and value the
contributions made to the College by people of all
ethnic and cultural backgrounds. We affirm our
role as a catalyst for promoting dialogue and
tolerance on issues supporting the common good.
College of DuPage promotes participation in
planning and decision making. We support
participatory governance and the involvement of
the College community in the development of a
shared vision. We believe that all students, staff
and residents can make meaningful contributions
within a respectful environment that encourages
meaningful discourse. We strive to build an
organizational climate in which freedom of
expression is defended and civility is affirmed.
College of DuPage will be a benefit to students
and the community. The needs of our students
and community are central to all we do.
Vision
College of DuPage will be the primary college
district residents choose for high quality
education.
Mission
The mission of College of DuPage is to be a
center for excellence in teaching, learning and
cultural experiences by providing accessible,
affordable and comprehensive education.
Values
Integrity - We expect the highest standard of
moral character and ethical behavior.
Honesty - We expect truthfulness
and trustworthiness.
Respect - We expect courtesy and dignity in
all interpersonal interactions.
Responsibility - We expect fulfillment of
obligations and accountability.
EDUCATIONAL PROGRAMS As a comprehensive community college,
College of DuPage meets five key community
educational needs through a wide range of
programs, degrees, certificates and services:
1. Transfer Education that prepares students
for transfer to a four-year institution to
pursue a bachelor’s degree.
2. Careers and Technical Education that
prepares students who will graduate with
an Associate in Applied Sciences degree or
certificate to directly enter the workforce.
3. Developmental Education that provides
remedial education for students who are
not academically ready to enroll in
college-level courses.
4. Continuing Education that provides non-
credit courses to the community for
personal development and enrichment.
5. Business Training that provides
specialized or customized training and
education to local companies for their
employees.

8 FACT BOOK 2016-2017
In response to different learning styles and student
needs, College of DuPage delivers its programs and
services in several different formats:
Traditional - face-to-face/in-person instruction
Online/Distance - Internet-based courses
Hybrid - traditional combined with online/distance
dult Fast Track - accelerated program for adults
Independent Learning - self-directed courses
College of DuPage grants the following nine degrees:
1. The Associate in Arts prepares students to
pursue a Bachelor of Arts degree.
2. The Associate in Science prepares students to
pursue a Bachelor of Science degree.
3. The Associate in Engineering prepares
students for transfer to a bachelor program
in engineering.
4. The Associate in Applied Science prepares
students for numerous careers, or for transfer
to a bachelor program.
5. The Associate in General Studies is designed
to meet students’ personal needs or interests.
6. The Associate in Fine Arts in Art prepares
students for transfer to a bachelor’s program in
Fine Arts.
7. The Associate in Fine Arts in Music
prepares students for transfer to a bachelor’s
program in music.
8. The Associate in Arts in Teaching
Secondary Mathematics prepares students
for transfer to a bachelor’s program and to
complete a teacher certificate at the
secondary level for mathematics.
9. The Associate in Arts in Teaching Early
Childhood Education prepares students for
transfer to a bachelor’s program and to complete
the Professional Educator’s License (PEL) with
an Endorsement in Early Childhood Education.
In addition to associate degrees, College of
DuPage offers over 170 certificates in over 50
areas of study.
STUDENT SERVICES College of DuPage provides many services to assist
students in making appropriate academic and career
plans, addressing other issues and enriching their
college experience through co-curricular activities.
Key services include:
Student Counseling and Advising Services
Center for Access and Accommodations
Veteran and Military Personnel
Student Services
International Student Services
The Career Services Center
Math Assistance Area
Tutoring Services
Writing, Reading and Speech Assistance
Library/Research Services
Tuition and Financial Aid Assistance
Placement Testing
Student Life and Leadership
Opportunities Student Leadership
Council
The Student Leadership Council represents
the student body to the administration and
provides a place for students to become
involved in the college community.
Student Clubs
College of DuPage has more than 90 student
clubs that provide opportunities for students to
interact through a connection with academic
programs, topical interest sharing, leisure-time
activities and social interaction. Practicing
leadership, business and organizational skills
outside of the classroom enhances students’ life
and career goals.
Latino Outreach Center
The Latino Outreach Center assists Hispanic
students in achieving their educational goals by
offering extensive support services and referrals.
The goal of the center is to recruit, retain, and
transition Hispanic students beyond College of
DuPage.
Center for Student Diversity and Inclusion
Beginning with African American students and
radiating out to include all students of diverse
backgrounds, the Center fosters a sense of
inclusion and encourages students to participate in
curricular learning and co-curricular activities such
as campus and community organizations,
leadership opportunities and intercultural
experiences.

OFFICE OF PLANNING AND INSTITUTIONAL EFFECTIVENESS 9
Athletics
College of DuPage participates in the North
Central Community College Conference (N4C)
and is a member of the National Junior College
Athletic Association (NJCAA).
Intercollegiate sports for men include:
Baseball
Basketball
Cross Country
Football
Golf
Soccer
Tennis
Track and Field
College of DuPage has women’s teams in:
Basketball
Cross Country
Soccer
Softball
Tennis
Track and Field
Volleyball
There is also a spirit squad that performs at home
football and basketball games.
HAROLD D. MCANINCH ARTS CENTER Since opening in October 1986, the Harold D.
McAninch Arts Center has focused on enriching the community with excellent entertainment
opportunities that go beyond the stage.
Along with offering the most diverse range of
programming in the area, the Harold D. McAninch
Arts Center provides unique outreach and
engagement programs before or after performances
to enlighten and educate their audiences.
The mission of the Harold D. McAninch Arts Center
is to foster enlightened educational and entertaining
performance opportunities, which encourage artistic
expression and engagement, establish a lasting
relationship between people and art and enrich the
cultural vitality of the community.
MARKET OVERVIEW
Competition
Within District 502, College of DuPage’s
competition comes from more than 16 other
institutions of higher education. College of
DuPage also competes on a statewide basis with
other community colleges and universities for
state funds.
Strategic Direction
Through College of DuPage’s comprehensive
strategic planning process, the following eight
strategic goals help to guide the long-term
direction of the College.
1. Accountability: College of DuPage is
committed to being transparent, answerable
and responsible to all stakeholders.
2. Value-Added Education: College of DuPage
is committed to going beyond standard
expectations and providing something more
to the students and communities we serve.
3. Student Centeredness: College of DuPage is
committed to methods of teaching that shift the
focus of instruction from the teacher to the
student.
4. Equality and Inclusiveness: College of DuPage
is committed to ensuring that all stakeholders
are involved in setting institutional direction;
that their perspectives are heard and valued and
their needs are understood and addressed.
5. Relationships: College of DuPage is
committed to cooperating and collaborating
with all stakeholders in order to advance
mutual interests.
6. Innovativeness: College of DuPage is
committed to making meaningful change that
enhances organizational effectiveness and adds
new value for stakeholders.
7. Financial Stewardship: College of DuPage
is committed to the careful and responsible
management of the resources entrusted to its
care.
8. Infrastructure: College of DuPage is
committed to maintaining, improving and
developing structures, systems and facilities
necessary for the delivery of high quality
education and meaningful cultural events.

10 FACT BOOK 2016-2017
DISTRICT MUNICIPALITIES Credit and non-credit students come from 45
municipalities in District 502. Table 2 shows
the 10th day enrollment trends of credit and non-
credit student enrollments in each municipality
for the last five fall terms. Table 3 displays the
2015 Census Findings for many of the same
communities.
Table 2. Fall Credit and Non-credit Students by District 502 Municipalities
Municipality 2013 2014 2015 2016 2017
Lemont* 349 360 331 315 314
Lisle 657 678 676 629 662
Lombard 1,562 1,520 1,537 1,441 1,415
McCook* 2 1 4 4 1
Naperville* 3,909 3,888 3,827 3,645 3,345
Oak Brook 142 159 142 139 123
Oakbrook Terrace 56 56 47 98 102
Plainfield* 160 187 167 188 159
Roselle* 511 512 516 450 420
Villa Park 910 953 978 890 920
Warrenville 406 415 409 444 417
West Chicago* 916 1,063 1,031 910 918
Western Springs 152 148 147 137 134
Westmont 643 665 660 611 560
Wheaton 1,658 1,643 1,609 1,730 1,720
Willow Springs* 33 32 40 42 40
Willowbrook 390 407 364 322 360
Winfield 276 290 284 300 286
Wood Dale 378 339 351 330 306
Woodridge 953 1,009 1,022 966 933
Other-In District 122 166 107 119 103
Out of District 1,848 2,185 2,010 2,016 1,973
Total 29,328 30,074 29,598 28,378 27,576
* Portion of municipality is outside District 502
Municipality 2013 2014 2015 2016 2017
Addison 1,298 1,263 1,274 1,225 1,293
Aurora* 1,330 1,379 1,309 1,283 1,235
Bartlett* 120 110 117 113 116
Bensenville 559 646 598 516 562
Bloomingdale 534 562 531 516 488
Bolingbrook* 591 678 680 626 528
Brookfield* 235 201 240 199 225
Burr Ridge 183 153 163 154 163
Carol Stream* 1,408 1,409 1,357 1,352 1,266
Clarendon Hills 153 150 155 147 153
Countryside 135 121 136 123 138
Darien 522 533 524 521 514
Downers Grove 1,482 1,411 1,385 1,269 1,201
Elk Grove
Village* 25 28 39 27 35
Elmhurst 899 886 866 846 842
Glen Ellyn 1,188 1,223 1,169 1,219 1,032
Glendale Heights 1,243 1,287 1,314 1,241 1,245
Hanover Park* 411 422 439 385 394
Hinsdale 219 221 198 195 201
Hodgkins 30 23 37 24 25
Indian Head Park 48 49 45 46 43
Itasca 187 185 190 178 172
La Grange 287 249 343 241 291
La Grange Park 208 209 230 206 203

OFFICE OF PLANNING AND INSTITUTIONAL EFFECTIVENESS 11
Table 3. District 502, 2015 U.S. Census Findings
Municipality Population Median
Household Income
Persons <18 (2010 Data)
Language other than
English Spoken at
Home
% with Bachelor’s Degree or
Higher
Addison 36,902 $56,203 26.4% 54.1% 21.0%
Aurora* 201,110 $63,967 31.6% 45.3% 31.1%
Bensenville 18,355 $62,286 24.5% 56.5% 17.6%
Bloomingdale 22,075 $76,757 19.4% 33.0% 36.9%
Bolingbrook* 74,518 $80,285 30.6% 33.3% 36.5%
Brookfield* 18,753 $75,336 23.0% 17.9% 37.4%
Burr Ridge 10,780 $126,771 21.1% 24.9% 65.0%
Carol Stream* 40,069 $73,104 25.3% 30.7% 37.6%
Clarendon Hills 8,653 $111,981 31.6% 12.1% 77.8%
Countryside 5,947 $53,750 19.3% 29.9% 27.2%
Darien 22,085 $82,255 20.1% 23.1% 48.6%
Downers Grove 49,473 $85,171 22.8% 12.0% 53.3%
Elk Grove* 32,931 $71,082 20.5% 27.1% 36.0%
Elmhurst 46,387 $100,671 26.5% 13.9% 58.1%
Glen Ellyn 28,042 $101,967 27.9% 16.2% 64.3%
Glendale Heights 34,145 $69,922 26.3% 55.1% 26.8%
Hanover Park* 38,044 $66,359 29.4% 53.2% 22.9%
Hinsdale 17,631 $173,558 33.5% 10.9% 79.0%
Itasca 8,728 $82,269 22.5% 23.7% 35.9%
La Grange 15,610 $105,417 30.1% 13.3% 60.6%
La Grange Park 13,483 $85,671 23.6% 17.0% 51.2%
Lemont* 16,985 $89,524 25.3% 21.4% 39.3%
Lisle 22,492 $79,819 21.0% 19.1% 56.7%
Lombard 43,815 $73,201 21.6% 19.3% 44.3%
Naperville 147,122 $110,676 28.7% 22.9% 66.0%
Oak Brook 8,070 $144,286 17.8% 28.5% 62.9%
Plainfield* 42,933 $116,896 35.2% 16.6% 50.9%
Roselle* 22,814 $79,040 23.5% 27.6% 38.0%
Villa Park 22,012 $71,724 24.2% 26.4% 35.8%
Warrenville 13,246 $80,686 24.8% 25.4% 44.7%
West Chicago* 27,221 $71,520 32.4% 54.5% 24.8%
Western Springs 13,391 $147,361 32.3% 6.1% 76.8%
Westmont 24,767 $55,684 21.9% 21.6% 41.4%
Wheaton 53,389 $91,241 23.8% 12.9% 62.7%
Willow Springs* 5,648 $81,926 19.9% 20.8% 44.3%
Willowbrook 8,543 $67,047 16.6% 29.3% 48.9%
Winfield 9,657 $96,849 23.9% 9.0% 53.2%
Wood Dale 13,813 $63,650 21.0% 36.1% 23.2%
Woodridge 33,476 $76,858. 24.0% 25.7% 48.1%
Illinois Average 12,801,539 $59,196 24.4% 22.7% 32.9%
U.S. Average 323,127,513 $55,322 24.0% 21.1% 30.3%
* Portion of municipality is outside District 502
Source: U.S. Census Bureau Quick Facts

12 FACT BOOK 2016-2017
STUDENT, FACULTY AND STAFF DEMOGRAPHICS
STUDENT DEMOGRAPHICS The following tables are created from the ICCB
E1 reports, these numbers may differ from the
10th Day Report.
FALL CREDIT STUDENT HEADCOUNTS
Table 4. Total Credit Student Headcounts
2013 2014 2015 2016 2017
28,627 29,476 28,678 26,901 26,165
Table 5. Credit Student Headcounts: Full-time and
Part-time Full-time/Part-time
2013 2014 2015 2016 2017
Full-time (>=12 hrs.) 9,908 10,022 9,811 9,004 8,510
Part-time (<12 hrs.) 18,719 19,454 18,867 17,897 17,655
Table 6. Credit Students by Gender
Gender 2013 2014 2015 2016 2017
Female 15,264 15,730 15,258 14,143 13,889
Male 13,363 13,746 13,420 12,758 12,276
Table 7. Credit Students by Age Classification Age Classification
2013 2014 2015 2016 2017
Recent HS Grads (18 and under)
5,280 5,923 6,473 5,914 5,516
Young Adults (19-24)
12,753 12,973 12,651 12,211 11,784
Adults (25-54) 9,627 9,506 8,622 7,969 7,937
Older Adults (55 and over)
958 1,040 914 791 910
Unknown 9 34 18 16 18
Table 8. Credit Students by Residency
Residency 2013 2014 2015 2016 2017
In-district 24,294 24,576 23,806 22,205 21,730
Out of district 3,891 4,465 4,412 4,230 3,989
Out of state 86 92 102 99 97
Out of Country 356 343 358 367 349
Table 9. Credit Students by Ethnicity
Ethnicity 2013 2014 2015 2016 2017
Asian 2,880 3,106 2,972 3,090 3,019
American Indian 264 242 211 220 185
Black 2,383 2,373 2,225 2,083 2,023
Hispanic or Latino 5,616 6,315 6,225 6,172 6,444
White 16,075 16,126 15,457 14,321 13,579
Nonresident Alien 356 343 358 367 348
Pacific Islander 166 182 150 170 158
Ethnicity/Race Unknown
887 789 1,080 478 409
Table 10. Credit Students by Educational Goal Educational Goals
2013 2014 2015 2016 2017
Transfer 14,007 14,222 14,047 13,437 12,958
Improve skills present job
1,975 1,661 1,470 1,250 1,147
Prep for future job 3,328 3,895 4,057 4,017 4,037
GED-ESL 809 721 532 411 412
Personal Interest 2,221 1,898 1,538 1,332 1,253
Unknown 6,287 7,079 7,034 6,454 6,358
Table 11. Credit Students by Status
Status 2013 2014 2015 2016 2017
Transfer 14,007 14,222 14,047 13,437 12,958
Improve skills present job
1,975 1,661 1,470 1,250 1,147
Prep for future job 3,328 3,895 4,057 4,017 4,037
GED-ESL 809 721 532 411 412
Personal Interest 2,221 1,898 1,538 1,332 1,253
Unknown 6,287 7,079 7,034 6,454 6,358
Table 12. Credit Students by Highest Degree Highest Degree
2013 2014 2015 2016 2017
Full-time (>=12 hrs.)
Doctoral degree
0 1 3 2 3
Master’s degree
37 23 28 27 13
Professional degree
4 3 3 8 4
Bachelor’s degree
166 168 149 161 166

OFFICE OF PLANNING AND INSTITUTIONAL EFFECTIVENESS 13
Highest Degree
2013 2014 2015 2016 2017
Associate’s degree
102 95 82 75 85
Certificate 84 73 67 60 58
Some college 1,663 1,605 1,553 1,510 1,354
GED or equivalent
271 271 218 190 191
High School diploma
6,780 6,857 6,789 6,210 6,025
Other 12 10 13 9 4
None 287 262 240 194 171
Unknown 502 654 666 558 436
Part-time (<12 hrs.)
Doctoral degree
48 53 52 50 45
Master's degree
380 443 388 396 390
Professional degree
39 41 38 33 32
Bachelor's degree
1,510 1,451 1,345 1,272 1,226
Associate's degree
543 518 453 383 410
Certificate 310 278 261 205 188
Some college 3,019 3,096 2,930 2,748 2,586
GED or equivalent
486 466 408 361 345
High School diploma
7,289 7,215 7,162 7,071 7,130
Other 24 26 33 29 36
None 894 844 704 611 555
Unknown 4,177 5,023 5,093 4,738 4,712
Table 13. Gender by Full and Part-time Status
Gender 2013 2014 2015 2016 2017
Full-time (>=12 hrs.)
Female 4,703 4,775 4,786 4,332 4,047
Male 5,205 5,247 5,025 4,672 4,463
Part-time (<12 hrs.)
Female 10,561 10,955 10,472 9,811 9,842
Male 8,158 8,499 8,395 8,086 7,813
Table 14. Age Classification by Full and Part-time Status
Age Classification
2013 2014 2015 2016 2017
Full-time (>=12 hrs.)
Recent HS Grads (18 and under)
2,718 2,790 2,881 2,516 2,426
Young Adults (19-
24) 5,671 5,772 5,600 5,312 5,015
Adults (25-54) 1,463 1,427 1,309 1,152 1,045
Older Adults (55 and over)
56 33 20 21 23
Unknown 1 3 1
Age Classification
2013 2014 2015 2016 2017
Part-time (<12 hrs.)
Recent HS Grads (18 and under)
2,562 3,133 3,592 3,398 3,090
Young Adults (19-24)
7,082 7,201 7,051 6,899 6,769
Adults (25-54) 8,164 8,079 7,313 6,817 6,892
Older Adults (55 and over)
902 1,007 894 770 887
Unknown 9 34 17 13 17
Table 15. Enrollment Status by Full and Part-time Status
Status 2013 2014 2015 2016 2017
New to College 4,439 4,327 4,344 3,912 4,372
Transfer In 1,531 1,456 1,336 1,217 746
Continuing Education Student
14,206 14,349 13,987 13,449 13,509
Returning Student
2,974 3,091 2,835 2,498 2,551
Other 5,477 6,253 6,176 5,825 4,987
Table 16. Previous Education by Full- and Part-time Status
Previous Education
2013 2014 2015 2016 2017
Full-time (>=12 hrs.)
Doctoral degree 1 3 2 3
Master's degree 37 23 28 27 13
Professional degree 4 3 3 8 4
Bachelor's degree 166 168 149 161 166
Associate's degree 102 95 82 75 85
Certificate 84 73 67 60 58
Some college 1,663 1,605 1,553 1,510 1,354
GED or equivalent 271 271 218 190 191
High School diploma 6,780 6,857 6,789 6,210 6,025
Other 12 10 13 9 4
None 287 262 240 194 171
Unknown 502 654 666 558 436
Part-time (<12 hrs.)
Doctoral degree 48 53 52 50 45
Master's degree 380 443 388 396 390
Professional degree 39 41 38 33 32
Bachelor's degree 1,510 1,451 1,345 1,272 1,226
Associate's degree 543 518 453 383 410
Certificate 310 278 261 205 188
Some college 3,019 3,096 2,930 2,748 2,586
GED or equivalent 486 466 408 361 345
High School diploma 7,289 7,215 7,162 7,071 7,130
Other 24 26 33 29 36
None 894 844 704 611 555
Unknown 4,177 5,023 5,093 4,738 4,712

14 FACT BOOK 2016-2017
Table 17. Ethnicity by Gender
Ethnicity 2013 2014 2015 2016 2017
Female
Asian 1,488 1,639 1,539 1,588 1,576
American Indian or Alaska Native
136 131 115 122 98
Black or African American
1,344 1,289 1,248 1,176 1,136
Hispanic or Latino 3,158 3,598 3,580 3,452 3,734
White 8,380 8,348 7,914 7,254 6,835
Nonresident Alien 223 209 225 220 205
Native Hawaiian or Other Pacific Islander
78 92 76 78 72
Ethnicity/Race Unknown
457 424 561 253 233
Male
Asian 1,392 1,467 1,433 1,502 1,443
American Indian or Alaska Native
128 111 96 98 87
Black or African American
1,039 1,084 977 907 887
Hispanic or Latino 2,458 2,717 2,645 2,720 2,710
White 7,695 7,778 7,543 7,067 6,744
Nonresident Alien 133 134 133 147 143
Native Hawaiian or Other Pacific Islander
88 90 74 92 86
Ethnicity/Race Unknown
430 365 519 225 176
Table 18. Residency by Gender
Residency 2013 2014 2015 2016 2017
Female
In-district 12,876 13,075 12,608 11,600 11,461
Out of district 2,108 2,393 2,376 2,276 2,169
Out of state 57 53 49 47 53
Out of Country 223 209 225 220 206
Male
In-district 11,418 11,501 11,198 10,605 10,269
Out of district 1,783 2,072 2,036 1,954 1,820
Out of state 29 39 53 52 44
Out of Country 133 134 133 147 143
Table 19. Educational Goals by Residency
Residency 2013 2014 2015 2016 2017
In-district
Transfer 8,442 8,526 8,340 7,823 7,538
Improve skills present job
766 566 464 365 317
Prep for future job 1,441 1,686 1,805 1,769 1,739
285 254 186 138 136
Personal Interest 884 690 544 453 404
Unknown 2,264 2,393 2,229 2,000 2,025
Total 14,081 14,115 13,567 12,547 12,159
Out of district
Transfer 1,172 1,310 1,346 1,296 1,221
Improve skills present job
201 199 179 135 133
Prep for future job 397 487 500 472 492
GED-ESL 25 31 19 15 11
Personal Interest 105 85 73 61 66
Unknown 322 367 341 320 283
Total 2,222 2,480 2,458 2,299 2,204
Out of state
Transfer 20 20 22 17 17
Improve skills present job
3 3 6 5 7
Prep for future job 9 12 9 10 9
GED-ESL 0 0 0 0 0
Personal Interest 2 3 4 3 3
Unknown 6 4 9 9 5
Total 39 42 50 45 42
Out of Country
Transfer 75 76 102 119 107
Improve skills present job
26 13 12 13 25
Prep for future job 12 37 29 47 34
GED-ESL 3 2 1 1 2
Personal Interest 6 11 13 8 11
Unknown 100 82 78 54 50
Total 223 221 235 242 228

OFFICE OF PLANNING AND INSTITUTIONAL EFFECTIVENESS 15
FALL CREDIT FULL-TIME EQUIVALENT STUDENTS FTES (Full-time Equivalent Students) are
computed by taking all of the credit hours for
a particular measure and then dividing the
total by 15.
Table 20. Total Full Time Equivalent Students (FTES)
Total FTES 2013 2014 2015 2016 2017
FTES (Full-time Equivalent Student)
16,565 16,858 16,310 15,133 14,633
Table 21. FTES by Full-time and Part-time Full-time/ Part-time
2013 2014 2015 2016 2017
Full-time (>=12 hrs.) 9,060 9,201 8,992 8,224 7,760
Part-time (<12 hrs.) 7,505 7,657 7,318 6,909 6,873
Table 22. FTES by Gender
Gender 2013 2014 2015 2016 2017
Female 8,489 8,616 8,385 7,723 7,479
Male 8,076 8,242 7,925 7,410 7,155
Table 23. FTES by Age Classification Age Classification
2013 2014 2015 2016 2017
Recent HS Grads (18 and under)
3,466 3,533 3,673 3,307 3,183
Young Adults (19-24)
8,410 8,624 8,407 8,037 7,683
Adults (25-54) 4,395 4,391 3,968 3,572 3,513
Older Adults (55 and over)
292 303 258 212 251
Unknown 2 6 4 5 5
Table 24. FTES by Residency
Residency 2013 2014 2015 2016 2017
In-district 14,081 14,115 13,567 12,547 12,159
Out of district 2,222 2,480 2,458 2,299 2,204
Out of state 39 42 50 45 42
Out of Country 223 221 235 242 228
Table 25. FTES by Ethnicity
Ethnicity 2013 2014 2015 2016 2017
Asian 1,669 1,852 1,780 1,801 1,775
American Indian or Alaska Native
174 159 137 135 111
Black or African American
1,489 1,442 1,336 1,240 1,166
Hispanic or Latino
3,051 3,421 3,441 3,395 3,520
White 9,376 9,232 8,847 7,998 7,566
Nonresident Alien
223 221 235 242 227
Ethnicity 2013 2014 2015 2016 2017
Native Hawaiian or Other Pacific Islander
114 115 95 105 99
Ethnicity/Race Unknown
468 417 440 216 169
Table 26. FTES by Educational Goal
Goal 2013 2014 2015 2016 2017
Transfer 9,708 9,932 9,810 9,255 8,883
Improve skills present job
995 780 661 518 482
Prep for future job
1,859 2,223 2,342 2,299 2,274
GED-ESL 314 288 206 155 149
Personal Interest 996 790 634 524 483
Unknown 2,692 2,845 2,658 2,383 2,363
Table 27. FTES by Enrollment Status
Status 2013 2014 2015 2016 2017
New to College 3,391 3,346 3,371 2,977 3,080
Transfer In 972 936 852 794 496
Continuing Student
8,680 8,902 8,658 8,241 8,142
Returning Student
1,381 1,433 1,318 1,140 1,177
Other 2,140 2,241 2,111 1,981 1,739
Table 28. FTES by Previous Education Previous Education
2013 2014 2015 2016 2017
Doctoral degree 11 13 15 12 12
Master's degree 132 139 130 123 113
Professional degree
13 13 13 17 12
Bachelor's degree
664 642 598 574 565
Associate's degree
285 279 238 203 225
Certificate 201 178 164 137 124
Some college 2,786 2,771 2,662 2,522 2,311
GED or equivalent
456 452 370 325 321
High School diploma
9,520 9,594 9,490 8,897 8,756
Other 22 20 24 19 19
None 611 560 494 411 368
Unknown 1,865 2,198 2,113 1,892 1,807
Table 29. FTES by Location
Location 2013 2014 2015 2016 2017
Glen Ellyn Campus
12,346 12,587 12,204 11,411 10,900
COD Center 1,066 883 834 661 606
Other Site 1,164 1,357 1,254 1,111 1,094
Online 1,989 2,031 2,018 1,950 2,034
16 FACT BOOK 2016-2017
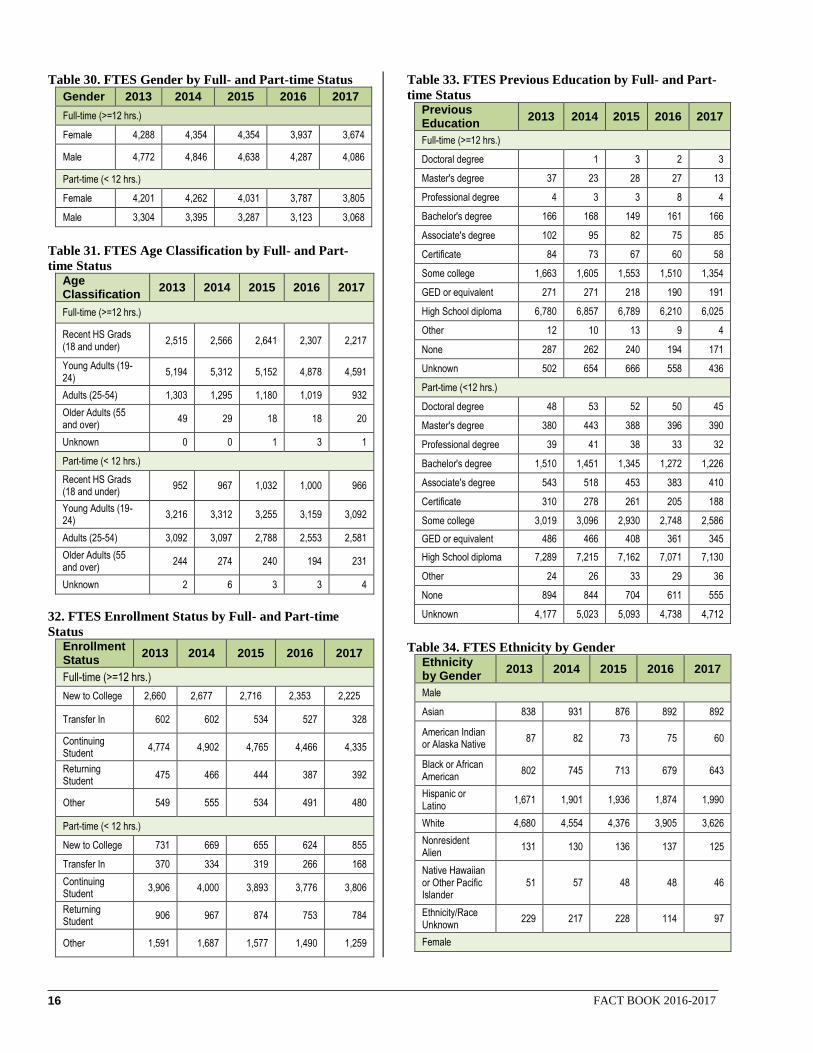
Table 30. FTES Gender by Full- and Part-time Status
Gender 2013 2014 2015 2016 2017
Full-time (>=12 hrs.)
Female 4,288 4,354 4,354 3,937 3,674
Male 4,772 4,846 4,638 4,287 4,086
Part-time (< 12 hrs.)
Female 4,201 4,262 4,031 3,787 3,805
Male 3,304 3,395 3,287 3,123 3,068
Table 31. FTES Age Classification by Full- and Part-
time Status Age Classification
2013 2014 2015 2016 2017
Full-time (>=12 hrs.)
Recent HS Grads (18 and under)
2,515 2,566 2,641 2,307 2,217
Young Adults (19-24)
5,194 5,312 5,152 4,878 4,591
Adults (25-54) 1,303 1,295 1,180 1,019 932
Older Adults (55 and over)
49 29 18 18 20
Unknown 0 0 1 3 1
Part-time (< 12 hrs.)
Recent HS Grads (18 and under)
952 967 1,032 1,000 966
Young Adults (19-24)
3,216 3,312 3,255 3,159 3,092
Adults (25-54) 3,092 3,097 2,788 2,553 2,581
Older Adults (55 and over)
244 274 240 194 231
Unknown 2 6 3 3 4
32. FTES Enrollment Status by Full- and Part-time
Status Enrollment Status
2013 2014 2015 2016 2017
Full-time (>=12 hrs.)
New to College 2,660 2,677 2,716 2,353 2,225
Transfer In 602 602 534 527 328
Continuing Student
4,774 4,902 4,765 4,466 4,335
Returning Student
475 466 444 387 392
Other 549 555 534 491 480
Part-time (< 12 hrs.)
New to College 731 669 655 624 855
Transfer In 370 334 319 266 168
Continuing Student
3,906 4,000 3,893 3,776 3,806
Returning Student
906 967 874 753 784
Other 1,591 1,687 1,577 1,490 1,259
Table 33. FTES Previous Education by Full- and Part-
time Status Previous Education
2013 2014 2015 2016 2017
Full-time (>=12 hrs.)
Doctoral degree 1 3 2 3
Master's degree 37 23 28 27 13
Professional degree 4 3 3 8 4
Bachelor's degree 166 168 149 161 166
Associate's degree 102 95 82 75 85
Certificate 84 73 67 60 58
Some college 1,663 1,605 1,553 1,510 1,354
GED or equivalent 271 271 218 190 191
High School diploma 6,780 6,857 6,789 6,210 6,025
Other 12 10 13 9 4
None 287 262 240 194 171
Unknown 502 654 666 558 436
Part-time (<12 hrs.)
Doctoral degree 48 53 52 50 45
Master's degree 380 443 388 396 390
Professional degree 39 41 38 33 32
Bachelor's degree 1,510 1,451 1,345 1,272 1,226
Associate's degree 543 518 453 383 410
Certificate 310 278 261 205 188
Some college 3,019 3,096 2,930 2,748 2,586
GED or equivalent 486 466 408 361 345
High School diploma 7,289 7,215 7,162 7,071 7,130
Other 24 26 33 29 36
None 894 844 704 611 555
Unknown 4,177 5,023 5,093 4,738 4,712
Table 34. FTES Ethnicity by Gender Ethnicity by Gender
2013 2014 2015 2016 2017
Male
Asian 838 931 876 892 892
American Indian or Alaska Native
87 82 73 75 60
Black or African American
802 745 713 679 643
Hispanic or Latino
1,671 1,901 1,936 1,874 1,990
White 4,680 4,554 4,376 3,905 3,626
Nonresident Alien
131 130 136 137 125
Native Hawaiian or Other Pacific Islander
51 57 48 48 46
Ethnicity/Race Unknown
229 217 228 114 97
Female

OFFICE OF PLANNING AND INSTITUTIONAL EFFECTIVENESS 17
Ethnicity by Gender
2013 2014 2015 2016 2017
Asian 831 921 905 910 883
American Indian or Alaska Native
87 77 63 60 51
Black or African American
688 696 623 562 523
Hispanic or Latino
1,380 1,520 1,505 1,521 1,530
White 4,696 4,678 4,471 4,093 3,940
Nonresident Alien
92 92 100 105 102
Native Hawaiian or Other Pacific Islander
63 58 46 56 53
Ethnicity/Race Unknown
240 200 212 102 73
Table 35. FTES Residency by Gender Residency by Gender
2013 2014 2015 2016 2017
Female
In-district 7,193 7,184 6,948 6,335 6,172
Out of district 1,142 1,280 1,277 1,232 1,158
Out of state 23 22 24 20 23
Out of Country 131 130 136 137 126
Male
In-district 6,888 6,931 6,619 6,212 5,987
Out of district 1,080 1,200 1,180 1,067 1,047
Out of state 16 19 26 25 19
Out of Country 92 92 100 105 102
Table 36. FTES Educational Goal by Residency
Goal 2013 2014 2015 2016 2017
In-district
Doctoral degree
10 12 12 10 10
Master's degree
99 104 89 83 80
Professional degree
12 9 9 11 6
Bachelor's degree
531 483 440 419 397
Associate's degree
220 191 167 141 139
Certificate 160 136 121 103 84
Some college 2,198 2,177 2,084 1,929 1,776
GED or equivalent
388 378 314 268 269
High School diploma
8,303 8,258 8,089 7,573 7,462
Other 19 16 19 12 14
None 564 508 443 370 332
Unknown 1,577 1,843 1,780 1,627 1,591
Out of District
Goal 2013 2014 2015 2016 2017
Doctoral degree
1 1 2 1 2
Master's degree
25 22 29 30 27
Professional degree
1 2 2 3 3
Bachelor's degree
106 132 127 119 138
Associate's degree
63 83 68 57 74
Certificate 36 37 35 27 29
Some college 532 546 524 538 490
GED or equivalent
63 72 50 54 47
High School diploma
1,131 1,231 1,274 1,197 1,176
Other 2 2 3 4 4
None 45 50 48 40 36
Unknown 218 303 295 229 179
Out of State
Doctoral degree
Master's degree
2 1 2 1
Professional degree
1 1 1
Bachelor's degree
4 3 2 2 2
Associate's degree
1 1 3
Certificate 1 1 2 1 4
Some college 16 20 23 20 17
GED or equivalent
3 1 2 1 1
High School diploma
13 13 15 16 12
None 1 1 1 0
Unknown 2 1 3 1 1
Out of Country
Doctoral degree
1 1 1
Master's degree
7 12 12 8 4
Professional degree
1 1 3 4
Bachelor's degree
24 24 29 34 28
Associate's degree
2 5 3 5 9
Certificate 5 4 7 6 7
Some college 41 27 30 36 28
GED or equivalent
2 1 3 2 4
High School diploma
73 92 112 111 106
Other 2 1 3 1
None 2 1 1 0
Unknown 68 52 35 35 36

18 FACT BOOK 2016-2017
DEGREES AND CERTIFICATES AWARDED This section shows the number of degrees and
certificates awarded in the Academic Year (fall,
summer, and spring). Degree numbers are
updated periodically for prior years.
Table 37. Primary Degrees and Certificates Awarded
Degrees and Certificates
AY 20113
AY 2014
AY 2015
AY 2016
AY 2017
Degrees 2,737 2,766 3,396 3,421 3,161
Certificates 3,199 2,690 2,824 2,666 2,539
Total 5,936 5,456 6,220 6,087 5,700
Table 38. Types of Degrees Awarded
Degrees & Certificates
AY 2013
AY 2014
AY 2015
AY 2016
AY 2017
Associate in Applied Science (A.A.S.)
802 879 898 947 944
Associate in Arts (A.A.)
986 989 1,188 1,136 1,119
Associate in Engineering Science (A.F.A)
20 30 44 43 59
Associate in Fine Arts (A.F.A)
12 17 8 14 10
Associate in General Studies (A.G.S.)
601 550 843 896 640
Associate in Science (A.S.)
316 300 410 382 389
Associate of Arts in Teaching (A.A.T.)
1 4 2
Associate of Arts in Teaching-Early Childhood Education (A.A.T.-E.C.)
1 1
Total 2,737 2,766 3,396 3,421 3,161
Occupational Certificate
3,199 2,690 2,824 2,666 2,539
Total 3,199 2,690 2,824 2,666 2,539
Table 39. Associate in Applied Science Degrees and
Certificates Awarded, by Program
Program Name AY
2013 AY
2014 AY
2015 AY
2016 AY
2017
Accounting
Accounting A.A.S 12 24 13 17 19
Accounting Bookkeeping Certificate
13
Accounting Certificate 18 10 9 6 2
Advanced Accounting Certificate
25 40 25 36 22
Clerical Accounting Certificate
19 17 27 31 17
Paraprofessional Accountant Certificate
2
Program Name AY
2013 AY
2014 AY
2015 AY
2016 AY
2017
American Sign Language
American Sign Language Certificate
6
Anthropology
Business Anthropology Certificate
3 1 1
Architecture
Architectural Technology-CADD A.A.S
1 2 1 2
Construction Management A.A.S
6 8 7 8 4
Pre-Architecture Technology A.A.S
7 8 12 7 9
Architectural Technology Certificate
3 2 2
Construction Management Certificate
3 8
Pre-Architecture Certificate 36 11 10 15 18
Automotive Service Technology
Automotive Service Technology A.A.S
24 20 21 19 22
Master Automotive Service Technology A.A.S
1
Automotive Service Technology Certificate
11 26 20 26 24
Master Automotive Service Technology Certificate
1
Computer & Internetworking Technology
Computer & Internetworking Technologies A.A.S
33 33 30 42 26
Information Systems Security 4011 Professional A.A.S
1 8 6 4 5
CCNA Security Certificate 70 60 57 53 54
CompTIA A+ and Network+ PC Technician Certificate
115 59 48 34 35
Computer & Internetworking Technologies Certificate
9 4 8 4 4
Computer Forensics Certificate
4 1 2
Information Systems Security (infosec) 4011 Prof Certificate
3 9 6 7 7
Internetworking Technician Certificate
177 93 74 81 77
Intrusion Prevention Systems Specialist Certificate
89 33 2
Microcomputer Servicing Technician Certificate
10
Network Professional Certificate
3 1
System Support Specialist Certificate
65 35 37 33 23
Voice Over IP Telephony Specialist Certificate
1 1 46
Computer Information Systems
Application & Technical Support Specialist A.A.S
3 5 11 24 35
Application Programmer A.A.S
2
Game Design and Development A.A.S
1 2 2 5 5
Game Programming and Development A.A.S
2 2 1

OFFICE OF PLANNING AND INSTITUTIONAL EFFECTIVENESS 19
Program Name AY
2013 AY
2014 AY
2015 AY
2016 AY
2017
Microcomputer Specialist A.A.S
3
Software Development A.A.S
3 3 2 4 9
Business Productivity Software Certificate
1 1 1
C++ Language Certificate 28 15 31 48 44
Database Proficiency Certificate
6 12 15 8 13
Enterprise Database Proficiency Certificate
6 5 8 6
Game Design & Development Certificate
6 2 8 5 1
Game Programming and Development Certificate
2 2 1 1
iPhone/iPad Developer Proficiency Certificate
5
JAVA Language Certificate 7 2 7 5 23
LINUX Certificate 1 1
Microcomputer Software Certificate
1
Spreadsheet Proficiency Certificate
3 2 1
Visual Basic Language Certificate
3 6
Web Programmer Certificate 1 2 3
Web Technician Certificate 1 4 10 6 10
Cosmetology
Cosmetology A.A.S 8 15 19 21 18
Cosmetology Certificate 75 77 90 72 75
Nail Technology Certificate 4
Criminal Justice
Criminal Justice A.A.S 73 90 87 70 50
Homeland Security A.A.S 1 1 3 1 1
Criminal Justice Certificate 20 15 11 7 2
Emergency Management Certificate
3 9 4 1
Forensic Criminal Investigations Certificate
2 1 2 4 1
Homeland Security Certificate
2 8 2 4 8
Private Security Certificate 2 4 1
Culinary Arts
Baking & Pastry Arts A.A.S 10 22 13 27 19
Culinary Arts A.A.S 21 26 34 31 21
Culinology and Food Science A.A.S
5 2 2
Foodservice Administration A.A.S
1
Baking & Pastry Arts Certificate
4 17 16 25 11
Culinary Arts Certificate 4 12 29 32 25
Foods-Culinary Arts Certificate
4 1
Dental Hygiene
Dental Hygiene A.A.S 27 26 28 27 27
Diagnostic Medical Imaging
Diagnostic Medical Imaging Radiography A.A.S
37 25 34 27 25
Diagnostic Medical Imaging Sonography A.A.S
9 16 15 13 14
Cardiac IV Radiography Specialist Certificate
3 2 1
Program Name AY
2013 AY
2014 AY
2015 AY
2016 AY
2017
Computed Tomography (CT) Certificate
5
Computed Tomography Certificate
8 6 9 7
Diagnostic Medical Imaging Nuclear Medicine Certificate
8 12 6 7 8
Diagnostic Medical Imaging Sonography Certificate
13 3 1 1
Diagnostic Medical Imaging Vascular Sonography Certificate
2 1 1 1
Magnetic Resonance Imaging Advanced Certificate
9
Mammography Certificate 10 14 8 11 9
Radiation Therapy Certificate
8 10 5 6 8
Early Childhood Ed & Care
Early Childhood Administration A.A.S
1
Early Childhood Education & Care A.A.S
18 6 13 8 15
Administration of an Early Childhood Center Certificate
1 6 5 5 5
Early Childhood Assistant Teacher Certificate
182 94 65 67 63
Early Childhood Education and Care Certificate
24 7 13 7 14
Infant, Toddler, 2-Year-Old Child Care Certificate
18 7 6 11 3
Earth Science
Weather Hazards & Preparedness Certificate
4 6 6 3
Education
Teaching Online Utilizing Technology (TOUT) Certificate
7 4 1 2
Electro-Mechanical Technology
Electrician Apprenticeship A.A.S
1
Electro-Mechanical Technology A.A.S
5 9 10 16 7
Advanced Multiskilled Technician Certificate
1 1 4 3
Electrician's Preparation Certificate
3 2 1 1 2
Mechanical Maintenance Certificate
4 2 6 3 7
Mechatronics Technology Certificate
6 6 4
Process Control Instrumentation Certificate
2 1 1
Programmable Controllers Certificate
3 1 4 2 2
Electronics Technology
Biomedical Engineering Technology A.A.S
3 1 2
Electronics Engineering Technology A.A.S
2 2 3 2 1
Integrated Engineering Technology A.A.S
1 1 1 2 2
Digital Logic Devices Programming Certificate
2 1
Electricity & Electronics Technology Certificate
24 11 9 5 3
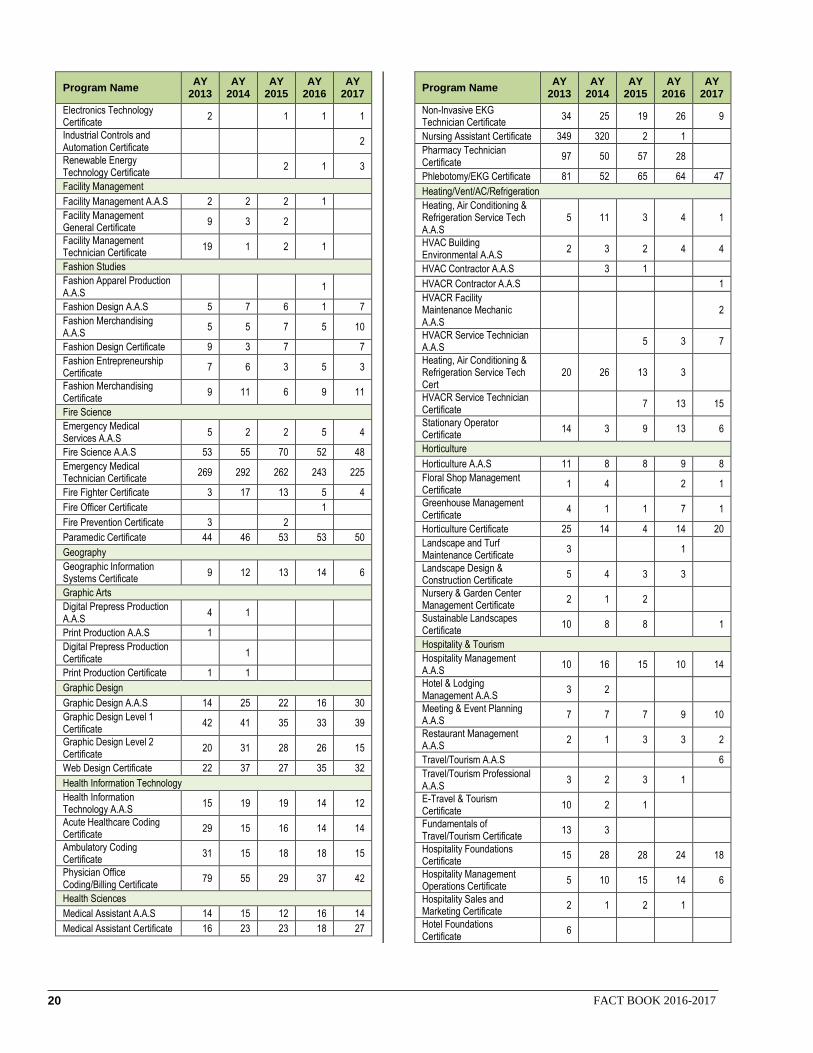
20 FACT BOOK 2016-2017
Program Name AY
2013 AY
2014 AY
2015 AY
2016 AY
2017
Electronics Technology Certificate
2 1 1 1
Industrial Controls and Automation Certificate
2
Renewable Energy Technology Certificate
2 1 3
Facility Management
Facility Management A.A.S 2 2 2 1
Facility Management General Certificate
9 3 2
Facility Management Technician Certificate
19 1 2 1
Fashion Studies
Fashion Apparel Production A.A.S
1
Fashion Design A.A.S 5 7 6 1 7
Fashion Merchandising A.A.S
5 5 7 5 10
Fashion Design Certificate 9 3 7 7
Fashion Entrepreneurship Certificate
7 6 3 5 3
Fashion Merchandising Certificate
9 11 6 9 11
Fire Science
Emergency Medical Services A.A.S
5 2 2 5 4
Fire Science A.A.S 53 55 70 52 48
Emergency Medical Technician Certificate
269 292 262 243 225
Fire Fighter Certificate 3 17 13 5 4
Fire Officer Certificate 1
Fire Prevention Certificate 3 2
Paramedic Certificate 44 46 53 53 50
Geography
Geographic Information Systems Certificate
9 12 13 14 6
Graphic Arts
Digital Prepress Production A.A.S
4 1
Print Production A.A.S 1
Digital Prepress Production Certificate
1
Print Production Certificate 1 1
Graphic Design
Graphic Design A.A.S 14 25 22 16 30
Graphic Design Level 1 Certificate
42 41 35 33 39
Graphic Design Level 2 Certificate
20 31 28 26 15
Web Design Certificate 22 37 27 35 32
Health Information Technology
Health Information Technology A.A.S
15 19 19 14 12
Acute Healthcare Coding Certificate
29 15 16 14 14
Ambulatory Coding Certificate
31 15 18 18 15
Physician Office Coding/Billing Certificate
79 55 29 37 42
Health Sciences
Medical Assistant A.A.S 14 15 12 16 14
Medical Assistant Certificate 16 23 23 18 27
Program Name AY
2013 AY
2014 AY
2015 AY
2016 AY
2017
Non-Invasive EKG Technician Certificate
34 25 19 26 9
Nursing Assistant Certificate 349 320 2 1
Pharmacy Technician Certificate
97 50 57 28
Phlebotomy/EKG Certificate 81 52 65 64 47
Heating/Vent/AC/Refrigeration
Heating, Air Conditioning & Refrigeration Service Tech A.A.S
5 11 3 4 1
HVAC Building Environmental A.A.S
2 3 2 4 4
HVAC Contractor A.A.S 3 1
HVACR Contractor A.A.S 1
HVACR Facility Maintenance Mechanic A.A.S
2
HVACR Service Technician A.A.S
5 3 7
Heating, Air Conditioning & Refrigeration Service Tech Cert
20 26 13 3
HVACR Service Technician Certificate
7 13 15
Stationary Operator Certificate
14 3 9 13 6
Horticulture
Horticulture A.A.S 11 8 8 9 8
Floral Shop Management Certificate
1 4 2 1
Greenhouse Management Certificate
4 1 1 7 1
Horticulture Certificate 25 14 4 14 20
Landscape and Turf Maintenance Certificate
3 1
Landscape Design & Construction Certificate
5 4 3 3
Nursery & Garden Center Management Certificate
2 1 2
Sustainable Landscapes Certificate
10 8 8 1
Hospitality & Tourism
Hospitality Management A.A.S
10 16 15 10 14
Hotel & Lodging Management A.A.S
3 2
Meeting & Event Planning A.A.S
7 7 7 9 10
Restaurant Management A.A.S
2 1 3 3 2
Travel/Tourism A.A.S 6
Travel/Tourism Professional A.A.S
3 2 3 1
E-Travel & Tourism Certificate
10 2 1
Fundamentals of Travel/Tourism Certificate
13 3
Hospitality Foundations Certificate
15 28 28 24 18
Hospitality Management Operations Certificate
5 10 15 14 6
Hospitality Sales and Marketing Certificate
2 1 2 1
Hotel Foundations Certificate
6

OFFICE OF PLANNING AND INSTITUTIONAL EFFECTIVENESS 21
Program Name AY
2013 AY
2014 AY
2015 AY
2016 AY
2017
Hotel Operations Certificate 1
Meeting & Event Planning Certificate
6 7 2 7 11
Resort Management Certificate
2 4 4 2 1
Restaurant Management Certificate
4 3 1
Tour Escort Certificate 5 3 1
Travel and Tourism Foundations Certificate
5 8 5
Travel Geography Specialist Certificate
5 1 2
Travel/Tourism Professional Certificate
5 2 1 1 6
Wine Appreciation & Knowledge Certificate
3 15 1 11 3
Human Services
Addictions Counseling A.A.S
10 5 5 16 12
Applied Gerontology A.A.S 1
Developmental Disability A.A.S
1
Domestic Violence Counseling A.A.S
2
Human Services A.A.S 2 3 3 6 16
Human Services/Residential Child Care A.A.S
2
Addictions Counseling Certificate
9 11 8 9 5
Applied Gerontology Certificate
1
Corrections Counseling Certificate
1
Developmental Disabilities Certificate
1
Domestic/Family Violence Counseling Certificate
1 1 3 4
Human Services Generalist Certificate
3 1 2 5
Mental Health First Aid Certificate
12 6
Psychiatric Rehabilitation Certificate
2 2 3 2
Veterans Counseling Certificate
2 7 7 2
Interior Design A.A.S 10 6 11 13 7
Interior Design Computer Applications Certificate
14 5 9 3 1
Kitchen & Bath Design Certificate
3 1 4 2 1
Library & Information Tech
Library & Information Technology A.A.S
4 5 4 9 10
Long-Term Care Administration
Long Term Care Administration Certificate
27 31 33 29 34
Management A.A.S 19 41 52 77 71
Business Environment & Concepts Certificate
8 15 11 13 11
E-Commerce Certificate 2
Entrepreneurship Certificate 31 18 9 5 11
Management Certificate 58 69 95 94 88
Organizational Leadership Certificate
77 82 107 105 88
Program Name AY
2013 AY
2014 AY
2015 AY
2016 AY
2017
Supervision Certificate 118 106 110 132 109
Automated Manuf. Systems A.A.S
2 3 3 4 7
Manufacturing Engineering Technology A.A.S
2 5 1 1
Manufacturing Technology
Manufacturing Technology A.A.S
2 5 7 8 4
Manufacturing Technology Drafting/Design A.A.S
2 1 2 3 2
Automated Manufacturing Systems Certificate
2 2 1 1
CNC Operations Certificate 4 6
Computer-Aided Design Certificate
2 1 4 7 6
Manufacturing Drafting/Design Certificate
1 3
Manufacturing Skills Standards-MSSC Certificate
13 16 14 11 18
Manufacturing Technology Certificate
7 10 11 12 9
Marketing
Marketing A.A.S 6 13 11 11
Consumer Marketing Certificate
51 47 49 41 14
Marketing Certificate 4 11 15 18 16
Motion Picture/Television
Animation A.A.S 4 9 6 6 8
Motion Picture Television Film/Video Production A.A.S
5 7 10 7 18
Motion Picture Television Production A.A.S
2 2 3
Animation Certificate 3 8 1 4 9
Motion Picture/Television Certificate
1 2 2 2
Music
Audio Production Certificate 1 4
Nursing
Nursing A.A.S 120 120 84 135 112
Basic Nursing Assistant Training Certificate
305 309 355
Practical Nursing Certificate 207 129 106
Practical Nursing for Military Medical Corpsman Certificate
6
Practical Nursing Program Certificate
36 37
Office Technology Information
Administrative Assistant & Meeting/Event Planning A.A.S
1 2 1
Administrative Assistant A.A.S
9 11 3 4
Administrative Support Specialist A.A.S
1 1
Executive Assistant A.A.S 5 3 2 2 3
Administrative Assistant & Meeting/Event Planning Cert.
2 1 1 1
Administrative Assistant Certificate
21 15 7
Administrative Support Essentials Certificate
3 11 9

22 FACT BOOK 2016-2017
Program Name AY
2013 AY
2014 AY
2015 AY
2016 AY
2017
Administrative Support Specialist Certificate
2 1
Executive Assistant Certificate
6 5 2
Medical Office Certificate 6 3 3 2
Office Technology Information Essentials Certificate
28 22 6 4
Office Technology Specialist Certificate
12 6 11
Word Specialist Certificate 52 25 39 18 25
Paralegal Studies
Paralegal Studies A.A.S 20 15 13 11 12
Paralegal Studies Certificate 53 48 51 39 23
Photography
Photography Technology A.A.S
13 9 15 9 11
Photography Technology Certificate
13 12 20 8 14
Physical Education
Fitness Instructor Certificate 3 1 1 6
Physical Therapist Assistant
22
24
22
23
24
Polysomnography
Polysomnography Certificate
5
Real Estate
Real Estate A.A.S 1
Respiratory Care
Respiratory Care Advanced Practitioner A.A.S
40 37 37 33 31
Polysomnography Certificate
6 6 6
Speech Language Pathology Assistant
Speech-Language Pathology Assistant A.A.S
21 20 18 15 17
Hearing Instrument Dispensary Program Certificate
5
Surgical Technology
Anesthesia Technology A.A.S
3 11
Surgical Technology A.A.S 15 9 18 12 22
Central Processing Distribution Technician Certificate
21 36 42 60 48
Perioperative Nursing Certificate
9 1
Surgical Assistant Certificate
3 2
Surgical Technology Certificate
11 24 25 21 25
Welding Technology
Welding Technology A.A.S 1 6
Aws Sense 1 Certificate 1 10
Welding Certificate 4 11 28 28 25

OFFICE OF PLANNING AND INSTITUTIONAL EFFECTIVENESS 23
FISCAL YEAR NON-CREDIT ENROLLMENTS Non-credit courses are delivered all year long.
Therefore the following charts are for the fiscal
year (July 1 – June 30). (Source N1)
Table 40. Non-credit Enrollment by Age (Headcount) Age Classification
FY 2013
FY 2014
FY 2015
FY 2016
FY 2017
13 and Under 1,281 583 578 623 575
14 thru 18 (incl. recent HS grads)
1,351 1,265 1,119 987 1,086
Young Adults (19-24)
353 428 410 650 664
Adults (25-54) 2,840 3,163 2,890 3,493 3,444
Older Adults (55 and over)
1,564 1,609 2,366 2,527 2,828
Unknown 3 4 68 62 77
Total 7,392 7,052 7,431 8,342 8,674
Table 41. Non-credit Enrollment by Age (Seats) Age Classification
FY 2013
FY 2014
FY 2015
FY 2016
FY 2017
13 and Under 2,893 1,222 1,209 1,344 1,320
14 thru 18 (incl. recent HS grads)
1,908 1,697 1,530 1,415 1,480
Young Adults (19-24) 400 515 473 1,401 1,572
Adults (25-54) 3,372 3,786 3,474 5,129 5,704
Older Adults (55 and over)
2,028 2,105 3,239 4,160 5,711
Unknown 3 4 68 83 100
Total 10,604 9,329 9,993 13,532 15,887
Table 42. Non-credit Enrollment by Activity
(Headcount)
Activity FY
2013 FY
2014 FY
2015 FY
2016 FY
2017
Business/Industry Contract
1,769 2,186 2,843 3,059 2,987
Professional/Vocational Development
1,636 1,877 1,441 1,509 1,733
Personal/Social Development
1,437 1,214 1,523 2,294 2,441
Youth Program 2,550 1,775 1,624 1,480 1,513
Total 7,392 7,052 7,431 8,342 8,674
Table 43. Non-credit Enrollment by Activity (Seats)
Activity FY
2013 FY
2014 FY
2015 FY
2016 FY
2017 Business/Industry Contract 1,948 2,415 3,077 4,979 5,514
Professional/Vocational Development 1,955 2,348 1,873 2,058 2,394
Personal/Social Development 2,023 1,755 2,413 3,925 5,369
Youth Program 4,678 2,811 2,630 2,570 2,610
Total 10,604 9,329 9,993 13,532 15,887

24 FACT BOOK 2016-2017
FACULTY/STAFF DEMOGRAPHICS The following tables are compiled from the
ICCB C1 reports. Student employees are not
included.
Employee groups are broken out:
Highest Degree
Ethnicity
Full- and Part-time statuses
Gender
Table 44 Employee Groups Employee Group
FY 2014
FY 2015
FY 2016
FY 2017
FY 2018
Teaching Faculty 1,480 1,502 1,483 1,438 1,391
Academic Support (Library, Counseling & Advising)
20 20 19 18 22
Administrative 44 46 44 44 38
Professional/ Technical
360 394 405 407 416
Clerical 265 278 296 294 307
Custodial/ Maintenance
120 135 115 115 114
Total 2,289 2,375 2,362 2,316 2,288
Table 45. Highest Degree by Employee Group Highest Degree
FY 2014
FY 2015
FY 2016
FY 2017
FY 2018
Teaching Faculty
Associate 54 56 53 54 46
Bachelors 214 233 220 207 200
Masters 882 875 875 837 829
First Professional
41 43 41 34 32
Doctoral 231 244 244 256 238
Other 58 51 50 50 46
Total 1,480 1,502 1,483 1,438 1,391
Academic Support (Library, Counseling & Advising)
Masters 16 16 15 15 18
Doctoral 4 4 4 3 4
Total 20 20 19 18 22
Administrative
Bachelors 3 5 4 4 4
Masters 29 27 26 26 19
Doctoral 9 11 11 9 9
Other 3 3 3 5 6
Total 44 46 44 44 38
Professional/ Technical
Highest Degree
FY 2014
FY 2015
FY 2016
FY 2017
FY 2018
Associate 64 66 70 76 74
Bachelors 99 123 128 132 133
Masters 56 65 69 72 82
First Professional
1 1 1 1 2
Doctoral 2 2 2 2
Other 138 137 135 124 125
Total 360 394 405 407 416
Clerical
Associate 58 55 54 60 63
Bachelors 43 51 67 71 85
Masters 7 12 16 14 21
Other 157 160 159 149 138
Total 265 278 296 294 307
Custodial/ Maintenance
Associate 10 12 10 13 14
Bachelors 7 6 4 3 4
Masters 3 4 2 2 2
Other 100 113 99 97 94
Total 120 135 115 115 114
Total
Associate 186 189 187 203 197
Bachelors 366 418 423 417 426
Masters 993 999 1,003 966 971
First Professional
42 44 42 35 34
Doctoral 246 261 261 270 251
Other 456 464 446 425 409
Total 2,289 2,375 2,362 2,316 2,288
Table 46. Ethnicity by Employee Group
Ethnicity FY
2014 FY
2015 FY
2016 FY
2017 FY
2018
Teaching Faculty
Asian or Asian American
120 119 128 114 113
American Indian or Alaska Native
5 4 4 5 5
Black or African American
47 65 70 65 61
Hispanic or Latino 40 41 48 46 44
White 1249 1252 1216 1187 1150
Native Hawaiian or Other Pacific Islander
19 20 15 20 17
Unknown 1 2 1 1
Total 1480 1502 1483 1438 1391
Academic Support (Library, Counseling & Advising)

OFFICE OF PLANNING AND INSTITUTIONAL EFFECTIVENESS 25
Ethnicity FY
2014 FY
2015 FY
2016 FY
2017 FY
2018
Asian or Asian American
1 1 1 1 1
Black or African American
5 5 5 4 4
Hispanic or Latino 1
White 14 14 13 13 16
Total 20 20 19 18 22
Administrative
Asian or Asian American
2 2 2 2 1
Black or African American
1 2 2 3 4
Hispanic or Latino 1 1 1 1
White 40 40 38 37 32
Native Hawaiian or Other Pacific Islander
1 1 1 1
Total 44 46 44 44 38
Professional/Technical
Asian or Asian American
18 19 20 22 24
American Indian or Alaska Native
2 2 2 2 2
Black or African American
14 15 19 24 22
Hispanic or Latino 16 19 24 27 27
White 309 339 338 329 336
Native Hawaiian or Other Pacific Islander
1 1
Unknown 2 3 4
Total 360 394 405 407 416
Clerical
Asian or Asian American
16 18 16 14 16
American Indian or Alaska Native
1 1 1
Black or African American
12 14 14 14 18
Hispanic or Latino 12 20 26 27 26
White 223 222 235 234 240
Native Hawaiian or Other Pacific Islander
1 1 1 2 2
Unknown 2 3 3 5
Total 265 278 296 294 307
Custodial/Maintenance
Asian or Asian American
5 6 5 4 3
American Indian or Alaska Native
1 1
Black or African American
6 5 5 5 5
Hispanic or Latino 35 37 31 30 27
White 71 84 71 71 73
Ethnicity FY
2014 FY
2015 FY
2016 FY
2017 FY
2018
Native Hawaiian or Other Pacific Islander
2 1 1 1 1
Unknown 1 2 2 3 4
Total 120 135 115 115 114
Total
Asian or Asian American
162 165 172 157 158
American Indian or Alaska Native
8 7 7 8 8
Black or African American
85 106 115 115 114
Hispanic or Latino 103 118 130 131 126
White 1,906 1,951 1,911 1,871 1,847
Native Hawaiian or Other Pacific Islander
24 23 18 24 21
Unknown 1 5 9 10 14
Total 2,289 2,375 2,362 2,316 2,288
Table 47. Full- and Part-time by Employee Group Employee Group
FY 2014
FY 2015
FY 2016
FY 2017
FY 2018
Teaching Faculty
Full-time 262 281 284 285 280
Part-time 1,218 1,221 1,199 1,153 1,111
Total 1,480 1,502 1,483 1,438 1,391
Academic Support (Library, Counseling & Advising)
Full-time 20 20 19 18 22
Total 20 20 19 18 22
Administrative
Full-time 44 46 44 44 38
Total 44 46 44 44 38
Professional/Technical
Full-time 276 301 311 328 339
Part-time 84 93 94 79 77
Total 360 394 405 407 416
Clerical
Full-time 135 138 145 147 153
Part-time 130 140 151 147 154
Total 265 278 296 294 307
Custodial/Maintenance
Full-time 101 110 104 103 102
Part-time 19 25 11 12 12
Total 120 135 115 115 114
Total
Full-time 838 896 907 925 934
Part-time 1451 1479 1455 1391 1354
Total 2289 2375 2362 2316 2288

26 FACT BOOK 2016-2017
Table 48. Gender by Employee Group
Gender FY
2014 FY
2015 FY
2016 FY
2017 FY
2018
Teaching Faculty
Male 657 662 657 639 615
Female 823 840 826 799 776
Total 1480 1502 1483 1438 1391
Academic Support (Library, Counseling & Advising)
Male 8 8 7 7 8
Female 12 12 12 11 14
Total 20 20 19 18 22
Administrative
Male 21 26 25 21 17
Female 23 20 19 23 21
Total 44 46 44 44 38
Professional/Technical
Male 153 174 180 178 187
Female 207 220 225 229 229
Total 360 394 405 407 416
Clerical
Male 30 34 39 36 36
Female 235 244 257 258 271
Total 265 278 296 294 307
Custodial/Maintenance
Male 86 92 77 77 77
Female 34 43 38 38 37
Total 120 135 115 115 114
Total
Male 955 996 985 958 940
Female 1334 1379 1377 1358 1348
Total 2289 2375 2362 2316 2288


Office of Planning and Institutional Effectiveness
College of DuPage425 Fawell Blvd.Glen Ellyn, IL 60137
www.cod.edu (630) 942-2800