fact sheet - ohio · fact sheet for npdes permit renewal, euclid wwtp, 2015 page 3 of 41 in part ii...
TRANSCRIPT

Fact Sheet for NPDES Permit Renewal, Euclid WWTP, 2015
Page 1 of 41
National Pollutant Discharge Elimination System (NPDES) Permit Program
FACT SHEET
Regarding an NPDES Permit To Discharge to Waters of the State of Ohio for Euclid Wastewater Treatment Plant (WWTP)
Public Notice No.: 15-11-073 Ohio EPA Permit No.: 3PE00003*KD Public Notice Date: November 30, 2015 Application No.: OH0031062 Comment Period Ends: December 30, 2015 Name and Address of Facility Where Name and Address of Applicant: Discharge Occurs: City of Euclid Euclid WWTP 585 East 222nd Street 22201 Lakeshore Boulevard Euclid, OH 44123 Euclid, OH 44123 Cuyahoga County Receiving Water: Lake Erie Subsequent Stream Network: Not applicable Introduction Development of a Fact Sheet for NPDES permits is mandated by Title 40 of the Code of Federal Regulations (CFR), Section 124.8 and 124.56. This document fulfills the requirements established in those regulations by providing the information necessary to inform the public of actions proposed by the Ohio Environmental Protection Agency (Ohio EPA), as well as the methods by which the public can participate in the process of finalizing those actions. This Fact Sheet is prepared in order to document the technical basis and risk management decisions that are considered in the determination of water quality based NPDES Permit effluent limitations. The technical basis for the Fact Sheet may consist of evaluations of promulgated effluent guidelines, existing effluent quality, instream biological, chemical and physical conditions, and the relative risk of alternative effluent limitations. This Fact Sheet details the discretionary decision-making process empowered to the Director by the Clean Water Act (CWA) and Ohio Water Pollution Control Law (Ohio Revised Code [ORC] 6111). Decisions to award variances to Water Quality Standards (WQS) or promulgated effluent guidelines for economic or technological reasons will also be justified in the Fact Sheet where necessary. No antidegradation review was necessary. Effluent limits based on available treatment technologies are required by Section 301(b) of the CWA. Many of these have already been established by the United States Environmental Protection Agency (U.S. EPA) in the effluent guideline regulations (a.k.a. categorical regulations) for industry categories in 40 CFR Parts 405-499. Technology-based regulations for publicly-owned treatment works are listed in the Secondary Treatment Regulations (40 CFR Part 133). If regulations have not been established for a category of dischargers, the director may establish technology-based limits based on best professional judgment (BPJ). Ohio EPA reviews the need for water-quality-based limits on a pollutant-by-pollutant basis. Wasteload allocations (WLAs) are used to develop these limits based on the pollutants that have been detected in the
Fact Sheet for NPDES Permit Renewal, Euclid WWTP, 2015
Page 2 of 41
discharge, and the receiving water’s assimilative capacity. The assimilative capacity depends on the flow in the water receiving the discharge, and the concentration of the pollutant upstream. The greater the upstream flow, and the lower the upstream concentration, the greater the assimilative capacity is. Assimilative capacity may represent dilution (as in allocations for metals), or it may also incorporate the break-down of pollutants in the receiving water (as in allocations for oxygen-demanding materials). The need for water-quality-based limits is determined by comparing the WLA for a pollutant to a measure of the effluent quality. The measure of effluent quality is called Projected Effluent Quality (PEQ). This is a statistical measure of the average and maximum effluent values for a pollutant. As with any statistical method, the more data that exists for a given pollutant, the more likely that PEQ will match the actual observed data. If there is a small data set for a given pollutant, the highest measured value is multiplied by a statistical factor to obtain a PEQ; for example if only one sample exists, the factor is 6.2, for two samples - 3.8, for three samples - 3.0. The factors continue to decline as samples sizes increase. These factors are intended to account for effluent variability, but if the pollutant concentrations are fairly constant, these factors may make PEQ appear larger than it would be shown to be if more sample results existed. Summary of Permit Conditions The Euclid WWTP is going to undergo major equipment and operation upgrades during the permit cycle. As such, two sets of limits are presented – initial limits that reflect the current plant operation and final limits that reflect the anticipated plant operation. A 54 month schedule of compliance is proposed for the construction and attainment of operational level of the new treatment plant. The initial effluent limits and monitoring requirements proposed for most parameters are the same as in the previous permit, although some monitoring frequencies have changed. New final limits are proposed for 5-day carbonaceous biochemical oxygen (CBOD5) and total suspended solids (TSS) based on the new plant design. The monitoring frequency of CBOD5 will be decreased in accordance with the monitoring requirements in the recently passed Senate Bill 1. New maximum copper concentration and loading limits are being proposed because this parameter has the reasonable potential to exceed WQS. It is anticipated that the facility can meet these limits, so no schedule of compliance is proposed. The average concentration and loading limits for mercury are proposed to be decreased in accordance with the data presented as part of the facility’s mercury variance renewal. In accordance with Ohio Administrative Code (OAC) 3745-33-07, it has been determined that the effluent from Euclid WWTP shows acute toxicity. New acute toxicity limits are being proposed. A 54 month compliance schedule with semi-annual monitoring is proposed in the initial limits table. Sanitary sewer overflow (SSO) station 039 will be added to the permit. This permit no longer authorizes the use of method 4500 CN-I from Standard Methods for free cyanide testing. As soon as possible, the permittee must begin using either ASTM D7237-10 or OIA-1677-09 both of which are approved methods for free cyanide listed in 40 CFR 136. To ensure that data is obtained that allows Ohio EPA to make water quality-related decisions regarding silver, a special condition is proposed in Part II of the permit that provides guidance on the analytical method detection limits (MDLs) the permittee should use in analyzing for this contaminant.

Fact Sheet for NPDES Permit Renewal, Euclid WWTP, 2015
Page 3 of 41
In Part II of the permit, special conditions are included that address SSO reporting; combined sewer overflow (CSO) reporting; operator certification, minimum staffing and operator of record; whole effluent toxicity (WET) testing; storm water compliance; mercury variance; pretreatment program requirements; phosphorus optimization; and outfall signage.
Fact Sheet for NPDES Permit Renewal, Euclid WWTP, 2015
Page 4 of 41
Table of Contents Page Introduction ................................................................................................................................................... 1
Summary of Permit Conditions ..................................................................................................................... 2
Procedures for Participation in the Formulation of Final Determinations .................................................... 6
Information Regarding Certain Water Quality Based Effluent Limits ......................................................... 6
Location of Discharge/Receiving Water Use Classification ......................................................................... 8
Facility Description ....................................................................................................................................... 8
Description of Existing Discharge ................................................................................................................ 9
Assessment of Impact on Receiving Waters ............................................................................................... 10
Development of Water-Quality-Based Effluent Limits .............................................................................. 10
Reasonable Potential/ Effluent Limits/Hazard Management Decisions ..................................................... 12
Other Requirements .................................................................................................................................... 15
List of Figures Figure 1. Location of Euclid Wastewater Treatment Plant ......................................................................... 17
Figure 2. Diagram of Wastewater Treatment System ................................................................................. 18
List of Tables Table 1. Average Annual Effluent Flow Rates ........................................................................................... 19
Table 2. Sanitary Sewer Overflows Discharges .......................................................................................... 19
Table 3. Bypass Discharges ........................................................................................................................ 19
Table 4. Combined Sewer Overflow Discharges from May 1, 2010 through April 30, 2015 .................... 20
Table 5. Effluent Characterization Using Pretreatment Data ...................................................................... 21
Table 6. Effluent Characterization Using Ohio EPA data ........................................................................... 22
Table 7. Effluent Characterization Using Self-Monitoring Data ................................................................ 23
Table 8. Projected Effluent Quality ............................................................................................................. 31
Table 9. Summary of Acute and Chronic Toxicity Results ........................................................................ 32
Table 10. Ohio EPA Toxicity Screening Results for Outfall 001 ............................................................... 32

Fact Sheet for NPDES Permit Renewal, Euclid WWTP, 2015
Page 5 of 41
Table 11. Water Quality Criteria in the Study Area .................................................................................... 33
Table 12. Instream Conditions and Discharger Flow .................................................................................. 34
Table 13. Summary of Effluent Limits to Maintain Applicable Water Quality Criteria ............................ 35
Table 14. Parameter Assessment ................................................................................................................. 36
Table 15. Initial Effluent Limits for Outfall 001 ......................................................................................... 37
Table 16. Final Effluent Limits for Outfall 001 .......................................................................................... 39
List of Attachments
Attachment 1. Mercury Data from Pollutant Minimization Program ......................................................... 41

Fact Sheet for NPDES Permit Renewal, Euclid WWTP, 2015
Page 6 of 41
Procedures for Participation in the Formulation of Final Determinations The draft action shall be issued as a final action unless the Director revises the draft after consideration of the record of a public meeting or written comments, or upon disapproval by the Administrator of the U.S. Environmental Protection Agency. Within thirty days of the date of the Public Notice, any person may request or petition for a public meeting for presentation of evidence, statements or opinions. The purpose of the public meeting is to obtain additional evidence. Statements concerning the issues raised by the party requesting the meeting are invited. Evidence may be presented by the applicant, the state, and other parties, and following presentation of such evidence other interested persons may present testimony of facts or statements of opinion. Requests for public meetings shall be in writing and shall state the action of the Director objected to, the questions to be considered, and the reasons the action is contested. Such requests should be addressed to:
Legal Records Section Ohio Environmental Protection Agency
P.O. Box 1049 Columbus, Ohio 43216-1049
Interested persons are invited to submit written comments upon the discharge permit. Comments should be submitted in person or by mail no later than 30 days after the date of this Public Notice. Deliver or mail all comments to:
Ohio Environmental Protection Agency Attention: Division of Surface Water
Permits Processing Unit P.O. Box 1049
Columbus, Ohio 43216-1049 The Ohio EPA permit number and Public Notice numbers should appear on each page of any submitted comments. All comments received no later than 30 days after the date of the Public Notice will be considered. Citizens may conduct file reviews regarding specific companies or sites. Appointments are necessary to conduct file reviews, because requests to review files have increased dramatically in recent years. The first 250 pages copied are free. For requests to copy more than 250 pages, there is a five-cent charge for each page copied. Payment is required by check or money order, made payable to Treasurer State of Ohio. For additional information about this fact sheet or the draft permit, contact Sara Hise, (614) 644-4824, [email protected]. Information Regarding Certain Water Quality Based Effluent Limits This draft permit may contain proposed water-quality-based effluent limits (WQBELs) for parameters that are not priority pollutants. (See the following link for a list of the priority pollutants: http://epa.ohio.gov/portals/35/pretreatment/Pretreatment_Program_Priority_Pollutant_Detection_Limits.pdf .) In accordance with ORC 6111.03(J)(3), the Director established these WQBELs after considering, to the extent consistent with the Federal Water Pollution Control Act, evidence relating to the technical feasibility and economic reasonableness of removing the polluting properties from those wastes and to evidence relating to conditions calculated to result from that action and their relation to benefits to the people of the state and to accomplishment of the purposes of this chapter. This determination was made based on data and information

Fact Sheet for NPDES Permit Renewal, Euclid WWTP, 2015
Page 7 of 41
available at the time the permit was drafted, which included the contents of the timely submitted NPDES permit renewal application, along with any and all pertinent information available to the Director. This public notice allows the permittee to provide to the Director for consideration during this public comment period additional site-specific pertinent and factual information with respect to the technical feasibility and economic reasonableness for achieving compliance with the proposed final effluent limitations for these parameters. The permittee shall deliver or mail this information to:
Ohio Environmental Protection Agency Attention: Division of Surface Water
Permits Processing Unit P.O. Box 1049
Columbus, Ohio 43216-1049 Should the applicant need additional time to review, obtain or develop site-specific pertinent and factual information with respect to the technical feasibility and economic reasonableness of achieving compliance with these limitations, written notification for any additional time shall be sent to the above address no later than 30 days after the Public Notice Date on Page 1. Should the applicant determine that compliance with the proposed WQBELs for parameters other than the priority pollutants is technically and/or economically unattainable, the permittee may submit an application for a variance to the applicable WQS used to develop the proposed effluent limitation in accordance with the terms and conditions set forth in OAC 3745-33-07(D). The permittee shall submit this application to the above address no later than 30 days after the Public Notice Date. Alternately, the applicant may propose the development of site-specific WQS pursuant to OAC 3745-1-35. The permittee shall submit written notification regarding their intent to develop site specific WQS for parameters that are not priority pollutants to the above address no later than 30 days after the Public Notice Date.

Fact Sheet for NPDES Permit Renewal, Euclid WWTP, 2015
Page 8 of 41
Location of Discharge/Receiving Water Use Classification Euclid WWTP discharges to Lake Erie through two submerged pipes; one is a 48 inch pipe located approximately 1,140 feet offshore and the other is a 60 inch pipe located approximately 1,540 feet offshore. Figure 1 shows the approximate location of the facility. This segment of the Lake Erie is described by Ohio EPA River Code: 24-600, U.S. EPA River Reach Code: 04110003, County: Cuyahoga, Ecoregion: Eastern Great Lakes and Hudson Lowlands. Lake Erie is designated for the following uses under Ohio’s WQS (OAC 3745-1-31): Exceptional Warmwater Habitat, Superior High Quality Water, Agricultural Water Supply, Industrial Water Supply, Bathing Waters, and Public Water Supply. Use designations define the goals and expectations of a waterbody. These goals are set for aquatic life protection, recreation use and water supply use, and are defined in the Ohio WQS (OAC 3745-1-07). The use designations for individual waterbodies are listed in rules -08 through -32 of the Ohio WQS. Once the goals are set, numeric WQS are developed to protect these uses. Different uses have different water quality criteria. Use designations for aquatic life protection include habitats for coldwater fish and macroinvertebrates, warmwater aquatic life and waters with exceptional communities of warmwater organisms. These uses all meet the goals of the federal CWA. Ohio WQS also include aquatic life use designations for waterbodies which cannot meet the CWA goals because of human-caused conditions that cannot be remedied without causing fundamental changes to land use and widespread economic impact. The dredging and clearing of some small streams to support agricultural or urban drainage is the most common of these conditions. These streams are given Modified Warmwater or Limited Resource Water designations. Recreation uses are defined by the depth of the waterbody and the potential for wading or swimming. Uses are defined for bathing waters, swimming/canoeing (Primary Contact Recreation) and wading only (Secondary Contact which are generally waters too shallow for swimming or canoeing). Water supply uses are defined by the actual or potential use of the waterbody. Public Water Supply designations apply near existing water intakes so that waters are safe to drink with standard treatment. Most other waters are designated for agricultural water supply and industrial water supply. Facility Description Euclid WWTP was constructed in 1975 and last upgraded in 1985. Euclid WWTP provides service to the cities of Euclid, Wickliffe, and Willowick, as well as portions of the cities of Richmond Heights, Willoughby Hills, South Euclid, and Cleveland for a total of approximately 95,872 customers. The system is designed to treat a peak flow of 66 MGD and an average flow of 22 MGD. Euclid WWTP has the following treatment processes which are shown on Figure 2:
Bar screening Grit removal Pure oxygen activated sludge Phosphorus removal (alum and polymer addition) Secondary clarification Tertiary filtration (microstrainers) Chlorination/dechlorination
The Euclid WWTP’s peak design flow of 66 MGD is currently not achievable due to hydraulic restrictions in the unit processes. The existing final clarifiers restrict the maximum flow through Euclid WWTP to a peak flow of 28-32 MGD. To prevent washout, wet weather flows in excess of 28 MGD at the headworks are bypassed to

Fact Sheet for NPDES Permit Renewal, Euclid WWTP, 2015
Page 9 of 41
the Wet Weather Auxiliary Treatment Facility (WWATF). Partial treatment is provided by bar screens, three swirl concentrations, and high rate disinfection using sodium hypochlorite. The WWATF was designed for a wet weather flow of 180 MGD. The swirl concentrators separate settleable and floatable solids from the flow. The effluent from the WWATF is discharged at the Lake Erie shoreline via outfall 002. The Euclid WWTP has 93% separate sewers and 7% combined sewers in the collection system. The City of Euclid has an approved pretreatment program. The city has 13 categorical users that discharge 0.6 MGD of flow and 13 significant non-categorical users that discharge 0.6 MGD of flow. Waste activated sludge is transferred to a satellite solids handling facility located on Lakeland Boulevard via an 8-inch force main. Euclid WWTP utilizes the following sewage sludge treatment processes:
Thickening Dewatering (belt filter press)
Treated sludge is disposed of in a municipal landfill. On October 14, 2011, Consent Decree No. 1:11-cv-01783 was lodged in U.S. District Court, Northern District of Ohio to address wet weather issues related to plant bypassing, CSOs, and SSOs. The Consent Decree set forth a long-term schedule that will enable the City of Euclid to comply with the requirements of the NPDES permit, the CWA, and ORC 6111. The decree includes the following specific control measures and/or requirements:
Elimination of all known SSOs by no later than December 31, 2020. Achieve full operation of all measures required by the approved Long-term Control Plan (LTCP) by no
later than December 31, 2026. Per the selected design alternative in the Consent Decree, the pure oxygen biological treatment process at Euclid WWTP will be replaced with a high-rate membrane bioreactor (MBR) process. Euclid WWTP’s hydraulic capacity will be increased to 66 MGD. Peak flows greater than 66 MGD are to be captured in a phased 25 million gallon (MG) equalization (EQ) basin. The 25 MG capacity will be provided in two separate tanks with the first phase sized to accommodate 15 MG and limit overflow activations to four or fewer in a typical year. Based on the performance of similar MBR processes, the new system should be capable of attaining final effluent limits of 10 mg/L CBOD5 and 12 mg/l TSS. Construction of the initial treatment plant improvements have already commenced. This includes permanent decommissioning of the existing microstrainers. The new WWTP is expected to be fully operational by the end of 2019. Given the new plant and other improvements are under construction, the compliance schedule in the draft permit will be for 54 months. This schedule will give the City sufficient time to ensure that the new treatment system will be able to achieve the new permit requirements. Description of Existing Discharge Euclid WWTP estimates there is an infiltration/inflow (I/I) rate to the collection system of 2.89 MGD. The effluent flow rates for Euclid WWTP for the previous five years is presented on Table 1. As part of the Consent Decree, Euclid WWTP will implement a LTCP, a SSO Elimination Plan, a Collection System Management, Operation and Maintenance (CMOM) Program, and implement the approved alternatives in the No Feasible Alternatives (NFA) Analysis.

Fact Sheet for NPDES Permit Renewal, Euclid WWTP, 2015
Page 10 of 41
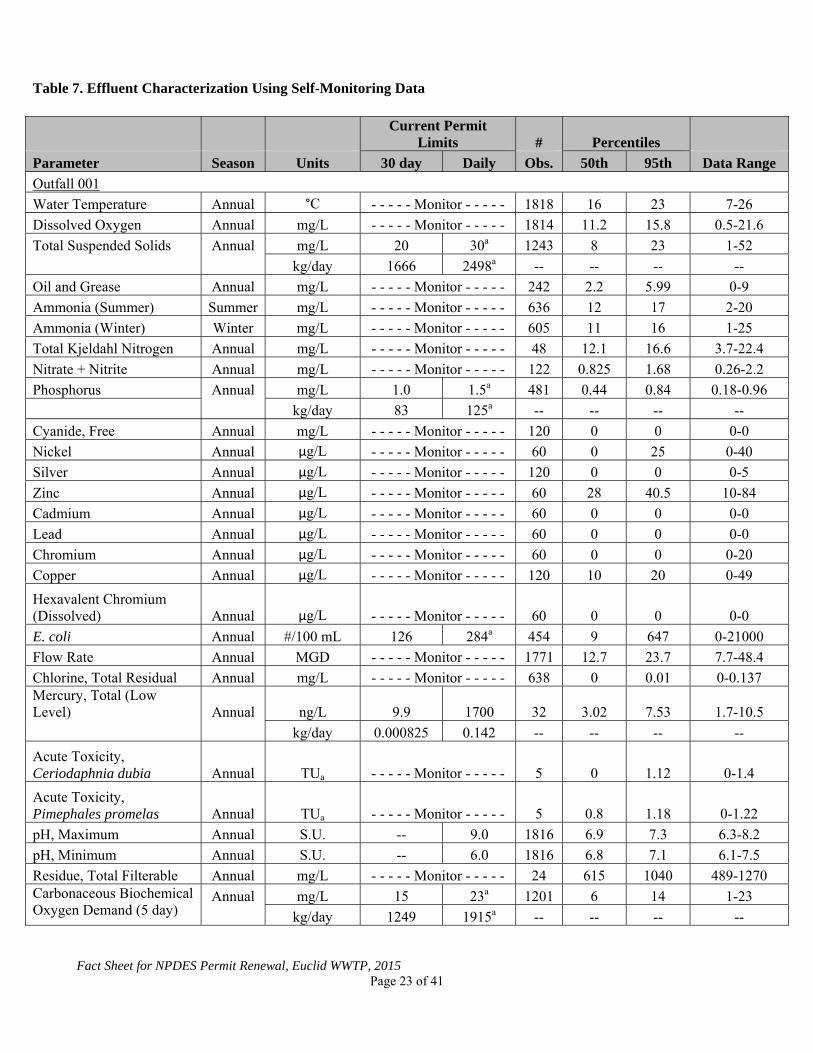
Euclid WWTP reports SSOs at station 300 as well as specifically identified SSOs in the collection system. The number of SSOs and dates recorded is presented on Table 2. Euclid WWTP reports bypasses at station 002. The bypass is used frequently and left open for multiple days. The bypass flows and sampling data are shown on Table 3. Euclid WWTP has 17 identified CSOs. The number of CSOs and overflow volume reported is presented on Table 4. In addition to the WWTP improvements, the LTCP requires the City of Euclid to undertake improvements and other measures necessary to: (i) minimize the number, duration, and volume of wet weather CSO discharges and (ii) ensure that wet weather CSO discharges that do occur comply with the technology and water quality-based requirements of the CWA, state law and regulations, and the NPDES Permit. Under the provisions of 40 CFR 122.21(j), the Director has waived the requirement for submittal of expanded effluent testing data as part of the NPDES renewal application. Ohio EPA has access to substantially identical information through the submission of annual pretreatment program reports and/or from Ohio EPA effluent testing conducted. Table 5 presents chemical specific data compiled from data reported in annual pretreatment reports. Table 6 presents chemical specific data compiled from data collected by Ohio EPA. Table 7 presents a summary of unaltered Discharge Monitoring Report (DMR). Data are presented for the period May 2010 through April 2015, and current permit limits are provided for comparison. Table 8 summarizes the chemical specific data for outfall 001 by presenting the average and maximum PEQ values. Table 9 summarizes the results of acute and chronic WET tests of the final effluent. Table 10 summarizes the screening results of Ohio EPA bioassay sampling of the final effluent. Assessment of Impact on Receiving Waters The City of Euclid-Frontal Lake Erie watershed assessment unit, which includes the Lake Erie in the vicinity of Euclid WWTP, is not listed as impaired on Ohio’s 303(d) list. No recent assessment data is available. Under the Great Lakes Restoration Initiative, sampling at near shore Lake Erie was started in 2011 and is planned to continue. Development of Water-Quality-Based Effluent Limits Determining appropriate effluent concentrations is a multiple-step process in which parameters are identified as likely to be discharged by a facility, evaluated with respect to Ohio water quality criteria, and examined to determine the likelihood that the existing effluent could violate the calculated limits. Parameter Selection Effluent data for the Euclid WWTP were used to determine what parameters should undergo WLA. The parameters discharged are identified by the data available to Ohio EPA DMR data submitted by the permittee, compliance sampling data collected by Ohio EPA, and any other data submitted by the permittee, such as priority pollutant scans required by the NPDES application or by pretreatment, or other special conditions in the NPDES permit. The sources of effluent data used in this evaluation are as follows:

Fact Sheet for NPDES Permit Renewal, Euclid WWTP, 2015
Page 11 of 41
Self-monitoring data (DMR) May 2010 through April 2015 Pretreatment data 2011, 2012 Ohio EPA compliance sampling data 2012
Statistical Outliers and Other Non-representative Data The data were examined and no values were removed from the evaluation. This data is evaluated statistically, and PEQ values are calculated for each pollutant. Average PEQ (PEQavg) values represent the 95th percentile of monthly average data, and maximum PEQ (PEQmax) values represent the 95th percentile of all data points (see Table 8). The PEQ values are used according to Ohio rules to compare to applicable WQS and allowable WLA values for each pollutant evaluated. Initially, PEQ values are compared to the applicable average and maximum WQS. If both PEQ values are less than 25 percent of the applicable WQS, the pollutant does not have the reasonable potential to cause or contribute to exceedances of WQS, and no WLA is done for that parameter. If either PEQavg or PEQmax is greater than 25 percent of the applicable WQS, a WLA is conducted to determine whether the parameter exhibits reasonable potential and needs to have a limit or if monitoring is required (see Table 11). Wasteload Allocation For those parameters that require a WLA, the results are based on the uses assigned to the receiving waterbody in OAC 3745-1. Dischargers are allocated pollutant loadings/concentrations based on the Ohio WQS (OAC 3745-1). Most pollutants are allocated by a mass-balance method because they do not degrade in the receiving water. WLAs for direct discharges to lakes are done using the following equation for average criteria: WLA = (11 x Water Quality Criteria) – (10 x Background Concentration). Allocations for maximum criteria are set equal to the Inside Mixing Zone Maximum (IMZM) values. Allocations are developed using a percentage of stream design flow as specified in Table 12, and allocations cannot exceed the IMZM criteria. Ohio’s WQS implementation rules [OAC 3745-2-05(A)(2)(d)(iv)] required a phase out of mixing zones for bioaccumulative chemicals of concern (BCCs) as of November 15, 2010. This rule applied statewide. Mercury is a BCC. The mixing zone phase-out means that as of November 15, 2010 all dischargers requiring mercury limits in their NPDES permit must meet WQS at the end-of-pipe, which for mercury are 1.3 ng/L (average) and 1700 ng/L (maximum) in the Lake Erie basin. The data used in the WLA are listed in Table 11 and Table 12. The WLA results to maintain all applicable criteria are presented in Table 13. Whole Effluent Toxicity WLA Whole effluent toxicity (WET) is the total toxic effect of an effluent on aquatic life measured directly with a toxicity test. Acute WET measures short term effects of the effluent while chronic WET measures longer term and potentially more subtle effects of the effluent. WQS for WET are expressed in Ohio’s narrative “free from” WQS rule [OAC 3745-1-04(D)]. These “free froms” are translated into toxicity units (TUs) by the associated WQS Implementation Rule (OAC 3745-2-09). WLAs can then be calculated using TUs as if they were water quality criteria. The WLA calculations for WET are similar to those for aquatic life criteria - using the chronic toxicity unit (TUc) and 7Q10 flow for the average and the acute toxicity unit (TUa) and 1Q10 flow for the maximum. These values are the levels of effluent toxicity that should not cause instream toxicity during critical low-flow conditions. For Euclid WWTP, the WLA values are 1.0 TUa and 11.0 TUc.

Fact Sheet for NPDES Permit Renewal, Euclid WWTP, 2015
Page 12 of 41
The chronic toxicity unit (TUc) is defined as 100 divided by the estimate of the effluent concentration which causes a 25% reduction in growth or reproduction of test organisms (IC25):
TUc = 100/IC25 This equation applies outside the mixing zone for warmwater, modified warmwater, exceptional warmwater, coldwater, and seasonal salmonid use designations except when the following equation is more restrictive (Ceriodaphnia dubia only):
TUc = 100/geometric mean of No Observed Effect Concentration and Lowest Observed Effect Concentration The acute toxicity unit (TUa) is defined as 100 divided by the concentration in water having 50% chance of causing death to aquatic life (LC50) for the most sensitive test species:
TUa = 100/LC50 This equation applies outside the mixing zone for warmwater, modified warmwater, exceptional warmwater, coldwater, and seasonal salmonid use designations. Reasonable Potential/ Effluent Limits/Hazard Management Decisions After appropriate effluent limits are calculated, the reasonable potential of the discharger to violate the WQS must be determined. Each parameter is examined and placed in a defined "group". Parameters that do not have a WQS or do not require a WLA based on the initial screening are assigned to either group 1 or 2. For the allocated parameters, the preliminary effluent limits (PEL) based on the most restrictive average and maximum WLAs are selected from Table 13. The average PEL (PELavg) is compared to the average PEQ (PEQavg) from Table 8, and the PELmax is compared to the PEQmax. Based on the calculated percentage of the allocated value [(PEQavg ÷ PELavg) X 100, or (PEQmax ÷ PELmax) X 100)], the parameters are assigned to group 3, 4, or 5. The groupings are listed in Table 14. The final effluent limits are determined by evaluating the groupings in conjunction with other applicable rules and regulations. Table 15 presents the final effluent limits and monitoring requirements proposed for Euclid WWTP outfall 001 and the basis for their recommendation. Unless otherwise indicated, the monitoring frequencies proposed in the permit are continued from the existing permit. Water Temperature, Dissolved Oxygen, Ammonia, and Flow Rate Monitoring for these parameters is proposed to continue in order to evaluate the performance of the treatment plant. The monitoring frequency for ammonia will be decreased slightly. The need for ammonia limits will be re-evaluated when the new treatment processes are in place. Total Suspended Solids and Carbonaceous Biochemical Oxygen Demand (5 day) The initial limits proposed for TSS and CBOD5 are based on the existing plant design criteria. The final limits are based on the expected design performance of the new treatment plant. The monitoring frequency for CBOD5
will be decreased slightly. Phosphorus, Oil & Grease, pH, and E. coli Limits proposed for oil and grease, and Escherichia coli are based on WQS (OAC 3745-1-07). Bathing Water E. coli standards apply to the Lake Erie. Phosphorus is limited based on provisions of OAC 3745-33-06(C). The maximum pH limit is based on WQS. The minimum pH standard is based on plant design criteria.

Fact Sheet for NPDES Permit Renewal, Euclid WWTP, 2015
Page 13 of 41
Copper The Ohio EPA risk assessment (Table 14) places copper in group 5. This placement, as well as the data in Table 5, Table 6, Table 7, and Table 8, indicates that the reasonable potential to exceed WQS exists and limits are necessary to protect water quality. For these parameters, the PEQ is greater than 100 percent of the WLA. Pollutants that meet this requirement must have permit limits under OAC 3745-33-07(A)(1). The daily maximum concentration limit is based on the IMZM. The daily maximum loading limit for is based on the IMZM and the average daily design flow rate. Mercury The Ohio EPA risk assessment (Table 14) places mercury in group 5. This placement, as well as the data in Table 5, Table 6, Table 7, and Table 8, indicates that the reasonable potential to exceed WQS exists and limits are necessary to protect water quality. For these parameters, the PEQ is greater than 100 percent of the WLA. The Euclid WWTP permit was renewed in March 30, 2011 to include a mercury variance, and variance-based limits for mercury. Based on the monitoring results from May 2010 through April 2015, and the new application information (Attachment 1), the Euclid WWTP has determined that the facility will not meet the 30-day average permit limit of 1.3 ng/L. However, the effluent data shows that the permittee can meet the mercury annual average value of 12 ng/L. The permittee’s application has also demonstrated to the satisfaction of Ohio EPA that there is no readily apparent means of complying with the WQBEL without constructing prohibitively expensive end-of-pipe controls for mercury. Based upon these demonstrations, the Euclid WWTP is eligible for the mercury variance under OAC 3745-33-07(D)(10)(a). Euclid WWTP submitted information supporting the renewal of the variance. The permittee surveyed potential mercury contributors to the collection system to reduce the amount of mercury coming being discharged. The calculation of the PEQavg value from 2010 to 2015 compared to the PEQavg calculated at the time the original variance was issued shows a reduction from 22.4 ng/L to 6.01 ng/L. The Pollutant Minimization Program (PMP) schedule developed from the original variance continues to be implemented, and further reductions in mercury may be possible. Ohio EPA has reviewed the mercury variance application and has determined that it meets the requirements of the OAC. A condition in Part II of the NPDES permit lists the provisions of the mercury variance, and includes the following requirements:
A variance-based monthly average effluent limit of 6.0 ng/L, which was developed from sampling data submitted by the permittee;
A requirement that the permittee make reasonable progress to meet the WQBEL for mercury by implementing the plan of study, which has been developed as part of the PMP;
Low-level mercury monitoring of the plant’s influent and effluent; A requirement that the annual average mercury effluent concentration is less than or equal to 12 ng/L as
specified in the plan of study; A summary of the elements of the plan of study; A requirement to submit an annual report on implementation of the PMP; and A requirement for submittal of a certification stating that all permit conditions related to implementing
the plan of study and the PMP have been satisfied, but that compliance with the monthly average WQBEL for mercury has not been achieved.
Silver The Ohio EPA risk assessment (Table 14) places silver in group 4. This placement, as well as the data in Table 5, Table 6, Table 7, and Table 8, indicates that this parameter does not have the reasonable potential to contribute to WQS exceedances, and limits are not necessary to protect water quality. Monitoring for Group 4

Fact Sheet for NPDES Permit Renewal, Euclid WWTP, 2015
Page 14 of 41
pollutants (where PEQ exceeds 50 percent of the WLA) is required by OAC 3745-33-07(A)(2). Monitoring is proposed to continue. To ensure that data is obtained that allows Ohio EPA to make water quality-related decisions regarding silver,a special condition is proposed in Part II of the permit that provides guidance on the MDLs the permittee must use in analyzing for this contaminant. Chromium, Lead, Hexavalent Chromium (Dissolved), Cadmium, Nickel, Zinc, Chlorine – Total Residual, Cyanide – Free, and Total Filterable Residue The Ohio EPA risk assessment (Table 14) places these parameters in groups 2 and 3. This placement, as well as the data in Table 5, Table 6, Table 7, and Table 8, support that these parameters do not have the reasonable potential to contribute to WQS exceedances, and limits are not necessary to protect water quality. Monitoring at is proposed to document that these pollutants continue to remain at low levels. The limits for total residual chlorine are proposed to remain in the initial table only. The proposed limit for total residual chlorine is based on WLA as limited by the IMZM. The IMZM is a value calculated to avoid rapidly lethal conditions in the effluent mixing zone. The effluent limit for chlorine at outfall 001 is less than the quantification level of 0.050 mg/L. However, a pollutant minimization program is not required because the dosing rate of dechlorination chemicals ensures that the WQBEL is being met. The upgraded treatment plant will not utilize chlorination and total residual chlorine limits are not necessary in the final limits table. New analytical limits for low-level free cyanide have been approved. Details are in Part II of the permit. Bromodichloromethane, Chloroform, Iron, Manganese, Strontium, Arsenic, Selenium, Aluminum, and Barium The Ohio EPA risk assessment (Table 14) places these parameters in groups 2 and 3. This placement, as well as the data in Table 5, Table 6, Table 7, and Table 8, support that these parameters do not have the reasonable potential to contribute to WQS exceedances, and limits are not necessary to protect water quality. No monitoring is proposed. Nitrate+Nitrite, Total Kjeldahl Nitrogen and Orthophosphate Municipal WWTPs discharge a nutrient load to the lake therefore monitoring for nitrate + nitrite and total Kjeldahl nitrogen is proposed to continue based on best technical judgment. New monitoring for orthophosphate is proposed in order to gather data on the effect of total phosphorus and dissolved phosphorus. The purpose of the monitoring is to maintain a nutrient data set for use in the future total maximum daily loads (TMDL) study. Whole Effluent Toxicity Reasonable Potential Evaluating the acute toxicity results in Table 9 and Table 10 under the provisions of 40 CFR Part 132, Appendix F, Procedure 6, gives an acute PEQ value of 3.22 TUa for Ceriodaphnia dubia and an acute PEQ value of 2.8 for Pimephales promelas. Reasonable potential for toxicity is demonstrated, since these values exceed the WLA value of 1.0 TUa. Consistent with Procedure 6 and OAC 3745-33-07(B), a daily maximum limit of 1.0 TUa for both species with semi-annual monitoring is proposed. It is proposed that the final effluent limits for toxicity become effective after the new WWTP becomes operational, ie. 54 months from the effective date. An evaluation regarding the need for a Toxicity Reduction Evaluation (TRE) will be conducted as part of the next permit renewal. Additional Monitoring Requirements SSO stations 038, 035, 034, 032, 031, 030, and 029 are proposed to be removed from the permit since these have been eliminated from the collection system. One new SSO is proposed to be added to the permit: 039 -Brandywine Pump Station.

Fact Sheet for NPDES Permit Renewal, Euclid WWTP, 2015
Page 15 of 41
Additional monitoring requirements proposed at the final effluent, influent and upstream/downstream stations are included for all facilities in Ohio and vary according to the type and size of the discharge. In addition to permit compliance, this data is used to assist in the evaluation of effluent quality and treatment plant performance and for designing plant improvements and conducting future stream studies. Sludge Limits and monitoring requirements proposed for the disposal of sewage sludge by the following management practices are based on OAC 3745-40: removal to sanitary landfill. Other Requirements Compliance Schedule Pretreatment Local Limits Review - A six month compliance schedule is proposed for the City of Euclid to submit a technical justification for either revising its local industrial user limits or retaining its existing local limits. If revisions to local limits are required, the City of Euclid must also submit a pretreatment program modification request. Details are in Part I.C of the permit. New Limits - A 54 month compliance schedule is proposed for the Euclid WWTP to meet the new limits for CBOD5, TSS, and acute toxicity. Details are in Part I.C of the permit. Consent Decree – Submittals and construction for wet-weather projects are described in the Consent Decree and therefore are not in this permit. Phosphorus Optimization - The permittee shall prepare and submit a Phosphorus Discharge Optimization Evaluation plan to Ohio EPA Northeast District Office. The plan shall be completed and submitted to Ohio EPA no later than 12 months after the new equipment goes online. Details are in Part I.C of the permit. Sanitary Sewer Overflow Reporting Provisions for reporting SSOs are again proposed in this permit. These provisions include: the reporting of the system-wide number of SSO occurrences on monthly operating reports; telephone notification of Ohio EPA and the local health department, and 5-day follow up written reports for certain high risk SSOs; and preparation of an annual report that is submitted to Ohio EPA and made available to the public. Many of these provisions were already required under the “Noncompliance Notification”, “Records Retention”, and “Facility Operation and Quality Control” general conditions in Part III of Ohio NPDES permits. Operator Certification and Operator of Record Operator certification requirements have been included in Part II of the permit in accordance with rules adopted in December 2006 (OAC 3745-7-02). These rules require the Euclid WWTP to have a Class IV wastewater treatment plant operator in charge of the sewage treatment plant operations discharging through outfall 001. These rules also require the permittee to designate one or more operator of record to oversee the technical operation of the sewerage system. Low-Level Free Cyanide Testing Currently there are two approved methods for free cyanide listed in 40 CFR 136.3 that have quantification levels lower than any water quality-based effluent limits: - ASTM D7237-10 and OIA-1677-09 - Flow injection followed by gas diffusion amperometry

Fact Sheet for NPDES Permit Renewal, Euclid WWTP, 2015
Page 16 of 41
These methods will allow Ohio EPA make more reliable water quality-related decisions regarding free cyanide. Because the quantification levels are lower than any water quality-based effluent limits, it will also be possible to directly evaluate compliance with free cyanide limits. New NPDES permits no longer authorize the use of method 4500 CN-I from Standard Methods for free cyanide testing. The new permits require permittees to begin using one of these approved methods as soon as possible. If a permittee must use method 4500 CN-I during the transition to an approved method, they are instructed to report the results on their DMR and enter “Method 4500 CN-I” in the remarks section. Method Detection Limit The reported data for silver shows that the Euclid WWTP used an analytical method with a MDL that is not sensitive enough to properly evaluate the discharge with regard to the WLA for this parameter. As a result, Part II of the permit includes a condition requiring the permittee to use an analytical method with an appropriate MDL. Storm Water Compliance To comply with industrial storm water regulations, the permittee submitted a form for "No Exposure Certification." 3GRN00333*EG was signed on 3/30/15. Compliance with the industrial storm water regulations must be re-affirmed every five years. No later than 3/30/20, the permittee must submit a new form for "No Exposure Certification" or make other provisions to comply with the industrial storm water regulations. Outfall Signage Part II of the permit includes requirements for the permittee to place and maintain a sign at each outfall to Lake Erie providing information about the discharge. Signage at outfalls is required pursuant to OAC 3745-33-08(A).

Fact Sheet for NPDES Permit Renewal, Euclid WWTP, 2015
Page 17 of 41
Figure 1. Location of Euclid Wastewater Treatment Plant

Fact Sheet for NPDES Permit Renewal, Euclid WWTP, 2015
Page 18 of 41
Figure 2. Diagram of Wastewater Treatment System

Fact Sheet for NPDES Permit Renewal, Euclid WWTP, 2015
Page 19 of 41
Table 1. Average Annual Effluent Flow Rates
Year Annual Flow in MGD
50th Percentile
95th Percentile
Maximum
2010a 11.5 22.3 30.6
2011 14.9 25.4 35.1
2012 11.7 23.6 48.4
2013 12.5 22.9 41.8
2014 13.0 23.1 37.2
2015b 13.4 23.2 31.1 a = data set begins on 5/1/10 b = data set ends on 5/1/15 MGD = million gallons per day Table 2. Sanitary Sewer Overflows Discharges
Year Number of SSOs 2010a 31 2011 85 2012 15 2013 42 2014 22 2015b 5
a = data set begins on 5/1/10 b = data set ends on 5/1/15 Table 3. Bypass Discharges
Bypass Volume (Million gallons) Total Suspended Solids (mg/L) CBOD5
Year Average Maximum Average Maximum Average Maximum
2010a 13.5 50.2 74.8 238 34.8 170
2011 17.8 89.7 68.9 358 23.5 97.0
2012 16.1 108 85.3 320 27.2 109
2013 15.3 84.4 77.9 240 28.6 104
2014 14.1 54.1 118 328 50.1 144
2015b 17.0 70.4 76.4 320 33.4 73.0 a = data set begins on 5/1/10 b = data set ends on 5/1/15 CBOD5 = five-day carbonaceous biochemical oxygen demand

Fact Sheet for NPDES Permit Renewal, Euclid WWTP, 2015
Page 20 of 41
Table 4. Combined Sewer Overflow Discharges from May 1, 2010 through April 30, 2015
Number of Occurrences
Volume (Million gallons)
Station Total
Gallons Average
Discharge 005 31 3.24 0.162 006 197 22.8 0.151 007 188 19.5 0.129 008 34 1.080 0.047 009 23 0.041 0.021 010 63 0.876 0.029 011 216 19.5 0.103 012 251 53.9 0.253 013 25 0.269 0.045 014 56 0.829 0.035 015 37 0.580 0.026 018 31 0.106 0.008 019 28 0.900 0.047 020 197 104 0.636 022 199 72.3 0.399 023 2 -- --
024 11 0.319 0.064

Fact Sheet for NPDES Permit Renewal, Euclid WWTP, 2015
Page 21 of 41
Table 5. Effluent Characterization Using Pretreatment Data Parameter (µg/L) 7/14/2011 6/28/2012
Antimony AA (200) AA (100)
Arsenic AA (10) AA (10)
Beryllium AA (10) AA (5)
Cadmium AA (5) AA (5)
Chromium AA (20) AA (20)
Copper 10 10
Lead AA (20) AA (20)
Mercury AA (0.2) AA (0.2)
Nickel AA (20) AA (20)
Selenium AA (10) AA (10)
Silver AA (5) AA (5)
Thallium AA (50) AA (20)
Zinc 35 30 AA = not-detected (analytical method detection limit)

Fact Sheet for NPDES Permit Renewal, Euclid WWTP, 2015
Page 22 of 41
Table 6. Effluent Characterization Using Ohio EPA data
Parameter Units 5/16/2012
Aluminum µg/L 1240
Ammonia mg/L 16.9
Arsenic µg/L AA (2)
Barium µg/L 18
Bromodichloromethane µg/L 0.82
Cadmium µg/L AA (0.2)
Carbonaceous Biochemical Oxygen Demand (5 day) mg/L 2.7
Chemical Oxygen Demand mg/L 43
Chloride mg/L 124
Chloroform µg/L 1.49
Chromium µg/L AA (2)
Copper µg/L 8.4
Cyanide, Free µg/L 8
Iron µg/L 250
Lead µg/L AA (2)
Magnesium mg/L 19
Manganese µg/L 111
Nickel µg/L 15
Nitrate+Nitrite mg/L 0.88
Oil & Grease mg/L AA (2.2)
Phosphorus mg/L 0.531
Selenium µg/L AA (2)
Strontium µg/L 306
Total Filterable Residue mg/L 526
Total Kjeldahl Nitrogen mg/L 16.2
Total Suspended Solids mg/L AA (5)
Zinc µg/L 31 AA = not detected (analytical method detection limit)
Fact Sheet for NPDES Permit Renewal, Euclid WWTP, 2015
Page 23 of 41
Table 7. Effluent Characterization Using Self-Monitoring Data
Current Permit
Limits # Percentiles
Parameter Season Units 30 day Daily Obs. 50th 95th Data Range
Outfall 001
Water Temperature Annual °C - - - - - Monitor - - - - - 1818 16 23 7-26
Dissolved Oxygen Annual mg/L - - - - - Monitor - - - - - 1814 11.2 15.8 0.5-21.6
Total Suspended Solids Annual mg/L 20 30a 1243 8 23 1-52
kg/day 1666 2498a -- -- -- --
Oil and Grease Annual mg/L - - - - - Monitor - - - - - 242 2.2 5.99 0-9
Ammonia (Summer) Summer mg/L - - - - - Monitor - - - - - 636 12 17 2-20
Ammonia (Winter) Winter mg/L - - - - - Monitor - - - - - 605 11 16 1-25
Total Kjeldahl Nitrogen Annual mg/L - - - - - Monitor - - - - - 48 12.1 16.6 3.7-22.4
Nitrate + Nitrite Annual mg/L - - - - - Monitor - - - - - 122 0.825 1.68 0.26-2.2
Phosphorus Annual mg/L 1.0 1.5a 481 0.44 0.84 0.18-0.96
kg/day 83 125a -- -- -- --
Cyanide, Free Annual mg/L - - - - - Monitor - - - - - 120 0 0 0-0
Nickel Annual µg/L - - - - - Monitor - - - - - 60 0 25 0-40
Silver Annual µg/L - - - - - Monitor - - - - - 120 0 0 0-5
Zinc Annual µg/L - - - - - Monitor - - - - - 60 28 40.5 10-84
Cadmium Annual µg/L - - - - - Monitor - - - - - 60 0 0 0-0
Lead Annual µg/L - - - - - Monitor - - - - - 60 0 0 0-0
Chromium Annual µg/L - - - - - Monitor - - - - - 60 0 0 0-20
Copper Annual µg/L - - - - - Monitor - - - - - 120 10 20 0-49
Hexavalent Chromium (Dissolved) Annual µg/L - - - - - Monitor - - - - - 60 0 0 0-0
E. coli Annual #/100 mL 126 284a 454 9 647 0-21000
Flow Rate Annual MGD - - - - - Monitor - - - - - 1771 12.7 23.7 7.7-48.4
Chlorine, Total Residual Annual mg/L - - - - - Monitor - - - - - 638 0 0.01 0-0.137 Mercury, Total (Low Level) Annual ng/L 9.9 1700 32 3.02 7.53 1.7-10.5
kg/day 0.000825 0.142 -- -- -- --
Acute Toxicity, Ceriodaphnia dubia Annual TUa - - - - - Monitor - - - - - 5 0 1.12 0-1.4
Acute Toxicity, Pimephales promelas Annual TUa - - - - - Monitor - - - - - 5 0.8 1.18 0-1.22
pH, Maximum Annual S.U. -- 9.0 1816 6.9 7.3 6.3-8.2
pH, Minimum Annual S.U. -- 6.0 1816 6.8 7.1 6.1-7.5
Residue, Total Filterable Annual mg/L - - - - - Monitor - - - - - 24 615 1040 489-1270 Carbonaceous Biochemical Oxygen Demand (5 day)
Annual mg/L 15 23a 1201 6 14 1-23
kg/day 1249 1915a -- -- -- --

Fact Sheet for NPDES Permit Renewal, Euclid WWTP, 2015
Page 24 of 41
Table 7. Effluent Characterization Using Self-Monitoring Data
Current Permit
Limits # Percentiles
Parameter Season Units 30 day Daily Obs. 50th 95th Data Range
Bypass Monitoring Station 002
Total Suspended Solids Annual mg/L - - - - - Monitor - - - - - 370 54 229 7-358
E. coli Annual #/100 mL - - - - - Monitor - - - - - 74 38.5 2560 1-15200
Flow Rate Annual MGD - - - - - Monitor - - - - - 344 10.8 48.7 0.04-108
Chlorine, Total Residual Annual mg/L - - - - - Monitor - - - - - 71 5 11.6 0-13.9
Carbonaceous Biochemical Oxygen Demand (5 day) Annual mg/L - - - - - Monitor - - - - - 344 24 79.9 1-170
Bypass Occurrence, Number per month Annual No./Month - - - - - Monitor - - - - - 237 1 1 1-2
Bypass Duration, Hours per month Annual Hr/Month - - - - - Monitor - - - - - 374 7.5 24 0.25-24
Combined Sewer Overflow Station 005
Total Suspended Solids Annual mg/L - - - - - Monitor - - - - - -- -- -- --
E. coli Annual #/100 mL - - - - - Monitor - - - - - -- -- -- --
Overflow Occurrence Annual No./Month - - - - - Monitor - - - - - 31 1 1 1-1
Overflow Volume Annual Million Gallons - - - - - Monitor - - - - - 20 0.0456 0.36 0.00082-1.7
Carbonaceous Biochemical Oxygen Demand (5 day) Annual mg/L - - - - - Monitor - - - - - -- -- -- --
Combined Sewer Overflow Station 006
Total Suspended Solids Annual mg/L - - - - - Monitor - - - - - 17 136 481 16-518
E. coli Annual #/100 mL - - - - - Monitor - - - - - 2 40500 70700 7000-74000
Overflow Occurrence Annual No./Month - - - - - Monitor - - - - - 191 1 1 1-2
Overflow Volume Annual Million Gallons - - - - - Monitor - - - - - 151 0.0451 0.596 0.00011-3.19
Carbonaceous Biochemical Oxygen Demand (5 day) Annual mg/L - - - - - Monitor - - - - - 16 16.5 91 5-127
Combined Sewer Overflow Station 007
Total Suspended Solids Annual mg/L - - - - - Monitor - - - - - 19 110 300 12-304
E. coli Annual #/100 mL - - - - - Monitor - - - - - 2 67000 76900 56000-78000
Overflow Occurrence Annual No./Month - - - - - Monitor - - - - - 182 1 1 1-2
Overflow Volume Annual Million Gallons - - - - - Monitor - - - - - 151 0.0567 0.463 0.00006-2.15

Fact Sheet for NPDES Permit Renewal, Euclid WWTP, 2015
Page 25 of 41
Table 7. Effluent Characterization Using Self-Monitoring Data
Current Permit
Limits # Percentiles
Parameter Season Units 30 day Daily Obs. 50th 95th Data Range
Carbonaceous Biochemical Oxygen Demand (5 day) Annual mg/L - - - - - Monitor - - - - - 15 40 169 3-231
Combined Sewer Overflow Station 008
Total Suspended Solids Annual mg/L - - - - - Monitor - - - - - -- -- -- --
E. coli Annual #/100 mL - - - - - Monitor - - - - - -- -- -- --
Overflow Occurrence Annual No./Month - - - - - Monitor - - - - - 33 1 1 1-2
Overflow Volume Annual Million Gallons - - - - - Monitor - - - - - 23 0.00952 0.0588
0.00042-0.753
Carbonaceous Biochemical Oxygen Demand (5 day) Annual mg/L - - - - - Monitor - - - - - -- -- -- --
Combined Sewer Overflow Station 009
Total Suspended Solids Annual mg/L - - - - - Monitor - - - - - 1 6 6 6-6
E. coli Annual #/100 mL - - - - - Monitor - - - - - -- -- -- --
Overflow Occurrence Annual No./Month - - - - - Monitor - - - - - 23 1 1 1-1
Overflow Volume Annual Million Gallons - - - - - Monitor - - - - - 2 0.0207 0.035
0.00476-0.0366
Carbonaceous Biochemical Oxygen Demand (5 day) Annual mg/L - - - - - Monitor - - - - - 1 13 13 13-13
Combined Sewer Overflow Station 010
Total Suspended Solids Annual mg/L - - - - - Monitor - - - - - 5 152 207 68-216
E. coli Annual #/100 mL - - - - - Monitor - - - - - 1 780 780 780-780
Overflow Occurrence Annual No./Month - - - - - Monitor - - - - - 63 1 1 1-1
Overflow Volume Annual Million Gallons - - - - - Monitor - - - - - 30 0.00563 0.0966
0.00045-0.483
Carbonaceous Biochemical Oxygen Demand (5 day) Annual mg/L - - - - - Monitor - - - - - 5 25 55.4 6-62
Combined Sewer Overflow Station 011
Total Suspended Solids Annual mg/L - - - - - Monitor - - - - - 30 101 273 12-808
E. coli Annual #/100 mL - - - - - Monitor - - - - - -- -- -- --
Overflow Occurrence Annual No./Month - - - - - Monitor - - - - - 204 1 2 1-2
Overflow Volume Annual Million Gallons - - - - - Monitor - - - - - 189 0.0406 0.449 0.00009-1.65
Carbonaceous Biochemical Oxygen Demand (5 day) Annual mg/L - - - - - Monitor - - - - - 23 15 69.4 4-104

Fact Sheet for NPDES Permit Renewal, Euclid WWTP, 2015
Page 26 of 41
Table 7. Effluent Characterization Using Self-Monitoring Data
Current Permit
Limits # Percentiles
Parameter Season Units 30 day Daily Obs. 50th 95th Data Range
Combined Sewer Overflow Station 012
Total Suspended Solids Annual mg/L - - - - - Monitor - - - - - 20 126 327 19-380
E. coli Annual #/100 mL - - - - - Monitor - - - - - 1 30000 30000 30000-30000
Overflow Occurrence Annual No./Month - - - - - Monitor - - - - - 236 1 2 1-2
Overflow Volume Annual Million Gallons - - - - - Monitor - - - - - 213 0.0924 1.07 0.00004-4.31
Carbonaceous Biochemical Oxygen Demand (5 day) Annual mg/L - - - - - Monitor - - - - - 16 41 164 5-202
Combined Sewer Overflow Station 013
Total Suspended Solids Annual mg/L - - - - - Monitor - - - - - 2 156 179 130-182
E. coli Annual #/100 mL - - - - - Monitor - - - - - -- -- -- --
Overflow Occurrence Annual No./Month - - - - - Monitor - - - - - 25 1 1 1-1
Overflow Volume Annual Million Gallons - - - - - Monitor - - - - - 6 0.00276 0.192
0.00007-0.253
Carbonaceous Biochemical Oxygen Demand (5 day) Annual mg/L - - - - - Monitor - - - - - 2 6 6.9 5-7
Combined Sewer Overflow Station 014
Total Suspended Solids Annual mg/L - - - - - Monitor - - - - - 5 144 282 92-314
E. coli Annual #/100 mL - - - - - Monitor - - - - - 1 23 23 23-23
Overflow Occurrence Annual No./Month - - - - - Monitor - - - - - 56 1 1 1-1
Overflow Volume Annual Million Gallons - - - - - Monitor - - - - - 24 0.0111 0.0688
0.00057-0.367
Carbonaceous Biochemical Oxygen Demand (5 day) Annual mg/L - - - - - Monitor - - - - - 4 18.5 30.4 7-32
Combined Sewer Overflow Station 015
Total Suspended Solids Annual mg/L - - - - - Monitor - - - - - 1 116 116 116-116
E. coli Annual #/100 mL - - - - - Monitor - - - - - -- -- -- --
Overflow Occurrence Annual No./Month - - - - - Monitor - - - - - 37 1 1 1-1
Overflow Volume Annual Million Gallons - - - - - Monitor - - - - - 22 0.00631 0.0614
0.00002-0.285
Carbonaceous Biochemical Oxygen Demand (5 day) Annual mg/L - - - - - Monitor - - - - - 1 13 13 13-13
Combined Sewer Overflow Station 018
Total Suspended Solids Annual mg/L - - - - - Monitor - - - - - -- -- -- --
E. coli Annual #/100 mL - - - - - Monitor - - - - - -- -- -- --

Fact Sheet for NPDES Permit Renewal, Euclid WWTP, 2015
Page 27 of 41
Table 7. Effluent Characterization Using Self-Monitoring Data
Current Permit
Limits # Percentiles
Parameter Season Units 30 day Daily Obs. 50th 95th Data Range
Overflow Occurrence Annual No./Month - - - - - Monitor - - - - - 31 1 1 1-1
Overflow Volume Annual Million Gallons - - - - - Monitor - - - - - 13 0.00434 0.0298
0.00006-0.0546
Carbonaceous Biochemical Oxygen Demand (5 day) Annual mg/L - - - - - Monitor - - - - - -- -- -- --
Combined Sewer Overflow Station 019
Total Suspended Solids Annual mg/L - - - - - Monitor - - - - - 1 440 440 440-440
E. coli Annual #/100 mL - - - - - Monitor - - - - - -- -- -- --
Overflow Occurrence Annual No./Month - - - - - Monitor - - - - - 28 1 1 1-1
Overflow Volume Annual Million Gallons - - - - - Monitor - - - - - 19 0.00663 0.0897
0.00022-0.774
Carbonaceous Biochemical Oxygen Demand (5 day) Annual mg/L - - - - - Monitor - - - - - 1 6 6 6-6
Combined Sewer Overflow Station 020
Total Suspended Solids Annual mg/L - - - - - Monitor - - - - - 28 104 355 8-484
E. coli Annual #/100 mL - - - - - Monitor - - - - - -- -- -- --
Overflow Occurrence Annual No./Month - - - - - Monitor - - - - - 189 1 1 1-2
Overflow Volume Annual Million Gallons - - - - - Monitor - - - - - 163 0.27 2.31 0.00069-5.51
Carbonaceous Biochemical Oxygen Demand (5 day) Annual mg/L - - - - - Monitor - - - - - 23 19 129 2-136
Combined Sewer Overflow Station 022
Total Suspended Solids Annual mg/L - - - - - Monitor - - - - - 15 204 414 20-540
E. coli Annual #/100 mL - - - - - Monitor - - - - - -- -- -- --
Overflow Occurrence Annual No./Month - - - - - Monitor - - - - - 193 1 1 1-2
Overflow Volume Annual Million Gallons - - - - - Monitor - - - - - 181 0.117 1.69 0.00017-4.65
Carbonaceous Biochemical Oxygen Demand (5 day) Annual mg/L - - - - - Monitor - - - - - 12 13 58.4 5-87
Combined Sewer Overflow Station 023
Total Suspended Solids Annual mg/L - - - - - Monitor - - - - - -- -- -- --
E. coli Annual #/100 mL - - - - - Monitor - - - - - -- -- -- --
Overflow Occurrence Annual No./Month - - - - - Monitor - - - - - 2 1 1 1-1
Overflow Volume Annual Million Gallons - - - - - Monitor - - - - - -- -- -- --

Fact Sheet for NPDES Permit Renewal, Euclid WWTP, 2015
Page 28 of 41
Table 7. Effluent Characterization Using Self-Monitoring Data
Current Permit
Limits # Percentiles
Parameter Season Units 30 day Daily Obs. 50th 95th Data Range
Carbonaceous Biochemical Oxygen Demand (5 day) Annual mg/L - - - - - Monitor - - - - - -- -- -- --
Combined Sewer Overflow Station 024
Total Suspended Solids Annual mg/L - - - - - Monitor - - - - - 2 141 198 78-204
E. coli Annual #/100 mL - - - - - Monitor - - - - - -- -- -- --
Overflow Occurrence Annual No./Month - - - - - Monitor - - - - - 11 1 1 1-1
Overflow Volume Annual Million Gallons - - - - - Monitor - - - - - 5 0.0408 0.152 0.0264-0.18
Carbonaceous Biochemical Oxygen Demand (5 day) Annual mg/L - - - - - Monitor - - - - - 2 13.5 22.1 4-23
Sanitary Sewer Overflow Station 025
E. coli Annual #/100 mL - - - - - Monitor - - - - - -- -- -- --
Overflow Occurrence Annual No./Month - - - - - Monitor - - - - - 6 1 1 1-1
Sanitary Sewer Overflow Station 026
E. coli Annual #/100 mL - - - - - Monitor - - - - - -- -- -- --
Overflow Occurrence Annual No./Month - - - - - Monitor - - - - - 16 1 1 1-1
Sanitary Sewer Overflow Station 027
E. coli Annual #/100 mL - - - - - Monitor - - - - - -- -- -- --
Overflow Occurrence Annual No./Month - - - - - Monitor - - - - - 3 1 1 1-1
Sanitary Sewer Overflow Station 028
E. coli Annual #/100 mL - - - - - Monitor - - - - - 1 30000 30000 30000-30000
Overflow Occurrence Annual No./Month - - - - - Monitor - - - - - 48 1 1 1-1
Sanitary Sewer Overflow Station 029
E. coli Annual #/100 mL - - - - - Monitor - - - - - -- -- -- --
Overflow Occurrence Annual No./Month - - - - - Monitor - - - - - -- -- -- --
Sanitary Sewer Overflow Station 030
E. coli Annual #/100 mL - - - - - Monitor - - - - - -- -- -- --
Overflow Occurrence Annual No./Month - - - - - Monitor - - - - - 15 1 1 1-1
Sanitary Sewer Overflow Station 031
E. coli Annual #/100 mL - - - - - Monitor - - - - - -- -- -- --

Fact Sheet for NPDES Permit Renewal, Euclid WWTP, 2015
Page 29 of 41
Table 7. Effluent Characterization Using Self-Monitoring Data
Current Permit
Limits # Percentiles
Parameter Season Units 30 day Daily Obs. 50th 95th Data Range
Overflow Occurrence Annual No./Month - - - - - Monitor - - - - - 22 1 1 1-1
Sanitary Sewer Overflow Station 032
E. coli Annual #/100 mL - - - - - Monitor - - - - - -- -- -- --
Overflow Occurrence Annual No./Month - - - - - Monitor - - - - - 17 1 1 1-1
Sanitary Sewer Overflow Station 033
E. coli Annual #/100 mL - - - - - Monitor - - - - - -- -- -- --
Overflow Occurrence Annual No./Month - - - - - Monitor - - - - - 3 1 1 1-1
Sanitary Sewer Overflow Station 034
E. coli Annual #/100 mL - - - - - Monitor - - - - - -- -- -- --
Overflow Occurrence Annual No./Month - - - - - Monitor - - - - - -- -- -- --
Sanitary Sewer Overflow Station 035
E. coli Annual #/100 mL - - - - - Monitor - - - - - -- -- -- --
Overflow Occurrence Annual No./Month - - - - - Monitor - - - - - -- -- -- --
Sanitary Sewer Overflow Station 036
E. coli Annual #/100 mL - - - - - Monitor - - - - - -- -- -- --
Overflow Occurrence Annual No./Month - - - - - Monitor - - - - - 7 1 1 1-1
Sanitary Sewer Overflow Station 037
E. coli Annual #/100 mL - - - - - Monitor - - - - - -- -- -- --
Overflow Occurrence Annual No./Month - - - - - Monitor - - - - - 13 1 1 1-1
Sanitary Sewer Overflow Station 038
E. coli Annual #/100 mL - - - - - Monitor - - - - - -- -- -- --
Overflow Occurrence Annual No./Month - - - - - Monitor - - - - - -- -- -- --
Sanitary Sewer Overflow Station 300
Overflow Occurrence Annual No./Month - - - - - Monitor - - - - - 58 2 12.5 0-19
Sludge Station 585
Arsenic Annual mg/kg - - - - - Monitor - - - - - -- -- -- --
Beryllium Annual mg/kg - - - - - Monitor - - - - - -- -- -- --
Cadmium Annual mg/kg - - - - - Monitor - - - - - -- -- -- --

Fact Sheet for NPDES Permit Renewal, Euclid WWTP, 2015
Page 30 of 41
Table 7. Effluent Characterization Using Self-Monitoring Data
Current Permit
Limits # Percentiles
Parameter Season Units 30 day Daily Obs. 50th 95th Data Range
Chromium Annual mg/kg - - - - - Monitor - - - - - -- -- -- --
Lead Annual mg/kg - - - - - Monitor - - - - - -- -- -- --
Nickel Annual mg/kg - - - - - Monitor - - - - - -- -- -- --
Sludge Fee Weight Annual Dry Tons - - - - - Monitor - - - - - -- -- -- --
Mercury Annual mg/kg - - - - - Monitor - - - - - -- -- -- --
Sludge Station 586
Sludge Fee Weight Annual Dry Tons - - - - - Monitor - - - - - 5 2520 3350 2370-3390
Influent Monitoring Station 601
Total Suspended Solids Annual mg/L - - - - - Monitor - - - - - 1240 136 244 24-474
Cyanide, Total Annual mg/L - - - - - Monitor - - - - - 60 0 0 0-0
Nickel Annual µg/L - - - - - Monitor - - - - - 60 0 45.3 0-55
Silver Annual µg/L - - - - - Monitor - - - - - 60 0 5 0-5
Zinc Annual µg/L - - - - - Monitor - - - - - 60 75 131 40-640
Cadmium Annual µg/L - - - - - Monitor - - - - - 60 0 0 0-0
Lead Annual µg/L - - - - - Monitor - - - - - 60 0 0 0-0
Chromium Annual µg/L - - - - - Monitor - - - - - 60 0 23.1 0-35
Copper Annual µg/L - - - - - Monitor - - - - - 60 40 70 10-100
Hexavalent Chromium (Dissolved) Annual µg/L - - - - - Monitor - - - - - 60 0 0 0-32
Mercury Annual ng/L - - - - - Monitor - - - - - 61 21 153 0-306
pH, Maximum Annual S.U. - - - - - Monitor - - - - - 1823 7.9 8.6 6.6-11.5
pH, Minimum Annual S.U. - - - - - Monitor - - - - - 1823 7.4 7.8 3.7-8.5 Carbonaceous Biochemical Oxygen Demand (5 day)
Summer mg/L - - - - - Monitor - - - - - 620 111 161 23-214
Winter mg/L - - - - - Monitor - - - - - 583 97 149 23-210 All values are based on annual records unless otherwise indicated. * = For minimum pH, 5th percentile shown in place of 50th percentile; ** = For dissolved oxygen, 5th percentile shown in place of 95th percentile; a = weekly average.”

Fact Sheet for NPDES Permit Renewal, Euclid WWTP, 2015
Page 31 of 41
Table 8. Projected Effluent Quality
Number
of Number
> PEQ PEQ Parameter Units Samples MDL Average Maximum
Aluminum µg/L 1 1 5612 7688
Ammonia (Summer) mg/L 424 424 8.32 11.4
Ammonia (Winter) mg/L 296 296 12.8 17.5
Arsenic µg/L 3 0 -- --
Barium µg/L 1 1 81.5 112
Bromodichloromethane µg/L 1 1 3.71 5.08
Cadmium µg/L 61 0 -- --
Chlorine, Total Residual mg/L 638 110 0.005 0.011
Chloroform µg/L 1 1 6.74 9.24
Chromium µg/L 61 1 14.6 20.0
Copper µg/L 123 98 28.6 39.2
Cyanide, Free mg/L 121 1 0.012 0.016 Hexavalent Chromium (Dissolved) µg/L 60 0 -- --
Iron µg/L 1 1 1132 1550
Lead µg/L 61 0 -- --
Magnesium mg/L 1 1 86.0 118
Manganese µg/L 1 1 502 688
Mercury ng/L 32 32 6.01 8.78
Nickel µg/L 61 6 19.0 30.1
Nitrate + Nitrite mg/L 123 123 1.28 1.76
Phosphorus mg/L 482 482 0.420 0.576
Selenium µg/L 3 0 -- --
Silver µg/L 120 1 2.92 4.00
Strontium µg/L 1 1 1385 1897
Total Filterable Residue mg/L 25 25 1201 1646
Total Kjeldahl Nitrogen mg/L 49 49 16.4 22.4
Zinc µg/L 63 63 40.5 54.1 MDL = analytical method detection limit PEQ = projected effluent quality

Fact Sheet for NPDES Permit Renewal, Euclid WWTP, 2015
Page 32 of 41
Table 9. Summary of Acute and Chronic Toxicity Results
Ceriodaphnia
Dubia Pimephales promelas
Date TUa TUa
9/14/2010 1.4 0.8
9/10/2011 AA AA
9/6/2012 AA 0.5
9/12/2013 AA 1.04
9/4/2014 AA 1.22 AA = non-detection; analytical method detection limit of 0.2 TUa TUa = acute toxicity unit Table 10. Ohio EPA Toxicity Screening Results for Outfall 001
Pimephales promelas (%M)
Ceriodaphnia dubia (%M)
Date 24 hours 48 hours 24
hours 48
hours
5/14/2012 0 0 0 0
5/15/2012 0 45 0 5
5/14/12-5/15/12a 35 95 0 30 a = 24-hour composite sample %M = percent mortality in 100% effluent

Fact Sheet for NPDES Permit Renewal, Euclid WWTP, 2015
Page 33 of 41
Table 11. Water Quality Criteria in the Study Area
Outside Mixing Zone Criteria Inside
Average Maximum Mixing
Human Agri- Aquatic Aquatic Zone Parameter Units Wildlife Health culture Life Life Maximum
Aluminum µg/L -- 4500 -- -- -- --
Ammonia (Summer) mg/L -- -- -- -- -- --
Ammonia (Winter) mg/L -- -- -- -- -- --
Arsenic µg/L -- 580 100 150 340 680
Barium µg/L -- 160000 -- 220 2000 4000
Bromodichloromethane µg/L -- 180c -- 340 3100 6200
Cadmium µg/L -- 730 50 3.2 6.6 13
Chlorine, Total Residual mg/L -- -- -- 0.011 0.019 0.038
Chloroform µg/L -- 1700c -- 140 1300 2600
Chromium µg/L -- 14000 100 110 2400 4800
Copper µg/L -- 64000 500 12 19 38
Cyanide, Free mg/L -- 48 -- 0.0052 0.022 0.044 Hexavalent Chromium (Dissolved) µg/L -- 14000 -- 11 16 31
Iron µg/L -- -- 5000 -- -- --
Lead µg/L -- -- 100 9.9 190 380
Magnesium mg/L -- -- -- -- -- --
Manganese µg/L -- 61000 -- -- -- --
Mercury ng/L 1.3 3.1 10000 910 1700 3400
Nickel µg/L -- 43000 200 69 620 1200
Nitrate + Nitrite mg/L -- -- 100 -- -- --
Phosphorus mg/L -- -- -- -- -- --
Selenium µg/L -- 3100 50 5 -- --
Silver µg/L -- 11000 -- 1.3 2.9 5.7
Strontium µg/L -- 1400000 -- 21000 40000 81000
Total Filterable Residue mg/L -- -- -- 1500 -- --
Total Kjeldahl Nitrogen mg/L -- -- -- -- -- --
Zinc µg/L -- 35000 25000 160 160 320 c = carcinogen

Fact Sheet for NPDES Permit Renewal, Euclid WWTP, 2015
Page 34 of 41
Table 12. Instream Conditions and Discharger Flow
Parameter Units Season Value Basis
Hardness mg/L annual 140
Euclid WWTP flow cfs annual 34 NPDES permit application.
Background Water Quality
Aluminum µg/L 134 Ohio EPA; 2011-2014; n=10; 9<MDL; Lake Erie Station 301256
Ammonia (Summer) mg/L 0.025 Ohio EPA; 2011-2014; n=20; 17<MDL; Lake Erie Station 301256
Ammonia (Winter) mg/L -- No representative data available.
Arsenic µg/L 0 Ohio EPA; 2011-2014; n=10; 10<MDL; Lake Erie Station 301256
Barium µg/L 21.5 Ohio EPA; 2011-2014; n=10; 0<MDL; Lake Erie Station 301256
Bromodichloromethane µg/L -- No representative data available.
Cadmium µg/L 0 Ohio EPA; 2011-2014; n=10; 10<MDL; Lake Erie Station 301256
Chlorine, Total Residual mg/L -- No representative data available.
Chloroform µg/L -- No representative data available.
Chromium µg/L 0 Ohio EPA; 2011-2014; n=10; 10<MDL; Lake Erie Station 301256
Copper µg/L 0 Ohio EPA; 2011-2014; n=10; 10<MDL; Lake Erie Station 301256
Cyanide, Free mg/L -- No representative data available.
Hexavalent Chromium (Dissolved) µg/L -- No representative data available.
Iron µg/L 45.5 Ohio EPA; 2011-2014; n=10; 5<MDL; Lake Erie Station 301256
Lead µg/L 0 Ohio EPA; 2011-2014; n=10; 10<MDL; Lake Erie Station 301256
Magnesium mg/L 9 Ohio EPA; 2011-2014; n=10; 0<MDL; Lake Erie Station 301256
Manganese µg/L 5 Ohio EPA; 2011-2014; n=10; 9<MDL; Lake Erie Station 301256
Mercury ng/L -- No representative data available.
Nickel µg/L 1 Ohio EPA; 2011-2014; n=10; 9<MDL; Lake Erie Station 301256
Nitrate + Nitrite mg/L 0.655 Ohio EPA; 2011-2014; n=20; 1<MDL; Lake Erie Station 301256
Phosphorus mg/L 0.005 Ohio EPA; 2011-2014; n=20; 11<MDL; Lake Erie Station 301256
Selenium µg/L 0 Ohio EPA; 2011-2014; n=10; 10<MDL; Lake Erie Station 301256
Silver µg/L -- No representative data available.
Strontium µg/L 173 Ohio EPA; 2011-2014; n=10; 0<MDL; Lake Erie Station 301256
Total Filterable Residue mg/L 172 Ohio EPA; 2011-2014; n=19; <MDL; Lake Erie Station 301256
Total Kjeldahl Nitrogen mg/L 0.225 Ohio EPA; 2011-2014; n=20; 0<MDL; Lake Erie Station 301256
Zinc µg/L 5 Ohio EPA; 2011-2014; n=10; 9<MDL; Lake Erie Station 301256 MDL = analytical method detection limit n = number of samples NPDES = National Pollutant Discharge Elimination System Ohio EPA = Ohio Environmental Protection Agency

Fact Sheet for NPDES Permit Renewal, Euclid WWTP, 2015
Page 35 of 41
Table 13. Summary of Effluent Limits to Maintain Applicable Water Quality Criteria
Outside Mixing Zone Criteria Inside
Average Maximum Mixing
Human Agri- Aquatic Aquatic Zone Parameter Units Wildlife Health culture Life Life Maximum
Aluminum µg/L -- 48160 -- -- -- --
Ammonia (Summer) mg/L -- -- -- -- -- --
Ammonia (Winter) mg/L -- -- -- -- -- --
Arsenic µg/L -- 6380 1100 1650 -- 680
Barium µg/L -- 1759785 -- 2205 -- 4000
Bromodichloromethane µg/L -- 1980 -- 3740 -- 6200
Cadmium µg/L -- 8030 550 35 -- 13
Chlorine, Total Residual mg/L -- -- -- 0.12 -- 0.038
Chloroform µg/L -- 18700 -- 1540 -- 2600
Chromium µg/L -- 154000 1100 1210 -- 4800
Copper µg/L -- 704000 5500 132 -- 38
Cyanide, Free mg/L -- 528 -- 0.057 -- 0.044 Hexavalent Chromium (Dissolved) µg/L -- 154000 -- 121 -- 31
Iron µg/L -- -- 54545 -- -- --
Lead µg/L -- -- 1100 109 -- 380
Magnesium mg/L -- -- -- -- -- --
Manganese µg/L -- 670950 -- -- -- --
Mercury ng/L 1.3 3.1 10000 910 -- 3400
Nickel µg/L -- 472990 2190 749 -- 1200
Nitrate + Nitrite mg/L -- -- 1093 -- -- --
Phosphorus mg/L -- -- -- -- -- --
Selenium µg/L -- 34100 550 55 -- --
Silver µg/L -- 121000 -- 14 -- 5.7
Strontium µg/L -- 15398270 -- 229270 -- 81000
Total Filterable Residue mg/L -- -- -- 14780 -- --
Total Kjeldahl Nitrogen mg/L -- -- -- -- -- --
Zinc µg/L -- 384950 274950 1710 -- 320

Fact Sheet for NPDES Permit Renewal, Euclid WWTP, 2015
Page 36 of 41
Table 14. Parameter Assessment
Group 1: Due to a lack of criteria, the following parameters could not be evaluated at this time.
Magnesium Total Kjeldahl Nitrogen
Group 2: PEQ < 25 percent of WQS or all data below minimum detection limit. WLA not required. No limit recommended; monitoring optional.
Bromodichloromethane Cadmium Chloroform Chromium Hexavalent Chromium (Dissolved) Iron Lead Manganese Nitrate + Nitrite Strontium Arsenic Selenium
Group 3: PEQmax < 50 percent of maximum PEL and PEQavg < 50 percent of average PEL. No limit recommended; monitoring optional.
Aluminum Barium Zinc
Cyanide, Free Total Filterable Residue Nickel
Chlorine, Total Residual
Group 4: PEQmax ≥ 50 percent, but < 100 percent of the maximum PEL or PEQavg ≥ 50 percent, but < 100 percent of the average PEL. Monitoring is appropriate.
Silver
Group 5: Maximum PEQ ≥ 100 percent of the maximum PEL or average PEQ ≥ 100 percent of the average PEL, or either the average or maximum PEQ is between 75 and 100 percent of the PEL and certain conditions that increase the risk to the environment are present. Limit recommended.
Limits to Protect Numeric Water Quality Criteria
Recommended Effluent Limits Parameter Units Average Maximum Copper µg/L -- 38 Mercury ng/L 1.3 1700
PEL = preliminary effluent limit PEQ = projected effluent quality WLA = wasteload allocation WQS = water quality standard

Fact Sheet for NPDES Permit Renewal, Euclid WWTP, 2015
Page 37 of 41
Table 15. Initial Effluent Limits for Outfall 001
Concentration Loading (kg/day)a
30 Day Daily 30 Day Daily Parameter Units Average Maximum Average Maximum Basisb
Water Temperature °C - - - - - - - - - - - - Monitor - - - - - - - - - - - - Mc
Dissolved Oxygen mg/L - - - - - - - - - - - - Monitor - - - - - - - - - - - - Mc
Total Suspended Solids mg/L 20 30d 1666 2498d EP/PD
Oil & Grease mg/L -- 10 -- -- WQS
Ammonia mg/L - - - - - - - - - - - - Monitor - - - - - - - - - - - - EP/BTJ
Total Kjeldahl Nitrogen mg/L - - - - - - - - - - - - Monitor - - - - - - - - - - - - EP/BTJ
Nitrate+Nitrite mg/L - - - - - - - - - - - - Monitor - - - - - - - - - - - - EP/BTJ
Phosphorus mg/L 1.0 1.5d 83 125d PTS
Orthophosphate mg/L - - - - - - - - - - - - Monitor - - - - - - - - - - - - BTJ
Nickel µg/L - - - - - - - - - - - - Monitor - - - - - - - - - - - - EP
Silver µg/L - - - - - - - - - - - - Monitor - - - - - - - - - - - - RP
Zinc µg/L - - - - - - - - - - - - Monitor - - - - - - - - - - - - EP
Cadmium µg/L - - - - - - - - - - - - Monitor - - - - - - - - - - - - EP
Lead µg/L - - - - - - - - - - - - Monitor - - - - - - - - - - - - EP
Chromium µg/L - - - - - - - - - - - - Monitor - - - - - - - - - - - - EP
Copper µg/L -- 38 -- 3.17 WLA Hexavalent Chromium (Dissolved) µg/L - - - - - - - - - - - Monitor - - - - - - - - - - - -
EP
E. coli #/100 mL 126 284d -- -- WQS
Flow Rate MGD - - - - - - - - - - - - Monitor - - - - - - - - - - - - Mc
Chlorine, Total Residual
Summer mg/L -- 0.038 -- -- EP/PD
Winter mg/L - - - - - - - - - - - - Monitor - - - - - - - - - - - - PD
Mercury ng/L 6.0 1700 0.0005 0.142 VAR
Cyanide, Free µg/L - - - - - - - - - - - - Monitor - - - - - - - - - - - - EP
Acute Toxicity
Ceriodaphnia dubia TUa - - - - - - - - - - - - Monitor - - - - - - - - - - - - WET
Pimephales promelas TUa - - - - - - - - - - - - Monitor - - - - - - - - - - - - WET
pH S.U. 6.0 - 9.0 -- -- WQS
Total Filterable Residue mg/L - - - - - - - - - - - - Monitor - - - - - - - - - - - - BTJ
Carbonaceous Biochemical Oxygen Demand (5 day) mg/L 15 23d 1249 1915d PD a Effluent loadings based on average design discharge flow of 22 MGD. b Definitions: BTJ = Best Technical Judgment EP = Existing Permit M = Division of Surface Water NPDES Permit Guidance 1: Monitoring frequency requirements for Sanitary
Discharges PD = Plant Design, OAC 3745-33-05(E)

Fact Sheet for NPDES Permit Renewal, Euclid WWTP, 2015
Page 38 of 41
PTS = Phosphorus Treatment Standards (OAC 3745-33-06 (C)) RP = Reasonable Potential for requiring water quality-based effluent limits and monitoring requirements in
permits (3745-33-07(A)) VAR = Mercury variance (OAC 3745-33-07(D)(10)(a)) WET = Whole Effluent Toxicity (OAC 3745-33-07(B)) WLA = Wasteload Allocation procedures (OAC 3745-2) WQS = Ohio Water Quality Standards (OAC 3745-1) c Monitoring of flow and other indicator parameters is specified to assist in the evaluation of effluent quality and treatment plant
performance. d 7 day average limit.

Fact Sheet for NPDES Permit Renewal, Euclid WWTP, 2015
Page 39 of 41
Table 16. Final Effluent Limits for Outfall 001
Concentration Loading (kg/day)a
30 Day Daily 30 Day Daily Parameter Units Average Maximum Average Maximum Basisb
Water Temperature °C - - - - - - - - - - - - Monitor - - - - - - - - - - - - Mc
Dissolved Oxygen mg/L - - - - - - - - - - - - Monitor - - - - - - - - - - - - Mc
Total Suspended Solids mg/L 12 18d 999 1499d PD
Oil & Grease mg/L -- 10 -- -- WQS
Ammonia mg/L - - - - - - - - - - - - Monitor - - - - - - - - - - - - EP/BTJ
Total Kjeldahl Nitrogen mg/L - - - - - - - - - - - - Monitor - - - - - - - - - - - - EP/BTJ
Nitrate+Nitrite mg/L - - - - - - - - - - - - Monitor - - - - - - - - - - - - EP/BTJ
Phosphorus mg/L 1.0 1.5d 83 125d PTS
Orthophosphate mg/L - - - - - - - - - - - - Monitor - - - - - - - - - - - - BTJ
Nickel µg/L - - - - - - - - - - - - Monitor - - - - - - - - - - - - EP
Silver µg/L - - - - - - - - - - - - Monitor - - - - - - - - - - - - RP
Zinc µg/L - - - - - - - - - - - - Monitor - - - - - - - - - - - - EP
Cadmium µg/L - - - - - - - - - - - - Monitor - - - - - - - - - - - - EP
Lead µg/L - - - - - - - - - - - - Monitor - - - - - - - - - - - - EP
Chromium µg/L - - - - - - - - - - - - Monitor - - - - - - - - - - - - EP
Copper µg/L -- 38 -- 3.17 WLA Hexavalent Chromium (Dissolved) µg/L
- - - - - - - - - - - Monitor - - - - - - - - - - - - EP
E. coli #/100 mL 126 284d -- -- WQS
Flow Rate MGD - - - - - - - - - - - - Monitor - - - - - - - - - - - - Mc
Mercury ng/L 6.0 1700 0.0005 0.142 VAR
Cyanide, Free µg/L - - - - - - - - - - - - Monitor - - - - - - - - - - - - EP
Acute Toxicity
Ceriodaphnia dubia TUa -- 1.0 -- -- WET
Pimephales promelas TUa -- 1.0 -- -- WET
pH S.U. 6.0 - 9.0 -- -- WQS
Total Filterable Residue mg/L - - - - - - - - - - - - Monitor - - - - - - - - - - - - BTJ
Carbonaceous Biochemical Oxygen Demand (5 day) mg/L 10 15d 833 1249d PD a Effluent loadings based on average design discharge flow of 22 MGD. b Definitions: BTJ = Best Technical Judgment EP = Existing Permit M = Division of Surface Water NPDES Permit Guidance 1: Monitoring frequency requirements for Sanitary
Discharges PD = Plant Design, OAC 3745-33-05(E) PTS = Phosphorus Treatment Standards (OAC 3745-33-06 (C)) RP = Reasonable Potential for requiring water quality-based effluent limits and monitoring requirements in

Fact Sheet for NPDES Permit Renewal, Euclid WWTP, 2015
Page 40 of 41
permits (3745-33-07(A)) VAR = Mercury variance (OAC 3745-33-07(D)(10)(a)) WET = Whole Effluent Toxicity (OAC 3745-33-07(B)) WLA = Wasteload Allocation procedures (OAC 3745-2) WQS = Ohio Water Quality Standards (OAC 3745-1) c Monitoring of flow and other indicator parameters is specified to assist in the evaluation of effluent quality and treatment plant
performance. d 7 day average limit.
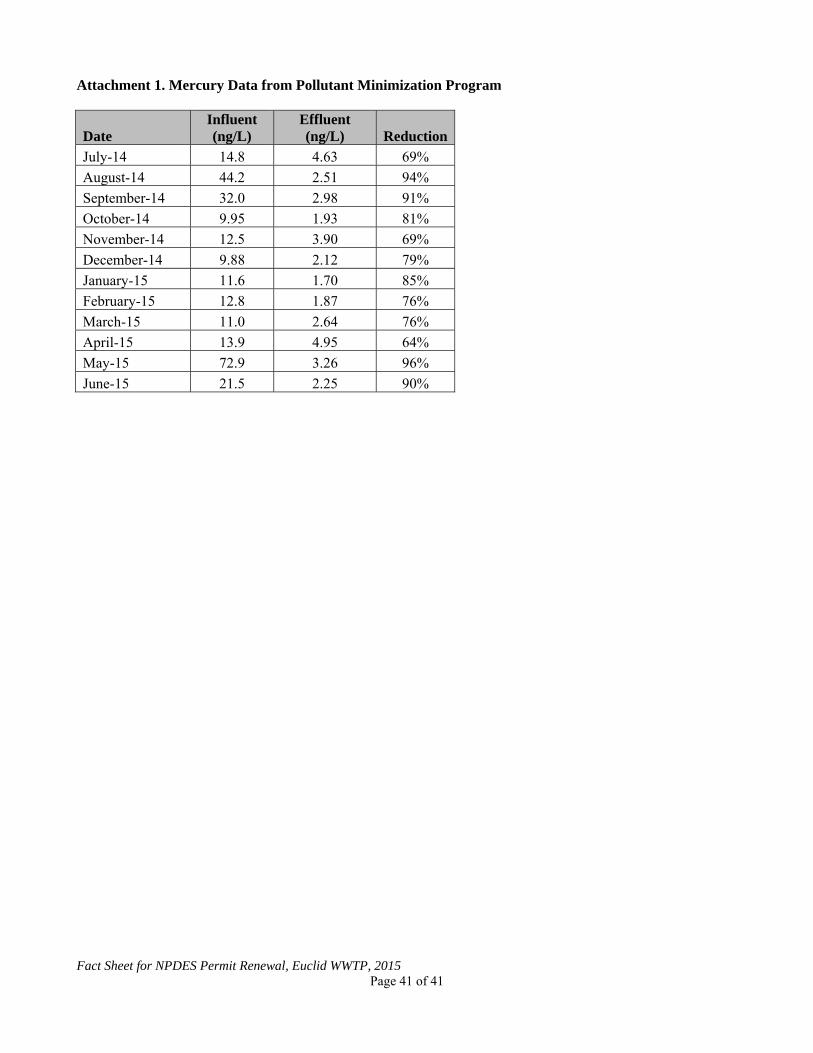
Fact Sheet for NPDES Permit Renewal, Euclid WWTP, 2015
Page 41 of 41
Attachment 1. Mercury Data from Pollutant Minimization Program
Date Influent (ng/L)
Effluent (ng/L) Reduction
July-14 14.8 4.63 69%
August-14 44.2 2.51 94%
September-14 32.0 2.98 91%
October-14 9.95 1.93 81%
November-14 12.5 3.90 69%
December-14 9.88 2.12 79%
January-15 11.6 1.70 85%
February-15 12.8 1.87 76%
March-15 11.0 2.64 76%
April-15 13.9 4.95 64%
May-15 72.9 3.26 96%
June-15 21.5 2.25 90%