factor affecting faculty attitudes towards open …/67531/metadc974448/m2/1/high... · factors...
TRANSCRIPT
FACTORS AFFECTING FACULTY ATTITUDES TOWARDS OPEN ACCESS INSTITUTIONAL REPOSITORIES (OA IR): UNT CASE STUDY
Ahmet Meti Tmava
PhD Candidate, College of Information
Multidisciplinary Information Research Symposium
University of North Texas
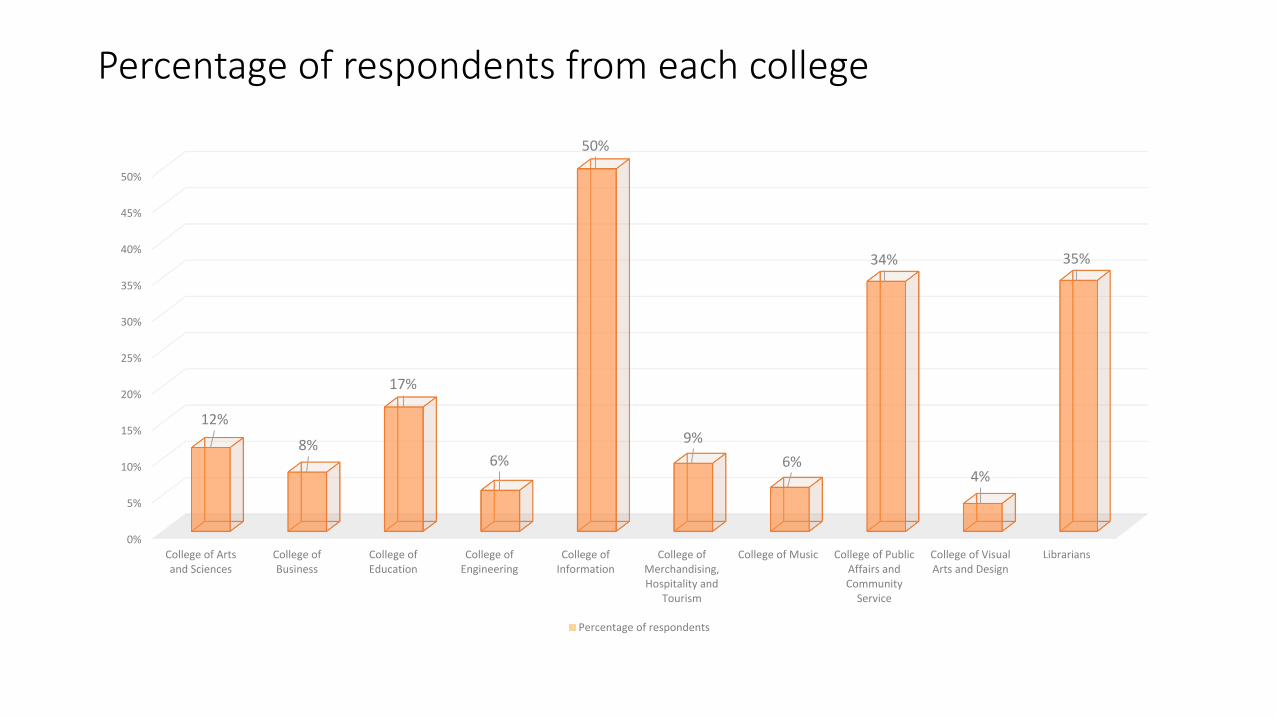
Percentage of respondents from each college
0%
5%
10%
15%
20%
25%
30%
35%
40%
45%
50%
College of Artsand Sciences
College ofBusiness
College ofEducation
College ofEngineering
College ofInformation
College ofMerchandising,Hospitality and
Tourism
College of Music College of PublicAffairs andCommunity
Service
College of VisualArts and Design
Librarians
12%
8%
17%
6%
50%
9%
6%
34%
4%
35%
Percentage of respondents
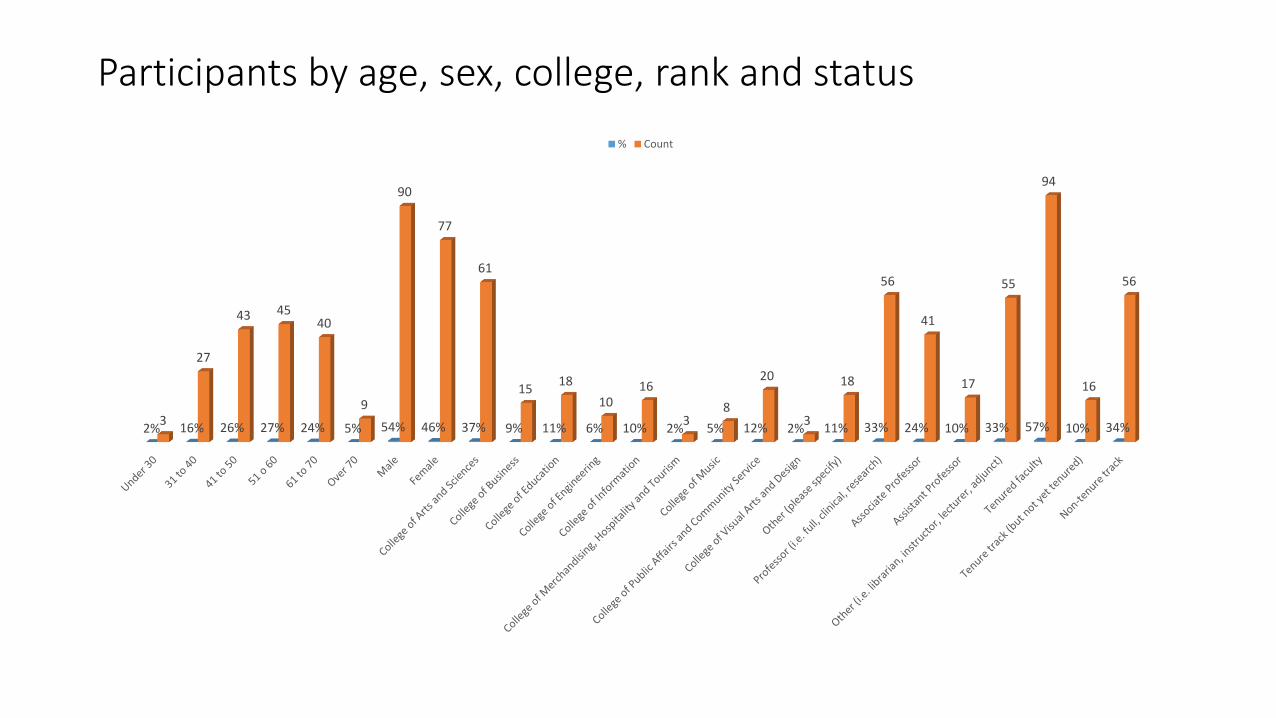
Participants by age, sex, college, rank and status
2% 16% 26% 27% 24% 5% 54% 46% 37% 9% 11% 6% 10% 2% 5% 12% 2% 11% 33% 24% 10% 33% 57% 10% 34%3
27
43 4540
9
90
77
61
1518
1016
38
20
3
18
56
41
17
55
94
16
56
% Count
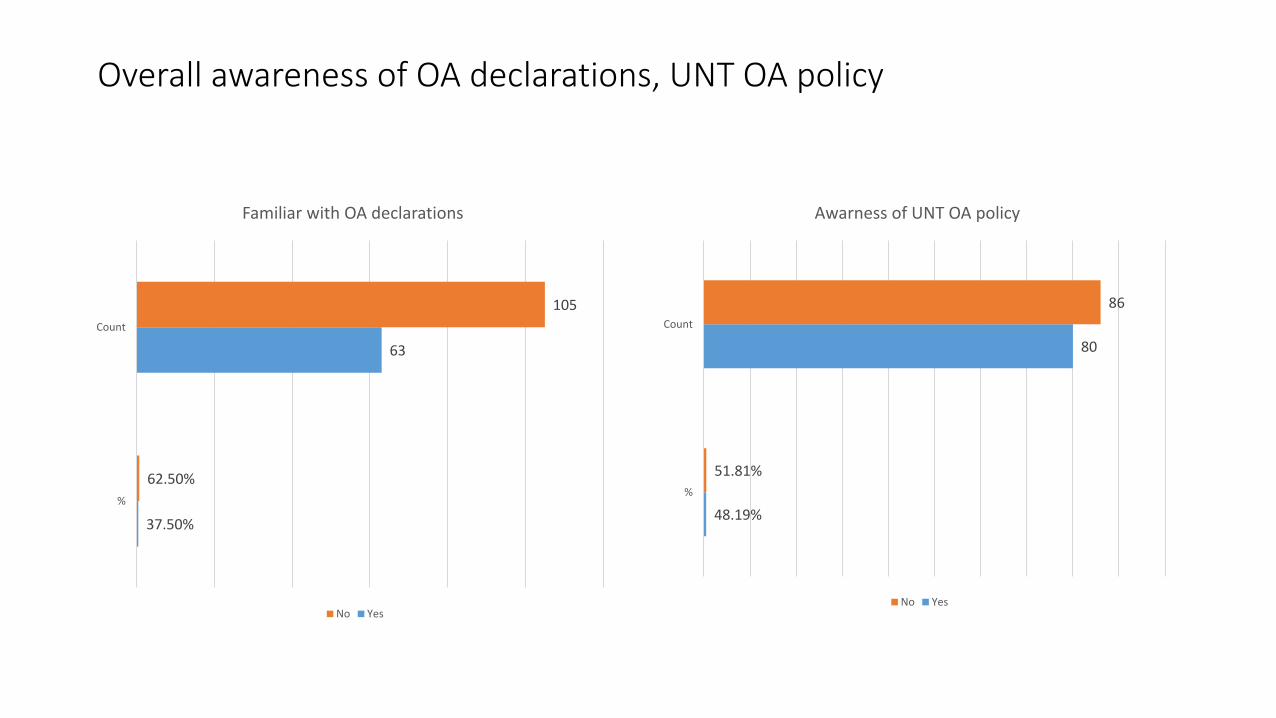
Overall awareness of OA declarations, UNT OA policy
37.50%
63
62.50%
105
%
Count
Familiar with OA declarations
No Yes
48.19%
80
51.81%
86
%
Count
Awarness of UNT OA policy
No Yes
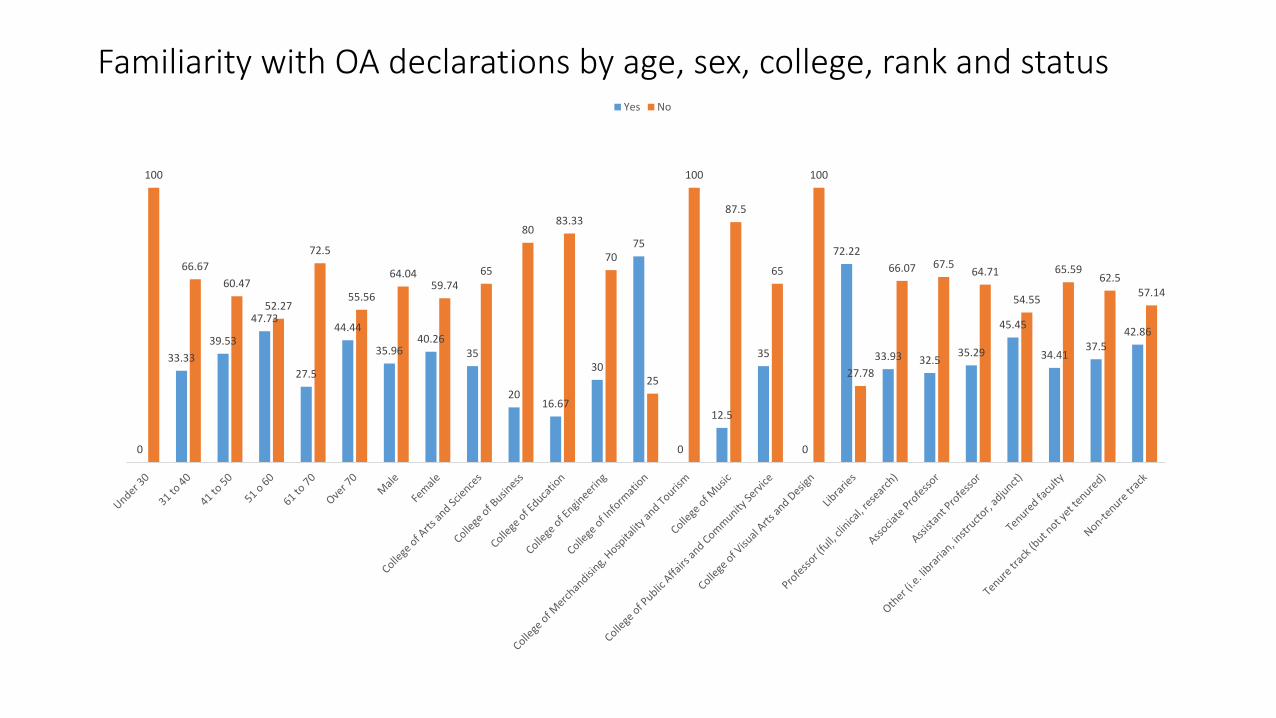
Familiarity with OA declarations by age, sex, college, rank and status
0
33.33
39.53
47.73
27.5
44.44
35.9640.26
35
2016.67
30
75
0
12.5
35
0
72.22
33.93 32.535.29
45.45
34.4137.5
42.86
100
66.67
60.47
52.27
72.5
55.56
64.0459.74
65
8083.33
70
25
100
87.5
65
100
27.78
66.07 67.564.71
54.55
65.5962.5
57.14
Yes No
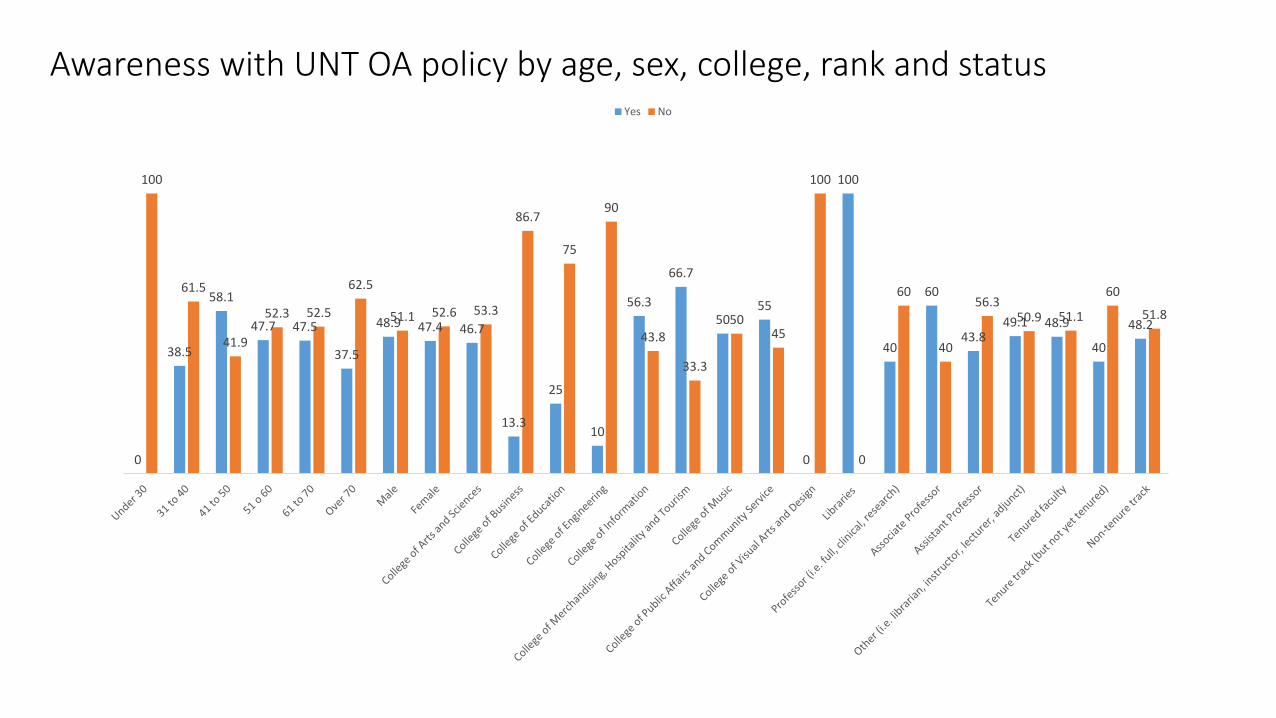
Awareness with UNT OA policy by age, sex, college, rank and status
0
38.5
58.1
47.7 47.5
37.5
48.9 47.4 46.7
13.3
25
10
56.3
66.7
5055
0
100
40
60
43.849.1 48.9
40
48.2
100
61.5
41.9
52.3 52.5
62.5
51.1 52.6 53.3
86.7
75
90
43.8
33.3
5045
100
0
60
40
56.350.9 51.1
60
51.8
Yes No
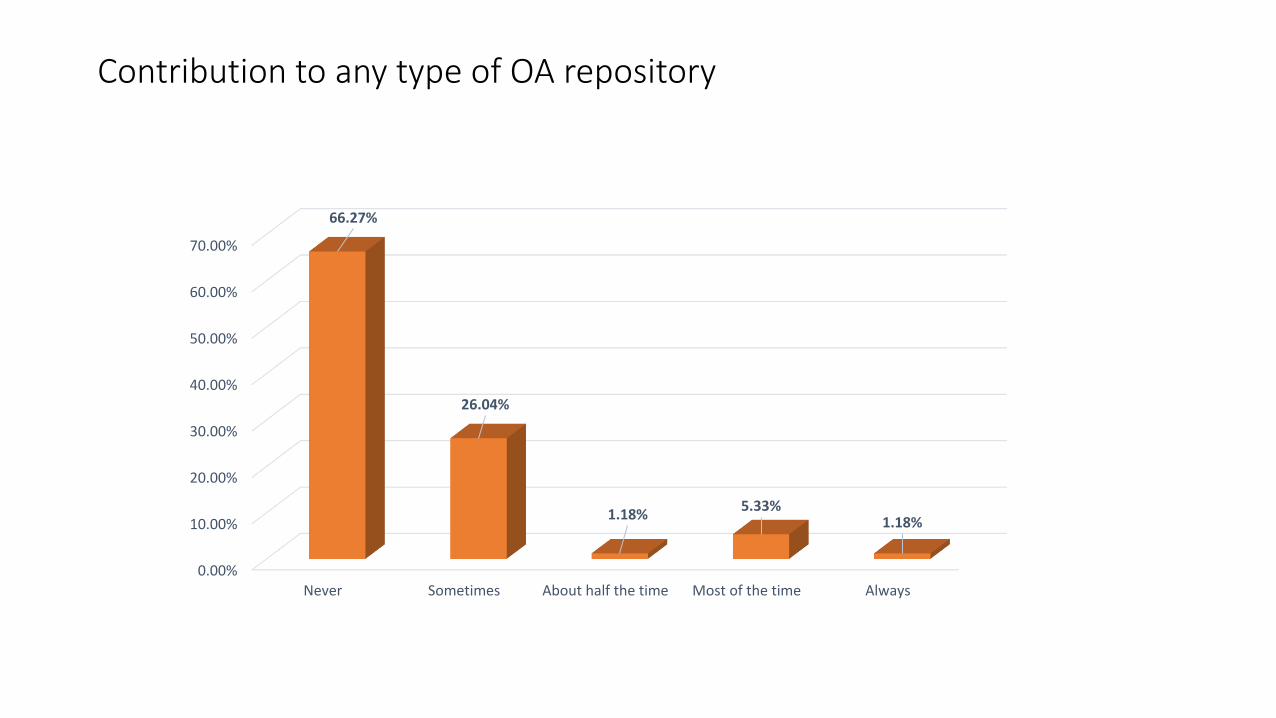
Contribution to any type of OA repository
0.00%
10.00%
20.00%
30.00%
40.00%
50.00%
60.00%
70.00%
Never Sometimes About half the time Most of the time Always
66.27%
26.04%
1.18%5.33%
1.18%

Theoretical framework for the study
Attitude towards participation
Perceived copyright concerns Perceived plagiarism issues Perceived technical barriers Perceived as low quality Perceived concerns about time
Influence of subjective norms on faculty participation Altruism Academic reward Academic culture &
collaboration Discoverability and ease of
access
Perceived control for
participation Self-efficacy Controllability
Behavioral Intentions
Self-reported
Intrinsic factors Altruism
Contextual factors Academic reward Peer-pressure Communication with
peers
Individual traits Rank Number of publications Age Technical skills
Theory of Planned Behavior
Extrinsic factors Academic reward Professional recognition Accessibility Publicity Trustworthiness
Cost Additional time & effort Copyright concerns
Model of faculty self-archiving behavior Predictor variables
Outcome Variable
Intent to deposit or NOT to deposit
Mea
sure
d b
y
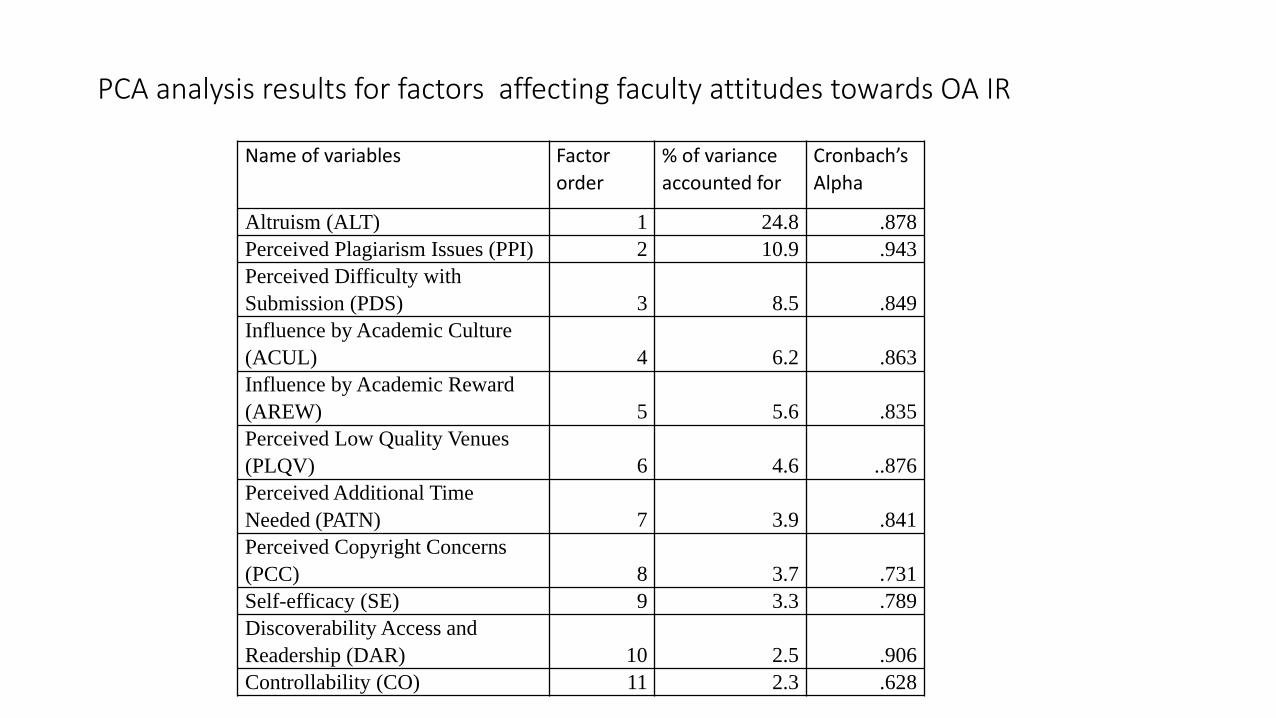
PCA analysis results for factors affecting faculty attitudes towards OA IR
Name of variables Factor
order
% of variance
accounted for
Cronbach’s
Alpha
Altruism (ALT) 1 24.8 .878
Perceived Plagiarism Issues (PPI) 2 10.9 .943
Perceived Difficulty with
Submission (PDS) 3 8.5 .849
Influence by Academic Culture
(ACUL) 4 6.2 .863
Influence by Academic Reward
(AREW) 5 5.6 .835
Perceived Low Quality Venues
(PLQV) 6 4.6 ..876
Perceived Additional Time
Needed (PATN) 7 3.9 .841
Perceived Copyright Concerns
(PCC) 8 3.7 .731
Self-efficacy (SE) 9 3.3 .789
Discoverability Access and
Readership (DAR) 10 2.5 .906
Controllability (CO) 11 2.3 .628
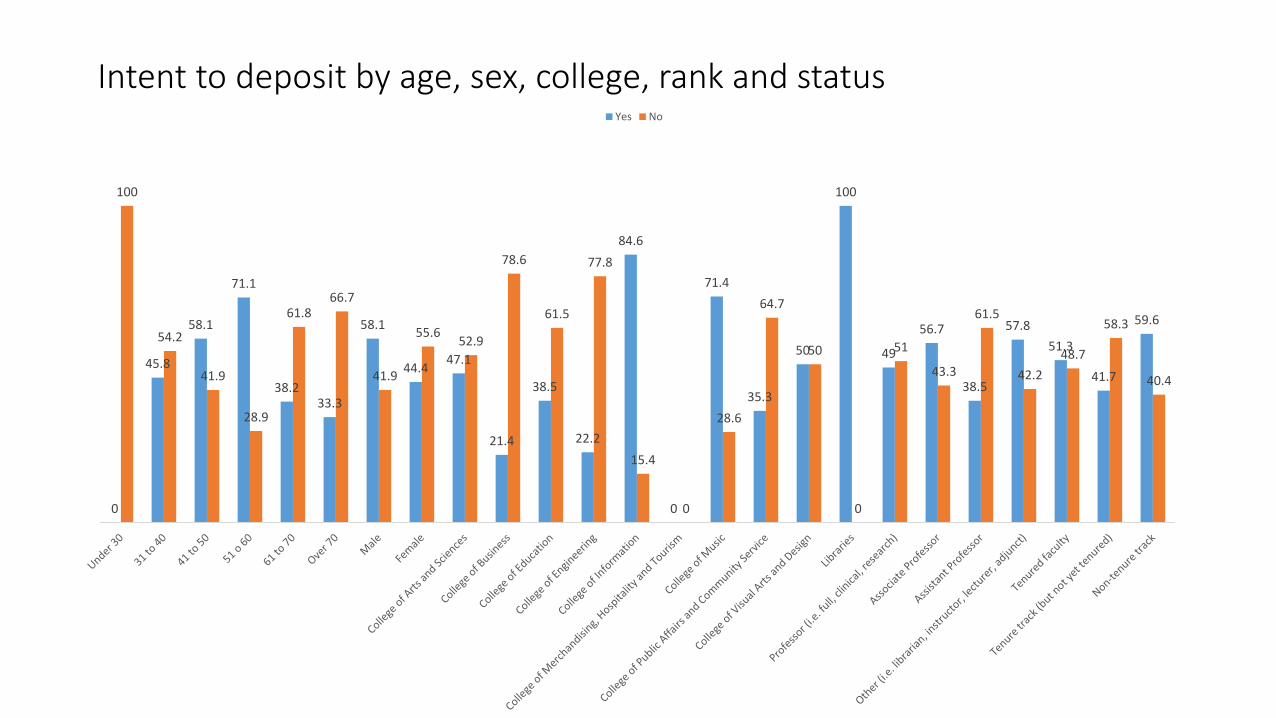
Intent to deposit by age, sex, college, rank and status
0
45.8
58.1
71.1
38.233.3
58.1
44.447.1
21.4
38.5
22.2
84.6
0
71.4
35.3
50
100
49
56.7
38.5
57.8
51.3
41.7
59.6
100
54.2
41.9
28.9
61.866.7
41.9
55.652.9
78.6
61.5
77.8
15.4
0
28.6
64.7
50
0
51
43.3
61.5
42.2
48.7
58.3
40.4
Yes No
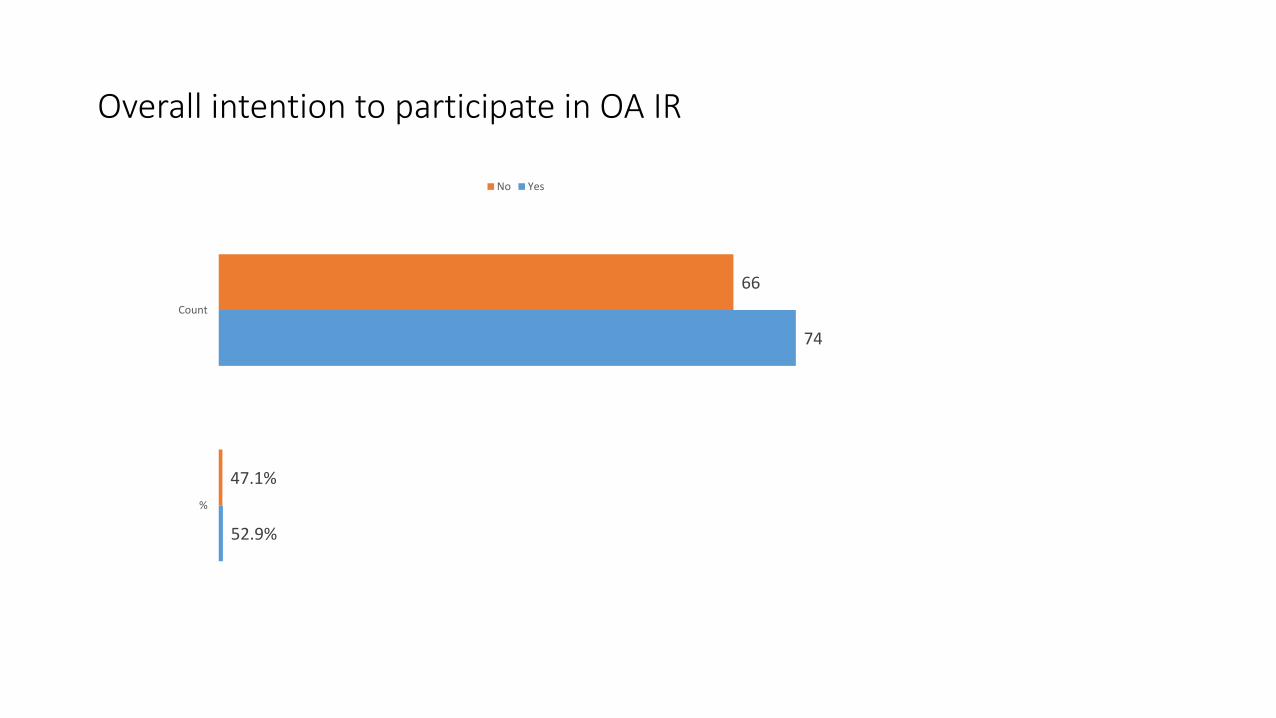
Overall intention to participate in OA IR
52.9%
74
47.1%
66
%
Count
No Yes

THANK YOU!
Questions & Comments