factor endowment and market size in eu-cee trade: …ftp.iza.org/dp1139.pdf · factor endowment and...
TRANSCRIPT

IZA DP No. 1139
Factor Endowment and Market Sizein EU-CEE Trade. Would Human CapitalChange the Actual Quality Trade Patterns?
Anna Maria FerraginaFrancesco Pastore
DI
SC
US
SI
ON
PA
PE
R S
ER
IE
S
Forschungsinstitutzur Zukunft der ArbeitInstitute for the Studyof Labor
May 2004
Factor Endowment and Market Size
in EU-CEE Trade: Would Human Capital Change the Actual Quality Trade Patterns?
Anna Maria Ferragina University Tor Vergata, Rome
Francesco Pastore Seconda Università di Napoli
and IZA Bonn
Discussion Paper No. 1139 May 2004
IZA
P.O. Box 7240 53072 Bonn
Germany
Phone: +49-228-3894-0 Fax: +49-228-3894-180
Email: [email protected]
Any opinions expressed here are those of the author(s) and not those of the institute. Research disseminated by IZA may include views on policy, but the institute itself takes no institutional policy positions. The Institute for the Study of Labor (IZA) in Bonn is a local and virtual international research center and a place of communication between science, politics and business. IZA is an independent nonprofit company supported by Deutsche Post World Net. The center is associated with the University of Bonn and offers a stimulating research environment through its research networks, research support, and visitors and doctoral programs. IZA engages in (i) original and internationally competitive research in all fields of labor economics, (ii) development of policy concepts, and (iii) dissemination of research results and concepts to the interested public. IZA Discussion Papers often represent preliminary work and are circulated to encourage discussion. Citation of such a paper should account for its provisional character. A revised version may be available on the IZA website (www.iza.org) or directly from the author.

IZA Discussion Paper No. 1139 May 2004
ABSTRACT
Factor Endowment and Market Size in EU-CEE Trade: Would Human Capital Change the Actual Quality Trade Patterns?∗
This paper aims to test several hypotheses on the determinants of the quality of trade in cross-country regressions, taking a sample of trade competitors in EU markets. The hypotheses are those underlying two models of VIIT: the so-called neo-H-O model based on factor endowment and an “economic geography” model based on market size and economic integration. As the explanatory variables used (proxies for human capital, physical capital, market size and a dummy for market integration) significantly affect the dependent variable (unit-value differences), it seems plausible to conclude that these variables give rise to specialisation in different segments of the quality spectrum. Much information is drawn from the analysis with respect to CEE specialisation in low-quality exports to EU markets. In particular, the estimates suggest the existence of a process of “crowding out” of the existing human capital due to the process of economic transition. Moreover, the smaller market size of the EU accession countries could contribute to strengthen the disadvantage in high quality segments of production. In fact, the significant coefficient of the variable used to measure market size suggests that liberalisation might be accompanied by increased concentration of high-quality productions in large markets. However, the geographic proximity to the core of Europe could counterbalance this force. The integration process itself could accelerate the process of catching up in terms of quality of products and of per capita income, providing Eastern producers with a larger market and potential for economies to scale. JEL Classification: F10, J30, P23 Keywords: quality product differentiation, human capital endowment and human capital
“crowding out”, economic geography, economic integration Corresponding author: Francesco Pastore Seconda Università di Napoli Via Mazzocchi 5 81056 Santa Maria Capua Vetere (CE) Italy Tel./Fax: +39 815 495 276 Email: [email protected]
∗ This paper is the result of a research carried out at the University of Sussex, UK. The authors wish to gratefully thank Alasdair Smith for detailed comments. He has also provided the data elaborated by Landesmann and Burgstaller (Wien Institute for Comparative Economic Studies) essential for the empirical part. We also thank Mariano D’Antonio and Johan Swinnen for stimulating discussions. A previous version of the paper was presented in a session of the seminar cycle of the Policy Research Group, at the Katholieke Universiteit of Leuven, Belgium. Many thanks are due to all participants. This notwithstanding, the usual disclaimer applies.

Introduction Changes in pattern of trade of Eastern Europe have profoundly affected the European
economies given their magnitude and the geographical proximity of the areas. Predictions regarding the employment and distribution effects of CEE-EU trade, also in view of the Eastward enlargement of the Union, draw two opposite scenarios. One looks at factor endowment differentials between the two partners and predicts that specialisation in the exchange of goods with different factor intensity may constitute the main pattern of trade, with possible loss of income and employment concentrated in the labour intensive sectors and in the less favoured regions of the EU. Another view suggests a different process of transition due to the peculiar factor endowment of CEECs and to other factors. In fact, the CEECs may hardly be compared with under-developed countries because of a consistent industrial capacity and capital accumulation. Moreover, the geographic proximity with the core of Europe, the lower level of wages and the large stock of human capital might provide a large scope for rapid growth in IIT making less dramatic the consequences of economic integration (CEPR, 1990).
Recent works have provided some evidence on CEE-EU trade, suggesting some uncontroversial facts (CEPR, 1990; Hamilton-Winters, 1992; Halpern, 1994; Neven, 1995; Smith and Dràbek, 1995; Landesmann and Burgstaller, 1997; Landesmann and Fersterer, 1998; Hoekman and Djankov, 1997; Aturupane C. et alias, 1997; Boylaud and Martins, 1998; Ferragina, 2003):
1 - inter-industry trade is a sizeable component - 50 through 70 per cent circa in 1995 - of CEE-EU trade. Studies based on the analysis of revealed comparative advantages have shown that CEECs specialisation lies mainly in production based on labour and natural resources and, even if less strongly, in physical capital intensive sectors, whereas exports in R&D activities lag behind;
2 - however, since the beginning of transition, IIT has been growing at a fast pace, and some countries such as Hungary, Slovenia and Czech Republic show the highest shares of IIT among all the internal and external EU partners;
3 - the existing IIT is not necessarily a sign of similarity of trade between East and West Europe: the very bulk, from 80 to 90 per cent, of total IIT is of a vertical kind, involving the exchange of goods belonging to the same industry but of different quality. This shows again a certain specialisation of the CEECs in low-value added segments;
4 - even interpreting the figures with caveats, they show that the human capital stock in the CEECs is much closer to Northern than to Southern countries;
5 - the CEECs do not represent a homogeneous group of countries, but show relevant internal differences, such that a differentiation between at least two groups is needed: the first, include the Visegrad countries plus Slovenia, the second includes Bulgaria, Romania, the Slovak Republic and Russia.
These facts suggest that even if a traditional H-O trade is not being observed, still factor endowment forces are at work, hidden behind the high shares of IIT registered. Therefore, greater attention should be devoted to the distinction between horizontal and vertical intra-industry trade due to the fact that their relative evolution is an important indicator of the extent to which the Cheeks are similar to the EU.
As pointed out, among others, in Abd-el-Rahman (1991) and Greenaway, Hine and Milner (1995), important differences exist in general in the determinants and the effects of the two types of patterns. In principle, only HIIT is to be referred to the IIT predicted by the so-called “new trade theories”. VIIT, instead, depends mainly on factor endowment differences and is far from being neutral in terms of distribution.
The aim of this contribution is to offer evidence on the determinants of quality product differentiation in CEE-EU IIT, in terms of factor endowment and market size. A special attention has been devoted to human capital endowment, for as noted before, since the beginning of the East-West integration process, this variable has been object of careful consideration in the literature and in the policy debate. In fact, in the reinforced version of the pre-accession strategy, envisaged in Agenda 2000 (COM, 1997), to prepare the candidate countries for membership, the renewal and upgrading of the CEE “administrative capacity” and especially its human component was a key element.
The dependent variable used in various cross-country regressions is a price gap index, as computed by Landesmann and Burgstaller (1997). This provides a proxy for quality differentiation
relative to EU trade with thirty-two EU trade competitors1, over the period 1988-1994, for selected industries belonging to three sectors - food, engineering and textile - featured by a different degree of capital to labour ratio.
The price-quality gap index has been used to disentangle HIIT and VIIT and to enlighten the relative productivity and efficiency of CEE exports over the transition period. The simple observation of the relative values of the indices shows a separation of the CEECs into two groups, called here CEECs1 and CEECs2 (see tab. A.2). The dualism is almost exactly corresponding to that proposed in COM (1997) and adopted by the European Council of Luxembourg to distinguish which of the candidate countries will be admitted to the first and which to the second wave of accession negotiations2.
A proxy for human capital (tertiary education attainment) has been included as a possible explanatory variable for the quality differentiation of trade, together with the capital to labour ratio, traditionally used in factor proportion models of VIIT, also called neo-Heckscher-Ohlin models (Falvey, 1981; Falvey and Kierzkowski, 1987).
In addition, a proxy for market size and a dummy for European integration have also been used as a broad test of some propositions stemming from the economic geography literature (Helpman and Krugman, 1985; Krugman and Venables, 1995).
We believe that the approach of studying the determinants of CEE-EU IIT may provide relevant information regarding the employment and distribution effects of the economic integration between the two areas. The outcomes of the analysis seem to suggest that specialisation is still to be considered the driving force of IIT. Nonetheless, factors such as the presence of an important stock of human capital and the proximity to the most industrialised regions of the EU may play an important role in accelerating the convergence in quality of productions.
The paper is organised as follows. Section 1 focuses on the evidence on quality product differentiation. Section 2 reviews the discussion on human capital endowment in the CEECs. Section 3 presents some theoretical models of the determinants of quality differentiated trade. Section 4 introduces the estimates and discuss the results. A short summary of the main findings concludes.
1 - Evidence on vertical product differentiation in CEE-EU trade
1.1 - Previous contributions The Grubel-Lloyd index has been employed by Smith and Drabek (1995) to detect the growing
share of IIT in CEE-EU relations. Table 1 shows the evolution of IIT at the 3-digit Nace, distinguishing across some Eastern European countries and some NICs: the level of IIT with the EU are higher for the CEECs than for Singapore, Taiwan and South Korea, besides it has remarkably increased between 1988 and 1993.
Tab. 1 - Intra-industry trade with the EU (1988-1993)
1 The CEECs included are: Poland, Czech Republic, Hungary, Yugoslavia/Slovenia, Romania, Bulgaria, Soviet
Union/Russia. In addition to the CEECs, the other considered competitors (or groups of competitors) are: Usa, Japan, Canada, Switzerland, Turkey, EU-North/EFTA countries (Germany, France, Italy, Belgium-Luxembourg, Netherlands, UK, Ireland, Finland, Sweden, Denmark, Austria), EU-South countries (Spain, Greece, Portugal), NIC1 (Taiwan, Hong-Kong, Singapore, Korea), NIC2 (Indonesia, Thailand, Philippines, Malaysia), China, India.
2 Actually, the group of countries identified as CEECs1 does not include Estonia, which the Commission considered ready to start negotiations already in the mid-1990s (COM, 1997). In the same document, the Commission expressed the opinion that other five EAs countries were not ready yet and could only start the negotiations as far as they corrected their deficiencies with respect to the Copenhagen criteria (Slovakia on political ground and Bulgaria, Romania, Latvia and Lithuania on economic ground). The group CEECs2, while including Romania and Bulgaria, excludes the other three and, in addition, incorporates Soviet Union/Russia, a country which is not2 included among the ones joining the EU together with the South-eastern Europe (Albania, Croatia, Macedonia, Bosnia and new-Yugoslavia) and the former Soviet Union Republics. Over the years, the European Union has changed her view regarding Slovakia, Latvia and Lithuania, leaving out of the first round of accessions Bulgaria and Romania only.

1988 1989 1990 1991 1992 1993 POLAND 0.38 0.42 0.39 0.40 0.42 0.45 CSFR 0.46 0.46 0.47 0.50 0.53 0.59 HUNGARY 0.48 0.49 0.50 0.52 0.52 0.55 SINGAPORE 0.38 0.38 0.40 0.41 0.39 0.36 SOUTH KORE 0.27 0.28 0.30 0.29 0.34 0.34 TAIWAN 0.32 0.35 0.38 0.38 0.37 0.37
Source: Dràbek & Smith, CEPR, 1995, p. 28, COMEXT data.
Indeed, the Grubel-Lloyd figures should be interpreted cautiously. In fact, as often pointed out,
3-digit could be a too low level of disaggregation. Nonetheless, Landesmann and Burgstaller (1997) find a relevant IIT share in CEE-EU trade even at 8-digit industry level.
A stronger reason for caution is that the Grubel-Lloyd index does not allow controlling whether trade within a sector is between goods embodying the same level of technology and know-how. In other words, the figures could conceal real differences in the nature and quality of the products traded. While, in general, high levels of IIT are typical of trade in differentiated products between advanced countries, in the case of the CEECs, instead, a careful analysis of the nature of IIT might reveal that much of it entails trade between low-skill ad high-skill products. Such vertical IIT (VIIT) may be more important, especially with the Northern Europe, than exchanges of similar goods driven by economies to scale and demand for variety as according to the textbook explanation of IIT (Smith and Drabek, 1995). The computations shown in Neven (1995) support similar conclusions3.
The limits of the Grubel-Lloyd has led to consider other units of measurement able to disentangle the different components of IIT. Using unit values indices, Smith and Drabek (1995) find evidence of a weak position of CEE productions on EU markets. The unit values indices also measure changes in the structure of IIT. For instance, the authors observe a marked decline in the unit values of CEE exports to the EU (especially for Poland and the Czechoslovak Republic) suggesting a fall in the quality of Eastern exports to the EU.
1.2 - The price-quality gap index Further evidence on vertical product differentiation in CEE-EU trade will be presented in the
next section based on a particular index of quality product differentiation, PGjh, computed by Landesmann and Burgstaller (1997) using EUROSTAT Detailed Trade Statistics relative to the period from 1988 to 1994. Since such index has been used as dependent variable in the econometric analysis, it will be discussed in some detail.
PGjh equals the sum of the ratios between the prices at which the n items i, belonging to the same industry, I(h), are exported to EU markets, and the average price of the same item in total EU imports, pEU,i weighted by the share of the same product item in total country c’s exports to the EU, sxj,i (see Tab. A.1 in the Appendix for further details):
( )PGp
psx i I hjh
j i
EU ij i=
∗ ∈ =Σ Σ,
,, ; sx ji 1 [1]
The index is exposed to some criticisms. First of all, the assumption that quality is reflected in prices and that price gaps are a measure of quality gaps may be partly confuted. However, such an assumption is largely found in the trade literature (Torstensson, 1991; Abd-al-Rahman, 1991; Greenaway-Hine-Milner, 1994; 1995). In fact, as proven in Stiglitz (1987), a variety sold at a higher
3 At the three-digit SITC product level, in Neven’s analysis, the importance of IIT between the CIS and the Eastern
European block of countries (excluding Bulgaria and ex-Jugoslavia) on the one hand, and the EC-12 member states on the other hand, has considerably increased between the two sub-periods 1985-7 and 1990-1992 (average indices have been taken for the years 1985-7 and 1990-1992). However, the IIT refers especially to the less developed South-European countries, such as Spain and Greece, suggesting that Eastern European countries have factor endowments rather similar to those of Southern Europe (Neven D., 1995, p. 38).

price must be of higher quality than a variety sold more cheaply, under the hypothesis of perfect information4.
Secondly, the effect of the level and the fluctuations of the exchange rate could produce a biased value. Nonetheless, Landesmann and Burgstaller (1996) found that “while upward movements in the exchange rate relative to the PPP rate relate in the general sample positively with upward movements in the price/quality position of exporters, such a relationship cannot be found with respect to CEE exporters” (p. 10). Thus, in the case of the CEECs the index does not exhibit a strong correlation with the dramatic exchange rate fluctuations registered. It is not completely clear which role has been played by the dramatic devaluation happened during the first years of the transition process: the relative stability of the index could be seen as a sign of recovery, since the gap is expected to increase, as a consequence of a monetary devaluation. However, it has to be observed that, in case of appreciation, which after the initial devaluation many countries have experienced, the stability of the price gap is evidence of low market power of the Eastern producers on EU markets.
Finally, tariff and non-tariff barriers could be hidden behind prices, giving a misleading measure of quality. For example, the free access to the market for EU member countries is partially responsible for a lower average export price with respect to non-EU members at a similar level of development (market integration effect). The exports of the CEECs to the EU markets has continued to be affected by serious restrictions over the period considered so that the trade barriers are potential distortions of the analysis.
Notwithstanding its shortcomings, PGjh may provide an important insight into EU-CEE trade as well as measures for the changes in economic performance. To such an end, in the following analysis, the index has been used to disentangle the presence of V- and HIIT, applying to it the criterion suggested by Abd-el-Rahman, (1991) and refined by Greenawy-Hine-Milner (1994, 1995), for the unit
value index i.e. UV
UVijx
ijm
5.
It has to be noticed that the indicator used by Landesmann and Burgstaller is based on a different ratio, including at the denominator not the unit value of imports by a given country, but the average price of EU imports for the products of a given industry. This provides information on whether the exports are of a higher quality than imports not with respects to an individual partner but to the EU. It has been observed that in this case it is possible to disentangle between H and VIIT and measure quality product differentiation in a more objective way avoiding the bias coming from assuming a particular country as a term of comparison. In fact, there may be cases in which a given country presents HIIT (VIIT) with respect to a given partner but VIIT (HIIT) with respect to the EU as a whole (Fontagné and Freudenberg, 1997).
The mentioned criterion proposed by Greenaway, Hine and Milner (1994) to detect HIIT consists of setting a threshold value. Following this criterion, if:
1 1− ≤ ≤ +α α G jhP
[2a]
we conclude that there is HIIT. Conversely, if :
PG Pjh < − > +1 1α α or G jh
[2b]
we conclude that there is VIIT, choosing an appropriate value (0.25) for the wedge α. However, the criterion is here applied to a higher level of aggregation, i.e. 3-digit, providing
only average estimates of HIIT and VIIT.
4 However, in presence of asymmetric information and transaction costs prices are only imperfect measures of quality.
Nevertheless, they provide the most accessible source of information about consumer assessments of the qualitative characteristics of the products. Another criticism is that the measure adopted, prices per kg, implies that unit values depend on the heaviness of the goods considered. Unfortunately, unit values per item are only available for a limited range of products.
5 This is the ratio between unit value of exports ( UVijx ) and unit value of imports ( UVij
m ) for a good i belonging to
industry j, computed at 5-digit level of aggregation.
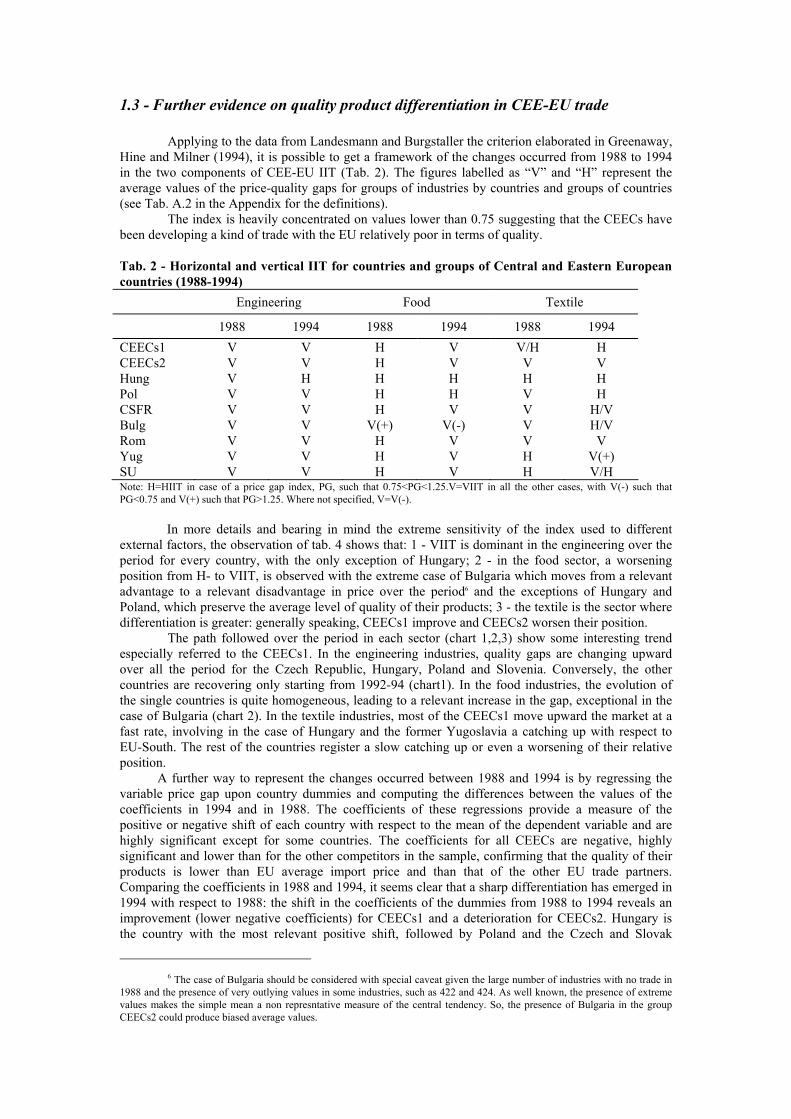
1.3 - Further evidence on quality product differentiation in CEE-EU trade
Applying to the data from Landesmann and Burgstaller the criterion elaborated in Greenaway, Hine and Milner (1994), it is possible to get a framework of the changes occurred from 1988 to 1994 in the two components of CEE-EU IIT (Tab. 2). The figures labelled as “V” and “H” represent the average values of the price-quality gaps for groups of industries by countries and groups of countries (see Tab. A.2 in the Appendix for the definitions).
The index is heavily concentrated on values lower than 0.75 suggesting that the CEECs have been developing a kind of trade with the EU relatively poor in terms of quality. Tab. 2 - Horizontal and vertical IIT for countries and groups of Central and Eastern European countries (1988-1994) Engineering Food Textile
1988 1994 1988 1994 1988 1994 CEECs1 V V H V V/H H CEECs2 V V H V V V Hung V H H H H H Pol V V H H V H CSFR V V H V V H/V Bulg V V V(+) V(-) V H/V Rom V V H V V V Yug V V H V H V(+) SU V V H V H V/H Note: H=HIIT in case of a price gap index, PG, such that 0.75<PG<1.25.V=VIIT in all the other cases, with V(-) such that PG<0.75 and V(+) such that PG>1.25. Where not specified, V=V(-).
In more details and bearing in mind the extreme sensitivity of the index used to different
external factors, the observation of tab. 4 shows that: 1 - VIIT is dominant in the engineering over the period for every country, with the only exception of Hungary; 2 - in the food sector, a worsening position from H- to VIIT, is observed with the extreme case of Bulgaria which moves from a relevant advantage to a relevant disadvantage in price over the period6 and the exceptions of Hungary and Poland, which preserve the average level of quality of their products; 3 - the textile is the sector where differentiation is greater: generally speaking, CEECs1 improve and CEECs2 worsen their position.
The path followed over the period in each sector (chart 1,2,3) show some interesting trend especially referred to the CEECs1. In the engineering industries, quality gaps are changing upward over all the period for the Czech Republic, Hungary, Poland and Slovenia. Conversely, the other countries are recovering only starting from 1992-94 (chart1). In the food industries, the evolution of the single countries is quite homogeneous, leading to a relevant increase in the gap, exceptional in the case of Bulgaria (chart 2). In the textile industries, most of the CEECs1 move upward the market at a fast rate, involving in the case of Hungary and the former Yugoslavia a catching up with respect to EU-South. The rest of the countries register a slow catching up or even a worsening of their relative position.
A further way to represent the changes occurred between 1988 and 1994 is by regressing the variable price gap upon country dummies and computing the differences between the values of the coefficients in 1994 and in 1988. The coefficients of these regressions provide a measure of the positive or negative shift of each country with respect to the mean of the dependent variable and are highly significant except for some countries. The coefficients for all CEECs are negative, highly significant and lower than for the other competitors in the sample, confirming that the quality of their products is lower than EU average import price and than that of the other EU trade partners. Comparing the coefficients in 1988 and 1994, it seems clear that a sharp differentiation has emerged in 1994 with respect to 1988: the shift in the coefficients of the dummies from 1988 to 1994 reveals an improvement (lower negative coefficients) for CEECs1 and a deterioration for CEECs2. Hungary is the country with the most relevant positive shift, followed by Poland and the Czech and Slovak
6 The case of Bulgaria should be considered with special caveat given the large number of industries with no trade in
1988 and the presence of very outlying values in some industries, such as 422 and 424. As well known, the presence of extreme values makes the simple mean a non represntative measure of the central tendency. So, the presence of Bulgaria in the group CEECs2 could produce biased average values.

Republics. Yugoslavia also shows a slightly positive value. Conversely, the former Soviet Union, Bulgaria and Romania register a negative shift (chart 4-8).
Previous studies making a comparison between EU-CEE imports and exports at an aggregate level had found unit values ratios lower than 1 and rapidly decreasing from 1988 (Smith and Drabek, 1995). The increasing price-gaps were explained in terms of the following factors. Firstly, a fall in prices due to increased quantities sold in EU markets (terms of trade effect) was considered. Secondly, a decline in export demand due to the fact that EU markets have not been able to compensate for the loss of the huge demand coming from the former CMEA. Thirdly, a fall in the quality of Eastern exports to EU, as goods once destined to CMEA are now sold on European markets. The third seems to have dominate as the reorientation of trade has mainly consisted of maintaining the old specialisation and composition of trade simply changing the direction (“distressed trade”). It means that the CEECs have conquered a position on EU markets only by means of facing lower prices and in order to sell those commodities which no longer could be sold in the former Comecon. This would suggest that trade liberalisation has been carried out without a systematic and structural industrial restructuring policy (Smith and Drabek, 1995; Faini and Portes, 1995).
The main findings obtained by the analysis of the price gaps calculated for each of the CEECs and for all the industries in the sample pooled together seem consistent with this conclusion (tab. 2). Nevertheless, an analysis per sector shows that behind an apparent static performance, which also the revealed comparative advantage analysis seems to suggest (section 1.1), there are countries and sectors experiencing a process of catching up and others regressing. Some sector specific factors, hence, have also to be considered7.
2 - The role of human capital in CEE-EU trade So far the presence of a strong product specialisation in East-West trade has been enlightened.
This evidence seems not to be consistent with the prediction made in the early stages of the transition, when the endowment of a relevant stock of human capital was considered a key factor of rapid catching up and switching toward the exchange of goods with a content of technology and skills similar to that of EU countries (CEPR, 1990; Hamilton and Winters, 1992; Winters and Wang, 1994). However, a brief review of the main evidence provided by the literature on the amount and composition of human capital in the CEECs shows some controversial facts.
As well known, statistics on human capital present special computation difficulties and problems of interpretation. In addition to general problems, such as the measure of the quality of education and the difficulty of making international comparisons, in the case of the CEECs there are other specific problems, such as the effect on human capital accumulation of the shock produced by transition.
The figures relative to human capital provided in Barro-Lee (1996) and used in the following econometric analysis show that educational attainment in the CEECs and the former SU, measured by three different indicators, was similar or even superior to that of more advanced groups of countries and far from that of the developing countries, traditionally specialised in low-skilled trade (tab. 3).
Tab. 3 - Education attainment by groups of countries (1990)
Country groups1 TYR2 SECC252 HIGHC252
7 There is evidence in the literature of the negative effects played by the EAs tariff and non-tariff barriers especially
relative to the “sensitive” sectors. It is likely that their role has been particularly negative for the food sector where FDI and OPT have not been able to play a compensating role, being quite low in terms of percentage (5% for Poland according to Naujoks and Schmidt, 1994). Conversely, in the textile industry, the role of foreign investors could have been important in crowding out the expected negative effects of protection. FDI could have also affected the interesting performance of the engineering sector.
EU-SOUTH 8.18 12.11 4.49 EU-NORTH 8.49 16.56 8.63 EFTA 7.24 18.34 6.9 CEE 9.01 17.18 8.55 CEE+SU 9.23 18.29 9.04 NIC1 7.63 22.4 6.35 NIC2 4.56 4.15 4.4 1 For the definition of the country groups, see Tab. A.2. 2 For the definition of the variable see Tab. A.1. Source: own computation on Barro-Lee data (1996).
However, Barro-Lee data can be questioned in the light of different sources. Halpern (1995),
for instance, provides a rather different picture, based on national statistics. He suggests that tertiary enrolment ratio in Hungary hardly overcomes the level of Turkey, one of the worst performing OECD countries, and far from being comparable to the NICs is rather close to Chile, Thailand and Mexico.
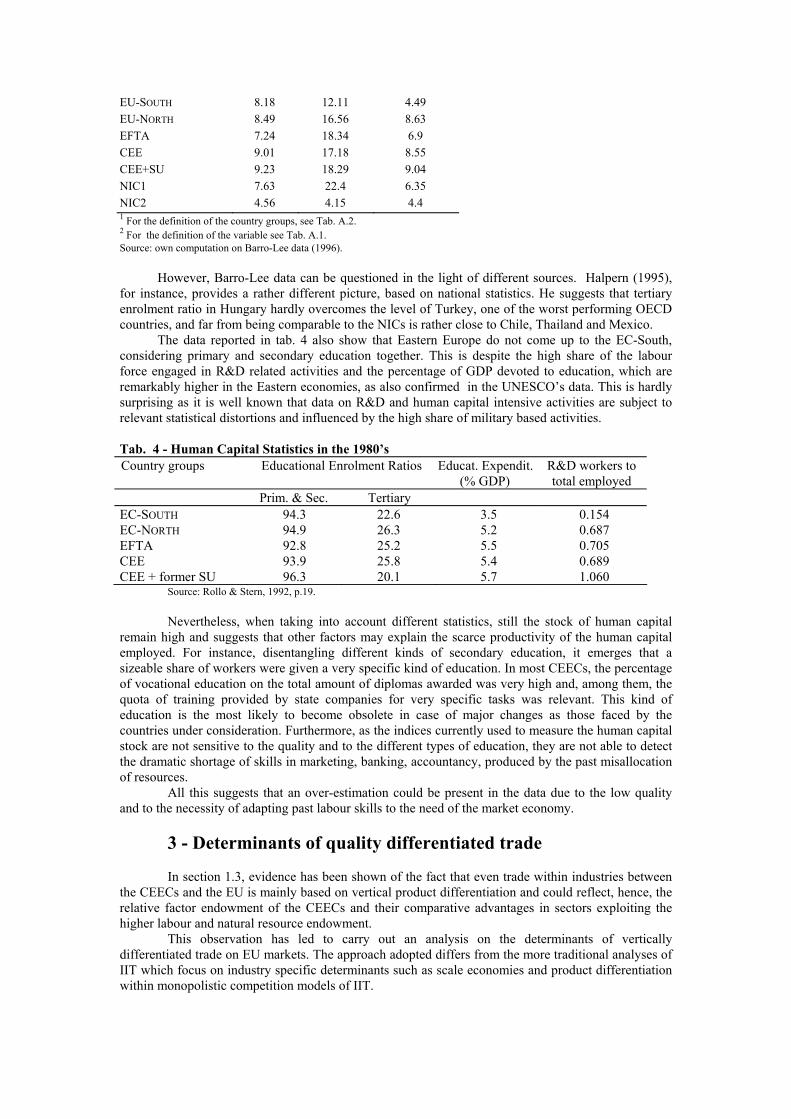
The data reported in tab. 4 also show that Eastern Europe do not come up to the EC-South, considering primary and secondary education together. This is despite the high share of the labour force engaged in R&D related activities and the percentage of GDP devoted to education, which are remarkably higher in the Eastern economies, as also confirmed in the UNESCO’s data. This is hardly surprising as it is well known that data on R&D and human capital intensive activities are subject to relevant statistical distortions and influenced by the high share of military based activities.
Tab. 4 - Human Capital Statistics in the 1980’s Country groups Educational Enrolment Ratios Educat. Expendit.
(% GDP) R&D workers to total employed
Prim. & Sec. Tertiary EC-SOUTH 94.3 22.6 3.5 0.154 EC-NORTH 94.9 26.3 5.2 0.687 EFTA 92.8 25.2 5.5 0.705 CEE 93.9 25.8 5.4 0.689 CEE + former SU 96.3 20.1 5.7 1.060
Source: Rollo & Stern, 1992, p.19. Nevertheless, when taking into account different statistics, still the stock of human capital
remain high and suggests that other factors may explain the scarce productivity of the human capital employed. For instance, disentangling different kinds of secondary education, it emerges that a sizeable share of workers were given a very specific kind of education. In most CEECs, the percentage of vocational education on the total amount of diplomas awarded was very high and, among them, the quota of training provided by state companies for very specific tasks was relevant. This kind of education is the most likely to become obsolete in case of major changes as those faced by the countries under consideration. Furthermore, as the indices currently used to measure the human capital stock are not sensitive to the quality and to the different types of education, they are not able to detect the dramatic shortage of skills in marketing, banking, accountancy, produced by the past misallocation of resources.
All this suggests that an over-estimation could be present in the data due to the low quality and to the necessity of adapting past labour skills to the need of the market economy.
3 - Determinants of quality differentiated trade In section 1.3, evidence has been shown of the fact that even trade within industries between
the CEECs and the EU is mainly based on vertical product differentiation and could reflect, hence, the relative factor endowment of the CEECs and their comparative advantages in sectors exploiting the higher labour and natural resource endowment.
This observation has led to carry out an analysis on the determinants of vertically differentiated trade on EU markets. The approach adopted differs from the more traditional analyses of IIT which focus on industry specific determinants such as scale economies and product differentiation within monopolistic competition models of IIT.

Recent works have cast some doubts on the empirical validity of these models. These findings of the applied literature have played quite a disruptive role toward the past empirical analyses of IIT and have justified a simplification of the econometric testing in favour of core models as well as experiment models not based on monopolistic competition. Firstly, the monopolistic competition models prove to perform quite poorly in empirical analyses. Especially the industry determinants of IIT have been found sensitive to various econometric problems (Hummels and Levinsohn, 1995; Torstensson, 1996b). Secondly, according to the evidence contained in Greenaway, Hine and Milner (1994, 1995), the most sizeable share of total IIT is not horizontal but vertical IIT, which produces relevant mis-specification in the estimated equations.
It is evident that whilst HIIT is better explained within the context of the so-called “new trade theories”, VIIT is mainly related to the traditional theories of comparative advantages8. This implies to leave the assumption of identical factor intensities and scale economies in the production of all the commodities, typical of some models of monopolistic competition, in order to investigate the possible existence of fundamental differences among products within an industry.
The empirical analysis has concentrated on two streams of literature which focus on the way in which different qualities of the same good can generate international trade. The first model is the so-called neo-H-O model (Falvey, 1981; Falvey and Kierzkowski, 1987). A further model tested (Greenaway and Torstensson, 1997) explains trade in quality differentiated goods as a linear function of lowering trade costs and of market size differentials between trade partners9. The analysis has consisted of testing by cross-country regressions the relation between factor endowment and market size (independent variables), on the one hand, and industry-level price gaps between trade partner (dependent variable), on the other hand. Among the factors of which a country is endowed also human capital has been included.
3.1 - Neo-Hecksher Ohlin models Models of VIIT as based on factor endowment differentials have gained the label of neo-
Heckscher-Ohlin approach and date from two fundamental contributions: Falvey (1981), Falvey and Kierzkowski (1987). VIIT is explained within the context of perfectly competitive markets: relatively capital abundant countries specialise and export high-quality manufactures, whilst labour abundant countries specialise in low quality manufactures. Given the relevance that this form of trade seems to play in East-West trade, the formal model will be briefly analysed and its main conclusions sketched.
In Falvey (1981), it is assumed that capital intensity is increasing in quality of vertically differentiated products. The paper develops a model of trade within an industry considering only two basic departures from the standard H-O framework: firstly, one of the two factors used is industry-specific (capital); secondly, an industry can produce a range, instead of a single homogeneous output. The advantage of this approach is that not only the source, but also the corresponding pattern of IIT is explained, unlike the modelling of IIT based on economies of scale and monopolistic competition.
In this model, higher quality products need more capital-intensive techniques of production and have higher prices This seems to be a strong simplification, since all the other factors from which quality may possibly depend, such as the size of the domestic market, the degree of opening up of the economy, the tradition of a country in a given sector of the industry and so forth are not considered. As will be shown in next section, quality product differentiation could arise even in different contexts.
Another restrictive hypothesis is that the input-output ratios are supposed to be internationally identical for any given quality. This reflects the fact that quality is expressed completely through prices and that only one technology is available to produce at a given standard.
Despite all the limitations, the realism of this model is quite high as vertical differentiation is a widespread form of differentiation and the relative capital intensity seems its predominant reason. Even in those productions in which higher quality does not follow from higher physical capital intensity (think of hand-made clothing) there are ways to lead again trade to a neo-H-O framework, introducing the distinction between skilled and unskilled labour or, in other words, the role of human capital accumulation.
8 Although Shaked and Sutton (1984) have shown that VIIT may be generated also in a model based on oligopolistic
market structure and economies to scale. 9 In opposition, more complex “economic geography” models of IIT (Krugman and Venables, 1990 and 1995;
Markusen and Venables, 1996; Puga and Venables, 1997) show the existence of a non monotone relation between the size of the export country and the entity of the VIIT as trade costs reduce.
3.2. - The economic Geography approach
Further relevant developments in the analysis of IIT have occurred departing from the first generation of monopolistic competition models on the basis of a re-consideration of trade costs and specialisation. A basic version of such models, based on Helpman and Krugman (1985), is considered here, as it may provide an explanation of VIIT different from that of the neo-H-O approach. In such a model, two countries have access to identical technologies. There is only one factor, labour, which is industry-specific. These assumptions are made to separate the effects on trade of market size and trade costs from those of technology or factor endowment differences. The goods produced are of two types. The first homogeneous type is produced under constant returns to scale; the market for it is supposed to be perfectly competitive and operating under free trade conditions. The other type is a differentiated good, produced under increasing returns to scale, monopolistic competition and high trade costs.
In Greenaway and Torstensson (1997), a reinterpretation of Helpman and Krugman (1985) is suggested to explain VIIT. The goods considered are respectively low and high quality varieties, instead of a homogeneous and differentiated good. Moreover, there is a positive relation between quality and scale economies, since high quality varieties need a higher investment in fixed costs (especially due to product development) and are subject to lower elasticity of substitution. Three important implications derive from the model:
1) net exports of high-quality varieties from the larger country are proportional to the relevance of scale economies and to the difference in country size;
2) “if transport costs are low […] even small differences in country size will lead the differentiated product industry to concentrate in the larger country” (Helpman and Krugman, 1985, p. 208).
3) as trade costs fall, the production of high-quality goods becomes increasingly concentrated in the large country; in other words, net specialisation will increase. This implies that trade will increasingly take place in different qualities which correspond to an increase in VIIT, with respect to HIIT.
Regarding CEE-EU trade, the implicit assumption which can be drawn from such an approach is that an increasing concentration of the productions caused by the integration process may imply the prospective for the CEECs of specialising in low-quality productions.
However, when interpreting the econometric results, one should bear in mind that the direct monotonic relation between country size and high quality specialisation predicted under the economic geography hypotheses is arguable. In Krugman (1991) and Krugman and Venables (1995), in fact, a probable non-linear relationship between IIT and trade costs has been enlightened. In particular, they show that reductions in trade costs may increase concentration of production and lead to a decreased share of IIT only in some intervals of trade costs, while in others the process can be reverted. The problem with these models is that they do not provide hypotheses easy to test.
4 - The econometric analysis
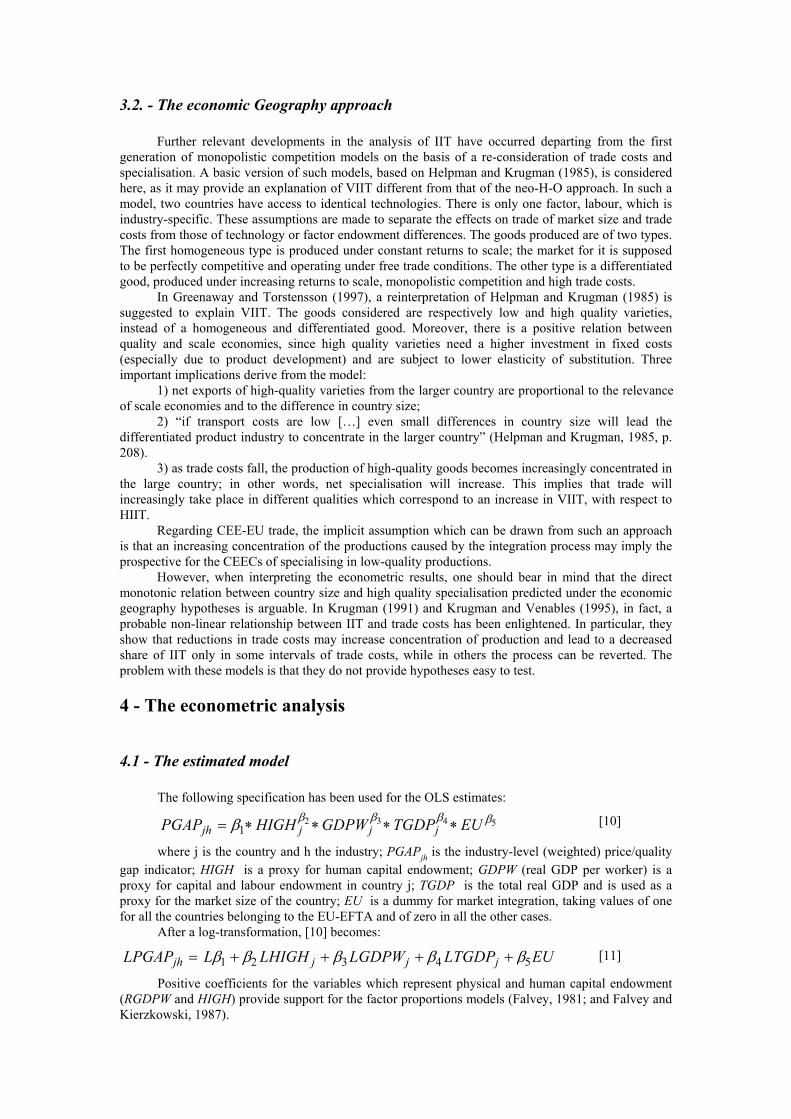
4.1 - The estimated model The following specification has been used for the OLS estimates:
PGAP HIGH GDPW TGDP EUjh j j j= ∗ ∗ ∗ ∗β β β β β1
2 3 4 5 [10]
where j is the country and h the industry; PGAPjh is the industry-level (weighted) price/quality gap indicator; HIGH is a proxy for human capital endowment; GDPW (real GDP per worker) is a proxy for capital and labour endowment in country j; TGDP is the total real GDP and is used as a proxy for the market size of the country; EU is a dummy for market integration, taking values of one for all the countries belonging to the EU-EFTA and of zero in all the other cases.
After a log-transformation, [10] becomes:
LPGAP L LHIGH LGDPW LTGDP EUjh j j j= + + + +β β β β β1 2 3 4 5 [11]
Positive coefficients for the variables which represent physical and human capital endowment (RGDPW and HIGH) provide support for the factor proportions models (Falvey, 1981; and Falvey and Kierzkowski, 1987).

The sign of the coefficient for the variable which represents market size (TOTGDP ) is also expected to be positive (Greenaway and Torstensson, 1997), although with the caveat shown in the previous section. This might suggest that market access measured by the dimension of the home market is positively correlated with the development of quality differentiated trade, i.e. that scale economies play an important role in it. The explanation for this is that high-quality varieties have to face higher fixed costs and have a low elasticity of substitution10. Previous analyses have already shown that VIIT is positively influenced by an high degree of scale economies and by the presence of a small number of firms in the market (Shaked and Sutton J., 1984).
An EU dummy has been used to verify whether there is an impact of participation in EU-EFTA regional trading arrangements on the quality standard of the goods exported. A similar variable has been found to significantly and positively affect the share of intra-industry on total trade by Balassa and Bawens (1987). In Greenaway and Torstensson (1997), a similar variable was found not significant using prices as dependent variable. Actually, in the case of price/quality gaps, the sign of the variable is difficult to forecast on an a priori ground, although some relevant factors may play a role in favour of a positive sign. In fact, following Puga and Venables (1997), it can be argued that member countries of the EU-EFTA may increase their production and net exports in the IRS-industries, with an higher level of price/quality on average. In addition, the integration process among countries with highly concentrated and differentiated productions may produce a relevant pro-competitive effect, increasing the average level of quality. It has to be observed, however, that the estimated sign of the coefficient will depend on the chosen sample of countries, because other variables may play a relevant role: for instance, if the presence of countries with an higher level of capital endowment or a bigger internal market is dominant, it is also possible that the sign of the EU-EFTA dummy be negative.
4.2 - Estimation Results
a) OLS pooled regressions The data relative to three-digit Nace industries (tab. A.3) have been pooled together and
regressed on the country values of the independent variables11. Different regressions have been run based on different country samples: the complete sample, a sub-sample excluding the CEECs, a sub-sample including only the CEECs (Tab. A4). The model as a whole is well-defined with an R2-statistics satisfactory for cross-country estimates. Moreover, all of the coefficient estimates are statistically significant and the signs generally consistent.
An exception is represented by the estimates which include the CEECs (columns 1 and 3) where the sign for human capital is non significant. However, when the CEECs are excluded from the sample (columns 2 and 4) the expected highly significant and positive coefficient for human capital appears. It has been argued that the unexpected sign and values (columns 1 and 3) are due to the inclusion of the data relative to the CEECs. How to explain it? Firstly, it is well known that data regarding human capital in former communist countries is over-estimated, due to many factors. Moreover, the international measurement are not very sensitive to the quality of education and, thus, qualification differentials across countries might be hidden behind the statistics. Furthermore, as observed in section 1.3, some of the quality indices relative to countries such as Bulgaria are upward biased in 1988.
GDPW is a significant regressor for the quality of traded products, thus confirming the assumptions of the neo-H-O-S model regarding trade quality patterns: the abundance of physical capital increases the quality of exports.
Moreover, the significant positive coefficient of TOTGDP seems to verify a simplified economic geography model of market access. In other words, it seems correct to argue that the expansion of intra-industry trade is in the direction of a concentration of high-quality varieties in more developed countries and conversely a specialisation of the less developed ones in the production of
10 One of the assumptions of the monopolistic models is that there is a positive relation between the elasticity of
substitution and the presence of scale economies in the production. 11 Of course, the availability of values of the independent variables at the industrial level would represent a relevant
improvement of the estimates.
low-quality varieties. This means a concentration of IRS-industries in the former and the tendency for VIIT to increase at the expenses of HIIT.
The dummy for EU-EFTA integration, is significant. The interpretation, however, is not straightforward. It is possible that the EU membership increases the level of quality of the products traded, in other words, the causality would be in the sense that the higher the level of integration, the higher that of quality. But on the other hand, the dummy could simply catch the obvious fact that the EU countries have reached a quite similar level of development. To avoid this the variable has only been included in the estimates for the entire sample.
.
b) OLS sectoral regressions Estimates have also been run for each sector based on the fact that, in estimates here omitted,
industry specific dummies have been found highly significant suggesting the presence of shifts in the coefficients relative to different industries. Hence model [11] has been tested for each sector, for all the countries (tab. A5) and excluding the CEECs (tab. A6). The results confirm the previous analysis. GDPW and TOTGDP perform well in almost all the regressions. Regarding human capital, the coefficient is again non significant when the CEECs are included and positive and significant when they are excluded, with the exception of the textile in 1988. The results for TOTGDP are on the contrary affected negatively by the removal of the CEECs from the sample probably because the remaining observations are referred to countries which are too similar among each other.
The food industry appears to be a “problematic” sector, since even the variable for capital endowment is often not significant. Actually, this sector should be considered a special case, given the role that variables not included in the model, such as natural resources, may play in it. Indeed, the R2 is generally lower in the food sector.
4.3 - Implications The results provide evidence in favour of the hypothesis that a country’s factor endowment is a
significant explanatory variable of the quality of trade, whatever the specification chosen and the countries included in the sample. Moreover, human capital, a factor not considered in the basic neo-H-O model, is a highly significant variable, for most part of the countries. This confirms that, although difficult to operate, an assessment of the industrial factor endowment, especially of human capital, of the CEECs can be determinant to predict their future specialisation.
In fact, the regressions confirm that, in spite of the high level of education attainment, the CEECs occupy the lowest quality segments of the European market. Of course, this casts a shadow on the statistics on human capital and let argue that they overstate the level of education provided. A better measure of the human capital stock would represent an important improvement for cross-country regressions including the CEECs, especially if able to take quality into consideration and focus on the kind of education actually gained by different groups of employees, which is of major importance in manufacturing production.
Notwithstanding the existence of possible distortions in the data, the stock of CEE human capital is still very high, suggesting that a process of deterioration could have taken place, due to the adjustment which these countries have to face in terms of inter-sector relocation of labour and adaptation to the needs of the market economy. This is a very sensitive issue on which the industrial and trade policies are in fact trying to intervene (COM, 1997). However, at least in the medium term, the CEECs seem destined to have a comparative disadvantage in the high-skill sectors.
A further result concerns the relevance of market size for the localisation of high-quality productions. The implication for the CEECs may be that EU accession would potentially lead to further specialisation in low quality production. In fact, we have found that while belonging to a preferential trade agreement is not clearly able to positively affect the quality level of a country export, conversely, market size seems to be highly correlated with an higher quality of exports at least within a certain range of reduction in trade costs. Therefore, liberalisation would be accompanied by increased concentration of high-quality production in large markets. However, the relation between concentration and liberalisation is a rather uncertain field of analysis and the sensitivity of the coefficient to different specifications in the estimates seems to confirm the doubts regarding the existence of a non monotonic relation between market size and high quality in production (Krugman-Venables, 1990; 1995; Puga-Venables, 1997).

In addition, the significance of the coefficient relative to the dummy for market integration, albeit not in all the estimates, could suggest that the integration process itself matters. It could make faster the process of catching up in terms of quality of products and income, providing Eastern producers with a larger market and potential economies to scale. Here, further investigation could benefit from the most recent developments of the “new growth” theory with respect to market integration and of some empirical testing on growth effects of European integration (Henrekson et al. , 1997).
Furthermore, it is important to consider that CEECs are much closer to the “core” of Europe than many EU full members. This proximity could counterbalance the forces indicated above, with the East benefiting from any process of further concentration. As the average income of some of the CEECs is likely to catch up quite soon with Western levels, it is possible to say that further concentration of activity might benefit CEECs and anticipate an Eastward movement of the economic centre of Europe.
Regarding the distribution and employment effects of the actual CEE-EU integration process, which is the issue at the core of EU policies, the findings seem supportive of the following hypotheses. Above all, it has to be observed that the relevance of factor endowment in determining a process of product specialisation will continue to push the CEECs towards low quality segments of production and the EU members towards the high quality segments in each industry. This trade is likely to produce income redistribution effects and not to be neutral as in case of HIIT. Nonetheless, the specialisation here considered is not of the traditional Heckscher-Ohlin kind, typical of the inter-industry trade, excluded from the analysis presented here. Therefore, the likely effects are less dramatic than those envisaged by the traditional H-O model, such as the crowding out of entire sectors, and rather involve a displacement with eventual loss of jobs and reductions in wages for the Western firms specialised in low quality segments of the market. However, this is still an under researched area.
5 - Concluding remarks The work is aimed at describing the driving forces of East-West European trade. It attempts also
to formulate some hypotheses regarding the possible adjustment effects. The first step of the analysis has consisted of a short review of the main features of the integration process over the period 1988-94. Focusing on IIT, it has been shown by means of the existing and of new evidence that quality product differentiation is a relevant, albeit still neglected feature.
The theoretical contributions to the analysis of quality in trade examined in section 3 suggest that specialisation in high or low-skill trade may depend on three types of sources: 1) physical capital and labour; 2) the human capital stock accumulated in a country; 3) and more controversially, the dimension of its internal market.
These hypotheses have been tested by means of cross-country equations. Quality gap indices have been regressed upon proxy variables for physical to labour and human capital endowment, for market size and EU/EFTA integration. All the variables have been found highly significant in almost all the estimates, except the last one which seems to be heavily dependent on the specification used. Although significant, market size seems to be only slightly higher than zero. Over all the estimates, the performance of human capital has been problematic with respect to the CEECs: interestingly, a measure of schooling gives the wrong sign when only the CEECs are included in the sample and the expected sign when the CEECs are excluded from the sample.
The main conclusion drawn from the enquiry is that factor endowment matters when we consider VIIT. The implications of EU-CEE integration for the labour markets of the two areas involved are different from those typical of inter-industry trade and of HIIT. They should be object of further research. The result obtained for human capital endowment is puzzling and seems to be compatible with different conclusions.
Some implications for the adjustment effect of East-West trade have been pointed out. At least in the medium term, the specialisation in low-quality segments of each industry by the CEECs should be the driving force, the employment and distributive effects of which should be fully investigated. Nonetheless, in the long term, the comparative disadvantages of CEE in the high-skill sectors would be overcome as soon as their human capital will be converted to the needs of the market economy.
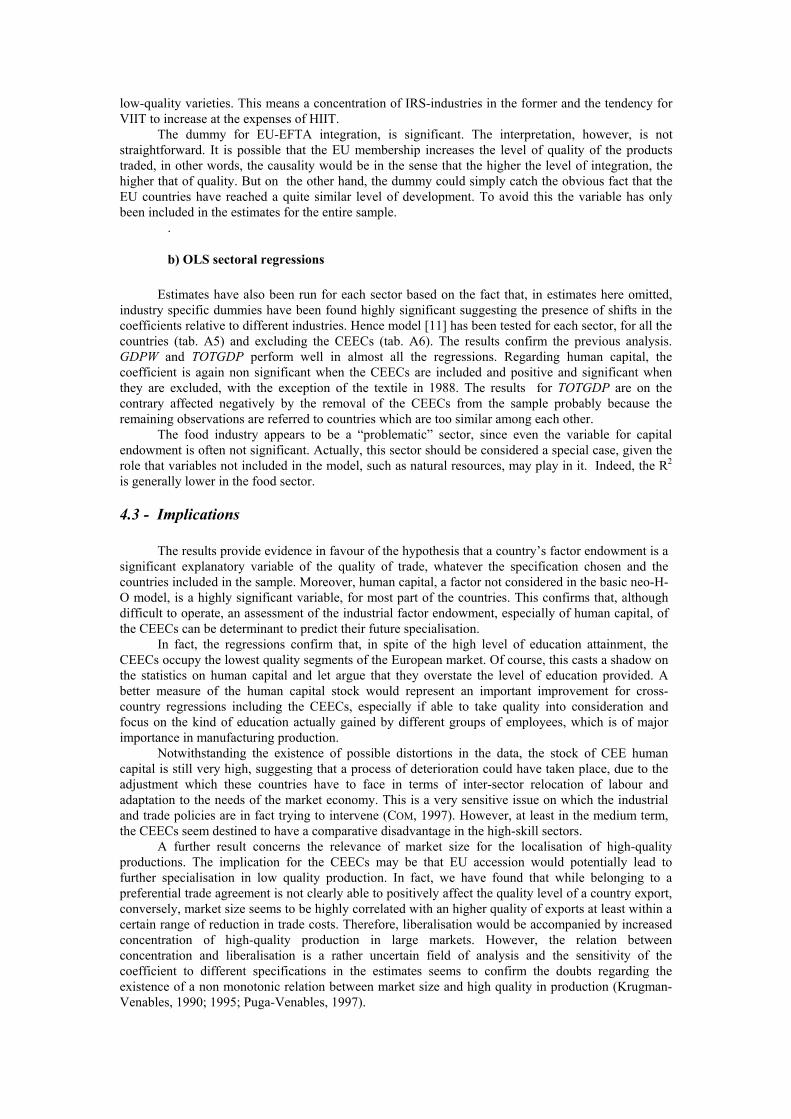
Appendix Tab. A.1 - Variable definition and data sources
Variable definition Data sources
a) Dependent Variable: Landesmann tables (1994)
PGjh = industry-level (weighted) price/quality gap indicator
= ( )Σ Σp
psx i I hj i
EU ij i
,
,,
∗ ∈ = ; sx ji 1
where j = country, h = industry, i = item belonging to the set of all the 8-digit items in NACE industry h, I (h); pji = price (per kg) at which country j sells exports of the item i on EU markets; peu,i = average price of item i in total EU imports; sxji = share of product item i in country c’s exports to the EU;
Construction of the index: 1) product prices (values per Kg) are calculated at the detailed product level (8 - digit Nace) across a set of countries competing in EU markets; 2) then, these prices are divided by the average price for the same product in total EU imports; 3) the price gaps for the individual products are then aggregated to construct a price/quality gap indicator at industry level. Each price gap is weighted considering which share, s, a particular commodity represents of a given country’s exports to the EU markets. 4) the weighted price/quality gap measures have been scaled so that they take the value of 1.0 for total EU imports: values below 1.0 mean sales of products by a specific country on EU markets at prices below the average of total EU imports the opposite for value higher than 1;
b) Independent variables:
GDPW= real GDP per worker (current international prices).
Proxy for capital endowment (capital/labour ratio)
RGDPPW in Penn World Tables (Mark5), Summers and Heston database, 1991
RGDPC = real GDP per capita (current international prices);
CGDP in Penn World Tables (Mark5)
TGDP= total real GDP = (CGDP)*POP
Proxy for market size;
Product of CGDP times POP in the Penn World Tables (Mark5)
HIGH = HIGHC25, since this measure performed better than others
Proxy for human capital endowment
HIGHC25 = percentage of population over 25 which has completed high school education;
TYR = average years of schooling in the total population SECC25 = percentage of population over 25 which has
completed secondary education. Barro and Lee data (1996).
R&D = ratio of R&D personnel to economically active population (per thousand)
Unesco, Yearbook, 1991 and OECD (STI database), OECD Leading Indicators
PCAP = capital stock per worker (1985 international prices) as a measure of physical capital endowment
Penn World Tables (KAPW, Summers and Heston database, 1991). It equals the depreciated sum of the cumulated gross domestic investment.
OPEN = Openess (exports + import)/ CGDP Penn World Tables (Summers and Heston database, 1991).
EU = dummy for market integration taking values of 1 for all the countries belonging to EC-EFTA and values of 0 for the others countries;
UK, Germany, France, Italy, Belgium/Luxemburg, Netherlands, Spain, Portugal, Greece, Ireland, Austria, Switzerland, Sweden, Finland, Denmark.
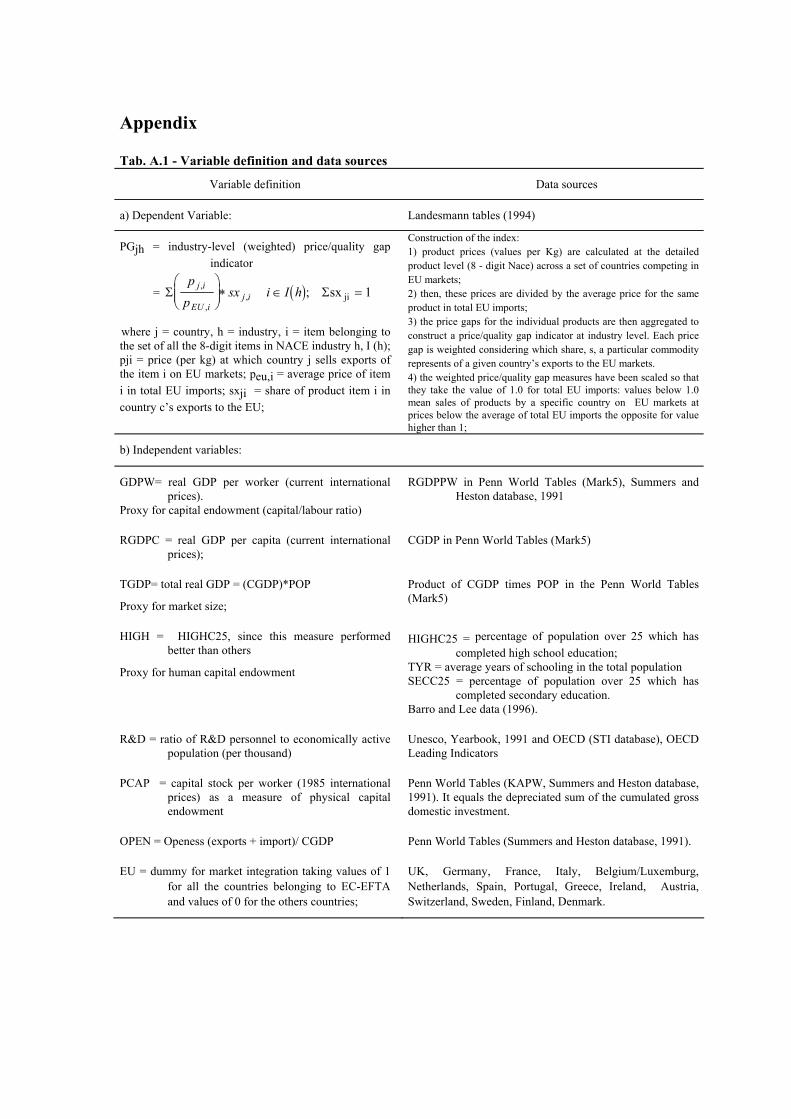
Tab. A.2 - List of the abbreviations used for countries and groups of countries
Abbreviation Countries Abbreviation Countries
USA USA TUR Turkey JAP Japan HUN Hungary CAN Canada POL Poland GER Germany CSFR Czech (and Slovak in 1994) Republic FRA France BUL Bulgaria BEL Belgium/Luxemburg ROM Romania NETH Netherlands YUG Yugoslavia ITA Italy SU Soviet Union / Russia UK United Kingdom NIC1 Taiwan, Hong Kong, Singapore, Korea AUS Austria NIC2 Indonesia,Thailand,Philippines,Malaysia SWIT Switerland IND India IRE Ireland CHI China FIN Finland EU-SOUTH Spain, Greece, Portugal SWE Sweden EU-NORTH GER, FRA, BEL, NETH, ITA, UK, IRE, DEN DEN Denmark CEECS1 HUN, POL, YUG, CSFR SPA Spain CEECS2 SU, ROM, BUL PORT Portugal NIC NIC1, NIC2 GRE Greece EFTA SWE, SWIT, FIN, AUS

Tab. A.3 - List of three-digit NACE engineering; food, drink and tobacco; textile, clothing and footwear
Sector Definition Sector Definition
321 Agricultural machinery; tractors 415 Processing of fish 322 Machine-tools for working metal 416 Grain milling 323 Textile machinery and accessories 417 Spaghetti, Macaroni 324 Machinery for the food, chemical industries 418 Starch products 325 Plant for mines, iron and steel industry foundries 419 Bread and flower 326 Transmission equipment for motive power 420 Sugar 327 Other machinery and equip. for specific branches 421 Cocoa and chocolate 328 Other machinery and equipment 422 Animal and poultry foods 330 Office machinery and data processing 423 Other food products 341 Insulated wires and cables 424 Distilling of alcohol 342 Electrical machinery 425 Wine of grapes 343 Batteries and accumulators 426 Cider and other beverage 344 Telecommunication & electro-medical equipment 427 Brewing and malting 345 Radio & television receiving sets 428 Soft drinks 346 Domestic electric appliances 429 Tobacco 347 Electric lighting equipment 436 Knitting 371 Precision instruments 438 Carpets, linoleum and other floor coverings 372 Medical and surgic5l equipment 439 Textile industries 373 Optical instruments and photographic Equip. 441 Tanning of leather 374 Clocks and watches 442 Products from leather 411 Vegetable and animal oils 451 Mass produced footwear 412 Meet 453 Clothing 413 Dairy products 455 Household textiles 414 Processing of fruit and vegetables 456 Furs
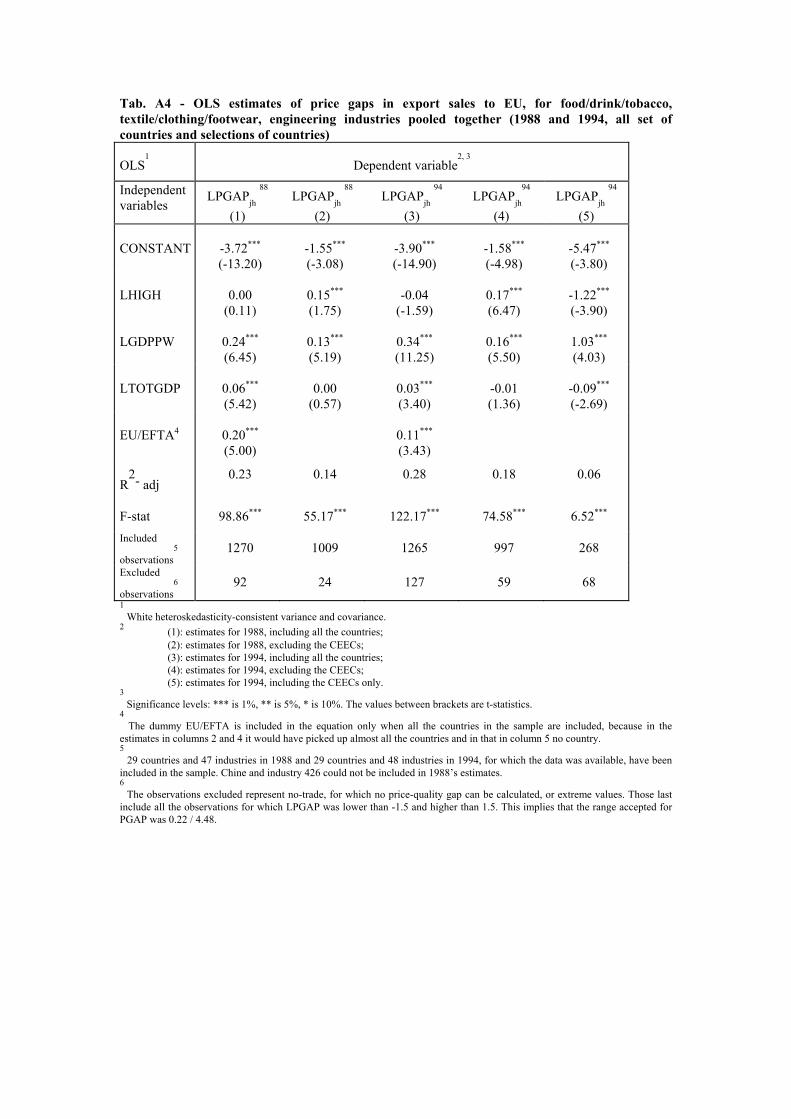
Tab. A4 - OLS estimates of price gaps in export sales to EU, for food/drink/tobacco, textile/clothing/footwear, engineering industries pooled together (1988 and 1994, all set of countries and selections of countries)
OLS1 Dependent variable
2, 3
Independent variables
LPGAPjh 88
(1) LPGAPjh
88
(2) LPGAPjh
94
(3) LPGAPjh
94
(4) LPGAPjh
94
(5) CONSTANT
-3.72*** (-13.20)
-1.55*** (-3.08)
-3.90*** (-14.90)
-1.58*** (-4.98)
-5.47*** (-3.80)
LHIGH
0.00
(0.11)
0.15*** (1.75)
-0.04
(-1.59)
0.17*** (6.47)
-1.22*** (-3.90)
LGDPPW
0.24*** (6.45)
0.13*** (5.19)
0.34*** (11.25)
0.16*** (5.50)
1.03*** (4.03)
LTOTGDP
0.06*** (5.42)
0.00
(0.57)
0.03*** (3.40)
-0.01 (1.36)
-0.09*** (-2.69)
EU/EFTA4
0.20*** (5.00)
0.11*** (3.43)
R2- adj
0.23 0.14 0.28 0.18 0.06
F-stat 98.86*** 55.17*** 122.17*** 74.58*** 6.52*** Included
observations5
1270 1009 1265 997 268
Excluded
observations6
92 24 127 59 68 1 White heteroskedasticity-consistent variance and covariance. 2 (1): estimates for 1988, including all the countries;
(2): estimates for 1988, excluding the CEECs; (3): estimates for 1994, including all the countries; (4): estimates for 1994, excluding the CEECs; (5): estimates for 1994, including the CEECs only.
3 Significance levels: *** is 1%, ** is 5%, * is 10%. The values between brackets are t-statistics.
4 The dummy EU/EFTA is included in the equation only when all the countries in the sample are included, because in the
estimates in columns 2 and 4 it would have picked up almost all the countries and in that in column 5 no country. 5 29 countries and 47 industries in 1988 and 29 countries and 48 industries in 1994, for which the data was available, have been
included in the sample. Chine and industry 426 could not be included in 1988’s estimates. 6
The observations excluded represent no-trade, for which no price-quality gap can be calculated, or extreme values. Those last include all the observations for which LPGAP was lower than -1.5 and higher than 1.5. This implies that the range accepted for PGAP was 0.22 / 4.48.

Tab. A5 - OLS estimates of price gaps in export sales to EU, for 3-digit NACE industries (1988 and 1994; food/drink/tobacco, textile/clothing/footwear, engineering)
OLS1 Dependent variable
3
Independent
variables2
LPGAP88
jeng
(1)
LPGAP88
jfood
(2)
LPGAP88
jtex
(3)
LPGAP94
jeng
(4)
LPGAP94
jfood
(5)
LPGAP94
jtext
(6) CONSTANT
-5.26*** (-13.28)
-2.17*** (-4.64)
-3.53*** (-8.30)
-5.51*** (-14.75)
-2.80*** (-6.07)
-2.27*** (-4.94)
LHIGH 0.01 (0.24)
0.04 (0.89)
-0.09 (-1.51)
-0.03 (-0.74)
-0.05 (-1.26)
-0.05 (-0.96)
LGDPPW
0.38*** (6.87)
0.07
(1.08)
0.28*** (4.84)
0.48*** (10.73)
0.23*** (4.74)
0.19*** (3.86)
LTOTGDP 0.06*** (3.64)
0.07*** (4.03)
0.05*** (2.15)
0.04*** (2.68)
0.03** (2.17)
0.03* (1.71)
EU
0.25** (4.32)
0.14** (2.07)
0.20*** (2.75)
0.12***
(2.64)
0.05
(0.88)
0.22*** (3.74)
R2- Adj.
0.41
0.08
0.32
0.43
0.13
0.25
F-stat 96.23*** 11.86*** 30.52*** 106.38*** 18.31*** 22.02***
Included
observations4
538
477
255
549
463
253
Excluded
observations5
42 55 6 31 88 8
1 White heteroskedasticity-consistent variance and covariance 2 Significance levels: *** is 1%, ** is 5%, * is 10%. The values between brackets are t statistics. 3 LPGAP88jeng= engineering industry (1988); LPGAP88jfood= food/drink/tobacco industry (1988); LPGAP88jtext =
textile/clothing/footwear (1988); LPGAP94jeng= engineering industry (1994); LPGAP94jfood= food/drink/tobacco industry
(1994); LPGAP94jtext = textile/clothing/footwear (1994). 4 The engineering sector includes 20 industries, the food 18 in 1988 and 19 in 1994, the textile 9. There are 29 countries. 5
The observations excluded represent no-trade, for which no price-quality gap can be calculated, or extreme values. Those last include all the observations for which LPGAP was lower than -1.5 and higher than 1.5. This implies that the range accepted for PGAP was 0.22 / 4.48.

Tab. A6 - OLS etimates of price gaps in export sales to EU, for 3-digit NACE industries (1988 and 1994; excluding the CEECs; food/drink/tobacco, textile/clothing/footwear, engineering)
OLS1 Dependent variable
3
Indep. Variables
2
LPGAP88
jeng LPGAP88
jfood LPGAP88
jtex LPGAP94
jeng LPGAP94
jfood LPGAP94
jtext
CONSTANT
-2.31*** (-5.17)
-0.86* (-1.65)
-1.44*** (-2.74)
-2.51*** (-4.70)
-0.58*** (-1.34)
-1.13** (-2.10)
LHIGH 0.21*** (6.17)
0.14*** (3.24)
0.04 (0.92)
0.27** (6.12)
0.11*** (2.81)
0.11** (1.94)
LGDPPW
0.23*** (6.20)
0.00
(0.01)
0.19*** (4.71)
0.24*** (5.19)
0.06* (1.68)
0.12*** (2.75)
LTOTGDP -0.01 (1.11)
0.04 (2.52)
-0.01 (0.80)
-0.01 (-1.11)
-0.08 (-0.72)
-0.00 (0.92)
R2-adj
0.33
0.05
0.14
0.35
0.05
0.11
F-stat 69.35*** 8.20*** 11.92*** 78.20*** 7.48*** 9.15***
Included observations
4
412
383
198
429
376
192
Excluded
observations5
28 13 0 11 42 6
1 White heteroskedasticity-consistent variance and covariance 2 Significance levels: *** is 1%, ** is 5%, * is 10%. The values between brackets are probabilities. 3 LPGAP88jeng= engineering industry (1988); LPGAP88jfood= food/drink/tobacco industry (1988); LPGAP88jtext =
textile/clothing/footwear (1988); LPGAP94jeng= engineering industry (1994); LPGAP94jfood= food/drink/tobacco industry
(1994); LPGAP94jtext = textile/clothing/footwear (1994); 4 The engineering sector includes 20 industries, the food 18 in 1988 and 19 in 1994, the textile 9. There are 22 countries. 5
The observations excluded represent no-trade, for which no price-quality gap can be calculated, or extreme values. Those last include all the observations for which LPGAP was lower than -1.5 and higher than 1.5. This implies that the range accepted for PGAP was 0.22 / 4.48.

C h a r t 1 - A v e r a g e p r ic e - q u a l i t y g a p s in t h e e n g in e e r in g in d u s t r ie s , f o r e a c h o f t h e C E E C s ( 1 9 8 8 - 9 4 )
0 .3
0 .4
0 .5
0 .6
0 .7
0 .8
0 .9
1
1 .1
1 9 8 8 1 9 8 9 1 9 9 0 1 9 9 1 1 9 9 2 1 9 9 3 1 9 9 4
Y e a r s
Pric
e-qu
ality
gap
s
H u n g a r yP o la n dC S F RB u lg a r iaR o m a n iaY u g o s la v iaS o v ie t U n io nE U -S o u th
C h a r t 2 - A v e ra g e p r ic e -q u a lity g a p s in th e fo o d in d u str ie s , fo r e a ch
o f th e C E E C s (1 9 8 8 -9 4 )
0 .3 0 0
0 .8 0 0
1 .3 0 0
1 .8 0 0
2 .3 0 0
1 9 8 8 1 9 8 9 1 9 9 0 1 9 9 1 1 9 9 2 1 9 9 3 1 9 9 4
Y e a r s
Pric
e-qu
ality
gap
s
H u n g a r yP o la n dC S F RB u lg a r iaR om a n iaY ug os la v iaS ov ie t U n ionE U -S ou th
C h a r t 3 - A v e r a g e p r ic e -q u a lity g a p s in th e te x t i le in d u s tr ie s , fo r e a c h
o f th e C E E C s (1 9 8 8 -9 4 )
0 .4
0 .6
0 .8
1
1 .2
1 .4
1 9 8 8 1 9 8 9 1 9 9 0 1 9 9 1 1 9 9 2 1 9 9 3 1 9 9 4
Y e a r s
Pric
e-qu
ality
gap
H u n g a r yP o la n dC S F RB u lg a r iaR o m a n iaY u g o s la v iaS o v ie t U n io nE U -S o u th
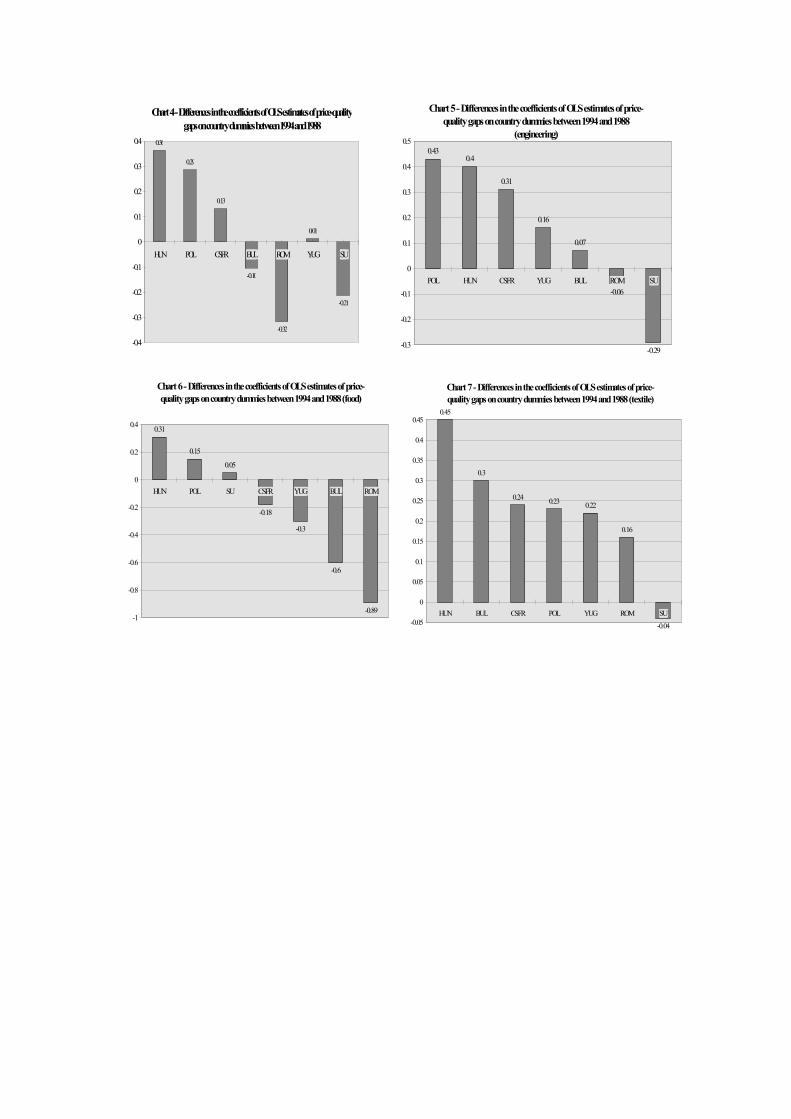
Chart 4 - Differences in the coefficients of OLS estimates of price-quality gaps on country dummies between 1994 and 1988
0.36
0.29
0.13
-0.10
-0.32
0.01
-0.21
-0.4
-0.3
-0.2
-0.1
0
0.1
0.2
0.3
0.4
HUN POL CSFR BUL ROM YUG SU
Chart 5 - Differences in the coefficients of OLS estimates of price-quality gaps on country dummies between 1994 and 1988
(engineering)0.43
0.4
0.31
0.16
0.07
-0.06
-0.29-0.3
-0.2
-0.1
0
0.1
0.2
0.3
0.4
0.5
POL HUN CSFR YUG BUL ROM SU
Chart 6 - Differences in the coefficients of OLS estimates of price-quality gaps on country dummies between 1994 and 1988 (food)
0.31
0.15
0.05
-0.18
-0.3
-0.6
-0.89-1
-0.8
-0.6
-0.4
-0.2
0
0.2
0.4
HUN POL SU CSFR YUG BUL ROM
Chart 7 - Differences in the coefficients of OLS estimates of price-quality gaps on country dummies between 1994 and 1988 (textile)
0.45
0.3
0.24 0.23 0.22
0.16
-0.04-0.05
0
0.05
0.1
0.15
0.2
0.25
0.3
0.35
0.4
0.45
HUN BUL CSFR POL YUG ROM SU
Bibliographical references
Abd-el-Rahman, K (1991), “Firms Competitive and National Comparatiive Advantages as Joint Determinants of Trade Composition”, Weltwrischaftliches Archiv, Vol. 127, 83-97.
Aturupane C., S. Djankov and B. Hoekman (1997), “Determinants of Intra-Industry Trade between East and West Europe”, CEPR, Discussion Paper, n. 1721, November.
Balassa, B. and Bauwens L. (1987), “Intra-Indusry Specialisation in a Multi-Country and Multy-Industry Framework”, The Economic Journal, Vol. 97, December, 923-939.
Barro, R.J. and J. W. Lee (1996) “International Measures of Schooling Years and Schooling Quality”, American Economic Review, vol. 86, 218-223.
Boeri T., J. Köllò and M. Burda (1997), Labour Market in Cetral Europe and EU Enlargement, CEPR / IEWS Conference, Portoroz, June 13-15.
Boylaud O. and J.O. Martins (1998) Market Structure and Trade Integration of Eastern European Countriess in the EU, , Conference ”Monitoring Economic Performance on the Road to EU Accession”, College of Europe, Natolin, typescript.
CEPR (1990), “Monitoring European Integration: The Impact of Eastern Europe”, Centre for Economic Policy Research, London.
COM (1997), Agenda 2000, (III vols.: I. For a Stronger and Wider Union; II. The Challenge of Enlargement; III. The Opinion of the European Commission on the Applications for Accession), Brussels.
Faini R. & R. Portes (ed., 1995), “European Union Trade with Eastern Europe: Adjustment and Opportunities”, CEPR, London .
Falvey R. & H. Kierzkowski (1987), “Product Quality, Intra-Industry Trade and Im(pefect) Competition”, in H. Kierzkowski, Protection and Competition in International Trade (ed.), Oxford, Blackwell.
Falvey R. (1981) “Commercial Policy and Intra-Industry Trade”, Journal of International Economics, vol. 11, 495-511.
Ferragina A. (2003), “Factor Content of Italy-CEE trade over Economic Transition”, Emergo. The Journal of Emerging Economies and Societies, vol. 10, n. 2.
Fontagné L. & M. Freudenberg (1997), “Intra-industry Trade: Methodological Issues Reconsidered”, CEPII, Document de Travail, n. 97-01, January.
Greenaway D., R. C. Hine and C. R. Milner (1994) “Country-Specific Factors and the Pattern of Horizontal and Vertical Intra-Industry Trade in the UK”, Welwirtschaftliches Archiv, vol. 130, 77-100.
Greenaway D., R. C. Hine and C. R. Milner (1995) “Vertical and Horizontal Intra-Industry Trade: A Cross Industry Analysis for the United Kingdom”, The Economic Journal, Nov. 1995, vol. 105, n°433, 1505-1518.
Greenway D. and J. Torstensson (1997), “Economic Geography, Comparative Advantage and Trade within Industries: Evidence from the OECD”, CEPR/NBER Conference, 23-25 May 1997, Paris.
Halpern L. (1994), “Comparative Advantage and Likely Trade Pattern of the CEECs”, CEPR, Discussion Paper n° 1003.
Hamilton C. B. & L. A. Winters (1992), “Opening Up International Trade with Eastern Europe”, Economic Policy, April.
Helpman E. and P.R. Krugman (1985), Market Structure and Foreign Trade: Increasing Returns, Imperfect Competition and the International Economy, Wheatsheaf, 1985.
Henrekson M., J. Torstensson and R. Torstensson, (1997), “Growth effects of European integration”, European Economic Review, 41.
Hoekman B. and S. Djankov (1997), “Determinants of the Export Structure of Countries in Central and Eastern Europe”, The World Bank Economic Review, vol.11, n. 3.
Hummels D. and J. Levinshon (1995), “Monopolistic Competition and International Trade: Reconsidering the Evidence”, Quarterly Journal of Economics, vol. 110, 799-836.
Kaminski B., Z. K. Wang and L. A. Winters (1996), “Exports Performance in Transition Economies”, Economic Policy, October.
Krugman P. & A. J. Venables (1995), “Globalisation and the Inequality of Nations”, The Quarterly Journal of Economics, Vol. 110, n. 4.
Landesmann M. and J. Burgstaller (1997), “Vertical Product Differentiation in EU Markets: the Relarive Position of East European Producers”, WIIW, Wien.
Landesmann M. and J. Fersterer (1998), “Vertical Product Differentiation and International Trade: an Econometric Analysis”, mimeo.
Neven D. (1995), “Trade Liberalization with Eastern Nations: How Sensitive?”, in Faini R. & Portes R. (ed., 1995), European Union Trade with Eastern Europe:: Adjustment and Opportunities , Centre for Economic Policy Reasearch, London .
Puga D. & G. Ottaviano (1997), “Agglomeration in the Global Economy. A Survey of the « New Economic Geography »”, CEP, Discussion Paper, n. 356, August.
Rollo J. and A. Smith (1993), “The political economy of Eastern European Trade with the European Community: why so sensitive?”, Economic Policy, April.
Rollo J. M. C. & Stern J. (1992), “Growth and Trade Prospects for Central and Eastern Europe”, Working Paper n° 1, National Economic Research Associates, May.
Shaked A. & J. Sutton (1984), “Natural Oligopolies and International Trade”, in Kierzkowski H. (ed.), Monopolistic Competition and International Trade, Oxford University Press.
Smith A. and Z. Dràbek (1995), “Trade Performance and Trade Policy in Central and Eastern Europe”, Centre for Economic Policy Research, Discussion Paper n. 1182.
Steedman, H. (1996), “Measuring the Quality of Eductional Outputs: a Note”, LSE, CEP, Discussion Paper, no. 302, August.
Stiglitz J. E. (1987), “The Causes and Consequences of the Dependence of Quality on Price”, The Journal of Economic Literature, vol. 25, 1-48.
Summers R. & A. Heston (1991), “The Penn-World Table An expanded set of international comparisons, 1950-1988”, Quarterly Journal of Economics, May, pp. 327-368.
Torstensson J. (1996a) “Can Factor Proportion Explain Vertical Intra-Industry Trade?’, Applied Economic Letters, 3, 30-9.
Torstensson J. (1996b) “Determinants of Intra-Industry Trade: a Sensitivity Analysis”, Oxford Bullettin of Economics and Statstics, 58, 3.
Torstensson J. (1991) “Quality Differentiation and Factor Proportions in International Trade: an Empirical Test of the Swedish Case‘, Weltwrischaftliches Archiv, vol. 127.
U.N. (1991), “Educational, Scientific and Cultural Organisation”, Statistical Yearbook.
Winters L. A. & Z. K. Wang (1994), Eastern Europe’s International Trade, Manchester University Press, Manchester
World Bank (1996), World Development Report 1996: from Plan to Market, New York, Oxford University Press.