factors affecting adoption of recommended …agecon.okstate.edu/faculty/publications/3230.pdf ·...
TRANSCRIPT

FACTORS AFFECTING ADOPTION OF RECOMMENDED MANAGEMENT PRACTICES IN STOCKER CATTLE PRODUCTION
Rachel J. Johnson Former graduate student, Oklahoma State University and now at USDA/ERS
Damona Doye
Department of Agricultural Economics Oklahoma State University
Stillwater, OK 74078 Phone: 405-744-9813
Email: [email protected]
David L. Lalman Department of Animal Science
Oklahoma State University
Derrell S. Peel Department of Agricultural Economics
Oklahoma State University
Kellie Curry Raper Department of Agricultural Economics
Oklahoma State University
Chanjin Chung Department of Agricultural Economics
Oklahoma State University Copyright 2008 by Rachel J. Johnson, Damona Doye, David L. Lalman, Derrell S. Peel, and Kellie Curry Raper and Chanjin Chung. All rights reserved. Readers may make verbatim copies of this document for non-commercial purposes by any means, provided that this copyright notice appears on all such copies.

1
Factors Affecting Adoption of Recommended Management Practices in
Stocker Cattle Production
Abstract Binary logit regression models were used to estimate factors affecting adoption of recommended
management practices (RMPs). Variables analyzed include aspects of farm structure, human
capital, farm objectives, and production system employed by the producer. Results reveal that
operation size and dependency upon income generated from the stocker operation, in particular,
influence the adoption of RMPs. Older producers and those pursuing a year-round production
strategy were found to lag behind in RMP adoption.
Keywords Beef production, logit, management practices, stocker cattle
JEL Classifications: Q12, Q16

2
Factors Affecting Adoption of Recommended Management Practices in Stocker Cattle Production
Three phases typically comprise U.S. beef production: cow-calf, growing, and finishing.
Most calves go through a post-weaning growing program, although specific programs vary in
structure, type, and nomenclature. Calves that have been weaned and are intended for sale as
commercial feeder cattle, but have not yet been placed in the feedlot, are commonly referred to
as stocker cattle. Stocker calves represent an important segment of the beef production and
marketing chain and typically weigh from 300-800 lbs. Inventory of stocker cattle in a specific
geographic area at a point in time are not easily captured in the USDA data collection system.
However, the National Agricultural Statistic Service (NASS) national cattle inventory reports
reveal that there were 1.75 million stocker calves grazing small grain pasture in Kansas,
Oklahoma, and Texas as of January 1, 2008 (USDA-NASS 2008).
Stocker cattle represent an economically viable enterprise characterized by inexpensive
weight gain relative to the cow-calf and finishing phases of production (Peel 2003). A cow-calf
producer may retain ownership of weaned calves for growing as a preliminary phase before
cattle feeding. Alternatively, beef cattle producers may choose to engage in stocker cattle
production as an independent commercial enterprise.
In the stocker phase, emphasis is placed on animal growth versus fattening and on the use
of forage/ grazing-based systems versus concentrate feeds. Some stockers are grazed throughout
the summer (season-long), while others may be double-stocked and removed from summer
pasture in mid-summer (early intensive strategy). Winter production systems typically employ
either annual cool season forage, such as small grains pasture, or perennial cool season forages.
Stockers may also be completely confined where they are fed harvested forages. Mineral,

3
protein and/or energy supplementation is generally practiced, depending on forage conditions
(Peel 2003).
Numerous technologies and management practices are available to improve biological
and economic efficiency of stocker operations. Examples include anabolic implanting, setting
proper stocking rates, correctly administering intramuscular (IM) injections, marketing cattle in
uniform lots, using risk management tools, and drafting a long-term business plan (Hart et al.
1988; Dexter et al. 1994; USDA-APHIS 2000; Schmitz, Moss, and Schmitz 2003; Avent, Ward,
Lalman 2005; Doye 2005; Reuter, Highfill, and Lalman 2005). Little research has been
undertaken to identify the current production and management practices of stocker producers.
Core components of stocker production include nutrition, pasture management, quality assurance
and animal health, marketing and risk management, genetics, and business management. Each
management area offers opportunities to add value to the product and/ or reduce costs of
production.
Determining factors affecting producer adoption of recommended management practices
(RMPs)1 is of interest. Why are recommended production and management practices not being
implemented in certain cases? Is there a definable category of producers who are not adopting
new information and technology to whom educational programs could be targeted? The
objectives of this research are to document the degree of adoption for selected management
practices and to identify factors that influence adoption of RMPs in Oklahoma stocker
operations. Findings will enable researchers and Extension staff to determine how to best direct,
or perhaps redirect, research and educational programs to achieve the goal of high adoption
levels of RMPs within various production systems.

4
Stocker Cattle Recommended Management Practices
Technologies and management practices that increase either economic or biological
efficiency are frequently recommended to producers for adoption by Extension educator, for
example, using implants, setting stocking rates to match forage resources, using proper injection
sites, selling in uniform lots, utilizing risk management and business planning tools. Research
has shown that anabolic implants are one of the most cost-effective technologies available to
cattle producers as producers can expect a 10-15% improvement in average daily gain (ADG)
over non-implanted controls (Reuter, Highfill, and Lalman 2005). Implants increase the rate of
growth measured by ADG as well as the metabolic and economic efficiency of growth.
Implanting calves provides the capacity to increase weight gains by 8-20% during the grazing
season (Selk, Reuter, Kuhl 2006).
Since forage utilization represents a critical cost factor in stocker production, knowing
how to set a proper stocking rate is key to stocker profitability. Setting proper stocking rates
ensures that plants will recover from grazing during the growing season, the quality of the
available forage will be maintained, and animal performance will be optimized (Hart et al. 1988).
Manipulation of stocking rates and duration of grazing is necessary to optimize range
management and ensure profitability.
Injection site lesions arise from the administration of intramuscular (IM) injections. The
incidence of blemishes in top sirloin beef is approximately 11% of carcasses and results in a
substantial loss to the beef industry (Dexter et al. 1994). Blemishes result not only in visual
defects but also require further processing, resulting in increased toughness in the end product
and therefore, an undesirable consumer eating experience. State and national industry leaders and
educators have made an effort to inform beef producers of ideal injection practices, namely

5
administering intramuscular and subcutaneous injections in the neck region of the animal. Losses
to the beef industry from injection site blemishes are thought to primarily originate from the
cow-calf and stocker levels, or early in the finishing period (USDA-APHIS 2000).
Production and feeding efficiency is increased with larger, more uniform lots of cattle
and a premium is often paid when purchased cattle are pooled into uniform lots (Avent, Ward,
and Lalman 2005). Uniform lots may consist of cattle with a similar frame, muscling, weight,
and breeding. Jones et al. (1992) and Schroeder et al. (1988) found feeder cattle transaction price
differentials to significantly differ between uniform and mixed cattle lots. Using 2001-2003 data,
Ward, Ratcliff, and Lalman (2004) found that average sale price increased $1.91/cwt for cattle
sold in uniform lots.
Feeder cattle prices are among the most difficult to predict due to a constantly changing
demand for slaughter cattle attributed to changing feed prices and shifting demand in both
domestic and international markets. Utilizing futures and options contracts are among the risk
management strategies available to producers when marketing cattle. Selective hedging
strategies in live cattle markets have been found to decrease the volatility of returns while
increasing profitability (Shafer, Griffin, and Johnston 1978; Schroeder and Hayenga 1988).
The stocker enterprise is in essence a margin business with highly variable input and
output prices, primarily reflected in stocker calf purchasing prices and feeder cattle market
fluctuations. Business planning for a stocker operation is particularly important, yet often
neglected by producers. A business plan defines the operation’s goals, identifies limitations, and
includes financial plans. Livestock are realistically matched to land resources, appropriate
markets are targeted, and financial resources are identified. A business plan can be particularly
useful for stocker operators since it can serve as an important reference for producers seeking

6
financing. The ultimate goal of business planning is to move the enterprise in a direction so that a
producer’s goals and objectives will be fulfilled and to provide a feasible operational/ financial
plan for fulfilling those goals (Doye 2005).
Adoption of Technologies and Management Practices
Examining the factors affecting the adoption of technologies has long been a focus of
agricultural economics research (Griliches 1957; Rogers 1983). Griliches (1957) was one of the
first economists to analyze the adoption and diffusion of technological innovations from an
economic perspective. In his analysis, profitability was found to be the largest determinant of
adoption in the case of hybrid corn. Rogers (1983) examined how various characteristics, either
real or perceived, of a certain technology affected its adoption. In his analysis, profitability
comprised only one component of adoption. Other attributes positively influencing technology
adoption included relative advantage, compatibility, complexity, trialability, and observability.
Trialability was explained as the potential to experiment with the practice on a smaller scale and
observability related to the degree to which the producer had the ability to see the results of the
implemented practice.
Farm size has frequently been identified as a significant determining factor in the
adoption of agricultural innovations (Just and Zilberman 1983; Popp, Faminow, and Parsch
1999; Diederen, et al. 2003; Gillespie, Basarir, and Schupp 2004; Rahelizatovo and Gillespie
2004; Ward, et al. 2008; Banerjee, et al. 2008). Just and Zilberman (1983) analyzed land-use
allocation and technology adoption while considering various risk preferences. The role of farm
size in technology adoption was determined by the risk attitudes and stochastic relationship of
land returns. When relative risk aversion was constant, the allocation of land devoted to modern
7
technology was proportional to farm size. If absolute risk aversion was constant, larger farms
were found to devote more land to newer technology than smaller farms.
Diederen et al. (2003) used a nested logit model to analyze determinants of adoption of
innovations in stages. Farm size and market position significantly and positively influenced
whether a producer was an innovator or early adopter of a technology. Rahelizatovo and
Gillespie (2004) examined size relative to adoption of environmental stewardship practices by
dairy producers. Results of the study clearly found that larger dairy operations were more likely
to adopt best management practices (BMPs). Gillespie, Basarir, and Schupp (2004) found larger,
commercialized beef operations to be more likely to utilize alternative cattle marketing channels.
Popp, Faminow, and Parsch 1999 analyzed factors affecting adoption of value-added
production on cow-calf farms. Although the study found farm size to be a significant factor for
adoption, farm size and scale of the operation had minimal impact on the decision to invest in
cattle backgrounding. However, the producer’s perceptions towards risk and profitability were
factors significantly impacting adoption of value-added production components into cow-calf
operations.
Caswell et al. (2001) examined how technology adoption can be driven by unquantifiable
factors by studying the relationship between farm and off-farm work and farm economic
performance. The amount of off-farm work undertaken by producers was significantly related to
the adoption of technologies that economized on managerial time. Alternatively, operators of
large farms, more dependent upon on-farm revenues and pursuing off-farm work to a lesser
extent, were more likely to adopt managerially intensive technologies such as precision
agriculture. Technology adoption was shown to be related to unquantifiable factors such as
simplicity and flexibility which translate to reduced management time. Reinforcing these

8
findings, Daberkow and McBride (2003) noted a positive relationship between full-time farming
and adoption of precision farming technologies.
Technology adoption has also been found to be contingent upon the degree to which a
producer’s net household income is generated from the operation. A greater concern for
economic efficiency exists when the total percent of household income from the cattle operation
is high. Non-adopters of BMPs tend to be less dependent upon the operation as a generator of
household income (Gillespie, Kim, and Paudel 2007). Vestal (2005) examined management
practice adoption among Oklahoma cow-calf producers using chi-square analysis. Producer
groups consisted of large, income dependent, and small, non-income dependent producers.
Numerous statistically significant differences were identified between the two producer groups
pertaining to nutrition, herd health, marketing and risk, and business management practices with
large, income dependent producers more likely to adopt recommended practices. Net household
income was a factor in adopting precision farming technologies in the cotton industry examined
by Banerjee et al. (2008), where income levels greater than $50,000 were significant in the
adoption of GPS guidance systems by cotton producers. Gillespie, Kim, and Paudel (2007)
analyzed adoption rates of 16 BMPs related to beef production in a study that focused on reasons
for non-adoption and factors influencing non-adoption. Most frequently adopted BMPs were
those that resulted in immediate economic benefits, such as grazing management practices and
mortality plus nutrient and pesticide management. Non-applicability and unfamiliarity were the
most commonly cited reasons for lack of BMP adoption.
Specialization has been found to be a significant variable affecting technology adoption
in the dairy industry. El-Osta and Morehart (2000) found specialization increased the likelihood
of dairy producers having increased technical efficiency. Furthermore, specialization and use of
9
management-intensive technologies were among the factors affecting the likelihood of a farmer
being a top performer in the industry. However, diversification in both beef and dairy production
has also been shown to influence technology adoption (Gillespie, Basarir, and Schupp 2004;
Gillespie, Kim, and Paudel 2007).
Human capital characteristics such as age, education, and experience represent another
frequently identified factor influencing technology adoption (Traoré, Landry, and Amara 1998;
Caswell et al. 2001; Daberkow and McBride 2003; Diederen et al. 2003; Gillespie, Basarir, and
Schupp 2004; Rahelizatovo and Gillespie 2004; Vestal 2005; Gillespie, Kim, and Paudel 2007;
Banerjee, et al. 2008). Education, in particular, was often demonstrated to have a strong positive
effect on the adoption of information-intensive technologies as exemplified by Caswell et al.
(2001), a study analyzing the adoption of agricultural production practices specifically relating to
nutrient, pest, soil, and water management across differing natural resource regions. Gillespie,
Basarir, and Schupp (2004) found that education increased the likelihood that Louisiana beef
producers chose alternative marketing arrangements such as private treaty or strategic alliances.
The study also found that younger producers who had greater contact with county extension
educators were more likely to retain ownership of their cattle. Similarly, age had a negative
effect on adoption of precision farming technologies in a study conducted by Daberkow and
McBride (2003). However, in the study conducted by Banerjee et al. (2008) which analyzed
factors affecting adoption of GPS guidance systems, adoption of other precision farming
technologies was found to have a larger impact on adoption probabilities than age and education
variables. Analysis of steps in the BMP adoption decision by Lousiana dairy producers were
examined by Paudel et al. (2008) where visits between producers and the U.S. Department of
Agriculture Natural Resource Conservation Service was found to increase BMP adoption
10
probabilities. In addition to operation size and income dependency, Ward et al. (2008) also used
logit models in which age, education, and farm objectives were identified as positively impacting
adoption.
When considering the adoption of BMPs, the entire farm production system must be
considered since the profitability of various technologies can be influenced between varying
production locations (Fernandez-Cornejo 2007; Caswell et al. 2001). Likewise, heterogeneity of
the resource base has been shown to influence technology adoption and profitability (Green et al.
1996; Thrikawala et al. 1999). Subsequently, climate, soil fertility, pest infestations, distance to
markets or availability of information can all serve as factors which affect the profitability and
adoption of certain technologies and management practices. Site-specific data was used by
Caswell et al. (2001) accounting for such factors.
Studies thus far have not investigated the implementation of specific management
practices in the stocker industry. Furthermore and of notable importance, RMPs have not been
evaluated in specific stocker production systems. This consideration is essential to stocker
management due to the diversified nature of the stocker industry.
Data Source and Summary
The Oklahoma Beef Cattle Manual (Lalman and Doye 2005), written by sixteen lead
authors from six academic disciplines, was distributed through local Extension offices, producer
meetings, and by e-mail request from an Oklahoma State University (OSU) website
(http://agecon.okstate.edu/cattleman/). Producers who received a copy of the Oklahoma Beef
Cattle Manual through 2006 were asked to complete a “Beef Cattle Management Practices
Assessment.” Two surveys were distributed: one for beef producers with only stockers and a
second for those also with a cow-calf operation.

11
The survey documented current management practices of Oklahoma stocker producers in
the areas of production, forage and introduced pasture, quality assurance and animal health,
marketing and risk, genetics, and business planning management. The survey asked 54 questions
with the majority of the questions being presented in 1-7 Likert scale. Other questions asked
respondents to fill in blanks with percentages and numerical values. Producers were also
questioned regarding operational characteristics, importance of specific farm objectives, extent
of off-farm work, dependency upon income generated from the stocker operation, and aspects of
human capital in addition to questions examining other demographic variables. For this study,
surveys from 186 beef producers specializing in stocker production were the focus.
Methodology
For further examination of the impact of socioeconomic and operation characteristics on
producers’ likelihood of adopting RMPs, a qualitative choice model was required. Given a set of
independent attributes and behavioral responses that are qualitative, as is often the case with
many assessment studies on farm management practices, non-linear iterative methods were
required to adequately measure likelihood estimates.
A binary logit model is used for estimation since its distribution function is bounded by 0
and 1 and it has computational advantages relative to the linear probability model (Amemiya
1981). The decision to adopt each of the designated management practices was modeled by the
logit equation as:
(1) Pi=F(Zi) = ezi / (1+ezi) = 1/(1+ e-zi), where Zi=∑ Xi'∑ βk
j=1ni=1 j
where Pi is the probability that the ith producer adopts the management practice and is regressed
against the explanatory variables (Xi). Xi is the ith row of the n x k matrix of explanatory

12
variables, βj is the k x 1 vector of parameter coefficients, n is the number of observations, and k
is the number of coefficients.
The logit model differs from multiple regression models in interpretation of the estimated
coefficients. As in the multiple regression model, the sign of the coefficient determines the
effect; however, with the logit model, the magnitude of the effect of the explanatory variable on
the dependent variable changes with the values of the explanatory variable. The coefficient
measures a one unit change in the explanatory variable based on the logarithm of the probability
ratio, or Ln[Pi/1-Pi)], of the producer choosing to adopt the management practice, Xi=1 (adopt)
or Xi=0 (not adopt), and measures the likelihood that the producer adopts the management
practice (Cox 1958). Coefficient estimates are obtained using maximum likelihood estimation by
finding the value of β that maximizes the log likelihood. The amount of increase in probability,
or “likelihood,” depends on the original values of the independent variables. The change in P
with respect to a change in X measured changes in probability:
(2) dPi/ dXi = [ezi /(1+ ezi)2]·βj = βj· Pi·(1- Pi)
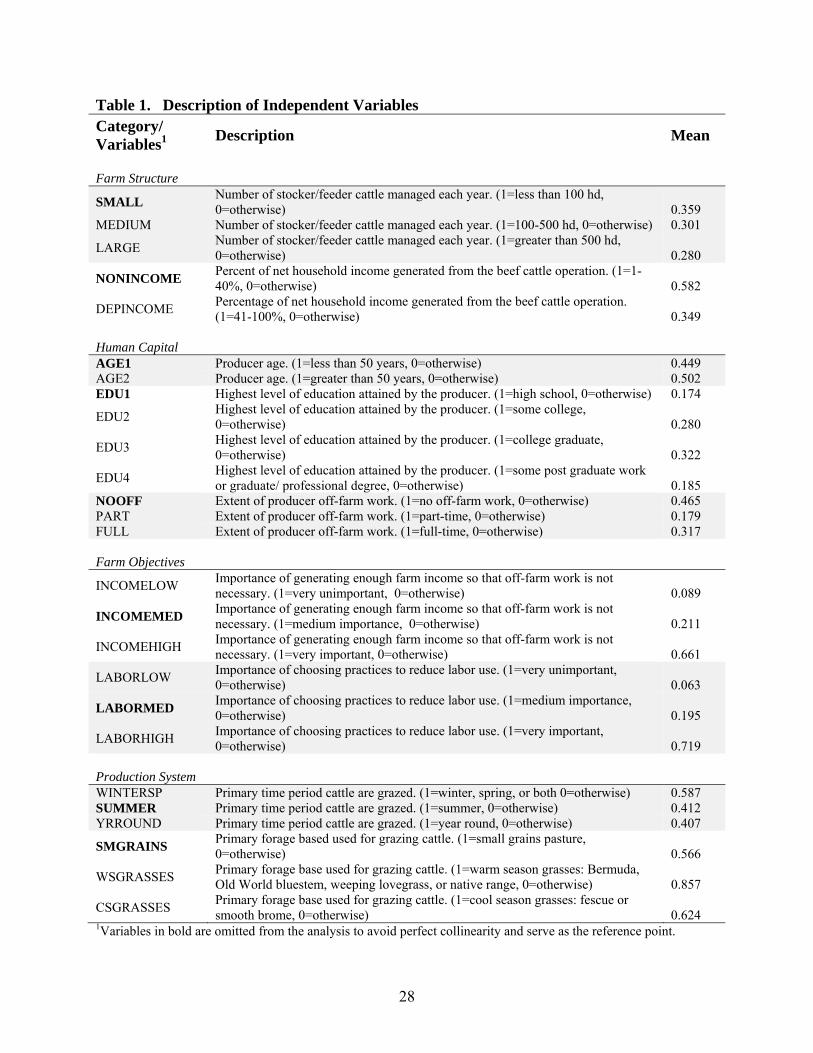
Independent variables used to measure the likelihood of management practice adoption
were socioeconomic and structural characteristics of the stocker producer and operation (Table
1). The explanatory variables included operation size (MEDIUM and LARGE), dependency
upon operation income (DEPINCOME), producer age (AGE2), education (EDU2, EDU3, and
EDU4), extent of off-farm work (PART and FULL), and the value that producers placed on
operation objectives such as generating income to reduce off-farm work (INCOMELOW and
INCOMEHIGH) and choosing management practices that reduced labor (LABORLOW and
LABORHIGH). The type of production system employed by the producer was also considered
and variables were generated to categorize grazing time periods (WINTERSP and YRROUND)

13
and forage bases (WSGRASSES and CSGRASSES). The independent variables were identified
with dummy variables (either 0 or 1). The variables SMALL, NONINCOME, AGE1, NOOFF,
INCOMEMED, REDUCEMED, SUMMER, and SMGRAINS were excluded from the estimated
models to avoid perfect collinearity. Most variables were hypothesized to have positive signs on
their estimated coefficients. However, assigning low importance to generating income to reduce
off-farm work or to choosing management practices to reduce labor were hypothesized to have
negative signs as was producer age. Detailed definitions of the independent variables are
provided in Table 1.
The empirical model used for the analysis was:
(4) Recommended Management Practice = β0 + β1 MEDIUM + β2LARGE + β3DEPINCOME + β4AGE2+ β5EDU2 + β6EDU3 + β7EDU4 + β8PART + β9FULL + β10INCOMELOW + β11INCOMEHIGH + β12LABORLOW + β13LABORHIGH + β14WINTERSP + β15YRROUND + β16WSGRASSES + β17CSGRASSES + et
Two categories were created for the dependent variables, or RMPs, to represent the
dichotomous choice in qualitative response. Dummy variables were created referring to each
RMP with 1=adopt (or nearly always) and 0=not adopt (or rarely, if ever). Specific management
practices were chosen pertaining to each area of stocker management including production,
forages, quality assurance and animal health, marketing and risk management, and business
planning management. Recommended management practices analyzed were implants,
maintenance of a proper stocking rate, administration of IM injections, marketing lot type, use of
risk management tools, and the presence of a long-term business plan for the stocker operation.
Recommended management practices, or dependent variables, are further identified and defined
in Table 2.
Results

14
Estimated coefficients from the logit analysis and percentage changes in probability for
each RMP are presented in Tables 3 and 4. Mean values of the explanatory variables, referring to
the proportion of producers taking on the particular qualitative attribute, were used in the logit
equation to calculate the changes in probability.
Implanting
Operation size, education, and production systems based on winter/ spring grazing of
small grains pasture were found to positively impact the probability that cattle are implanted
(Table 3). Both producer age and warm season grass production systems had statistically
significant negative impacts on the probability that cattle are implanted. Medium and large
operations were 11.4% and 13.6% more likely to implant cattle, respectively. As noted earlier,
implanting calves increases growth rates and the economic efficiency of growth; furthermore,
research confirms that profitability is a factor driving technology adoption by larger operators
(Griliches 1957). For operators with more cattle, additional cattle weight gain from implanting
likely equated to greater profits. In addition, the probability of implanting increased by 8.9% for
producers who indicated that they primarily use a winter or spring production system based on
small grains pasture. Using the same dataset, Johnson (2008) determined that a greater number of
large stocker operators were pursuing a small grain based production system, a factor which
might contribute to the likelihood that small grain stocker producers implant cattle. Additionally,
a small grain based production system would typically be more management intensive than a
summer pasture based system.
Producers who primarily graze cattle on warm season grasses were 23.5% less likely to
implant cattle. Consistent with our hypothesis, producers over age 50 were 6.2% less likely to
implant cattle. Despite perhaps greater years of experience, older producers were often reluctant

15
to adopt new technology (Gillespie, Basarir, and Schupp 2004). Post-graduate training or a
professional degree increased the probability by 8.1% that cattle were implanted.
Stocking Rate
Operation size, income dependency, and warm season grass production systems
significantly affected the likelihood that a producer knew how to set stocking rates (Table 3).
Producers dependent upon income generated from the stocker cattle operation were 6.8% more
likely to know how to set accurate stocking rates. These results were consistent with earlier
findings that producers were more likely to adopt technologies with immediate economic
benefits, such as grazing management practices, and that producers dependent upon stocker
income were implementing management practices which reduce costs and/ or increase
profitability. Large operations were also 4.9% more likely to know how to set proper stocking
rates. Due to economies of size, the economic benefits realized from increased plant and animal
efficiency will be greater for larger operations. Warm season production, however, negatively
impacted this likelihood by 21.1%. Producers pursuing the wheat-stocker enterprise face
complex decisions when producing both grain and beef gains from forage. Thus, producers
grazing cattle on warm season grasses do not perceive setting accurate stocking rates as critically
as do producers with dual purpose wheat.
Intramuscular Injections
Medium size operations were more likely to correctly administer IM injections in the
neck region (Table 3). Interestingly, Hoag, Ascough, and Frasier (1999) identified mid-sized
producers as most likely to adopt specific management practices, resulting in an inverted U-
shaped adoption pattern, as is demonstrated with the case of IM injections. No other statistical

16
difference was determined concerning IM injection sites and percentage changes in probability
were minimal.
Marketing Lot Type
Income dependency, producer age, and production systems based on grazing winter or
spring small grains pasture as well as warm season forage affected marketing lot types (Table 3).
Producer age was the only statistically significant factor that negatively impacted the probability
that cattle were marketed in uniform lots. Producers above age 50 were 7.9% less likely to
market cattle in uniform lots. Such findings corroborate with the results of Gillespie, Basarir, and
Schupp (2004) where younger producers utilized a greater variety of alternative marketing
arrangements. Producers dependent upon income generated from the stocker operation were
4.8% more likely to market cattle in uniform lots. Considering the additional and immediate
economic gains that can be realized from marketing cattle in uniform lots, such results were not
surprising. Production systems based both on small grains pasture and warm season grasses, the
two most common seasonal approaches to stocker production, positively impacted the adoption
of this marketing management practice. Producers engaged in production during the winter or
spring and producers grazing cattle on warm season grasses were 9.8% and 20.3%, respectively,
more likely to pool cattle together into uniform lots at time of sale. Seasonal stocker producers
had greater total herd numbers at specific points of the year and generally marketed cattle during
a designated time frame; thus, seasonal producers had an increased herd stock to assemble
uniform lots and appear to do so in a concerted effort when marketing cattle.
17
Risk Management Tools
Operation size and part-time off-farm work were factors which positively affected the use
of risk management tools such as futures, options, and/ or cash contracts (Table 3). Medium and
large operations were 0.6% and 1.7% more likely to use risk management tools, respectively.
Interestingly, higher education levels significantly reduced the probability that a producer used
futures, options, and/ or cash contracts in managing risk. Producers with some college were 5.8%
less likely to use risk management tools. The likelihood also decreased by 7.4% for college
graduates. The field of study or degree attained by the producer was not captured in the data set;
thus, education levels may not specifically relate to areas of agricultural study. Additional
variables capturing agricultural related education and/ or participation in extension educational
programs would have perhaps shed more light on such counter-intuitive results. Part-time off-
farm work, however, positively influenced the use of risk management tools by 0.9%. According
to Harwood et al. (1999), the riskiness of farm income is positively related to working off the
farm; thus, producers working off the farm may be more risk averse, leading such producers to
be more attentive to risk management tools.
Business Plan
Numerous statistically significant factors were identified regarding producers’ probability
of having a long-term business plan for their operation (Table 3). Income dependency, some
college education, full-time off-farm work, and the use of cool season forages positively
impacted this probability, while producer age and the use of warm season grasses had a negative
impact. Producers dependent upon income generated from the stocker operation were 7.2% more
likely to have a long-term business plan. Vestal (2005) also found income dependent cow-calf
producers to be more likely to have a business plan. Such results were not surprising as
producers who derive a greater percentage of net income from their cattle operation have a

18
greater incentive to maximize profit. Furthermore, the business plan aids in efficiently allocating
financial resources to achieve operational objectives. Producers who indicated they had at least
some college education were 5.0% more likely to have a business plan. The probability increased
by 6.1% for producers engaged in full-time off-farm work. Producers over age 50 were 9.8% less
likely to have a long-term business plan, demonstrating that older producers may be less
concerned with expanding and improving the operation. Vestal (2005) also noted the same trend
regarding long-term business plans with older cow-calf producers. Producers grazing cattle on
cool season grasses were 10.1% more likely to have a long-term business plan. The probability
decreased by 33.9% for producers primarily utilizing warm season grasses. Results specifically
related to production system are particularly important for targeting producer groups for future
extension education programs.
Conclusions and Implications
Few studies have analyzed technology and recommended management practice adoption
in the stocker cattle industry. Previously, knowledge of practices in this segment remained
somewhat ambiguous due to the large variety of production strategies and systems. We analyzed
the probability of adoption of six recommended management practices, specifically implanting,
stocking rates, IM injections site, marketing lot type, use of risk management tools, and long-
term business planning. Binomial logit models were used to model adoption behavior using
variables relating to farm structure, human capital, producer evaluation of certain farm
objectives, and production system.
Results demonstrated a clear disparity between producer groups regarding management
practice adoption behavior. Numerous statistically significant variables were identified; however,
operational characteristics had the most impact upon adoption probabilities. Operation size was
significant in four of six management practices modeled and positively affected adoption of each
19
practice analyzed. Income dependency was also statistically significant for half of the practices
analyzed. Despite differing production strategies for the stocker and cow-calf beef enterprises,
the impacts of size, income dependency, age, and education on adoption rates were nonetheless
evident.
Extension educational programs such as the Oklahoma State University Master
Cattleman program seek to enhance the profitability of beef cattle operations and the quality of
life of beef cattle producers through education. However, our research results suggest that if
large and small, income dependent and non-income dependent producer groups become
increasingly differentiated from one another with growing disparity between rates of adoption,
such programs will become increasingly advantageous to the small, income dependent producer.
This also suggests that when educational resources are limited, efforts could be targeted to the
groups with the highest return on investment.
Education levels had a positive impact on adoption probabilities. Interestingly, education
levels beyond a high school education negatively influenced the use of futures, options, and/ or
cash contracts in most instances. Future research which differentiates between fields of education
related to agriculture as opposed to non-related fields and which accounts for extension
education might yield informative results. Likewise, knowledge about producer attitudes towards
risk would be helpful.
Similar to previous studies, a common finding was the negative impact that producer age
has on adoption rates. Producers over age 50 are simply less likely to adopt recommended
practices without special incentives. Younger producers have a longer time horizon over which
to recoup any costs associated with technology adoption. If age is consistently identified as a

20
factor negatively impacting adoption of technology which is beneficial to society, incentive
programs for older producers may need to be considered.
Educational programs can encourage technology adoption. Considering Oklahoma’s role
in beef production, high levels of technology adoption in the stocker sector have the potential to
result in sizable economic impacts for the state. Thus, it is essential that producers engaged in
specific areas of beef production, such as stocker production and systems with a specific forage
base, are identified and targeted for extension educational programs. Until this study, technology
adoption by stocker producers had not been examined in detail, nor had differing production
systems been considered. Results revealed that seasonal stocker producers, primarily producers
engaged in the wheat-stocker enterprise, were more likely to adopt recommended practices while
year-round producers lagged behind in adoption. A better understanding of producer groups and
their characteristics should enable extension educators to identify producer groups that would
benefit from educational programs. While conferences targeted to wheat-stocker producers are
ongoing in Oklahoma, other stocker systems have received less emphasis and could be
beneficial.
In addition to having implications for educators, this analysis could interest producers. As
producers gain a better understanding of the stocker industry as a whole, it is foreseeable that
smaller, income dependent producers, for example, will be made aware of their status as laggards
in adoption. This could spur adoption as the practices analyzed in this study should not be
limited to larger operators. Economies of scale, for example, should not hinder producers from
implanting cattle, being knowledgeable in setting proper stocking rates, knowing where to
properly administer injections, marketing cattle in uniform lots, using risk management tools, or

21
having a long-term business plan. The same is true for producers pursuing differing production
strategies.
Limitations of this research should be mentioned. Data generated from the survey
instrument does not represent a random sample. Many producers who requested or received a
copy of the Beef Cattle Management Practice Assessment were interested in becoming part of
the Master Cattleman program. Therefore, findings may not be extrapolated to the stocker
producer population unconditionally. Furthermore, more detailed analysis could have been
conducted if the sample size were larger.
Future research might compare results with those from the recent National Stocker
Survey analysis. The National Stocker Survey was conducted by Elanco and Beef Magazine, in
conjunction with Kansas State University in 2007-2008. Comparisons with the national survey
might reveal interesting results. An analysis could also be conducted examining the economic
impact resulting from the disparity in adoption probabilities between producer groups. Future
research might also include cost-benefit analysis for certain practices and for particular groups of
producers. Considering the importance of the beef industry to Oklahoma, and the role that
Oklahoma plays as a stocker producing state, an analysis of this scope would have regional and
national implications.

22
1 Best management practices are often associated with natural and environmental resource
management practices. This study analyzes management practices recommended by extension
educators and researchers; thus the term recommended management practices (RMPs) is used.

23
References
Amemiya, T. 1981. “Qualitative Response Models: A Survey.” Journal of Economic Literature
19(1): 1483-1536.
Avent, R. K., C. E. Ward, and D. L. Lalman. 2004. “Market Valuation of Preconditioning Feeder
Calves.” Journal of Agricultural and Applied Economics 36(1): 173-83.
Banerjee, S., S.W. Martin, R. K. Roberts, S. L. Larkin, J. A. Larson, K. W. Paxton, B. C.
English, M. C. Marra, and J. M. Reeves. 2008. “A Binary Logit Estimation of Factors
Affecting Adoption of GPS Guidance Systems by Cotton Producers.” Journal of
Agricultural and Applied Economics 40(1): 345-355.
Caswell, M., K. Fuglie, C. Ingram, S. Jans, and C. Kascak. 2001. Adoption of Agricultural
Production Practices: Lessons Learned from the U.S. Department of Agriculture Area
Studies Project. Washington, D.C.: U. S. Department of Agriculture, Economic Research
Service, Agricultural Economic Report No. 792.
Cox, D. R. 1958. “The Regression Analysis of Binary Sequences.” Journal of the Royal
Statistical Society 20(2): 215-242.
Daberkow, S. G. and W. D. McBride. 2003. “Farm and Operator Characteristics Affecting the
Awareness and Adoption of Precision Agriculture Technologies in the US.” Precision
Agriculture 4(2): 163-177.
Dexter, D.R., G. L. Cowman, J. B. Morgan, R. P. Clayton, J. D. Tatum, J. N. Sofos, G. R.
Schmidt, R. D. Glock, and G. C. Smith. 1994. “Incidence of Injection-Site Blemishes in
Beef Top Sirloin Butts.” Journal of Animal Science 72(4): 824-827.

24
Diederen, P., H van Meijl, A. Wolters, and K. Bijak. 2003. “Innovation Adoption in Agriculture:
Innovators, Early Adopters and Laggards.” Cahiers d’Economie et Sociologie Rurales
67(2): 29-50.
Doye, D. 2005. “Ranch Business Planning and Management.” Beef Cattle Manual 5th ed. D.
Lalman and D. Doye, eds. Oklahoma Cooperative Extension Service, Oklahoma State
University.
El-Osta, H. S. and M. J. Morehart. 2000. “Technology Adoption and Its Impact on Production
Performance of Dairy Operations.” Review of Agricultural Economics 22(2): 477-498.
Fernandez-Cornejo, J. 2007. Off-Farm Income, Technology Adoption, and Farm Economic
Performance. Washington, D.C.: U. S. Department of Agriculture, Economic Research
Service, Agricultural Economic Report No. 36.
Gillespie, J., A. Basarir, and A. Schupp. 2004. “Beef Producer Choice in Cattle Marketing.”
Journal of Agribusiness 22(2): 149-161.
Gillespie, J., S. Kim, and K. Paudel. 2007. “Why don’t producers adopt best management
practices? An analysis of the beef cattle industry.” Agricultural Economics 36(1): 89-102.
Green, G., D. Sunding, D. Zilberman, and D. Parker. 1996. “Explaining Irrigation Technology
Choices: A Microparameter Approach.” American Journal of Agricultural Economics
78(4): 1064-1072.
Griliches, Z. 1957. “Hybrid Corn: An explanation in the Economics of Technological Change.”
Econometrica 25(4): 501-522.
Hart, R.H., M. J. Samuel, P. S. Test, and M. A. Smith. 1988. “Cattle, Vegetation, and Economic
Responses to Grazing Systems and Grazing Pressure.” Journal of Range Management
41(4): 282-286.

25
Harwood, J., R. Heifner, K. Coble, J. Perry, and A. Somwaru. 1999. Managing Risk in Farming:
Concepts, Research, Analysis. Washington, D.C.: U. S. Department of Agriculture,
Economic Research Service, Agricultural Economic Report No. 774.
Hoag, D. L., J. C. Ascough, and W. M. Frasier. 1999. "Farm Computer Adoption in the Great
Plains." Journal of Agricultural and Applied Economics 31(1): 57-67.
Johnson, R. J. 2008. “Adoption of Recommended Management Practices in Stocker Cattle
Production.” Master’s Thesis. Department of Agricultural Economics, Oklahoma State
University, Stillwater, Oklahoma.
Jones, R., T. Schroeder, J. Mintert, and F. Brazle. 1992. “The Impacts of Quality on Cash Fed
Cattle Prices.” Southern Journal of Agricultural Economics 24(2): 149-162.
Just, R. E., and D. Zilberman. 1983. “Stochastic Structure, Farm Size, and Technology Adoption
in Developing Agriculture.” Oxford Economic Papers 35: 307-328.
Lalman, D., and D. Doye. 2005. Beef Cattle Manual, 5th ed. Oklahoma Cooperative Extension
Service, Oklahoma State University.
Paudel, K., W. Gauthier, J. Westra, and L. Hall. 2008. “Factors Influencing and Steps Leading to
the Adoption of Best Management Practices by Louisiana Dairy Farmers.” Journal of
Agricultural and Applied Economics 40(1): 203-222.
Peel, D. S. 2003. “Beef Cattle Growing and Backgrounding Programs.” The Veterinary Clinics:
Food Animal Practice. 19(2): 365-385.
Popp, M. P., M. D. Faminow, and L. D. Parsch. 1999. “Factors Affecting the Adoption of Value-
Added Production on Cow-Calf Farms.” Journal of Agricultural and Applied Economics
31(1): 97-108.

26
Rahelizatovo, N. C., and J. M. Gillespie. 2004. “The Adoption of Best-Management Practices
by Louisiana Dairy Producers.” Journal of Agricultural and Applied Economics 36(1):
229-240.
Reuter, R., G. Highfill, D. Lalman. 2005. “Implants and Their Use in Beef Cattle Production.”
Beef Cattle Manual 5th ed. D. Lalman and D. Doye, eds. Oklahoma Cooperative
Extension Service, Oklahoma State University.
Rogers, E. 1983. Diffusion of Innovations, 3rd Edition. Free Press, New York.
Schmitz, T. G., C. B. Moss, and A. Schmitz. 2003. “Marketing Channels Compete for U.S.
Stocker Cattle.” Journal of Agribusiness 21(2): 131-148.
Schroeder, T., and M. L. Hayenga. 1988. “Comparison of Selective Hedging and Options
Strategies in Cattle Feedlot Risk Management.” Journal of Futures Markets 8(2): 141-
156.
Schroeder, T.C., J. Minert, F. Brazle, and O. Grunewald. 1988. “Factors Affecting Feeder Cattle
Price Differentials.” Western Journal of Agricultural Economics 13(1): 71-81.
Selk, G. E., R. R. Reuter, and G. L. Kuhl. 2006. “Using Growth Promoting Implants in Stocker
Cattle.” Veterinary Clinics of North America: Food Animal Practice 22(2): 435-449.
Shafer, C. E., W. L. Griffin, and L. D. Johnston. 1978. “Integrated Cattle Feeding Hedging
Strategies,” Southern Journal Agricultural Economics. 10: 34-42.
Thrikawala, S., A. Weersink, G. Kachanoski, and G. Fox. 1999. “Economic Feasibility of
Varible-Rate Technology for Nitrogen on Corn.” American Journal of Agricultural
Economics 81: 914-92.

27
Traoré, N., R. Landry, and N. Amara. 1998. “On-Farm Adoption of Conservation Practices: The
Role of Farm and Farmer Characteristics, Perceptions, and Health Hazards.” Land
Economics 74(1): 114-127.
U. S. Department of Agriculture (USDA), Animal and Plant Health Inspection Services
(APHIS). 2000. “Injection Practices in U.S. Feedlots.” Washington, DC. Available at:
http://nahms.aphis.usda.gov/feedlot/
U. S. Department of Agriculture (USDA), National Agricultural Statistics Service (NASS). 2008.
“Cattle.” Washington, DC. Available at:
http://usda.mannlib.cornell.edu/usda/nass/Catt//2000s/2008/Catt-02-01-2008.pdf
Vestal, M. K. 2005. “Production Practices and Management Intensity of Oklahoma Cow-Calf
Producers across Income and Herd Size.” Master’s Thesis. Department of Agricultural
Economics, Oklahoma State University, Stillwater, Oklahoma.
Ward, C.E., M. Vestal, D. Doye, and D. Lalman. “Factors Affecting Adoption of Cow-Calf
Production Practices in Oklahoma.” Journal of Agricultural and Applied Economics 40,
3 (2008):December.
Ward, C.E., C.D. Ratcliff, and D.L. Lalman. 2004. “Buyer Preferences for Feeder Calf Traits.”
Division of Agricultural Sciences and Natural Resources. AGEC-602, Oklahoma State
University.
28
Table 1. Description of Independent Variables Category/ Variables1 Description Mean
Farm Structure
SMALL Number of stocker/feeder cattle managed each year. (1=less than 100 hd, 0=otherwise) 0.359
MEDIUM Number of stocker/feeder cattle managed each year. (1=100-500 hd, 0=otherwise) 0.301
LARGE Number of stocker/feeder cattle managed each year. (1=greater than 500 hd, 0=otherwise) 0.280
NONINCOME Percent of net household income generated from the beef cattle operation. (1=1-40%, 0=otherwise) 0.582
DEPINCOME Percentage of net household income generated from the beef cattle operation. (1=41-100%, 0=otherwise) 0.349
Human Capital AGE1 Producer age. (1=less than 50 years, 0=otherwise) 0.449 AGE2 Producer age. (1=greater than 50 years, 0=otherwise) 0.502 EDU1 Highest level of education attained by the producer. (1=high school, 0=otherwise) 0.174
EDU2 Highest level of education attained by the producer. (1=some college, 0=otherwise) 0.280
EDU3 Highest level of education attained by the producer. (1=college graduate, 0=otherwise) 0.322
EDU4 Highest level of education attained by the producer. (1=some post graduate work or graduate/ professional degree, 0=otherwise) 0.185
NOOFF Extent of producer off-farm work. (1=no off-farm work, 0=otherwise) 0.465 PART Extent of producer off-farm work. (1=part-time, 0=otherwise) 0.179 FULL Extent of producer off-farm work. (1=full-time, 0=otherwise) 0.317 Farm Objectives
INCOMELOW Importance of generating enough farm income so that off-farm work is not necessary. (1=very unimportant, 0=otherwise) 0.089
INCOMEMED Importance of generating enough farm income so that off-farm work is not necessary. (1=medium importance, 0=otherwise) 0.211
INCOMEHIGH Importance of generating enough farm income so that off-farm work is not necessary. (1=very important, 0=otherwise) 0.661
LABORLOW Importance of choosing practices to reduce labor use. (1=very unimportant, 0=otherwise) 0.063
LABORMED Importance of choosing practices to reduce labor use. (1=medium importance, 0=otherwise) 0.195
LABORHIGH Importance of choosing practices to reduce labor use. (1=very important, 0=otherwise) 0.719
Production System WINTERSP Primary time period cattle are grazed. (1=winter, spring, or both 0=otherwise) 0.587 SUMMER Primary time period cattle are grazed. (1=summer, 0=otherwise) 0.412 YRROUND Primary time period cattle are grazed. (1=year round, 0=otherwise) 0.407
SMGRAINS Primary forage based used for grazing cattle. (1=small grains pasture, 0=otherwise) 0.566
WSGRASSES Primary forage base used for grazing cattle. (1=warm season grasses: Bermuda, Old World bluestem, weeping lovegrass, or native range, 0=otherwise) 0.857
CSGRASSES Primary forage base used for grazing cattle. (1=cool season grasses: fescue or smooth brome, 0=otherwise) 0.624
1Variables in bold are omitted from the analysis to avoid perfect collinearity and serve as the reference point.

29
Table 2. Description of Recommended Management Practices Category/ Management Practice Description MeanProduction Implanting Steers are implanted. (1=nearly always, 0=rarely, if ever) 0.362 Forages
Stocking Rate The producer has knowledge of setting and monitoring a proper stocking rate. (1=yes, 0=no, or not sure) 0.483
Quality Assurance and Animal Health
IM Injections Intramuscular injections are administered in the neck. (1=nearly always, 0=rarely, if ever) 0.111
Marketing and Risk Management Marketing Type Lot type used for marketing cattle. (1=uniform lots, 0=mixed lots) 0.257
Risk Management Tools Feeder cattle futures, options, and/or cash contracts are used to lock in expected fixed prices. (1=nearly always, 0=rarely, if ever) 0.895
Business Planning Business Plan The producer has a long-term business plan. (1=yes, 0=no) 0.497

30
Table 3. Results of Logit Models for Selected Recommended Practices
Implanting Stocking Rate Intramuscular Injections Category/ Variables Coefficient
Standard Error
Change in Probability Coefficient
Standard Error
Change in Probability Coefficient
Standard Error
Change in Probability
Intercept -0.2320 0.8359 - 0.4648 0.7305 - 13.9135 268.0000 - Farm Structure MEDIUM 1.5221* 0.4918 11.40% 0.4271 0.4170 3.19% 1.8500** 0.8867 1.43% LARGE 1.9480* 0.5874 13.55% 0.7083*** 0.4504 4.93% 1.0030 0.8560 0.81% DEPINCOME -0.0106 0.5235 -0.08% 0.7794** 0.4026 6.79% 0.0653 0.8662 0.03% Human Capital AGE2 -0.6037* 0.4428 -6.20% -0.0075 0.3498 -0.09% 0.3331 0.6327 0.27% EDU2 0.1202 0.5864 0.84% 0.4079 0.4901 2.83% 0.0099 0.8737 0.00% EDU3 0.8088 0.5594 6.39% 0.5354 0.4629 4.27% 0.5738 0.8882 0.30% EDU4 1.7844* 0.6818 8.05% 0.4439 0.5374 2.02% -0.0521 0.9344 -0.02% PART 0.6011 0.6096 2.28% -0.4595 0.4902 -2.05% -0.9831 0.8334 -0.22% FULL -0.3597 0.5458 -2.52% 0.0137 0.4347 0.11% -0.2827 0.8177 -0.11% Farm Objectives INCOMELOW 0.5032 0.7345 1.11% -0.7298 0.6670 -1.56% -0.5882 1.0718 -0.09% INCOMEHIGH 0.8076 0.5309 12.64% -0.4297 0.4346 -6.94% 0.3033 0.7205 0.31% LABORLOW 0.2022 0.9651 0.16% 0.6305 0.8060 0.58% -0.9968 1.3712 -0.04% LABORHIGH 0.0448 0.5601 0.71% 0.3595 0.4471 6.45% -0.5618 0.8779 -0.48% Production System WINTERSP 0.6833*** 0.4070 8.94% -0.0555 0.3468 -0.81% 0.3844 0.6012 0.30% YRROUND -0.2931 0.4313 -2.86% -0.1758 0.3431 -1.78% -0.5703 0.6415 -0.38% WSGRASSES -1.6198** 0.8434 -23.46% -1.1256*** 0.6630 -21.13% -11.2531 268.0000 -0.73% CSGRASSES 0.2628 0.4743 1.64% -0.2056 0.3854 -2.38% -1.1711 0.8685 0.00% *Indicates significance at .01 level. **Indicates significance at .05 level. ***Indicates significance at .10 level.

31
Table 3 (continued). Results of Logit Models for Selected Recommended Practices
Marketing Lot Type Risk Management Tools Business Plan Category/ Variables Coefficient
Standard Error
Change in Probability Coefficient
Standard Error
Change in Probability Coefficient
Standard Error
Change in Probability
Intercept -0.0837 0.9204 - -2.6331 1.6965 - 0.1772 0.8106 - Farm Structure MEDIUM 0.6109 0.5115 3.36% 2.0701*** 1.2400 0.58% 0.1528 0.4271 1.14% LARGE 0.5513 0.6068 2.84% 4.4570* 1.4257 1.66% 0.2901 0.4822 2.01% DEPINCOME 0.7943*** 0.5521 4.78% 0.1568 0.7605 0.22% 0.8346** 0.4222 7.16% Human Capital AGE2 -1.1943* 0.4733 -7.88% -0.0136 0.7354 -0.03% -0.7821** 0.3668 -9.76% EDU2 -0.0121 0.6189 -0.07% -1.8310*** 1.0154 -5.84% 0.7345*** 0.5169 5.01% EDU3 0.6634 0.6083 3.98% -2.1617*** 1.2179 -7.43% 0.0494 0.4918 0.38% EDU4 0.9907 0.7085 3.45% -1.3896 1.0610 -3.20% 0.5547 0.5622 2.48% PART 0.8249 0.6252 2.80% 2.0201*** 1.0754 0.92% 0.3296 0.4956 1.42% FULL 0.7661 0.5840 4.49% 1.0733 0.9686 0.85% 0.7810*** 0.4627 6.06% Farm Objectives INCOMELOW -0.8355 0.7723 -1.35% 2.0095 1.5445 0.78% -0.2785 0.6848 -0.62% INCOMEHIGH 0.408 0.5483 4.45% -0.2340 1.0185 -0.58% -0.0043 0.4461 -0.07% LABORLOW -0.8222 0.9789 -0.33% -1.9307 2.8520 -0.52% 1.3339 0.8416 1.20% LABORHIGH -0.7719 0.6074 -7.25% -0.8691 0.9203 -3.66% 0.2584 0.4448 4.57% Production System WINTERSP 1.1506* 0.4291 9.80% 0.1758 0.8801 0.39% -0.3472 0.3621 -5.09% YRROUND -1.20258 0.4775 -9.76% 0.0796 0.8298 0.12% 0.1249 0.3573 1.26% WSGRASSES 1.2362*** 0.7890 20.27% -0.9068 1.2670 -5.99% -1.6495* 0.3865 -33.89% CSGRASSES -0.2827 0.5225 -4.22% -0.5032 0.7729 -2.89% 0.8432** 0.4115 10.09% *Indicates significance at .01 level. **Indicates significance at .05 level. ***Indicates significance at .10 level.