factors affecting chemistry …repository.out.ac.tz/1332/1/dissertation_-_theresia.pdffactors...
TRANSCRIPT

FACTORS AFFECTING CHEMISTRY PERFORMANCE IN ORDINARY
LEVEL NECTA EXAMINATIONS FROM 2009 TO 2012: A CASE OF
SELECTED SCHOOLS IN DAR ES SALAAM
THERESIA SALATIEL SHEMHILU
A DISSERTATION SUBMITTED IN PARTIAL FULFILMENT OF THE
REQUIREMENTS FOR THE DEGREE OF MASTER OF EDUCATION IN
ADMINISTRATION, PLANNING AND POLICY STUDIES OF THE OPEN
UNIVERSITY OF TANZANIA
2015

ii
CERTIFICATION
The undersigned certifies that she has read and hereby recommends for acceptance
by the Open University of Tanzania a dissertation titled: “Factors Affecting
Chemistry Performance in Ordinary Level NECTA Examinations from 2009 to
2012: A Case of Selected Schools in Dar es Salaam,” in partial fulfillment of the
requirements for the degree of Master of Education in Administration, Planning and
Policy Studies of the Open University of Tanzania.
…………..……………………
Dr. Stanslus Kashinje
(Supervisor)
………………………………..
Date
iii
COPYRIGHT
No part of this dissertation may be reproduced, stored in any system, or transmitted
in any form by any means, electronic mechanical, photocopying recording or
otherwise without prior written permission of the author or the Open University of
Tanzania in that behalf.

iv
DECLARATION
I, Theresia Salatiel Shemhilu, do hereby declare to the Senate of the Open
University Tanzania that this dissertation is my own original work and it has not
been submitted for a degree in any other University.
…………..……………………
Signature
………………………………..
Date
v
DEDICATION
This dissertation is dedicated to my husband Rev. Allen Adam Mbiso for his close
support during my research work.

vi
ACKNOWLEDGEMENTS
I would like to give thanks to the Lord my God, who made me study this programme
and reach up to this point of my research. I express my gratitude to my lovely
husband Rev. Allen Adam Mbiso for his cordial support and encouragement to press
on my research work up to this stage. Also, I give special thanks to my supervisor
Dr. Stanslaus Kashinje from Physical Science Department at the Open University of
Tanzania. He worked with me hand by hand to make sure that I progress well. His
concerns, guidance, tolerance and encouragement played a significant role in
preparing, organising and compiling this research work throughout the various stages
of its developments.
I also, give many thanks to the Regional Executive Officer (REO) who provided me
with the required data, as well as, permitted me to conduct the research in the three
Dar es Salaam Municipalities, which are Iala, Temeke and Kinondoni.
Moreover, my additional thanks should go to the District Education Officers (DEOs)
of the three Municipals who allowed me to collect data at the selected schools
namely, Kambangwa Secondary, Mbezi Beach Secondary, Jamhuri Secondary,
Airwing Secondary and Kibasila Secondary.
Not to be forgotten are the heads of the selected schools and chemistry teachers for
their kind cooperation in selecting the students for interviews. Moreover, I appreciate
the cooperation of the interviewed students who participated well during the
interviews. Special acknowledgements should go to the MOEVT officials, who
supplied me with the secondary data needed for the research work.
vii
ABSTRACT
The major objective of the study was to find out factors affecting chemistry
performance in Ordinary Level National examinations from 2009 to 2012 with
reference to selected schools in Dar es Salaam City. From 2008 to 2012 the overall
National chemistry pass rate in Ordinary Level secondary schools were below 50%.
The study wanted to find the pattern of the Form Four student’s performance in the
NECTA examinations from 2009 to 2012, as well as, the students’ and teachers’
opinions on that poor performance. The study used cross sectional research design to
collect data from the population samples. It employed two stage-sampling design to
select the 100 respondents who were form three students studying chemistry from
selected schools. The first stage used purposive sampling to select 5 schools in Dar
es Salaam. The second stage used simple random sampling to select 20 form three
students, ten boys and ten girls from each of the five schools. Purposive sampling
was also used to select key informants. Data collection was done by using
questionnaires, interviews and documentary review. Data from questionnaires were
collected, edited, coded and summarized and then analysed using the Statistical
Package for Social Sciences Version 12.0 (SPSS 12.0 for windows). Descriptive
statistics such as frequencies and percentages were employed to show the patterns
revealed from the findings. The major findings of the study show that insufficient
facility distribution and accessibility in secondary schools, problems of enough
qualified chemistry teachers in schools and poor students’ home support services
were among the major challenges which led to poor performance in the NECTA
examinations results. The study recommends to provide enough learning facilities, as
well as, enough motivated chemistry teachers in secondary schools.
viii
TABLE OF CONTENTS
CERTIFICATION ..................................................................................................... ii
COPYRIGHT ............................................................................................................ iii
DECLARATION ....................................................................................................... iv
DEDICATION ............................................................................................................ v
ACKNOWLEDGEMENTS ...................................................................................... vi
ABSTRACT .............................................................................................................. vii
LIST OF TABLES .................................................................................................. xiii
LIST OF FIGURES ................................................................................................ xiv
APPENDICES ......................................................................................................... xvi
LIST OF ABBREVIATIONS ............................................................................... xvii
CHAPTER ONE ........................................................................................................ 1
INTRODUCTION TO THE STUDY ....................................................................... 1
1.1 Introduction .................................................................................................... 1
1.2 Background to the Problem ........................................................................... 2
1.3 Problem Statement ......................................................................................... 7
1.4 Research Objectives ....................................................................................... 8
1.4.1 Main Objective............................................................................................... 8
1.4.2 Specific Objectives ........................................................................................ 8
1.4.3 Research Questions ........................................................................................ 8
1.5 Significant of the Study ............................................................................... 11
1.6 Limitations of the Study............................................................................... 11
1.7 Delimitations of the Study ........................................................................... 12

ix
1.8 Definition of Key Terms .............................................................................. 12
1.8.1 Interview ...................................................................................................... 12
1.8.2 Questionnaire ............................................................................................... 12
1.8.3 Variable ........................................................................................................ 13
1.8.4 Independent Variable ................................................................................... 13
1.8.5 Dependent Variable ..................................................................................... 13
1.8.6 Performance ................................................................................................. 13
1.8.7 Motivation .................................................................................................... 13
1.8.8 Laboratory .................................................................................................... 13
1.9.9 Library.......................................................................................................... 14
CHAPTER TWO ..................................................................................................... 15
LITERATURE REVIEW ........................................................................................ 15
2.1 Introduction .................................................................................................. 15
2.2 Theoretical Review ...................................................................................... 15
2.2.1 Active Learning: Learn by Doing ................................................................ 15
2.2.2 Teaching in Multiple Learning Modalities .................................................. 15
2.2.3 Teaching to Multiple Intelligences .............................................................. 16
2.3.4 Metacognition: Teaching Students to Think about their Thinking .............. 16
2.2.5 Constructivism ............................................................................................. 17
2.3 Empirical Review......................................................................................... 17
2.3 Overview of Natural Science Subjects in Africa ......................................... 18
2.3.1 Science Subjects in Sub-Sahara Africa ........................................................ 18
2.3.2 Effective Assessments and Examination System ........................................ 21
2.4 Science Subjects in Eastern and Southern Africa ........................................ 22
x
2.5 Chemistry Subject in Tanzania .................................................................... 22
2.5.1 National Objectives of Chemistry Subject Policy in Ordinary Level
Secondary Schools ....................................................................................... 23
2.5.2 General Objectives and Competences for Chemistry Subject Policy in
Secondary Schools ....................................................................................... 23
2.5.2.1 General Objectives for Chemistry Subject .................................................. 23
2.5.2.2 General Competences for Chemistry Subject .............................................. 23
2.6 Issues Related to Performance in Secondary Schools ................................. 24
2.7 Performance and Teachers ........................................................................... 25
2.8 Chapter Summary of Knowledge Gap ......................................................... 29
CHAPTER THREE ................................................................................................. 31
RESEARCH METHODOLOGY ........................................................................... 31
3.1 Introduction .................................................................................................. 31
3.2 Study Area and the Rationale ...................................................................... 31
3.3 Methodology and Research Design ............................................................. 33
3.4 Sampling Procedure ..................................................................................... 33
3.4.1 Population Sample and Size......................................................................... 33
3.4.2 Sampling Methods ....................................................................................... 34
3.5 Data Collection ............................................................................................ 35
3.5.1 Primary Data ................................................................................................ 35
3.5.2 Secondary Data ............................................................................................ 35
3.6 Instruments ................................................................................................... 35
3.6.1 Questionnaires.............................................................................................. 35
3.6.2 Interview ...................................................................................................... 36

xi
3.7 Data Management and Procedure ................................................................ 36
3.7.1 Data Collection and Processing ................................................................... 36
3.7.2 Data Analysis ............................................................................................... 36
3.7.3 Ethical Consideration ................................................................................... 37
CHAPTER FOUR .................................................................................................... 38
RESULTS AND DISCUSSION .............................................................................. 38
4.1 Introduction .................................................................................................. 38
4.2 Demographic Characteristics of the Respondents ....................................... 38
4.2.1 Sex of the Respondents ................................................................................ 39
4.2.2 Age of the Respondents ............................................................................... 39
4.3 Brief Analysis of the General National Form Four Results
from 2009 to 2012 ........................................................................................ 40
4.4 Brief analysis of National Form Four Chemistry Results
from 2009 to 2012 ........................................................................................ 42
4.5 Factors Affecting Chemistry Performance in NECTA Examinations ......... 43
4.5.1 Student Interests in Chemistry ..................................................................... 44
4.5.2 Curriculum Related Factors ......................................................................... 45
4.5.3 Human Resources Related Factors .............................................................. 46
4.5.4 Home Based and Related Factors ................................................................ 47
4.5.5 Schools’ Motivations ................................................................................... 48
4.5.6 Facility Related Factors ............................................................................... 49
4.5.6.1 Chemistry Textbooks ................................................................................... 50
4.5.6.2 Chemistry Laboratories ................................................................................ 53
4.5.6.3 Non- Chemistry Laboratories ...................................................................... 55

xii
4.6 Students Perceptions on Chemistry Performance in their Schools .............. 56
4.7 Students Perceptions on Chemistry Performance in the NECTA
Examinations................................................................................................ 57
4.8 Constraints Facing Chemistry Subject ......................................................... 60
CHAPTER FIVE ...................................................................................................... 62
CONCLUSIONS AND RECOMMENDATIONS ................................................. 62
5.1 Conclusions .................................................................................................. 62
5.2 Recommendations ........................................................................................ 64
REFERENCES ......................................................................................................... 65
APPENDICES .......................................................................................................... 71

xiii
LIST OF TABLES
Table 3.1: Distribution of Selected Secondary Schools by Dar es Salaam
Districts ................................................................................................... 33
Table 3.2: Distribution of Selected Secondary Schools by Dar es Salaam
Districts ................................................................................................... 34
Table 4.1: Percentage of the Ages of Secondary Schools Students Interviewed ..... 39
Table 4.2: Percentages of all Subjects Form Four National Examinations
Pass Rates 2005 to 2012 .......................................................................... 40
Table 4.3: Percentages of Chemistry Performance in National Form Four
Examinations from 2009 to 2012 ............................................................ 42
Table 4.4: Percentage Distribution of Students with their Own Chemistry Books .. 51
Table 4.5: Percentages of Students who Entered Chemistry Laboratory for
Studies or Observing a Demonstration.................................................... 54
Table 4.6: Percentage Distribution of Students' Views on Chemistry
Performance in their Schools .................................................................. 56

xiv
LIST OF FIGURES
Figure 1.1: NECTA Organization Structure .............................................................. 4
Figure 1.2: Conceptual Frameworks ......................................................................... 9
Figure 3.1: Map of Dar es Salaam ........................................................................... 32
Figure 4.1: Percentage Distributions of the Ages of the Secondary Schools
Students interviewed ............................................................................. 40
Figure 4.2: Percentages of all Subjects Form Four National Examinations
Pass Rate 2004-2012 ............................................................................. 41
Figure 4.3: Percentages of Chemistry Performance in the National Form Four
Examinations from 2009 to 2012 .......................................................... 43
Figure 4.4: Students' Opinions on Human Resource Related Factors Affecting
Chemistry Performance ........................................................................ 47
Figure 4.5: Distribution of Students Support on Chemistry Subject from their
Parents/Guardians ................................................................................. 48
Figure 4.6: School Motivations on Chemistry Subject for Good Students
Performers ............................................................................................. 49
Figure 4.7: Students' opinion on Facility Related Factors Affecting Chemistry
Performance .......................................................................................... 50
Figure 4.8: Percentage Distributions of Students with Chemistry Textbooks
and how they got them .......................................................................... 51
Figure 4.9: Percentage Distributions of Students with their Own Chemistry
Textbook ............................................................................................... 52

xv
Figure 4.10: Histogram showing Percentage Distributions of Students with their
Own Chemistry Textbooks ................................................................... 52
Figure 4.11: Percentage Distributions on Students' Opinions about their Schools
Chemistry Laboratories' Availability of Necessary Chemical and
Apparatus .............................................................................................. 53
Figure 4.12: Histogram showing Percentage of Students who Entered Chemistry
Laboratory for Studies or Observing a Demonstration ......................... 54
Figure 4.13: Percentage Distributions on Students' Opinions on the Presence
of other Laboratories in their Schools ................................................... 55
Figure 4.14: Histogram showing Percentage Distributions of Students'
Views on Chemistry Performance in their Schools .............................. 57
Figure 4.15: Histogram showing Percentage Distributions of Students'
Perceptions on the Possible Reasons for Declining of Form
Four Chemistry NECTA Examinations Results ................................... 58
Figure 4.16: Histogram showing Students' Views on the Constraints of
Chemistry Subject in Secondary Schools ............................................. 60
xvi
APPENDICES
Appendix 1: Questionnaire for Form Three Chemistry Students ............................. 71
Appendix 2: Interview Guide for Chemistry Teachers in Secondary Schools ......... 74
Appendix 3: Interview Guide for other Key Informants such as TIE Staff .............. 76

xvii
LIST OF ABBREVIATIONS
BEST Basic Education Statistics of Tanzania
DEOs District Education Officers
ESA Eastern and Southern Africa
HIV/AIDS Human Immunodeficiency Virus/Acquired Immuno Deficiency
Syndrome
MOEVT Ministry of Education and Vocational Training
NGOs Non-Governmental Organisations
NSGRP National Strategy for Growth and Reduction of Poverty
NECTA National Examination Council of Tanzania
OUT Open University of Tanzania
PEDP Primary Education Development Programme
REO Regional Education Officer
SEDP Secondary Education Development Programme
SPSS Statistical Package for Social Science
SSA sub-Sahara Africa
UNESCO United Nations Educational, Scientific and Cultural
Organisation
URT United Republic of Tanzania
TIE Tanzania Institute of Education
1
CHAPTER ONE
INTRODUCTION TO THE STUDY
1.1 Introduction
Assessment of performance is a method of teaching and learning that involves both
process and product. It is not just a testing strategy. Performance assessment tasks
involve students in constructing various types of products for diverse audiences.
Students also are involved in developing the process that leads to the finished
product. Performance assessment measures what students can do with what they
know, rather than how much they know. Performance assessment tasks are based on
what is most essential in the curriculum and what is interesting to a student.
Performance of examinations in secondary schools remained to be the major
criterion for measuring success and qualification in academic achievements for a
long time. Examination results tell whether the student understood her studies or not.
In Tanzania, the National Form Four Examination results which are administered by
The National Examination Council of Tanzania (NECTA) had been used to express
to what extent the school is good or bad in Ordinary Level education. They even
attract parents and caregivers to select good secondary schools.
However, the history of Tanzania Ordinary Level education shows that performance
in Natural science subjects such as Biology, Chemistry, Physics and Mathematics
have not being good as compared to arts or social science subjects. Many researches
had been done with respect to several causing factors but the problem remains.

2
1.2 Background to the Problem
Education and development of any society are always related; better life of the
people in any country can never be separated from better education especially in
natural science education. UNESCO (2008) pointed out that education level in a
particular society is direct proportional to the level of poverty in a given society;
thus, improving education plays a crucial role in poverty reduction, health
development as well as economic growth.
Performance in the National Examinations is one of the major criterions defining the
success of the students as well as of the secondary schools in Tanzania. Best schools
in Tanzania can never being recognized without their students’ best performance in
the National Examinations results as compared to other secondary schools. The
National Examinations Council of Tanzania (NECTA) is Government Institution,
which was established by the Parliamentary Act No. 21 of 1973. NECTA is
responsible for the administration of all National Examinations in Tanzania.
The decision to establish NECTA was a follow-up of an earlier move, in April 1971,
when Tanzania Mainland pulled out of the East African Examinations Council
(EAEC) to conduct her own examinations. Zanzibar pulled out of EAEC in 1970.
Before the pull out, between 1968 and 1971, Tanzania sat for foreign Secondary
School Examinations conducted jointly by the East African Syndicate, which before
then were conducted by the Cambridge Local Examinations Syndicate alone. The
Examinations conducted by the Cambridge Local Examinations Syndicate then were
the School Certificate and the Higher School Certificate Examinations. The School

3
Certificate Examinations was taken by the African Students for the first time in 1947
and that of the Higher School Certificate in 1960 (NECTA, 2015a).
The Functions of the National Examinations Council of Tanzania are:
(i) To formulate examinations policy in accordance with the principles of
education for self reliance and the education and training policy;
(ii) To ensure responsibility for examinations within the United Republic of
Tanzania and to make provision for places and centres for examinations;
(iii) To receive from other persons or bodies of persons reports or other material
affecting examinations policy and from time to time to consider and review
examinations policy as circumstances may require;
(iv) To co-operate with other persons or bodies of persons in the orderly
development of an examinations system in the United Republic of Tanzania;
(v) To conduct examinations for, and to grant, diplomas, certificates and other
awards of the council;
(vi) To act as the body which shall facilitate, administer and supervise foreign
examinations in Tanzania (NECTA, 2015a).
NECTA is led by the Council which functions for a period of 4 years and it consists
of the following committees:
(i) Executive Committee responsible for the day to day running of the Council
(ii) School Examinations Committee responsible for school examinations
(iii) Professional Examinations Committee responsible for professional
examinations.
4
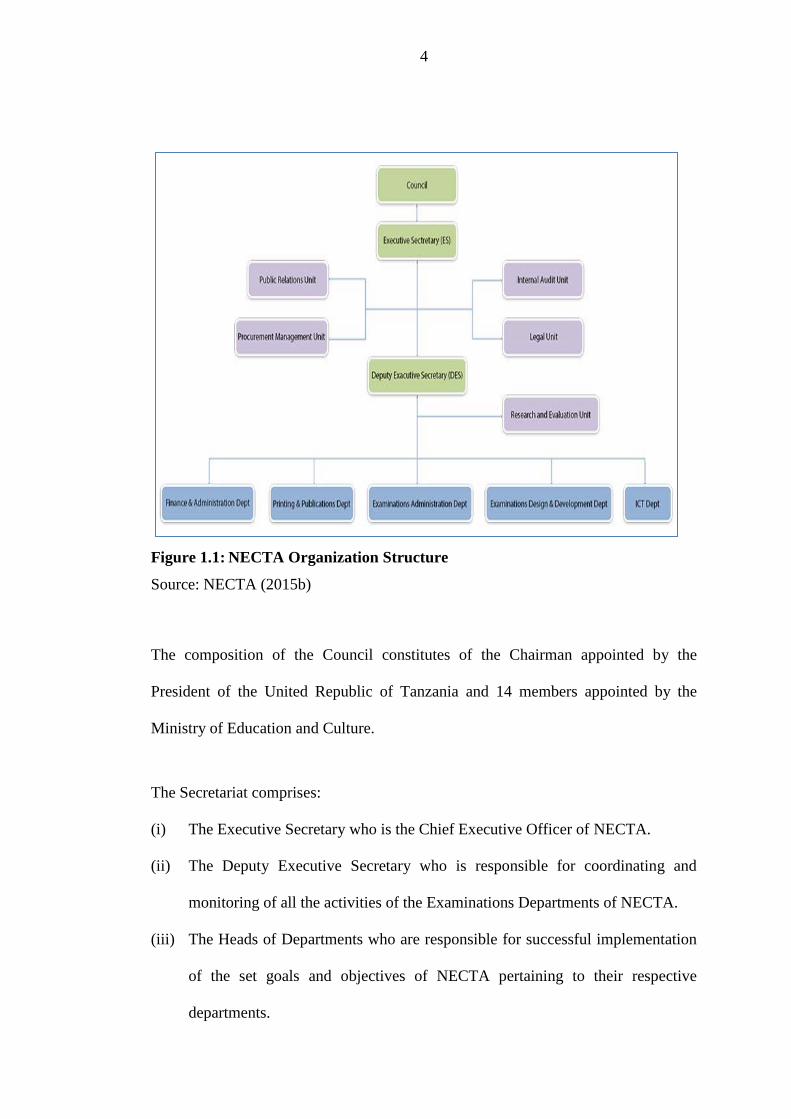
Figure 1.1: NECTA Organization Structure
Source: NECTA (2015b)
The composition of the Council constitutes of the Chairman appointed by the
President of the United Republic of Tanzania and 14 members appointed by the
Ministry of Education and Culture.
The Secretariat comprises:
(i) The Executive Secretary who is the Chief Executive Officer of NECTA.
(ii) The Deputy Executive Secretary who is responsible for coordinating and
monitoring of all the activities of the Examinations Departments of NECTA.
(iii) The Heads of Departments who are responsible for successful implementation
of the set goals and objectives of NECTA pertaining to their respective
departments.

5
(iv) Heads of Sections who are responsible for the successful implementation of the
day-to-day work of their sections (NECTA, 2015b).
Rapid, worldwide change has significantly altered global educational needs,
challenging societies to transform the structures and processes of education. In
developing countries such as Tanzania, educational change means providing a
quality of education that better addresses the needs of ever-expanding technologies
in information systems, communications, medicine and engineering. The current
Tanzanian educational system, which was meant to serve an agriculturally-based
society, will not allow teachers and students to adapt to meet the economic and social
demands that such global transformation is bringing. As a result, there is a wide
discrepancy between the knowledge, skills and competencies that school graduates
have and the needs of society (UNESCO, 2008).
Secondary education plays an essential role in the development of the economy and
the education system itself. Experience shows that, the majority of the people in both
the private and public sectors are expected to be secondary education leavers. The
primary education system relies on teachers who are the product of secondary
education system. Candidates of higher and tertiary education training are the
products of the secondary education system. This is the essence of being pivotal of
secondary education being fundamental in the development of the economy of any
country (Komba et al. 2013).
Improvement of natural science subjects such as Chemistry, Physics and Biology in
secondary schools remains to be the major challenge in the lower developing

6
countries like Tanzania. These subjects require physical materials such as apparatus,
chemicals and special laboratories which are always expensive for the less
developing societies to afford. Lack of laboratory and laboratories facilities hinders
good performance in science subjects. Furthermore, poor science learning has a lot to
do with poor learning facilities SEDP (2010).
Despite the fact that, Natural science subjects are important for development of any
developing country such as Tanzania; Results in Form Four NECTA examinations
show clearly that performance in these subjects is lower than in social science or arts
subjects for years. Moreover, the number of students studying different natural
science subjects has remained small as compared to those studying the social science
subjects. However, several attempts to improve performance in these subjects have
been in place. One example is the National Strategy for Growth and Reduction of
Poverty II (NSGRP II) Cluster 2.3.1 is giving emphasis to improvement of education
(NSGRP, 2010).
Furthermore, the NSGRP had been incorporated in the Secondary Education
Development Programme Phase II (SEDP II) which dwells on improvement of
quality and relevance of secondary education, enhancing of access and quality, as
well as, improvement of the teaching force and teaching process (SEDP, 2010). In
spite of these attempts the performance of students in these subjects in examinations
remains a major challenge. The problem seems to arise from many factors such as
facilities related ones like lack of reliable chemistry laboratory and equipment. The
problem cannot have single solution since it comprises of multi-related factors. This
study focuses on the performance of students in National chemistry examination in

7
ordinary level secondary schools from 2009 to 2012 in Dar es Salaam as a case
study.
1.3 Problem Statement
There is an alarming statistics which shows poor performance of secondary schools
in the chemistry subject for schools in Tanzania. The problem has been rising with
time from 2009 to date. Form Four Chemistry NECTA examination results show that
the pass rate has been below 50% from 2008 to 2012 consecutively (BEST, 2011)
and (NECTA, 2012). Studies have been done concerning wide range of anticipated
factors affecting good Chemistry performance in National examination such as
availability of chemistry facilities in secondary schools (Maina, 2009) and how
teaching environment can affect performance in secondary schools (Gwambombo,
2013).
However, despite of the National programs such as SEDP and several researches, the
problem continues to prevail. Form Four Chemistry National examination results
should at least be above 50% pass rate so as to achieve the desired future impact of
this subject in the development of Tanzania. On the contrary, chemistry pass rates
had been generally below 50% for several years, for example, from 2009 to 2012
(NECTA, 2012). These results show a clear discrepancy or gap between what is
expected versus what is happening. Hence, this is the crucial problem to be
researched on. In this study we have also focused on the role of Science Laboratory
Technicians in the performance of chemistry Form Four National Examinations. The
previous studies have not looked at this issue.

8
1.4 Research Objectives
1.4.1 Main Objective
The main objective of the study was to find out factors affecting students’
performance in chemistry subject in ordinary level secondary examinations of the
National Examination Council of Tanzania (NECTA). The study was limited to Dar
es Salaam city with data for the period from 2009 to 2012. It was in this period that,
the overall National pass rate in NECTA examinations was below 50% for three
years from 2009 to 2012 (NECTA, 2012).
1.4.2 Specific Objectives
The following are the specific objectives of the study:
(i) To analyse performance in the Form Four NECTA examination results from
2009 to 2012. This helped to give out an analysis to the background of the
problem. It revealed trends which are useful in identifying factors that affect
performance.
(ii) To determine teacher and students perceptions on poor chemistry NECTA
examination performance.
(iii) To collect and identify factors leading to poor performance of chemistry
students in ordinary level secondary school examinations.
1.4.3 Research Questions
This study was guided by the following research questions;
(i) What are the patterns of the Form Four student performance in the NECTA
examinations from 2009 to 2012?
9
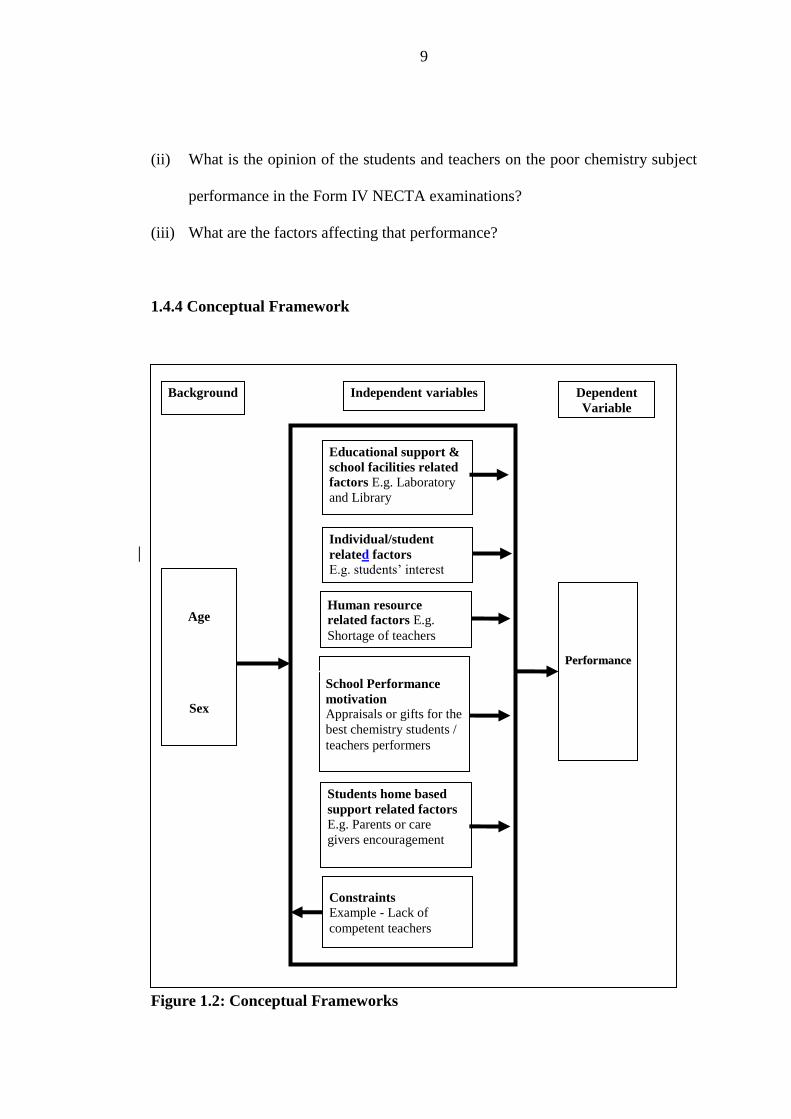
(ii) What is the opinion of the students and teachers on the poor chemistry subject
performance in the Form IV NECTA examinations?
(iii) What are the factors affecting that performance?
1.4.4 Conceptual Framework
Figure 1.2: Conceptual Frameworks
PPeerrffoorrmmaannccee
Dependent
Variable
Independent variables Background
Variables
Educational support &
school facilities related
factors E.g. Laboratory
and Library
School Performance
motivation
Appraisals or gifts for the
best chemistry students /
teachers performers
Individual/student
related factors
E.g. students’ interest
Age
Sex
Religion
Students home based
support related factors E.g. Parents or care
givers encouragement
Constraints
Example - Lack of
competent teachers
Human resource
related factors E.g.
Shortage of teachers

10
The study had a look into the social and economic factors affecting performance of
students in chemistry NECTA examinations in Dar es Salaam. These factors were
treated as independent variables while the impact on the performance on the form
four NECTA examinations was considered as dependent variable (Figure 1.1).
Although examination performance is a multidisciplinary study which can include a
wide number of variables the study decided to focus on the following for detailed
analysis; student or personal related factors: this includes students’ interest to the
subject and perceptions.
These factors can affect the students’ morale of study and commitments hence; they
can influence the performance outcomes. Others are curriculum related factors like
problems facing the implementation of the competence based curriculum. For
example learning environments may affect the students’ performance in NECTA
examinations by affecting the learning mood- of the students. Furthermore, human
resources related factors which include shortage of chemistry teachers can lead to
heavy teachers’ workloads that consequently affect teachers’ efficiency. Student
home based related factors: these include students’ home economy and support.
Studying morale can begin at home.
Moreover, school motivations such as gifts to the good chemistry students’
performers can increase students’ confidence to the subject and thus, students’
commitment. Facility related factors like availability and accessibility of laboratories
and apparatus can influence learning interest. Finally availability of qualified
Chemistry teachers and Laboratory Technicians is also an important factor.

11
1.5 Significant of the Study
The study is in line with National Strategy for Growth and Reduction of Poverty II
(NSGRP II) Cluster 2.3.1 giving emphasis to improvement of education (NSGRP,
2010). This is due to the fact that the study deals with factors affecting chemistry
performance in ordinary level NECTA examinations. These examinations are the
major criterion of measuring the improvement of science education in secondary
school.
Also, it is in line with the Secondary Education Development Programme Phase II
(SEDEP II) which dwells on improvement of quality of relevance of secondary
education, enhancing of access and quality, as well as, improvement of the teaching
force and teaching process (SEDP, 2010). Since for three consecutive years of
investigation pass rates for chemistry subject in the Form IV NECTA Examinations
were below 50% this is an alarming reason requiring further studies.
1.6 Limitations of the Study
Since social science researches on human aspects of the world depend on human
beings as their major source of information, they are therefore, subjected to many
factors oriented to human consent and understanding. These challenges of social
science researchers are mostly dominant in less developed countries in Africa.
(Chigora and Mutenheri, 2007). The following are some of the major problems
encountered during the research process;
(i) Some respondents were too ambitious and based on their personal feelings on
their responses’ hence created some biases, which finally implied some
problems in data reporting.

12
(ii) The study encountered some bureaucracy oriented problems from public
institutions in getting research data. However, with perpetual follow up most of
the required data were obtained.
1.7 Delimitations of the Study
Delimitations are choices made by the researcher which should be mentioned. They
describe the boundary set for the study; they describe the parameters of the
investigation. In educational research the delimitations normally deal with such items
as population sample, setting and instrumentation. The study put its delimitations in
terms of study area and period of investigation. Dar es Salaam was selected to be the
study area due to the fact that, Dar es Salaam is one of the regions with the largest
number of schools and students. Moreover, the study focuses on Chemistry NECTA
examinations results from 2009 to 2012 in order to cover current trend of
performance within four years of study time. Furthermore, it was in this range where
chemistry pass rates were below 50% in three years continually.
1.8 Definition of Key Terms
1.8.1 Interview
An interview involves presentation of oral-verbal stimuli and reply in terms of oral-
verbal responses (Kothari, 2007). The presenter of the oral verbal stimuli is known as
an interviewer where as the one who responds is known as an interviewee.
1.8.2 Questionnaire
A questionnaire consist of a number of questions printed or typed in a defined order
onto a form or set of form which is given to a respondent who is expected to answer

13
the questions and return them to the researcher. Quite often questionnaire is
considered as the heart of a survey operation (Kothari, 2007).
1.8.3 Variable
A variable is a concept which can take on different quantitative values such as
number, weight, sex and income (Kothari, 2007).
1.8.4 Independent Variable
Independent variable is a variable which is not affected by the dependent variable but
affect the dependent variable.
1.8.5 Dependent Variable
Dependent variable is a variable which is affected by independent variable.
1.8.6 Performance
Performance is the results or grades acquired in examinations.
1.8.7 Motivation
Motivation is the act of being motivated or being cause to do something. In this
research motivation are incentives which cause either chemistry students or
chemistry teachers in secondary school to act positively on the subject.
1.8.8 Laboratory
Laboratory is a room or building for scientific research and experiments.
14
1.9.9 Library
Library is a building or store room that contains learning materials such as books and
periodicals that may be used in that building or borrowed and taken from the
building.
1.9.10 Constraints
Constraints are the things which affect performance in negative way example lack of
competent teachers in secondary schools.

15
CHAPTER TWO
LITERATURE REVIEW
2.1 Introduction
This chapter focuses on the literature related to the specific objectives of the study. It
reviews literature about the learning situation especially in the less developed
countries like Tanzania, the objectives of teaching chemistry in Tanzania. Also, it
highlights the theories of learning sciences, some issues relating to performance in
secondary schools, what other researchers have written about the subject and the gap
requiring further research.
2.2 Theoretical Review
There are numerous theories and perspectives concerning the teaching and learning
of science subjects. Some of the more prominent ones are:
2.2.1 Active Learning: Learn by Doing
Active learning is a set of strategies that places the responsibility of learning to the
student. Discovery learning, problem-based learning, experiential learning, and
inquiry-based instruction are examples of active learning (Herr, 2010). In Tanzania,
this is hardly practiced due to lack of facilities and qualified teachers and Laboratory
Technicians.
2.2.2 Teaching in Multiple Learning Modalities
We can learn through any of our five senses, but the three most valuable are vision,
hearing, and touch. Theorists and practitioners claim that learners have a preference

16
for one learning style over another. Visual learners learn best by watching, while
auditory learners learn best by verbal instruction, and kinesthetic learners learn best
by manipulation. Because of the demands of the profession, teachers often resort to
the instructional style that requires the least time and preparation, namely lecture and
discussion. Although these may be valuable approaches to teaching and learning,
they fail to take advantage of other learning modalities, and marginalize students
whose primary modality is visual (Herr, 2010).
2.2.3 Teaching to Multiple Intelligences
Intelligence is a property of the mind that includes many related abilities such as the
capacities to reason, plan, solve problems, comprehend language and ideas, learn
new concepts, and think abstractly. Historically, psychometricians have measured
intelligence with a single score (Intelligence Quotient, IQ) on a standardized test,
finding that such scores are predictive of later intellectual achievement.
Furthermore, there are multiple intelligences, and that no single score can accurately
reflect a person’s intelligence. More importantly, the theory of multiple intelligences
implies that people learn better through certain modalities than others, and that the
science teacher should design the curriculum to address as many modalities as
possible (Herr, 2010).
2.3.4 Metacognition: Teaching Students to Think about their Thinking
John Flavel argues that learning is maximized when students learn to think about
their thinking and consciously employ strategies to maximize their reasoning and
problem solving capabilities. A metacognitive thinker knows when and how he
learns best, and employs strategies to overcome barriers to learning. As students
17
learn to regulate and monitor their thought processes and understanding, they learn to
adapt to new learning challenges. Expert problem solvers first seek to develop an
understanding of problems by thinking in terms of core concepts and major
principles. By contrast, novice problem solvers have not learned this metacognitive
strategy, and are more likely to approach problems simply by trying to find the right
formulas into which they can insert the right numbers. A major goal of education is
to prepare students to be flexible for new problems and settings. The ability to
transfer concepts from school to the work or home environment is a hallmark of a
metacognitive thinker (Herr, 2010).
2.2.5 Constructivism
This is a technique in which students are guided to build their understanding of
science. Constructivism is a major learning theory, and is particularly applicable to
the teaching and learning of science. Piaget suggested that through accommodation
and assimilation, individuals construct new knowledge from their experiences (Herr,
2010) Constructivism views learning as a process in which students actively
construct or build new ideas and concepts based upon prior knowledge and new
information. The constructivist teacher is a facilitator who encourages students to
discover principles and construct knowledge within a given framework or structure.
Seymour Papert, a student of Piaget, affirmed that learning occurs particularly well
when people are engaged in constructing a product (Herr, 2010).
2.3 Empirical Review
Researches conducted in some developing countries by Munro and Elson (2000)
indicated that, only 30% of students studied physics and 32% studied chemistry and

18
mathematics at their higher learning in 1994. These percentages decreased to 25%
and 26% respectively in 2005 as pointed out by research by Lyons (2005). Similar
trends can be seen in France, Germany and other Developed countries where for
example, the students’ enrolment number has been decreasing in different rates
(Mabula, 2012). Other examples include the trend in some countries such as Norway
which experienced decrease at the rate of 40% as from 1994 to 2003, Denmark had
20% decrease as from 1994 to 2002, Germany 20% as from 1994 to 2001 and the
Netherlands had6% as from 1994 to 2001 (Mabula, 2012). In many developed
countries like Sweden, there has been a decline in the number of students studying
Chemistry at the university level. Many studies tried to explain why students
studying chemistry in secondary level are not interested in Chemistry at the tertiary
level (Bromanet al., 2011).
These researches show that there is global decline of students studying natural
science subjects in secondary schools. There is also a serious concern on the reasons
why many students who do core science subjects in secondary schools choose not to
take science programmes and science related specializations in their higher learning.
Moreover, they depict that many graduates who graduate in science fields choose not
to pursue science related occupations regardless of their good qualifications in
science courses.
2.3 Overview of Natural Science Subjects in Africa
2.3.1 Science Subjects in Sub-Sahara Africa
Access to general secondary education remains important in the foreseeable future of
developing Africa. Maintaining the qualities of secondary programmes is critical to
19
insure a supply of well-qualified candidates for universities and other tertiary
institutions.
International economic and technology developments have increased the importance
of science subjects at secondary level. Performance in these subjects on international
tests has been linked to better economic growth; they prepare students with
knowledge and skills necessary to function in their local societies. Science subjects
especially in developing countries, including sub-Sahara Africa (SSA), are facing
common problems; most of the programmes are too academic and difficult.
Furthermore, there is a large gap between the intended curriculum and what is
actually taught in the classroom (Verspoor, 2008). The causes are well known, some
of them are,
(i) Lack of teaching material and other resources.
(ii) Curriculum crowding and poor time-on-task management, leaving little room
for a learner centred approach.
(iii) Lack of teacher confidence with content resulting from poor teacher
qualification; and
(iv) Overcrowding classes, which hinder laboratory classes and learner-centred
problem solving.
As a result, there have been poor science subject performances. For example in 2000,
Namibia had 18 percent pass rate in junior secondary education in mathematics;
Zimbabwe had a 28 percent pass rate in ordinary secondary examinations in core
sciences (Verspoor, 2008).

20
Many SSA countries are moving towards more integrated science approaches in
secondary levels of education. This direction aligns with the international trends and
it can enhance the relevance of the science curricula and can reduce curriculum
overload. The importance of integrating separate science subjects into broader
science learning areas is significant; it provides a more holistic picture of science; it
focuses on the real world problems that are cross cutting, and promotes science
reasoning skills across a paradigm learning context.
These benefits give a basis for living in the rapid changing societies that increasingly
demand judgments and decisions informed by science understanding. New topics
have been added to the curricula, such as HIV/AIDS education (in all Anglophone
countries except Botswana), environmental education, and issues related to science
and technology. Sometimes, as in Ghana and Namibia, topics may include
agriculture and environment (Verspoor, 2008). Implementing these integrated
curricula had been facing some critical challenges including:
(i) Teachers already struggle with new approaches to teaching that are commonly
attached to new subjects combinations, and they are expected to maintain the
new developments.
(ii) Teachers lack the required combined knowledge of the related subjects to teach
the integrated learning areas in a meaningful way because they have not been
trained to do so (although Ghana provides for integrated science studies in
teacher education).
(iii) The instructional materials, such as textbooks, for both learning areas and new
academic approaches are lacking (Verspoor, 2008).

21
2.3.2 Effective Assessments and Examination System
Modern curricula in SSA formally include learning outcomes such as
comprehension, application of knowledge, methodological and social competencies,
and problem solving. Some SSA countries maintain that they use a wide range of
techniques to assess and examine the knowledge and skills of secondary school
students.
However, on the contrary the reality is different, to many countries, current
assessment and examination practices are largely limited to recapitulation of
memorized facts even when curriculum statements insist higher skills and
competencies. Examinations and classroom assessments that only require students to
reproduce statements, facts, and definitions will train students’ rote learning and
memorization, whatever the aims of the secondary curriculum will be (Verspoor,
2008).
The effectiveness of examinations for certification and selection is another challenge
to where cheating and corruption influence examination results. Correction of exams
is an important quality criterion, closely connected to questions of equity and quality.
Extreme examples of widespread examination leakages and other fraudulent
practices are commonly reported throughout SSA, one of them is Ghana junior
secondary examinations of 2002, which were cancelled and repeated nationwide
(Verspoor, 2008). In addition, these problems are generally prevailing in all African
countries since, even in Eastern and Southern Africa there are similar examples. In
Tanzania the Form Four National examinations of 1998 were cancelled and repeated
nationwide (Mallya, 2004).

22
2.4 Science Subjects in Eastern and Southern Africa
Natural science subjects in Eastern and Southern Africa (ESA) are facing similar
challenges as in other parts of Africa such as Sub-Sahara Africa. Since
independence, science subjects had been facing critical challenges especially due to
lack of qualified teachers, teaching facilities and laboratories. In some countries such
as Tanzania some science subjects were not taught at all, for some time, in some
technical secondary schools due to lack of teachers (Ishumi, 1994).
In spite of the fact that, there had been a number of developments to rescue the
situation, the problems are still prevailing to date. For example, after the end of
UNESCO Science Project in the 1970s; laboratory and field activities and
enthusiasm continued only as long as the equipments and materials supplied by the
project lasted. In many ESA countries once equipment wore out or chemicals were
used up, replacement was either slow or simply not done. In their annual budgets, the
ministries of education and their parastatal institutions gave little consideration to
science teaching equipment as critical input in science teaching and technological
training (Ishumi, 1994).
2.5 Chemistry Subject in Tanzania
According to the results in the Form Four National examinations in Ordinary Level
Secondary Schools the overall general performance of Chemistry, like other natural
science subjects, have not been as good as the social science subjects. They are
usually either slightly below or slightly above 50% pass. A good example is on the
years of investigation of this study from 2009 to 2012 where, the general Chemistry
performance was below 50% pass rate for three years (NECTA, 2012).

23
2.5.1 National Objectives of Chemistry Subject Policy in Ordinary Level
Secondary Schools
With reference to the 1997 Chemistry subject syllabus, which was revised in 2010,
there is a pattern shift from content to competence based curricula which gives room
for the pupils to build skills and competences in the subject. It promotes the
constructivist approaches whereby the learner participates actively in the
construction and acquisition of knowledge (URT, 2010b). The knowledge acquired
in chemistry subject is both theory and practical based (TIE, 2011).
2.5.2 General Objectives and Competences for Chemistry Subject Policy in
Secondary Schools
The following are the general objectives and competences for Chemistry subject in
ordinary secondary school education;
2.5.2.1 General Objectives for Chemistry Subject
By the end of the four years course, the student should be able to:
(i) design and perform chemistry experiments;
(ii) understand symbols, formulae and equations in order to communicate in
chemistry;
(iii) acquire chemistry skills, knowledge and principles to solve daily life problems;
(iv) appreciate application of the scientific principles and knowledge in exploitation
of natural resources with conservation of environments (URT, 2010a).
2.5.2.2 General Competences for Chemistry Subject
By the end of four years course, the students should have developed competences in:
(i) developing knowledge in chemistry by doing various activities and/or
experiments;

24
(ii) applying chemical symbols, formulae and equations to communicate in
chemistry;
(iii) applying chemistry knowledge skills and principles to solve daily life
problems;
(iv) Using science and technological skills in conserving and making sustainable
use of the environment (URT, 2010a).
2.6 Issues Related to Performance in Secondary Schools
Results in secondary school examinations are one of the basic factors showing
success or failure in academic performance. These factors have been linked to many
other variables. For example, study on preference and performance in natural science
subjects at Udzungwa Secondary School, Kilolo Iringa, showed that; age of learners,
sex, ignorance, shortage of learning materials, gender bias by subject teachers and
lack of guidance on the future importance of science were the prevailing reasons for
poor performances and preferences on natural science subjects among other reasons
(Nyamba and Mwajombe, 2012).
In addition to that, even though the issue of poor performing students is well known
to education stakeholders such as teachers, school owners and is a famous
discussion, it is not well incorporated in some critical areas. For example, according
to the National Audit performance report on school inspection programmes for
secondary schools in Tanzania delivered in 2008, it was found that, there were no
clear priorities on poor performing students in mathematics and science subjects in
the school inspectorates’ own annual operational planning for inspections.

25
The issue of poor performing students was not well addressed in issues of guidelines
to school inspectors. According to these guidelines inspectors were supposed to go
through 148 items at each inspection. But only 16 of these items were referring to the
issues of poor performing students. Thus, these guidelines gave ground for
inadequate information to the Government on how to improve education system in
the country. Failure to capture the issue of poor performing students in the school
inspectorates’ annual planning guidelines to a greater extent hampered the efficiency
and effectiveness of conducted school inspection programmes.
Also, there were no routine for monitoring and evaluation for conducted inspections
which were important part of learning system about implementation and impact of
provided information. Not only that but also there were no compilation of
recommendations which were very important in their implementation and for the
impact on school performance (URT, 2008).
2.7 Performance and Teachers
Tanzania has been struggling for improved universal access to quality education for a
long time. Through PEDEP and SEDP Tanzania made remarkable increase of both
primary and secondary enrolment to the extent of receiving an award at the
Millennium Development Goals Summit in 2010 (Kim, 2013). However, this
achievement brought problems on the quality of education. President Jakaya Kikwete
(President of the Republic of Tanzania 2005 - 2015) when addressing the UNESCO
conference in 2007 said, “The increase in access to education through PEDP and
SEDP has led to low quality of education that will require the government to put the
need for improved quality of education high on the agenda of SEDP II alongside

26
with improved infrastructure, teaching facilities, better salaries, building teachers’
houses especially in rural areas, and investing in science education” (UNESCO,
2007).
The increased number of students led to the shortage of qualified teachers especially
in natural science subjects not only in Tanzania but also in many sub-Saharan
countries. Many countries allowed unqualified students to enter the teaching
profession without any form of training. In Tanzania paraprofessional teachers were
employed to handle the massive increase in the number of students. In 2006 the
Government of Tanzania decided to employ form six secondary school graduate
students with less than one month training and posted them to teach in secondary
schools especially in rural areas with low salaries. These paraprofessional teachers
comprised 26.2% of rural teachers in 2007(Kim, 2013). This policy was stopped in
2009 due to its adverse effect on the quality of education in the country (Kim, 2013).
Furthermore, in private schools, headmasters and headmistresses were employing
secondary school student leavers to teach natural science subjects (Chemistry being
one of them) to cover the shortage of qualified teachers. These teachers were paid by
parental funding without any kind of training as teachers. They were not official
employees of the Government, they were known only by the headmasters or
headmistresses (Kim, 2013).
These challenges caused a continuous declining of performance in the public
examinations. In Tanzania the National Examination Council of Tanzania (NECTA)
is the governing authority of the public examinations in secondary schools.
Performance in NECTA examinations determines the efficiency and success in

27
education. According to Basic Education Statistics in Tanzania (BEST, 2011)
percentage of candidates who failed increased from16.3%) in the year 2008
to(49.6%) in the year 2010 although the enrolment increased from (1, 222, 403
pupils) in the year 2008 to(1, 638, 699 pupils) in the year 2010. Chemistry subject
performance results dropped from (57.1%) in the year 2009 to (43.9%) in the year
2010 (URT, 2011).
Rubaha (2008) studied the factors influencing good performance in Tanzanian
schools. The study found that in the selected schools; motivations were provided for
both teachers and students. Teachers and students’ commitment towards learning
was observed; academic foundation for the students, committed and qualified
teachers, reasonable teacher student ratio, relationship among teachers and students
in the whole process of learning was observed. The study pointed out that students’
academic performance is determined both by teachers and student commitment
towards the process of learning.
Wilson (2013) studied the determinants of poor academic performance in community
secondary schools in Tanzania at Kinondoni Municipality in Dar es Salaam. The
following are some of the major findings of the study; community secondary schools
were facing challenges such as the lack of teaching and learning resources,
overcrowding in the classroom, lack of science teachers, lack of security such as
school fencing.
According to this study these challenges affected negatively student academic
performance. Gwambombo (2013) studied the effect of teachers’ workload on
28
students’ academic performance in community secondary schools at Mbeya City.
The study revealed that heavy teachers’ workload had negative impact on students’
academic performance.
Kibani (2008) studied the contribution of chemistry practical marks to the overall
National Examination results in ordinary level secondary education in Tanzania with
reference to Coastal Region. The study revealed that practical marks raise the
performance of final examinations by overriding the theory marks. This finding
points out the importance of enhancing practical teaching in secondary schools. In
order to realize that challenges such as availabilities of Laboratories with all
necessary chemicals and apparatus, as well, as enough qualified Laboratory
Technicians should be considered.
Maina (2009) studied about the analysis of teaching chemistry in ordinary level
secondary schools for performance improvement in Coastal Region. The study found
that chemistry teaching was facing the following problems; lack of chemicals,
apparatus, expert teachers, and laboratory technicians, as well as large numbers of
learners to handle. The study also found out that the table of specification used to
construct terminal tests did not match the recommended one.
The study suggested that in order to overcome the problems associated with the
teaching of chemistry for performance improvement there is a need to strengthen
teaching colleges and demonstration schools in terms of facilities, to improve
teachers’ motivation, to employ laboratory technicians, to revise the current syllabus
and to make effective use of professional development programmes. With regards to

29
this study problems associated with the teaching of chemistry for performance
improvement includes other challenges which have not been researched on such as
students’ home based environment like home economy and students’ perceptions on
chemistry subjects. These are beyond school facilities and human resource oriented
problems but can also affect performance in secondary schools.
2.8 Chapter Summary of Knowledge Gap
However, despite those studies done on general students’ performance, in Chemistry
and other natural science subjects in ordinary secondary schools, factors that led to
the poor chemistry performance in ordinary level NECTA examination especially
from 2009 to 2012 are not fully covered even though the poor performance is
generally known by both secondary school teachers, students and the society as a
whole.
Moreover the study done by Maina (2009) was done five years ago for Coast region
only, so it is important to revisit the study in order to see if there is any improvement
on the factors studied and also to compare with other regions. According to the
literature reviewed, performance in natural science subjects including Chemistry is
one of the most prominent challenges facing secondary school education in Tanzania
and other less developed countries in Africa. Chemistry performance in secondary
schools is facing overlapping challenges that affect the context of learning.
These challenges are related in one way or another with the issues of lack of enough
and reliable learning facilities like Libraries, shortage of qualified human personnel
like chemistry teachers and chemistry technicians to mention a few. It is clear that

30
these are areas that have to be continuously researched on from time to time in order
to realise to what extent they affect student performance in the Chemistry subject in
Ordinary level secondary schools.

31
CHAPTER THREE
RESEARCH METHODOLOGY
3.1 Introduction
This chapter dwells with the methodology of the study. It comprises of the study area
and its rationale, research design, sampling procedure and sampling methods used by
the study. Also, it details the data collection, processing and analysis.
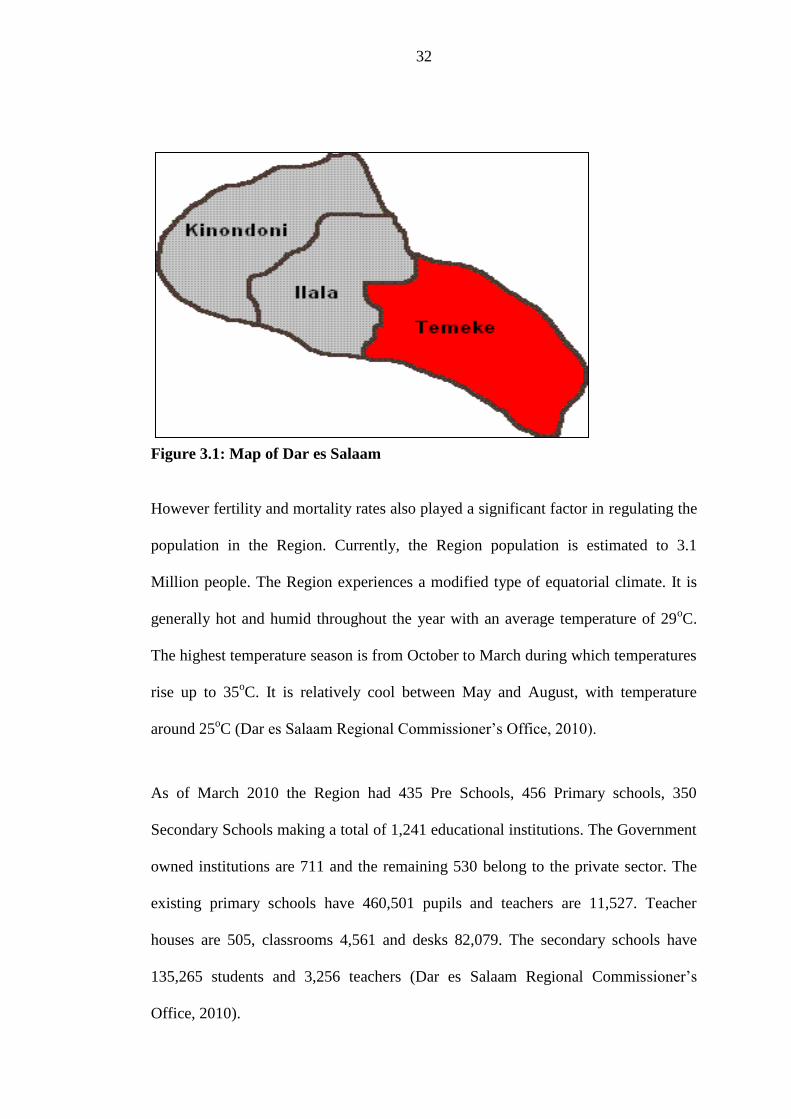
3.2 Study Area and the Rationale
The study area consists of three Districts namely Ilala, Kinondoni and Temeke
(Figure 3.1). The Districts’ boundaries are also the same as Municipal Councils. The
Districts are divided into 10 Divisions, which are subdivided into 93 Wards. The
Region lies along the Western Coast of Indian Ocean. It is situated between Latitudes
60 and 7
0 degrees South of the Equator and between Longitudes 33.33 and 39
degrees East of Greenwich. It borders with Coast Region in the North, West and
South while to the East, the Indian Ocean. The total surface area of Dar es Salaam
Region is 1,397 square kilometers which is equivalent to 0.15 percent of the entire
Tanzania Mainland area (Dar es Salaam Regional Commissioner’s Office, 2010).
According to the 2002 National Population and Housing Census, the Dar es Salaam
Region had a total population of 2,487,288, having increased from 1,360,865 as
recorded in 1988 Census. The population increase of 1,126,423 people represents an
average annual population growth rate of 4.3 percent. The rate is above the national
population growth rate of 2.9 percent. The higher population growth rate is mainly
due to migration factor.
32
Figure 3.1: Map of Dar es Salaam
However fertility and mortality rates also played a significant factor in regulating the
population in the Region. Currently, the Region population is estimated to 3.1
Million people. The Region experiences a modified type of equatorial climate. It is
generally hot and humid throughout the year with an average temperature of 29oC.
The highest temperature season is from October to March during which temperatures
rise up to 35oC. It is relatively cool between May and August, with temperature
around 25oC (Dar es Salaam Regional Commissioner’s Office, 2010).
As of March 2010 the Region had 435 Pre Schools, 456 Primary schools, 350
Secondary Schools making a total of 1,241 educational institutions. The Government
owned institutions are 711 and the remaining 530 belong to the private sector. The
existing primary schools have 460,501 pupils and teachers are 11,527. Teacher
houses are 505, classrooms 4,561 and desks 82,079. The secondary schools have
135,265 students and 3,256 teachers (Dar es Salaam Regional Commissioner’s
Office, 2010).

33
3.3 Methodology and Research Design
According to Kothari (2007) a research design is the arrangement of conditions for
collection and analysis of data in a way that aims to combine relevance to the
research purpose with economy in procedure. The study used cross-sectional
research design due to time limitation and economy. This kind of research design
includes collection of data on a sample of numerous groups of subjects at one point
in time (Kothari, 2007).
3.4 Sampling Procedure
3.4.1 Population Sample and Size
Table 3.1: Distribution of Selected Secondary Schools by Dar es Salaam
Districts
S/N School centre number School name District
1 S. 1278 Mbezi Beach Secondary Kinondoni
2 S. 1022 Kambangwa Secondary Kinondoni
3 S. 1406 Jamhuri Secondary Ilala
4 S. 0784 Airwing Secondary Ilala
5 S. 0316 Kibasila Secondary Temeke
Source: Field Data (2013)
Population is the group of persons which is of interest to the researcher. It is the
group where the researcher aims to collect the results of the study. Population
generally includes all the individuals who possess a certain characteristic (Frankel
and Wallen 1993). Population sample of respondents is a small fraction of a
population selected, observed and analysed (Best and Khan 1993). Form three
students taking chemistry subject in selected schools, listed in Table 3.1, formed the
group of respondents. Form three chemistry students have studied the subject for
more than two years and have selected it as one of their possible carriers.

34
Furthermore, they still have one year before NECTA examinations. The study
consisted of a sample size of 100 students. Alreckand Settle (1985) points out that
for a large population the minimum practical sample size is 100 respondents.
3.4.2 Sampling Methods
The study employed two stage-sampling design to select the 100 respondents. This is
a mixed sampling design which allows to employ more than one sampling designs.
The study used both purposive or deliberate and simple random sampling. The first
stage used purposive sampling to select 5schools among 318 schools in Dar es
Salaam. This method was used in order to obtain schools which, on one hand, can
give reliable information due to their experience in NECTA examinations and, on the
other hand, had targeted students. The second stage used simple random sampling to
select 20 Form three students out of all form three students studying chemistry
subject in a particular school, ten boys and ten girls from each of the five schools.
Simple random sampling allows each and every item in the population an equal
chance of being selected (Kothari, 2007). Purposive sampling was again used to
select key informants. Table 3.1 shows distribution of selected secondary schools by
Dar es Salaam region districts.
Table 3.2: Distribution of Selected Secondary Schools by Dar es Salaam
Districts
S/N School Centre Number School Name District
1. s.1287 Mbezi Beach Secondary Kinondoni
2. s. 1022 Kambangwa Secondary Kinondoni
3. s. 1406 Jamhuri Secondary Ilala
4. s. 0784 Airwing Secondary Ilala
5. s. 0316 Kibasila Secondary Temeke
Source: This study (2013)
35
3.5 Data Collection
The study used both primary and secondary data. The primary data is that which is
collected afresh and for the first time, and thus happens to be original in character,
while, the secondary data is that which has already been collected by someone else
and which has already been passed through the statistical process but is relevant to
our study (Kothari, 2007).
3.5.1 Primary Data
The primary data for this study was obtained from questionnaires on students
selected and from interviews on key informants such as school teachers. Sample
questionnaires and interview guides are included in appendices 1 to 3.
3.5.2 Secondary Data
Secondary data consisted of information from published and unpublished materials
such as journals and books. The study also applied internet materials, documents
from the OUT library and libraries in other universities, such as the University of
Dar es Salaam as sources of the secondary data.
3.6 Instruments
The study used the following instruments for data collection.
3.6.1 Questionnaires
Questionnaires were used to collect information from the respondents who were
Form Three Chemistry students. This helped to get their perspectives with regards to
the specific questions (Appendix 1).
36
3.6.2 Interview
Interviews were used to gather information from the key informants such as
Chemistry teachers, as well as, Municipal academic officers by using interview
guides (Appendix 2 and 3).
3.7 Data Management and Procedure
3.7.1 Data Collection and Processing
Data was collected, edited, coded and summarized prior to analysis by using the
Statistical Package for Social Sciences version 12.0.Collection of primary data was
done by giving the prepared questionnaires to the selected students, collected the
filled questionnaires. Interview guides were used while collecting data from the key
informants. Furthermore so as to enhance the validity and reliability of the
instruments used, questionnaires and interview guides where tested before collecting
the information.
3.7.2 Data Analysis
Data from questionnaires was analysed by computer software, known as the
Statistical Package for Social Sciences Version 12.0 (SPSS 12.0 for windows).
Descriptive statistics such as frequencies and percentages were employed to show
the outline of the findings. The study utilized descriptive statistics such as mean,
frequencies and percentages in data analysis. Qualitative data were analysed using
content analysis. Content analysis consists of analysing the contents of documentary
materials such as books, magazines, newspapers and the contents of all other verbal
materials which can be either spoken or printed (Kothari, 2007).
37
3.7.3 Ethical Consideration
The researcher always made sure that ethical issues were given special attention and
consideration as Frankel and Wallen 2006 state that the researchers responsibilities is
to ensure that the participants were physically and psychologically protected from
any discomfort or danger that might rise due to the research procedure. All
respondents were ensured their safety in terms of there personal security.

38
CHAPTER FOUR
RESULTS AND DISCUSSION
4.1 Introduction
This chapter focuses on the results of the study. The discussion bases on the results
acquired with regards to the specific objectives of the study. The first section is an
overview which briefly describes the framework of the discussion. The second
section focuses on a description of the demographic characteristics of the
respondents. The third section analyses the overall form four NECTA examinations
results from 2009 to 2012. The fourth section gives a brief analysis of the Form Four
chemistry NECTA examination results from 2009 to 2012. The fifth dwells on the
factors affecting chemistry performance in NECTA examinations which include,
students/personal related factors, curriculum related factors, human resources related
factors, home based related factors, school motivations and facility related factors.
The sixth section describes students’ perceptions on chemistry performance in their
schools. The seventh deals with students perceptions on the NECTA examinations.
The last section is about the constraints facing the study of the chemistry subject.
4.2 Demographic Characteristics of the Respondents
The study interviewed male and female persons from the following groups; Form
Three students taking chemistry at the selected schools, secondary school teachers
teaching chemistry at the selected secondary schools, and key informants. The
central focus of the study was on the Form Three students interviewed who are the
research respondents. However, other groups played a role of verification of
students’ reports as well as, complementing information for each student.

39
4.2.1 Sex of the Respondents
The percentage distribution of the sex of the respondents were as follows; among the
form three students interviewed 50 (50%) were boys and 50 (50%) pupils were girls.
4.2.2 Age of the Respondents
The age of the students interviewed varied from 14 years old to 20 years old. Among
them 87 (87%) were between15 years old to 17 years old. All the key informants had
ages ranging from 30 years old and above. This is shown in Table 4.1.
Table 4.1: Percentage of the Ages of Secondary Schools Students Interviewed
(N=100)
Age in Years Frequency Percentage
14 1 1.0
15 18 18 18.0
16 45 45.0
17 24 24.0
18 8 8.0
19 1 1.0
20 3 3.0
Total 100 100.0
Source: Field Data (2013)
According to the age distribution of the students interviewed as described in Table
4.1 and Figure 4.1 above; 45 students (45%) were 16 years old. 69 students (69%)
were between 16 to 18 years old while 87 students (87%) were between 15 to 17
years old. Students who have ages from 15 years old and above can give authentic
information especially about things they have already started to experience.

40
Figure 4.1: Percentage Distributions of the Ages of the Secondary Schools
Students interviewed (N=100)
Source: Field Data (2013)
4.3 Brief Analysis of the General National Form Four Results from 2009 to
2012
Table 4.2: Percentages of all Subjects Form Four National Examinations Pass
Rates 2005 to 2012
Year Percentage Passed Percentage Failed
2005 89.3 10.7
2006 89.1 10.9
2007 90.3 9.7
2008 83.6 16.4
2009 72.5 27.5
2010 50.4 49.6
2011 53.6 46.4
2012 43.1 56.9
Source: URT (2012)
%

41
Figure 4.2: Percentages of all Subjects Form Four National Examinations Pass
Rate 2004-2012
Source: URT (2012)
Table 4.2 and Figure 4.2 show the pattern of general performance in the NECTA
examinations for the last eight years. For the first four years, from 2005 to 2008,
Percentage pass rate was above 80% while for the second four years, from 2009 to
2012, the percentage pass rate was below 80%. Furthermore for the last three years
from 2010 to 2012, the overall pass rate was below 60%. Also, in the last
consecutive years from 2010 to 2012 the pass rate was below 60%. Thus, there is a
trend of performance decline in the NECTA overall examinations in the years under
investigation.
In 2010 the pass rate dropped by more than 20%, from 72.5% (2009) to 50.4%
(2010). This is an alarming drop. However, in 2007 there was an increase of
enrolment by 33.8 % from 675 672 students in 2006 to 1020510 students in
Passed
Failed
Year
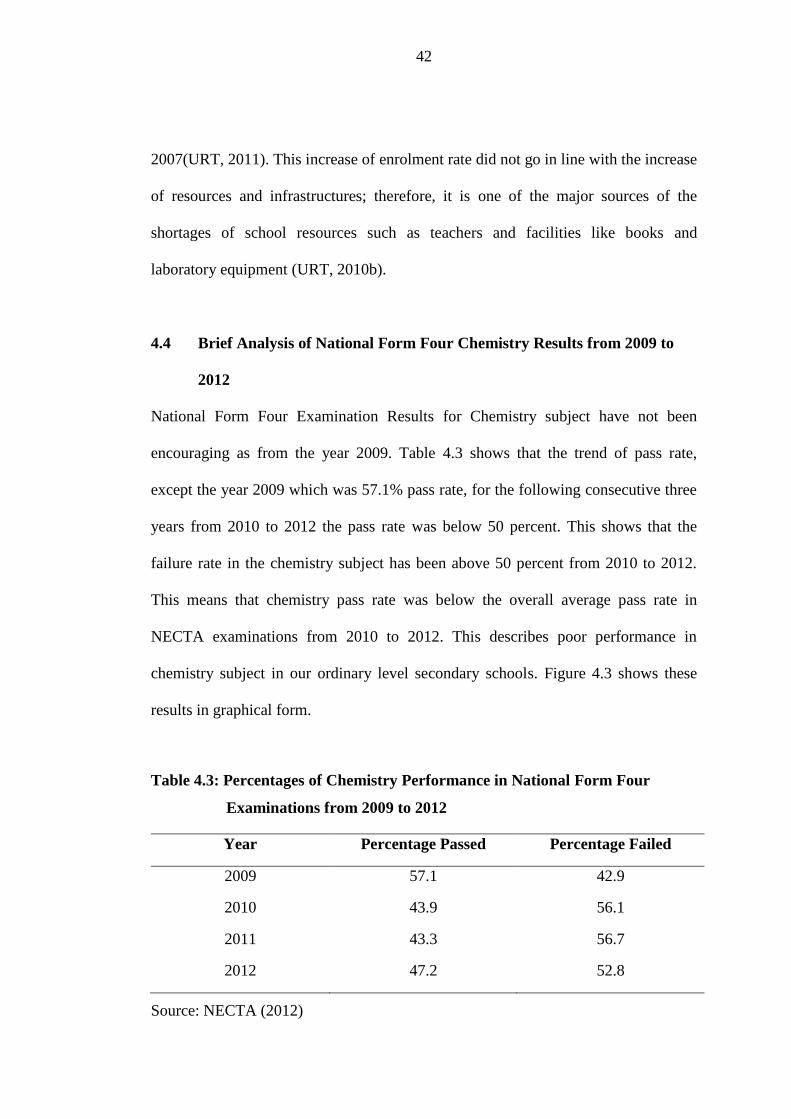
42
2007(URT, 2011). This increase of enrolment rate did not go in line with the increase
of resources and infrastructures; therefore, it is one of the major sources of the
shortages of school resources such as teachers and facilities like books and
laboratory equipment (URT, 2010b).
4.4 Brief Analysis of National Form Four Chemistry Results from 2009 to
2012
National Form Four Examination Results for Chemistry subject have not been
encouraging as from the year 2009. Table 4.3 shows that the trend of pass rate,
except the year 2009 which was 57.1% pass rate, for the following consecutive three
years from 2010 to 2012 the pass rate was below 50 percent. This shows that the
failure rate in the chemistry subject has been above 50 percent from 2010 to 2012.
This means that chemistry pass rate was below the overall average pass rate in
NECTA examinations from 2010 to 2012. This describes poor performance in
chemistry subject in our ordinary level secondary schools. Figure 4.3 shows these
results in graphical form.
Table 4.3: Percentages of Chemistry Performance in National Form Four
Examinations from 2009 to 2012
Year Percentage Passed Percentage Failed
2009 57.1 42.9
2010 43.9 56.1
2011 43.3 56.7
2012 47.2 52.8
Source: NECTA (2012)

43
Figure 4.3: Percentages of Chemistry Performance in the National Form Four
Examinations from 2009 to 2012
Source: NECTA (2012)
4.5 Factors Affecting Chemistry Performance in NECTA Examinations
There are dynamic factors which affect performance of chemistry students in
NECTA examinations which include both school based factors and home based
factors, as well as, personal related factors. This study mostly dwells on the school
based factors.
According to the Government review of SEDP I, which was implemented from 2004
to 2009 the number of secondary schools tripled within the implementation period
and lead to the increase of enrolment rate. This is one of the significant National
successes in terms of children’ access to secondary school education. Despite of this
success, the number of challenges increased as an outcome, these challenges include;
(i) Shortages of teachers, especially in science and mathematics, with many
students, not able to do these subjects at all.
% Passed
% Failed
Year
%

44
(ii) Asymmetrical deployments of teachers required, whereby urban areas have an
advantage in recruiting more and better teachers compared to rural community
secondary schools, most of which have acute shortages of teachers.
(iii) Poor teaching approaches in the classroom, as they are mostly teacher centred,
with student relying heavily on the teacher and old notes, and classroom time
often not being used efficiently and effectively for mental engagement of the
students.
(iv) Lack of or non-use of laboratories in most schools resulting in students doing
the science theoretically and most of them doing poorly. As a result an
avoidance syndrome is formed, with most students choosing to enrol in social
science/arts subjects, rather than natural science subjects.
(v) Insufficient infrastructure, due to many construction projects that started under
SEDP I not being completed (URT, 2010a).
4.5.1 Student Interests in Chemistry
Interest to the subject can affect the students’ efforts or commitment on the particular
subject which eventually affects performance in that subject. The study interviewed
the students by asking them to what extent they liked or disliked the chemistry
subject and the reasons behind their interest.
Among the students interviewed 94 students (94%) said they liked chemistry subject
very much and six percent did not like chemistry so much. Among the six students
who did not like chemistry so much, five of them perceive chemistry to be difficult
subject while one student did not know the importance of chemistry in his future

45
carrier. Five percent pointed out that they like chemistry subject because of the
teacher while 87% considered chemistry subject as import in their future lives. These
results show that majority of students studying chemistry like the subject and know
the importance of chemistry in their lives. The results indicate that poor performance
in chemistry subject is not mainly due to students’ interest on the subject. Even
though, these students have not done the Form Four NECTA examinations they
shared almost similar environment with those who have recently sat for the
examinations.
The study made in Mufindi District about science subjects in community secondary
schools showed that majority of students in community secondary school had
positive attitudes and interest towards science subjects when they joined secondary
schools. However, they lost interest in science subjects due to various reasons as
identified by this study (Lihaya, 2009). The finding from Mufindi District shows that
student interest to the subject is dynamic and it has to be measured in relation to
other factors.
4.5.2 Curriculum Related Factors
Poor performance in the Form Four NECTA examinations especially science
subjects like Chemistry has been easily linked with lack of teachers, poor teaching
and poor learning environment as dominant anticipated factors. However, there are
few systematic researches which focus on the curriculum implementation and
examination practices as the major factor. Since 2005 the Government of Tanzania
has been implementing a competence based curriculum, which encourages
development of certain articulated key competences. A set of standards of resources

46
have been identified for effective implementation of the curriculum. These include a
number of teaching and learning resources, such as textbooks, syllabuses, modules
and manuals. Few teachers, less than 40% use other items more than books and
syllabuses, most of them depend only on books and syllabuses (Mkumbo et al.
2012).
In spite of the fact that the Government has been implementing the competence
based curriculum since 2005 very few teachers are familiar with the concept and
philosophy of the curriculum orientation. Furthermore, the teaching and learning
environment is generally poor to support competence based curriculum. Problems on
implementing the competence based curriculum can be one of the factors leading to
poor performance in the NECTA examinations (Mkumbo et al. 2012).
The study finding shows similar results that there are poor learning environment in
schools. 46% of the interviewed students pointed out that there a lack of enough and
qualified teachers in schools while 63% of the students interviewed pointed the lack
of necessary facilities such as textbooks, chemicals and other apparatus in schools’
laboratories.
4.5.3 Human Resources Related Factors
Four chemistry teachers out of six who were interviewed when asked about the
causes of poor performance in chemistry NECTA examinations pointed out the lack
of Chemistry teachers as the major cause. This causes overcrowding of students in
classrooms and hinders access of laboratory facilities in practical sessions.
Furthermore, 46 percent of students interviewed pointed out that lack of enough and

47
qualified teachers, is one of the factors that causes poor performances of chemistry
students in the NECTA examinations. In addition, 55% of the students interviewed
suggested that an increase of chemistry subject teachers will improve performance in
NECTA examinations (Figure 4.4).
Figure 4.4: Students' Opinions on Human Resource Related Factors Affecting
Chemistry Performance
Source: This study (2013).
According to the research done in Muheza District, in 2012, there was a positive
correlation between the number of science teachers, including part time teachers in
schools, and students’ performance in the national examination. Secondary schools
with more science teachers tend to produce a high pass rate, and vice versa (Kim,
2013).
4.5.4 Home Based and Related Factors
There are several home based factors, such as socio-cultural (e.g. family conflicts)
and socio-economic factors like home based poverty which can influence students’
performance on chemistry subjects. However, the study focused on the home based
support or encouragement on students’ learning chemistry.
Lack of teachers
Increase teachers will help

48
According to the research findings, 79% of the student interviewed agreed that their
parents/guardians encouraged them to perform well in their chemistry subject, while
21% denied to have received any support from their parents/guardians to help them
perform well in chemistry (Figure 4.5). 56% of the students interviewed mentioned
the types of support/encouragements they were receiving from their
parents/guardians which included provision of chemistry books, previous chemistry
NECTA examinations (past papers). They also, mentioned that their
parents/guardians were paying for their additional studies which are well known as
tuition.
Figure 4.5: Distribution of Students Support on Chemistry Subject from their
Parents/Guardians
Source: Field Data (2013)
4.5.5 Schools’ Motivations
School motivations create a good environment for students’ success in chemistry
performance. The most dominant motivation practise in secondary schools is by
openly giving gifts to students who perform well in a particular subject. The study
asked students if their schools gave any gifts to the best students in the chemistry
subject. 50% answered yes, while 50% answered no (Figure 4.6). Those who agreed
that their schools provide gifts to the best chemistry students mentioned exercise
Students who got support fromparents/guardians
Students who did not get support
Students mentioned support fromparents/guardians e.g. provision ofchemistry textbooks

49
books, mathematical sets and money as common gifts. Motivation as a contributing
factor to student performance is very important. Stronger motivations can increase
students’ morale to the subject. This is in line with the constructivism theory of
learning science (Herr, 2010) which emphasises the importance of encouraging
students to discover principles and construct knowledge within a given framework.
Figure 4.6: School Motivations on Chemistry Subject for Good Students
Performers
Source: Field Data (2013)
4.5.6 Facility Related Factors
Facilities such as laboratories with all necessary appliances, libraries with all relevant
books, student access to books creates good environment for better performances for
students in examination. According to results, of the students interviewed, 63 % had
an opinion that lack of chemistry facilities such as libraries, chemicals and textbooks
is one of the causes of poor performance of chemistry in the NECTA examinations
(Figure 4.7).
Students agreed their schoolsgive motivations on goodchemistry performance
Students denied that theirschools give motivations on goodchemistry performance

50
Figure 4.7: Students' opinion on Facility Related Factors Affecting Chemistry
Performance
Source: Field Data (2013)
According to the study results on factors affecting students’ academic performance
in community and Government built schools in Tanzania in 2013; it showed that
there was lack of teaching facilities in both community and Government built
schools, lack of good environment for learning due to lack of adequate or complete
absence of laboratories, libraries, toilets, dormitories and teachers houses all together
appeared to greatly influence academic performance of students. It was also noted
that, in most community built schools which were located far from town centres,
both teachers and students failed to acquire learning materials from learning centres
like libraries and internet services and few students failed to attend all periods on
time (Mlozi et al., 2013).
4.5.6.1 Chemistry Textbooks
The study asked students whether they had their own chemistry text books, 65
students (65%) claimed to have their own chemistry text books while, 35% did not
have their own chemistry text books. Among those 65 students who had their own
chemistry books; 56 students received those books from their parents, friends or
relatives. 8 students showed great interest to the subject since they bought those
Students argued lack of chemistryfacilities is one of the causes of poorperformance
Students who did not argued thatlack of chemistry facilities is one ofthe causes of poor perfomance

51
books from their own money. Two students claimed to receive the books from their
teachers. According to the results, it is clear that many parents, friends and relatives
of the students interviewed had awareness of the importance of books on students
learning. Furthermore, the study asked on the students’ awareness about their school
provisions of chemistry books to students, by asking them whether their schools
provided chemistry books to students. 67% of the students agreed that their school
provides chemistry books to students. Figure 4.8 shows the same results in
histogram.
Figure 4.8: Percentage Distributions of Students with Chemistry Textbooks and
how they got them
Source: Field Data (2013)
Table 4.4: Percentage Distribution of Students with their Own Chemistry Books
Amount of chemistry books Frequency Percentage
Zero (not have chemistry books) 35 35.0
One 37 37.0
Less than five 22 22.0
Five and less than ten 5 5.0
Ten and more than ten 1 1.0
Total 100 100.0
Source: Field Data (2013)
Students with chemistry textbooks
Students bought chemistry textbooks from their ownpocket money
Students received chemistry textbooks from theirchemistry teachers
Students received chemistry textbooks fromparents/caregivers
Student said their schools provide chemistry text books
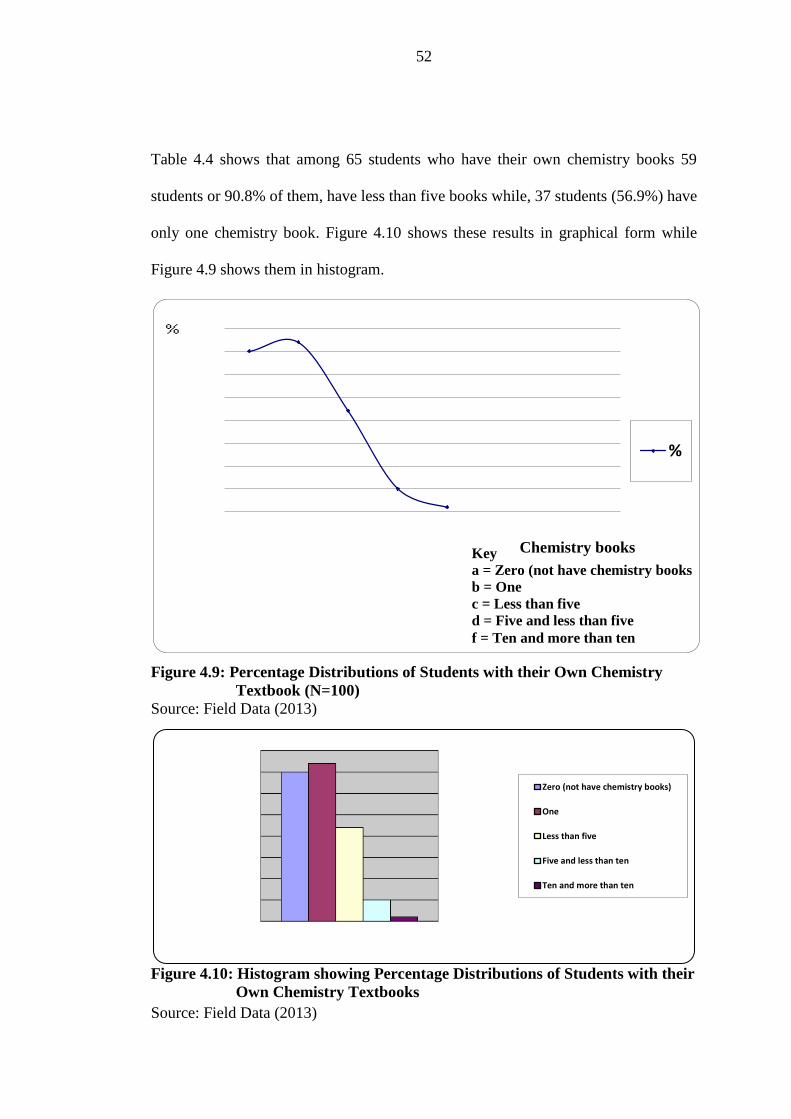
52
Table 4.4 shows that among 65 students who have their own chemistry books 59
students or 90.8% of them, have less than five books while, 37 students (56.9%) have
only one chemistry book. Figure 4.10 shows these results in graphical form while
Figure 4.9 shows them in histogram.
Figure 4.9: Percentage Distributions of Students with their Own Chemistry
Textbook (N=100)
Source: Field Data (2013)
Figure 4.10: Histogram showing Percentage Distributions of Students with their
Own Chemistry Textbooks
Source: Field Data (2013)
%
Zero (not have chemistry books)
One
Less than five
Five and less than ten
Ten and more than ten
Chemistry books Key
a = Zero (not have chemistry books
b = One
c = Less than five
d = Five and less than five
f = Ten and more than ten
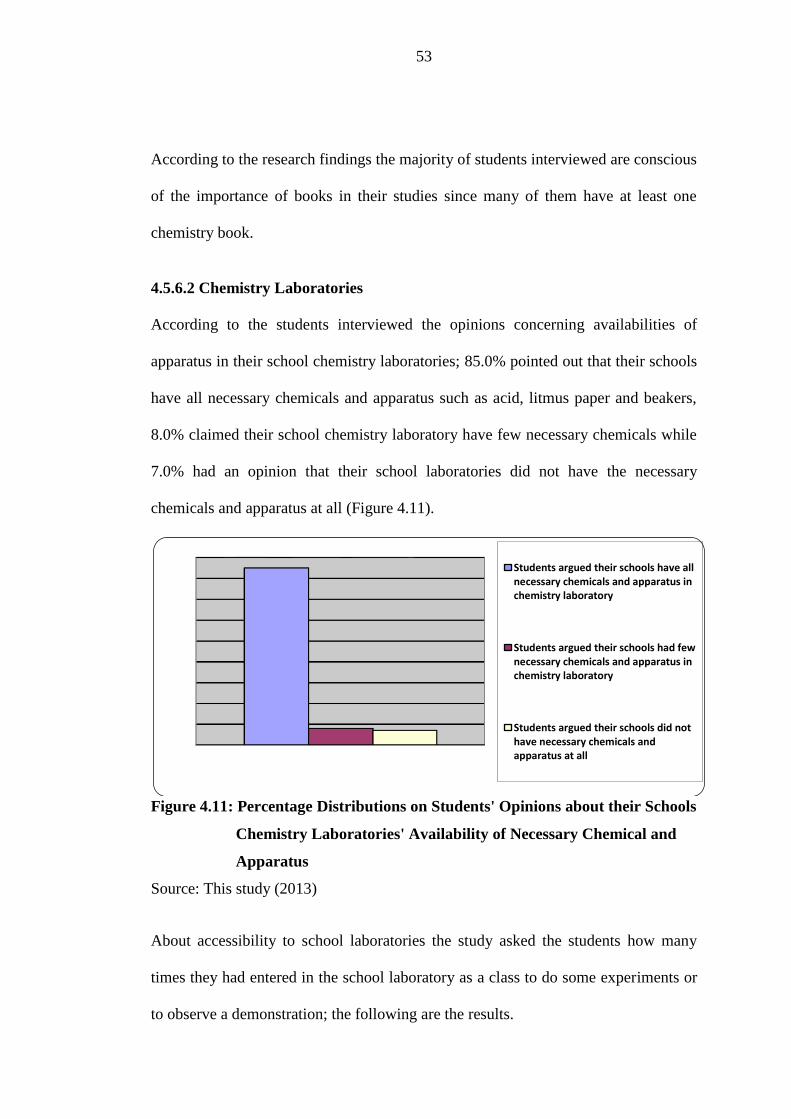
53
According to the research findings the majority of students interviewed are conscious
of the importance of books in their studies since many of them have at least one
chemistry book.
4.5.6.2 Chemistry Laboratories
According to the students interviewed the opinions concerning availabilities of
apparatus in their school chemistry laboratories; 85.0% pointed out that their schools
have all necessary chemicals and apparatus such as acid, litmus paper and beakers,
8.0% claimed their school chemistry laboratory have few necessary chemicals while
7.0% had an opinion that their school laboratories did not have the necessary
chemicals and apparatus at all (Figure 4.11).
Figure 4.11: Percentage Distributions on Students' Opinions about their Schools
Chemistry Laboratories' Availability of Necessary Chemical and
Apparatus
Source: This study (2013)
About accessibility to school laboratories the study asked the students how many
times they had entered in the school laboratory as a class to do some experiments or
to observe a demonstration; the following are the results.
Students argued their schools have allnecessary chemicals and apparatus inchemistry laboratory
Students argued their schools had fewnecessary chemicals and apparatus inchemistry laboratory
Students argued their schools did nothave necessary chemicals andapparatus at all

54
Table 4.5: Percentages of Students who Entered Chemistry Laboratory for
Studies or Observing a Demonstration
Times Entered into School Chemistry
Laboratory
Frequency Percentage
Never entered 7 7.0
Less than five times 35 35.0
Five or less than ten times 43 43.0
More than ten times 15 15.0
Total 100 100.0
Source: Field Data (2013)
Table 4.5 shows that 43% of the students interviewed in their almost three years of
study in secondary schools have entered in their school chemistry laboratory between
five and ten times, while 35% have entered in the laboratories less than five times.
Besides, only 7% of them have never entered the school laboratory either for
experiments or observing a demonstration. Figure 4.12 shows the same results in a
histogram.
Figure 4.12: Histogram showing Percentage of Students who Entered Chemistry
Laboratory for Studies or Observing a Demonstration
Source Field Data (2013)
Never entered
Less than five times
Five or less than ten times
More than ten times
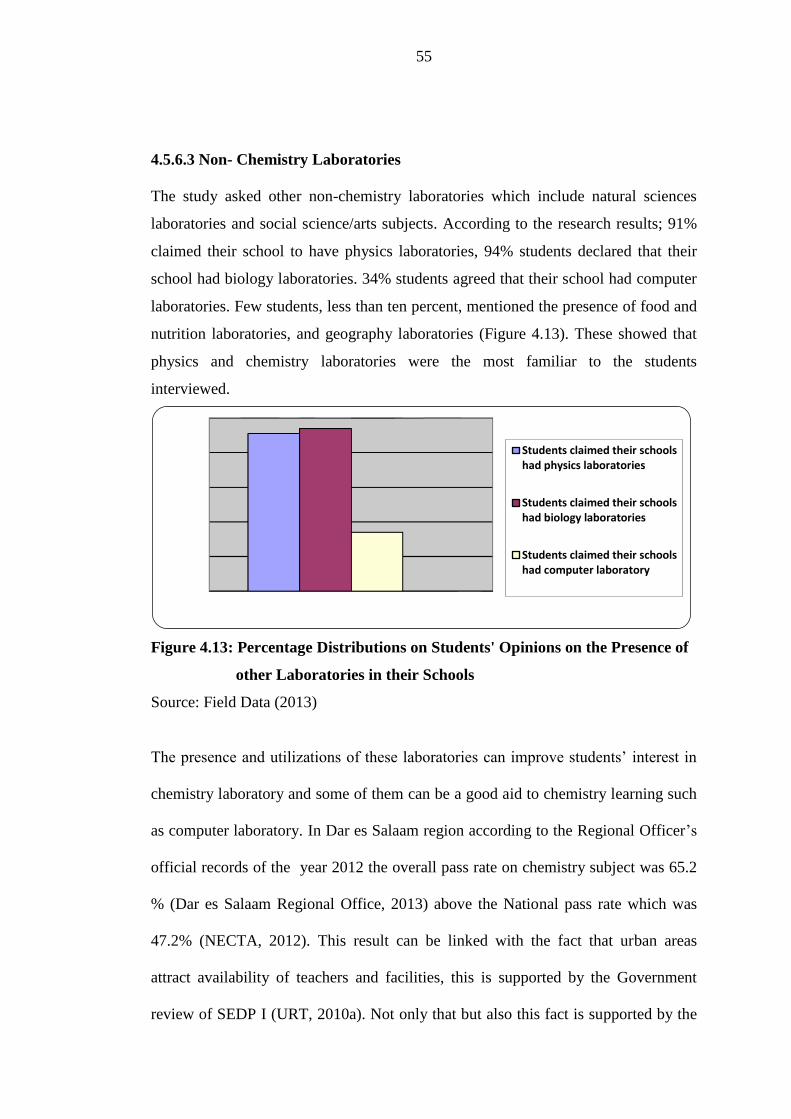
55
4.5.6.3 Non- Chemistry Laboratories
The study asked other non-chemistry laboratories which include natural sciences
laboratories and social science/arts subjects. According to the research results; 91%
claimed their school to have physics laboratories, 94% students declared that their
school had biology laboratories. 34% students agreed that their school had computer
laboratories. Few students, less than ten percent, mentioned the presence of food and
nutrition laboratories, and geography laboratories (Figure 4.13). These showed that
physics and chemistry laboratories were the most familiar to the students
interviewed.
Figure 4.13: Percentage Distributions on Students' Opinions on the Presence of
other Laboratories in their Schools
Source: Field Data (2013)
The presence and utilizations of these laboratories can improve students’ interest in
chemistry laboratory and some of them can be a good aid to chemistry learning such
as computer laboratory. In Dar es Salaam region according to the Regional Officer’s
official records of the year 2012 the overall pass rate on chemistry subject was 65.2
% (Dar es Salaam Regional Office, 2013) above the National pass rate which was
47.2% (NECTA, 2012). This result can be linked with the fact that urban areas
attract availability of teachers and facilities, this is supported by the Government
review of SEDP I (URT, 2010a). Not only that but also this fact is supported by the
Students claimed their schoolshad physics laboratories
Students claimed their schoolshad biology laboratories
Students claimed their schoolshad computer laboratory

56
research of 2011 about location and academic achievement of secondary schools in
Ekiti State Nigeria (Owoeye and Yara, 2011). This study showed that geographical
location of schools had influence on academic achievement of the students. Urban
school performed better than rural schools, the performance situation was attributed
to various causes including; uneven distribution of resources, facilities, problems of
qualified teachers refusing appointments or not willing to work in isolated villages,
lack of good roads and poor communication infrastructures.
4.6 Students Perceptions on Chemistry Performance in their Schools
The study wanted to know what the students had to say about the status of the
chemistry performance in their school as compared to other subjects. Table 4.6
shows distribution of the students’ perceptions on their school chemistry subject
performance as compared to other subjects.
Table 4.6: Percentage Distribution of Students' Views on Chemistry
Performance in their Schools
Student Views on school chemistry
performance as compared to other subjects
Frequency Percentage
Worse 6 6.0
Bad 20 20.0
Good 41 41.0
Better 15 15.0
Best 8 8.0
I don’ know 5 5.0
Total 100.0
Source: Field Data (2013)

57
Figure 4.14: Histogram showing Percentage Distributions of Students' Views on
Chemistry Performance in their Schools
Source: Field Data (2013)
According to the above findings, many students 41% considered chemistry
performance in their schools to be good, while 26% viewed chemistry subject
performance in their schools as worse than the previous year (Figure 4.14).
Furthermore, when asked about the possible reasons for such performances, those
students who considered chemistry performance to be poor in their schools pointed
the following as among the possible reasons; poor teacher class attendances, poor
teaching, lack of enough and qualified teachers, and lack of facilities. On the other
hand, for those students who considered the subject performance as good, pointed
out the same reasons in the positive way such as good teacher class attendances.
4.7 Students Perceptions on Chemistry Performance in the NECTA
Examinations
Having asked the students about the status of chemistry subject performances in their
schools the study continued to ask about students perceptions on possible reasons for
Worse Bad
Good Better
Best I don’ know

58
the declining of form four chemistry NECTA examination results. The following are
the dominant reasons in percentages as mentioned by the students interviewed
(Figure 4.15):
(i) Because of lack of enough and qualified teachers in schools (46%).
(ii) Poor chemistry teaching and some teachers do not cover the syllabus (5%).
(iii) Because of poor students awareness on the importance of chemistry subject in
their future lives (68%).
(iv) Because of the lack of necessary facilities such as text books, chemicals and
other apparatus in school laboratory (63%).
(v) Chemistry subject is difficult (12%).
Figure 4.15: Histogram showing Percentage Distributions of Students'
Perceptions on the Possible Reasons for Declining of Form Four
Chemistry NECTA Examinations Results
Source: Field Data (2013)
Because of lack of enough andqualified teachers in schools
Poor chemistry teaching and someteachers don not cover the syllabus
Because of poor students awarenesson the importance of chemistrysubject in their future lives
Because of the lack of necessaryfacilities such as text books,chemicals and other apparatus inschool laboratory
Chemistry subject is difficult
59
With reference to the above findings most of the students interviewed thought that
the foremost possible reasons for the declining of form four NECTA examinations
results are lack of awareness on the importance of the subject in their future lives and
insufficiency of necessary chemistry subject facilities. Another reason is the lack of
enough and qualified chemistry teachers in schools. These give an overview of
students’ option of the problem under study which is important in finding the
solutions for improving chemistry NECTA examinations performance. This is due to
the fact that students are among the major stakeholders in dealing with improving
performance. Moreover, the study asked students on their opinions to improve
chemistry performance in NECTA examination results. The following are students’
suggestions;
(i) Government/schools should increase number of qualified teachers and facilities
such as textbooks and laboratories with all necessary features.
(ii) Chemistry teachers should cover the syllabus and make many revisions prior to
schools and NECTA examinations.
(iii) To increase time allocation for chemistry subject in school time tables.
(iv) To improve students awareness on the importance of the chemistry subject in
their future lives.
(v) Students to study harder.
The above findings show that chemistry students interviewed were aware of what
should be done to improve their performance. Their responses covered both the roles
of chemistry facilities and human resources (teachers), as well as, students’ roles to
improve chemistry performances.

60
4.8 Constraints Facing Chemistry Subject
Students interviewed were asked about the constraints facing chemistry subjects. The
following are the most mentioned constraints by the students;
(i) Lack of enough and qualified chemistry teachers 35 %
(ii) Poor chemistry teaching and teachers class attendances 15%
(iii) Lack of chemistry related facilities in schools such as books and
laboratories.63%
(iv) Poor students’ awareness of the importance of chemistry subject in their future
carriers19 %
(v) Chemistry is a difficult subject (5%) (Figure 4.16).
Figure 4.16: Histogram showing Students' Views on the Constraints of
Chemistry Subject in Secondary Schools
Source: Field Data (2013)
Lack of enough and qualifiedchemistry teachers
Poor chemistry teaching andteachers class attendances
Lack of chemistry relatedfacilities in schools such asbooks and laboratories
Poor students’ awareness of the importance of chemistry subject in their future carriers
Chemistry subject is a difficultsubject.

61
The above findings show that chemistry students in ordinary level secondary schools
are aware of some of the major constraints facing the subjects. This is a good sign for
any effective struggle in improving chemistry NECTA examinations results. For
example, knowing that lack of chemistry related facilities in schools is a problem in
NECTA examinations performance motivates students to utilize effectively the few
available facilities, as well as, encourage students to use the facilities when fully
available.
62
CHAPTER FIVE
CONCLUSIONS AND RECOMMENDATIONS
5.1 Conclusions
The major objective of the research was to find out factors affecting chemistry
performance in ordinary level secondary schools in Tanzania with reference to Dar
es Salaam city. The study showed that the pattern of chemistry performance in the
NECTA exams in the last four years from 2009 to 2012 was declining. It also
investigated how curriculum, individual students, inadequate resources i.e. teachers
and learning facilities have contributed to the continuing poor chemistry performance
in NECTA examinations. The specific objectives were:
To analyse performance in the Form Four NECTA examinations results from 2009 to
2012. This gave a foundational background in analysis of the problem.
(i) To describe teacher and students perceptions on poor chemistry NECTA
examinations performance.
(ii) To identify factors leading to poor performance of chemistry in ordinary
secondary school students.
Moreover, performance was treated as dependent variable while factors affecting
chemistry performance in NECTA examinations were treated as independent
variables. These included individual/students related factors, curriculum related
factors, human resources related factors, home based related factors, facility related
factors, schools’ motivations and students’ perceptions on the chemistry
performance.
63
The results show that there is a declining tendency in the general NECTA
examination performance rates under the years of investigation. Performance on
chemistry subject in NECTA exams had been below the general NECTA
examinations result. Moreover, for the last three consecutive years from 2010 to
2012 chemistry pass rates were below 50%.
Furthermore, the factors affecting chemistry performances in secondary school are
not only, insufficient facilities in schools such as libraries, laboratories and lack of
qualified chemistry teachers, but also, the poor learning environment for many
secondary schools do not support well the implementation of the competency based
curriculum. In addition, home based factors such as economy as well as student
interests affect the performance.
The following are conclusions provided in the light of the specific objectives of the
study and findings:
(i) The competence based curriculum, which is very important in the development
of natural science subjects like chemistry, is not supported well by the learning
environment for most schools in Dar es Salaam.
(ii) Facility distribution and accessibility in secondary schools together with the
problems of enough qualified chemistry teachers in schools remains to be
among the major challenges which lead to poor performance in the NECTA
examination results.
(iii) Not only facility and human personnel oriented problems affect poor
performance in secondary schools but also students’ home support influence
the morale of students studying natural science subjects
64
5.2 Recommendations
On the basis of the results obtained the following are the key recommendations of the
study:
(i) There is a need for urgent action on dealing with the issues of poor
performances in NECTA examinations. Government and secondary school
owners ought to increase the number of science subject teachers, provide
adequate teaching and learning materials like laboratories, libraries and
textbooks as well as laboratory technicians.
(ii) Government and school owners should provide special incentives to natural
science teachers and students especially those who are teaching in rural areas.
(iii) Teachers should try their best to fulfil their teaching role regardless of the
challenges of the teaching environments instead of just complaining.
(iv) Government, NGOs, school owners, and all community should increase
students and public awareness on the importance of natural science subjects for
the development of our country.
(v) The issues of poor performing students ought to be given more emphasis on
school inspections starting from the inspectors’ annual guidelines.
The study recommends that similar research to be done in other regions so as to
reveal the situations to a broader spectrum. Also there is a need for more research on
how out-of-the school related factors such as students’ home support can affect
Chemistry performance in secondary schools.

65
REFERENCES
Alreck, P. L. and Settle, R. P. (1985). The Survey Research Hand Book, Illinois,
Richard D. Irwin.
BEST, (2011). The United Republic of Tanzania: Basic Education Statistics in
Tanzania (BEST) 2007 – 2011, Dar es Salaam, Ministry of Education and
Vocational Training.
Best, J. and Khan, J. (1993). Research in Education, New York, Allyn and Bacon.
Broman, K., Ekborg, M. and Johnels, D. (2011). Nordic Studies in Science
Education: Chemistry in crisis? Perspectives on Teaching and Learning
Chemistry in Swedish Upper Secondary Schools, [https://www.journals.
uio.no/index.php/nordina/article/view/245] site visited 3/11/2014.
Chigora, P. and Mutenheri, F. (2007). Beyond the Truth: Limitations in social
science research from a development perspective in Africa. Journal of
Sustainable Development in Africa 9(3): 1509 – 1520.
Dar es Salaam Regional Commissioners’ Office, (2010), Strategic Plan for
2010/11–2012/2013.[http://www.dsm.go.tz/kurasa/nyaraka/Strategic%
20plan_Book.pdf] site visited 28/10/2014.
Dar es Salaam Regional Office (2013), Jamhuri ya Muungano wa Tanzania Ofisi ya
Waziri Mkuu Tawala za Mikoa na Serikali za Mitaa: Uchambuzi wa
Tathmini ya Matokeo ya Mtihani wa “Mock Mkoa” Darasa la VII, 2013,
Mtihani wa Taifa Kidato cha Nne 2012, naKidato cha Sita, 2013 Mkoa wa
Dare es Salaam, Dar es Salaam, Ofisi yaMkuu wa Mkoa.
Frankel, R. and Wallen, E. (1993), How to Design and Evaluate Research in
Education, New York, McGraw Hill Inc.

66
Frankel, J. R. and Wallen, N. E. (2006). How to Design and Evaluate Research in
Education. New York; McGraw Hill.
Glencoe, M. (2000). Performance Assessment, [http://www.glencoe.com/sec/
teachingtoday/educationupclose.phtml/1] site visited on 29/10/2013.
Gwambombo, I. (2013). The Effect of Teachers’ Workload on Students’ Academic
Performance in Community Secondary Schools: A Study of Mbeya City.
Dissertation for Award of Master of Education, Administration, Planning and
Policy Studies (Med. APPS) at Open University of Tanzania, Dar es Salaam,
Tanzania.
Herr, N. (2010). Theories and Perspectives in Science Learning, [http://www.csun.
edu/science/ref/theory-research/theories-science-education.html] site visited
on 29/10/2014.
Ishumi, A. G. M. (1994). 30 Years of Learning: Educational Development in Eastern
and Southern Africa from Independence to 1990, Ottawa, International
Development Research Centre.
Kibani, L. H. (2008). Contribution of Chemistry Practical Marks to Overall National
Examination Results in Ordinary Secondary Education in Tanzania: The Case
of Coastal Region. Dissertation for Award of Master of Education (Science)
at University of Dar es Salaam, Dar es Salaam, Tanzania.
Kim, E. (2013). HakiElimu Working Paper: The State of Secondary Science
Education in Rural Tanzania and the Urgent Need for Local Level In-service
Teachers Training, Dar es Salaam, HakiElimu Working Papers.
Komba, C. K., Hizza, E. L., and Jonathan, W. T. Y. (2013). Factors Influencing
Academic Performance of Ward Secondary Schools: A Case of Selected
67
Schools in Moshi Municipality and Moshi District. MUCCoBS Working
Paper Series Moshi University College of Cooperative and Business Studies
1:1821-5211.[http://www.mocu.ac.tz/upload/researches/KOMBA%20HIZA
%20G%C3%87%C3%B3%20MUCCOBS.pdf] site visited on 11/10/2015.
Kothari, C. R. (2007). Research Methodology: Methods and Techniques, New Delhi,
New Age International Publishers.
Lihaya, H. S. J. (2009). The Perceived Influence of Pre-service – Short Term Trained
Teachers on Students’ Interest in Science Subjects: A Case Study of Selected
Community Secondary Schools in Mufindi District Iringa Region.
Dissertation for Award of MED (Science) at University of Dar es Salaam,
Dar es Salaam, Tanzania.
Mabula, N. (2012). Promoting Science Subjects Choices for Secondary School
Students in Tanzania: Challenges and Opportunities. Academic Research
International. 3(3):2223-9944. [http://www.savap.org.pk/journals/ARInt./
Vol.3(3)/2012(3.3-28).pdf] site visited on 3/11/2014.
Maina, K. A. (2009). The Analysis Of Teaching Chemistry in Ordinary Level
Secondary Schools for Performance Improvement: A Case Study In Coast
Region. Dissertation for Award of Master of Education (Science Education)
at University of Dar es Salaam, Dar es Salaam, Tanzania.
Mallya, W. D. J. (2004). Cell phones bolster exam leakage, [http://www.arushatimes
[http://www.arushatimes.co.tz /2004/45/front_page_ 1.htm] site visited on
9/12/2012.
Mkumbo, K., Missokia, E., Boniventura, G., Msokwa, F., Mihayo, R., and Kituto, E.
(2012). School Children and National Examinations: Who Fails Who? A
68
Research Report on the Relationship between Examination Practise and
Curriculum Objective in Tanzania, Dar es Salaam, HakiElimu.
Mlozi, M. R. S., Kaguo, F. E. and Nyamba, S. Y. (2013). Factors Influencing
Students’ Accademic Performance in Community and Government Built
Secondary Schools in Tanzania: A Case of Mbeya Municipality.
International Journal of Science and Technology 2(2):174 – 186.
NECTA, (2012). National Examinations Council of Tanzania Examination Results:
Examination Cycle, Dar es Salaam, The Department of Research Evaluation
and Data Processing.
NECTA, (2015a). National Examination Council of Tanzania: About the
Establishment of NECTA, [http://www.necta.go.tz/about] site visited on
25/10/2015.
NECTA, (2015b). National Examination Council of Tanzania: Organization
Structure, [http://www.necta.go.tz/about] site visited on 25/10/2015.
NSGRP, (2010). National Strategy for Growth and Reduction of Poverty II,
[http://www.tz.undp.org/docs/MKUKUTA.pdf] site visited on 27/8/2012.
Nyamba, S. Y. and Mwajombe, K. K. (2012). Students’ Preference on Science
Subjects: Does this Affect their Performances? A case of Udzungwa
Secondary School, Kilolo, Iringa, Tanzania. International Journal of Science
and Technology 2(8):556 – 560. [http://ejournalofsciences.org/archive/
vol2no8/vol2no8_11.pdf] site visited on 5/2/2013.
Owoeye, J. S. and Yara, P. O. (2011). School Location and Academic Achievement
of Secondary Schools in Ekiti Nigeria. Asian Social Science 7(5):170 – 175.
[www.ccsenet.org/ass] site visited on 30/9/2013.

69
Rubaha, F. R. (2008). Factors Influencing Good Performance in Tanzanian Schools:
The Case of St. Francis, Msolwa and Marian Secondary Schools. Dissertation
for Award of Master of Arts (Education) at University of Dar es Salaam, Dar
es Salaam, Tanzania.
SEDP, (2010). The United Republic of Tanzania Ministry of Education and
Vocational Training, Education Sector Development Programme: Secondary
Education Programme II (July 2010 – June 2015)(SEDP II) Final Draft,
[http://www.ed-dpg.or.tz/pdf/CCI/Secondary%20Education%20Development
%20Plan%20 2010-2015.pdf] site visited on 19/8/2013.
TIE, (2011). Tanzania Institute of Education: Chemistry Practical Teachers Manual
for Ordinary Secondary Education, Dar es Salaam, Tanzania Institute of
Education.
UNESCO, (2007). Tanzanian President Speaks of Education and Culture before
UNESCO General Conference, [http://portal.unesco.org/en/ev.phpURL_
ID=40618&URL_DO=DO_TOPIC&URL_SECTION=201.html] site visited
on 19/8/2013.
UNESCO, (2008). A Needs Assessment Study of Tanzania Science Education: The
Economic and Social Research Foundation (ESRF),[http://www.unesco
.org/new/fileadmin/MULTIMEDIA/HQ/SC/pdf/sc_A_Needs_Assessment_St
udy_of_Tanzania_Science_Education.pdf] site visited on 12/10/2015.
URT, (2008). A Performance and Audit Report on School Inspection Programme for
Secondary Schools in Tanzania: A Report of the Controller and Auditor
General of the United Republic of Tanzania, Dar es Salaam, National Audit
Office.

70
URT, (2010b). The United Republic of Tanzania: Chemistry Syllabus for Ordinary
Secondary Education Form I – IV, Dar es Salaam, Tanzania Institute of
Education.
Wilson, S. (2013). Determinants of Poor Academic Performance in Community
Secondary Schools in Tanzania: A Case of Study of Kinondoni Municipality.
Dissertation for Award of Master of Education, Administration, Planning and
Policy Studies (Med. APPS) at Open University of Tanzania, Dar es Salaam,
Tanzania.
URT, (2012). United Republic of Tanzania Ministry of Education and Vocational
Training: Matokeo ya Mitihani K4 2012,
[http://www.tanzania.go.tz/government/] site visited on 28/8/2012.
Verspoor, M. A. (2008). At the Crossroads Choices for Secondary Education in Sub-
Saharan Africa: Africa Human Development Series, Washington D.C, The
World Bank.

71
APPENDICES
Appendix 1: Questionnaire for Form Three Chemistry Students
FACTORS AFFECTING CHEMISTRY PERFORMANCE IN SECONDARY
SCHOOL ORDINARY LEVEL NECTA EXAMINATIONS FROM 2009 TO
2012: A CASE OF SELECTED SCHOOLS IN DAR ES SALAAM
QUESTIONAIRE FOR FORM THREE CHEMISTY STUDENTS
Instructions
You have been selected to participate in this research which focuses on factors
affecting chemistry performance in ordinary level NECTA examinations results from
2009 to 2012 in Dar es Salaam city. Your inputs are very important for meeting the
objectives of this research.
Unless otherwise explained, please, write the letter of your preferable answer in the
curled brackets [ ] located in each question. Furthermore, you are kindly
requested to give some short explanation where allocated.
A:-Identification
1. Name of the School ............................................................................................
2. Date of interview (Date/Month/Year) ................................................................
B:- Personal information
1. What is your age in complete years? .................................................................
2. What is your sex?
a) Male b) Female [ ]
C:- Chemistry preference and facilities
1. Do you like Chemistry subject?
a) Very much? b) Not much? c) I don’t like chemistry [ ]
2. What are the reasons for your answer in (1)?
a) I love chemistry teacher
c) Chemistry is important in my future carrier
d) I hate chemistry teacher
e) Chemistry subject is difficult
f) I don’t know the importance of chemistry in my future life
More reasons if any..............................................................................
3. Does the school have Chemistry laboratory?
a) Yes b) No c) I don’t know [ ]

72
3. A If Yes, how many times have you entered in the laboratory as a class to do
some experiments or to observe a demonstration?
a) Less than five times b) five or more than five times c) more than ten times
d) I have never entered in the school laboratory for studies? [ ]
3.B The chemistry laboratory has the following facilities
a) All necessary chemicals (acids, bases, litmus paper, test tube and beaker)
b) Only a few chemicals and not enough beakers
c) Laboratory has no facilities [ ]
4. Does the school has laboratories for other subjects?
a) Yes b) No c) I don’t know [ ]
If Yes, tick [ √ ] all the laboratories which the school has
a) Mathematics laboratory [ ]
b) Physics laboratory [ ]
c) Biology laboratory [ ]
d) Computer laboratory [ ]
Others please mention ....................................
5. Do you have your own Chemistry books?
a) Yes b) No [ ]
6. If yes, How many?
a) one b) less than five c) more than five d) more than ten
e) Not applicable [ ]
7. From where did you get those books?
a) Received from my parents, friends or relatives
b) I bought with my own money c) Not applicable
Other sources, please explain. ......................................... [ ]
8. Does the school provide Chemistry books to students?
a) Yes b) No [ ]
C:- Performances in Chemistry subject
1. What are the performances in Chemistry Subject at your school as compared
to other subject?
a) Worse b) Bad c) Good d) Better e) Best?
(f) I don’t know [ ]
2. What are the reasons for your answer in C (1)?
............................................................................................................................
............................................................................................................................

73
D:- Performances in Form Four Chemistry NECTA examinations
Form four Chemistry NECTA examinations results have been declining
especially within the last four years from 2009.
1. What do you think are the reasons that cause that kind of performance?
Tick [ √ ] all the reasons you agree with from a) to d) below
a) There is no enough and qualified teachers in our schools [ ]
b) There are few chemistry facilities such as textbooks and
chemicals in our schools [ ]
c) Poor awareness on the importance of chemistry subject in
students future life or carriers [ ]
d) Chemistry subject is difficult [ ]
Other please explain,
............................................................................................................................
............................................................................................................................
2. What do you suggest should be done to improve Chemistry performance in
Form four NECTA examinations?
............................................................................................................................
............................................................................................................................
E:- Motivations
Are there any gifts given to the best students in chemistry subject at you
school?
a) Yes b) No [ ]
If Yes, please mention them
............................................................................................................................
............................................................................................................................
F:- Parent support/encouragement
Do your parents/care givers encourage you to perform well in Chemistry
subject?
a) Yes b) No [ ]
If Yes, please mention them
............................................................................................................................
............................................................................................................................
J:- Constraints
Please mention any constraints which are facing the learning of chemistry
subject
............................................................................................................................
............................................................................................................................
THANK YOU VERY MUCH FOR YOUR CORDIAL COOPERATION
I WISH YOU GOOD WORK

74
Appendix 2: Interview Guide for Chemistry Teachers in Secondary Schools
FACTORS AFFECTING CHEMISTRY PERFORMANCE IN SECONDARY
SCHOOL ORDINARY LEVEL NECTA EXAMINATIONS FROM 2009 TO
2012: A CASE OF SELECTED SCHOOLS IN DAR ES SALAAM
INTERVIEW GUIDE FOR CHEMISTRY TEACHERS IN SECONDARY
SCHOOLS
Instructions
You have been selected to participate in this research which focuses on factors
affecting chemistry performance in ordinary level NECTA examinations results from
2009 to 2009 in Dar es Salaam city. Your inputs are very important for meeting the
objectives of this research.
A:- Identification
1. Name of the School ............................................................................................
3. Date of interview (Date/Month/Year) ................................................................
B:- Personal information..
1. What is your age?
a) Less than 30 years
b) 30 years to 39 years
c)40 years to 49 years
d) 50 years and above [ ]
2. Sex
a) Male b) Female [ ]
3. Qualifications
a) Form VI leaver only
b) Diploma
c) B.sc (ED)
d) B.sc (Gen)
d) M.sc.
f) Others; Explain ................................ [ ]
B:- Chemistry teaching experience
1. How long have you been teaching chemistry?
a) Less than 5 years
b) Five but less than 10 years
c) 10 years and above [ ]
C:- Chemistry preferences and facilities.
1. Do you like teaching chemistry subject?
a) Yes b) No [ ]
What are the reasons for your answer above? ...................................................

75
2. Does the school have Chemistry laboratory?
a) Yes b) No [ ]
3. Does the school have a library
a) Yes b) No [ ]
4. Does the school provide Chemistry text books to students?
a) Yes b) No [ ]
D:- Perceptions on Chemistry NECTA examinations
Chemistry performances in NECTA examinations have been declining
especially within the last four years?
a) What do you think are the reasons for such performance?
............................................................................................................................
............................................................................................................................
b) What in your opinion should be done to improve Chemistry performance
in NECTA examinations results?
............................................................................................................................
............................................................................................................................
E:- Any other comments
............................................................................................................................
............................................................................................................................
THANK YOU VERY MUCH FOR YOUR CORDIAL COOPERATION
I WISH YOU GOOD WORK

76
Appendix 3: Interview Guide for other Key Informants such as TIE Staff
FACTORS AFFECTING CHEMISTRY PERFORMANCE IN SECONDARY
SCHOOL ORDINARY LEVEL NECTA EXAMINATIONS FROM 2009 TO
2012: A CASE OF SELECTED SCHOOLS IN DAR ES SALAAM
INTERVIEW GUIDE FOR OTHER KEY INFORMANTS
A:- Identification
1. Name of the key informant ................................................................................
2. Position in the organisation ................................................................................
3. Date of interview (Date/Month/Year) ................................................................
4. Phone number or e-mail .....................................................................................
B:- Background information
1. What is your age?
a) Less than 30 years
b) 30 years to 39 years
c) 40 years to 49 years
d) 50 years and above [ ]
2. Sex
a) Male b) Female [ ]
C:- Research Questions
1. Chemistry performances in NECTA examinations results in recent years have
not been improving as well as being poor compared to other subjects. What
are the reasons for those performances?
2. What should be done to improve the situation?
THANK YOU VERY MUCH FOR YOUR CORDIAL COOPERATION
I WISH YOU GOOD WORK