factors affecting consumers preferences for specialty eggs in
TRANSCRIPT

Factors Affecting Consumers Preferences for Specialty Eggs in Canada
A Thesis Submitted to the College of
Graduate Studies and Research
In Partial Fulfillment of the Requirements
For the Degree of Master of Science
In the Department of Bioresource Policy, Business and Economics
University of Saskatchewan
Saskatoon
By
Liou Huang
Copyright Liou Huang, January 2013. All rights reserved.

i
PERMISSION TO USE
In presenting this thesis in partial fulfilment of the requirements for a Postgraduate degree from
the University of Saskatchewan, I agree that the Libraries of this University may make it freely
available for inspection. I further agree that permission for copying of this thesis in any manner,
in whole or in part, for scholarly purposes may be granted by the professor or professors who
supervised my thesis work or, in their absence, by the Head of the Department or the Dean of the
College in which my thesis work was done. It is understood that any copying or publication or
use of this thesis or parts thereof for financial gain shall not be allowed without my written
permission. It is also understood that due recognition shall be given to me and to the University
of Saskatchewan in any scholarly use which may be made of any material in my thesis.
Requests for permission to copy or to make other use of material in this thesis in whole or
part should be addressed to:
Head of the Department of Bioresource Policy, Business and Economics
University of Saskatchewan
Saskatoon, Saskatchewan S7N 5A8
ii
ABSTRACT
The past decade has seen a significant increase in the consumer demand for specialty eggs in
Canada. This egg consumption trend has reflected the fact that current egg consumers are not
only content about eggs as a staple, but also demand egg products with enhanced attributes, such
as nutrition, health, animal welfare and food safety. A large body of literature has reported that
consumers are willing to pay a premium for specialty eggs that embody value-added qualities.
Thus, marketing information about heterogeneity in consumer preferences and characteristics
when purchasing eggs is needed for developing effective marketing plans and serving
consumers’ needs.
In order to address this issue, a choice experiment approach is adopted to elicit respondents’
preferences toward various characteristics of eggs and egg purchasing behaviours through an
online survey of 647 egg consumers in Canada. Egg consumers were asked to make choices from
three alternative egg products, or none, on the basis of five attributes including price, shell
colour, production method, feed, and pasteurization. Additionally, to test an alternative
production method (verified free run), I developed two versions of choice responses: one with
verified free run, one with only free run.
Results show that Canadian consumers’ willingness to pay for different types of egg attributes
varies significantly, shell colour is found to be related to consumers’ preferences for some
credence attributes (including free run, organic and pasteurization). Compared to white regular
eggs, respondents are willing to pay the most for white free run eggs (premium is $1.18 per
dozen), followed by omega-3 enhanced eggs (premium is $ .57 per dozen), brown organic eggs
(premium is $.52 per dozen) and brown free run eggs (premium is $ .57 per dozen), and are
indifferent towards verified free run eggs, vitamin-enhanced eggs and white pasteurized eggs. In
addition, consumers generally require a discount of $ .70 per dozen to purchase brown

iii
pasteurized eggs relative to white regular eggs. Furthermore, results from the extended
multinomial (MNL) model and the mixed logit (ML) model confirm the existence of preference
heterogeneity for egg attributes amongst Canadian consumers.
Results from this study will not only help egg producers, retailers and other stakeholders to
develop targeted marketing plans to expand choices within egg markets, but will also benefit egg
consumers with different requirements for egg quality and egg attributes.
iv
ACKNOWLEDGMENTS
I am extremely grateful to my two major supervisors: Dr. Hayley Hesseln and Dr. Jing Zhang.
I am genuinely thankful to Dr. Hayley Hesseln for her tremendous patience in mentoring me to
become an eligible researcher, for her continuous support and encouragement and providing me
with the invaluable advice on improving my thesis. Dr. Jing Zhang has constantly encouraged
me to conduct high quality research in a professional manner, and I greatly appreciate her for her
generous suggestions and help with my survey design and data analysis and guiding me
throughout the research process.
I would also like to extend my appreciation to my committee members, Dr. Jill E. Hobbs and
Dr. Kenneth W. Belcher for their guidance and feedback. I am also grateful to Dr. Marjorie
Delbaere for serving as external examiner and providing valuable comments and advice during
the defense.
I gratefully acknowledge the financial support from the Alliance for Food and Bioproducts
Innovation (AFBI) and the Department of Bioresource Policy, Business and Economics during
my graduate studies.
I am truly thankful for my classmates and the office staff in the Department of Bioresource
Policy, Business and Economics throughout my entire study-especially to Buwani Dayananda,
Xiaoyu Liu, Alphanso Williams, Deborah Rousson, Barb Burton and Heather Baerg for their
help and support. I also want to thank all the survey participants; this research would not have
been possible without their participation. At last, I really want to thank my family for their
incredible support and encouragement in all of my endeavours.

v
TABLE OF CONTENTS
ABSTRACT .................................................................................................................................... II
ACKNOWLEDGMENTS ............................................................................................................ IV
LIST OF TABLES ....................................................................................................................... VII
LIST OF FIGURES ................................................................................................................... VIII
INTRODUCTION .......................................................................................................................... 1
1.1 BACKGROUND ...................................................................................................................... 1
1.2 PROBLEM STATEMENT AND RESEARCH OBJECTIVES ........................................................... 4
1.3 ORGANIZATION OF THESIS ................................................................................................... 6
LITERATURE REVIEW ............................................................................................................... 8
2.1 INTRODUCTION .................................................................................................................... 8
2.2 CONSUMER PERCEPTION OF FOOD QUALITY ........................................................................ 8
2.3 CERTIFICATION SCHEMES AND INFORMATION ASYMMETRY ................................................ 9
2.4 FACTORS AFFECTING CONSUMER PREFERENCES FOR CREDENCE GOODS .......................... 11
Socio-demographic and Economic Factors .......................................................................... 11
Attitudes towards Food Quality ............................................................................................ 12
Purchasing Behavior and Knowledge .................................................................................. 14
2.5 SUMMARY OF RECENT CANADIAN EGG RESEARCH ........................................................... 15
2.6 CONCLUSION ...................................................................................................................... 17
THEORY AND SURVEY DESIGN ............................................................................................ 18
3.1 INTRODUCTION .................................................................................................................. 18
3.2 DEMAND AND THE CHOICE EXPERIMENT APPROACH ......................................................... 18
3.3 THE SURVEY DESIGN ......................................................................................................... 20
3.4 SURVEY QUESTIONS ABOUT RESPONDENTS’ CHARACTERISTICS ....................................... 25
3.5 SURVEY INSTRUMENT, COMPOSITION AND ADMINISTRATION ........................................... 27
EMPIRICAL METHODOLOGY ................................................................................................. 29
4.1 INTRODUCTION .................................................................................................................. 29
4.2 CHOICE MODELLING FRAMEWORK .................................................................................... 29
4.3 ALTERNATIVE MODEL SPECIFICATIONS ............................................................................. 32
Multinomial Logit Model ...................................................................................................... 33
4.3.1.1 Hypothesis testing ............................................................................................. 34
4.3.1.2 MNL model including interaction terms between attributes ............................ 35
4.3.1.3 Extended MNL model with respondents’ characteristics ................................. 36
Mixed Logit Model ................................................................................................................ 37
Willingness to Pay................................................................................................................. 39
4.4 CONCLUSION ...................................................................................................................... 40
DESCRIPTIVE ANALYSIS ........................................................................................................ 41
5.1 INTRODUCTION .................................................................................................................. 41

vi
5.2 DEMOGRAPHIC CHARACTERISTICS OF THE RESPONDENTS ................................................. 41
5.3 EGG SHOPPING HABITS ...................................................................................................... 43
5.4 FOOD SAFETY, RISK AND HEALTH ATTITUDES .................................................................. 47
5.5 KNOWLEDGE OF EGGS AND BARRIERS TO PURCHASING SPECIALTY EGGS ........................ 54
5.6 PERCEPTIONS OF EGG QUALITY AND ATTRIBUTES ............................................................. 56
5.7 CONCLUSION ...................................................................................................................... 58
MODEL RESULTS AND ANALYSIS........................................................................................ 60
6.1 INTRODUCTION .................................................................................................................. 60
6.2 ESTIMATION RESULTS OF THE MULTINOMIAL LOGIT MODEL ............................................ 60
Hypothesis Testing ................................................................................................................ 60
Base MNL Model Results ...................................................................................................... 62
Base MNL Model Including Interaction Terms between Attributes ..................................... 66
Extended MNL Model with Respondents’ Characteristics ................................................... 67
6.3 ML MODEL RESULTS ......................................................................................................... 74
6.4 CONCLUSION ...................................................................................................................... 78
CONCLUSIONS........................................................................................................................... 80
7.1 SUMMARY OF RESEARCH RESULTS .................................................................................... 80
7.2 INDUSTRY IMPLICATIONS ................................................................................................... 81
7.3 LIMITATIONS OF THE RESEARCH AND AREAS FOR FUTURE RESEARCH .............................. 83
REFERENCES ............................................................................................................................. 85
APPENDIX ................................................................................................................................... 94

vii
LIST OF TABLES
Table 3-1. Egg attributes and levels ..................................................................................21
Table 3-2. An example choice question (Version 1) ........................................................24
Table 3-3. An example choice question (Version 2) ........................................................24
Table 4-1. Interpretation and coding of main variables used in the choice models ..........31
Table 5-1. Demographic characteristics of the sample .....................................................42
Table 6-1. Base MNL model estimates for pooled data sets controlling for scale difference
................................................................................................................................61
Table 6-2. Base MNL model results .................................................................................63
Table 6-3. Marginal mean WTP for each egg attribute ....................................................64
Table 6-4. Base MNL model with two-way interaction effects for the egg attributes .....66
Table 6-5. Variables used in the extended MNL model ...................................................68
Table 6-6. Extended MNL model estimates with characteristic interaction terms ...........69
Table 6-7. Simulated maximum likelihood estimates from ML model ............................75
Table 6-8. Mean marginal WTP (in $/dozen) estimates from the ML model ..................77

viii
LIST OF FIGURES
Figure 1-1. Egg consumption per capita, per annum in Canada 1980-2009 (source: Statistics
Canada 2010) ...........................................................................................................1
Figure 4-1. Flowchart of alternative discrete choice models ............................................33
Figure 5-1. Provincial distribution of the survey samples compared to Canadian population
(excluding Quebec) (source: Statistics Canada 2006) ...........................................43
Figure 5-2. Frequency of purchasing eggs in the past six months ....................................44
Figure 5-3. Package size of eggs most frequently purchased by respondents ..................44
Figure 5-4. Egg purchasing locations by respondents ......................................................45
Figure 5-5. Price for per dozen of eggs .............................................................................46
Figure 5-6. Colour of eggs respondents normally bought ................................................46
Figure 5-7. Types of eggs most often purchased ..............................................................47
Figure 5-8. Respondents’ general attitudes towards food safety ......................................48
Figure 5-9. Average score of confidence in the safety of product groups by respondents49
Figure 5-10. Risk perception of eating eggs .....................................................................50
Figure 5-11. Risk preference associated with health and recreational behaviours ...........51
Figure 5-12. Health conditions of respondents’ household members...............................52
Figure 5-13. Health behavior and awareness of respondents ...........................................53
Figure 5-14. Health locus of control over respondents’ health .........................................54
Figure 5-15. Mean knowledge score of survey respondents to different types of eggs ....55
Figure 5-16. Likelihood of purchasing specialty eggs if they become available or more available
in superstores/grocery stores ..................................................................................56
Figure 5-17. Likelihood of purchasing specialty eggs if their production process are verified or
certified by a third-party organization ...................................................................56
Figure 5-18. Frequency of perceptions of objective quality .............................................57
Figure 5-19. Frequency of perceptions of subjective quality ...........................................58

1
CHAPTER 1
INTRODUCTION
1.1 Background
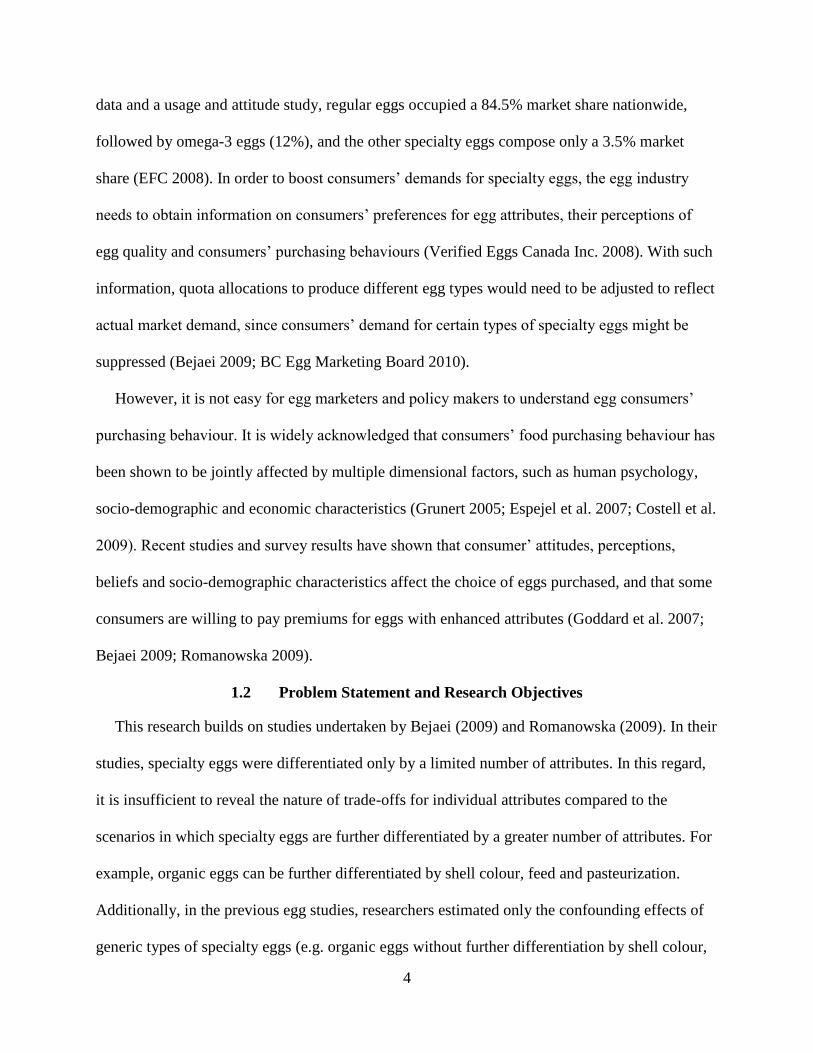
Per capita egg consumption declined beginning in the 1980s and continued to fall until 1995.
An increased public awareness of the link between high cholesterol and egg consumption, and
the salmonella scare contributed to the rapid decline in per capita consumption of eggs during
this time in Canada (see Figure 1-1) (Brown and Schrader 1990; Schmit and Kaiser 1998; Sim
and Sunwoo 2000; Hailu and Goddard 2004; Asselin 2005). Changing dietary culture and
lifestyle (e.g. rising demand for healthy alternatives as well as novel and convenience foods) also
contributed to the decline in egg consumption (Brown and Schrader 1990; Ness and Gerhardy
1994; Fearne and Lavelle 1996). However, since the middle 1990s, this downward trend has
reversed.
Figure 1-1. Egg consumption per capita, per annum in Canada 1980-2009 (source: Statistics
Canada 2010)
The rebound could be partially attributed to two factors. First, over the past few years, with
ever-increasing positive medical coverage and research findings concerning the health benefits
2
of eggs, eggs have been considered to be a healthy food choice by Health Canada’s “Eating Well
with Canada’s Food Guide” and the Heart and Stroke Foundation of Canada’s “Health Check™”
program if consumed in moderation (Hu et al. 1999; Katz et al. 2005; EFC 2009, 2010). Second,
the introduction of a variety of specialty eggs is considered to be another primary driver of
increased egg demand (Sim and Sunwoo 2000; Hailu and Goddard 2004; Karipidis et al. 2005;
Goddard et al. 2007).
Recent years have witnessed a rapid growth in specialty egg consumption. According to AC
Nielsen retail sales data, sales of specialty eggs in Canada increased by 21.4% between 2008 and
2006, whereas sales of regular eggs in Canada increased by only 3.2% between 2008 and 2006
(BC Egg Marketing Board 2009). In addition, consumer spending for specialty eggs in Canada
rose from $94 million at the end of 2005 to $120 million at the end of 2007 (AAFC 2008).
Although there is no unified definition, specialty eggs differ from regular eggs in the way
hens are housed or fed, or the way eggs are processed (EFC 2009; CCFA 2009). In this regard,
specialty eggs in this study refer to eggs with enhanced attributes in terms of feed (e.g. omega-3
enhanced feed and vitamin-enhanced feed), production method (e.g. free run and organic) or
processing practice (e.g. pasteurized). Despite the fact that nutrient values can be altered only by
changing the feed formula eaten by hens (EFC 2009, 2010) and eggs produced under alternative
housing environments (e.g. free run and organic) typically have similar nutritional composition
to those produced from battery cages, many consumers think otherwise (Eng 2009; Gerken 2010;
HSUS 2010).
Specialty eggs satisfy consumers’ demands for a wider range of tastes, health benefits, food
safety and animal welfare. For example, eggs produced in alternative housing environments (e.g.
3
free run, free range1 and organic) offer consumers choices as to egg production and hen welfare,
since the vast majority of Canada’s eggs (approximately 98 percent) come from hens kept in
conventional battery cages (CCFA 2009). A series of recent consumer poll results,
commissioned by animal welfare groups suggested that the majority of Canadians cared about
the well-being of laying hens and around 10% of the respondents already regularly purchased
cage-free eggs (including free run, free range and organic eggs) (WSPA and CCFA 2005; WSPA
2008; VHS 2009). However, due to the credence nature of quality-differentiated specialty eggs,
consumers cannot easily detect or assess the quality attributes before or after purchase and
consumption (Nelson 1970; Darby and Karni 1973). Consequently, verification or certification
systems have been introduced to assure consumers of the quality claims displayed on food
packages (Caswell 2001). It is noteworthy that most specialty eggs sold in the Canadian egg
market are neither certified nor verified except for organic eggs. Some organic eggs are certified
by third-parties, such as certified organic eggs with the Canadian Organic Regime (COR) label,
British Columbia Society for the Prevention of Cruelty to Animals (BC SPCA) certified eggs
(available in parts of Canada), and Local Food Plus (LFP) cage-free eggs based in Toronto
(CCFA 2009). In addition, as pasteurized eggs are not available in the Canadian market, it is
worthwhile to assess how consumers’ knowledge of pasteurized eggs and risk preferences
influence choice behaviors in a hypothetical context, thereby providing useful policy information
for the potential market prospects for pasteurized eggs.
Despite the overall rapid market growth of specialty eggs, the market share of various types of
specialty eggs remains small relative to regular eggs (Bejaei 2009). According to 2008 Nielsen
1 The difference between free range eggs and free run eggs is that free range eggs come from
hens that are either raised outdoors or have outdoor access, whereas free run eggs are produced
by hens that are only raised indoors without battery cages.
4
data and a usage and attitude study, regular eggs occupied a 84.5% market share nationwide,
followed by omega-3 eggs (12%), and the other specialty eggs compose only a 3.5% market
share (EFC 2008). In order to boost consumers’ demands for specialty eggs, the egg industry
needs to obtain information on consumers’ preferences for egg attributes, their perceptions of
egg quality and consumers’ purchasing behaviours (Verified Eggs Canada Inc. 2008). With such
information, quota allocations to produce different egg types would need to be adjusted to reflect
actual market demand, since consumers’ demand for certain types of specialty eggs might be
suppressed (Bejaei 2009; BC Egg Marketing Board 2010).
However, it is not easy for egg marketers and policy makers to understand egg consumers’
purchasing behaviour. It is widely acknowledged that consumers’ food purchasing behaviour has
been shown to be jointly affected by multiple dimensional factors, such as human psychology,
socio-demographic and economic characteristics (Grunert 2005; Espejel et al. 2007; Costell et al.
2009). Recent studies and survey results have shown that consumer’ attitudes, perceptions,
beliefs and socio-demographic characteristics affect the choice of eggs purchased, and that some
consumers are willing to pay premiums for eggs with enhanced attributes (Goddard et al. 2007;
Bejaei 2009; Romanowska 2009).
1.2 Problem Statement and Research Objectives
This research builds on studies undertaken by Bejaei (2009) and Romanowska (2009). In their
studies, specialty eggs were differentiated only by a limited number of attributes. In this regard,
it is insufficient to reveal the nature of trade-offs for individual attributes compared to the
scenarios in which specialty eggs are further differentiated by a greater number of attributes. For
example, organic eggs can be further differentiated by shell colour, feed and pasteurization.
Additionally, in the previous egg studies, researchers estimated only the confounding effects of
generic types of specialty eggs (e.g. organic eggs without further differentiation by shell colour,
5
feed or pasteurization) without disentangling the effects of individual egg attributes on the choice
decision (Goddard et al. 2007; Bejaei 2009; Romanowska 2009). In such cases, if there are
interaction effects between different types of attributes, the estimation results with regard to
attribute preference might be biased. For example, Chang et al. (2010) found that egg consumers
in Dallas and San Francisco tend to associate the implicit price of cage-free and organic
attributes with egg shell colour, and that a significant proportion of the premium identified for
such eggs over regular eggs depends on shell colour. In order to test whether egg consumers
evaluate attributes together, it is important to consider the main effect of attributes, as well as
two-way interaction effects between attributes.
Finally, there is little information available in the literature about how the introduction of
verified specialty eggs affects consumer demand for unverified specialty eggs. This point gives
rise to the question of whether the introduction of verification results in a stigma effect on
unverified counterparts. Research conducted by Romanowska (2009) identified that the price
premium of uncertified vitamin-enhanced eggs and pasteurized eggs identified in the revealed
preference experiment became negative or zero in the stated preference experiment where
“certification body” was introduced into the choice design. Nevertheless, willingness to pay
(WTP) estimates from revealed preference experiments and stated preference experiments are
not comparable in Romanowska’s study due to the difference in the survey design.
This study uses a choice experiment where consumers of egg products were provided with a
combination of five egg attributes at varying levels: price, shell colour, production method, feed,
and pasteurization. The overall objective of this thesis is to identify Canadian consumers’
valuation of changes in attribute levels of specialty eggs relative to regular eggs, with an

6
emphasis on revealing factors affecting preference heterogeneity and the consumer profile of
diverse market segments. The first objective is to:
Identify Canadian consumers’ preferences and WTP for various specialty eggs and how
consumer characteristics, attitudes, perceptions and other psychological factors affect
valuation of egg attributes.
The primary focus is on the relative importance of egg attributes in consumers’ purchasing
decisions and segmentation of egg consumers based on the differences in observed
characteristics and attitudes towards egg quality. In light of an increase in market sales of
specialty eggs, a pertinent question is what types of egg attributes really matter to Canadian
consumers and how much they are willing to pay for these value-added attributes when
purchasing eggs. Specifically, this study aims to understand how enhanced egg attributes affects
choice of eggs. Do consumers’ risk preferences affect their stated WTP for pasteurized eggs? In
addition, it is intriguing to find out the heterogeneity of behaviour between frequent purchasers
of eggs and non- or seldom egg purchasers. Finally, this study also seeks to understand how
consumers’ knowledge towards production method and nutritional information of egg types
influences their assessment and evaluation of them.
The second objective is to:
Determine whether willingness to pay for free run eggs is significantly different when a
verified free run attribute is introduced.
The purpose is to explore whether the verified free run attribute has an impact on consumers’
marginal willingness to pay for egg attributes, particularly the attribute level of unverified free
run.
1.3 Organization of Thesis
The thesis is organized as follows. Chapter 2 reviews the literature on consumers’ preferences
for agri-food products and provides a summary of recent Canadian egg research. Chapter 3

7
describes the theory, survey instrument and the development of the choice experiment. Chapter 4
illustrates the theoretical foundation and empirical methodology utilized in this study. Chapter 5
provides a descriptive analysis of the survey sample. Chapter 6 provides model results and
discussion, followed by concluding comments and industry implications in Chapter 7.
8
CHAPTER 2
LITERATURE REVIEW
2.1 Introduction
This chapter is divided into four sections. The first section provides a definition of credence
attributes and how consumers’ perceptions of food quality affect their purchasing decisions; the
second section describes the role of certification schemes in alleviating information asymmetry
in credence goods markets; the third section reviews the literature explaining consumer
preferences for credence goods; and the final section examines recent Canadian egg research.
2.2 Consumer Perception of Food Quality
From an economics perspective, consumers’ purchasing decisions are made to maximize
utility derived from a good. Lancaster (1966) proposed that goods are a bundle of characteristics
or attributes; therefore a consumer’s demand for a product reflects the demand for that product’s
attributes. Since food products of higher quality are associated with higher prices, consumers
have to trade off between different attributes to meet their own needs as a result of income
constraints. Therefore, alternative types of eggs can be defined as a combination of attribute
levels, such as price, production method and shell colour. Egg consumers have to trade off
attribute level combinations when deciding to purchase different types of eggs in order to
maximize their utility. However, some food quality attributes, such as food safety, animal
welfare, and health are difficult for consumers to verify. Therefore, consumers might lose utility
by making less-informed purchase decisions, depending on the extent to which their attitudes and
perceptions towards food attributes correctly correspond to the attribute for which they are
paying.
According to Darby and Karni (1973) and Nelson (1970), product attributes can be
categorized as search, experience and credence attributes. Search attributes can be observed and
9
assessed by consumers before purchase, such as colour and size. Experience attributes cannot be
assessed until consumers have used the product, such as taste and cooking performance.
Credence attributes are those for which consumers cannot detect or assess before or after
purchase and consumption, such as animal welfare and food safety. Due to prohibitively high
search costs or difficulty assessing the presence of credence attributes, consumers often rely on
quality indicators (e.g. labeling and certification) and cues (e.g. price and past purchase
experience) to form expectations of food quality (Caswell 2001). Grolleau and Caswell (2005)
identified that consumers perceived a connection between environmental friendliness
characteristics and the levels of search and experience attributes in products with environmental
soundness claims. For instance, some consumers might believe that food products with eco-
labeling taste better. Fearne and Lavelle (1996) identified that the majority of free run egg
consumers perceived them to taste better. Research by Romanowska (2009) also showed that
free run eggs were perceived by respondents to be more natural, to have not been treated with
antibiotics and to taste better. Similarly, another study showed that locally grown apples were
considered by some respondents to be firm, free of pests and diseases and have good flavour
(Dentoni et al. 2009).
Furthermore, even though consumers might be well aware of perception bias, it is still
difficult for consumers to calibrate their perceptions of credence attributes over time after
purchase or with new information sources (Caswell et al. 2002; Grunert 2005; Espejel et al.
2007). Consequently, there is a need to incorporate consumer perceptions of egg quality into an
empirical analysis of preferences for credence attributes in eggs.
2.3 Certification Schemes and Information Asymmetry
Certification or verification, have the potential to mitigate the severe information asymmetry
problem and facilitate consumers to make choices that are aligned with their expectation of
10
quality of credence goods. Through certification or verification, credence attributes can be
transformed into search attributes, which would facilitate the process of quality evaluation and
communication between buyers and sellers (Caswell 2001; Umberger et al. 2003).
A large body of literature suggests that some consumer segments are willing to pay premiums
for the certification of product quality claims, such as improved safety (e.g. rBST-free and
growth hormone-free), enrichment of nutrition (e.g. vitamin and omega-3 enhanced) and certain
types of production or processing practices (e.g. organic and animal welfare) (Umberger et al.
2003; Bernard and Mathios 2005; Bonti-Ankomah and Yiridoe 2006; Aguilar and Vlosky 2007).
However, caution should be exercised that providing consumers with information regarding
credence attributes without considering consumers’ capabilities and heterogeneity in information
processing and perceptions of information sources might be insufficient to mitigate information
asymmetry (Caswell 1998; Grolleau and Caswell 2005; Gellynck et al. 2006).
There are very few Canadian egg studies that investigate the impact of certification on
consumers’ evaluation of credence attributes. Romanowska (2009) found that there is no
premium or negative premium for uncertified specialty eggs when certified specialty eggs are
available, which might be due to the small sample bias or externality effect arising from the
availability of certified specialty eggs. For instance, respondents were indifferent between
regular eggs and uncertified free run eggs in terms of WTP when certified free run eggs were
available in the stated preference study. Currently, specialty eggs (except for organic eggs) are
voluntarily verified or certified by public or private certifying bodies (e.g. BC SPCA, LFP and
Verified Eggs Canada Inc.). To date, there is little research that tests for the effect of the
certification of specialty eggs on consumers’ WTP for uncertified counterparts. In

11
Romanowska’s study, she estimated only the consumers’ WTP for certification of credence
attributes without testing the possible externality effect of certified specialty eggs.
2.4 Factors Affecting Consumer Preferences for Credence Goods
It is well-known that there is significant heterogeneity in consumers’ preferences for food
quality. Therefore, it is necessary to investigate how factors such as attitude and knowledge
towards credence attributes, past purchase experience and socio-demographic profiles affect
consumer demand for credence goods.
Socio-demographic and Economic Factors
There are no consistent findings about the impact of socio-demographic and economic factors
on consumers’ preferences across credence goods. Gender, number of children, family size,
educational level, income, price and age are among the relatively important and significant
factors that influence consumers’ preferences and WTP for credence goods; however, the
direction and magnitude of correlation and resulting WTP can vary across types of credence
goods (Thompson 1998; Wessells et al. 1999; Huang et al. 1999; Heiman et al. 2000; Armah and
Kennedy 2000; Boccaletti and Nardellab 2000; Loureiro and McCluskey 2000; James and
Burton 2003; Li et al. 2003; Hatirli et al. 2004; Aguilar and Vlosky 2007; Angulo and Gil 2007;
Romanowska 2009; Probst et al. 2010).
For instance, some studies reported that older respondents and respondents with large families
were generally less likely to purchase specialty eggs because of income constraints (Goddard et
al. 2007); respondents with higher levels of income were found to consume fewer white regular
eggs and more free run and organic eggs (Goddard et al. 2007; Bejaei 2009); older people are
less likely to prefer certified eggs (Romanowska 2009). It has also been demonstrated that price
was deemed to be the most important factor for the choice of white regular eggs, and that
consumers’ sensitivity to price was different and affected by several factors, including the

12
number of minors at home and the age of household heads (Fearne and Lavelle 1996; Goddard et
al. 2007; Bejaei 2009).
Some studies reported that socio-demographic characteristics such as marital status,
membership in environmental organizations, religion and community (living in urban areas
versus rural areas) might also help in explaining consumer choices for credence goods
(Thompson 1998; Wessells et al. 1999; Armah and Kennedy 2000; Heiman et al. 2000; Botonaki
et al. 2006). Additionally, many studies found that attitude, perception, knowledge towards
credence goods, past purchase experience or habits, and health consciousness and behaviour are
more significant in interpreting preference heterogeneity than socio-demographic factors
(Verbeke 2005).
Attitudes towards Food Quality
Attitudes towards credence attributes have been identified to be major driving forces behind
the decision to purchase food products, which vary among consumers and types of food
products. Moon and Balasubramanian (2003) stated that consumers’ acceptance and preference
for agri-foods produced using agro-biotechnology was affected by their perceptions of risk
associated with bio-foods and environmental perceptions of agro-biotechnology. Further to that,
consumers who were more risk averse were more likely to perceive non-GM foods as quality-
improving (Baker and Burnham 2001).
Some credence attributes can act as proxy signals for a range of perceived qualities. For
example, Brennan et al. (2003) reported that consumers perceived organic meat as healthier,
more nutritious and tasting better than non-organic counterparts, despite potential health risks of
Escherichia coli and salmonella associated with organic meat. Animal welfare concerns are also
motives for consumers’ decisions to purchase organic foods (Harper and Makatouni 2002;
Goddard et al. 2007). Analogously, some consumers perceived animal welfare as a cue for food
13
safety and sensory attributes (Phan-Huy and Fawaz 2003). In the context of egg products, Bejaei
(2009) found that free range, free run and organic eggs were chosen by some respondents who
perceived them to be indicative of better animal welfare, healthfulness and taste.
Fearne and Lavelle (1996) found that egg consumers in the UK were concerned about
cholesterol levels as well as bird welfare, and that free range egg consumers perceived free range
eggs from happier laying hens to taste better. Most consumers agreed that battery-egg production
was cruel, but some would purchase regular eggs in spite of this knowledge. The blind taste test
between different types of eggs (battery eggs, free range eggs and branded eggs) showed that
there was no significant difference in terms of perception of taste compared to the informed
version in which respondents were informed about which type of eggs they tasted.
Baltzer (2004) found that Danish egg consumers concerned about animal welfare and organic
production were willing to pay extra for enhanced animal welfare and organic housing practices.
Goddard et al. (2007) recognized that a series of attitudinal factors significantly affected
consumers’ willingness to pay for specialty eggs. One intriguing finding in their research was
that consumers’ perceptions of organic and free run eggs were associated with health benefits,
even though there is no nutritional difference between those eggs and regular eggs.
In addition, consumers’ health consciousness, behaviours and their family members’ health
conditions were also found to be related to the choice of certain types of credence goods,
particularly for functional foods. For example, when a family member was ill, respondents were
more likely to choose nutrient fortification or pesticide free products, such as functional foods
and hydroponically grown vegetables (Huang et al. 1999; Verbeke 2005). Goddard et al. (2007)
found that health-conscious consumers preferred specialty eggs and were willing to pay
premiums for them, which is consistent with results identified in Asselin (2005) who found that

14
respondents’ health behaviour and consciousness were significantly correlated to WTP for
omega-3 enhanced eggs, and that respondents who were more health conscious were more likely
to buy omega-3 enhanced eggs.
Previous egg researchers also suggested that shell colour matters in consumers’ choices of
eggs (Goddard et al. 2007; Bejaei 2009; Romanowska 2009), although the impact of shell colour
was not separately analyzed from credence attributes. Chang et al. (2010) identified a substantial
proportion of the price premium of cage-free and organic egg consumers depended on whether
those eggs had brown shells in Dallas and San Francisco.
Purchasing Behavior and Knowledge
Respondents’ past purchasing behaviours, such as consumption levels and purchase
frequencies can significantly influence the choice of certain types of credence goods and WTP
due to the persistent impact of habit formation and reluctance to change (Campiche et al. 2004;
Botonaki et al. 2006; Angulo and Gil 2007). Thompson (1998) maintained that awareness of
where consumers purchased foods might be of great importance in tapping into organic foods
markets. Analogous to his assertion, Ubilava and Foster (2009) also suggested that factors such
as location and type of outlet might be linked to food attributes, providing producers with
additional marketing strategies. Respondents’ egg purchasing habits might, to a certain extent,
affect their knowledge and perception of egg quality. For example, the AC Nielsen Homescan
data indicated that Albertan households with higher grocery store expenditures purchased more
specialty eggs (Goddard et al. 2007).
Several researchers identified that lack of knowledge about production methods, and the lack
of product availability are also barriers to purchasing credence goods with enhanced attributes
(Wessells et al. 1999; Harper and Henson 2001; Kozak et al. 2004; Botonaki et al. 2006; Bonti-
Ankomah and Yiridoe 2006). Fearne and Lavelle (1996) found that consumers were not well

15
aware of the various egg production methods. Ambiguity and the lack of knowledge regarding
product quality and quality assurance systems were also found to affect respondents’ WTP for
credence goods (Baker and Burnham 2001; Brennan et al. 2003; Li et al. 2003; Schroder and
McEachern 2004; Verbeke 2005). Romanowska (2009) found that respondents were
misinformed about certification regimes and institutions responsible for quality assurance claims
and standards; on average, respondents were aware of approximately half of the certification
process for nutritional claims: for example, industry is responsible for claims about being
vitamin-enhanced.
In summary, a wide range of factors can affect consumers’ egg purchases. In a consumer-
driven market, it is important for egg producers and marketers to understand these factors to
improve their product development plans and marketing strategies. However, there is a lack of
research that investigates the interaction effects among such factors.
2.5 Summary of Recent Canadian Egg Research
Cranfield and Henson (2009) conducted an online survey by randomly selecting 2,000
residents from a Guelph Food Panel in 2008 to assess respondents’ response to egg products with
animal welfare quality, including free run and free range eggs. They found that choices to buy
both types of eggs were correlated with attitude towards conventional housing methods for hens
and awareness of animal welfare.
Based on analyses of stated preferences in Alberta, and revealed preferences in Alberta and
Ontario, Goddard et al. (2007) reported that most consumers were not willing to pay more for
specialty eggs than for regular eggs. Furthermore, a series of attitudinal and socio-demographic
factors were identified to be closely associated with preferences for egg attributes, such as health
and animal welfare concerns. For instance, families with children and older shoppers tended to
be more responsive to price changes.

16
Bejaei (2009) conducted an online survey in June 2009 to elicit consumers’ actual purchasing
behaviours and corresponding profiles of different types of egg consumers from 702 adult BC
residents. Her research also revealed the importance of factors including consumers’
characteristics and attitudes in their selection of alternative types of eggs. For example, results in
her survey questionnaires indicated that consumers with higher education and income levels
actually purchased more free-range eggs compared with regular eggs. Further to that, results also
suggested that the importance of factors varies considerably across consumers of different types
of eggs. For instance, in terms of consumers’ reasons for preference of a particular type of egg,
regular eggs were mostly chosen by regular egg purchasers because lower price was rated to be
an important factor, whereas nutrient-enhanced eggs were mainly chosen due to the perceived
nutritional value and health benefits by respondents. Nevertheless, her study did not involve the
empirical analysis of choice models and WTP information and the survey results were applicable
to only BC consumers.
Another recent Canadian egg study undertaken by Romanowska (2009) focused on the impact
of certification on consumer preferences for credence attributes in eggs. She adopted two
information treatments (choice task prior to a survey vs. choice task after a survey with and
without a real experiment prior to the stated preference exercise). She found a significant
variation in consumers’ willingness to pay for certification; consumers generally prefer certified
specialty eggs to uncertified counterparts and government to be the most preferred certifying
body regardless of egg types. Consumers’ overall trust levels, shopping location, age and income
also affected consumers’ choice of egg types and related certifying bodies. For example,
consumers who usually bought eggs at the farmers’ market were more price sensitive, richer
people would pay more for free run eggs, and consumers with high general levels of trust had a
17
preference for farmer certification of vitamin-enhanced and free run eggs. In her study, three
segments of egg consumers were classified, including “the rational trade-off consumer”, “the
price-conscious consumer” and “the free-run lover”. Romanowska’s research revealed a negative
premium for uncertified specialty eggs versus regular eggs, which is inconsistent with the actual
specialty egg markets where specialty eggs are priced higher than regular eggs. Additionally, the
results might be due to a small sample size bias and limited egg attributes. Finally, the results
were generalized only to Edmonton consumers.
The literature shows that it is necessary to cover a broader range of egg attributes in
consumers’ preferences for specialty eggs. It is commonly acknowledged that the importance
and value of egg qualities considerably differ among egg consumers. This study aims to examine
egg consumers’ preference heterogeneity and profile of consumer segments at a national level
relative to the regional level covered in previous egg studies.
2.6 Conclusion
A summary of recent egg studies indicates that consumer motivation is complex regarding
egg purchasing behaviour. Based on previous bodies of research, it is important to evaluate
consumers’ socio-demographic characteristics and attitudes towards egg quality to understand
egg consumers’ preferences. This study will add to existing egg research by examining the
potential correlation of egg attributes rather than treating egg attributes independently. This is
important because results will be useful to eggs producers and marketers who will better
understand consumers’ demands and can change production methods or outputs to better satisfy
customers.

18
CHAPTER 3
THEORY AND SURVEY DESIGN
3.1 Introduction
This chapter focuses on the research approach rationale and the development and organization
of the choice experiment (CE) survey. This chapter discusses Lancastrian consumer theory, and
the CE approach, which compared to other attribute-based methodologies, is more suited to this
research. This chapter also elaborates on the survey design, which includes the survey
instrument, composition and administration, and a brief review of a wide array of survey
questions regarding egg-shopping habits, attitudes toward food safety and health, perceptions of
egg quality and socio-demographic characteristics.
3.2 Demand and the Choice Experiment Approach
Traditional demand theory posits that individuals choose goods in order to maximize utility.
In this context, the attributes considered in the utility function are quantity and price. However,
significant variation in qualities or attributes of products is important when evaluating products.
Therefore, separate assessment of individual product attributes is masked under the overall
evaluation of price by the means of a demand function.
Unlike traditional demand theory, Lancaster (1966) developed an attribute-based demand
theory which assumes that consumers derive utility from characteristics or attributes of a product
rather than from the product per se. Lancaster’s approach aims to maximize the aggregate of
individuals’ utilities arising from a given bundle of attributes of a good. This approach is
conducive to understanding the overall utility consumers obtain from egg consumption based on
egg attributes: price, shell colour, production method, feed and pasteurization.
Founded in consumer theory, a multitude of methods have been developed to gauge
individuals’ preference for goods, which can be categorized as revealed preference (RP) or stated
19
preference (SP) methods (Louviere et al. 2000; Train 2003). As the name indicates, RP relies on
observations of real market behaviour to elicit individuals’ preferences. Therefore, RP
explanatory variables might suffer from little variability and be highly collinear (Hanley et al.
1998; Louviere et al. 2000; Hensher et al. 2005). In this regard, it is difficult or impossible for
researchers to estimate the individual impact of variability of an attribute. Furthermore, RP data
are not available for new products. In contrast to RP, SP relies on participants to state their
preferences in a hypothetical setting. Thus, SP is more appropriate in this research for two
reasons. First, because market-level data on sales of pasteurized eggs and other hypothetical egg
profiles do not exist in Canada, stated preference data are thus needed to evaluate the relative
importance of attributes in consumers’ purchasing behaviours. Second, through SP survey
design, researchers have better control over the data to satisfy model assumptions and permit
rigorous testing of relevant research hypotheses.
Among a set of stated preference methods, the CE approach has frequently been used by
economists and market researchers over the past two decades (Hanley et al. 1998; Train 1998;
Revelt and Train 1998; Adamowicz et al. 1998; Hensher 2001; Boxall and Adamowicz 2002;
Carlsson et al. 2003; Lusk and Schroeder 2004; Lagerkvist et al. 2006; Mtimet and Albisu 2006;
Loureiro and Umberger 2007; Tonsor et al. 2009; Olynk et al. 2010; Innes and Hobbs 2011;
Uzea et al. 2011). In a typical CE task, respondents are asked to make repeated choices among
hypothetically constructed alternatives described by a defined set of attributes. Hence, the total
utility consumers derive from choosing a product is the sum of the individual utilities gained
from the attributes of that product. With this methodology, researchers are able to examine
consumers’ trade-offs among attributes and to compute WTP for such attributes (Boxall et al.
1996; Hanley et al. 1998).

20
While there are many benefits to using the CE approach, choice experiments are prone to
hypothetical bias (Carlsson and Martinsson 2001; Lusk 2003; Lusk and Schroeder 2004) where
respondents overstate their WTP. To reduce hypothetical bias, “certainty questions” were used in
this study (Champ and Bishop 2001). For example, after each choice task, respondents were
asked to rate how certain they were about their decision, ranging from 1 (no confidence at all) to
10 (complete confidence).
3.3 The Survey Design
The first stage of the design involved identification of attributes with varying levels including:
price, shell colour, production method, feed and pasteurization. The five attributes were chosen
on the basis of previous egg studies that indicated their importance of such attributes in
consumers’ egg purchasing decisions (Goddard et al. 2007; Romanowska 2009; Bejaei 2009). To
assess consumers’ marginal WTP for unverified free run eggs, two CE treatments were designed
in which all the attributes and correspondent levels are identical except for production method.
Version 1 included: conventional battery cages, free run and organic; version 2 included a fourth
level: verified free run. The remaining attributes and levels were identical between versions.
Each respondent answered one version of the survey. Table 3-1 illustrates egg attributes and
levels used.

21
Table 3-1. Egg attributes and levels
Version 1 Version 2
Attributes Levels
Shell colour White
Brown
White
Brown
Production method Conventional battery cages
Free run
Organic
Conventional battery cages
Free run
Verified free run
Organic
Feed Regular feed
Omega-3 enhanced feed
Vitamin-enhanced feed
Regular feed
Omega-3 enhanced feed
Vitamin-enhanced feed
Pasteurization Pasteurized to kill Salmonella
Not Pasteurized
Pasteurized to kill Salmonella
Not Pasteurized
Price(per dozen) $2.15, $3.43, $4.71 or $5.99 $2.15, $3.43, $4.71 or $5.99
Note: The attribute levels of regular eggs (constant option C) are italicized; the extra attribute
level in version 2 is represented in bold.
The motivation for the information treatment arose from Romanowska (2009). In her study,
when free run eggs were further differentiated by certification organization, the price premium
was not statistically different from zero compared to regular eggs, whereas people were willing
to pay a premium for certified free run eggs regardless of certifying organization. This is not
consistent with the results from her revealed preference choice experiment and the real market
where people are willing to pay a premium for uncertified free run eggs. Romanowska (2009)
suggested this finding might result from the unique characteristics of the surveyed respondents
who did not prefer uncertified free run eggs. Nevertheless, respondents’ marginal WTP for
uncertified eggs might be negatively affected by the existence of certified counterparts.
Respondents were asked to make a choice between three alternative types of eggs or none. As
a basis of comparison, the third egg product (option C) was regular eggs where all attributes
were fixed at the base level (see Table 3-1) in each choice set. The fourth alternative (option D)
is an opt-out option. Since option C and option D are constant in each choice situation, the
22
experimental design is used to generate egg profiles for the first two alternatives by manipulating
attributes and their levels and pairing of them. Given the five attributes and their associated
levels, a large number of different egg alternatives could be constructed if using the full factorial
design2. In order to reduce the number of the choice tasks respondents face while maximizing the
statistical performance of coefficient estimates, this study employed the fractional factorial
design (Louviere et al. 2000; Carlsson and Martinsson 2001).
Because two versions of CE questions were answered by two groups of respondents, this
study sought to create a different experimental design for each version. The difference between
the two designs is that the production method is varied at four levels in the version 2. To
accommodate the objectives, a D-optimal design was used to maximize the determinant of the
information matrix (see Kuhfeld 2010 for detail). Based on a computer-generated search
algorithm in the D-optimal design. The final design consisted of 32 choice sets for each CE
treatment (Louviere et al. 2000; Kuhfeld 2010). In order to minimize respondents’ cognitive
burden, it was decided to present each respondent with only four choice sets. Hence, for each CE
treatment, the resulting 32 choice sets were further grouped into 8 blocks, each with four choice
sets. In this regard, eight blocks fell into version one; the other eight blocks were retained for
version two. Each respondent was randomly allocated to one block in which they were asked to
complete four randomized choice sets to mitigate an ordering effect so that previous CE
questions would not affect consumers’ responses to subsequent responses in a systematic way.
Prior to the choice experiment, an information sheet was presented to respondents that
included detailed descriptions of egg attributes, levels, the nutritional value of a Canadian Grade
A large egg as well as nutrition comparisons between regular and specialty eggs. The product
2 Full factorial design refers to a design that contains all possible combinations of the levels of
the attributes.

23
was a one-dozen carton of Canadian Grade A eggs. Respondents who were randomly assigned to
each version were shown the corresponding information sheet and choice task. Readers can refer
to the information sheet for clarification of egg attributes and levels provided in the Appendix
(Section I).
In each choice set, respondents were asked to choose their preferred carton of eggs as if they
were making an actual egg purchase during a typical shopping trip. The addition of an opt-out
alternative (option D) allowed respondents to choose not to purchase any of the three types of
eggs, which was intended to provide a realistic market setting. The first two alternatives of each
choice set included specialty eggs characterized by a combination of egg attributes that varied in
shell colour, production, feed, pasteurization or price. The third alternative was regular eggs
(white, conventional battery cages, regular feed, not pasteurized at a price of $2.15). Table 3-2
and Table 3-3 provide one example of a choice set from versions 1 and 2 of the survey design.

24
Table 3-1. An example choice question (Version 1)
Option A Option B Option C Option D
Shell colour White Brown White
I wouldn’t buy
any
Production
method
Free run Conventional
Battery cage
Conventional
Battery cage
Feed Regular feed Omega-3
enhanced feed
Regular feed
Pasteurization Not Pasteurized Pasteurized Not Pasteurized
Price $3.43 $2.15 $2.15
I choose Option A Option B Option C Option D
Table 3-2. An example choice question (Version 2)
Option A Option B Option C Option D
Shell colour White Brown White
I wouldn’t buy
any
Production
method
Organic Verified free run Conventional
Battery cage
Feed Regular feed Omega-3
enhanced feed
Regular feed
Pasteurization Not Pasteurized Pasteurized Not Pasteurized
Price $3.43 $5.99 $2.15
I choose Option A Option B Option C Option D
Lastly, in order to better account for and interpret the motivation behind respondents’ choice
decisions, six questions asked how respondents made their decision using a five-point Likert
scale (Question 5, Section I).
25
3.4 Survey Questions about Respondents’ Characteristics
After completing choice tasks, respondents were asked to answer a series of questions related
to purchasing habits, attitudes, risk preferences and socio-demographics. Questions were posed
using a five-point Likert scale. Section II of the Appendix provides a full explanation of all
questions.
Respondents were required to answer six questions with respect to egg purchasing frequency,
location, egg type preferences, packaging sizes and prices. It is speculated that respondents who
consume eggs frequently might value certain egg attributes differently from those who do not.
By examining egg purchasers’ behavior and their shopping habits, factors that affect egg
consumers’ purchasing decisions would be revealed, thereby facilitating egg producers and
marketers to adjust their egg production offerings, pricing strategy and package design to better
accommodate egg consumers’ preference in actual shopping settings.
Respondents were also asked about their general perceptions of food safety, their confidence
in the safety of product categories, perceptions about the responsibility of actors in the food
chain for food safety, reactions to a hypothetical food safety scandal regarding egg production in
Canada, and consumers’ risk and health attitudes. De Jonge et al. (2007) argued that general
confidence in the food safety comprises two separate dimensions: optimism and pessimism
where both optimism and pessimism can coexist among consumers. In order to gain information
on respondents’ general perception of food safety, three questions were adopted from the
literature (De Jonge et al. 2007; De Jonge et al. 2008).
Another set of survey questions dealt with consumers’ risk preferences, perceptions of risk
with respect to eating eggs, health behaviours and attitudes. Weber et al. (2002) pointed out that
respondents’ risk preference was not homogenous but that it varies across all content domains,
such as financial, health/safety, recreational, ethical and social decisions. In other words,

26
people’s risk preference is domain-specific instead of constant. Therefore, it is possible that
consumers’ risk preferences in the domain of health/safety and recreation decisions might affect
their preference for different types of eggs, especially pasteurized eggs that embody safety
attributes. To elicit risk preferences, two separate sets of risk attitude scales in the domain of
health/safety and recreation were extracted from Weber et al. (2002).
One survey question concerning the presence of family members with an illness was included.
In addition, respondents were also asked to indicate the extent to which they agreed with nine
statements relating to health behaviours and attitudes on a 5-point Likert scale. The first three of
nine statements were related to respondents’ health practices; the second three were about health
awareness and perception; the last three statements (extracted from scales developed by Wallston
et al. 1978) were used to measure respondents’ attitudes towards a health locus of control. In this
research, it is expected that there might exist a correlation between consumers’ health attitudes
and their inclination and willingness to pay for health attributes of specialty eggs, such as omega-
3 enhanced eggs and vitamin-enhanced eggs.
Egg knowledge questions arose from consumers’ unfamiliarity with types of eggs in terms of
production method and nutrition information in previous egg studies (Fearne and Lavelle 1996;
Goddard et al. 2007; Bejaei 2009). Respondents were required to rate their knowledge of the
production method and nutritional information of several types of eggs. It is expected that
respondents’ WTP for different types of eggs might be correlated with their reported knowledge
of egg products.
In addition, consumers’ self-reported involvement in food-related activities can act as a proxy
to assess if consumers think their actions will make a difference to food safety and quality issues

27
(Poppe and Kjaernes 2003). Another question assessed respondents’ knowledge about the 2010
egg recall in the US, given that consumer recalls might influence egg-purchasing decisions.
To better meet egg consumers’ demands for specialty eggs, it is important to understand the
potential barriers to purchasing specialty eggs. Thus, two hypothetical questions were
constructed to investigate the likelihood of respondents purchasing specialty eggs if they become
more prevalent in their usual shopping locations or when third-party certification or verification
were introduced. Some consumers might not purchase specialty eggs due to the lack of egg
availability or scepticism towards authenticity of credence attribute quality claims without the
introduction of third-party verification or certification.
The last section of the survey elicited respondents’ socio-demographic information, including
gender, age, household composition, marital status, community, income, education level and
employment status. Socio-demographic information can be used to compare the
representativeness of sample respondents to the Canadian population, allowing researchers to
generalize the results to the whole population. Additionally, socio-demographic information
might contribute to the explanation of preference heterogeneity among egg consumers through
interaction terms with egg attributes or market segmentation.
3.5 Survey Instrument, Composition and Administration
An online survey was used, given comparatively low costs, faster response collection and
convenience for respondents (Bejaei 2009; Gao and Schroeder 2009; Olsen 2009). Furthermore,
online methods have been shown to produce WTP estimates not statistically different from other
collection methods (Olsen 2009). The survey consisted of two main sections. In the first section,
respondents were asked to make repeated choices among alternative types of eggs or none at all.
Each egg profile was described by five attributes. Following the choice section, survey
respondents were asked about socio-economic and demographic characteristics.

28
The survey instrument was reviewed by relevant academic researchers and pre-tested to
ensure clarity and accessibility. The final survey was administered online to participants
recruited from a large opt-in consumer panel by Insightrix Research. The survey was conducted
in April 2011 in all Canadian provinces except Quebec (since this survey was only conducted in
English). Consumers who agreed to participate in this survey were given a unique link that
provided access to the web-based survey. Each respondent was allowed to complete the survey
only once to avoid multiple entries. Eligible respondents were at least 18 years of age and had
personally purchased eggs for their household in the past six months.

29
CHAPTER 4
EMPIRICAL METHODOLOGY
4.1 Introduction
This chapter focuses on the specification of discrete choice models and related hypothesis
tests with regard to the research questions. It first discusses the choice modelling framework
followed by alternative model specifications based on different preference assumptions and
hypothesis testing, including the multinomial logit (MNL) model and mixed logit (ML) model.
The analysis of these models addresses the research questions laid out in the Chapter 1.
Empirical results are presented in Chapter 6.
4.2 Choice Modelling Framework
Random utility theory (RUT) underlies the consumers’ choice decision and judgement.
Consequently, the choice behaviour can be modelled using a random utility model framework.
As shown by Adamowicz et al. (1998) and Train (2003), Unit represents the utility an nth
individual obtains from ith alternative within a choice task t. Based on RUT, the overall utility
Unit is assumed to consists of two components: the observable systematic portion Vnit (also called
an indirect utility function) and the unobservable random (stochastic) element εnit. Therefore, the
individual’s true utility remains unknown to the researcher: the choice behaviour can only be
predicted in a probabilistic manner. Furthermore, RUT postulates that an individual n acts
rationally and chooses the alternative i that yields the highest utility subject to the choice set
given. Thus, the probability that an individual n chooses the alternative i is the probability that
the utility provided by that alternative is the highest among all possible options from a choice
task t, which is given by:
| Pr( ) Pr( ; , )tnit C nit njt nit nit njt njt tP U U V V j i j C (4.1)

30
In this application, in each CE question, respondents were asked to choose among three
alternative types of eggs or no eggs. Vnit is determined by the egg attributes for the ith
alternative. Ct refers to a choice task t that contains four possible options (Ct =Option A, Option
B, Option C, Option D). In the choice experiment, each respondent made four repeated choices,
that is t=4. Consequently, panel data are modelled in this study (Train 2003; Greene 2003).
Assuming Vnit is linear in parameters, the generic functional form of the systematic portion of
the utility function for an individual n choosing the alternative i can be expressed as:
'
0 * _ * _nit r nitV asc n asc reg x (4.2)
Where asc_n and asc_reg are both alternative-specific constants; α0 and αr refer to
correspondent alternative specific intercepts that capture an nth individual’s intrinsic preference
for the alternative i. nitx is a vector of exogenous variables associated with egg attributes and
respondents’ characteristics; ' refers to a vector of parameters that represent the effect of
observed variables on an individual’s utility. Note that the specific functional form described by
Equation (4.2) might vary by model, depending on preference assumptions and research
hypotheses. Table 4-1 shows the definition and coding of the main variables used in the discrete
choice models.

31
Table 4-1. Interpretation and coding of main variables used in the choice models
Variables Abbreviation Description
Asc_none Asc_n =1 if the no purchase alternative is chosen, otherwise 0.
Asc_regular Asc_reg =1 if the regular egg alternative is chosen, otherwise 0.
Price Price The price of a one-dozen carton of Canadian Grade A large eggs,
($2.15, $3.43, $4.71 and $5.99).
Brown Brown =1 if brown shell colour, 0 if white shell colour.
Free run Fr =1 if the egg product comes from hens that are able to move
about the floor of the barn, 0 if the egg product is battery caged.
Organic Org =1 if the egg product is raised by certified organic production
methods, 0 if the egg product is battery caged.
Verified free
run
Vfr =1 if the egg product comes from hens that are able to move
about the floor of the barn and a third party auditor verifies the
free run process, 0 if the egg product is battery caged.
Omega-3
enhanced
Omg-3 =1 if the egg product comes from hens that are fed with a diet
enriched with omega-3 polyunsaturated fatty acids, 0 if the egg
product comes from hens that are fed with regular feed.
Vitamin-
enhanced
Vitam =1 if the egg product comes from hens that are fed with a diet
enriched with vitamin nutrients, 0 if the egg product comes from
hens that are fed with regular feed.
Pasteurized Pasteu =1 if the egg product is in-shell pasteurized, 0 if not.
As shown in Table 4-1, asc_n equals 1 if respondents choose option D (the non-purchase
option), 0 otherwise; similarly, asc_reg takes on a value of 1 if respondents choose the constant
option C (white regular eggs), 0 otherwise. Each choice set contains four generic options with
only two dummy-coded alternative-specific constants, leaving the choice of either option A or B
as reference alternatives relative to the two alternative-specific constants. Table 4-1 also
demonstrates how five attributes with varying levels are coded in the choice modelling. For each
attribute variable (except for price) with n levels, n-1 dummy coded variables are created relative
to the nth omitted variable. For example, with regards to the production method attribute, product
method has three attribute levels in version 1 and four attribute levels in version 2. Thus, the

32
production method attribute is specified by two dummy variables for the version 1 model: fr
(free run) and org (organic), whereas it is represented by three dummy variables for version 2
model: fr (free run), org (organic) and vfr (verified free run). The production method dummy
variables take on a value of 1 if the type of eggs is produced under corresponding production
practice, 0 otherwise, with conventional battery cages being the base level. Price is a continuous
variable that reflects the impact of price change on consumers’ utility and resulting probability of
buying egg products. Its parameter estimate is expected to be negative.
The derivation of different discrete choice models depends on the different assumptions made
about the distribution of the random term. In the following subsections, several alternative choice
models that make different assumptions about the form of Equation (4.2) or the distribution of ε
nit in Equation (4.1) are discussed.
4.3 Alternative Model Specifications
Various choice models that allow for the assumptions underlying consumers’ preferences are
used to address different research questions proposed in Chapter 1. The model estimation begins
with a simple multinomial logit model that assumes consumers are homogeneous in terms of
taste with no interaction effects among attributes. Then, two-way interaction terms between
attributes are incorporated into the base MNL model to account for the potential correlation
between different types of egg attributes. Lastly, the assumption of preference homogeneity is
relaxed to allow the taste parameters to vary among the sample though the application of two
alternative choice models. These two models make up the extended MNL model and the ML
model (also called the Random Parameter Model by some researchers). Figure 4-1 represents
how the models relate to one another and the research questions each model addresses.

33
Figure 4-1. Flowchart of alternative discrete choice models
Multinomial Logit Model
The multinomial logit model is widely regarded as the appropriate starting point for discrete
choice analysis. If the error term is independently and identically distributed (IID) across
individuals, and alternatives and choice sets have the type I extreme value distribution, the
resulting probability of an individual n choosing alternative i from the choice set t can be
expressed by multinomial logit model as (McFadden 1974; Louviere et al. 2000):
'
0
'
0
exp * _ * _exp( )
exp( ) exp * _ * _t t
r nitnitnit
nit r niti C i C
asc n asc reg xVP
V asc n asc reg x
(4.3)
The base MNL model 1) Test for data pooling (H0:
Taste parameters are equivalent)
2) Test for externality effect (H0:
MWTPv1
free run=MWTPv2
free run)
Preference homogeneity
MNL model with
two-way interaction
terms
To examine the potential
correlation between different
types of egg attributes (H0: all
interaction coefficients are
jointly zero)
Extended MNL
model
Capture observed heterogeneity
across the sample (H0: all
covariates coefficients are jointly
zero)
Preference heterogeneity
Mixed logit model
(ML model)
Taste coefficients randomly vary
among respondents according to
a continuous distribution (H0:
taste coefficients are
homogeneous)

34
where all the variables are defined as before (see Table 4-1). µ is a scale parameter and
inversely related to the variance of the error term. For the MNL model, the scale parameter is
typically assumed to be one, as it is unidentifiable within any given data set. However, one can
estimate a relative scale parameter across data sets (Hensher and Bradley 1993; Swait and
Louviere 1993; Adamowiciz et al. 1994; Adamowiciz et al. 1997; Hensher et al. 1999).
4.3.1.1 Hypothesis testing
One information treatment was conducted, resulting in two versions of data sets. Therefore,
the indirect utility function that includes only the main effect variables in the MNL model for
two versions is specified respectively as:
1
1 0 1 2
3 4 5 6 7
( * _ * _
)
v
nit v nit r nit nit nit
nit nit nit nit nit
V asc n asc reg price brown
fr org omg vitam pasteu
Version1 (4.4)
2
2 0 1 2
3 4 5 6 7 8
( * _ * _
)
v
nit v nit r nit nit nit
nit nit nit nit nit nit
V asc n asc reg price brown
fr vfr org omg vitam pasteu
Version2 (4.5)
This model is referred to as the base MNL model and incorporates explanatory variables with
only main effects in the utility function. The two versions of the base MNL models have
different scale parameters (µv1 and µv2). Identification of the scale parameter is important in
determining whether differences in parameter estimates across data sets are unconfounded with
the differences in scale. The test of data pooling is motivated by the fact that data fusion provides
more information for model estimation. Following Hensher and Bradley (1993) and Louviere et
al. (2000), an artificial nested logit model is used in this application to identify the relative scale
parameter between two versions of CE treatments. In the nested logit model, each version of the
data set represents a branch of the artificially constructed tree. The inclusive value estimate
represents the relative scale parameter. To test for equal taste by controlling for difference in

35
scale, the scale of the first data set is fixed to 1 and the scale for the second data set is estimated
(i.e. the relative scale factor of µv2 relative to µv1 while assuming βv1=βv2 is estimated).
Since the respondents are randomly assigned to each version and complete choice tasks in a
similar decision-making process, it is expected that the estimated coefficients for the main
variables between two subsamples are not significantly different if there is no statistical
difference in sample characteristics between the two subsamples. If the null hypothesis of taste
parameter equivalence cannot be rejected, the pooled data sets will be modelled in the relevant
discrete choices. The model specification for the base MNL model using pooled data is the same
as that for version 2 (Equation 4.5).
To test whether the introduction of the verified free run attribute has any adverse impact on
consumers’ preference for the free run attribute, marginal WTP for the free run attribute across
the two versions is compared. If the null hypothesis is not rejected, then it indicates that the
introduction of the verified free run attribute has no significant effect on consumers’ preferences
for the free run attribute between the two data sources.
4.3.1.2 MNL model including interaction terms between attributes
The valuation of some attributes might be closely related to the presence of others. Thus, two-
way interaction effects between the main attributes are taken into account in the model
specification as follows:
0 1 2 3
4 5 6 7 8 ,
* _ * _
*
nit nit r nit nit nit nit
nit nit nit nit nit j nkt njt j k
j
V asc n asc reg price brown fr
org vfr omg vitam pasteu x x
(4.6)
where ,*nkt njt j kx x denotes two-way interaction variables that enter into the model in a
multiplicative way by combining two attribute variables from different types of egg attributes.
The remaining variables are identically defined as those in the main effect model. If βj is

36
identified to be significantly different from zero, it indicates that consumers’ preferences for the
relevant attribute level depends on the presence of another attribute level. A likelihood ratio (LR)
test is used to determine whether the interaction MNL model significantly improves the
goodness of fit.
4.3.1.3 Extended MNL model with respondents’ characteristics
To examine individual heterogeneity in preference for egg attributes in the MNL model, an
extended MNL model was specified that incorporates explanatory variables regarding socio-
demographic and attitudinal characteristics of the respondents and captures systematic
heterogeneity across sample groups. Since respondents’ characteristics are invariant across the
choice alternatives, these variables enter the utility model by interacting with attribute variables.
Thus, the indirect utility function in the extended MNL model for the pooled data sets is shown
as:
0 1 2 3
4 5 6 7 8
* _ * _
*
nit nit r nit nit nit nit
nit nit nit nit nit j n nit
j
V asc n asc reg price brown fr
org vfr omg vitam pasteu z x
(4.7)
where zn represents the socio-demographic and attitudinal variables (e.g. income and health
attitude), which are interacted with different attributes of egg alternatives, xnit; βj represents the
associated parameters of the interaction variables, which represent the systematic heterogeneity
across the sample. While the extended MNL model is better at interpreting the sources of
preference heterogeneity, it is subject to Independently and Identically Distributed (IID) errors.
The IID assumption implies Independence of Irrelevant Alternatives (IIA), such that the ratio of
probabilities of choosing one alternative over another is unaffected by the presence or absence of
any additional alternatives in the choice set, which is unrealistic in the egg choice task. For
instance, the addition of the verified free run egg choice might affect the probability of a

37
respondent with concern for animal welfare choosing free run eggs over omega-3 enhanced eggs,
given that the verified free attribute is a proxy for animal welfare.
In addition, the MNL model assumes that egg consumers share homogeneous preferences for
egg attributes, suggesting that all the estimated coefficients on the included variables in the
utility function are the same for all consumers. Such an assumption might be unrealistic, as
recent egg research has identified that Canadian egg consumers possess heterogeneous
preferences (Goddard et al. 2007; Romanowska 2009). Furthermore, although the extended MNL
model to some extent contributes to the interpretation of preference variability by explicitly
incorporating covariates into the utility model, it still cannot fully capture preference
heterogeneity (e.g. unobserved taste heterogeneity). Consequently, the mixed logit (ML) model
is employed to account for preference heterogeneity among respondents.
Mixed Logit Model
The ML model allows for random parameter variation over the population, and is the most
flexible discrete choice model to represent a random utility model (McFadden and Train 2000;
Train 2003). The ML model is free of the IIA property implied by the IID assumption and allows
correlation in the unobserved utility in the choice experiment (Revelt and Train 1998; Train
1998; Train 2003). With this model, the heterogeneity in consumer preferences for egg attributes
can be estimated explicitly. In this study, it is postulated that the taste coefficients vary among
respondents, but are constant across four choice sets for each respondent. This reflects an
underlying assumption of stable preference structures for all respondents (Train 2003).
The utility of respondent n choosing alternative i in the choice set t could be represented as:
nit n nit nitU x (4.8)

38
where nitx is a vector of observed variables. βn is a vector of individual-specific coefficients
that are unobserved and randomly distributed with density ƒ(βn | θ), where θ refers to the true
parameters of the taste distribution (Revelt and Train 1998; Train 1998; Train 2003). ɛnit is a
random term that is an IID type I extreme value, independent of βn and nitx . βn can be
decomposed into a mean β and a standard deviation parameter ηn that measures unobserved taste
to reveal the existence of preference heterogeneity. Given a specific distribution for βn (e.g.
normal, log-normal, triangular, or uniform), the focus of the ML model analysis is on the
estimation of both a mean and a standard deviation parameter.
As βn is unknown to the researcher, thus the choice probability of a respondent n choosing
alternative i in the ML model is the integral of the standard logit probability over all possible
values of βn, which can be expressed as:
( ) ( ( |ni ni nP L f d (4.9)
where (niL represents the logit probability, which is conditional on β. In this application, it
is assumed that all non-price attribute parameters are randomly distributed. By fixing the price
coefficient, the derived WTP estimates will have an identical distribution to the attribute
parameter. From a technical perspective, the MNL model is a degenerated version of the ML
model where ƒ(βn | θ)=1 and βn=β.
Compared to the MNL model, the probability expression of the ML model does not take a
closed form, so the Simulated Maximum Likelihood Estimation (SMLE) is applied for
estimation (Train 2003; Hensher et al. 2005). Readers are advised to refer to Louviere et al.
(2000), Train (2003) or Hensher et al. (2005) for details about the simulation procedure of the
ML model.

39
Willingness to Pay
Estimated parameters on attributes from the discrete choice model provide little interpretation
in terms of preference strength. The willingness to pay (WTP) of an individual is thus more
appropriate in comparing the intensity of consumers’ preference for individual egg attributes by
converting attribute coefficients into the same scale of measurement. The marginal WTP is
generally defined as the net income change that equals a change in quality or quantity of a
product. Thus, the economic interpretation of the marginal WTP from the utility function is
straightforward. The marginal WTP is a marginal price change associated with a marginal
change in a specific attribute while keeping the utility constant. As the attribute variables are
dummy coded in this study, the marginal WTP can be calculated as the negative ratio of the
estimated parameter on the given attribute to the price parameter, which is represented as:
ii
price
WTP
(4.10)
where βi represents the individual coefficient on the attribute variable ix (excluding the
variable price); βprice is the parameter on the variable of price. WTPi represents the premium that
respondents are willing to pay for alternative egg attribute level ix relative to the base level. In
this application, standard errors of the WTP estimates are calculated by using the Delta method
(Greene 2003).
In addition, a Wald test is used to test the significance of the difference in WTP for the free
run attribute between two versions, which is expressed as:
1*1 2
1*
( )fr version fr frv v
fr fr
price version price price
WTP WTP
(4.11)

40
If the coefficient of marginal WTP difference variable is not significantly different from 0, it
indicates that respondents from both versions assess the free run attribute in a similar manner.
4.4 Conclusion
The CE approach allows the estimation of the value of egg attributes. Under the conceptual
framework of RUT, a series of discrete choice models are developed to address the major
research objectives. To achieve the research objectives, the MNL model and the ML model are
elaborated on by progressively relaxing key assumptions. The analysis stays focused on the
advantages and limitations of each model while taking advantage of their merits to investigate
egg consumers’ preference (e.g. preference homogeneity versus preference heterogeneity).
Model results and analysis with regard to these types of choice models are presented in Chapter
6. The next chapter presents a descriptive analysis of the remaining survey data.

41
CHAPTER 5
DESCRIPTIVE ANALYSIS
5.1 Introduction
This chapter presents a descriptive analysis of respondents beginning with socio-demographic
traits of the sample as compared with the 2006 Canadian census. Second, survey results
pertaining to different aspects of respondents’ characteristics and attitudes towards egg
purchasing are examined. Last, a summary of the characterization of respondents is provided in
the conclusion section.
5.2 Demographic Characteristics of the Respondents
In total, 647 subjects participated in the survey, of which 321 completed the first version and
326 completed the second version. Socio-demographic characteristics of respondents and the
2006 Canadian census are presented in Table 5-1. As expected, the null hypothesis of equality of
means across treatments cannot be rejected for each demographic characteristic reported.
Generally speaking, this sample is representative of the Canadian population (excluding Quebec)
in household size and marital status. The age of the respondents is slightly higher than that of the
Canadian population, which is expected in that individuals had to be at least 18 years old to
participate in the survey. The number of minors in the household and household income are
slightly underrepresented in the sample relative to the Canadian population. More females
responded than males, likely because women tend to be primary household shoppers. In addition,
the sample population is slightly more educated than the Canadian population, which is a typical
bias in internet-based samples. According to the 2009 Canadian Internet Use Survey, 89% of
Internet users have achieved at least some post-secondary education (Statistics Canada 2009).
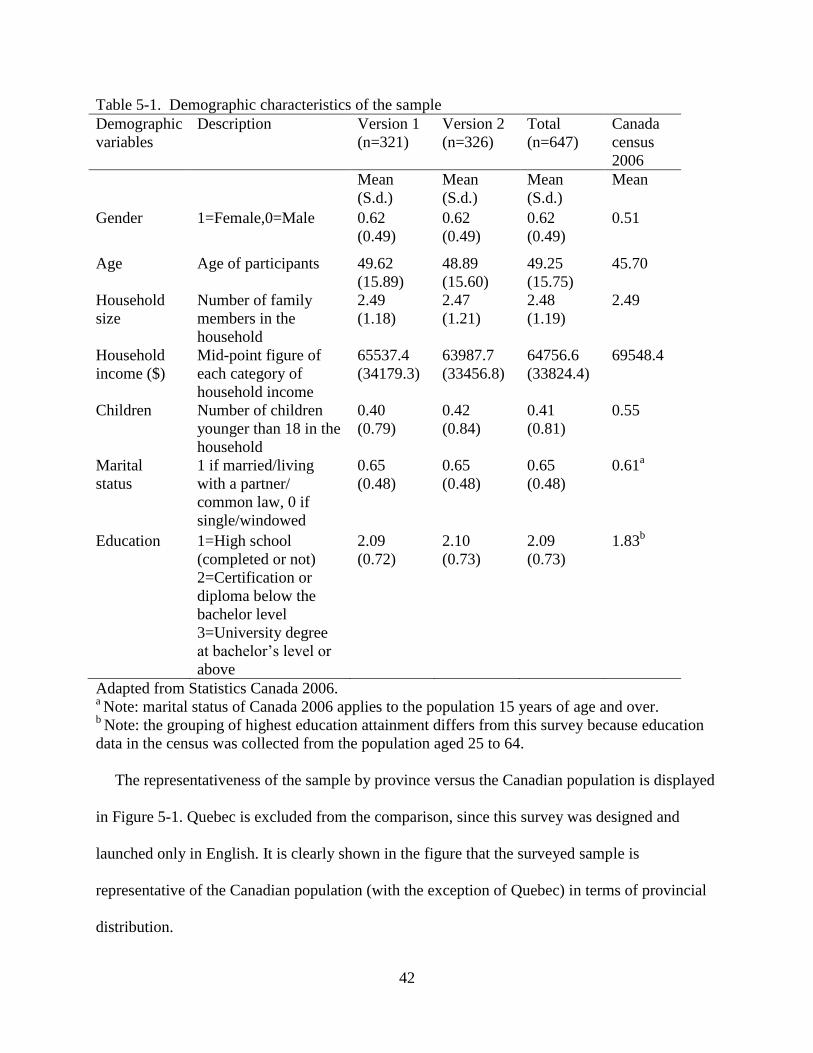
42
Table 5-1. Demographic characteristics of the sample
Demographic
variables
Description Version 1
(n=321)
Version 2
(n=326)
Total
(n=647)
Canada
census
2006
Mean
(S.d.)
Mean
(S.d.)
Mean
(S.d.)
Mean
Gender 1=Female,0=Male 0.62
(0.49)
0.62
(0.49)
0.62
(0.49)
0.51
Age Age of participants 49.62
(15.89)
48.89
(15.60)
49.25
(15.75)
45.70
Household
size
Number of family
members in the
household
2.49
(1.18)
2.47
(1.21)
2.48
(1.19)
2.49
Household
income ($)
Mid-point figure of
each category of
household income
65537.4
(34179.3)
63987.7
(33456.8)
64756.6
(33824.4)
69548.4
Children Number of children
younger than 18 in the
household
0.40
(0.79)
0.42
(0.84)
0.41
(0.81)
0.55
Marital
status
1 if married/living
with a partner/
common law, 0 if
single/windowed
0.65
(0.48)
0.65
(0.48)
0.65
(0.48)
0.61a
Education 1=High school
(completed or not)
2=Certification or
diploma below the
bachelor level
3=University degree
at bachelor’s level or
above
2.09
(0.72)
2.10
(0.73)
2.09
(0.73)
1.83b
Adapted from Statistics Canada 2006. a Note: marital status of Canada 2006 applies to the population 15 years of age and over.
b Note: the grouping of highest education attainment differs from this survey because education
data in the census was collected from the population aged 25 to 64.
The representativeness of the sample by province versus the Canadian population is displayed
in Figure 5-1. Quebec is excluded from the comparison, since this survey was designed and
launched only in English. It is clearly shown in the figure that the surveyed sample is
representative of the Canadian population (with the exception of Quebec) in terms of provincial
distribution.

43
Figure 5-1. Provincial distribution of the survey samples compared to Canadian population
(excluding Quebec) (source: Statistics Canada 2006)
5.3 Egg Shopping Habits
Approximately 40% of respondents reported that they usually purchased eggs at least once per
week in the past six months (Figure 5-2). This result is not surprising in that a screener question
is included to exclude those who had not purchased eggs in the past six months. A majority of
respondents bought eggs by the dozen at the point of purchase (Figure 5-3).
9%
50%
9%
14% 17%
10%
51%
9%
14% 17%
0%
10%
20%
30%
40%
50%
60%
Maritimes ON MB/SK AB BC
Sample Canadian population

44
Figure 5-2. Frequency of purchasing eggs in the past six months
Figure 5-3. Package size of eggs most frequently purchased by respondents
With regard to purchasing location, supermarkets/grocery stores remain the regular shopping
place for approximately 86% of respondents, with farmers’ markets being regularly chosen by
only 4% of respondents (Figure 5-4).
1%
12%
46%
36%
4%
0%5%
10%15%20%25%30%35%40%45%50%
Less often thanonce every six
months
Less than oncea month butmore than
once every sixmonths
About 1-2times per
month
About once perweek
More thanonce per week
% o
f R
esp
on
de
nts
5%
78%
13% 3% 1% 6 egg carton (half a dozen)
12 egg carton (1 dozen)
18 egg carton (1.5 dozen)
Egg tray that holds about 20to 30 eggs
Other
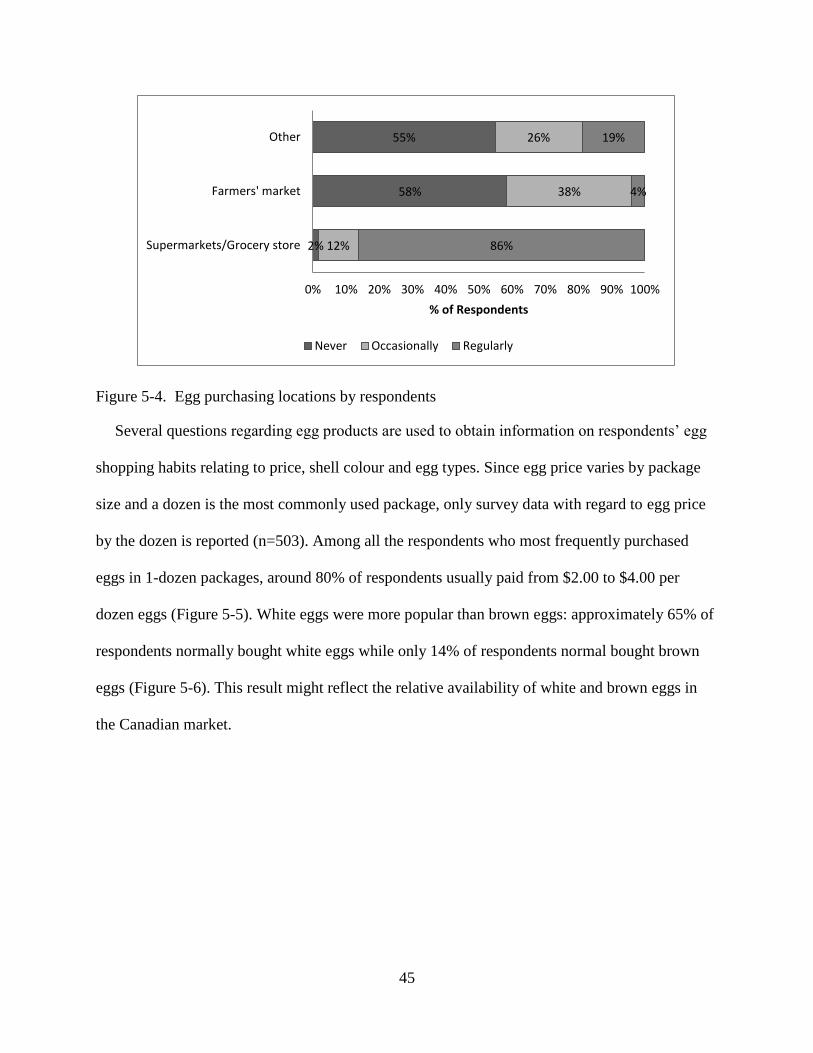
45
Figure 5-4. Egg purchasing locations by respondents
Several questions regarding egg products are used to obtain information on respondents’ egg
shopping habits relating to price, shell colour and egg types. Since egg price varies by package
size and a dozen is the most commonly used package, only survey data with regard to egg price
by the dozen is reported (n=503). Among all the respondents who most frequently purchased
eggs in 1-dozen packages, around 80% of respondents usually paid from $2.00 to $4.00 per
dozen eggs (Figure 5-5). White eggs were more popular than brown eggs: approximately 65% of
respondents normally bought white eggs while only 14% of respondents normal bought brown
eggs (Figure 5-6). This result might reflect the relative availability of white and brown eggs in
the Canadian market.
2%
58%
55%
12%
38%
26%
86%
4%
19%
0% 10% 20% 30% 40% 50% 60% 70% 80% 90% 100%
Supermarkets/Grocery store
Farmers' market
Other
% of Respondents
Never Occasionally Regularly
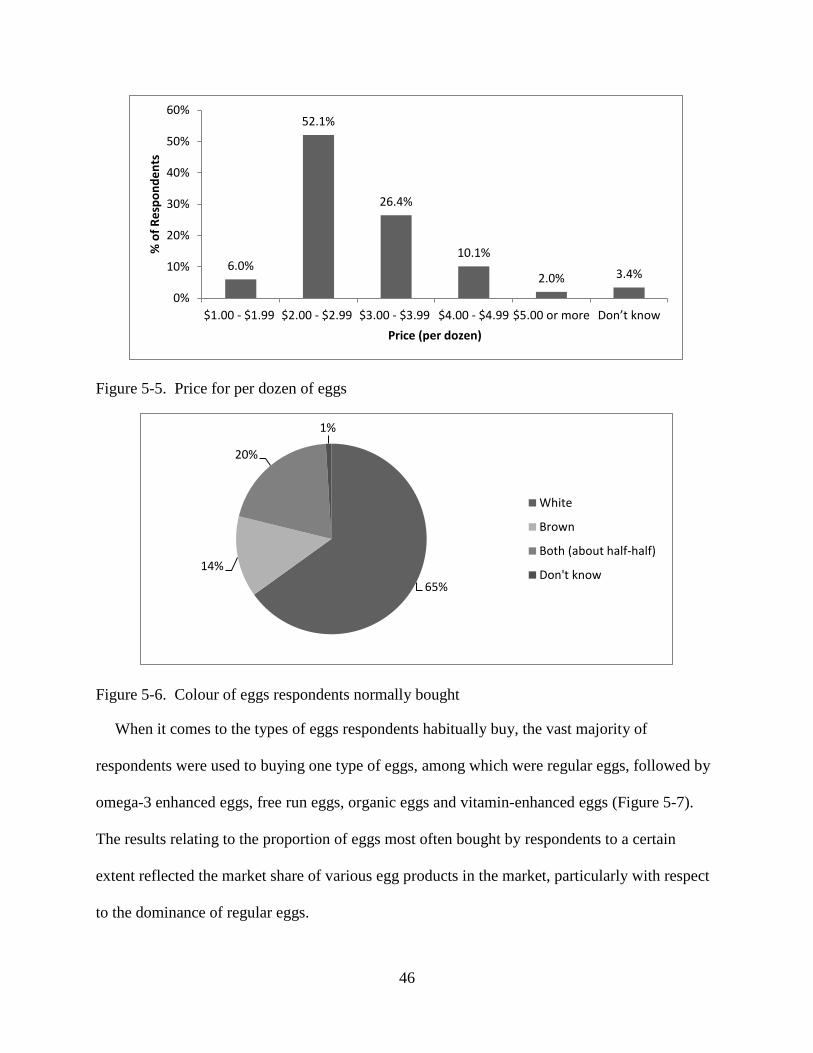
46
Figure 5-5. Price for per dozen of eggs
Figure 5-6. Colour of eggs respondents normally bought
When it comes to the types of eggs respondents habitually buy, the vast majority of
respondents were used to buying one type of eggs, among which were regular eggs, followed by
omega-3 enhanced eggs, free run eggs, organic eggs and vitamin-enhanced eggs (Figure 5-7).
The results relating to the proportion of eggs most often bought by respondents to a certain
extent reflected the market share of various egg products in the market, particularly with respect
to the dominance of regular eggs.
6.0%
52.1%
26.4%
10.1%
2.0% 3.4%
0%
10%
20%
30%
40%
50%
60%
$1.00 - $1.99 $2.00 - $2.99 $3.00 - $3.99 $4.00 - $4.99 $5.00 or more Don’t know
% o
f R
esp
on
de
nts
Price (per dozen)
65%
14%
20%
1%
White
Brown
Both (about half-half)
Don't know
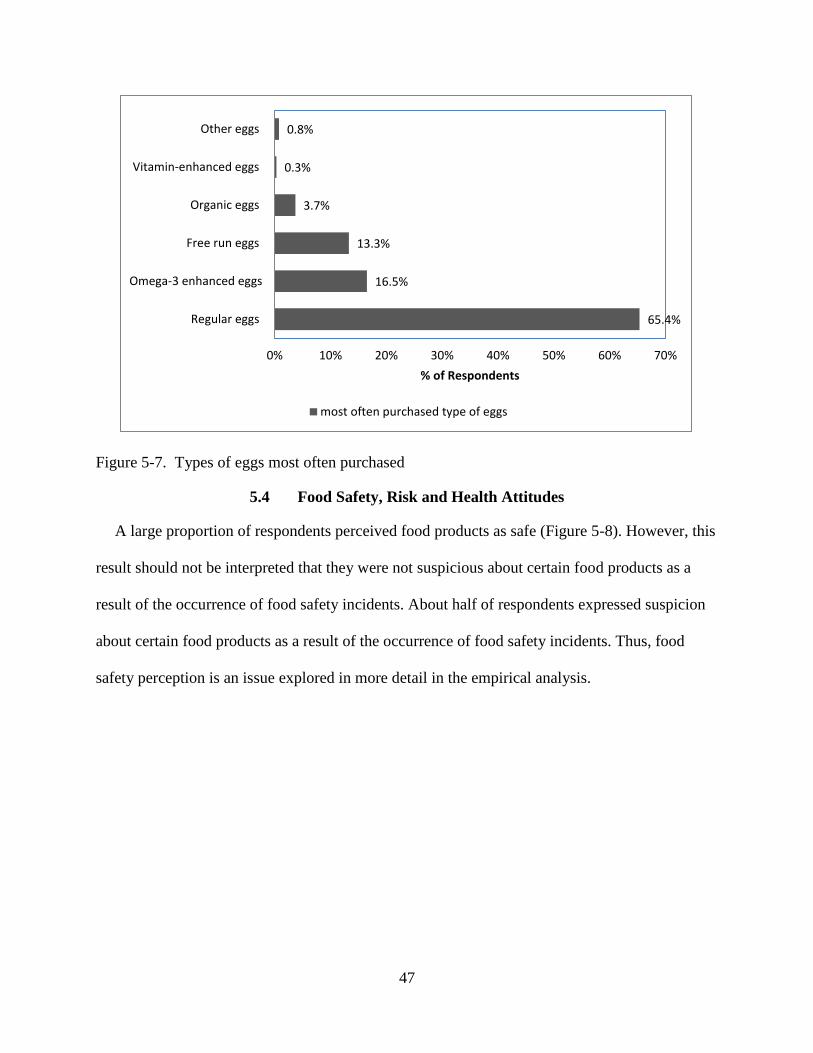
47
Figure 5-7. Types of eggs most often purchased
5.4 Food Safety, Risk and Health Attitudes
A large proportion of respondents perceived food products as safe (Figure 5-8). However, this
result should not be interpreted that they were not suspicious about certain food products as a
result of the occurrence of food safety incidents. About half of respondents expressed suspicion
about certain food products as a result of the occurrence of food safety incidents. Thus, food
safety perception is an issue explored in more detail in the empirical analysis.
65.4%
16.5%
13.3%
3.7%
0.3%
0.8%
0% 10% 20% 30% 40% 50% 60% 70%
Regular eggs
Omega-3 enhanced eggs
Free run eggs
Organic eggs
Vitamin-enhanced eggs
Other eggs
% of Respondents
most often purchased type of eggs
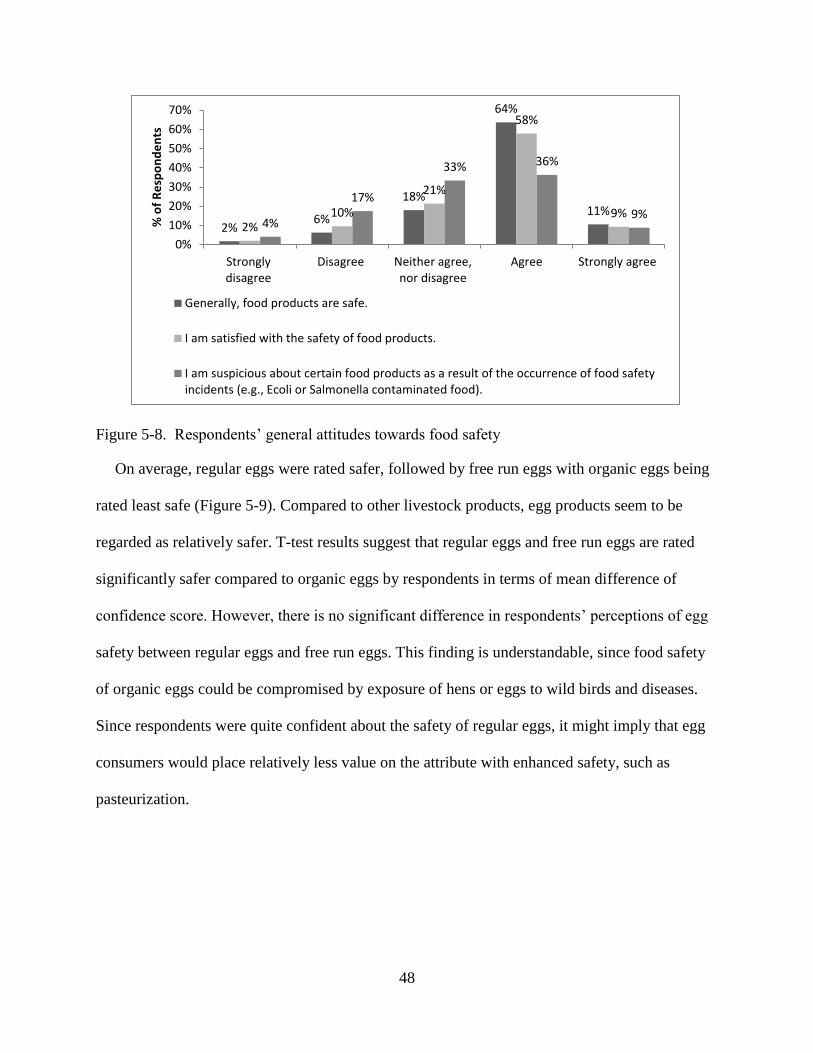
48
Figure 5-8. Respondents’ general attitudes towards food safety
On average, regular eggs were rated safer, followed by free run eggs with organic eggs being
rated least safe (Figure 5-9). Compared to other livestock products, egg products seem to be
regarded as relatively safer. T-test results suggest that regular eggs and free run eggs are rated
significantly safer compared to organic eggs by respondents in terms of mean difference of
confidence score. However, there is no significant difference in respondents’ perceptions of egg
safety between regular eggs and free run eggs. This finding is understandable, since food safety
of organic eggs could be compromised by exposure of hens or eggs to wild birds and diseases.
Since respondents were quite confident about the safety of regular eggs, it might imply that egg
consumers would place relatively less value on the attribute with enhanced safety, such as
pasteurization.
2% 6%
18%
64%
11% 2%
10%
21%
58%
9% 4%
17%
33% 36%
9%
0%
10%
20%
30%
40%
50%
60%
70%
Stronglydisagree
Disagree Neither agree,nor disagree
Agree Strongly agree
% o
f R
esp
on
de
nts
Generally, food products are safe.
I am satisfied with the safety of food products.
I am suspicious about certain food products as a result of the occurrence of food safetyincidents (e.g., Ecoli or Salmonella contaminated food).
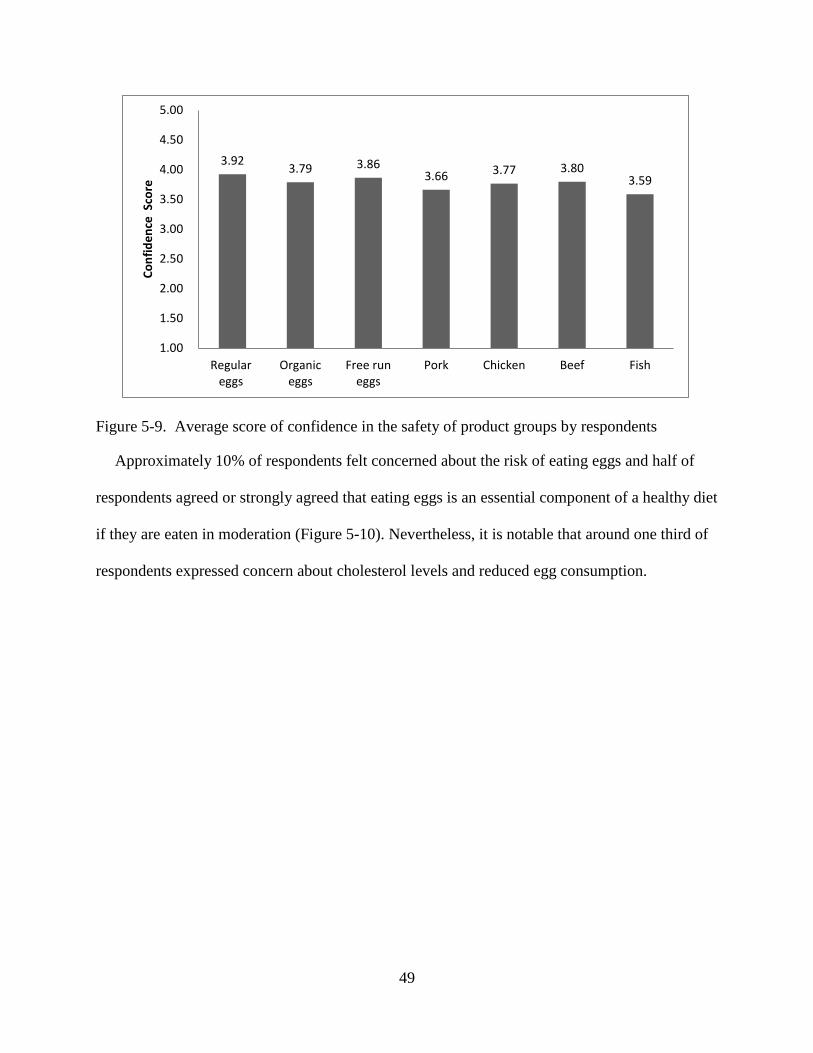
49
Figure 5-9. Average score of confidence in the safety of product groups by respondents
Approximately 10% of respondents felt concerned about the risk of eating eggs and half of
respondents agreed or strongly agreed that eating eggs is an essential component of a healthy diet
if they are eaten in moderation (Figure 5-10). Nevertheless, it is notable that around one third of
respondents expressed concern about cholesterol levels and reduced egg consumption.
3.92 3.79 3.86
3.66 3.77 3.80 3.59
1.00
1.50
2.00
2.50
3.00
3.50
4.00
4.50
5.00
Regulareggs
Organiceggs
Free runeggs
Pork Chicken Beef Fish
Co
nfi
de
nce
Sco
re
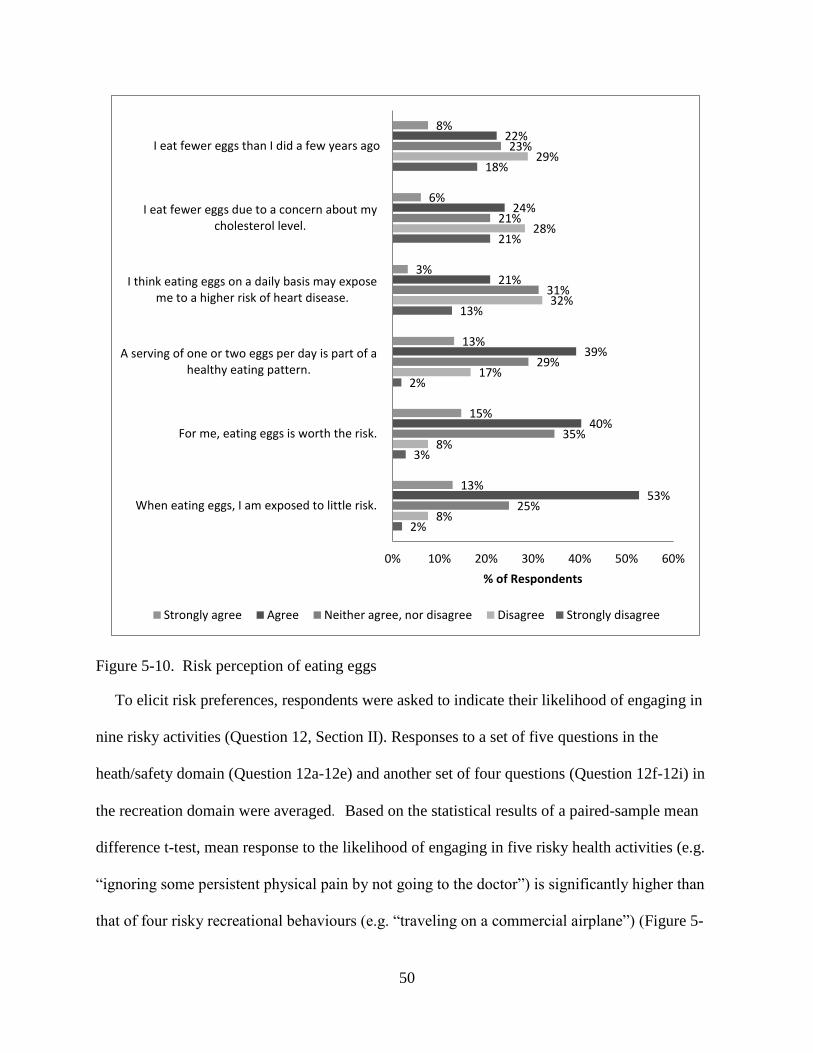
50
Figure 5-10. Risk perception of eating eggs
To elicit risk preferences, respondents were asked to indicate their likelihood of engaging in
nine risky activities (Question 12, Section II). Responses to a set of five questions in the
heath/safety domain (Question 12a-12e) and another set of four questions (Question 12f-12i) in
the recreation domain were averaged. Based on the statistical results of a paired-sample mean
difference t-test, mean response to the likelihood of engaging in five risky health activities (e.g.
“ignoring some persistent physical pain by not going to the doctor”) is significantly higher than
that of four risky recreational behaviours (e.g. “traveling on a commercial airplane”) (Figure 5-
2%
3%
2%
13%
21%
18%
8%
8%
17%
32%
28%
29%
25%
35%
29%
31%
21%
23%
53%
40%
39%
21%
24%
22%
13%
15%
13%
3%
6%
8%
0% 10% 20% 30% 40% 50% 60%
When eating eggs, I am exposed to little risk.
For me, eating eggs is worth the risk.
A serving of one or two eggs per day is part of ahealthy eating pattern.
I think eating eggs on a daily basis may exposeme to a higher risk of heart disease.
I eat fewer eggs due to a concern about mycholesterol level.
I eat fewer eggs than I did a few years ago
% of Respondents
Strongly agree Agree Neither agree, nor disagree Disagree Strongly disagree
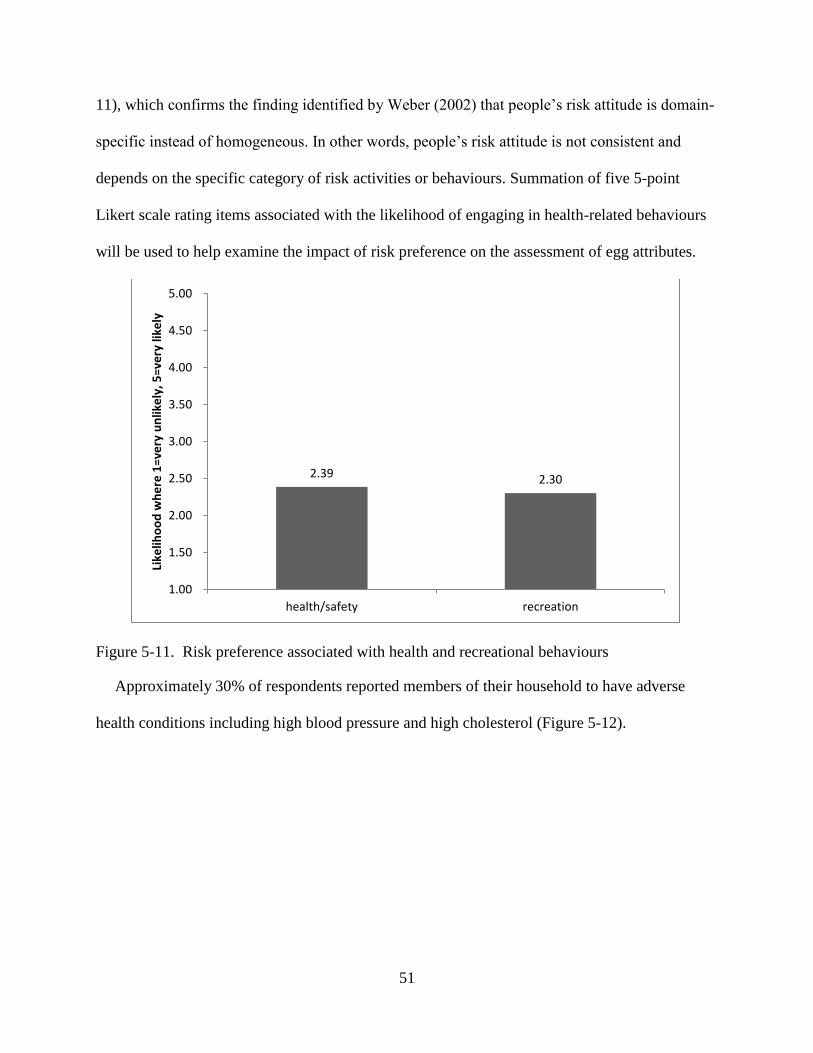
51
11), which confirms the finding identified by Weber (2002) that people’s risk attitude is domain-
specific instead of homogeneous. In other words, people’s risk attitude is not consistent and
depends on the specific category of risk activities or behaviours. Summation of five 5-point
Likert scale rating items associated with the likelihood of engaging in health-related behaviours
will be used to help examine the impact of risk preference on the assessment of egg attributes.
Figure 5-11. Risk preference associated with health and recreational behaviours
Approximately 30% of respondents reported members of their household to have adverse
health conditions including high blood pressure and high cholesterol (Figure 5-12).
2.39 2.30
1.00
1.50
2.00
2.50
3.00
3.50
4.00
4.50
5.00
health/safety recreation
Like
liho
od
wh
ere
1=v
ery
un
like
ly, 5
=ve
ry li
kely
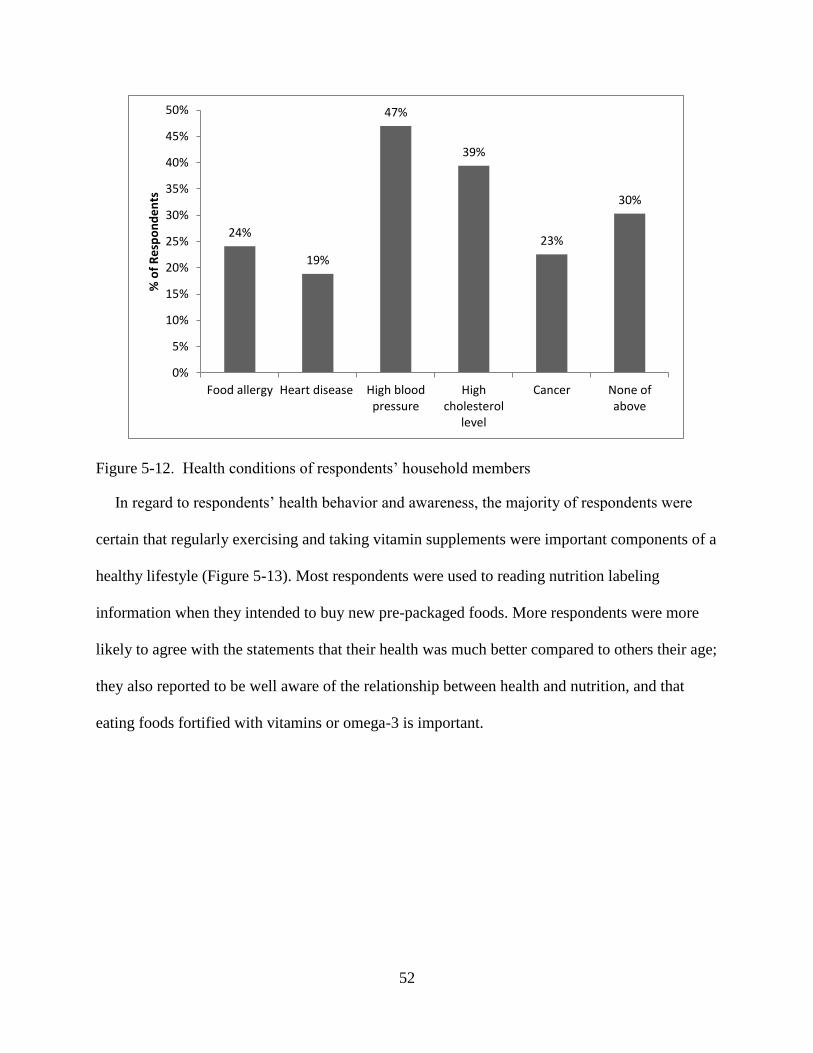
52
Figure 5-12. Health conditions of respondents’ household members
In regard to respondents’ health behavior and awareness, the majority of respondents were
certain that regularly exercising and taking vitamin supplements were important components of a
healthy lifestyle (Figure 5-13). Most respondents were used to reading nutrition labeling
information when they intended to buy new pre-packaged foods. More respondents were more
likely to agree with the statements that their health was much better compared to others their age;
they also reported to be well aware of the relationship between health and nutrition, and that
eating foods fortified with vitamins or omega-3 is important.
24%
19%
47%
39%
23%
30%
0%
5%
10%
15%
20%
25%
30%
35%
40%
45%
50%
Food allergy Heart disease High bloodpressure
Highcholesterol
level
Cancer None ofabove
% o
f R
esp
on
de
nts
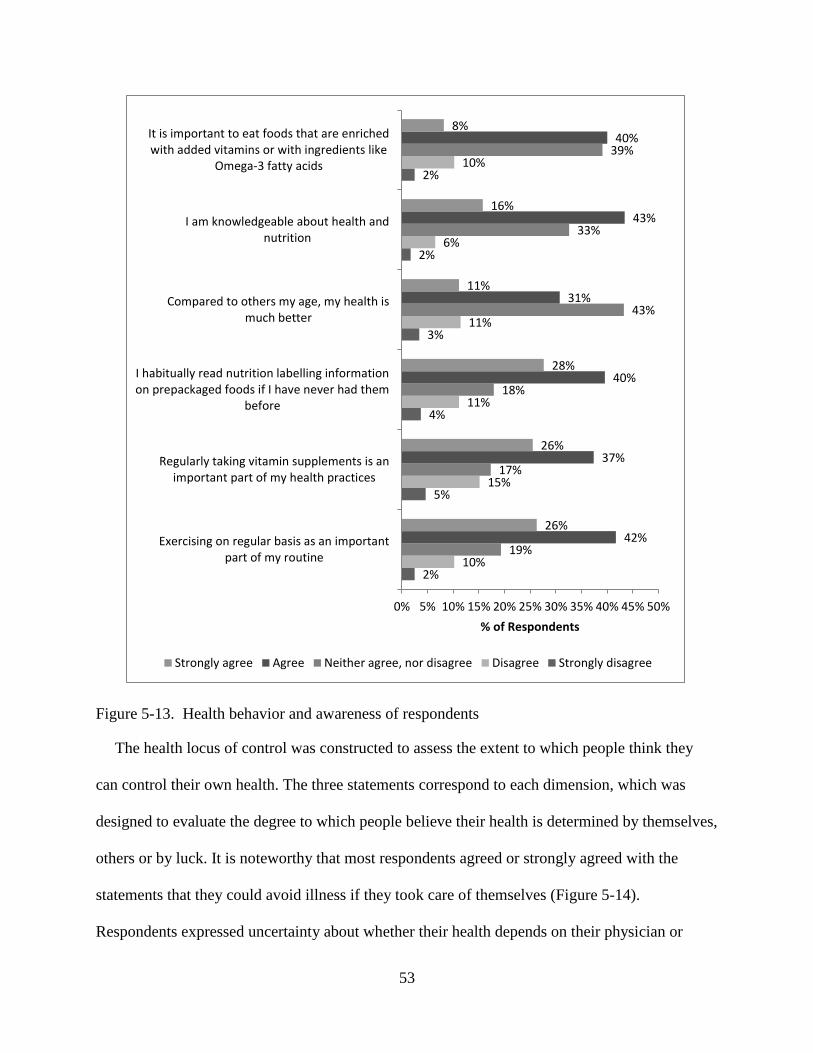
53
Figure 5-13. Health behavior and awareness of respondents
The health locus of control was constructed to assess the extent to which people think they
can control their own health. The three statements correspond to each dimension, which was
designed to evaluate the degree to which people believe their health is determined by themselves,
others or by luck. It is noteworthy that most respondents agreed or strongly agreed with the
statements that they could avoid illness if they took care of themselves (Figure 5-14).
Respondents expressed uncertainty about whether their health depends on their physician or
2%
5%
4%
3%
2%
2%
10%
15%
11%
11%
6%
10%
19%
17%
18%
43%
33%
39%
42%
37%
40%
31%
43%
40%
26%
26%
28%
11%
16%
8%
0% 5% 10% 15% 20% 25% 30% 35% 40% 45% 50%
Exercising on regular basis as an importantpart of my routine
Regularly taking vitamin supplements is animportant part of my health practices
I habitually read nutrition labelling informationon prepackaged foods if I have never had them
before
Compared to others my age, my health ismuch better
I am knowledgeable about health andnutrition
It is important to eat foods that are enrichedwith added vitamins or with ingredients like
Omega-3 fatty acids
% of Respondents
Strongly agree Agree Neither agree, nor disagree Disagree Strongly disagree

54
good fortune. Respondents were most ambivalent in agreeing or disagreeing with these two
statements.
Figure 5-14. Health locus of control over respondents’ health
5.5 Knowledge of Eggs and Barriers to Purchasing Specialty Eggs
Respondents’ rating of their knowledge of eggs by means of a five-point Likert scale is
averaged to construct an index of knowledge score. As anticipated, respondents were most
familiar with regular eggs and least familiar with pasteurized eggs (Figure 5-15), which are not
available Canada. Among other specialty eggs, respondents were relatively more familiar with
free run eggs, organic eggs and omega-3 enhanced eggs compared to vitamin-enhanced eggs and
eggs from hens fed only vegetarian feed. It is expected that respondents’ WTP for different types
of eggs might be correlated with their knowledge of egg products.
6% 1%
9%
17%
5%
27%
33%
21%
36% 32%
51%
23%
13%
21%
5%
0%
10%
20%
30%
40%
50%
60%
Having regular contact withmy physician is the best way
for me to avoid illness
If I take care of myself, I canavoid illness
My good health is largely amatter of good fortune
% o
f R
esp
on
de
nts
Strongly disagree Disagree Neither agree, nor disagree Agree Strongly agree

55
Figure 5-15. Mean knowledge score of survey respondents to different types of eggs
As illustrated in Figure 5-16 and Figure 5-17, the lack of product availability in grocery stores
and the absence of third-party verification and/or certification could be key barriers to expanding
market shares of free run and omega-3 enhanced eggs compared to other kinds of specialty eggs.
More than half of respondents claimed they would buy or buy more free run eggs if the egg
production practices were verified or certified by third-party organizations. However, caution
should be exercised in that consumers’ stated purchasing behaviours might not be consistent with
their actual purchasing behaviours, since there might exist a wide variety of unobserved factors
affecting consumers purchasing decision in real settings, such as time limit, budget constraint
and purchasing habits.
3.05
2.82
2.13
2.66
2.62
2.27
2.25
1.00 1.50 2.00 2.50 3.00 3.50 4.00 4.50 5.00
Regular eggs
Free run eggs
Pasteurized eggs
Organic eggs
Omega-3 enhanced eggs
Vitamin-enhanced eggs
Eggs from hens fed only vegetarian feed
Knowledge score where 1=know nothing, 5=know a lot

56
Figure 5-16. Likelihood of purchasing specialty eggs if they become available or more available
in superstores/grocery stores
Figure 5-17. Likelihood of purchasing specialty eggs if their production process are verified or
certified by a third-party organization
5.6 Perceptions of Egg Quality and Attributes
Respondents were asked to state their agreement with statements about egg quality, the results
of which are depicted in Figure 5-18. Respondents reported uncertainty over the safety of
pasteurized eggs with around 70% of them unsure or dismissing safety improvements associated
with pasteurized eggs. Respondents were also relatively ambiguous about the shell colour of free
6%
12% 11% 9%
11% 12% 9%
17% 16% 16%
21%
16%
37%
45%
37% 35%
40% 41%
25%
18% 22%
25%
21% 20% 23%
8%
15% 15%
7%
12%
0%5%
10%15%20%25%30%35%40%45%50%
Free run eggs Pasteurizedeggs
Organic eggs Omega-3enhanced eggs
Vitamin-enhanced eggs
Eggs from hensfed only
vegetarianfeed
% o
f R
esp
on
de
nts
1:Very unlikely 2 3 4 5:Very likely
6% 7% 9% 10% 10%
14%
17% 15%
31% 32%
37% 37%
28% 26%
23% 21%
26%
21%
13%
17%
0%
5%
10%
15%
20%
25%
30%
35%
40%
Free run eggs Omega-3 enhancedeggs
Vitamin-enhancedeggs
Eggs from hens fedonly vegetarian feed
% o
f R
esp
on
de
nts
1:Very unlikely 2 3 4 5:Very likely

57
run eggs (61% yes and don’t know) and the nutrition of brown eggs (40% yes and don’t know).
In general, respondents revealed substantial misperceptions of food quality, which is in line with
the findings of other Canadian egg research in that consumers perceived dark-yolked, organic
and brown eggs to have higher nutritional values than white eggs (Goddard et al. 2007; Bejaei
2009).
Figure 5-18. Frequency of perceptions of objective quality
When it comes to the perception of quality, around half of respondents indicated that free run
or organic eggs were healthier than regular eggs; approximately one third of respondents were
certain that free run or organic eggs tasted better than regular eggs; and eggs with a darker yolk
colour tasted better (Figure 5-19). Many respondents were uncertain whether mishandling eggs
at home was the major reason for the 2010 salmonella outbreak caused by tainted eggs in the US.
Only a small proportion of respondents believed that free run and organic eggs were more likely
15%
20%
9%
26%
30%
60%
37%
52%
38%
15%
25%
43%
39%
36%
55%
0% 10% 20% 30% 40% 50% 60% 70%
Brown eggs are more nutritious than whiteeggs
Eggs with a darker yolk colour have highernutritional value
Free run eggs have brown shells
Organic eggs have a higher nutritional valuethan regular eggs
Pasteurized eggs are safer than regular eggs
% of Respondents
Don’t know No Yes
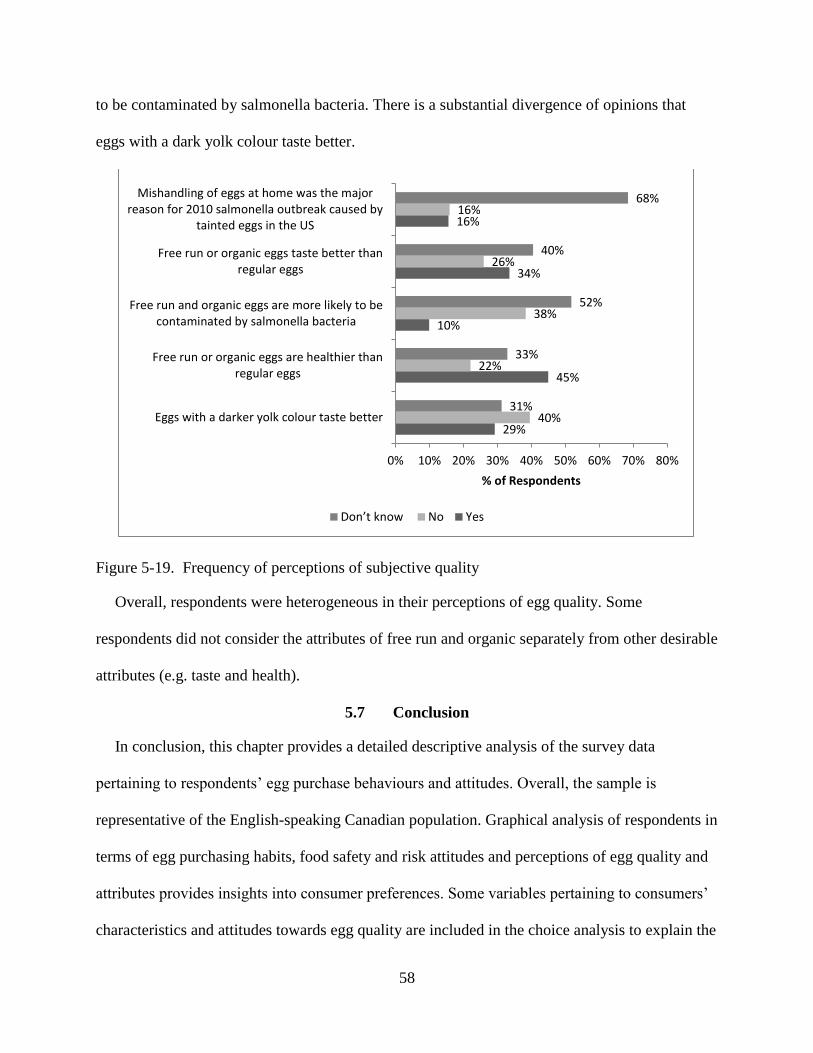
58
to be contaminated by salmonella bacteria. There is a substantial divergence of opinions that
eggs with a dark yolk colour taste better.
Figure 5-19. Frequency of perceptions of subjective quality
Overall, respondents were heterogeneous in their perceptions of egg quality. Some
respondents did not consider the attributes of free run and organic separately from other desirable
attributes (e.g. taste and health).
5.7 Conclusion
In conclusion, this chapter provides a detailed descriptive analysis of the survey data
pertaining to respondents’ egg purchase behaviours and attitudes. Overall, the sample is
representative of the English-speaking Canadian population. Graphical analysis of respondents in
terms of egg purchasing habits, food safety and risk attitudes and perceptions of egg quality and
attributes provides insights into consumer preferences. Some variables pertaining to consumers’
characteristics and attitudes towards egg quality are included in the choice analysis to explain the
29%
45%
10%
34%
16%
40%
22%
38%
26%
16%
31%
33%
52%
40%
68%
0% 10% 20% 30% 40% 50% 60% 70% 80%
Eggs with a darker yolk colour taste better
Free run or organic eggs are healthier thanregular eggs
Free run and organic eggs are more likely to becontaminated by salmonella bacteria
Free run or organic eggs taste better thanregular eggs
Mishandling of eggs at home was the majorreason for 2010 salmonella outbreak caused by
tainted eggs in the US
% of Respondents
Don’t know No Yes

59
difference in consumers’ response to egg attributes. Furthermore, respondents displayed
distinctly different preferences and attitudes pertaining to different types of eggs and revealed
that they evaluate various attributes of egg products in different manners. Heterogeneity in socio-
demographic characteristics and attitudinal responses were markedly revealed among
respondents. The next chapter provides a more detailed examination of preference heterogeneity
and consumers’ attitudes toward egg attributes using econometric modeling.
60
CHAPTER 6
MODEL RESULTS AND ANALYSIS
6.1 Introduction
This chapter presents estimation results from the choice models and relevant hypotheses
developed in Chapter 4 to deal with the proposed research questions: (1) How do different types
of egg attributes affect consumers’ purchasing decisions for quality-differentiated eggs? (2) To
what extent do preferences for egg attributes vary among people, and how do individual’s
attitudes and socio-demographic characteristics influence their egg choices? (3) Does the
inclusion of a verified free run attribute (versus simply free run) make a difference across the two
versions of the survey?
The econometric software NLOGIT 4.0 written by Greene is applied for model estimation
following Figure 4-1 in Chapter 4. The estimated models can be classified into two streams
based on the preference assumptions:
(1) The base MNL models that assume preference homogeneity: (1a) the base MNL model
with main effects; (1b) the base MNL model with two-way interaction effects.
(2) Two alternative choice models that take account of preference heterogeneity: (2a) an
extended MNL model with respondents’ characteristics; (2b) the ML model.
6.2 Estimation Results of the Multinomial Logit Model
In this section, the results regarding two hypothesis tests are first presented, followed by the
base MNL model with main effects and the estimation results for the base MNL model that
contains significant two-way interaction variables between shell colour and other attributes.
Hypothesis Testing
In order to test for preference equality across treatments and estimate the relative scale
parameter in the joint model, an artificial nested logit model outlined by Hensher and Bradley

61
(1993) was applied in a full information maximum likelihood (FIML) manner. In the joint
model, where the version 1 scale parameter is normalized to be 1, the parameters on common
attributes are restricted to be the same between the two CE treatments. Estimation results are
presented in Table 6-1 where all variables names are as specified in Table 4-1.
Table 6-1. Base MNL model estimates for pooled data sets controlling for scale difference
Variables Coefficient P-value
ASC_N -3.087*** .000
ASC_REG .350*** .000
PRICE -.528*** .000
BROWN .156*** .010
FR .681*** .000
ORG .425*** .000
VFR .360*** .002
OMG-3 .315*** .000
VITAM .253*** .003
PASTEU .203*** .001
Summary statistics
Scale parameter .735
McFadden R2 .477
Log-likelihood -2814.436
LR statistics .064
Number of obs. 2588
Note: ***, **,* denotes significance at the 1%, 5%, 10% level.
The scale parameter is 0.735, which is not significantly different from unity (p-value=.789).
Thus, we fail to reject the null hypothesis of parameter equality subject to scale heterogeneity,

62
since the chi-squared statistic for the hypothesis of equal parameters (LR statistics) is .064, which
is less than the critical values χ2 (1) (3.841) at the 5% level. Hence, when allowing for scale
heterogeneity, the underlying parameters in the base MNL model are not significantly different
between the two versions of CE responses. Therefore, the data are pooled for all subsequent
analysis.
To examine whether the introduction of the verified free run attribute has any adverse or
negative effect on consumers’ evaluation of free run without verification, the marginal WTP for
free run is compared between the treatments. Based on the Wald test for marginal WTP
difference, the null hypothesis of equality of marginal WTP for the free run attribute between
treatments was rejected at the 10% significance level (p-value=.079). The test result indicates
that introducing the verified free run attribute has a weakly significant negative effect on
respondents’ valuation. This finding is expected and intuitive, it is speculated that due to
skepticism towards the authenticity of free run eggs without verification in the presence of
verified free run eggs, some respondents were either unwilling to pay or lowered their WTP for
unverified free run eggs, which can be referred to as the “externality or stigma effect”.
Base MNL Model Results
Table 6-2 presents the estimated results for the base MNL model, which is obtained from the
empirical specification of Equation (4.5).
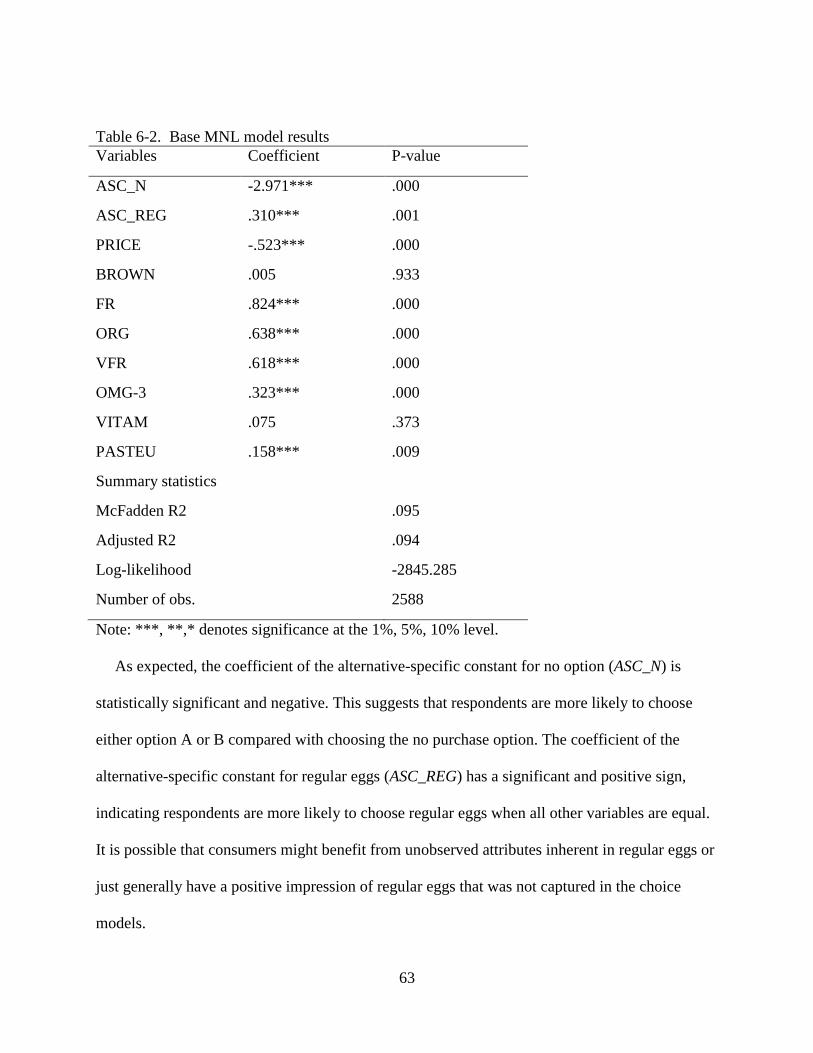
63
Table 6-2. Base MNL model results
Variables Coefficient P-value
ASC_N -2.971*** .000
ASC_REG .310*** .001
PRICE -.523*** .000
BROWN .005 .933
FR .824*** .000
ORG .638*** .000
VFR .618*** .000
OMG-3 .323*** .000
VITAM .075 .373
PASTEU .158*** .009
Summary statistics
McFadden R2 .095
Adjusted R2 .094
Log-likelihood -2845.285
Number of obs. 2588
Note: ***, **,* denotes significance at the 1%, 5%, 10% level.
As expected, the coefficient of the alternative-specific constant for no option (ASC_N) is
statistically significant and negative. This suggests that respondents are more likely to choose
either option A or B compared with choosing the no purchase option. The coefficient of the
alternative-specific constant for regular eggs (ASC_REG) has a significant and positive sign,
indicating respondents are more likely to choose regular eggs when all other variables are equal.
It is possible that consumers might benefit from unobserved attributes inherent in regular eggs or
just generally have a positive impression of regular eggs that was not captured in the choice
models.

64
All attribute coefficients are found to be statistically significant at the 1% level with expected
signs, with the exception of shell colour and vitamin-enhanced feed, which are not statistically
significant. As expected, the price coefficient is negative, suggesting that an increase in egg price
would reduce the probability of choosing the egg alternative.
Since all remaining attribute variables are dummy-coded, their parameter estimates have to be
interpreted in relation to the base level (where eggs have white shells and come from hens kept
in conventional battery cages and fed with regular feed). Consequently, a positive estimated
coefficient on a specific attribute implies that respondents are more likely to choose the egg
alternative with changes in that attribute, ceteris paribus.
However, estimated parameters on attributes from the discrete choice model provide little
interpretation in terms of preference ordering. It is more common to calculate the marginal WTP
to make comparisons of consumers’ preference strength for each of the attributes by converting
the attribute coefficient into the same scale of measurement (implicit price). Marginal WTP
estimates and asymptotic standard errors are shown in Table 6-3, which are obtained with the
coefficients reported in Table 6-2.
Table 6-3. Marginal mean WTP for each egg attribute
Variables Marginal WTP ($/1 dozen) P-value
BROWN .010 (.114) .933
FR 1.575*** (.166) .000
ORG 1.218*** (.174) .000
VFR 1.182*** (.230) .000
OMG-3 .617*** (.163) .000
VITAM .143 (.161) .373
PASTEU .302*** (.116) .009
Note: ***, **,* denotes significance at the 1%, 5%, 10% level, the numbers in parentheses are
standard errors generated by using delta method in NLOGIT 4.0.
The marginal WTP estimates provide an interpretation of the relative importance of egg
attributes. Free run eggs are most preferred by respondents, followed by organic eggs and
65
verified free run eggs. Respondents are on average willing to pay a price premium of $1.58 per
dozen to purchase free run eggs relative to regular eggs while other variables are held constant.
Respondents are clearly willing to pay more for the production method attribute relative to other
attributes. An odd finding is that the marginal WTP for FR is slightly higher than the marginal
WTP for VFR at the 10% level. It is speculated that the result might be due to the caveat that the
MNL model fails to account for the unobserved preference heterogeneity associated with free
run and verified free run eggs. In addition, respondents notably prefer omega-3 enhanced eggs
(premium is $.62 per dozen eggs) over vitamin-enhanced eggs (no significant premium). Among
the considered attributes that carry a positive premium, PASTEU carries the lowest premium
($.30 per dozen eggs), probably because pasteurized eggs are not available in Canada and
consumers are less familiar with the quality of pasteurized eggs. Respondents are indifferent
towards brown or vitamin-enhanced eggs relative to regular eggs. The results clearly show that
Canadian consumers do evaluate different egg attributes in a different manner.
Generally speaking, the premiums for pasteurized eggs and free run eggs identified in this
research are significantly higher than the premiums found in Romanowska’s stated preference
experiment where respondents’ WTP for uncertified pasteurized eggs and uncertified free run
eggs are negative and zero respectively compared to regular eggs. For vitamin-enhanced eggs,
the identified zero premium from this research is same as that of Romanowska’s stated
preference research.
While the base MNL model with main effects reveals consumers’ preferences for egg
attributes, it fails to take into consideration the potential correlation of attributes. Therefore, the
base MNL model with two-way interaction effects is considered next.

66
Base MNL Model Including Interaction Terms between Attributes
After extensive exploration of model testing, the estimated results of the base MNL model
with significant two-way interaction terms are reported in Table 6-4.
Table 6-4. Base MNL model with two-way interaction effects for the egg attributes
Variables Coefficient P-value
ASC_N -3.279*** .000
ASC_REG -.005 .967
PRICE -.520*** .000
BROWN -.756*** .000
FR .603*** .000
ORG .190 .159
VFR .348* .048
OMG-3 .347*** .000
VITAM -.090 .294
PASTEU -.062 .541
BROWN*FR .503*** .012
BROWN*ORG .974*** .000
BROWN*VFR .457* .064
BROWN*PASTEU .514*** .002
Summary statistics
McFadden R2 .100
Adjusted R2 .097
Log-likelihood -2829.960
Restricted Log-likelihood (base MNL model) 2845.285
LR statistics 30.65
Number of obs. 2588
Note: ***, **,* denotes significance at the 1%, 5%, 10% level.
The base MNL model with main effects is rejected, since the chi-squared statistic (LR
statistic) for the hypothesis that the coefficients of two-way interaction variables are jointly zero
is greater than the critical value χ2 (4) (13.277) at the 1% level.
Four two-way interaction terms pertaining to egg shell colour are statistically significant. The
magnitude of these parameters demonstrates that shell colour does matter to respondents when
choosing eggs with enhanced production methods or pasteurization. Based on the model results
in Table 6-4, respondents appear to prefer cage-free eggs, which have brown shells. Shell colour
67
has a significant impact on respondents’ preferences for free run, organic and pasteurized eggs.
This confirms the expectation that consumers tend to rely on search attributes (shell colour) to
help evaluate egg products with certain credence attributes (free run, organic or pasteurization).
Since the base MNL model with a set of significant two-way interaction terms significantly
improves the goodness of fit, it serves as the base model for estimations of the extended MNL
model and the ML model in the subsequent sections. In the following paragraphs, two alternative
choice models are introduced to ascertain the presence of preference heterogeneity by relaxing
the limitations of base MNL models.
Extended MNL Model with Respondents’ Characteristics
In order to examine the heterogeneity of egg consumers’ preferences, an MNL model that
includes the socio-demographic and attitudinal characteristics of the respondents is estimated.
The inclusion of individual-specific variables in the base MNL model makes it possible to
account for some of the heterogeneity in the preferences between individuals. Table 6-5
illustrates the definition and coding of the variables that enter the model as covariates in the
extended MNL model.
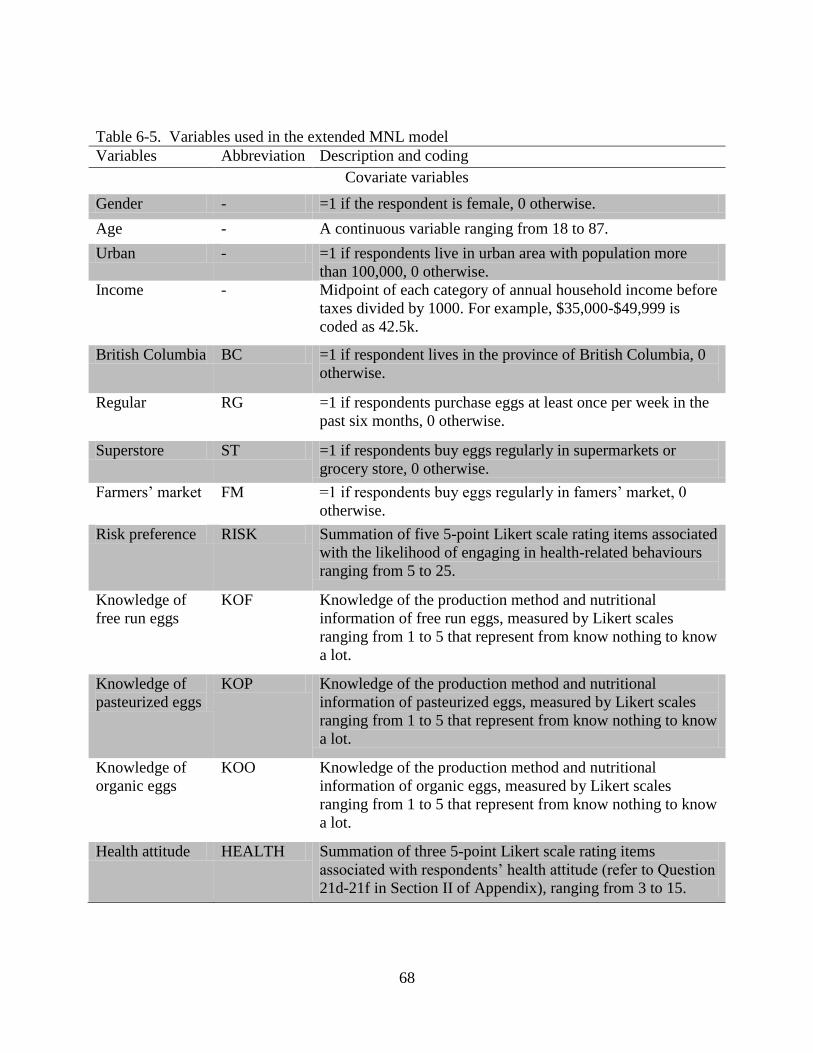
68
Table 6-5. Variables used in the extended MNL model
Variables Abbreviation Description and coding
Covariate variables
Gender - =1 if the respondent is female, 0 otherwise.
Age - A continuous variable ranging from 18 to 87.
Urban - =1 if respondents live in urban area with population more
than 100,000, 0 otherwise.
Income - Midpoint of each category of annual household income before
taxes divided by 1000. For example, $35,000-$49,999 is
coded as 42.5k.
British Columbia BC =1 if respondent lives in the province of British Columbia, 0
otherwise.
Regular RG =1 if respondents purchase eggs at least once per week in the
past six months, 0 otherwise.
Superstore ST =1 if respondents buy eggs regularly in supermarkets or
grocery store, 0 otherwise.
Farmers’ market FM =1 if respondents buy eggs regularly in famers’ market, 0
otherwise.
Risk preference RISK Summation of five 5-point Likert scale rating items associated
with the likelihood of engaging in health-related behaviours
ranging from 5 to 25.
Knowledge of
free run eggs
KOF Knowledge of the production method and nutritional
information of free run eggs, measured by Likert scales
ranging from 1 to 5 that represent from know nothing to know
a lot.
Knowledge of
pasteurized eggs
KOP Knowledge of the production method and nutritional
information of pasteurized eggs, measured by Likert scales
ranging from 1 to 5 that represent from know nothing to know
a lot.
Knowledge of
organic eggs
KOO Knowledge of the production method and nutritional
information of organic eggs, measured by Likert scales
ranging from 1 to 5 that represent from know nothing to know
a lot.
Health attitude HEALTH Summation of three 5-point Likert scale rating items
associated with respondents’ health attitude (refer to Question
21d-21f in Section II of Appendix), ranging from 3 to 15.
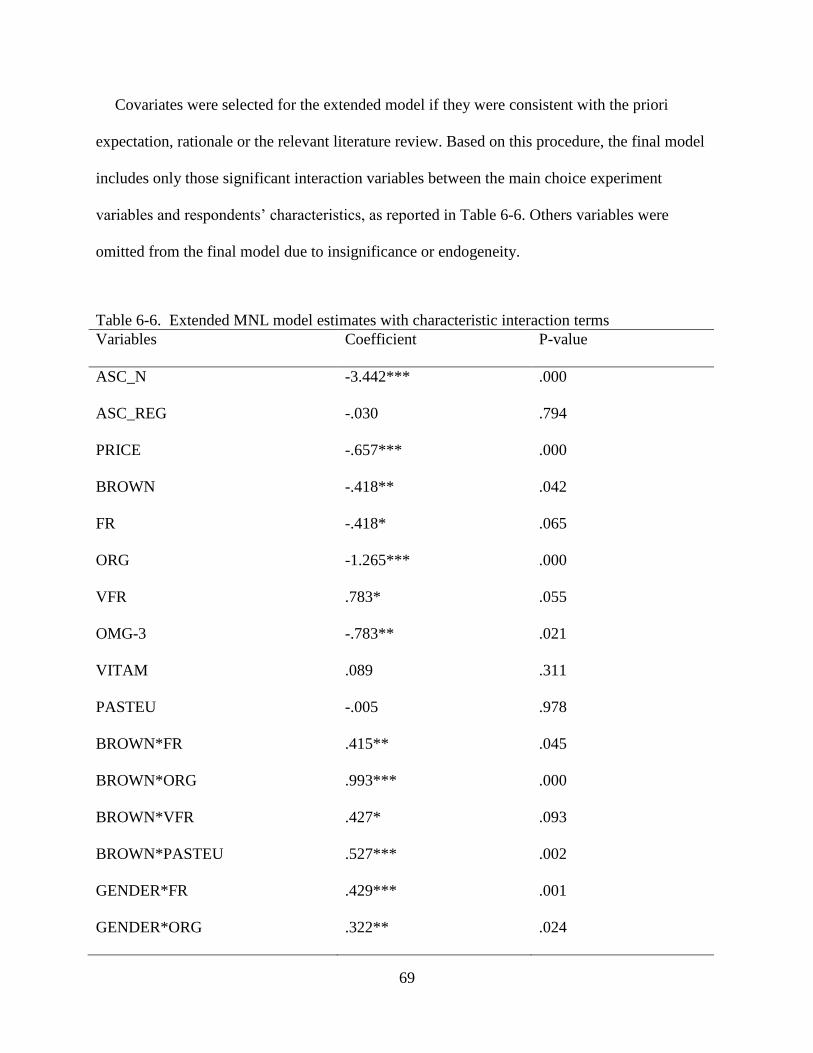
69
Covariates were selected for the extended model if they were consistent with the priori
expectation, rationale or the relevant literature review. Based on this procedure, the final model
includes only those significant interaction variables between the main choice experiment
variables and respondents’ characteristics, as reported in Table 6-6. Others variables were
omitted from the final model due to insignificance or endogeneity.
Table 6-6. Extended MNL model estimates with characteristic interaction terms
Variables Coefficient P-value
ASC_N -3.442*** .000
ASC_REG -.030 .794
PRICE -.657*** .000
BROWN -.418** .042
FR -.418* .065
ORG -1.265*** .000
VFR .783* .055
OMG-3 -.783** .021
VITAM .089 .311
PASTEU -.005 .978
BROWN*FR .415** .045
BROWN*ORG .993*** .000
BROWN*VFR .427* .093
BROWN*PASTEU .527*** .002
GENDER*FR .429*** .001
GENDER*ORG .322** .024

70
AGE*VFR -.016** .015
URBAN*ORG .307** .024
URBAN*VFR .567*** .006
INCOME*PRICE .001** .014
BC*FR .371** .017
BC*VFR .624** .012
RG*PRICE .167*** .000
ST*BROWN -.390*** .005
FM*PRICE .404*** .000
FM*FR -1.036*** .002
RISK*PASTEU -.056*** .000
KOF*FR .278*** .000
KOP*PASTEU .280*** .000
KOO*ORG .399*** .000
HEALTH*OMG-3 .110*** .000
Summary statistics
McFadden R2 .147
Adjusted R2 .144
Log-likelihood -2682.182
Restricted Log-likelihood (base MNL model with two-way
interaction effects)
-2829.960
LR statistics 295.556
Number of obs. 2588
Note: ***, **,* denotes significance at the 1%, 5%, 10% level.

71
As shown in Table 6-6, the LR statistic is greater than the critical values χ2 (17) (33.409) at
the 1% level, suggesting the extended MNL model with covariates fits the data better than the
base MNL model with two-way interaction effects. Thus, it confirms preference heterogeneity
exists among egg consumers.
As expected, the coefficients on the alternative-specific constants for no option and price are
negative and significant, indicating that there is positive utility associated with choosing either
option A or B compared with choosing the no purchase option and that increasing prices
decrease the probability of a respondent purchasing any egg type. Similar to the base MNL
model with two-way interaction terms, the coefficients on four two-way interaction terms
pertaining to egg shell colour are also positive and statistically significant. It should be noted that
when interpreting the effects of egg attributes, it is better to compare the total effects of the main
attributes on the choice decision by taking interaction effects into consideration instead of partial
effects. This is because the coefficients on the covariates are statistically significant at least
above the 5% level in the extended MNL model. When looking at the role of the respondents’
characteristics, the estimation results should be interpreted relative to the reference group. It is
evident that different covariates have different impacts on individual attributes.
Shell colour: The variable denoting whether respondents who buy eggs regularly in
supermarkets/grocery store (ST) was the only covariate statistically significant when interacted
with the shell colour (BROWN). The negative coefficient indicates respondents who buy eggs
regularly in supermarkets/grocery stores are more likely to choose white eggs. In addition, shell
colour plays a significant role in respondents’ choice of eggs with enhanced production methods
or pasteurization.
72
Production method: The interaction terms between gender and the attributes of free run and
organic (GENDER*FR and GENDER*ORG) have significant and positive effects, suggesting
that females in the sample have a higher likelihood of purchasing free run eggs and organic eggs
relative to male counterparts. KOF*FR and KOO*ORG both have positive significant
coefficients, implying that respondents who viewed themselves to be more knowledgeable about
the production and nutrition of free run eggs or organic eggs are more likely to purchase those
two types of eggs. With the coefficient of the interaction variable FM*FR being negative and
significant, it suggests that respondents who buy eggs regularly in farmers’ markets are less
likely to choose free run eggs compared to those who never or occasionally buy eggs in farmers’
markets. Unlike free run eggs, the source of respondents’ preference heterogeneity for verified
free run eggs is different except for the covariate of BC. The positive and significant coefficients
of BC*FR and BC*VFR indicate that respondents from British Columbia are more likely to buy
free run and verified free run eggs. In addition, the variable AGE shows a negative and
significant impact on the evaluation of the VFR attribute. Thus, ceteris paribus, older consumers
are generally less likely to choose verified free run eggs. The coefficients of URBAN*VFR and
URBAN*ORG are positive and significant, suggesting that respondents who live in urban areas
with populations more than 100,000 have a higher possibility of purchasing verified free run
eggs and organic eggs relative to those who live in community with population less than
100,000. It is also notable that brown shell free run, verified free run or organic eggs are valued
more by respondents compared to white shell free run, verified free run or organic eggs.
Feed: When the covariates are interacted with the vitamin-enhanced attribute, none is found
to significantly interpret respondents’ preference variation. For the omega-3 enhanced attribute,
one interaction variable HEALTH*OMG-3 is identified to have a significant coefficient. The

73
positive and significant coefficient of HEALTH*OMG-3 indicates that respondents with heighted
health consciousness are more likely to purchase omega-3 enhanced eggs. Previous studies, such
as Asselin (2005), found similar results in terms of the impact of health consciousness on
consumers’ choice of omega-3 enhanced eggs.
Pasteurization: Two variables RISK and KOP that are interacted with PASTEU are estimated
to be highly significant. The negative and significant coefficient of RISK*PASTEU indicates that
respondents who are more risk-seeking have a lower intention of buying pasteurized eggs. This
result is expected, since pasteurized eggs are claimed to be eggs with enhanced safety.
KOP*PASTEU has a significant positive coefficient, implying that respondents who claimed
themselves to be more knowledgeable about the production and nutrition of pasteurized eggs are
more likely to purchase pasteurized eggs. On average, respondents prefer brown shell
pasteurized eggs over white shell pasteurized eggs.
Price: Three interaction variables related to price carry positive and significant effects at the
1% level, including FM*PRICE, INCOME*PRICE and RG*PRICE. Consequently, these
estimated coefficients imply that respondents who buy eggs regularly in farmers’ markets are
relatively less price sensitive relative to those who never or occasionally buy eggs in farmers’
markets; respondents with higher income levels are less sensitive to price changes; respondents
who purchase eggs regularly tend to be less responsive towards price changes in contrast with
those who purchase eggs irregularly.
To sum up, it is demonstrated that the sampled respondents display distinctive preferences for
egg attributes and some of their socio-demographic characteristics, knowledge and attitudes
explicitly explain preference variability. However, it is suspected that only some proportion of
utility variance is captured by direct incorporation of interaction terms in this model.

74
Consequently, it is necessary to use the ML model to further confirm the existence of preference
heterogeneity and compare its explanatory power to the extended MNL model.
6.3 ML Model Results
In the ML model, the price coefficient is specified to be fixed and allow the coefficients on
the remaining variables to vary with the normal distribution among the respondent population.
By doing that, it is possible for the sample to have either positive or negative preferences and the
mean marginal WTP estimates are ensured to be normally distributed (Louviere et al. 2000;
Train 2003). The ML model is estimated by Simulated Maximum Likelihood through Halton
draws with 150 replications (Revelt and Train 1998; Louviere et al. 2000; Train 2003; Hensher et
al. 2005). The estimation results for the ML model are presented in Table 6-7.

75
Table 6-7. Simulated maximum likelihood estimates from ML model
Mean value of random
parameters
Coefficients P-value Standard
deviation
coefficients
P-value
ASC_N -8.918*** .000 4.369*** .000
ASC_REG -.628*** .009 3.002*** .000
BROWN -1.042*** .002 1.583*** .000
FR 1.379*** .000 1.769*** .000
ORG -.063 .827 1.877*** .000
VFR .618 .113 2.337*** .000
OMG-3 .670*** .000 1.114*** .000
VITAM -.003 .988 1.045*** .000
PASTEU -.195 .353 1.856*** .000
BROWN*FR .206 .621 .698* .090
BROWN*ORG 1.708*** .000 .224 .793
BROWN*VFR -.045 .932 1.028 .101
BROWN*PASTEU .424 .203 1.065*** .008
Mean value of fixed
parameters
Price -1.167*** .000
Summary statistics
McFadden R2 .343
Adjusted R2 .340
Log likelihood at start values -2829.960
Simulated log likelihood at convergence -2358.616
LR statistics 942.688
Number of obs. 2588
Number of Halton draws 150
Note: ***, **,* denotes significance at the 1%, 5%, 10% level. Coefficients on all variables
except for price are specified as normally distributed.
As expected, the coefficients for the opt out and price are significant and negative, indicating
that respondents prefer option A or B and that a price increase would lessen the probability of
respondents choosing the alternatives.
Nevertheless, compared to the base MNL model estimates, the mean coefficients of several
random parameters in the ML model are slightly different. For example, parameters for variables
of VFR, BROWN*FR, BROWN*PASTEU and BROWN*VFR are no longer significant.
Consumers are distinctly more likely to choose free run eggs and omega-3 enhanced eggs all else

76
being equal. They are indifferent toward verified free run eggs, vitamin-enhanced eggs and
pasteurized eggs relative to regular eggs. The positive and significant coefficient of
BROWN*ORG indicates that consumers’ preference for organic eggs highly depends on the
eggs’ shell colour.
Given that the estimation of the ML model first involves the estimation of the base MNL
model with four significant two-way interaction terms to derive initial start values for each of the
parameters, the relative performance of the base MNL model and the ML model can be
compared. An LR test is performed to examine the null hypothesis that the ML model does not
significantly improve the model fit relative to the base MNL model. Since the LR statistic
(942.688) is greater than the Chi-squared critical value χ2 (13) at the 1% level (the ML model
has 13 extra parameter estimates compared to the base MNL model), the null hypothesis can be
rejected and it can be concluded that the ML model fits the data better in comparison to the base
MNL model that assumes fixed taste parameters.
As shown in Table 6-7, the estimated standard deviations of all random parameters on the
main variables are highly significant, implying the existence of preference heterogeneity for egg
attributes, including shell colour, production method, feed and pasteurization. In order to better
compare the preference ordering of different types of specialty eggs, the marginal mean WTP for
each type of egg is calculated and presented in Table 6-8. The estimated coefficients reported in
Table 6-7 were used to compute the mean marginal WTP estimates. The standard errors are
obtained by the Delta method. Note that the WTP estimates for free run, organic and pasteurized
eggs are differentiated by shell colour. Results indicate that among the types of eggs with
positive premiums, the highest premium is for white free run eggs, followed by omega-3
enhanced eggs, brown organic eggs and brown free run eggs compared to white regular eggs.

77
Table 6-8. Mean marginal WTP (in $/dozen) estimates from the ML model
Egg type Mean marginal WTP($/1 dozen) P-value
Brown -.892*** (.289) .002
White Free-run 1.182*** (.224) .000
Brown Free-run .466* (.261) .074
White Organic -.054 (.246) .827
Brown Organic .517* (.286) .071
White Verified Free-run .530 (.330) .109
Brown Verified Free-run -.401 (.408) .326
Omega-3 Enhanced .574*** (.154) .000
Vitamin Enhanced -.002 (.156) .988
White Pasteurized .167 (.179) .352
Brown Pasteurized -.696*** (.262) .008
Note: ***, **,* denotes significance at the 1%, 5%, 10% level, the numbers in parentheses are
standard errors generated by using delta method in NLOGIT 4.0.
It is noticeable that respondents’ WTP for free run eggs, organic eggs and pasteurized eggs
depends on the shell colour. On average, respondents are willing to pay a price premium of $1.18
per dozen to purchase white free run eggs, whereas their premium for the brown free run eggs is
$.47 per dozen. The negative impact of shell colour on specialty eggs also applies to pasteurized
eggs. There is no premium for white pasteurized eggs relative to regular eggs, whereas the mean
marginal WTP for brown pasteurized eggs is -$.70 per dozen. Nevertheless, shell colour adds a
positive premium to the valuation of organic eggs. Respondents apparently prefer brown organic
eggs (the premium is $ .52 per dozen) over white regular eggs (the premium is zero) and are
indifferent between white organic eggs and white regular eggs. The WTP difference between

78
certain types of white specialty eggs (free run eggs, organic eggs and pasteurized eggs) and
brown counterparts may seem curious. However, it is speculated that this could be because the
sampled respondents see the shell colour (search attribute) as proxy for credence attributes, since
it is difficult or impossible for them to ensure the claim of credence attributes on egg products.
Consistent with the result in the base MNL model, consumers’ WTP for the feed attribute
varies, the mean marginal WTP for omega-3 enhanced eggs is $ .57 per dozen, whereas there is
no premium for vitamin-enhanced eggs relative to regular eggs. Additionally, on average,
consumers demand a discount by $ .89 per dozen for choosing brown eggs over white eggs.
Finally, estimated WTP shows indifference between respondents’ preferences for verified free
run eggs and regular eggs.
In conclusion, the ML model results yield a more nuanced picture regarding the dispersion of
preference weights among respondents. Respondents’ preferences for egg attributes are found to
be heterogeneous and vary across attributes. Similar to the results reported in the base MNL
model with two-way interaction effects for egg attributes, shell colour is significantly valued by
organic egg consumers.
6.4 Conclusion
This chapter encompasses several forms of logit model under the RUT framework, evolving
from base MNL models to an array of extended discrete choice models. Instead of running
separate models for both versions of the survey, the pooled model without rescaling was used for
the relevant discrete choice analysis, based on data pooling tests. The result of a Wald test
suggests that the introduction of verified free run eggs has a weak impact on consumers’
assessment of free run eggs.
By starting with base MNL models for the pooled data set, it is initially assumed that egg
consumers hold homogeneous preference for egg attributes. The estimated results indicate that

79
on average, respondents’ WTP for different types of egg attributes significantly varied.
Furthermore, results from the base MNL model with two-way interaction terms of egg attributes
show that shell colour has a considerable effect on consumers’ evaluation of relevant attributes.
The estimation of base MNL models, however, ignores preference heterogeneity. Therefore,
two alternative choice models are introduced to account for preference heterogeneity, including
an extended MNL model including interaction terms between main variables and respondents’
characteristics and the ML model. These two models confirm the existence of preference
heterogeneity from different perspectives. The extended MNL model results reveal factors that
affect the evaluation of egg attributes and depict the profile of consumer segments. As the most
generalized logit model, the ML model captures preference heterogeneity by assuming the
respondent-specific parameters randomly vary according to a normal distribution instead of
being fixed. In this sense, the significance of parameters relating to standard deviation of random
variables confirms the existence of heterogeneity in consumers’ preferences for egg shell colour,
production method, feed and pasteurization.
The premium for free run eggs identified in this research is positive, which is different from
the premium found in Romanowska’s stated preference experiment where respondents’ WTP for
uncertified free run eggs is zero. With regard to the WTP estimate for pasteurized eggs, the WTP
for brown pasteurized eggs is negative and significant, which is similar to the WTP estimate in
Romanowska’s study in which pasteurized eggs are not differentiated by shell colour. For
vitamin-enhanced eggs, the identified zero premium from this research is same as that of
Romanowska’s study.
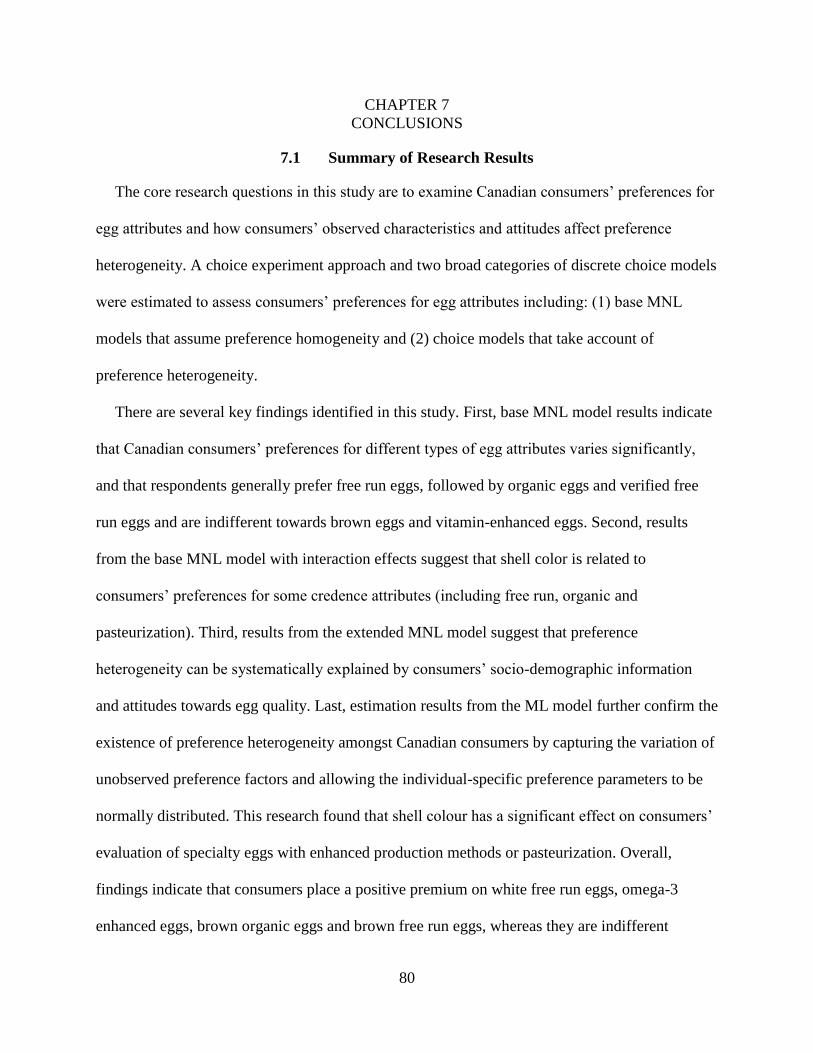
80
CHAPTER 7
CONCLUSIONS
7.1 Summary of Research Results
The core research questions in this study are to examine Canadian consumers’ preferences for
egg attributes and how consumers’ observed characteristics and attitudes affect preference
heterogeneity. A choice experiment approach and two broad categories of discrete choice models
were estimated to assess consumers’ preferences for egg attributes including: (1) base MNL
models that assume preference homogeneity and (2) choice models that take account of
preference heterogeneity.
There are several key findings identified in this study. First, base MNL model results indicate
that Canadian consumers’ preferences for different types of egg attributes varies significantly,
and that respondents generally prefer free run eggs, followed by organic eggs and verified free
run eggs and are indifferent towards brown eggs and vitamin-enhanced eggs. Second, results
from the base MNL model with interaction effects suggest that shell color is related to
consumers’ preferences for some credence attributes (including free run, organic and
pasteurization). Third, results from the extended MNL model suggest that preference
heterogeneity can be systematically explained by consumers’ socio-demographic information
and attitudes towards egg quality. Last, estimation results from the ML model further confirm the
existence of preference heterogeneity amongst Canadian consumers by capturing the variation of
unobserved preference factors and allowing the individual-specific preference parameters to be
normally distributed. This research found that shell colour has a significant effect on consumers’
evaluation of specialty eggs with enhanced production methods or pasteurization. Overall,
findings indicate that consumers place a positive premium on white free run eggs, omega-3
enhanced eggs, brown organic eggs and brown free run eggs, whereas they are indifferent
81
towards vitamin-enhanced eggs, verified free run eggs, white pasteurized eggs and white organic
eggs. Consumers generally dislike brown eggs compared to white eggs with the exception of
organic eggs.
This research differs from previous studies in terms of choice of attributes used and the
correlation between egg attributes in the choice modelling. Five attributes with varying levels
were chosen to reveal the difference between specialty eggs and regular eggs, thus people’s
preferences for certain types of specialty eggs could be decomposed into their preference for
individual attributes. The wide range of attributes used in this study also enabled the analysis to
account for the possible interaction between attributes, which might be masked if specialty eggs
are differentiated by only a limited range of attributes. In addition, results could be applied to
national consumers with the exception of Quebec instead of regionally as in previous egg
studies.
7.2 Industry Implications
Despite the overall growth of the market share of specialty eggs, it is essential to understand
the nature of preferences for egg attributes to further boost consumer demand for specialty eggs.
To achieve this, it will be important to expand the range of egg products in existing markets to
meet consumers’ demands. Additionally, more knowledge is important for egg producers and
retailers regarding egg characteristics and consumers’ tastes.
The major findings of this research are the identification of heterogeneity in Canadian
consumers’ preferences toward attributes and the interaction effects between the search attribute
(shell colour) and several credence attributes. Since brown organic eggs are clearly preferred
over white organic eggs, egg producers can use clear plastic cartons to help consumers make
purchasing decisions. Egg producers should be cautious about the decision to produce white
organic eggs, since consumers might use shell colour as proxy to validate the organic claim. In
82
addition, even though respondents were provided with the information sheet showing the
nutritional equivalence between regular eggs and free run or organic eggs, half of the
respondents still think free run or organic eggs are healthier than regular eggs. Thus, an
educational campaign and promotional program concerning free run and organic eggs might be
more effective by emphasizing the health and taste of these eggs.
The research results are important to egg producers and other stakeholders of the egg industry
in developing product differentiation strategies. Although the choice data suggest that consumers
are willing to pay a premium for brown organic eggs, free run eggs and omega-3 enhanced eggs,
the survey results still show that the majority of respondents still prefer regular eggs. One reason
might be that the premium identified in this study for certain specialty eggs over regular eggs is
lower than the actual price differentials set by the egg producers. Another reason might be that
consumers are lacking knowledge and awareness of the benefits associated with specialty eggs,
which makes them habitually purchase regular eggs. Therefore, it might be useful for egg
marketers and producers to advertise desirable attributes of specialty eggs using a series of
promotional events or campaigns, or alternative packaging strategies: e.g. free run egg packages
could illustrate that eggs come from happy laying hens.
Another strategy would be for egg marketers and producers to work with animal rights groups
(e.g. British Columbia Society for the Prevention of Cruelty to Animals and World Society for
the Protection of Animals) to promote specialty eggs with enhanced animal welfare attributes
(e.g. free run and organic eggs) to reach target customers. For specialty eggs with perceived
health benefits, it might be advisable to market them through different alternative outlets such as
functional food stores instead of generic grocery stores, which might help to target health-
conscious consumers. Since some consumers perceive free run and organic eggs as healthier and

83
better tasting, in spite of information provided that explains free run and organic eggs have the
same nutritional components as regular eggs, egg marketing strategies could emphasize desirable
features of health and taste regarding free run and organic eggs to expand the targeted niche
market. For example, marketers could develop an on-site tasting campaign.
To sum up, the identification of preference heterogeneity and determining factors amongst
Canadian egg consumers can not only help egg marketers and policy makers to lay out relevant
educational and marketing plans to sustain the further development of egg sectors, but also
satisfy consumers’ unique preferences by providing quality-differentiated products with unique
features or characteristics. However, care should be exercised if free run egg verification is to be
introduced into the niche market of free run eggs given the potential existence of the externality
effect. The research finding indicates that the introduction of the verified free run attribute might
have adverse effect on consumers’ evaluation of free run without verification. Consequently,
welfare or benefit-cost analysis might be required to evaluate the influence of verification
policies on preferences for a set of credence attributes. In addition, findings concerning the
interaction of attributes might imply that shell colour could be used by the egg industry to send
positive quality signals about credence attributes.
7.3 Limitations of the Research and Areas for Future Research
While this research provides valid results about respondents’ preferences for specialty eggs,
there are several limitations. First, the model estimates might be sensitive to the number of
attributes and levels of attributes. Thus, future research would be beneficial to examine the effect
of the number of attributes or attribute levels on marginal WTP estimates. Second, survey
subjects are only those who personally purchased eggs for their household to eat at home, and
therefore might not be representative of Canadian egg consumers as a whole. In addition, it is of
note that the sample omitted the province of Quebec in which consumers might have different

84
preferences for egg attributes from the rest of Canada. Third, although the choice experiment is
beneficial because it enables researchers to manipulate product attributes and develop product
choices that do not exist in the grocery store, it has limitations because of the nature of the stated
preference method. Therefore, it ought to be acknowledged that the stated choice experiment
results might be subject to hypothetical bias (people are prone to overstating their WTP for
choices without being faced with choices for real products in a real shopping experience). Hence,
future research could be conducted to compare marginal WTP estimates in a hypothetical setting
versus in a non-hypothetical setting.
In addition, as more varied specialty eggs emerge in the Canadian market, it might be possible
for prospective researchers to use revealed preference experiments to conduct similar research to
investigate consumers’ WTP for egg attributes in an actual purchasing setting. Last, as the choice
experiment does not take into account the alternative verification policies when investigating the
externality effect, it might be worthwhile to examine how alternative verification institutions
influence consumers’ valuation of free run eggs.

85
REFERENCES
Adamowicz, W., J. Louviere, and M. Williams. 1994. “Combining stated and revealed preference
methods for valuing environmental amenities”. Journal of Environmental Economics and
Management 26:271–292.
Adamowicz W., J. Swait, P. Boxall, J. Louviere, and M. Williams. 1997. “Perceptions versus
objective measures of environmental quality in combined revealed and stated preference
models of environmental valuation”. Journal of Environmental Economics and
Management 32(1):65–84.
Adamowicz, W., P. Boxall, M. Williams, and J. Louviere. 1998. “Stated preference approaches
for measuring passive use values: choice experiments and contingent valuation”.
American Journal of Agricultural Economics 80(1):64–75.
Agriculture and Agri-Food Canada (AAFC). 2008. Consumer spending for the 52 weeks ending
ranging from December 24, 2005 to December 22, 2007. Available at
http://www4.agr.gc.ca/AAFC-AAC/display-afficher.do?id=1170951696766&lang=eng
(Accessed August 6, 2010).
Aguilar, F. X, and R. P. Vlosky. 2007. “Consumer willingness to pay price premiums for
environmentally certified wood products in the US”. Forest policy and Economics
9(8):1100–1112.
Angulo, A. M, and J. M. Gil. 2007. “Risk perception and consumer willingness to pay for
certified beef in Spain”. Food Quality and Preference 18(8):1106–1117.
Armah, P. W, and D. Kennedy. 2000. “Evaluating consumer perceptions and preferences for
pasture-raised pork in the Mississippi Delta of Arkansas”. Journal of Agribusiness
18(3):261–273.
Asselin, A. M. 2005. “Eggcentric behavior-consumer characteristics that demonstrate greater
willingness to pay for functionality”. American Journal of Agricultural Economics
87(5):1339–1344.
Baker, G. A, and T. A. Burnham. 2001. “Consumer response to genetically modified foods:
market segment analysis and implications for producers and policy makers”. Journal of
Agricultural and Resource Economics 26(2):387–403.
Baltzer, K. 2004. “Consumers’ willingness to pay for food quality – the case of eggs”. Food
Economics - Acta Agriculturae Scandinavica, Section C 1(2):78–90.
BC Egg Marketing Board. 2009. “BCEMB quota distribution policy for national and provincial
allocations”. Available at http://www.worldcat.org/title/bcemb-quota-distribution-policy-
for-national-and-provincial-allocations/oclc/593406018 (Accessed October 3, 2011).
BC Egg Marketing Board. 2010. “BCEMB 2010 quota distribution policy 10-03”. Available at
http://www.firb.gov.bc.ca/reports/eggs/10_aug_4_2010_quota_distribution_policy_exec_
86
summ.pdf (Accessed October 3, 2011).
Bejaei, M. 2009. “Attitudes and preferences of consumers/purchasers toward different types of
table eggs”. M.Sc. Thesis, University of British Columbia.
Bernard, D. J, and A. Mathios. 2005. “Factors affecting consumer choice and willingness to pay
for milk attributes”. Selected paper at the American Agricultural Economics Association
annual meeting, Providence, Rhode Island.
Boccaletti, S., and M. Nardellab. 2000. “Consumer willingness to pay for pesticide-free fresh
fruit and vegetables in Italy”. International Food and Agribusiness Management Review
3:297–310.
Bonti-Ankomah, S., and E. K. Yiridoe. 2006. “Organic and conventional food: a literature review
of the economics of consumer perceptions and preferences”. Final Report Submitted to
Organic Agriculture Centre of Canada, Nova Scotia Agricultural College.
Botonaki, A., K. Polymeros, E. Tsakiridou, and K. Mattas. 2006. “The role of food quality
certification on consumers’ food choices”. British Food Journal 108(2):77–90.
Boxall, P. C, W. L. Adamowicz, J. Swait, M. Williams, and J. Louviere. 1996. “A comparison of
stated preference methods for environmental valuation”. Ecological Economics
18(3):243–253.
Boxall, P. C, and W. L. Adamowicz. 2002. “Understanding heterogeneous preferences in random
utility models: a latent class approach”. Environmental and Resource Economics
23(4):421–446.
Brennan, C., K. Gallagher, and M. McEachern. 2003. “A review of the ‘consumer interest’ in
organic meat”. International Journal of Consumer Studies 27(5):381–394.
Brown, D. J, and L. F. Schrader. 1990. “Cholesterol information and shell egg consumption”.
American Journal of Agricultural Economics 72(3):548–555.
Campiche, J., R. B. Holcomb, and C. E. Ward. 2004. “Impacts of consumer characteristics and
perceptions on willingness to pay for natural beef in the southern plains”. Oklahoma
Agricultural Experiment Station publication P-1006.
Canadian Coalition for Farm Animals (CCFA). 2009. “Cage-free eggs: a comparison of labels”.
Available at http://www.humanefood.ca/pdf%20links/cage-free-eggs-new-logo-v4.pdf
(Accessed November 6, 2010).
Carlsson, F., and P. Martinsson. 2001. “Do hypothetical and actual marginal willingness to pay
differ in choice experiments?: application to the valuation of the environment”. Journal
of Environmental Economics and Management 41(2):179–192.
Carlsson, F., P. Frykblom, and C. Liljenstolpe. 2003. “Valuing wetland attributes: an application
of choice experiments”. Ecological Economics 47(1):95–103.

87
Caswell, J. A. 1998. “How labeling of safety and process attributes affects markets for food”.
Agricultural and Resource Economics Review 27:151–158.
Caswell, J. A. 2001. “Analyzing quality and quality assurance (including labelling) for GMOs”.
AgBioForum 3(4):225–230.
Caswell, J. A, C. M. Noelke, and E. M. Mojduszka. 2002. “Unifying two frameworks for
analyzing quality and quality assurance for food products”. Global food trade and
consumer demand for quality, ed. Barry Krissoff, Mary Bohman, and Julie A. Caswell,
pp. 43-61. New York, NY: Kluwer Academic/Plenum Publishers.
Champ, P. A, and R. C. Bishop. 2001. “Donation payment mechanisms and contingent valuation:
an empirical study of hypothetical bias”. Environmental and Resource Economics
19(4):383–402.
Chang, J. B, J. L. Lusk, and F. B. Norwood. 2010. “The price of happy hens: a hedonic analysis
of retail egg prices”. Journal of Agricultural and Resource Economics 35(3):406–423.
Costell, E., A. Tárrega, and S. Bayarri. 2009. “Food acceptance: the role of consumer perception
and attitudes”. Chemosensory Perception 3(1):42–50.
Cranfield, J. A. L, and S. Henson. 2009. “WTP for enhanced animal welfare food products-
evidence from Canada using free-run and free-range eggs”. Department of Food,
Agricultural and Resource Economics, University of Guelph.
Darby, M. R, and E. Karni. 1973. “Free competition and the optimal amount of fraud”. Journal
of Law and Economics 16(1):67–88.
De Jonge, J., H. Van Trijp, R. J. Renes, and L. J. Frewer. 2007. “Understanding consumer
confidence in the safety of food: its two-dimensional structure and determinants”. Risk
Analysis 27(3):729–740.
De Jonge, J., J. C. M. Van Trijp, I. A. Van Der Lans, R. J. Renes, and L. J. Frewer. 2008. “How
trust in institutions and organizations builds general consumer confidence in the safety of
food: A decomposition of effects”. Appetite 51(2):311–317.
Dentoni, D., G. T. Tonsor, R. J. Calantone, and H. C. Peterson. 2009. “The direct and indirect
effects of ‘locally grown’ on consumers’ attitudes towards agri-food products”.
Agricultural and Resource Economics Review 38(3):384–396.
Egg Farmers of Canada (EFC). 2008. “Annual Report 2008”. Available at
http://eggs.ca/resources/MediaRoom/Reports/1527E_Egg_Farmers_of_Canada_Annual_
Report_2008.pdf (Accessed October 3, 2011).
Egg Farmers of Canada (EFC). 2009. “Egg-so many choice”. Available at
http://www.eggs.ca/resources/Eggs_So_Many_Choices2009.pdf (Accessed April 6,
2011).
88
Egg Farmers of Canada (EFC). 2010. “Dedicated to quality”. Available at
http://www.eggs.ca/resources/MediaRoom/Publications/87566_English.pdf (Accessed
March 24, 2011).
Eng, M. 2009. “USDA guide of definitions SFlbhelps crack the mystery surrounding egg labels”.
Available at http://www.vindy.com/news/2009/dec/30/usda-guide-of-definitionssflbhelps-
crack-the/?print (Accessed September 16, 2011).
Espejel, J., C. Fandos, and C. Flavián. 2007. “The role of intrinsic and extrinsic quality attributes
on consumer behaviour for traditional food products”. Managing Service Quality
17(6):681–701.
Fearne, A., and D. Lavelle. 1996. “Perceptions of food ‘quality’ and the power of marketing
communication: results of consumer research on a branded-egg concept”. Journal of
Product & Brand Management 5(2):29–42.
Gao, Z. F, and T. C. Schroeder. 2009. “Effects of label information on consumer willingness-to-
pay for food attributes”. American Journal of Agricultural Economics 91(3):795–809.
Gellynck, X., W. Verbeke, and B. Vermeire. 2006. “Pathways to increase consumer trust in meat
as a safe and wholesome food”. Meat Science 74(1):161–171.
Gerken. 2010. “What kind of eggs should I buy?”. Available at
http://www.fyiliving.com/diet/nutrition/what-kind-of-eggs-should-i-buy/ (Accessed
October 1, 2010).
Goddard, E. W, P. C. Boxall, J. P. Emunu, C. Boyd, A. Asselin and A. Neall. 2007. “Consumer
attitudes, willingness to pay and revealed preferences for different egg production
attributes: analysis of Canadian egg consumers”. Project Report #07-03, Department of
Rural Economy, University of Alberta.
Greene, W. H. 2003. Econometric Analysis, 5th Edition, Prentice Hall, New Jersey, US.
Grolleau, G., and J. A. Caswell. 2005. “Interaction between food attributes in markets: the case
of environmental labeling”. Working paper, Department of Resource Economics,
University of Massachusetts.
Grunert, K. G. 2005. “Food quality and safety: consumer perception and demand”. European
Review of Agricultural Economics 32(3):369–391.
Hailu, G., and E. Goddard. 2004. “Nutrition and health: structural analysis of egg consumption in
Canada”. American Agricultural Economics Association Annual meeting, August 1-4,
Denver, CO, USA.
Hanley, N., R. E. Wright, and V. Adamowicz. 1998. “Using choice experiments to value the
environment”. Environmental and resource economics 11(3-4):413–428.
Harper, G., and S. Henson. 2001. “Consumer concerns about animal welfare and the impact on

89
food choice”. Final Report EU Fair CT98-3678, Centre for Food Economics Research,
University of Reading.
Harper, G. C, and A. Makatouni. 2002. “Consumer perception of organic food production and
farm animal welfare”. British Food Journal 104(3/4/5):287–299.
Hatirli, S. A, B. Ozkan, and A. R. Aktas. 2004. “Factors affecting fluid milk purchasing sources
in Turkey”. Food Quality and Preference 15(6):509–515.
Heiman, A., D. R. Just, and D. Zilberman. 2000. “The role of socioeconomic factors and lifestyle
variables in attitude and the demand for genetically modified foods”. Journal of
Agribusiness 18(3):249–260.
Hensher, D. A, and M. Bradley. 1993. “Using stated response choice data to enrich revealed
preference discrete choice models”. Marketing Letters 4(2):139–151.
Hensher, D. A, J. Louviere, and J. Swait. 1999. “Combining sources of preference data”.
Journal of Econometrics 89(1–2):197–221.
Hensher, D. A. 2001. “The valuation of commuter travel time savings for car drivers: evaluating
alternative model specifications”. Transportation 28(2):101–118.
Hensher, D. A, J. M. Rose, and W. H. Greene. 2005. Applied choice analysis: a primer.
Cambridge University Press, Cambridge, UK.
Hu, F. B, M. J. Stampfer, E. B. Rimm, J. E. Manson, A. Ascherio, G. A. Colditz, B. A. Rosner, D.
Spiegelman, F. E. Speizer, F. M. Sacks, C. H. Hennekens and W. C. Willett. 1999. “A
prospective study of egg consumption and risk of cardiovascular disease in men and
women”. Journal of American Medical Association 218(15):1387–1394.
Humane Society of the United States (HSUS). 2010. “Egg cartons labels: a brief guide to labels
and animal welfare”. Available at
http://www.humanesociety.org/issues/confinement_farm/facts/guide_egg_labels.html.
(Accessed September 30, 2011).
Huang, C. L, K. Kan, and T-T. Fu. 1999. “Consumer willingness-to-pay for food safety in
Taiwan: a binary-ordinal probit model of analysis”. Journal of Consumer Affairs
33(1):76–91.
Innes, B.G, and J. E. Hobbs. 2011. “Does it matter who verifies production derived quality? ”.
Canadian Journal of Agricultural Economics 59(1):87–107.
James, S., and M. Burton. 2003. “Consumer preferences for GM food and other attributes of the
food system”. Australian Journal of Agricultural and Resource Economics 47(4):501–
518.
Karipidis, P., E. Taskiridou, N. Tabakis, and K. Mattas. 2005. “Hedonic analysis of retail egg
prices”. Journal of Food Distribution Research 36(3):68–73.
90
Katz D. L, M. A. Evans, H. Nawaz, V. Y. Njike, W. Chan, B. P. Comerford, and M. L. Hoxley.
2005. “Egg consumption and endothelial function: A randomized controlled crossover
trial”. International Journal of Cardiology 99(1):65–40.
Kozak, R. A, D. H. Cohen, J. Lerner, and G. Q. Bull. 2004. “Western Canadian consumer
attitudes towards certified value-added wood products: an exploratory assessment”.
Forest Products Journal 54(9):21–24.
Kuhfeld W. F. 2010. Marketing Research Methods in SAS: Experimental Design, Choice
Conjoint, and Graphical Techniques. SAS 9.2 Edition, MR-2010. Available at
http://support.sas.com/techsup/technote/mr2010.pdf (Accessed February 18, 2011).
Lancaster, K. J. 1966. “A new approach to consumer theory”. Journal of Political Economy
74(2):132–157.
Largerkvist, C. J, F. Carlsson, and D. Viske. 2006. “Swedish consumer preferences for animal
welfare and biotech: a choice experiment”. AgBioForum 9(1):51–58.
Li, Q., K. R. Curtis, J. J. McCluskey, and T. I. Wahl. 2003. “Consumer attitudes toward
genetically modified foods in Beijing, China”. AgBioForum 5(4):145–152.
Loureiro, M. L, and J. J. McCluskey. 2000. “Assessing consumer response to protected
geographical identification labeling”. Agribusiness 16(3):309–320.
Louviere, J. J, D. A. Hensher, and J. D. Swait. 2000. Stated choice methods: analysis and
applications. Cambridge University Press, Cambridge, UK.
Loureiro, M. L, and W. J. Umberger. 2007. “A choice experiment model for beef: what US
consumer responses tell us about relative preferences for food safety, country-of-origin
labeling and traceability”. Food Policy 32(4):496–514.
Lusk, J. L. 2003. “Effects of cheap talk on willingness to pay for golden rice”. American Journal
of Agricultural Economics 85(4):840–856.
Lusk, J. L, and T. C. Schroeder. 2004. “Are choice experiments incentive compatible? a test with
quality differentiated beef steaks”. American Journal of Agricultural Economics
86(2):467–482.
McFadden, D. 1974. “Conditional Logit Analysis of Qualitative Choice Behaviour”. in P.
Zarembka, ed., Frontiers in Econometrics, New York: Academic Press.
McFadden, D., and K. Train. 2000. “Mixed MNL models for discrete response”. Journal of
applied econometrics 15(5):447–470.
Moon, W., and S. K. Balasubramanian. 2003. “Willingness to pay for non-biotech foods in the
U.S. and U.K.”. Journal of Consumer Affairs 37(2):317–339.
Mtimet N., and L. M. Albisu. 2006. “Spanish wine consumer behaviour: a choice experiment
91
approach”. Agribusiness 22(3):343–362.
Nelson, P. 1970. “Information and consumer behavior”. Journal of Political Economy 78(2):311–
329.
Ness, M. R, and H. Gerhardy. 1994. “Consumer preferences for quality and freshness attributes
of eggs”. British Food Journal 96(3):26–34.
Olsen, S. B. 2009. “Choosing between internet and mail survey modes for choice experiment
surveys considering non-market goods”. Environmental and Resource Economics
44(4):591–610.
Olynk, N. J, G. T. Tonsor, and C. A. Wolf. 2010. “Consumer willingness to pay for livestock
credence attribute claim verification”. Journal of Agricultural and Resource Economics
35(2):261–280.
Phan-Huy, S. A, and R. B. Fawaz. 2003. “Swiss market for meat from animal-friendly
production–responses of public and private actors in Switzerland”. Journal of
Agricultural and Environmental Ethics 16(2):119–136.
Poppe, C., and U. Kjaernes. 2003. “Trust in food in Europe: a comparative analysis”. Profession
Report No.5, The National Institute for Consumer Research, Oslo.
Probst, L., L. Aigelsperger, and M. Hauser. 2010. “Consumer attitudes towards vegetable
attributes: potential buyers of pesticide-free vegetables in Accra and Kumasi, Ghana”.
Ecology of Food and Nutrition 49(3):228–245.
Revelt, D., and K. Train. 1998. “Mixed logit with repeated choices: households’ choices of
appliance efficiency level”. Review of Economics and Statistics 80(4):647–657.
Romanowska, P. E. 2009. “Consumer preferences and willingness to pay for certification of
eggs”. M.Sc. Thesis, Department of Rural Economy, University of Alberta.
Schmit, T. M, and H. M. Kaiser. 1998. “Egg advertising, dietary cholesterol concerns, and US
consumer demand”. Agricultural and resource economics review 27(1):43–52.
Schroder, M. J. A, and M. G. McEachern. 2004. “Consumer value conflicts surrounding ethical
food purchase decisions: a focus on animal welfare”. International Journal of Consumer
Studies 28(2):168–177.
Sim, J. S, and H. H. Sunwoo. 2000. “Designer eggs: nutritional and functional significance”.
Department of Agricultural, Food and Nutritional Science, University of Alberta.
Available at: http://animalscience.ucdavis.edu/Avian/sim.pdf. (Accessed March 24,
2011).
Statistics Canada. 2006. Available at http://www12.statcan.ca/census-recensement/2006/index-
eng.cfm (Accessed April 20, 2011).
92
Statistics Canada. 2009. “Canadian Internet Use Survey”. Available at
http://www.statcan.gc.ca/daily-quotidien/100510/dq100510a-eng.htm (Accessed March
20, 2011).
Statistics Canada. 2010. Disposition of eggs, sold for consumption (dozens). E-STAT, CANSIM,
v25653426, restricted data.
Swait, J., and J. Louviere. 1993. “The role of the scale parameter in the estimation and
comparison of multinomial logit models”. Journal of Marketing Research 30(3):305–314.
Thompson, G. D. 1998. “Consumer demand for organic foods: what we know and what we need
to know”. American Journal of Agricultural Economics 80(5):1113–1118.
Tonsor, G. T, N. Olynk, and C. Wolf. 2009. “Consumer preferences for animal welfare attributes:
the case of gestation crates.” Journal of Agricultural and Applied Economics 41(3):713–
730.
Train, K. E. 1998. “Recreation demand models with taste differences over people”. Land
economics 74(2):230–239.
Train, K. 2003. Discrete choice methods with simulation. Cambridge University Press,
Cambridge, UK.
Ubilava, D., and K. Foster. 2009. “Quality certification vs. product traceability: consumer
preferences for informational attributes of pork in Georgia”. Food Policy 34(3):305–310.
Umberger, W. J, D. M. Feuz, C. R. Calkins, and B. M. Sitz. 2003. “Country-of-origin labeling of
beef products: US consumers’ perceptions”. Journal of Food Distribution Research
34(3):103–116.
Uzea, A. D, J. E. Hobbs, and J. Zhang. 2011. “Activists and animal welfare: quality verifications
in the Canadian pork sector”. Journal of Agricultural Economics 62(2):281–304.
Vancouver Humane Society (VHS). 2009. “Key Findings: Harris/Decima 2009 Omnibus Poll of
2012 Canadians”. Available at
http://www.choosecagefree.ca/Resources/VHS%20Poll%20Exec%20Summary%20Resul
ts%20-%201%20pager%20(3).pdf (Accessed October 4, 2011).
Verbeke, W. 2005. “Consumer acceptance of functional foods: socio-demographic, cognitive and
attitudinal determinants”. Food quality and preference 16(1):45–57.
Verified Eggs Canada Inc. 2008. “Specialty eggs and supply management”. Available at
http://www.humanefood.ca/pdf%20links/Supply_management_letter.pdf (Accessed
October 3, 2011).
Wallston, K. A, B. S. Wallston, and R. DeVellis. 1978. “Development of the Multidimensional
Health Locus of Control (MHLC) scales”. Health Education & Behavior 6(1):160–170.

93
Weber, E. U, A. R. Blais, and N. E. Betz. 2002. “A domain-specific risk-attitude scale: measuring
risk perceptions and risk behaviors”. Journal of Behavioral Decision Making 15(4):263–
290.
Wessells, C. R, R. J. Johnston, and H. Donath. 1999. “Assessing consumer preferences for
ecolabeled seafood: the influence of species, certifier, and household attributes”.
American Journal of Agricultural Economics 81(5):1084–1089.
World Society for the Protection of Animals (WSPA), the Canadian Coalition for Farm Animals
(CCFA). 2005. “Decima poll for WSPA and CCFA: Canadians want more humane eggs
and pork in grocery stores and fast-food restaurants”. Available at
http://www.choosecagefree.ca/Resources/release%20ccfa%20wspa%20poll%20results%
20FINAL.pdf (Accessed October 3, 2011).
World Society for the Protection of Animals (WSPA). 2008. “Harris/Decima Poll for WSPA–
Farm Animal Welfare”. Available at
http://www.choosecagefree.ca/Resources/WSPA%20-
%20Farm%20Animal%20Welfare%20Executive%20Summary%20-%20Jan%2028.pdf
(Accessed October 4, 2011).
94
APPENDIX
Egg Survey
You are invited to participate in a research study related to egg consumption. The
survey will take approximately 20-30 minutes to complete. By participating in this study
you may help us gain a greater understanding of issues surrounding egg consumption.
The research involves a web-based online survey about the choices you make
when purchasing eggs. Your participation is voluntary and you are free to withdraw from
the survey at any time. Should you do so, the questions that you have answered prior to
your withdrawal will be completely deleted. All responses to this questionnaire are
anonymous; the researchers will not be able to identify you in any way with your
answers. There is no risk to participating in this survey since no results will be identified
at the individual level.
If you are interested in learning more about this study, please contact the
researchers Dr. Jing Zhang or Liou Huang using the contact information below. This
study was approved by the Behavioural Research Ethics Board at the University of
Saskatchewan on September 14, 2010. For more details on this you may contact the
University of Saskatchewan Research Ethics office at (306) 966-2975. Thank you for
considering this request, your participation is invaluable to the research process.
Researchers:
Jing Zhang
Assistant Professor, Department of Bioresource Policy, Business and Economics
University of Saskatchewan
Phone: (306) 966-1981
Fax: (306) 966-8413
Email: [email protected]
Liou Huang
M.Sc. student, Department of Bioresource Policy, Business and Economics
University of Saskatchewan
Phone: (306) 966-8721
Email:[email protected]

95
Consent to Participate:
I have read and understood the description provided above. I consent to participate in the
study, understanding that I may withdraw my consent at any time while completing the
online survey.
Yes, start the survey
No, decline the survey
Have you personally purchased eggs for your household to eat at home in the past six
months?
Yes
No
Please select the region you live in.
Maritimes
Ontario
Manitoba/Saskatchewan
Alberta
British Columbia

96
Canadian Consumer Egg Consumption Survey
This survey has two sections. You will be first asked to complete some choice
tasks and then you will be asked to answer a series of questions related to egg
consumption.
Section I
In this section, we would appreciate it if you would complete the following
choice-related tasks. In each choice-related task, you will be asked to choose your most
preferred carton containing 1 dozen (12) eggs from a choice of three cartons of Canada
Grade A large eggs. Alternative cartons of eggs may vary in their shell colour, the way
hens are housed and raised, the type of feed fed to the hens, whether a pasteurization
process is applied, and price. Although many of the questions may look similar, your
answers are helping us in our research.

97
Detailed information about the different options in the choice task is provided
below.
Version 1:
Shell colour
Eggs have either brown or white shell colours.
Production method
Conventional battery cages: hens are kept in conventional battery cages.
Free run: hens are able to move about the floor of the barn and have
access to nesting boxes and, quite often, perches.
Organic: hens must be raised by certified organic production methods
from birth. The hens are required to have outdoor access year round. All feed
must be certified organic as well. No antibiotics or animal by-products are
allowed in the feed.
Feed
Regular feed: a diet that is widely used in the current poultry industry in
Canada. It must not contain ingredients that can cause illness or suffering in
hens, but may contain animal proteins or by-products as a protein source.
Omega-3 enhanced feed: a diet that contains 10 to 20 per cent flaxseed.
As a result, the eggs produced will contain higher levels of omega-3
polyunsaturated fatty acids than eggs of hens that are fed regular feed.
Vitamin-enhanced feed: a nutritionally-enhanced diet containing higher
levels of certain nutrients (e.g., vitamin E, folate, vitamin B6 and vitamin B12).
As a result, the eggs produced will contain higher levels of these nutrients than
eggs of hens that are fed regular feed.
Pasteurization
In-shell pasteurized eggs use a patented, all-natural pasteurization process
to eliminate bacteria without cooking the eggs. Currently, eggs sold in Canada
are not pasteurized.
Some eggs in this study are not pasteurized, while some eggs are
pasteurized.
Nutritional value of a Canadian Grade A large egg:
Regular eggs are produced using conventional battery caged methods.
The nutritional value of a regular Canadian Grade A large egg (53 g) is shown
below. Free-run and organic eggs have the same nutritional value as regular eggs
unless the feed is enhanced with higher levels of flaxseed or vitamins.

98

99
1.1 During a typical shopping trip to the grocery store where you purchase eggs, if the
following options were the only ones available (1 dozen carton of Canadian Grade A
large eggs), which option would you purchase?
Detailed info
Option A Option B Option C Option D
Shell colour White Brown White
I wouldn’t
buy any
Production
method Free run
Conventional
Battery cage
Conventional
Battery cage
Feed Regular feed Omega-3
enhanced feed Regular feed
Pasteurization Not Pasteurized Pasteurized Not Pasteurized
Price $3.43 $2.15 $2.15
I choose Option A Option B Option C Option D
1.2 How certain or confident are you about the decision you made? Please rate your
confidence using a scale from 1 to 10. For example, “10” means you are 100% percent
sure that the one you chose is your most preferred option, while “1”means you are not
sure about the decision your made.
No
confidence
at all
Complete
confidence
1 2 3 4 5 6 7 8 9 10

100
2.1 During a typical shopping trip to the grocery store where you purchase eggs, if the
following options were the only ones available (1 dozen carton of Canadian Grade A
large eggs), which option would you purchase?
Detailed info
Option A Option B Option C Option D
Shell colour Brown White White
I wouldn’t
buy any
Production
method
Conventional
Battery cage Free run
Conventional
Battery cage
Feed Vitamin-
enhanced feed Regular feed Regular feed
Pasteurization Pasteurized Not Pasteurized Not Pasteurized
Price $2.15 $5.99 $2.15
I choose Option A Option B Option C Option D
2.2 How certain or confident are you about the decision you made? Please rate your
confidence using a scale from 1 to 10. For example, “10” means you are 100% percent
sure that the one you chose is your most preferred option, while “1”means you are not
sure about the decision your made.
No
confidence
at all
Complete
confidence
1 2 3 4 5 6 7 8 9 10
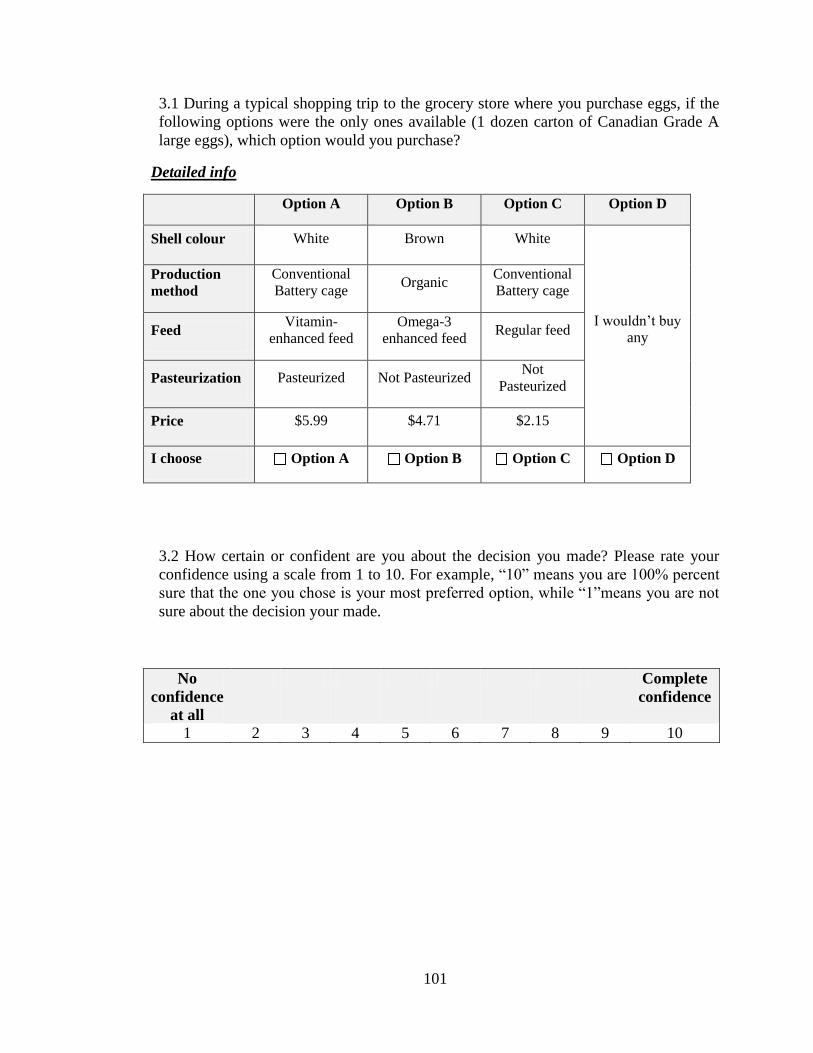
101
3.1 During a typical shopping trip to the grocery store where you purchase eggs, if the
following options were the only ones available (1 dozen carton of Canadian Grade A
large eggs), which option would you purchase?
Detailed info
Option A Option B Option C Option D
Shell colour White Brown White
I wouldn’t buy
any
Production
method
Conventional
Battery cage Organic
Conventional
Battery cage
Feed Vitamin-
enhanced feed
Omega-3
enhanced feed Regular feed
Pasteurization Pasteurized Not Pasteurized Not
Pasteurized
Price $5.99 $4.71 $2.15
I choose Option A Option B Option C Option D
3.2 How certain or confident are you about the decision you made? Please rate your
confidence using a scale from 1 to 10. For example, “10” means you are 100% percent
sure that the one you chose is your most preferred option, while “1”means you are not
sure about the decision your made.
No
confidence
at all
Complete
confidence
1 2 3 4 5 6 7 8 9 10
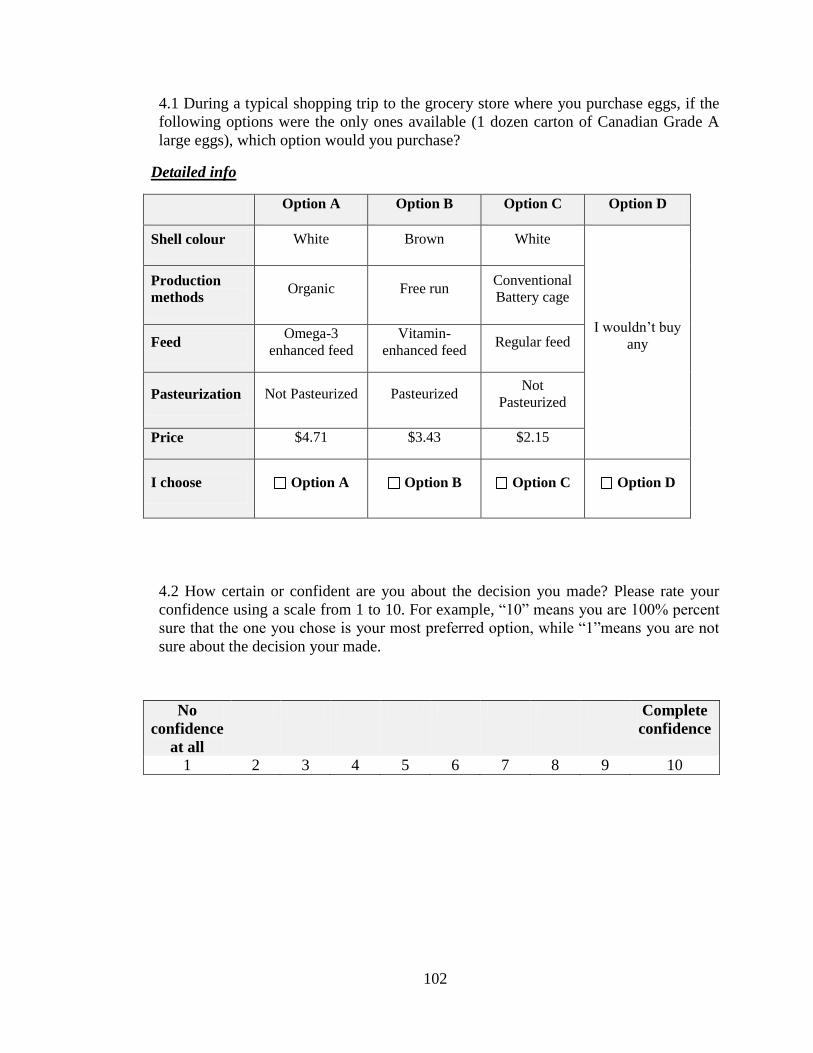
102
4.1 During a typical shopping trip to the grocery store where you purchase eggs, if the
following options were the only ones available (1 dozen carton of Canadian Grade A
large eggs), which option would you purchase?
Detailed info
Option A Option B Option C Option D
Shell colour White Brown White
I wouldn’t buy
any
Production
methods Organic Free run
Conventional
Battery cage
Feed Omega-3
enhanced feed
Vitamin-
enhanced feed Regular feed
Pasteurization Not Pasteurized Pasteurized Not
Pasteurized
Price $4.71 $3.43 $2.15
I choose Option A Option B Option C Option D
4.2 How certain or confident are you about the decision you made? Please rate your
confidence using a scale from 1 to 10. For example, “10” means you are 100% percent
sure that the one you chose is your most preferred option, while “1”means you are not
sure about the decision your made.
No
confidence
at all
Complete
confidence
1 2 3 4 5 6 7 8 9 10

103
5 Recall how you made the above choices; please indicate how well the following
descriptions match your decision strategy.
Strongly
disagree
Disagree Neither
agree,
nor
disagree
Agree Strongly
agree
1 2 3 4 5
a) I was looking for the best
deal for my money.
b) I always buy regular eggs
(battery caged produced eggs) no
matter what.
c) I didn’t buy any pasteurized
eggs because I have not had them
before.
d) I don’t care how the hens
were housed.
e) I don’t care what the hens
were fed.
f) I am more likely to buy
verified free run eggs or organic
eggs because of the quality
assurance guaranteed by the
verification or certification
process.

104
Version 2:
Shell colour
Eggs have either brown or white shell colours.
Production method
Conventional battery cages: hens are kept in conventional battery cages.
Free run: hens are able to move about the floor of the barn and have
access to nesting boxes and, quite often, perches. Housing systems for free-run
are not audited or third-party verified.
Verified free run: hens are able to move about the floor of the barn and
have access to nesting boxes and, quite often, perches. A third party auditor
verifies the process.
Organic: hens must be raised by certified organic production methods
from birth. The hens are required to have outdoor access year round. All feed
must be certified organic as well. No antibiotics or animal by-products are
allowed in the feed. Organic eggs are subject to a third party audit or verification.
Feed
Regular feed: a diet that is widely used in the current poultry industry in
Canada. It must not contain ingredients that can cause illness or suffering in
hens, but may contain animal proteins or by-products as a protein source.
Omega-3 enhanced feed: a diet that contains 10 to 20 per cent flaxseed.
As a result, the eggs produced will contain higher levels of omega-3
polyunsaturated fatty acids than eggs of hens that are fed regular feed.
Vitamin-enhanced feed: a nutritionally-enhanced diet containing higher
levels of certain nutrients (e.g., vitamin E, folate, vitamin B6 and vitamin B12).
As a result, the eggs produced will contain higher levels of these nutrients than
eggs of hens that are fed regular feed.
Pasteurization
In-shell pasteurized eggs use a patented, all-natural pasteurization process
to eliminate bacteria without cooking the eggs. Currently, eggs sold in Canada
are not pasteurized.
Some eggs in this study are not pasteurized, while some eggs are
pasteurized.
Nutritional value of a Canadian Grade A large egg:
Regular eggs are produced using conventional battery caged methods.
The nutritional value of a regular Canadian Grade A large egg (53 g) is shown

105
below. Free-run and organic eggs have the same nutritional value as regular eggs
unless the feed is enhanced with higher levels of flaxseed or vitamins.

106
1.1 During a typical shopping trip to the grocery store where you purchase eggs, if the
following options were the only ones available (1 dozen carton of Canadian Grade A
large eggs), which option would you purchase?
Detailed info
Option A Option B Option C Option D
Shell colour White Brown White
I wouldn’t buy
any
Production
method Organic Free run
Conventional
Battery cage
Feed Omega-3
enhanced feed Regular feed Regular feed
Pasteurization Not
Pasteurized Pasteurized
Not
Pasteurized
Price $2.15 $4.71 $2.15
I choose Option A Option B Option C Option D
1.2 How certain or confident are you about the decision you made? Please rate your
confidence using a scale from 1 to 10. For example, “10” means you are 100% percent
sure that the one you chose is your most preferred option, while “1”means you are not
sure about the decision your made.
No
confidence
at all
Complete
confidence
1 2 3 4 5 6 7 8 9 10

107
2.1 During a typical shopping trip to the grocery store where you purchase eggs, if the
following options were the only ones available (1 dozen carton of Canadian Grade A
large eggs), which option would you purchase?
Detailed info
Option A Option B Option C Option D
Shell colour Brown White White
I wouldn’t buy
any
Production
method Free run
Conventional
Battery cage
Conventional
Battery cage
Feed Regular feed Omega-3
enhanced feed Regular feed
Pasteurization Pasteurized Not Pasteurized Not
Pasteurized
Price $4.71 $2.15 $2.15
I choose Option A Option B Option C Option D
2.2 How certain or confident are you about the decision you made? Please rate your
confidence using a scale from 1 to 10. For example, “10” means you are 100% percent
sure that the one you chose is your most preferred option, while “1”means you are not
sure about the decision your made.
No
confidence
at all
Complete
confidence
1 2 3 4 5 6 7 8 9 10
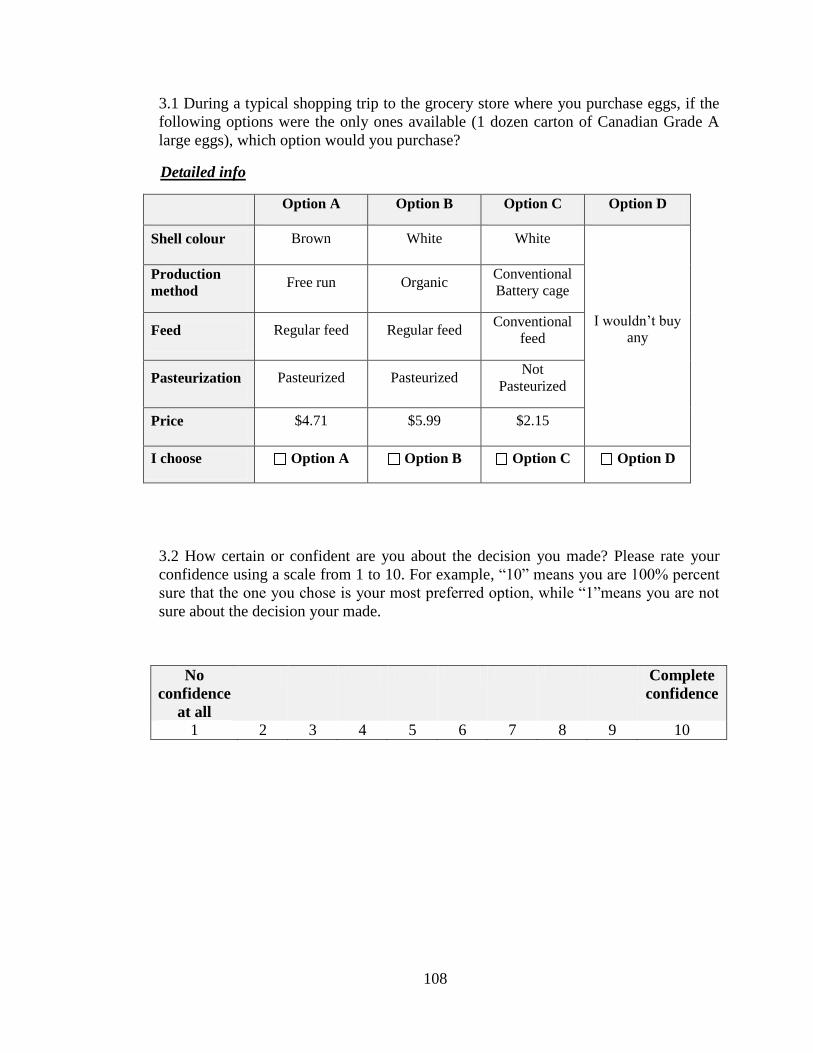
108
3.1 During a typical shopping trip to the grocery store where you purchase eggs, if the
following options were the only ones available (1 dozen carton of Canadian Grade A
large eggs), which option would you purchase?
Detailed info
Option A Option B Option C Option D
Shell colour Brown White White
I wouldn’t buy
any
Production
method Free run Organic
Conventional
Battery cage
Feed Regular feed Regular feed Conventional
feed
Pasteurization Pasteurized Pasteurized Not
Pasteurized
Price $4.71 $5.99 $2.15
I choose Option A Option B Option C Option D
3.2 How certain or confident are you about the decision you made? Please rate your
confidence using a scale from 1 to 10. For example, “10” means you are 100% percent
sure that the one you chose is your most preferred option, while “1”means you are not
sure about the decision your made.
No
confidence
at all
Complete
confidence
1 2 3 4 5 6 7 8 9 10

109
4.1 During a typical shopping trip to the grocery store where you purchase eggs, if the
following options were the only ones available (1 dozen carton of Canadian Grade A
large eggs), which option would you purchase?
Detailed info
Option A Option B Option C Option D
Shell colour White Brown White
I wouldn’t buy
any
Production
methods Organic Verified free run
Conventional
Battery cage
Feed Regular feed Omega-3
enhanced feed Regular feed
Pasteurization Not Pasteurized Pasteurized Not
Pasteurized
Price $3.43 $5.99 $2.15
I choose Option A Option B Option C Option D
4.2 How certain or confident are you about the decision you made? Please rate your
confidence using a scale from 1 to 10. For example, “10” means you are 100% percent
sure that the one you chose is your most preferred option, while “1”means you are not
sure about the decision your made.
No
confidence
at all
Complete
confidence
1 2 3 4 5 6 7 8 9 10

110
5 Recall how you made the above choices; please indicate how well the following
descriptions match your decision strategy.
Strongly
disagree
Disagree Neither
agree,
nor
disagree
Agree Strongly
agree
1 2 3 4 5
a) I was looking for the best
deal for my money.
b) I always buy regular eggs
(battery caged produced eggs) no
matter what.
c) I didn’t buy any pasteurized
eggs because I have not had them
before.
d) I don’t care how the hens
were housed.
e) I don’t care what the hens
were fed.
f) I am more likely to buy
verified free run eggs or organic
eggs because of the quality
assurance guaranteed by the
verification or certification
process.

111
Section II
Please answer the following questions to the best of your knowledge.
1. How often did you purchase eggs in the past six months? (Check One)
1. Less often than once every six months
2. Less than once a month but more than once every six
months 3. About 1-2 times per month
4. About once per week
5. More than once per week
2. Where do you usually buy eggs?
Never Occasionally Regularly
1 2 3
Supermarkets/Grocery store
Farmers’ market
Other (specify)
3. What is the package size of eggs you most frequently purchase? (Check One
Only)
1. 6 egg carton (half a dozen)
2. 12 egg carton (1 dozen)
3. 18 egg carton (1.5 dozen)
4. Egg tray that holds about 20 to 30 eggs
5. Other:_____________

112
4. To the best of your knowledge, how much do you usually pay per package of
eggs for the most common package type that you purchase? (Check one)
1. $1.00 - $1.99
2. $2.00 - $2.99
3. $3.00 - $3.99
4. $4.00 - $4.99
5. $5.00 - $5.99
6. $6.00 or more
7. Don’t know
5. To the best of your knowledge, what colour of eggs do you normally buy?
(Check one)
1. White
2. Brown
3. Both (about half-half)
4. Don’t know
6. What type of eggs do you normally buy? (Check all that apply)
1. Regular eggs
2. Omega-3 enhanced eggs
3. Free run eggs
4. Organic eggs
5. Vitamin-enhanced eggs
6. Other eggs

113
6a. [If more than one selected in Q6] What type of eggs do you buy most often?
1. Regular eggs
2. Omega-3 enhanced eggs
3. Free run eggs
4. Organic eggs
5. Vitamin-enhanced eggs
6. Other eggs
7. Please indicate to what extent you agree/disagree with the following statements.
Strongly
disagree
Disagree Neither
agree,
nor
disagree
Agree Strongly
agree
1 2 3 4 5
a) Generally, food products are
safe.
b) I am satisfied with the safety
of food products.
c) I am suspicious about certain
food products as a result of the
occurrence of food safety
incidents (e.g., Ecoli or
Salmonella contaminated food).
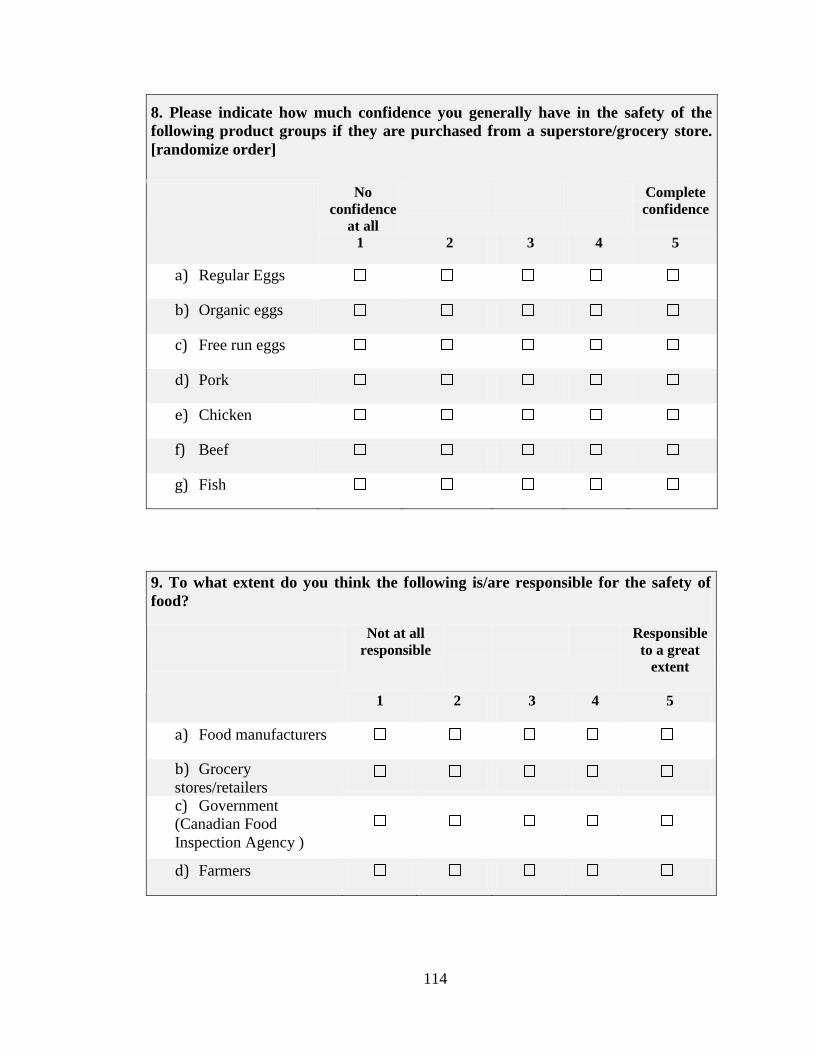
114
8. Please indicate how much confidence you generally have in the safety of the
following product groups if they are purchased from a superstore/grocery store.
[randomize order]
No
confidence
at all
Complete
confidence
1 2 3 4 5
a) Regular Eggs
b) Organic eggs
c) Free run eggs
d) Pork
e) Chicken
f) Beef
g) Fish
9. To what extent do you think the following is/are responsible for the safety of
food?
Not at all
responsible
Responsible
to a great
extent
1 2 3 4 5
a) Food manufacturers
b) Grocery
stores/retailers
c) Government
(Canadian Food
Inspection Agency )
d) Farmers

115
10. Imagine that there is a food safety scandal concerning egg production in
Canada. To what extent do you think the following is/are most likely to be
responsible for the incident?
Very
unlikely
Somewhat
unlikely
Neutral
Somewhat
likely
Very
likely
1 2 3 4 5
a) Food manufacturers
b) Grocery
stores/retailers
c) Government
(Canadian Food
Inspection Agency )
d) Farmers
11. To what extent do you agree or disagree with the following statements?
Strongly
disagree
Disagree Neither
agree,
nor
disagree
Agree Strongly
agree
1 2 3 4 5
a) When eating eggs, I
am exposed to little risk.
b) For me, eating eggs is
worth the risk.
c) A serving of one or
two eggs per day is part
of a healthy eating
pattern.
d) I think eating eggs on
a daily basis may expose
me to a higher risk of
heart disease.
e) I eat fewer eggs due
to a concern about my
cholesterol level.
f) I eat fewer eggs than
I did a few years ago.
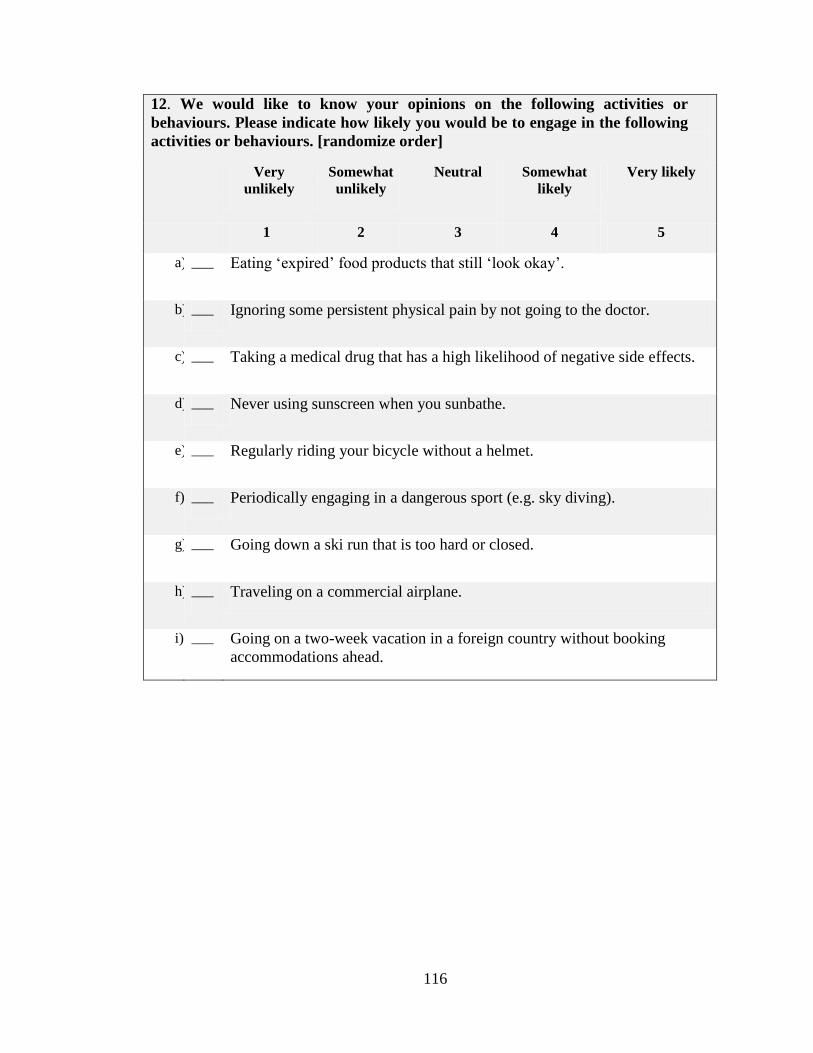
116
12. We would like to know your opinions on the following activities or
behaviours. Please indicate how likely you would be to engage in the following
activities or behaviours. [randomize order]
Very
unlikely
Somewhat
unlikely
Neutral
Somewhat
likely
Very likely
1 2 3 4 5
a) ___ Eating ‘expired’ food products that still ‘look okay’.
b) ___ Ignoring some persistent physical pain by not going to the doctor.
c) ___ Taking a medical drug that has a high likelihood of negative side effects.
d) ___ Never using sunscreen when you sunbathe.
e) ___ Regularly riding your bicycle without a helmet.
f) ___ Periodically engaging in a dangerous sport (e.g. sky diving).
g) ___ Going down a ski run that is too hard or closed.
h) ___ Traveling on a commercial airplane.
i) ___ Going on a two-week vacation in a foreign country without booking
accommodations ahead.

117
13. Please rate your knowledge of the production method and nutritional
information of the following types of eggs.
Know
nothing
Know a
lot
1 2 3 4 5
a) Regular eggs
b) Free run eggs
c) Pasteurized eggs
d) Organic eggs
e) Omega-3
enhanced eggs
f) Vitamin-enhanced
eggs
g) Eggs from hens
fed only vegetarian
feed
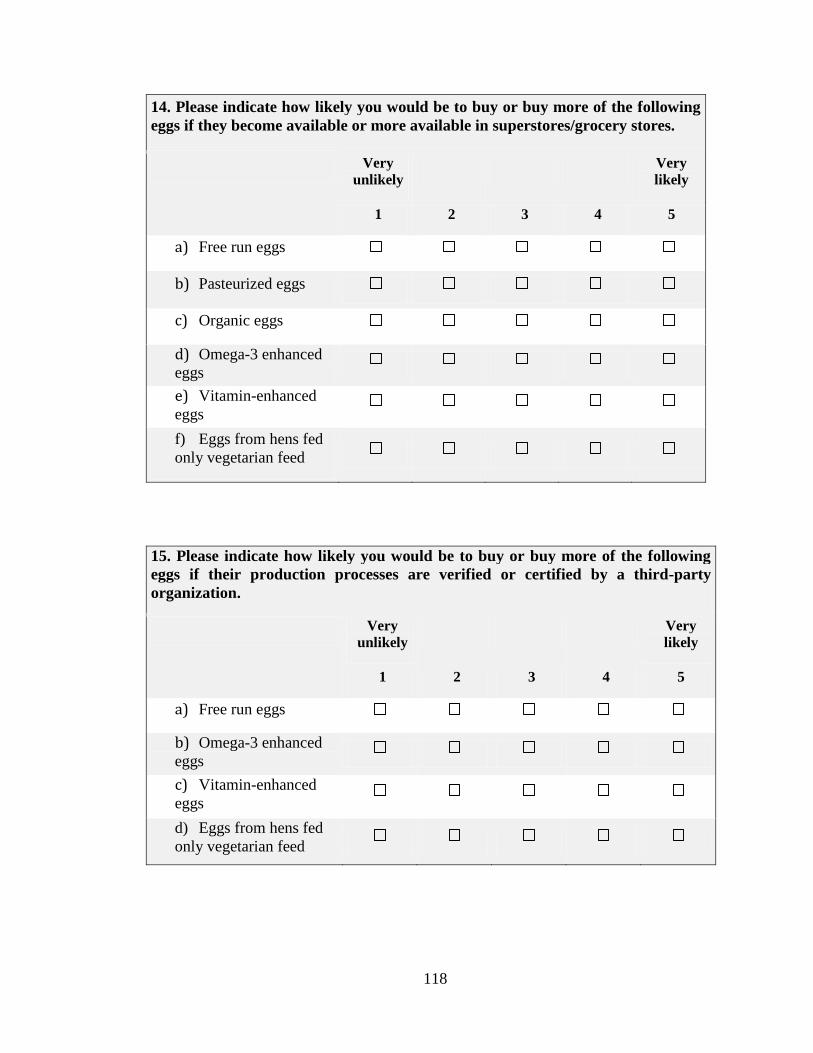
118
14. Please indicate how likely you would be to buy or buy more of the following
eggs if they become available or more available in superstores/grocery stores.
Very
unlikely
Very
likely
1 2 3 4 5
a) Free run eggs
b) Pasteurized eggs
c) Organic eggs
d) Omega-3 enhanced
eggs
e) Vitamin-enhanced
eggs
f) Eggs from hens fed
only vegetarian feed
15. Please indicate how likely you would be to buy or buy more of the following
eggs if their production processes are verified or certified by a third-party
organization.
Very
unlikely
Very
likely
1 2 3 4 5
a) Free run eggs
b) Omega-3 enhanced
eggs
c) Vitamin-enhanced
eggs
d) Eggs from hens fed
only vegetarian feed

119
16. Have you previously heard of recent egg recall in the United States last August?
Yes
No
17. Please indicate who is responsible for setting the following standards or
regulations.
Government
Private
industry
Don’t
know
a) Quality standards for eggs such as
Canada Grade A large
b) Standards for nutritional claims such as
“vitamin-enhanced”
c) Standards for the pasteurization process
d) Housing standards such as free fun
18. Please indicate whether or not you agree with the following statements:
Yes No
Don’t
know
a) Brown eggs are more nutritious than white eggs.
b) Eggs with a darker yolk colour have higher
nutritional value.
c) Eggs with a darker yolk colour taste better.
d) Free run eggs have brown shells.
e) Free run or organic eggs are healthier than regular
eggs.
f) Free run and organic eggs are more likely to be
contaminated by salmonella bacteria.
g) Organic eggs have a higher nutritional value than
regular eggs.
h) Free run or organic eggs taste better than regular

120
eggs.
i) Pasteurized eggs are safer than regular eggs.
j) Mishandling of eggs at home was the major reason
for 2010 salmonella outbreak caused by tainted eggs in
the US.
19. Have you been involved in any of the following situations in the past twelve
months?
Yes No Don’t
know
a) Complained to a retailer about food
quality
b) Refused to buy certain food types or
brands in order to express your opinion on a
political or social issue
c) Participated in organised consumer
boycotts
20. Have you or anyone in your family (including all household members,
children, siblings and parents) ever been diagnosed with the following health
conditions? [multi-select]
a) Food allergy
b) Heart disease
c) High blood pressure
d) High cholesterol level
e) Cancer
f) None of above [exclusive
selection]

121
21. To what extent do you agree or disagree with the following statements?
Strongly
disagree
Disagree Neither
agree,
nor
disagree
Agree Strongly
agree
1 2 3 4 5
a) Exercising on a regular
basis as an important part of
my routine.
b) Regularly taking
vitamin supplements is an
important part of my health
practices.
c) I habitually read
nutrition labelling
information on prepackaged
foods if I have never had
them before.
d) Compared to others my
age, my health is much
better.
e) I am knowledgeable
about health and nutrition.
f) It is important to eat
foods that are enriched with
added vitamins or with
ingredients like Omega-3
fatty acids.

122
g) Having regular contact
with my physician is the
best way for me to avoid
illness.
h) If I take care of myself,
I can avoid illness.
i) My good health is
largely a matter of good
fortune.
22. Are you male or female?
Male
Female
23. What is your age?
________(years)
24. Including yourself, how many people live in your household? (Check one)
1
2
3
4
5 or more

123
24a. [If 2 or more in Q24] How many children younger than 18 live in your house?
(Check one)
0
1
2
3 or more
25. What is your marital status? (Check one)
Married/Living with a partner/Common Law
Single/Widowed
26. Do you smoke?
Yes
No
27. Which of the following best describes your community? (Check one)
Rural area, population under 1,000
Small urban area with population between 1,000 - 29,999
Urban area with population between 30,000 - 99,999
Urban area with population between 100,000 - 499,999
Large urban area with population of over 500,000

124
28. Are you a member of an animal welfare organization?
Yes
No
29. What is the highest level of education you’ve achieved? (Check one)
Some high school
Completed high school
Some post-secondary training but did not complete
Completed technical school or college diploma
University undergraduate or graduate degree
Other:_______________
30. Which of the following best describes your employment status? (Check one)
Employed full-time or self-employed
Employed part-time
Homemaker or on leave from working
Student
Retired
Unemployed and seeking employment
Other:_______________

125
31. Which one of the following best describes your annual household income level
before taxes? (Check one)
Under $20,000
$20,000 - $34,999
$35,000 - $49,999
$50,000 - $64,999
$65,000 - $79,999
$80,000 - $94,999
$95,000 - $109,999
$110,000 - $124,999
$125,000 or more
32. Please provide the first 3 digits of your home postal code
________