factors affecting effective capacity in mobile phone money
TRANSCRIPT
FACTORS AFFECTING EFFECTIVE CAPACITY IN MOBILE PHONE MONEY TRANSFER SERVICES: A CASE OF SAFARICOM M-PESA SERVICES
MOMANYI VERAH KERUBO
A Management Research Project Report Submitted in Partial Fulfillment of the
Requirements for the Award of the Degree of Master of Business Administration,
School of Business, University of Nairobi
2011
ii
DECLARATION
STUDENT’S DECLARATION
I declare that this research project is my original work and has not been presented in this
or any other university for the award of a degree.
Signature Date
MOMANYI VERAH KERUBO
Registration Number: D61/73339/2009
SUPERVISOR’S DECLARATION
This research project has been submitted for examination with my approval as University
Supervisor.
Signature Date
Supervisor: Onserio Nyamwange
Lecturer, Department of Management Science

iii
DEDICATION
This research project is dedicated to my dear parents, my dad Benson Momanyi and
Mum, Carren Mogere. Your life of example has inspired me to follow your footsteps and
to try and exceed your expectations of me. You are both a true source of inspiration.
To my fiancée Cyrus, I thank you for always reminding to get this work done.
Your encouragement and belief in me has been instrumental in finally getting to this
stage of my studies. I appreciate you.
To my siblings Victor, Becky and Ruth, I thank you for being there for me. I
acknowledge with gratitude your support and love. Thank you so much for having
confidence in me. I love you too and thank God for you.
iv
ACKNOWLEDGEMENT
My first acknowledgement goes to God Almighty for His grace to me that has been
sufficient to me throughout my degree studies and, indeed, through my entire academic
journey up to this point. I express my thanks and honour to You.
Special thanks go to my project supervisor, Onserio Nyamwange, for his patience,
dedication, and valuable knowledge that has greatly improved the quality of this work. I
am grateful for his support and guidance throughout the period of writing this project.
To my moderator, Thomas Ombati, I acknowledge his valuable input during the
critical moderation stage. His valuable comments have been reflected in this final
document and have greatly improved the quality of this work. I thank Dr. Njihia
Muranga, Head of the Department of Management Science, for his insightful comments
on the draft project paper prior to presentation. I wish to make special acknowledgement
to Mrs. Betty Mwangi, the Safaricom Company’s M-pesa Operations Manager. Her
insights into the factors affecting effective capacity in the mobile money platform of M-
pesa were central to this research project. I thank you for taking time from your busy
schedule to offer me the necessary assistance, without which this research would have
been difficult, if not impossible to complete.
I thank my family and friends for their encouragement throughout the project
period. I can never thank you enough. I pray that the Almighty God will richly reward
you.

v
ABSTRACT
This study sought to determine the factors affecting effective capacity in mobile money
transfer services. It involved a case of Safaricom’s M-pesa service. The study also sought
to identify the challenges facing the company in managing transactions capacity and how
the capacity of the money transfer service can be effectively managed.
Primary data for this study was collected through questionnaires administered to
persons offering M-pesa services. Secondary data was obtained from the company
intranet and other company reports. The collected data was sorted and organized for
analysis. Data collected was analyzed using descriptive statistics.
The study found that effective capacity in the money transfer service has not been
optimally managed in a way that would ensure effective capacity in the money transfer
industry. The study also found that the current M-pesa capacity is constrained thereby
negatively affecting the quality of services. Capacity has been affected by variables
among them the following: cash flow and liquidity management, technology, quality of
service, government regulation, cash in transit and capacity management. From the study
findings, it can be inferred that an effective capacity management will enhance the
quality of the money transfer service.
In this study, a large percentage of respondents (80%) reported that the M-pesa
money transfer service faces challenges that affect its effective capacity. A further 42%
of the respondents strongly agreed that system delays represent the greatest challenge
facing the service. The results of the study show that the current M-pesa capacity does
not fully meet the expectation of the customers. This implies that better management of
the various factors affecting effective capacity is likely to improve the M-pesa money
transfer service.

vi
TABLE OF CONTENTS
DECLARATION ................................................................................................................ ii
DEDICATION ................................................................................................................... iii
ACKNOWLEDGEMENT ................................................................................................. iv
ABSTRACT .........................................................................................................................v
LIST OF TABLES ........................................................................................................... viii
LIST OF FIGURES ACRONYMS AND ABBREVIATIONS ......................................... ix
ACRONYMS AND ABBREVIATIONS ............................................................................x
CHAPTER ONE: INTRODUCTION ............................................................................. 1
1.1 Background of the Study ...............................................................................................1
1.2 Statement of the problem .............................................................................................5
1.3 Objectives of the Study ..................................................................................................8
1.4 Significance of the study ..............................................................................................8
CHAPTER TWO: LITERATURE REVIEW ................................................................ 9
2.1 Introduction .................................................................................................................9
2.2 Mobile phone usage background in Africa ..................................................................9
2.3 Money transfer ...........................................................................................................10
2.4 History of the Mobile phone money transfer .............................................................11
2.5 Earlier modes of money transfer in Kenya ................................................................11
2.7 Capacity Management ...............................................................................................14
2.8 The Safaricom M-pesa Mobile Transfer Services .....................................................15
2.9 Comparing M-pesa with Alternatives ........................................................................15
CHAPTER THREE: RESEARCH METHODOLOGY ............... .............................. 17
3.1 Introduction ................................................................................................................17
3.2 Research Design...........................................................................................................17
3.3 Population ....................................................................................................................18
3.4 Sampling Techniques and Sample Size .......................................................................19
3.5 Data Collection Techniques .......................................................................................20
vii
3.6 Data Analysis .............................................................................................................20
CHAPTER FOUR: DATA ANALYSIS AND PRESENTATION....... ....................... 21
4.1 Response Rate ..............................................................................................................21
4.2 M-pesa Challenges .......................................................................................................21
4.3 System Users ................................................................................................................22
4.3 Role as an M-pesa system user ....................................................................................23
4.4 System Maintenance done by System Engineers.........................................................28
4.5 Strong Latent Demand for Domestic Remittances ......................................................29
4.6 The broader significance of M-PESA ..........................................................................30
4.7 Three Perspectives Accounting for the M-Pesa Success .............................................32
CHAPTER FIVE: SUMMARY, CONCLUSION AND RECCOMENDATIO NS ... 32
5.1 Summary of the M-pesa Innovation ............................................................................32
5.2 Conclusions ..................................................................................................................33
5.3 Recommendations ........................................................................................................33
5.4 Limitations of Study ....................................................................................................34
5.5 Suggestions for further study .......................................................................................34
REFERENCES ................................................................................................................ 35
APPENDICES ................................................................................................................. 40
APPENDIX I: GUIDING QUESTIONS FOR INTERVIEWS ........................................ 40
APPENDIX II: BUDGET SCHEDULE ........................................................................... 46
APPENDIX III TIME PLAN............................................................................................ 47
viii
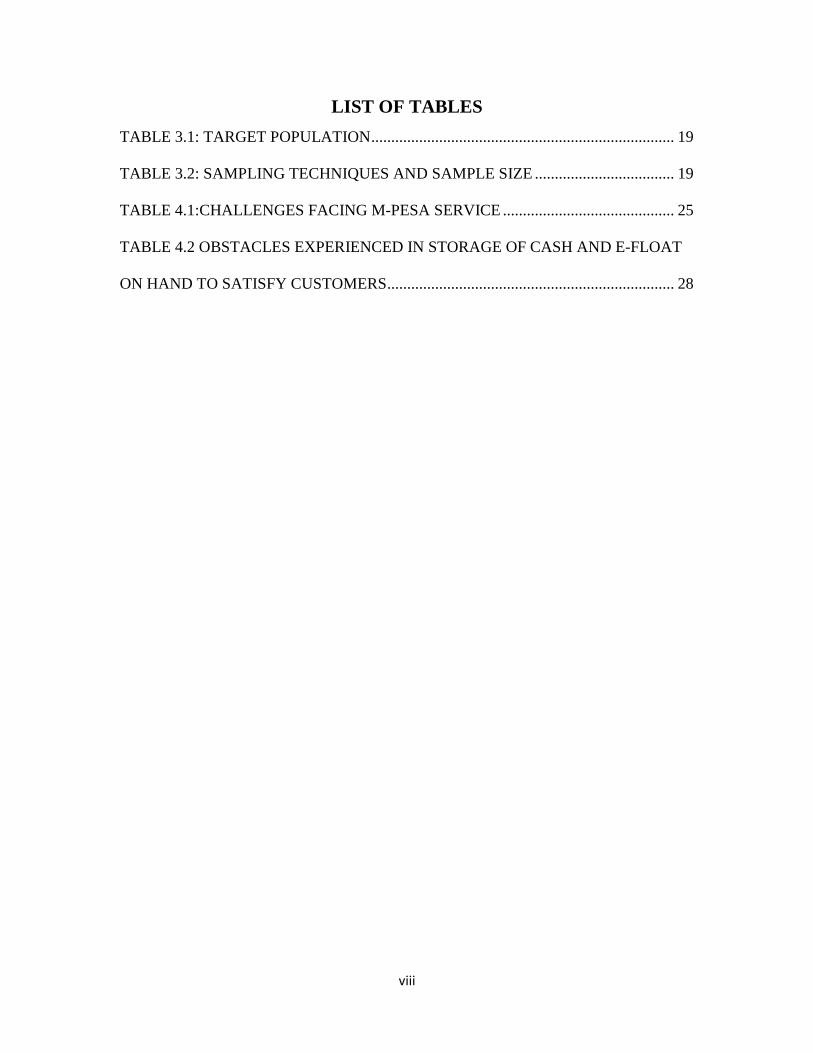
LIST OF TABLES
TABLE 3.1: TARGET POPULATION ............................................................................ 19
TABLE 3.2: SAMPLING TECHNIQUES AND SAMPLE SIZE ................................... 19
TABLE 4.1:CHALLENGES FACING M-PESA SERVICE ........................................... 25
TABLE 4.2 OBSTACLES EXPERIENCED IN STORAGE OF CASH AND E-FLOAT
ON HAND TO SATISFY CUSTOMERS ........................................................................ 28

ix
LIST OF FIGURES FIGURE 2.1: EARLIER MODES OF MONEY TRANSFER ......................................... 12
FIGURE 2.2: COMPARING M-PESA WITH OTHER MODES OF MONEY
TRANSFER ...................................................................................................................... 16
FIGURE 4.1 FREQUENCY OF EXPERIENCING DELAYS ........................................ 21
FIGURE 4.2 OUTLETS OFFERING FINANCIAL SERVICES IN KENYA ................ 23
FIGURE 4.3 ROLE AS AN M-PESA SYSTEM USER .................................................. 24
FIGURE 4.4 THE USES OF M-PESA ............................................................................. 26
FIGURE 4.5 EXPERIENCE CHALLENGE WITH FLOAT AVAILABILITY ............. 26
FIGURE 4.6 FREQUENCY OF EXPERIENCING CHALLENGES WITH FLOAT
AVAILABILITY. ............................................................................................................. 27
FIGURE 4.7 FREQUENCY OF DOING SYSTEM MAINTENANCE .......................... 29
FIGURE 4.8 BACK UP SERVERS FOR THE M-PESA SYSTEM ............................... 30
x
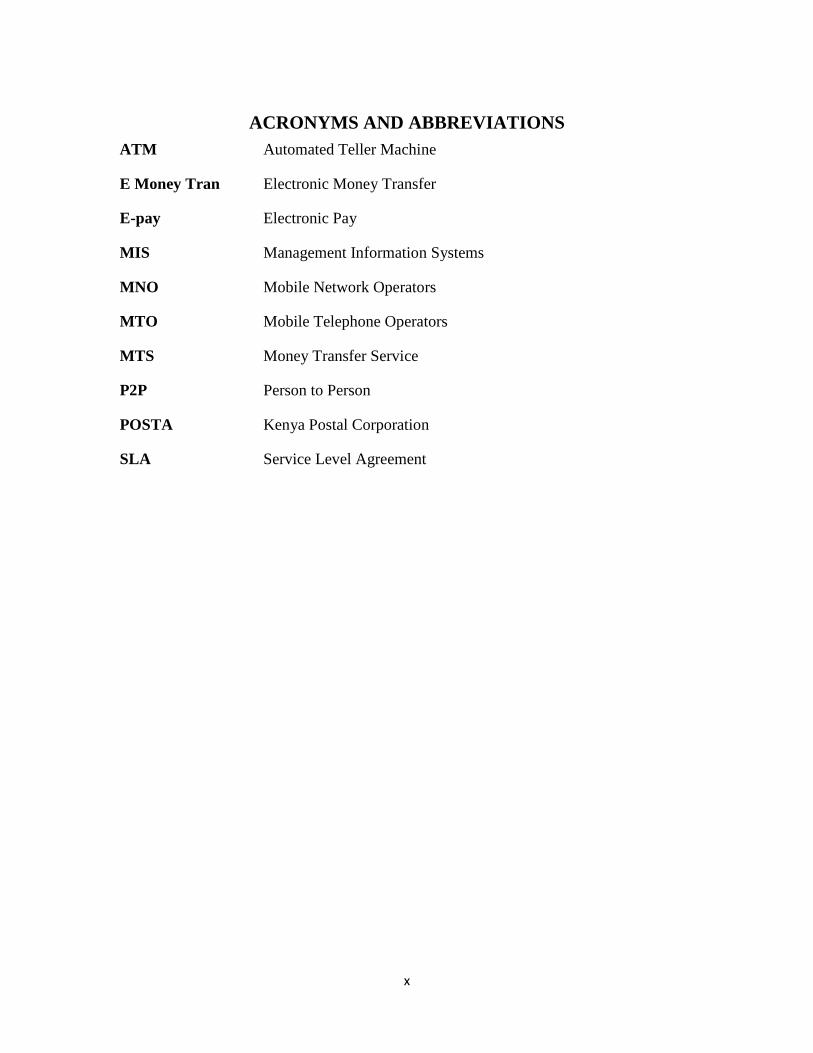
ACRONYMS AND ABBREVIATIONS ATM Automated Teller Machine
E Money Tran Electronic Money Transfer
E-pay Electronic Pay
MIS Management Information Systems
MNO Mobile Network Operators
MTO Mobile Telephone Operators
MTS Money Transfer Service
P2P Person to Person
POSTA Kenya Postal Corporation
SLA Service Level Agreement
1
CHAPTER ONE: INTRODUCTION
1.1 Background of the Study
Economic, technological and political factors are a few of the diverse external conditions that
can influence a company’s decisions to open, close or modify its manufacturing facilities. These
factors change over time but especially so in environments of growing global competition, where
the development of a capacity and facilities strategy is essential to any manufacturing enterprise
(Butler, 1990). In order to develop a capacity and facility strategy for a particular company, it is
first necessary to understand how each factor affects their strategic capacity management and
impacts market growth, product obsolescence, technology changes and conflicts with the
environment. A lack of understanding of these issues can cause a disconnect between the
company’s capacity and business strategies (Skinner, 1969).
Effective capacity is an important concept in operations strategy. Not all productive
capacity is actually used or usable. It is important for production managers to understand what
capacity is actually achievable. Matching supply and demand in services by capacity
management has a direct influence on the ability of the service delivery system to achieve
service quality and resource productivity targets. In addition to the chase and level strategies for
managing capacity in services suggested by Rikert and Sasser (1980), a coping strategy for
capacity management is described which aims to improve the overall delivery of service quality
while achieving resource productivity targets. Coping is necessary for all organizations at some
time (Abrahamson, 1996).
From the perspective of manufacturing strategy, efficient capacity management is
concerned with capacity expansion and reduction in order to respond to long-term changes in
demand levels. Strategic capacity management is essential as it has a significant impact on the
competitive performance dimensions of cost, delivery speed, dependability and flexibility
(Olhager et al, 2001). It has been identified that the development of a connected facilities
strategy and the development of a production capacity are essential to any manufacturing
company that wants to reduce costs (Butler, 1990). The capacity strategy and the business
strategy need to be connected to prevent unnecessary investments to repair or replace assets
when a duplication of capacity exists (Skinner, 1969, Reeve, 2001).
2
Capacity management can refer to the overall function of the business, or focus on
specific areas of the operation, such as the quality and performance of the information
technology efforts within the company. Capacity has its main dimensions which include:
quantity that deals with the how much factor, quality that talks of the requirements of a product
to meet the customer requirements, time factor which deals with the when the capacity is
required and location that deals with the where the capacity is required (Panneerselvam, 2008).
A weak connection between strategic capacity management and the business plan can
result in disconnecting the strategic and tactical phases of a company’s plans. Capacity
management needs to be reviewed at the three planning levels: the strategic, the tactical and the
operational (Silva et al, 1992). Studies have also indicated that companies have ignored the
signals of the market demand by building capacity above the potential of the market. This causes
an excess of capacity and the duplication of overhead costs (Silva, 1994). Reeve (2001) has
noted that when the bottleneck is above the level of highest demand, a high level of control needs
to be exercised in order to avoid capacity duplication and stop spending in capital funds.
In mobile money transfer services, capacity is illustrated in sending or receiving money
for either payment of salaries, settlement of business transactions, payment of school fees, or for
family support for both businesses and individuals. Effective capacity requires efficient, reliable
and affordable money transfer services whereby money can be deposited in one location and
withdrawn in another in both urban and rural areas. Structural weaknesses in the financial
industry in Kenya, however, limit the access to money transfer services, especially in rural areas
and for low-income people. This is because dealers are concentrated mainly in urban centers and
have conditions that constitute barriers to the use of their services. The cancellation of
telegraphic money transfer services previously offered by the government through the Kenya
Postal Corporation has left fewer service options to customers. Money transfer services (MTS)
are offered by formal providers (e.g. commercial dealers or the Kenya Postal Corporation
(POSTA), by semi-formal providers (e.g. courier or bus companies), and by informal services or
means (e.g. by bus conductors or friends).
3
Generally, commercial dealers are the major players in money transfer business in Kenya,
servicing mainly large users and, to a smaller extent, low-income users. Among the commercial
bank instruments, telegraphic transfers, electronic funds transfers and bank drafts are typically
used for large value transfers, as they offer the cheapest service for the transfer of large amounts.
In addition, bank cheques are the preferred and often required means of payment for school fees.
Western Union and similar services in Kenya, most of which operate through commercial
dealers, are used almost exclusively to receive money rather than to send
(www.dai.com/pdf/Passing the Buck).
Mobile phone subscribers in Kenya increased to 22 million between July and September
last year (2010) up from 20.1 million in June 2010. This represented a growth of 9.5 percent, the
highest over the last three quarters, and a tele-density to 56.9 percent. According to the CCK
Quarterly Sector Statistics Report (July- September 2010/2011), the growth is attributed to
promotions and lower tariffs. During the quarter, pre-paid and post-paid mobile tariffs went
down by 33.4% and 55.5% respectively, following an interconnection determination by CCK
that saw mobile termination rates reduced to Kshs 2.21 from Kshs 4.42. A total of 6.63 billion
minutes of local calls were made on the mobile networks up from 6.06 billion in the previous
quarter, posting an increase of 9.6% (Communications Commission of Kenya, 2011)
To address the challenges that were faced by the earlier discussed modes of money
transfer, a more innovative and even faster way of sending money via mobile phone was
launched in Kenya where mobile transaction payments system, based on a system of low-value
accounts held by a mobile operator and accessible from a subscribers’ mobile phones through a
SIM card-resident application. The conversion of cash into electronic value (and vice versa) is
performed at a network of retail stores. Mobile money transfer has highly substituted earlier
money transfer services and so far has proved to be an efficient and effective way of transferring
money both locally and internationally. We have four main players in the mobile phone money
transfer. These are: Safaricom with M-pesa, Bharti Airtel with Zap, Essar Telecom with YUcash
and Orange with IKO pesa. All these offer money transfer services but with different number of
subscribers registered and using their service currently (Peake, 2006).
4
With the increase in mobile money transfer services capacity, our understanding has been
refined over the past years; the industry has generally arrived at consensus on the “what” and the
“why” of mobile money. Now the industry has intensified its focus on the “how” to approach
common constraints in order to fully capture the opportunities. Despite progress over the last
year, there is an acknowledgement that there are still too few successes at scale. Much remains to
be done to reach critical mass in money transfer services, the point at which an industry has
gained sufficient penetration for momentum to be self-sustaining. In the mobile money space,
this will require both more customers and more transactions per customer. Reaching critical mass
will require mobile money ecosystems to become more dynamic and productive. Mobile money
ecosystems are the networks of organizations and individuals that must be in place for mobile
money services to take root, proliferate, and scale up and will be characterized by
interdependence and coordination among any number of actors such as: Mobile Network
Operators (MNOs), dealers, airtime sales agents, retailers, utility companies, employers,
regulators, International financial institutions and donors, and even civil society organizations
(Andriessen 2004).
More than 4 billion people around the world are now mobile phone users, 61 percent of
all potential subscribers and most of the existing subscribers are becoming increasingly
comfortable with a wide range of functionality that such phones enable. One such capability is
mobile banking and mobile money management using a mobile device to complete a variety of
transactions or to have an interactive relationship in real time with a financial institution. It’s a
compelling value proposition to buy movie tickets, pay for a store purchase, check your account
balance, and send money to a relative and much more all from your mobile phone. Mobile
money management is key to high performance for financial institutions and mobile network
operators alike. A managed-services approach to mobile financial services can be a significant
differentiator in serving customers quickly and efficiently, and in protecting an institution from
rapid and complex technology change (Ansoff, 1965).
M-pesa, a key mobile money transfer widely used, was launched in Kenya on March 6,
2007 by Safaricom in partnership with Vodafone. Based upon its success in Kenya, M-pesa has
now gone global. Innovation in the Kenyan mobile money scene has progressed so fast that it is a
5
long while since March 2007 when Vodafone, the world’s leading mobile services provider
which owns 40 per cent of Safaricom chose to work with Safaricom. It has now become the
most preferred medium of personal cash transfers (www.safaricom.co.ke). The service enables
subscribers to use their mobile phones to carry out transactions such as pay for goods and
services, pay bills, send to and receive money from friends and family, withdraw cash for their
use, top up their own airtime account or top up someone else's account and manage their own
accounts “M-pesa has served as a testing ground for mobile money transfer systems and
processes and the eyes of much of the world have been on it. The success of M-pesa has acted as
a starter’s pistol for a race to gain the upper hand in mobile money transfers throughout Africa,
with at least half a dozen contenders already in the wings,” said Arthur Glodstuck, an industry
analyst in an interview, (Business Daily, 2010). The M-pesa facility depends on efficient
interaction of cash flow and liquidity management, value and volume of transfers, Quality of
service, Network of outlets, Technology, Government regulation, Cash-in-transit, IT Platform
and interoperability affects affective capacity (Valdecantos, 2009).
1.2 Statement of the Problem
Capacity in any organization that is not effective affects its operations and productivity, aside
from inconveniencing a number of other parties. Some of these parties include: staff and the
agents working for that organization and customers who expect nothing less than efficiency and
reliability who become disappointed. This may lead to loss of faith and loyalty to the service or
product provider. Mobile money and microfinance go hand in hand for a number of reasons:
mobile money increases the efficiency, transparency, and security of microfinance; and
microfinance lowers the customer acquisition cost and increases the average revenue per user of
mobile money. Nevertheless, everything hinges on the capacity of the mobile money agent
network to serve its customers.
Customers and management of Safaricom Ltd rely on the M-pesa facility to deliver on
numerous activities. The challenges of providing mobile money transfers on such a service are
equally daunting for the mobile service providers. The financial system of Kenya has developed
over a period of time with strict discipline and regulatory control. Even during the worst of the
financial crisis, the country’s financial system took no or little beating, basically because of
strong discipline and monitoring.
6
A number of critical issues and risks that have been reviewed include: liquidity
management, settlement risks, the reliability of the system, the registration of users, system audit
trail, anti-money laundering measures and consumer protection issues that could compromise the
safety, efficiency, integrity and effectiveness of the M-Pesa system. These risks have been
mitigated through a number of measures which the Central Bank and the Communications
Commission of Kenya (CCK) helps in monitoring regularly.
Agent liquidity is one of the most fundamental challenges mobile money providers face.
In order to be effective, mobile money agents have to have a fine-tuned understanding of their
market, including an ability to predict when customers will come and what types and volumes of
transactions they will want to perform. This already difficult task is made all the more
challenging when microfinance loan customers enter the equation, which is one reason why
microfinance institutions (MFIs) and mobile money providers need to both understand one
another and maintain clear, frequent communication (Barney, 1995). Like any mobile money
customer, loan customers need to both cash-in and cash-out. Unlike other customers, however,
they receive one large payment upfront and then send frequent, smaller payments over the course
of their loan lifecycle. To serve these customers, mobile money agents need to have sufficient
cash to cash-out at the time of loan disbursement (usually several hundred dollars per loan
customer) and sufficient e-float to cash-in throughout the repayment period.
System delays on M-pesa services are a common problem affecting the effectiveness of
mobile money transfers. This forces consumers to wait longer to be able to operate their
accounts. Lack of enough float by agents in various outlets, few agents in rural areas which can
be termed as low staffing, mainly caused by low levels of economic activities in those areas, the
ceiling on the maximum account balance (currently standing at Kenya shillings,100000 and a
maximum transfer per day of Kenya shillings 140000, are the major challenges facing the M-
pesa service, www.mpesa.co.ke).

7
Limited access to formal finance and banking institutions in Kenya has decreased the
sustainability of mobile money transactions and has also affected the reliance on self-supporting
and informal institutional arrangements. Some of the transactions are too restrictive or
cumbersome because of taxation systems and Kenyan labor laws. Excessive government
regulations in some areas such as business start-up, in particular as regards cumbersome, time
demanding and costly procedures for business registration are a challenge to the M-pesa agents
country wide. Limited access to employers´ organizations affects the ability of M-pesa agents to
obtain access to official social security schemes within the mobile money industry. Lack of
information on prices and viability of products by some consumers is also a challenge to the
usage of the facility. Excessive registration and transaction costs of starting or operating
businesses and also limited access to technology by consumers have all posed great challenges to
the mobile money industry.
It is with this argument therefore that the study sought to specifically address the
challenges of M-pesa capacity effectiveness that stand in the way of maximizing revenue and
ensuring customer satisfaction. The study also sought to provide current and up to date
information on how the M-pesa service manages its capacity in terms of the number of
transactions initiated and completed, how fast such transactions are processed and completed
upon attempt, liquidity management, and quality of service. The study also sought to understand
if agents and other personnel are able to obtain reliable product information and are able to
utilize efficient technology to aid timely and accurate communication as described by (Chandler,
1990).
This study therefore sought to look at the challenges facing organizations in managing
effective capacity of the mobile money transfers services, what the factors affecting effective
capacity in mobile money transfer services are and how these challenges can be addressed to
effectively handle steadily increasing customer base.
8
1.3 Objectives of the Study
The general objective of this project study was to look at the ways in which the M-pesa money
transfer service can be improved to effectively manage its capacity.
The specific objectives were:
i. To establish the challenges affecting mobile money transfer ;
ii. To identify the challenges facing the organization in managing transactions capacity; and,
iii. To determine how the M-pesa money transfer service can be managed to effectively
manage its capacity.
1.4 Significance of the Study
The research findings are expected to be useful to organizations that provide mobile money
transfer services, specifically the management and key players in the M-pesa product
development and operation departments who would obtain information to help them improve
their services. The study is also important to businesses who utilize mobile money transfer
services. The information from this study will help them manage their growing customer base,
improve services, and efficiently handle capacity.
The findings will also provide new knowledge and ideas in capacity management to
upcoming scholars. As such, the study contributes to the body of knowledge in the field of
capacity management in the new and cutting-edge technologies of mobile money transfers. The
study findings will also be useful to all the governmental agencies involved in the field of mobile
telephony and mobile money transfers in providing current information which may be used to
improve policy governing this industry.
9
CHAPTER TWO: LITERATURE REVIEW
2.1 Introduction
Since its inception in 2007, M-Pesa has rapidly developed to become one of the most dynamic
innovations for delivery of financial services using modern Information and Communications
Technology (ICT). This innovation makes Kenya a world leader in the use of mobile phones to
transfer money. To appreciate its rapid growth in popularity, it is important to note that the
number of registered Kenyan using the M-Pesa service regularly has grown rapidly to reach
close to 8 million persons in the year 2010.
However, the adoption and growth of M-Pesa services has not only continued to draw
public attention but has also generated a lot of debate as to the safety and reliability of these
kinds of payments and transfer systems and what the government is doing about it. Among the
questions in the minds of many Kenyans are: How does the M-Pesa money transfer service really
operate and is it safe and reliable? What are the factors affecting effective capacity in mobile
phone money transfers in Kenya and what should be regulated to overcome this. It is for this
reason that it became necessary for the government to audit the M-Pesa system in order to clear
doubts from the minds of customers regarding the system’s safety and reliability. The audit has
also provided information about the effectiveness and soundness of the M-pesa operating
platform and also of other similar services currently operating in the Kenyan market.
2.2 Mobile Phone Usage Background in Africa
In 2004, Africa added almost 15 million new mobile phone subscribers, an equivalent of the total
number of fixed and mobile telephone subscribers in the continent in 1996. Some analysts
predict that there will be close to 200 million mobile subscribers in Africa by 2010
(http://moconews.net/article). By comparison the reach of the retail banking system in most
African countries is very low (Porteous, 2006). In Kenya, as of Aug 24, 2010 mobile phone
penetration was up to the 51 percent mark in the first quarter of 2010 with mobile subscriptions
up 2.7 percent to 19.9 million from 19.4 million in the previous quarter. The regulator attributes
the increase in the number of mobile subscriptions to multiple SIM ownership and increased
10
number of service providers offering attractive promotions. Out of the 19.9 million mobile phone
subscribers in Kenya, Safaricom commands 15.79 million subscribers (Safaricom Annual
Report, 2010).
According to this Annual Report, M-pesa has continued to experience high growth rates
over the years. This growth has been realized through expansion of the agent network and
increased usage of M-pesa by subscribers. The M-pesa subscriber base has grown from 5.8
million in 2009 to 9.5 million in 2010 which is 65.3 percent growth rate adding 3.3 million new
subscribers in the period. According to the industry statistics from the Communications
Commission of Kenya (CCK), at the end of March 2010, the population under mobile coverage
stood at 86 percent (www.cck.com).
2.3 Money Transfer
Money Transfer Services refer to services in which money or funds can be transferred from one
location to another with the help of several methods. A large number of reputed companies offer
a variety of money transfer services to customers The methods are quick, dependable, and easy
to process, with money being sent or received all over the world without any difficulties. The
sending of payments or purchasing money orders is also done through this service. Nowadays,
the Internet has also become a highly popular method for transferring money and has services
that are quick, affordable, and safe in comparison to other conventional methods, (Porteous
2006).
The operations of money transfer companies are carried out with the help of the extensive
network of their agents. Usually, services can be categorized into Online Money Transfer
Services, where money or funds are transferred over the internet with the help of a credit or debit
card, and Walk in Money Transfer Services. The majority of transfers occur with the help of this
second method. Under the Walk in Money Transfer, cash is received from the customer by a
clerk and the payment is ready for collection at an agent location, suitable for the receiver. This
is all done within a short span of time. A large number of agent locations recognize debit cards
for this type of transactions (Financial Mirror, 2010).
We also have Telephonic Money Transfer Services, a system through which funds can be
sent telephonically by utilizing a debit card or credit card. At the Payout Services, receivers are

11
able to collect funds within a short period of time after the sender has completed the transaction.
Other systems include: Money Orders (which is a dependable payment option for people who do
not have a checking account, useful for bill payments and various purchases), Prepaid Cards and
Services (where a number of prepaid cards such as MasterCard or Visa are used as ATM cards or
for online shopping purposes wherever the cards are acknowledged), Mobile Money Transfer
Services (a system through which funds are transferred from one person to another by using
mobile phone numbers).
Kenya currently has four key players in the mobile money transfer services. These are
provided by the various network providers for their respective mobile phone services. The
leading money transfer services companies include the following: Safaricom with M-pesa,
BhartiAirtel with Zap, Essar Telecom with YU Cash and Orange with IKO pesa. Others are:
Western Union Money Transfer, Kobo Money Transfer Services, MoneyGram International,
Epay, and PayPal eMoneyTran (Business Daily, 2011).
2.4 History of the Mobile Phone Money Transfer
According to Kerama (2003), a few years back, the mobile phone was a luxury and only the very
rich could afford one. This has changed with time and right now everyone has a cell phone which
can do more than just make a call or send a text message. One of the most functional services
that the mobile phone has been offering customers is money transfer services. In Africa,
especially Kenya, many people who had been locked out of the banking system due to the many
requirements that were needed, have been able to transact on their mobile phones with a lot of
ease. Through the mobile phone, people can buy talk time, pay their utility bills, transfer funds to
their business partners or suppliers, access their bank details as well as receive payments from
various parties. The transactions are flexible as one can initiate them at the comfort of their
homes as long as they have some funds in their account. International barriers to transacting have
also been reduced through international mobile money transfer services (Kerama, 2003)).
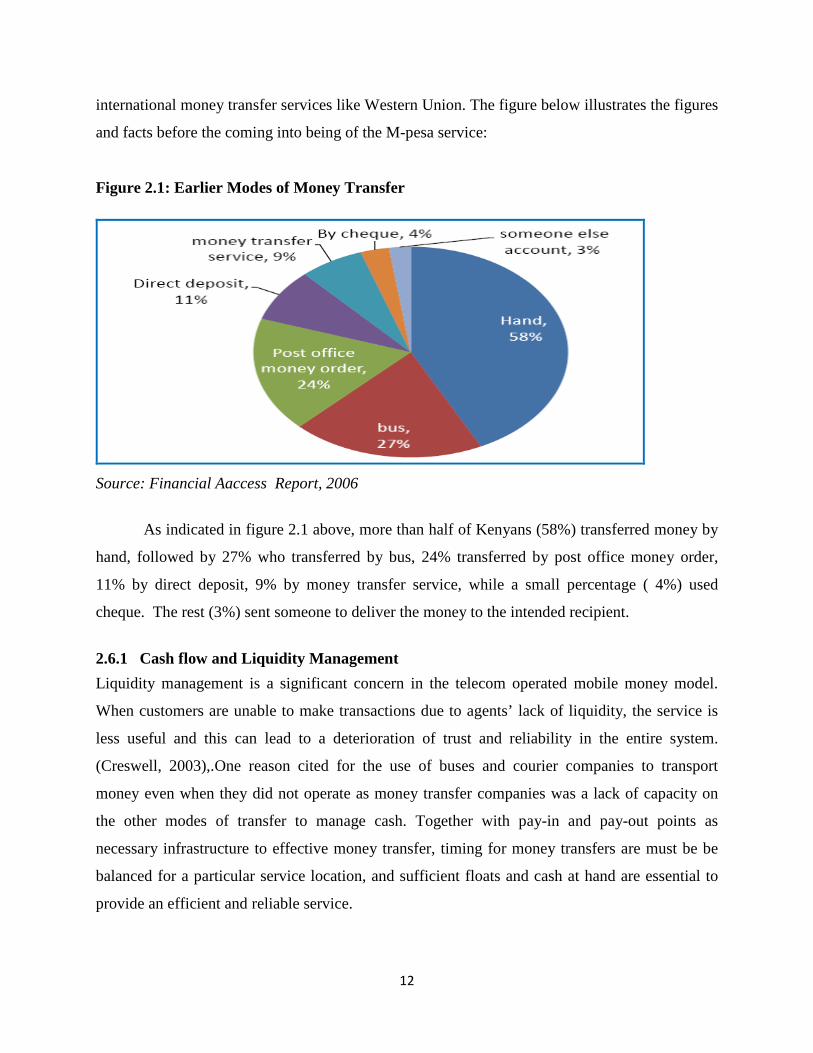
2.5 Earlier Modes of Money Transfer in Kenya
Before M-pesa became into being in the year 2007, there were other modes of money transfer
including money order from post office, hand delivery, bus, someone else’s account and
12
international money transfer services like Western Union. The figure below illustrates the figures
and facts before the coming into being of the M-pesa service:
Figure 2.1: Earlier Modes of Money Transfer
Source: Financial Aaccess Report, 2006
As indicated in figure 2.1 above, more than half of Kenyans (58%) transferred money by
hand, followed by 27% who transferred by bus, 24% transferred by post office money order,
11% by direct deposit, 9% by money transfer service, while a small percentage ( 4%) used
cheque. The rest (3%) sent someone to deliver the money to the intended recipient.
2.6.1 Cash flow and Liquidity Management
Liquidity management is a significant concern in the telecom operated mobile money model.
When customers are unable to make transactions due to agents’ lack of liquidity, the service is
less useful and this can lead to a deterioration of trust and reliability in the entire system.
(Creswell, 2003),.One reason cited for the use of buses and courier companies to transport
money even when they did not operate as money transfer companies was a lack of capacity on
the other modes of transfer to manage cash. Together with pay-in and pay-out points as
necessary infrastructure to effective money transfer, timing for money transfers are must be be
balanced for a particular service location, and sufficient floats and cash at hand are essential to
provide an efficient and reliable service.
13
2.6.2 Quality of Service
Safaricom provides two forms of agent training. The first is the initial training session when a
new agent is brought on board. This session is in depth and covers all aspects of the operation of
the platform and the requirements for AML and KYC compliance. The team that manages M-
pesa has a dedicated department to provide current training materials and to facilitate training
sessions. The second form of training happens in the field and is provided by an external agency
that has been hired by Safaricom to travel around the country and provide refresher sessions for
master and retail agents.
Master agency head office and retail agents are provided with different training material
that are specific to the role they are required to fill. Head office staff is required to attend a one
day training program at the Safaricom offices. The training emphasizes the need for a high
quality of service that meets customer requirements. The client is trained on the need to provide
the service with high quality and understanding and to meet a certain minimum set of staffing
requirements in order to ensure a uniform level of service across the board (Krogh et al. 1999).
The distribution network consists of authorized agents who will perform client-facing functions
such as handling of cash and management of documents. The most successful providers of
money transfer services are those with relatively large national and regional networks of
branches or outlets which are already in place for their core businesses. The money transfer
service is an add-on product which benefits from this network at marginal additional cost and is
an expensive venture for organizations in trying to network further to reach customers (Porter,
1980),
2.6.3 Technology
Efficient and reliable communications and computer systems, including MIS, are essential in
operating a money transfer service. This in part because speed and reliability are key product
features for entering the market. Information technology can provide a competitive advantage
particularly in the area of operations management. Specific IT applications have been seen in
forecasting, procurement, supply chain management, and distribution, as well as in managing the
complex transactions upon which the mobile money transfer platform operates. However,
technology also has its limitations. Beckman and Rosenfield (2008) have identified the
14
challenges of implementing large-scale system changes, and the rigidity that IT can create for
business processes.
2.6.4 Government Regulation
Financial operations in many countries are subject to regulation by the government and the
central bank. A regulatory audit must be performed in order to establish the suitability in Kenya
with regard to money transfers, holding deposits and exchanging monies. The outcome of this
audit will affect the business model and profitability of the service.
2.6.5 Cash-in-transit
In order to ensure sufficient cash availability at agent end points, cash will need to be transferred
to these locations. If an MNO decides to partner with a bank and use full-service model then the
bank will provide also cash transfers at wholesale level (Valdecantos, 2009).The platform that
manages the client accounts, transaction logging and settlement may or may not be part of the
existing IN platform of the operator.
2.7 Capacity Management
Capacity management involves planning, sizing, and controlling the new system so that it always
meets the minimum performance expectations in the SLA (Service Level Agreement). But a
capacity management strategy cannot be designed to meet these SLA levels at any cost. The cost
associated with meeting these performance levels also has to meet the business’s cost
expectations. For example, although the organization can meet performance expectations by
installing a new system with clustered, hot standby servers for each major function, the cost
associated with buying the additional hardware and software licenses to support this level of
redundancy may be considerably more than the expected business benefit of the system.
Managing capacity effectively means that as the system grows, you’re able to add users or
transactions without adversely affecting the existing users. For example, if the new system is an
ATM withdrawal system via M-pesa, one will need to understand in advance: How many users
can run effectively on each server housing M-pesa e-cash database, how heavily they will use the
system and how much space is allowed or will be required for transaction message storage
(Business Daily, 2011).
15
2.8 The Safaricom M-pesa Mobile Transfer Services
Mobile payments have had an incredible uptake in Kenya because they allow both the banked
and the unbanked to transfer money more conveniently, more safely, and at a much lower cost
than through formal banking services or other money transfer methods. In Kenya, M-pesa,
launched on March 6, 2007, is the dominant m-payment system. It has experienced phenomenal
growth since then, greatly exceeding expectations. M-pesa’s initial goal was to acquire 200,000–
250,000 subscribers in the first year. Instead, it achieved that goal in just four months. In fact, M-
pesa attained 10 times the original goal in one year, registering 2 million customers. Today the
more than 7,000 M-pesa agents serving a country of 39 million Kenyans and customer base of 6
million far exceeds the 887 bank branches and 1435 automatic teller machines (ATMs) in
Kenya. As of the end of February 2009, the monthly value of person-to-person money transfers
was KES 14.5 billion (USD 190.3 million), with the cumulative value of these money transfers
since M-pesa’s launch reaching KES 118 billion (USD 1.5 billion). Person to person transfers
continued to be the main transactions and were valued at KES 28.59 billion, an increase of
66.4%, (Safaricom Annual Report, 2010). Kenya’s M-pesa is now being considered for a number
of countries across the globe (www.safaricom.co.ke).
2.9 Comparing M-pesa with Alternatives
M-pesa is very useful as a retail payments platform because of its reach into large segments of
the population. Over the years M-pesa has proved to be a faster, more secure and more
convenient way of sending money. Below are illustrations on how M-pesa compares with other
modes of money transfer.

16
Figure 2.2: Comparing M-Pesa with other modes of Money Transfer
Source: Financial Sector Deepening Kenya, 2008.
The above figure rates M-Pesa at different percentages as compared to other modes of money
transfer. These are: convenience (96%), safety (98%), cost (96%), and speed (98%).
17
CHAPTER THREE: RESEARCH METHODOLOGY
3.1 Introduction
A research methodology guides the researcher in collecting, analyzing and interpreting observed
facts (Bless and Achola, 1988). There are several research designs ranging from exploratory
studies to descriptive studies. Within these designs, there are strategies that can be applied such
as survey and case study. Descriptive research portrays an accurate profile of persons; events or
situations surveys allow the collection of large amount of data from a sizeable population in
highly economical way. It allows one to collect quantitative data which can be analyzed
quantitatively using descriptive and inferential statistics (Barbie, 1995). Surveys are concerned
with describing recording, analyzing and interpreting conditions that either exist or existed.
In the research methodology the following aspects of acquiring and presenting data are to
be considered; research design, target population, samplings and sample procedure; piloting,
research instruments, validity and reliability of instruments; data collection, data analysis and
presentation technique.
3.2 Research Design
According to McMillan and Schumacher (2001), a research design is a plan for selecting
subjects, research sites and data collection procedures to answer the research questions. A
research design is the arrangement of conditions for collection and analysis of data in a manner
that aims to combine relevance to the research purpose with economy in procedure (Seltiz,
1963). It is the conceptual structure within which research is conducted and it also constitutes the
blueprint for the collection of data and analysis of the collected data. Consideration of these
procedures assist the investigator in answering the research questions formulated (M’Mwari,
1999).
The design shows which individuals were studied, when and where and under which
circumstances they were being studied. More equally, research design refers to the way the study
is designed, that is, the method used to carry out a research. It is important to highlight the two
main methods when investigating and collecting data quantitative and qualitative. A quantitative
18
approach is strongly linked to deductive testing of theories through hypotheses, while a
qualitative approach to research generally is concerned with inductive testing (Saunders et al,
2003). The main focus of this study was quantitative. However some qualitative approach was
used in order to gain a better understanding and to enable a better and more insightful
interpretation of the results from the quantitative study.
This research was conducted as a case study of Safaricom M-pesa product development
and operations department. The findings of this study are expected to form a useful background
for planning a major investigation on the challenges facing M-pesa transaction capacity
management. The findings of the study will also form a basis for conducting further investigation
into other services relating to the M-pesa money transfer service. Assessing the factors affecting
effective capacity management in the M-pesa system will require the use of qualitative methods
(Creswell, 2003).
3.3 Population
According to Kothari (2004), a population is a well-defined or set of people, services, elements,
and events, group of things or households that are being investigated. This definition ensures that
population of interest is homogeneous. And by population the researcher means complete census
of the sampling frames. Population studies are also called census and are more representative
because everyone is included (Mugenda and Mugenda, 1999).
The sample of the study comprised 200 individuals who perform M-pesa transaction on a
day to day basis; 20 system engineers, 40 system users, 40 operators and 100 customers. The
study focused on the section and particularly the four categories that are involved in the M-pesa
money transfer service either as system users, operators, customers, or engineers and also
managerial level staff. The table below shows the selection from the population of interest:

19
Table 3.1: Target Population
Category of Population Population frequency Percentage (%)
System engineers 20 10
System users 40 20
Operators 40 20
Consumers 100 50
Total 200 100
Source: Research data, 2011
3.4 Sampling Techniques and Sample Size
A research sample can be defined as the people who actually participate in a study, (KAC, 2002).
Sampling is the process of selecting a number of individuals for a study in such a way that the
individuals selected represented the large group from which they were selected. This is done to
secure a representative group which will enable the researcher to gain information about a
population. From the above population of two hundred, a sample of 50% from within each group
in proportions that each group bear to the population as a whole was selected using stratified
random sample. From the stratified sample, the selection of respondents to the actual sample
was as per the following table:
Table 3.2: Sampling Techniques and Sample Size
Category Population frequency (N) Sample Ratio Sample (n)
System engineers 20 0.5 10
System users 40 0.5 20
Operators 40 0.5 20
Consumers 100 0.5 50
Total 200 0.5 100
Source: Research data, 2011
20
3.5 Data Collection Techniques
The researcher visited the Safaricom premises to administer questionnaires and interviews. The
respondents filled the questionnaires while the researcher conducted the interviews using the
interviewee guides. The researcher explained the purpose of the instrument to the respondents
before the actual data collection. The questionnaires were collected after two weeks by which
time the respondents had all enough time to complete the instruments.
The interviews with the engineers and system users and operators allowed the researcher
to have a better exposure of their perspectives, and their deeper thoughts about the capacity
challenges. This less structured approach allowed the interviews to be much more like
conversations and permitted the obtaining of information which would not otherwise have been
obtained. This is in line with the findings of Marshall and Rossman (1997).
3.6 Data Analysis
Data collected was analyzed through use of frequency tables, percentages, and means. It was
then presented in form of tables which is a standard way that enables easy understanding. Both
qualitative and quantitative analysis was done. Content analysis was also done for the thematic
areas under investigation. Bryman and Bell (2003) have described data analysis as a technique
used to make inferences from data collected by means of a systematic and objective
identification of specific characteristics.
21
CHAPTER FOUR: DATA ANALYSIS, FINDINGS AND DISCUSSIO N
4.1 Response Rate
The response rate for the questionnaire from the categories was substantially high. Out of 175
questionnaire sent to the respondents, 118 questionnaires were returned for analysis which
included a gender stratification of 98 male and 30 female making the response rate of 66%. This
high response rate indicates that the sample was representative of respondents involved in the M-
pesa money transfer service.
4.2 M-pesa Challenges
The study inquired into the challenges respondents faced with while using the M-pesa service.
They cited delays, failure of the system, and lack of efficient customer support and high charges
of use. Respondents reported that they turned to the Customer Care department to seek help for
these challenges. Others reported that they decided to turn to alternative outlets, such as ATM
withdrawals.
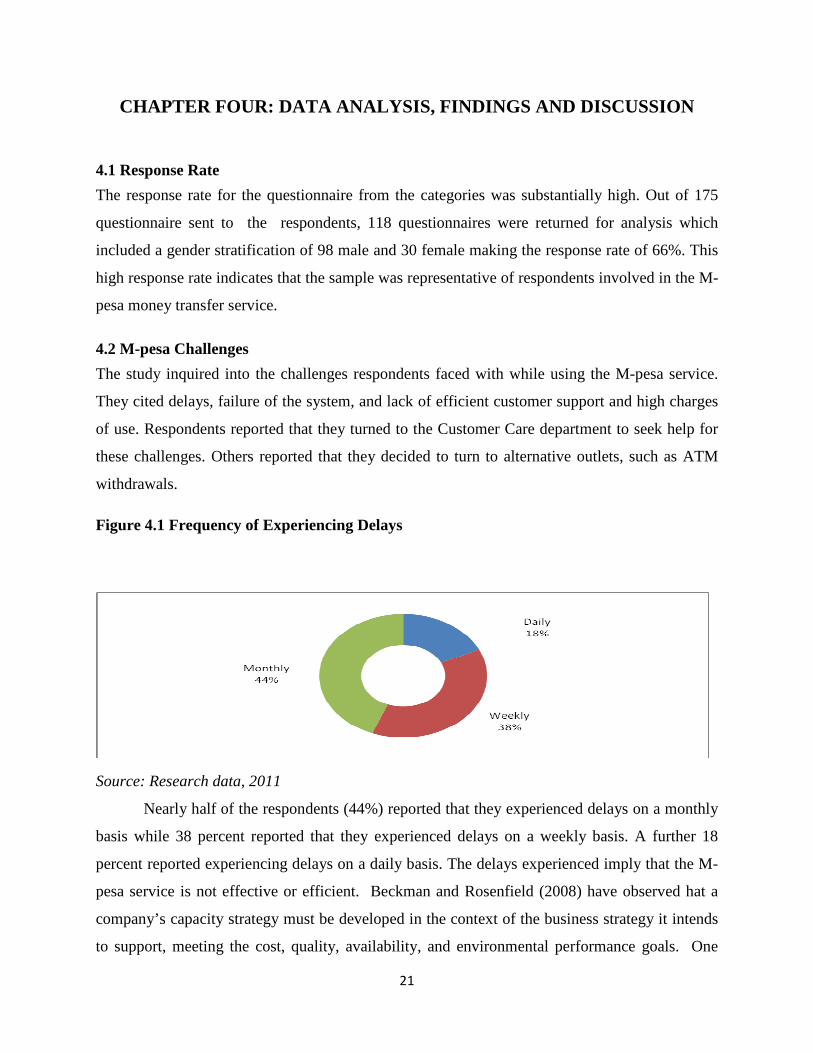
Figure 4.1 Frequency of Experiencing Delays
Source: Research data, 2011
Nearly half of the respondents (44%) reported that they experienced delays on a monthly
basis while 38 percent reported that they experienced delays on a weekly basis. A further 18
percent reported experiencing delays on a daily basis. The delays experienced imply that the M-
pesa service is not effective or efficient. Beckman and Rosenfield (2008) have observed hat a
company’s capacity strategy must be developed in the context of the business strategy it intends
to support, meeting the cost, quality, availability, and environmental performance goals. One
22
way to achieve the operational goals of performance is to develop flexibility capabilities. They
identify some of the flexibility capabilities that an organization can create. These include:
volume flexibility, and product or service mix flexibility.
Most respondents reported that they contacted the Customer Care department
immediately they experienced delays. They reported that the duration of solving the problem
usually ranged from just a few hours to a maximum of one day. This wide range of responding
to customer requests implies that the human resources aspects of the M-pesa service do not have
adequate competence to handle the requests. Literature shows that human resources capacity is
an important aspect of overall product or service capacity. This calls for training of the available
resources. Slack and Lewis (2008) have stated that technology decisions (such as the M-pesa
service) have human resource implications. They observe that a company must evaluate whether
it has adequate technical or human skills required to implement the technology for service
provision. Every process technology will need a set of skills to be present within the
organization, so that it can be successfully implemented. If new technology is very similar to
that existing in the organization, it is likely that the necessary skills will already be present. If,
however, the technology is completely novel, it is necessary to identify the required skills and to
match these against those existing in the organization (ibid.).
4.3 System Users
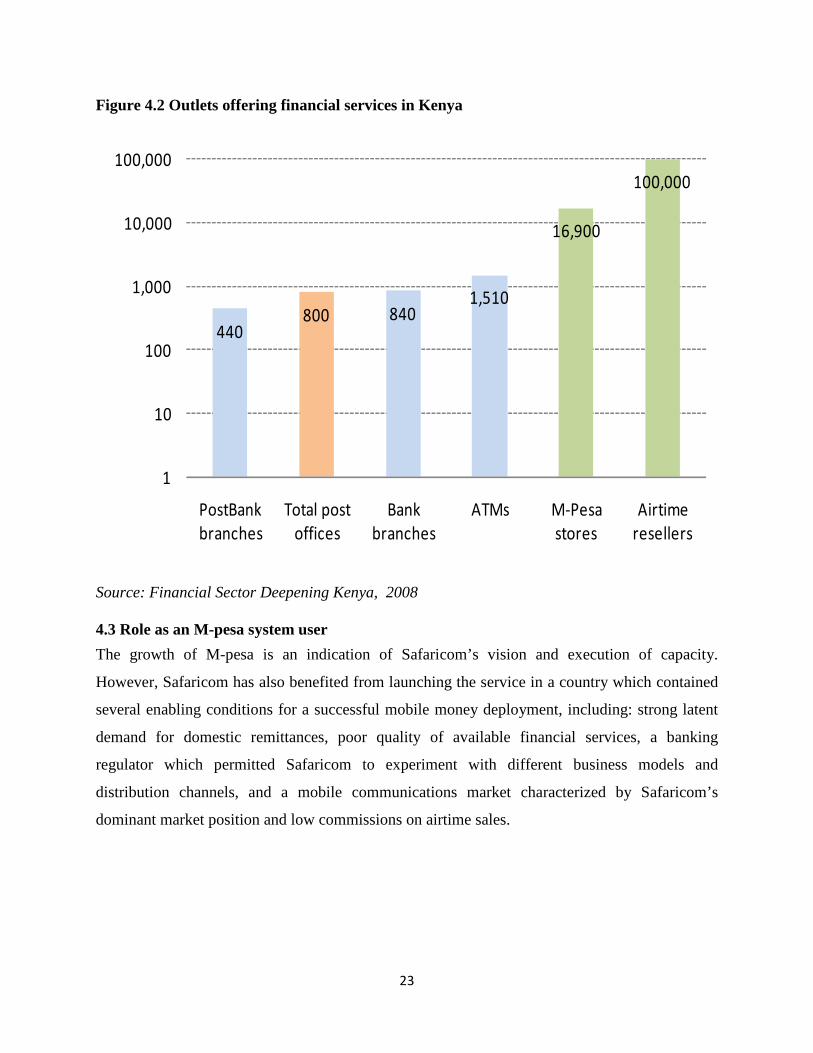
M-PESA is useful as a retail payment platform because it has extensive reach into large
segments of the population. The next chart shows the size of various retail channels in Kenya.
From this chart, there are nearly five times the number of M-PESA outlets compared to the
Postbank branches, post offices, bank branches, and automated teller machines (ATMs) in the
country. This wide network implies that using existing retail stores as M-PESA cash-in/cash-out
outlets would reduce the deployment costs and provide greater convenience and lower cost of
access to users.
23
Figure 4.2 Outlets offering financial services in Kenya
440800 840
1,510
16,900
100,000
1
10
100
1,000
10,000
100,000
PostBank
branches
Total post
offices
Bank
branches
ATMs M-Pesa
stores
Airtime
resellers
Source: Financial Sector Deepening Kenya, 2008
4.3 Role as an M-pesa system user
The growth of M-pesa is an indication of Safaricom’s vision and execution of capacity.
However, Safaricom has also benefited from launching the service in a country which contained
several enabling conditions for a successful mobile money deployment, including: strong latent
demand for domestic remittances, poor quality of available financial services, a banking
regulator which permitted Safaricom to experiment with different business models and
distribution channels, and a mobile communications market characterized by Safaricom’s
dominant market position and low commissions on airtime sales.
24
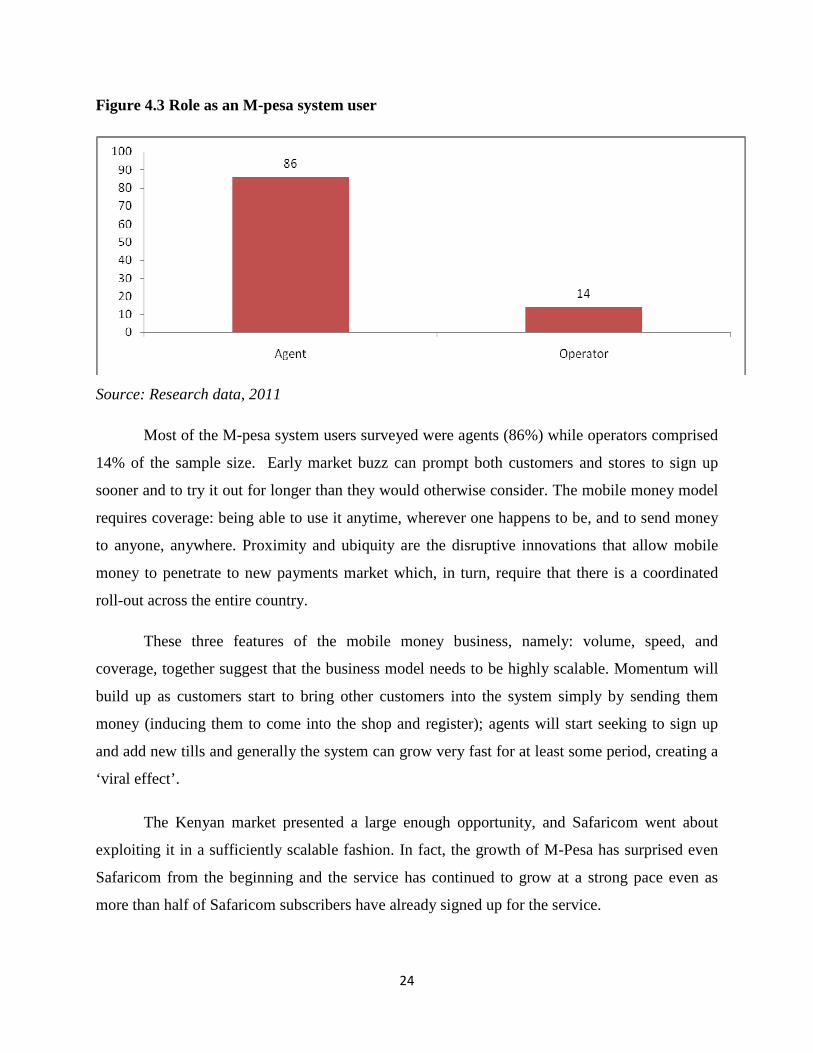
Figure 4.3 Role as an M-pesa system user
Source: Research data, 2011
Most of the M-pesa system users surveyed were agents (86%) while operators comprised
14% of the sample size. Early market buzz can prompt both customers and stores to sign up
sooner and to try it out for longer than they would otherwise consider. The mobile money model
requires coverage: being able to use it anytime, wherever one happens to be, and to send money
to anyone, anywhere. Proximity and ubiquity are the disruptive innovations that allow mobile
money to penetrate to new payments market which, in turn, require that there is a coordinated
roll-out across the entire country.
These three features of the mobile money business, namely: volume, speed, and
coverage, together suggest that the business model needs to be highly scalable. Momentum will
build up as customers start to bring other customers into the system simply by sending them
money (inducing them to come into the shop and register); agents will start seeking to sign up
and add new tills and generally the system can grow very fast for at least some period, creating a
‘viral effect’.
The Kenyan market presented a large enough opportunity, and Safaricom went about
exploiting it in a sufficiently scalable fashion. In fact, the growth of M-Pesa has surprised even
Safaricom from the beginning and the service has continued to grow at a strong pace even as
more than half of Safaricom subscribers have already signed up for the service.
25
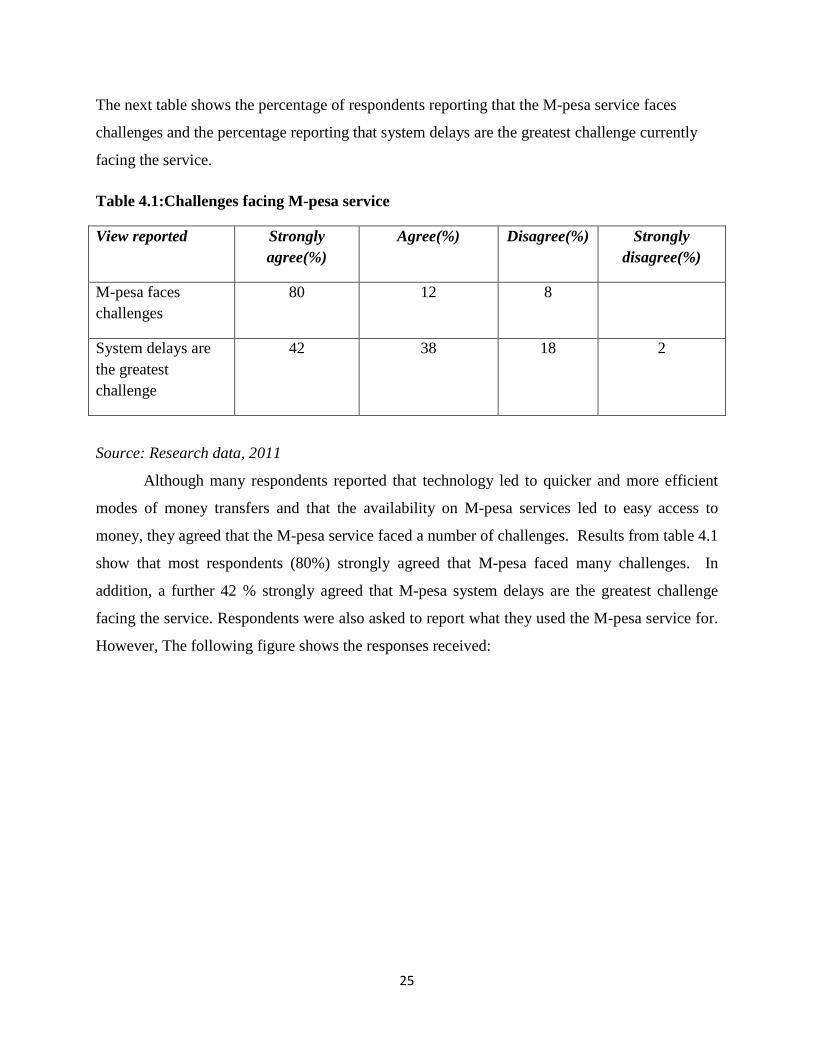
The next table shows the percentage of respondents reporting that the M-pesa service faces
challenges and the percentage reporting that system delays are the greatest challenge currently
facing the service.
Table 4.1:Challenges facing M-pesa service
View reported Strongly agree(%)
Agree(%) Disagree(%) Strongly disagree(%)
M-pesa faces challenges
80 12 8
System delays are the greatest challenge
42 38 18 2
Source: Research data, 2011
Although many respondents reported that technology led to quicker and more efficient
modes of money transfers and that the availability on M-pesa services led to easy access to
money, they agreed that the M-pesa service faced a number of challenges. Results from table 4.1
show that most respondents (80%) strongly agreed that M-pesa faced many challenges. In
addition, a further 42 % strongly agreed that M-pesa system delays are the greatest challenge
facing the service. Respondents were also asked to report what they used the M-pesa service for.
However, The following figure shows the responses received:
26
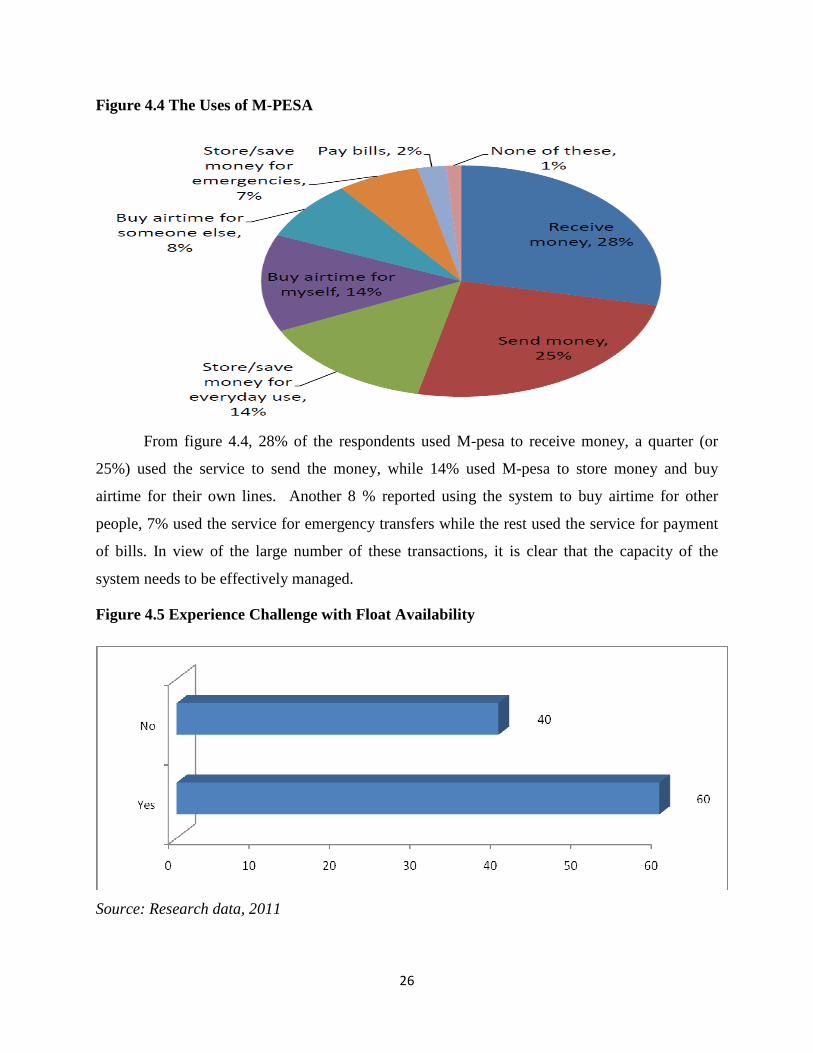
Figure 4.4 The Uses of M-PESA
From figure 4.4, 28% of the respondents used M-pesa to receive money, a quarter (or
25%) used the service to send the money, while 14% used M-pesa to store money and buy
airtime for their own lines. Another 8 % reported using the system to buy airtime for other
people, 7% used the service for emergency transfers while the rest used the service for payment
of bills. In view of the large number of these transactions, it is clear that the capacity of the
system needs to be effectively managed.
Figure 4.5 Experience Challenge with Float Availability
Source: Research data, 2011
27
The researcher sought to find out from the customer respondents if they experienced
challenges with float availability at the agent outlet. The findings from the study showed that a
majority of the respondents (60%) experienced challenges with float availability while 40% did
not experience these challenges. This information is shown in figure 4.5 above. This was not
surprising because literature reviewed by the researcher showed that float availability was a
major challenge.
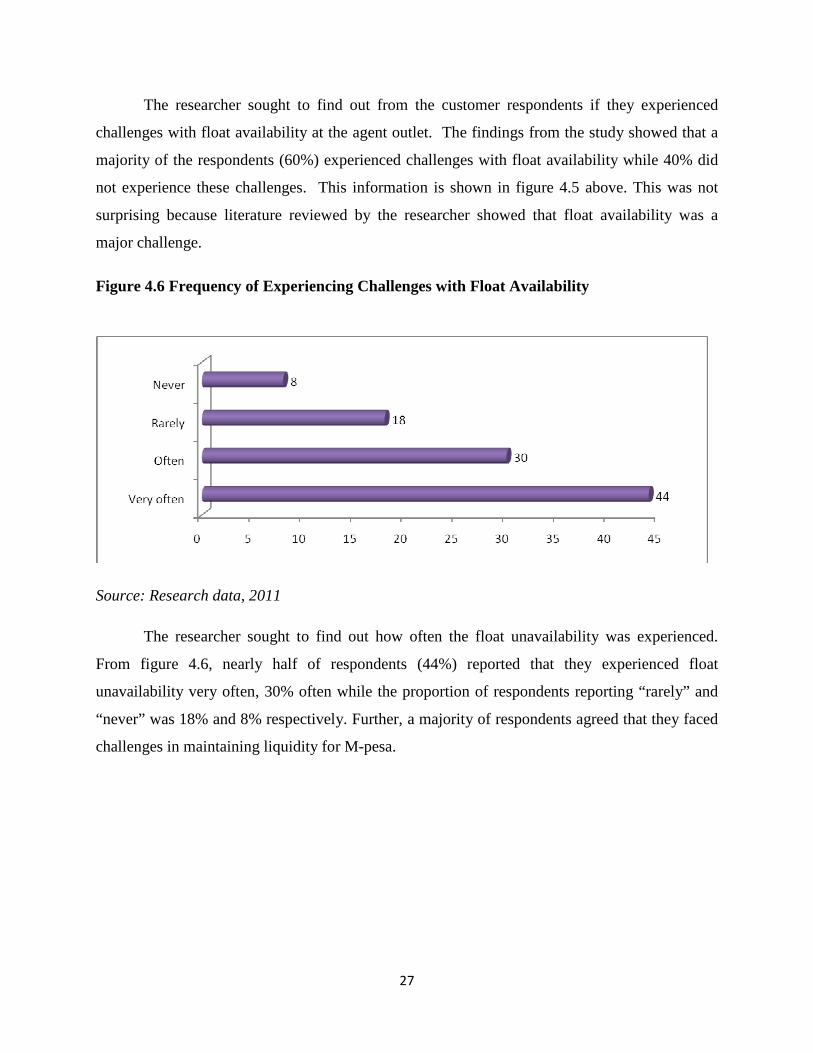
Figure 4.6 Frequency of Experiencing Challenges with Float Availability
Source: Research data, 2011
The researcher sought to find out how often the float unavailability was experienced.
From figure 4.6, nearly half of respondents (44%) reported that they experienced float
unavailability very often, 30% often while the proportion of respondents reporting “rarely” and
“never” was 18% and 8% respectively. Further, a majority of respondents agreed that they faced
challenges in maintaining liquidity for M-pesa.
28
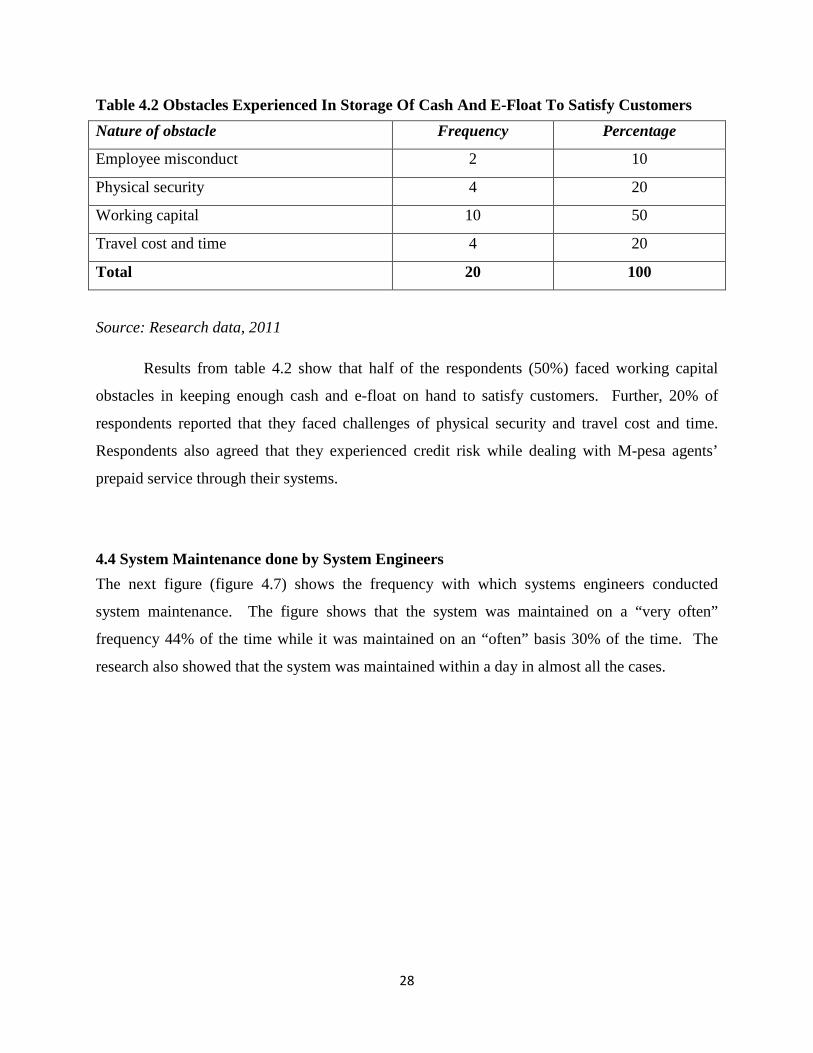
Table 4.2 Obstacles Experienced In Storage Of Cash And E-Float To Satisfy Customers
Nature of obstacle Frequency Percentage
Employee misconduct 2 10
Physical security 4 20
Working capital 10 50
Travel cost and time 4 20
Total 20 100
Source: Research data, 2011
Results from table 4.2 show that half of the respondents (50%) faced working capital
obstacles in keeping enough cash and e-float on hand to satisfy customers. Further, 20% of
respondents reported that they faced challenges of physical security and travel cost and time.
Respondents also agreed that they experienced credit risk while dealing with M-pesa agents’
prepaid service through their systems.
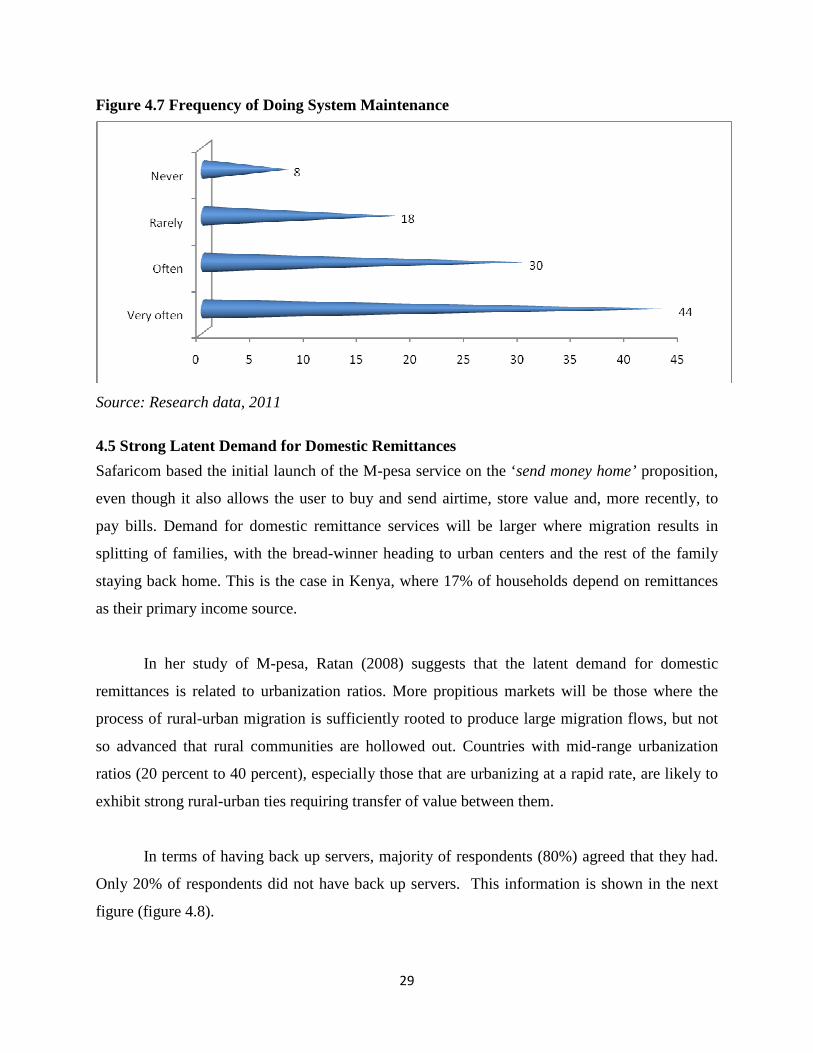
4.4 System Maintenance done by System Engineers
The next figure (figure 4.7) shows the frequency with which systems engineers conducted
system maintenance. The figure shows that the system was maintained on a “very often”
frequency 44% of the time while it was maintained on an “often” basis 30% of the time. The
research also showed that the system was maintained within a day in almost all the cases.
29
Figure 4.7 Frequency of Doing System Maintenance
Source: Research data, 2011
4.5 Strong Latent Demand for Domestic Remittances
Safaricom based the initial launch of the M-pesa service on the ‘send money home’ proposition,
even though it also allows the user to buy and send airtime, store value and, more recently, to
pay bills. Demand for domestic remittance services will be larger where migration results in
splitting of families, with the bread-winner heading to urban centers and the rest of the family
staying back home. This is the case in Kenya, where 17% of households depend on remittances
as their primary income source.
In her study of M-pesa, Ratan (2008) suggests that the latent demand for domestic
remittances is related to urbanization ratios. More propitious markets will be those where the
process of rural-urban migration is sufficiently rooted to produce large migration flows, but not
so advanced that rural communities are hollowed out. Countries with mid-range urbanization
ratios (20 percent to 40 percent), especially those that are urbanizing at a rapid rate, are likely to
exhibit strong rural-urban ties requiring transfer of value between them.
In terms of having back up servers, majority of respondents (80%) agreed that they had.
Only 20% of respondents did not have back up servers. This information is shown in the next
figure (figure 4.8).

30
Figure 4.8 Back Up Servers for The M-Pesa System
Source: Research data, 2011
Further, most respondents agreed that the system was able to comfortably handle the current
growing transaction capacity.
The challenge remains for M-pesa to become a vehicle for delivery of a broader range of
financial services to the bulk of the Kenyan population. So far, the evidence is limited that
people are willing to use the basic M-pesa account itself as a store of value. There is likely to be
a need to develop more targeted savings products that balance customers’ preference for liquidity
and commitment and which also connect into a broader range of financial institutions. If M-pesa
is able to accomplish this, it will be able to deliver on its promise of addressing the challenge of
financial inclusion in Kenya. A key precondition is regulation: the Central Bank of Kenya is in
the process of finalizing regulations that will allow non-bank outlets and platforms such as M-
pesa to become channels of for formal deposit-taking. Beyond that, Safaricom will need to
develop appropriate service, commercial and technical models for M-pesa to interwork with the
systems of other financial service providers.
4.6 The Broader Significance of M-PESA
M-pesa has demonstrated the promise of leveraging mobile technology to extend financial
services to large segments of unbanked poor people. This is fundamentally because the mobile
phone is quickly becoming a ubiquitously deployed technology, even among poor segments of
the population. Mobile penetration in Africa has increased from 3 percent in 2002 to 48 percent
today, and is expected to reach 72 percent by 2014. And, happily, the mobile device mimics
31
some of the key ingredients needed to offer banking services. The SIM card inside GSM phones
can be used to authenticate users, thereby avoiding the costly exercise of distributing separate
bank cards to low-profitability poor customers. The mobile phone can also be used as a point of
sale (POS) terminal to initiate financial transactions and securely communicate with the
appropriate server to request transaction authorization, thus obviating the need to deploy costly
dedicated devices in retail environments.
M-pesa has demonstrated the importance of designing usage- rather than float-based
revenue models for reaching poor customers with financial services. Because dealers make most
of their money by collecting and reinvesting deposits, they tend to distinguish between profitable
and unprofitable customers based on the likely size of their account balances and their ability to
absorb credit. Dealers thus find it difficult to serve poor customers because the revenue from
reinvesting small-value deposits is unlikely to offset the cost of serving these customers. In
contrast, mobile operators in developing countries have developed a usage-based revenue model,
selling prepaid airtime to poor customers in small increments, such that each transaction is
profitable on a stand-alone basis. This is the magic behind the rapid penetration of prepaid
airtime into low-income markets: a card bought is profit booked, regardless of who bought the
prepaid card. This usage-based revenue model is directly aligned with the model needed to
sustainably offer small-value cash-in/cash-out transactions at retail outlets and would make
possible a true mass-market approach, with no incentive for providers to deny service based on
minimum balances or intensity of use.
M-pesa has demonstrated the importance of building a low-cost transactional platform
which enables customers to meet a broad range of their payment needs. Once a customer is
connected to an e-payment system, she can use this capability to store money in a savings
account, send and receive money from friends and family, pay bills and monthly insurance
premiums, receive pension or social welfare payments, or receive loan disbursements and repay
them electronically. In short, when a customer is connected to an e-payment system, her range of
financial possibilities expands dramatically.
Putting these elements together, M-pesa has prompted a rethink on the optimal
sequencing of financial inclusion strategies. Where most financial inclusion models have
employed “credit-led” or “savings-led” approaches, the M-pesa experience suggests that there

32
may be a third approach focus first on building the payment “rails” on which a broader set of
financial services can ride.
4.7 Three Perspectives Accounting for the M-Pesa Success
A number of papers have been written on M-pesa’s success. Heyer and Mas (2009) discussed
the country factors that led to M-pesa’s success, Mas and Morawczynski (2009) have written on
the M-pesa’s service features, Mas and Ng’weno (2010) have investigated Safaricom’s M-pesa
execution strategy while Mas (2009) studied the economics underpinning branchless banking
systems. Beyond the compelling marketing, cold business logic and consistent execution of M-
pesa highlighted by these scholars, the service’s success is a vivid example of how great things
happen when a group of leaders from different organizations rally around common challenges
and ideas.

32
CHAPTER FIVE: SUMMARY, CONCLUSION AND RECCOMENDATIONS
5.1 Summary of the M-pesa Innovation
The study established that most respondents (64%) used M-pesa services. Almost half of the
respondents (44%) used M-pesa service on a weekly basis, 38% used M-pesa services on a
monthly basis, while 18% used it on a daily basis. Respondents reported that system delays were
the most serious challenges facing the M-pesa service. Other challenges included: failure of the
system, lack of efficient customer support, and high user charges. To deal with some of these
challenges, respondents resorted to alternative banking services which included ATM
withdrawals.
On the issue of the frequency of experiencing delays, about half of the respondents (44%)
experienced delays on a monthly basis, 38% experienced delays on a weekly basis while 18%
experienced delays on a daily basis. Further, most respondents contacted customer care
immediately when there were delays and such delays were solved within one day at the
maximum. The study also inquired into how changes in technology have affected the mobile
money transfers. The respondents reported that technology has led to quicker and more efficient
modes of money transfers and that the availability on M-pesa services has greatly eased access to
money.
The study found that the M-pesa money transfer service has demonstrated the possibility
and also importance of building a low-cost transactional platform which enables customers to
meet a broad range of their payment needs. Once a customer is connected to an e-payment
system, such customer can use this capability to store money in a savings account, send and
receive money from friends and family, pay bills and monthly insurance premiums, receive
pension or social welfare payments, or receive loan disbursements and repay them electronically.
Thus, when a customer is connected to an e-payment system, his range of financial possibilities
expands dramatically. M-pesa has the potential to meet all these user needs if properly supported
and if it continues to make use of innovation.
33
5.2 Conclusions
This study concludes that the M-pesa service faces a number of challenges. The major ones
were found to be system delays, slow customer care response and help, and slow processing
procedures especially during the weekends. From this, the study concludes that the capacity of
the M-pesa platform is not efficient and therefore calls for improvement in capacity
management. Specifically, management of capacity should address challenges of float
availability and problems of storing enough cash and e-float to meet immediate customer needs.
The study observes that regular maintenance of the M-pesa system is one way through
which the system’s capacity can be managed. This will help address problems of transaction
delays and in the process improve services to customers through speedy support, and lower user
charges.
5.3 Recommendations
From the findings of this study, it is recommended that Safaricom put in place an effective
capacity management strategy for its M-pesa services. This should include regular system
maintenance and introduce user-friendliness features. The cost of services was found to be too
high for majority of customers, a factor which limits the reach of the service. It is also
recommended that the M-pesa system investigate ways through which float management can be
undertaken. Information and education with respect to products and services should also be
undertaken through various promotional and outreach programmes.
The study found that Safaricom Ltd has tended to focus more on system capacity with
less emphasis on human resources and subcontractors capacities. Beckman and Rosenfield
(2008) have observed that the capacity of human resources is critical in most industries.
Tangible costs associated with making changes in human resources include hiring, firing,
training, and overtime costs. They have also noted that firms may also use subcontractors as a
source of external capacity to buffer the effects of demand variability of their own internal
resources, or simply to provide an alternative to internal capacity. From the results of this study,
it is recommended that Safaricom investigate ways by which it can improve its M-pesa services
through improvement of human resources capacity. The company should also consider the
possibility of subcontracting capacity so as to deal with issues of demand variability and to
34
provide an alternative to internal capacity, especially when the M-pesa system is down or cannot
cope with high demand at peak time.
Finally, it is recommended that Safaricom undertake a systematic capacity planning
process for its M-pesa services. This should include an analysis of the overall company strategy
and competitive environment, developing a demand forecast, and identification of capacity
expansion alternatives. The company should also assess the implications of the adopted strategy,
develop an implementation plan and finally measure the results of the adopted strategy as a
feedback process.
5.4 Limitations of Study
In undertaking this study, a number of challenges were faced. Some of these included fear of
victimization where respondents were afraid to provide factual information on the basis that
information provided could be used against them. There were also concerns of confidentiality
with respondents fearing that information provided might not be used for the purposes for which
it ws sought. Last but not lest, the researcher found that some respondents were uncomfortable
in sharing information for reasons that could not be explained.
5.5 Suggestions for further study
The study focused on effective capacity in mobile phone money transfer services. It is suggested
that similar research be carried out for other competing services(such as Orange Money and
YU-Cash ) . A comparison of the effectiveness of the M-pesa and the competing services should
then be undertaken.
For policy makers, this study recommends a future study on the economic implication of
mobile money transfers. Such a study should seek to establish the impact of mobile money
transfer on macroeconomic variables of the GDP and employment. The study should aim at
quantifying the economic implications of the money transfer services.
It is also proposed that future research be undertaken on the effect of mobile money
transfer on rural-urban trends in Kenya. This is especially important because Safaricom has
based its M-pesa services on the “send money back home” proposition where people in towns

35
can send money to their relatives still living in the rural areas. This study would also seek to
evaluate the continued relevance of this proposition and to show whether it has out-lived its
usefulness.

35
REFERENCES Abrahamson, E. (1996), "Management fashions", Academy of Management Review, 21
(1),254 85.
Andriessen, D. (2004), Making Sense of Intellectual Capital, Amsterdam: Elsevier,.
Ansoff, H.I. (1965), Corporate Strategy. New York, NY: McGraw-Hill.
Barbie, B,.(1995:225), Intangibles: Management, Measurement and Reporting. Washington,
DC, The Brookings Institute,
Barney, J. (1991), Firm resources and sustained competitive advantage, Journal of
Management, 17 (1), 99-120.
Barney, J.B. (1995), Looking inside for competitive advantage, Academy of Management
Executive, 9(4), 49-65.
Beckman, Sara L. and Donald B. Rosenfield (2008). Operations Strategy, Competing in the
21st Century. McGraw Hill, New York.
Black, J.A. and Boal, K.B. (1994), Strategic resources: traits, configurations and paths to
sustainable competitive advantage, Strategic Management Journal, 15 (2), 131-136.
Bontis, N. (2003), Intellectual capital disclosure in Canadian corporations, Journal of Human
Resource Costing and Accounting, 7 (.1/2), 9-20.
Bryman and Bell (2003), Is the resource-based ‘view’ a useful perspective for strategic
management research?, The Academy of Management Review, 26 (1), 22-40.
Business Daily, (2011).Strategy and the Delusion of Grand Designs
Chandler, A.D. (1990), Economies of Scale and Scope: The Dynamics of Industrial
Capitalism, Boston M.A: Harvard Business School.
Chesbrough, H. (2003), Open Innovation: The New Imperative for Creating and Profiting
from Technology, Boston MA: Harvard Business School Press.
Conner, K. (1991), A historical comparison of resource-based theory and five schools of
thought within industrial organization economics: do we have a new theory of the firm?,
Journal of Management,. 17 (1), 121-154.
Cort, K.T., Griffith, D.A., and White, D.S. (2007), An attribution theory approach for
understanding the internationalization of professional service firms, International
Marketing Review, 24 (1), 9-25.

36
Creswell, H. (2003), "Ten ideas designed to rile everyone who cares about management",
Harvard Business Review, 74 (4), 61-67.
Dierickx, I. and Cool, K. (1989), Asset stock accumulation and sustainability of competitive
advantage, Management Science, 35 (12), 1504-1511.
Dussauge, P., Garrette, B. and Mitchell, W. (2000), Learning from competing partners:
outcomes and durations of scale and link alliances in Europe, North America and Asia,
Strategic Management Journal, 21 (2), 99-126.
Eriksen, B. and Mikkelsen, J. (1996), Competitive advantage and the concept of core
competence, in Foss, N.J., Knudsen, C. (Eds),Towards a Competence Theory of the
Firm,Routledge, London, 54-74.
Flynn, B.B., Sakakibara, S. and Schroeder, R.G. (1995), "Relationship between JIT and
TQM: practices and performance", Academy of Management Journal, 38 (5),1325-1360.
Gagnon, S. (1996), "The rise and fall of TQM and BPR: a literature review", Working Paper,
Garvin, D.A. (1994), "Manufacturing strategic planning", California Management Review,
35(4), 85-106.
Grant, R.M. (1991), The resource-based theory of competitive advantage: implications for
strategy formulation, California Management Review, 4(2), 114-135.
Grant, R.M., Shani, R., and Krishnan, R. (1994), "TQM’s challenge to management theory
and practice", Sloan Management Review,14(2),25-35.
Hall, R. (1992), The strategic analysis of intangible resources, Strategic Management
Journal,12 (13), 135-144.
Hamel, G. (1991), Competition for competence and interpartner learning within international
strategic alliances, Strategic Management Journal, 12 (1), 83-103.
Helfat, C.R. and Raubitschek, R. (2000), Product sequencing: co-evolution of knowledge,
capabilities, and products, Strategic Management Journal, 21(10/11), 961-979.
Hill, T.J. (1989), Manufacturing Strategy: Text and Cases, Homewood, IL. Irwin,.
Hitt, M.A., Ireland, R.D. and Hoskisson, R.E. (2005), Strategic Management, 6th ed. Mason,
OH| Thomson South-Western
Hoopes, D.G., Madsen, T.L. and Walker, G. (2003), Guest editors' introduction to the special
issue: why is there a resource-based view? Toward a theory of competitive
heterogeneity, Strategic Management Journal, 24(10), 889-902.
37
Johanson, U. (2000), Characteristics of intangibles – proposals generated from literature and
experienced Swedish firms, in Gröjer, J.E. and Stolowy, H. (Eds),Classification of
Intangibles,Groupe HEC, Paris, pp.56-77.
Kerama L.N. (2003) The Resource Based View of Competitiveness. A Survey of
Manufacturing Firms Listed in the NSE
Kogut, B. and Kulatilaka, N. (2001), Capabilities as real options, Organization Science,12
(2),744-758.
Kothari C.R. (2004), Research Methodology: Methods and Techniques.2ndEd.New, New
Delhi Age International (P) Limited.
Krogh V. and Roos, G. (1999), The knowledge toolbox: a review of the tools available to
measure and manage intangible resources, European Management Journal,17 (4), 391-
397.
Leonard-Barton, D. (1992), Core capabilities and core rigidities: a paradox in managing new
product development, Strategic Management Journal, 13 (1), 111-126.
Lippman, S.A. and Rumelt, D.P., (1982), Uncertain Imitability: An Analysis of Interfirm
Differences in Efficiency Under Competition. The Bell Journal of Economics; 13, (2),
.418-432.
Luo, Y. (2002), "Capability exploitation and building in a foreign market: implications for
multinational enterprises", Organization Science, 13 (1), 48-63.
Luo, Y. (2004), Building a strong foothold in an emerging market: a link between resource
commitment and environment conditions, Journal of Management Studies,. 41(5),749-
773.
M’Mwari, (1999).Use of Resource Based Perspective as a Competitive Strategy at
JKUAT.An Unpublished MBA Project. Nairobi: University of Nairobi.
Mahoney, J.T. and Pandian, J.R. (1992), The resource-based view within the conversation of
strategic management, Strategic Management Journal, Vol. 13 pp.363-80.
Makadok, R. (2001), Toward a Synthesis of the Resource-Based View and Dynamic-
Capability Views of Rent Creation. Strategic Management Journal; 22, (4),387-401
McKelvey, B. (1999), "Avoiding complexity catastrophe in co evolutionary pockets:
strategies for rugged landscapes", Organization Science, 10(3), 294-321.
38
Mcmillan & Schumaker (2001); Non-enforceable implementation of enterprise mobilization:
an exploratory study of the critical success factors, Industrial Management & Data
Systems,105 (6), 786-814.
Morgan, N.A., Zou, S., Vorhies, D.W. and Katsikeas, C.S. (2003), "Experiential and
informational knowledge, architectural marketing capabilities, and the adaptive
performance of export ventures: a cross-national study", Decision Sciences, 34 (2), 287-
321.
Mugenda, O.M., and Mugenda, A.G. (2003). Research Methods: Quantitative & Qualitative
Approaches. Acts Press. Nairobi. Kenya.
Nonaka, I. and Konno, N. (1998), The concept of ‘Ba’: building a foundation for knowledge
creation, California Management Review, 40(3), 40-54.
Olhager et.al. (2001)., "Competing on resources: strategy in the 1990s", Harvard Business
Review, 119-28.
Penrose, E.T. (1959), The Theory of the Growth of the Firm. London,Basil Blackwell, .
Peteraf, M.A. and Barney, J.B. (2003), "Unravelling the resource-based tangle", Managerial
and Decision Economics, 24(4),309-23.
Porteous M. (2006), Towards an organic perspective on strategy, Strategic Management
Journal, 23 (7),561-94.
Porter, M. E. (1980), Competitive Strategy: Techniques for Analyzing Industries and
Competitors, New York, NY: Free Press
Porter, M.E. (1991), Towards a dynamic theory of strategy, Strategic Management Journal,
12 (6), 95-117.
Powell, T.C. (1995), "Total quality management as competitive advantage: A review and
empirical study", Strategic Management Journal, 16 (2) , 15-37.
Reeve G.S (2001).The capabilities of market-driven organizations, Journal of Marketing, 58
(4), 37-52.
Rikert, David C., and W. Earl Sasser, Jr. (1980). “McDonald’s Corporation.” Harvard
Business School Publishing.
Rugman A.M. and Verbeke, A. (2002), Edith Penrose’s Contribution to the Resource-Based
Views of Strategic Management.Strategic Management Journal; 23 (4), 769-780.
39
Russo, M.V and Fouts, P. (1997), "Resource-based perspective on corporate environmental
performance and profitability", The Academy of Management Journal, 40 (3), 534-559.
Sánchez, R., Heene, A. and Thomas, H. (1996), Towards the theory and practice of
competence-based competition,in Sánchez, R., Heene, A., Thomas, H. (Eds),Dynamics
of Competence-based Competition. Theory and Practice in the New Strategic
Management,Pergamon Press, Oxford, pp.1-35.
Serenko, A. and Bontis, N. (2004), Meta-review of knowledge management and intellectual
capital literature: citation impact and research productivity rankings, Knowledge and
Process Management,11 (3), 185-198.
Silva, Marucheck & McClelland, (1992). A resource-based theory of strategic alliances,
Journal of Management, 26 (1), 31-61.
Skinner, (1969) On how to measure managerial and organizational capabilities. Multi-item
models for measuring distinctive competences, Management Research, 3(1), 27-48.
Slack, N and Michael Lewis (2008). Operations Strategy. Pearson Education Ltd, Essex,
England.
Smith, D.J. (2003), Strategic alliances and competitive strategies in the European aerospace
industry: the case of BMW Rolls-Royce GmbH, European Business Review,15 (4), 27-
36
Valdecantos, J. (2009), The performance impact of marketing resources, Journal of Business
Research, 58 (1), 18-27.
Wade, M. and Hulland, J. (2004), The resource-based view and information systems
research: review, extension, and suggestions for future research, MIS Quarterly, 28 (1),
45-58
Wernerfelt, B. (1984), A resource-based view of the firm, Strategic Management Journal,
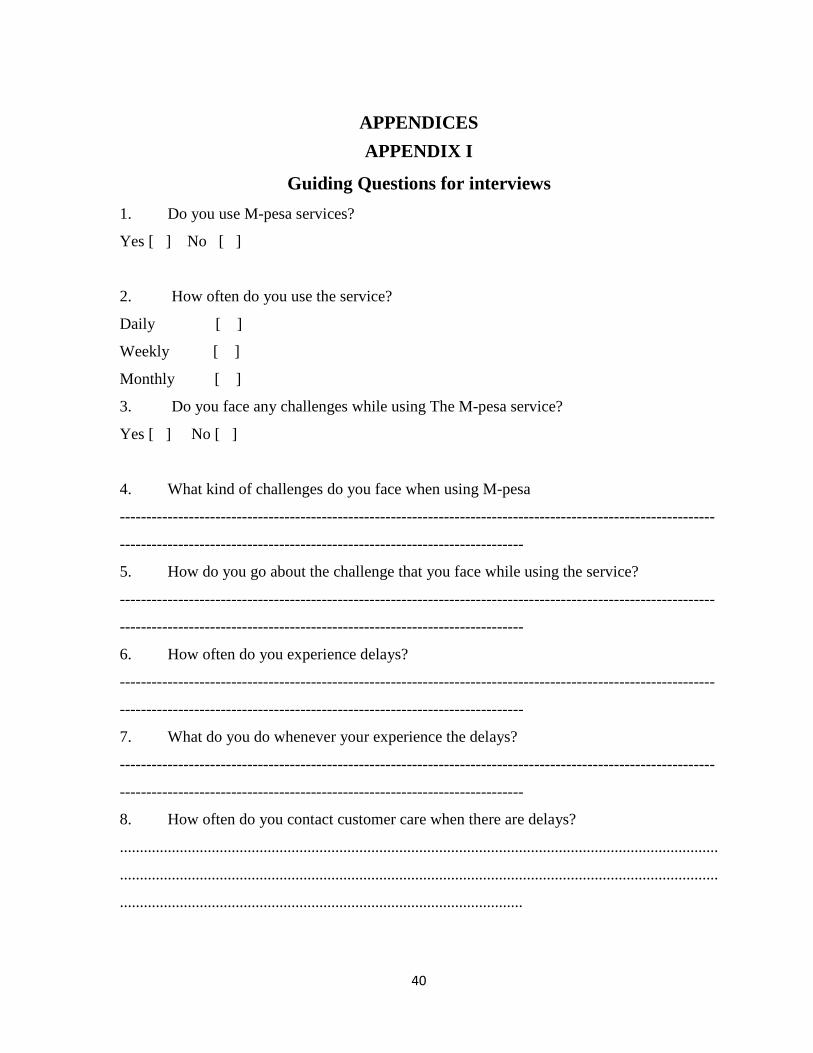
40
APPENDICES
APPENDIX I
Guiding Questions for interviews
1. Do you use M-pesa services?
Yes [ ] No [ ]
2. How often do you use the service?
Daily [ ]
Weekly [ ]
Monthly [ ]
3. Do you face any challenges while using The M-pesa service?
Yes [ ] No [ ]
4. What kind of challenges do you face when using M-pesa
----------------------------------------------------------------------------------------------------------------
----------------------------------------------------------------------------
5. How do you go about the challenge that you face while using the service?
----------------------------------------------------------------------------------------------------------------
----------------------------------------------------------------------------
6. How often do you experience delays?
----------------------------------------------------------------------------------------------------------------
----------------------------------------------------------------------------
7. What do you do whenever your experience the delays?
----------------------------------------------------------------------------------------------------------------
----------------------------------------------------------------------------
8. How often do you contact customer care when there are delays?
......................................................................................................................................................
......................................................................................................................................................
.....................................................................................................

41
9. How long does it take for the problem to be resolved?
......................................................................................................................................................
......................................................................................................................................................
10. How does change in technology affects the mobile money transfers to you?
…………………………………………………………………………………………………
…………………………………………………………………………………………………
…………………………………………………………………………………………………
Questionnaire for system Users
1. What is your role as an M-pesa system user?
a) Agent [ ]
b) Operator [ ]
2. Does M-pesa face any challenges?
[ ] Strongly Agree [ ] Agree [ ] Disagree [ ] Strongly Disagree
3. M-pesa system delays are the greatest challenge facing the service, so you agree?
[ ] Strongly Agree [ ] Agree [ ] Disagree [ ] strongly disagree
4. Do you as a system user encounter transactions that require manual completion?
[ ] yes [ ] No
If yes, how often do you complete transactions manually?
[ ] Very Often [ ] Often [ ] Rarely [ ] Never
5. Do you experience any challenge with float availability?
[ ] yes [ ] No
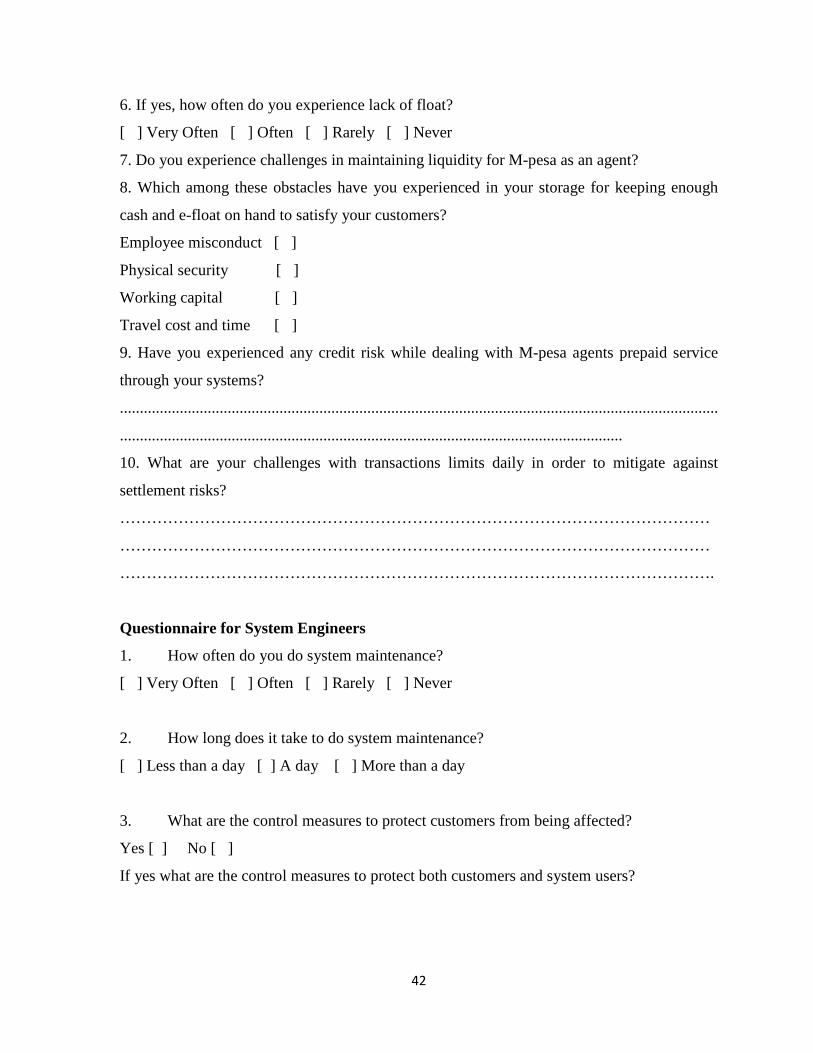
42
6. If yes, how often do you experience lack of float?
[ ] Very Often [ ] Often [ ] Rarely [ ] Never
7. Do you experience challenges in maintaining liquidity for M-pesa as an agent?
8. Which among these obstacles have you experienced in your storage for keeping enough
cash and e-float on hand to satisfy your customers?
Employee misconduct [ ]
Physical security [ ]
Working capital [ ]
Travel cost and time [ ]
9. Have you experienced any credit risk while dealing with M-pesa agents prepaid service
through your systems?
......................................................................................................................................................
..............................................................................................................................
10. What are your challenges with transactions limits daily in order to mitigate against
settlement risks?
…………………………………………………………………………………………………
…………………………………………………………………………………………………
………………………………………………………………………………………………….
Questionnaire for System Engineers
1. How often do you do system maintenance?
[ ] Very Often [ ] Often [ ] Rarely [ ] Never
2. How long does it take to do system maintenance?
[ ] Less than a day [ ] A day [ ] More than a day
3. What are the control measures to protect customers from being affected?
Yes [ ] No [ ]
If yes what are the control measures to protect both customers and system users?
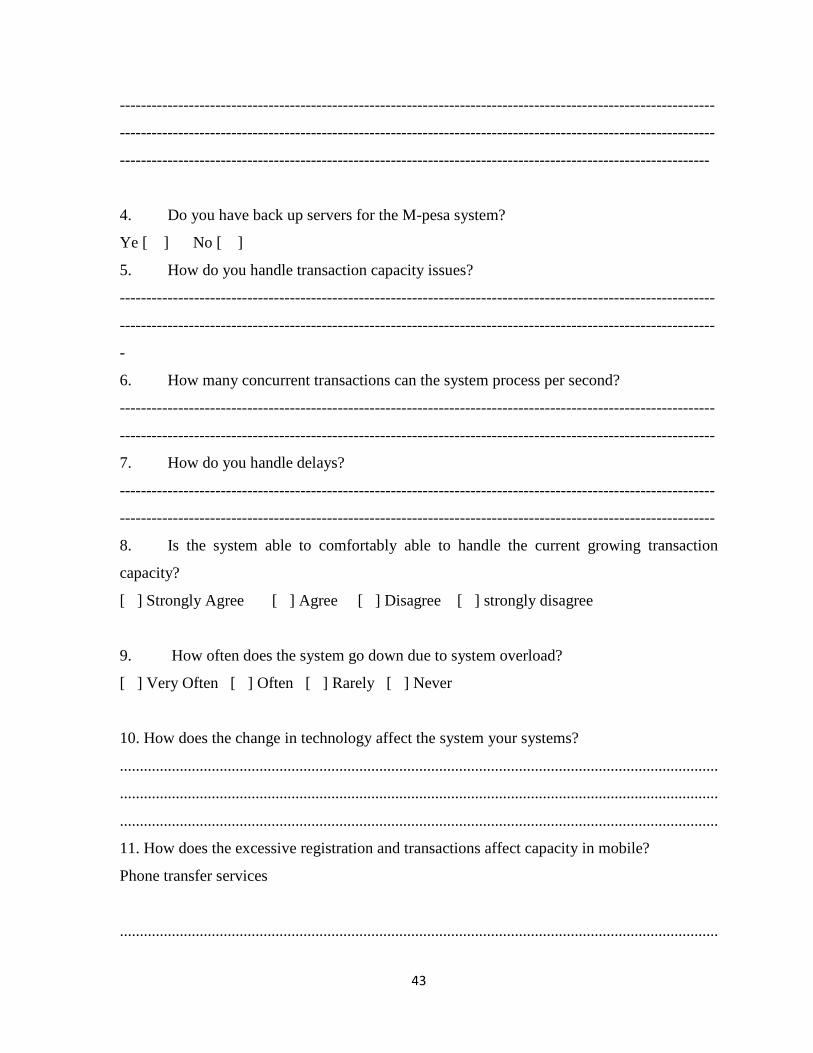
43
----------------------------------------------------------------------------------------------------------------
----------------------------------------------------------------------------------------------------------------
---------------------------------------------------------------------------------------------------------------
4. Do you have back up servers for the M-pesa system?
Ye [ ] No [ ]
5. How do you handle transaction capacity issues?
----------------------------------------------------------------------------------------------------------------
----------------------------------------------------------------------------------------------------------------
-
6. How many concurrent transactions can the system process per second?
----------------------------------------------------------------------------------------------------------------
----------------------------------------------------------------------------------------------------------------
7. How do you handle delays?
----------------------------------------------------------------------------------------------------------------
----------------------------------------------------------------------------------------------------------------
8. Is the system able to comfortably able to handle the current growing transaction
capacity?
[ ] Strongly Agree [ ] Agree [ ] Disagree [ ] strongly disagree
9. How often does the system go down due to system overload?
[ ] Very Often [ ] Often [ ] Rarely [ ] Never
10. How does the change in technology affect the system your systems?
......................................................................................................................................................
......................................................................................................................................................
......................................................................................................................................................
11. How does the excessive registration and transactions affect capacity in mobile?
Phone transfer services
......................................................................................................................................................

44
......................................................................................................................................................
......................................................................................................................................................
Questionnaire for Customers
1. Do you use the M-pesa service?
[ ] Yes [ ] No
2. How often do you use M-pesa?
[ ] Very Often [ ] Often [ ] Rarely [ ] Never
3. Do you face any challenges when using money transfer service?
[ ] Yes [ ] No
If yes, how often do you experience the challenges?
[ ] Very Often [ ] Often [ ] Rarely [ ] Never
4. Which of the following challenges do you as an M-pesa customer face?
1) System Delays [ ]
2) Lack of enough float by agents [ ]
3) Unavailability of enough agents [ ]
4) Account minimum and maximum limit [ ]
5) If other, please specify? .....................................................................................
…………………………………………………………………………………………………
…………………………………………………………………………………
5. How do you go about the challenges that you face?
1) Call customer care [ ]
2) Wait until it resumes [ ]
3) Report to the nearest M- pesa agent [ ]
4) No action [ ]
45
6. How long does it take for the challenge to resolved?
[ ] Immediately [ ] A day [ ] A week [ ] Never
7. How do you rate M-pesa service on a scale of 1-5?
Very low [ ] 1. [ ] 2. [ ] 3. [ ] 4. [ ] 5 Very High
8. In how many ways do you us M-pesa money transfer service?
To receive money Never [ ] Hardly[ ] Often[ ] Very often [ ]
To send money Never [ ] Hardly[ ] Often[ ] Very often [ ]
To buy own airtime Never [ ] Hardly[ ] Often[ ] Very often [ ]
To buy for another Never [ ] Hardly[ ] Often[ ] Very often [ ]
To keep savings Never [ ] Hardly[ ] Often[ ] Very often [ ]
Emergency transfers Never [ ] Hardly[ ] Often[ ] Very often [ ]
To pay bill Never [ ] Hardly[ ] Often[ ] Very often [ ]
11. Is it safer to use M-pesa compared to other modes of money transfers?
[ ] Yes [ ] No
12. If yes do you rate the safety of using M-pesa transactions in a scale of 1-5?
Less Safe [ ] 1. [ ] 2. [ ] 3. [ ] 4. [ ] 5 Very safe
13. Is it more convenient to use M-pesa compared to other modes of money transfer?
[ ] Yes [ ] No
15.If Yes , please explain
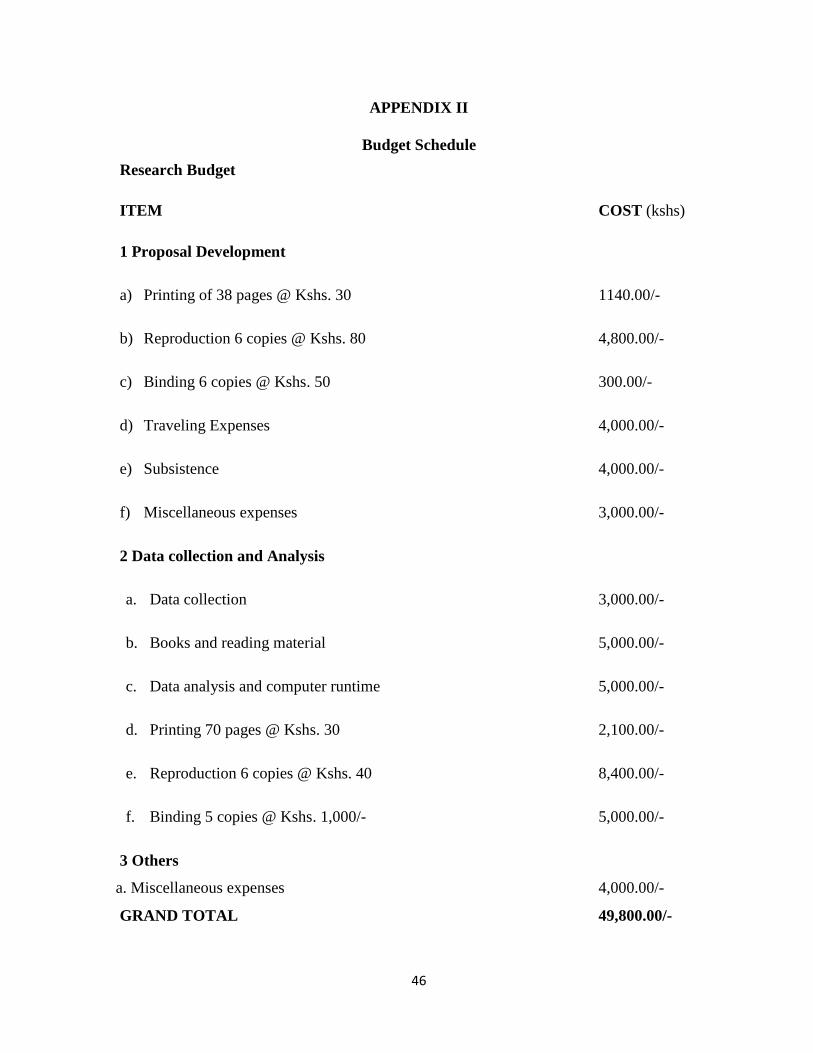
46
APPENDIX II
Budget Schedule
Research Budget
ITEM COST (kshs)
1 Proposal Development
a) Printing of 38 pages @ Kshs. 30 1140.00/-
b) Reproduction 6 copies @ Kshs. 80 4,800.00/-
c) Binding 6 copies @ Kshs. 50 300.00/-
d) Traveling Expenses 4,000.00/-
e) Subsistence 4,000.00/-
f) Miscellaneous expenses 3,000.00/-
2 Data collection and Analysis
a. Data collection 3,000.00/-
b. Books and reading material 5,000.00/-
c. Data analysis and computer runtime 5,000.00/-
d. Printing 70 pages @ Kshs. 30 2,100.00/-
e. Reproduction 6 copies @ Kshs. 40 8,400.00/-
f. Binding 5 copies @ Kshs. 1,000/- 5,000.00/-
3 Others
a. Miscellaneous expenses 4,000.00/-
GRAND TOTAL 49,800.00/-
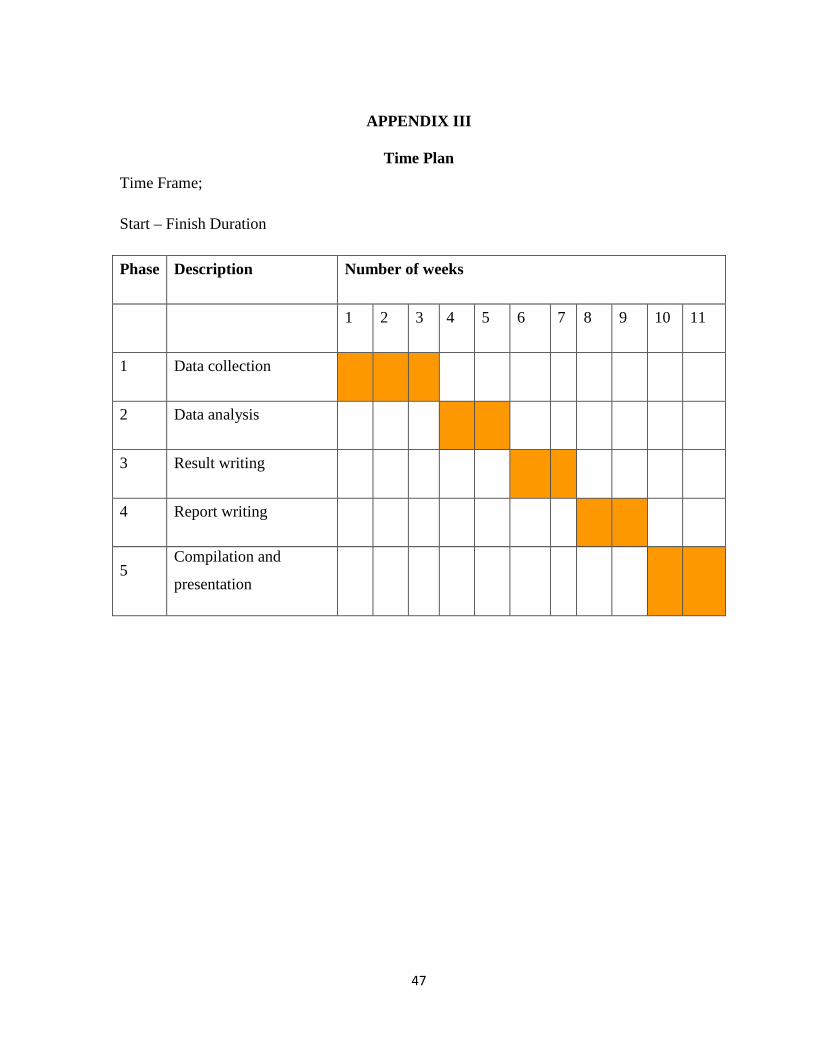
47
APPENDIX III
Time Plan
Time Frame;
Start – Finish Duration
Phase Description Number of weeks
1 2 3 4 5 6 7 8 9 10 11
1 Data collection
2 Data analysis
3 Result writing
4 Report writing
5 Compilation and
presentation