factors affecting electricity consumption in · pdf filefactors affecting electricity...
TRANSCRIPT
FACTORS AFFECTING ELECTRICITY CONSUMPTION IN THE U.S. (2010 - 2035)
IEE Report March 2013

Factors Affecting Electricity Consumption in the U.S.
(2010–2035)
IEE Report
March 2013
Prepared by
Ingrid Rohmund
David Costenaro
Anthony Duer
EnerNOC Utility Solutions Consulting
Lisa Wood
Adam Cooper
IEE

TABLE OF CONTENTS
EXECUTIVE SUMMARY .......................................................................................................... 1
SCENARIOS .................................................................................................................................. 2 RESULTS ...................................................................................................................................... 3
INTRODUCTION......................................................................................................................... 7
CODES AND STANDARDS ........................................................................................................ 9
IMPACT OF CODES AND STANDARDS ON U.S. ELECTRICITY CONSUMPTION ................................ 12 RESULTS BY SECTOR .................................................................................................................. 18
Residential Sector ................................................................................................................. 18
Commercial Sector................................................................................................................ 20 Industrial Sector.................................................................................................................... 22
SUMMARY .................................................................................................................................. 23
RATEPAYER-FUNDED EFFICIENCY PROGRAMS ......................................................... 24
RATEPAYER-FUNDED EE PROGRAM ANALYSIS APPROACH ........................................................ 25 ACCOUNTING FOR RATEPAYER-FUNDED CODES & STANDARDS EFFORTS ................................. 27
SUMMARY .................................................................................................................................. 28
ELECTRIC TRANSPORTATION ........................................................................................... 29
LIGHT DUTY VEHICLE SCENARIOS............................................................................................. 33 LIGHT DUTY SCENARIO RESULTS .............................................................................................. 34 TRANSPORTATION SCENARIOS ................................................................................................... 37
SUMMARY .................................................................................................................................. 39
CONCLUSION ........................................................................................................................... 42
APPENDIX A COMPARISON OF AEO 2009, 2010, 2011, AND 2012 .............................. A-1
APPENDIX B ASSUMPTIONS ABOUT BUILDING CODES AND APPLIANCE
STANDARDS ............................................................................................................................ B-1
APPENDIX C OVERVIEW OF MODELING APPROACH .............................................. C-1
APPENDIX D RATEPAYER-FUNDED EE PROGRAM ANNUAL IMPACTS .............. D-1
APPENDIX E TRANSPORTATION SECTOR ANALYSIS APPROACH ....................... E-1
APPENDIX F REFERENCES.................................................................................................. F-1

1
EXECUTIVE SUMMARY
In the coming decades, many factors will affect electricity consumption in the United States.
This report, prepared by EnerNOC Utility Solutions Consulting, examines the potential effects of
three key factors on electricity consumption:
1. Improvements to building energy codes and appliance/equipment efficiency standards
2. Growth in ratepayer-funded electric efficiency (EE) programs including both utility
programs and those administered by state or regional program administrators
3. Electrification of the transportation sector; primarily light duty vehicles and commercial
light trucks.
Table 1 shows the impact of each of these factors on electricity consumption in 2025 and 2035
under two scenarios – a moderate scenario which is very plausible and under a more aggressive
scenario – relative to the Reference Case from the Energy Information Administration’s (EIA)
Annual Energy Outlook 2012 (AEO 2012).1
Table 1: Factors Affecting Electricity Consumption in the U.S. in 2025 and 2035
* To avoid double counting, ratepayer-funded EE programs exclude the effects of utility-administered codes and
standards programs. In 2035, we project an overlap of 46 TWh, meaning that EE programs achieve an
additional 46 TWh of savings related to codes and standards programs which is 15.8% of the ratepayer-funded
EE Programs component.
1 http://www.eia.gov/forecasts/archive/aeo12/index.cfm
2010 Total
Electricity
Use (TWh)
2025 Total
Electricity Use
(TWh)
Percentage of
Total Use
2035 Total
Electricity Use
(TWh)
Percentage of
Total Use
Reference Case 3,730 4,099 100% 4,440 100%
Moderate Codes and Standards -277 -6.8% -420 -9.5%
Ratepayer Funded EE Programs* -242 -5.9% -249 -5.6%
Moderate Electric Transportation 16 0.4% 33 0.8%
TOTAL EFFECT -504 -12.3% -635 -14.3%
IEE MODERATE FORECAST 3,595 3,805
Aggressive Codes and Standards -478 -11.7% -769 -17.3%
Ratepayer Funded EE Programs* -242 -5.9% -249 -5.6%
Aggressive Electric Transportation 52 1.3% 147 3.3%
TOTAL EFFECT -668 -16.3% -871 -19.6%
IEE AGGRESSIVE FORECAST 3,431 3,569
Moderate Scenario
Aggressive Scenario
2
SCENARIOS
Under the moderate scenario, today’s most efficient appliances and equipment become the
minimum standard, newly constructed buildings use 35 percent less energy, ratepayer-funded EE
programs grow at current trends, and electric vehicles make up 2 percent of the registered vehicle
stock by 2035. This scenario is very plausible.
The aggressive scenario expands on the assumptions made in the moderate scenario. By 2035,
newly constructed buildings use 60 percent less energy, electric vehicles constitute 12 percent of
the registered vehicle stock, and some appliance and equipment efficiency standards are pushed
to engineering limits. Ratepayer-funded EE programs follow the same path as in the moderate
scenario.
The effect of each factor is summarized below.
As shown in Table 1, building codes and equipment standards have the largest impact
among the factors examined with the potential to decrease electricity consumption by 420
Terawatt-hours (TWh) (9.5%) in 2035 under a moderate scenario and 769 TWh (17.3%)
under an aggressive scenario.
o The codes and standards moderate scenario decreases growth in consumption nearly
60% between 2010 and 2035 relative to the AEO reference forecast in 2010.
o The codes and standards aggressive scenario completely eliminates growth in
electricity consumption between 2010 and 2035. Over 70% of these savings comes
from equipment standards, with the remainder ensuing from building codes phased
into the building stock over time through new construction and major renovations.
Ratepayer-funded electric energy efficiency (EE) programs, including both utility
programs and those administered by state or regional program administrators decrease
national electricity consumption. Following current trends, these programs reduce electricity
consumption by 249 TWh (5.6%) by 2035.
O Some ratepayer-funded EE programs are beginning to include efforts to accelerate the
development and enforcement of codes and standards. To avoid double-counting the
codes and standards savings, we subtract the savings achieved due to codes and
standards programs to get a net ratepayer-funded programs savings estimate. When
unadjusted, ratepayer EE programs save an estimated 295 TWh (6.7%) in 2035.2
2 At the national level the attribution of this overlap is moot as the net effect on U.S. electricity consumption
remains the same. However, for participating utilities, the attribution of energy savings resulting from
ratepayer-funded codes and standards programs is very important. In the face of increasing statewide and
3
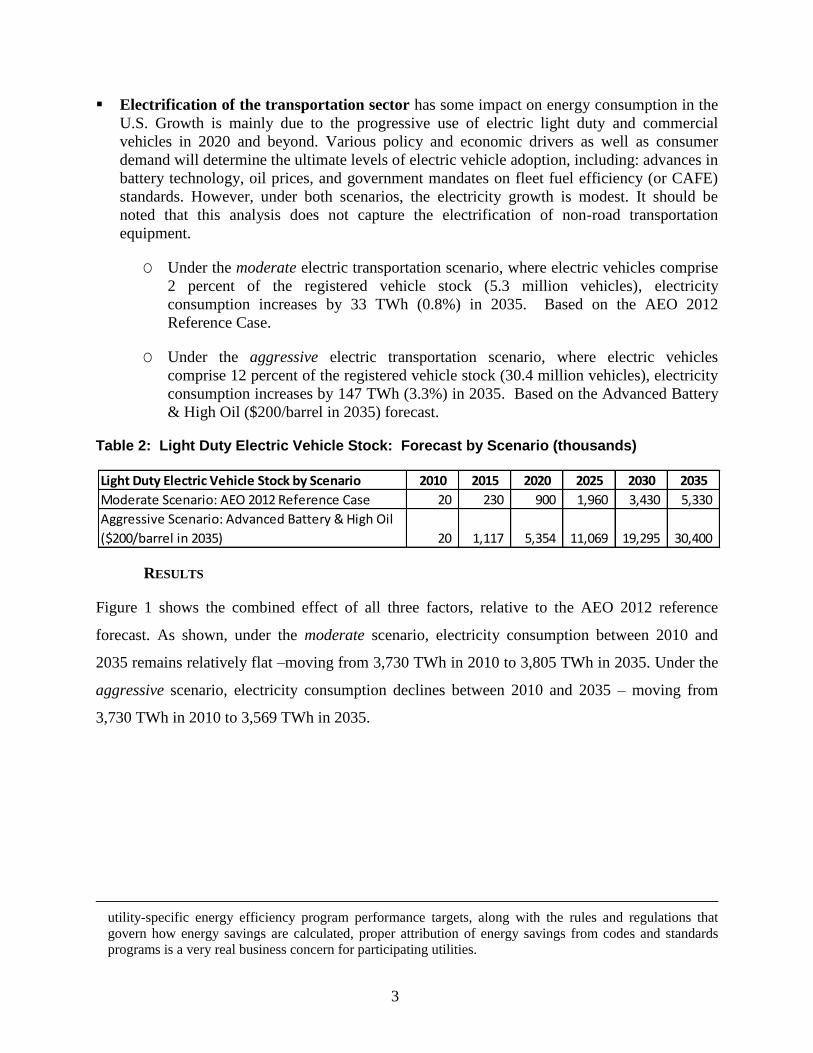
Electrification of the transportation sector has some impact on energy consumption in the
U.S. Growth is mainly due to the progressive use of electric light duty and commercial
vehicles in 2020 and beyond. Various policy and economic drivers as well as consumer
demand will determine the ultimate levels of electric vehicle adoption, including: advances in
battery technology, oil prices, and government mandates on fleet fuel efficiency (or CAFE)
standards. However, under both scenarios, the electricity growth is modest. It should be
noted that this analysis does not capture the electrification of non-road transportation
equipment.
O Under the moderate electric transportation scenario, where electric vehicles comprise
2 percent of the registered vehicle stock (5.3 million vehicles), electricity
consumption increases by 33 TWh (0.8%) in 2035. Based on the AEO 2012
Reference Case.
O Under the aggressive electric transportation scenario, where electric vehicles
comprise 12 percent of the registered vehicle stock (30.4 million vehicles), electricity
consumption increases by 147 TWh (3.3%) in 2035. Based on the Advanced Battery
& High Oil ($200/barrel in 2035) forecast.
Table 2: Light Duty Electric Vehicle Stock: Forecast by Scenario (thousands)
RESULTS
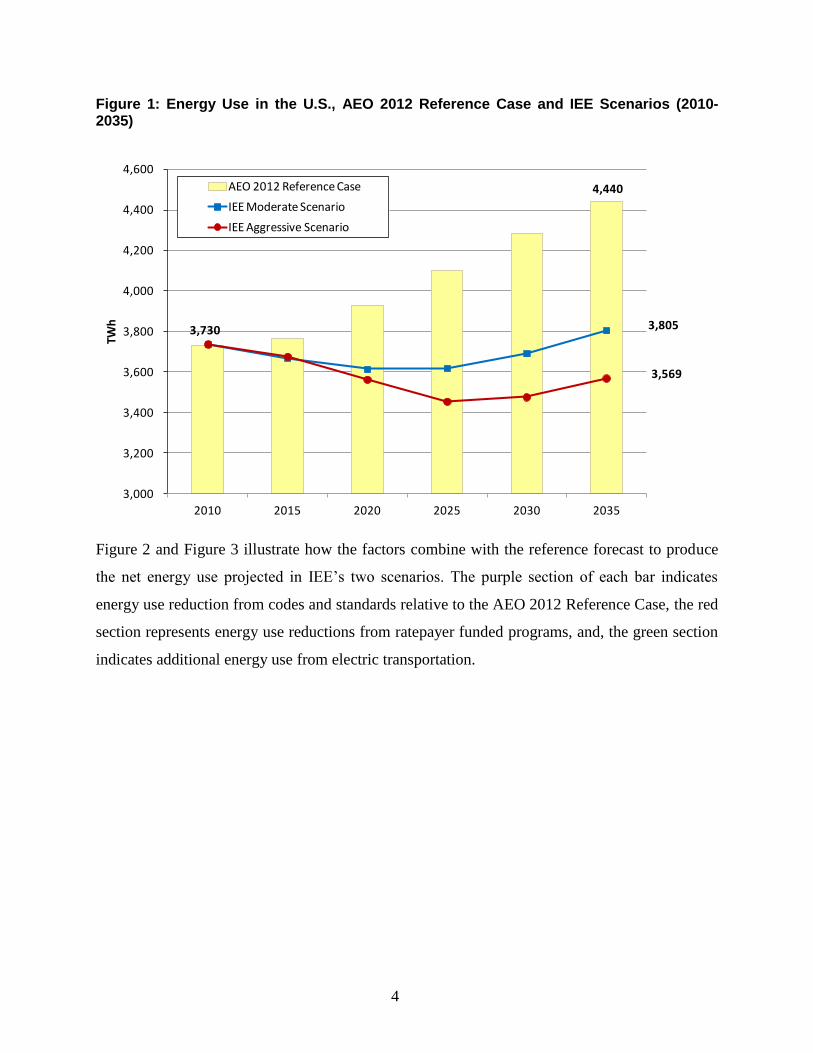
Figure 1 shows the combined effect of all three factors, relative to the AEO 2012 reference
forecast. As shown, under the moderate scenario, electricity consumption between 2010 and
2035 remains relatively flat –moving from 3,730 TWh in 2010 to 3,805 TWh in 2035. Under the
aggressive scenario, electricity consumption declines between 2010 and 2035 – moving from
3,730 TWh in 2010 to 3,569 TWh in 2035.
utility-specific energy efficiency program performance targets, along with the rules and regulations that
govern how energy savings are calculated, proper attribution of energy savings from codes and standards
programs is a very real business concern for participating utilities.
Light Duty Electric Vehicle Stock by Scenario 2010 2015 2020 2025 2030 2035
Moderate Scenario: AEO 2012 Reference Case 20 230 900 1,960 3,430 5,330
Aggressive Scenario: Advanced Battery & High Oil
($200/barrel in 2035) 20 1,117 5,354 11,069 19,295 30,400
4
Figure 1: Energy Use in the U.S., AEO 2012 Reference Case and IEE Scenarios (2010-2035)
Figure 2 and Figure 3 illustrate how the factors combine with the reference forecast to produce
the net energy use projected in IEE’s two scenarios. The purple section of each bar indicates
energy use reduction from codes and standards relative to the AEO 2012 Reference Case, the red
section represents energy use reductions from ratepayer funded programs, and, the green section
indicates additional energy use from electric transportation.
4,440
3,805
3,569
3,000
3,200
3,400
3,600
3,800
4,000
4,200
4,400
4,600
2010 2015 2020 2025 2030 2035
TWh
AEO 2012 Reference Case
IEE Moderate Scenario
IEE Aggressive Scenario
3,730
5
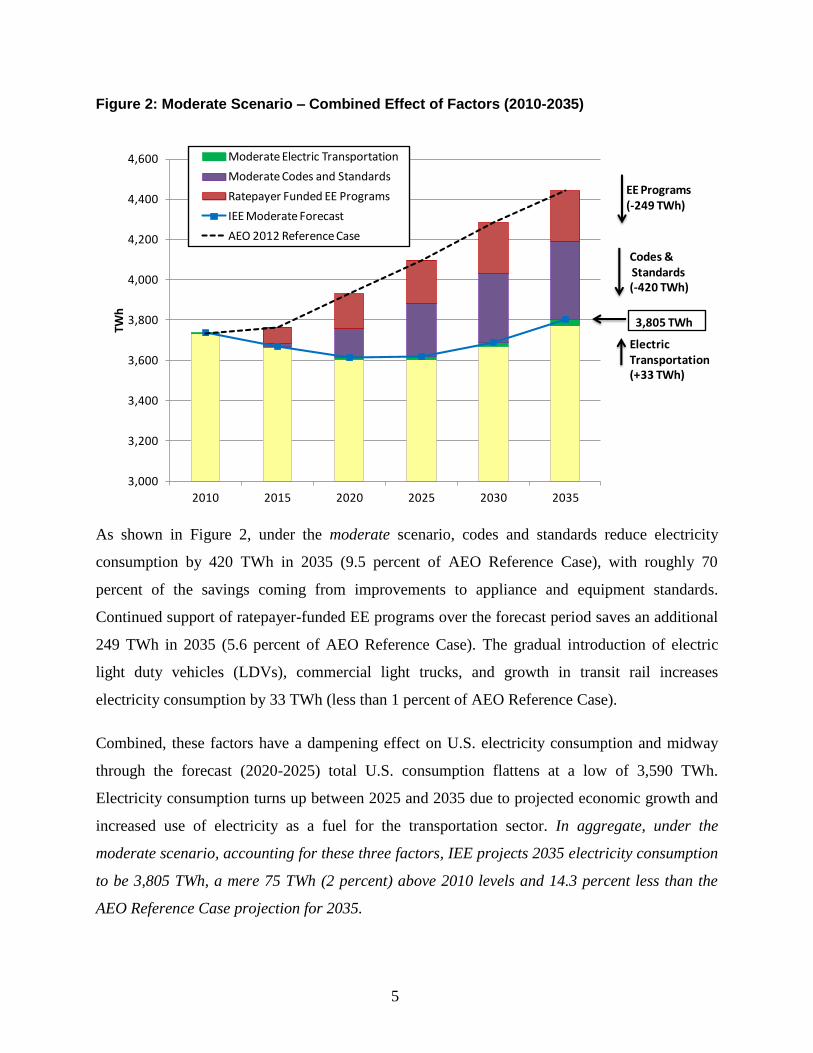
Figure 2: Moderate Scenario – Combined Effect of Factors (2010-2035)
As shown in Figure 2, under the moderate scenario, codes and standards reduce electricity
consumption by 420 TWh in 2035 (9.5 percent of AEO Reference Case), with roughly 70
percent of the savings coming from improvements to appliance and equipment standards.
Continued support of ratepayer-funded EE programs over the forecast period saves an additional
249 TWh in 2035 (5.6 percent of AEO Reference Case). The gradual introduction of electric
light duty vehicles (LDVs), commercial light trucks, and growth in transit rail increases
electricity consumption by 33 TWh (less than 1 percent of AEO Reference Case).
Combined, these factors have a dampening effect on U.S. electricity consumption and midway
through the forecast (2020-2025) total U.S. consumption flattens at a low of 3,590 TWh.
Electricity consumption turns up between 2025 and 2035 due to projected economic growth and
increased use of electricity as a fuel for the transportation sector. In aggregate, under the
moderate scenario, accounting for these three factors, IEE projects 2035 electricity consumption
to be 3,805 TWh, a mere 75 TWh (2 percent) above 2010 levels and 14.3 percent less than the
AEO Reference Case projection for 2035.
3,000
3,200
3,400
3,600
3,800
4,000
4,200
4,400
4,600
2010 2015 2020 2025 2030 2035
TWh
Moderate Electric Transportation
Moderate Codes and Standards
Ratepayer Funded EE Programs
IEE Moderate Forecast
AEO 2012 Reference Case
EE Programs (-249 TWh)
Codes &Standards (-420 TWh)
Electric Transportation (+33 TWh)
3,805 TWh

6
Figure 3: Aggressive Scenario — Combined Effect of Factors (2010–2035)
As shown in Figure 3, under the aggressive scenario, codes and standards programs have a
substantial impact on electricity consumption throughout the forecast period, reducing electricity
consumption in 2035 by 769 TWh (17.3 percent of AEO Reference Case). Continued support of
ratepayer-funded EE programs over the forecast period saves an additional 249 TWh in 2035. In
this scenario, substantial battery technology breakthroughs and increasing oil prices result in
greater consumer demand for electric light duty vehicles (LDVs) and commercial light trucks
resulting in electricity consumption increasing by 147 TWh (3.3 percent of AEO Reference
Case).
Combined, these factors have a substantial dampening effect on U.S. electricity consumption and
in 2025 total U.S. consumption drops to a forecast low of 3,431 TWh. Rapid electrification of the
transportation sector in the latter part of the forecast partially offsets the downward drivers,
resulting in an end of forecast value of 3,569 TWh. In aggregate, under the aggressive scenario,
accounting for these three factors, IEE projects 2035 electricity consumption to be 3,569 TWh,
which is 161 TWh (4 percent) below 2010 levels and 19.6 percent less than the AEO Reference
Case projection for 2035.
3,000
3,200
3,400
3,600
3,800
4,000
4,200
4,400
4,600
2010 2015 2020 2025 2030 2035
TWh
Aggressive Electric Transportation
Aggressive Codes and Standards
Ratepayer Funded EE Programs
IEE Aggressive Forecast
AEO 2012 Reference Case
EE Programs (-249 TWh)
Codes &Standards(-769 TWh)
Electric Transportation(+147 TWh)
3,569 TWh
7
INTRODUCTION
In the coming decades, many factors will affect electricity consumption in the United States.
This report examines the potential effects of three key factors on electricity consumption:
Improvements to building energy codes and appliance/equipment efficiency standards
Growth in ratepayer-funded electric efficiency (EE) programs including both utility programs
and those administered by state or regional program administrators
Electrification of the transportation sector; primarily light duty vehicles and commercial light
trucks.
Our analysis begins with identification of a baseline forecast, which is the Reference Case from
EIA’s Annual Energy Outlook 2012 (AEO 2012).
AEO 2012 provides total U.S. electricity consumption in the residential, commercial, and
industrial sectors from 2010 to 2035. According to AEO 2012, electricity use across all sectors
increases from 3,730 TWh in 2010 to 4,440 TWh in 2035, an increase in consumption of 710
TWh (19.0% increase) over the 26-year period. This implies an annual growth rate of 0.7%.
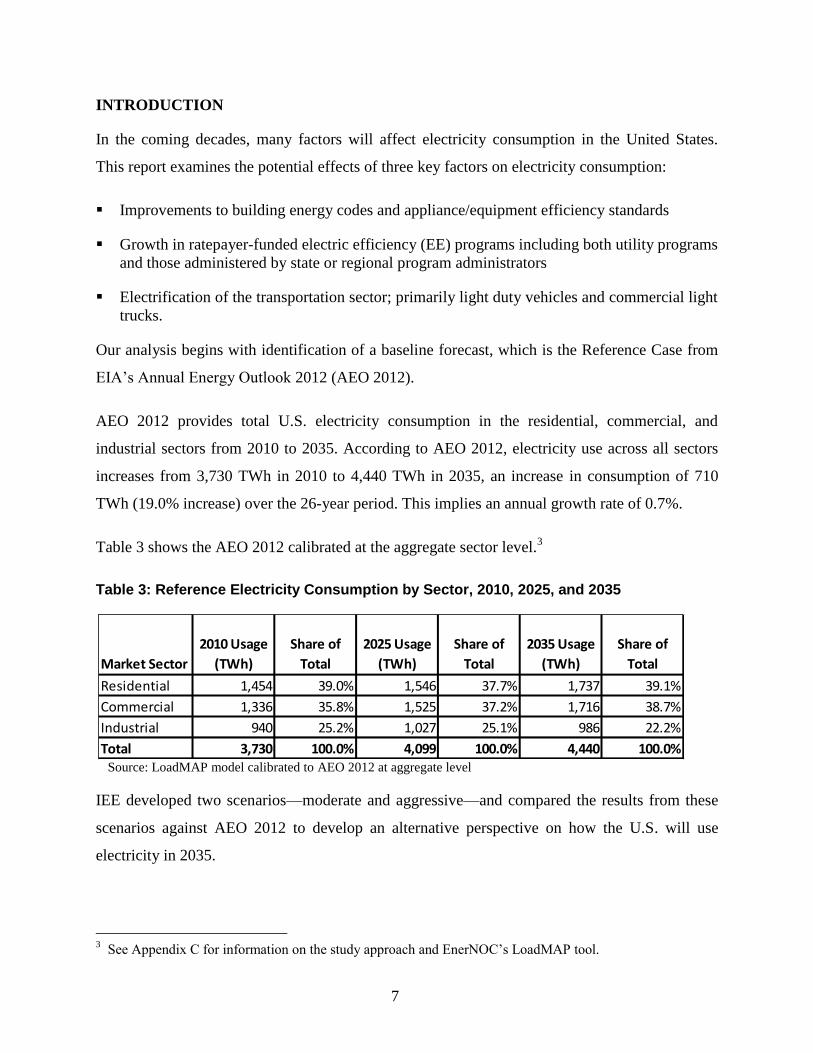
Table 3 shows the AEO 2012 calibrated at the aggregate sector level.3
Table 3: Reference Electricity Consumption by Sector, 2010, 2025, and 2035
Source: LoadMAP model calibrated to AEO 2012 at aggregate level
IEE developed two scenarios—moderate and aggressive—and compared the results from these
scenarios against AEO 2012 to develop an alternative perspective on how the U.S. will use
electricity in 2035.
3 See Appendix C for information on the study approach and EnerNOC’s LoadMAP tool.
Market Sector
2010 Usage
(TWh)
Share of
Total
2025 Usage
(TWh)
Share of
Total
2035 Usage
(TWh)
Share of
Total
Residential 1,454 39.0% 1,546 37.7% 1,737 39.1%
Commercial 1,336 35.8% 1,525 37.2% 1,716 38.7%
Industrial 940 25.2% 1,027 25.1% 986 22.2%
Total 3,730 100.0% 4,099 100.0% 4,440 100.0%
8
Under the moderate scenario, today’s most efficient appliances and equipment become the
minimum standard, newly constructed buildings use 35 percent less energy, ratepayer-funded EE
programs grow at current trends, and electric vehicles make up 2 percent of the registered vehicle
stock by 2035. IEE believes this scenario is very plausible.
The aggressive scenario expands on the assumptions made in the moderate scenario. By 2035,
newly constructed buildings use 60 percent less energy, electric vehicles constitute 12 percent of
the registered vehicle stock, and some appliance and equipment efficiency standards are pushed
to engineering limits. Ratepayer-funded EE programs follow the same path as in the moderate
scenario.
IEE’s moderate and aggressive forecasts present two different U.S. electricity consumption
outlooks than what AEO 2012 projects. The following sections provide further details on each of
the three factors—codes and standards, ratepayer EE programs, and electric transportation—that
influence US electricity consumption through 2035. The methodology and major assumptions
used to produce IEE’s forecasts are provided in the appendices.
9
CODES AND STANDARDS
As part of a push toward a more energy-efficient U.S. economy, activity at federal and state
levels indicates that building energy efficiency codes and appliance/equipment energy efficiency
standards will increase in stringency over the next 25 years. In fact, recent years have seen a
flurry of activity in appliance and equipment standards, and a number of new appliance standards
have gone through the rulemaking process and are now officially on the books. Additionally,
jurisdictions continue to adopt and implement more stringent building codes. This wave of
activity has been incorporated into the AEO Reference case, best described as a ‘current laws
and regulations’ case, prepared each year by the Energy Information Administration (EIA),
causing significant downward pressure in forecasts relative to past editions of the AEO.
Appendix A catalogues the decline in projected electricity consumption since AEO 2009.
The AEO serves as a starting point for policy analysis and depending on the specific codes and
standards adopted, under an aggressive scenario, electricity savings could be as high as 17.3%
(i.e., 769 TWh) of the AEO reference electricity forecast in 2035. Savings of this magnitude will
completely offset the anticipated growth in demand in the residential, commercial, and industrial
sectors combined, reducing the need for additional power plants to serve these sectors. The more
likely moderate scenario anticipates savings of 9.5% in 2035 (i.e., 420 TWh). Average annual
growth in the reference forecast is 0.7%, and IEE’s moderate codes and standards scenario would
reduce it to 0.3% per year.
This chapter is an update to Assessment of Electricity Savings in the U.S. Achievable through
New Appliance/Equipment Efficiency Standards and Building Efficiency Codes (2010-2025),
released by IEE in May 2011. IEE’s 2011 report was based on the AEO 2011 reference forecast,
and this report updates the analysis using the AEO 2012 reference forecast and updated
assumptions to take a fresh look at savings achievable through the adoption of new building
codes and appliance/equipment efficiency standards beyond those embedded in the AEO
reference.4
4 AEO 2012 can be found at: http://www.eia.gov/forecasts/aeo/. See Appendix A for a comparison of AEO
2009 thru 2012.
10
The results presented here quantify the impact of future building codes and appliance/equipment
efficiency standards on electricity consumption in the United States. New efficiency codes and
standards have two basic components: new building energy codes and new or expanded
appliance and equipment efficiency standards.
Building codes focus on reducing energy consumption in newly-constructed buildings or
those undergoing major renovation, making them less energy intensive than older buildings.
Appliance and equipment efficiency standards entail mandated minimum efficiency levels
for energy-using equipment, such as central air conditioners, lamps and ballasts, furnace fans,
and residential white-goods appliances (e.g., refrigerators, dishwashers, clothes washers).
Federal or state-level equipment standards result in lower electricity consumption levels for
all units purchased, both in new construction and existing buildings.
Codes and standards affect baseline electricity use — the amount of consumption expected to
occur before utility or other ratepayer-funded energy-efficiency programs become effective. New
codes and standards that are adopted in a timely fashion shift the starting point and thus change
the potential for savings from ratepayer-funded programs, which are discussed in a subsequent
section of this report.
Because of uncertainty in the policy-making process, we developed two possible codes and
standards scenarios for this paper — moderate and aggressive — intended to represent a range of
possibilities in future legislative and regulatory actions surrounding codes and standards. The
two scenarios reflect the input of the authors, as informed by professional experience, literature
review, and discussion with experts.5 IEE’s projections and underlying assumptions have not
undergone a full life-cycle cost and payback analysis, or other preliminary analyses typically
undertaken during a formal rulemaking process. This was not the intended purpose.
Rather, the moderate scenario defines a plausible range of possible future outcomes that IEE
considers likely. The moderate scenario was developed by incrementally layering and expanding
upon the minimum efficacy assumptions embedded in the AEO reference forecast and by
expanding the scope of appliances and equipment that codes and standards address. The AEO
reference case assumes that the prevailing code is fully complied with and IEE does not alter that
5 A list of references can be found in Appendix F. IEE received expert advice from Steve Nadel from the
American Council for an Energy-Efficient Economy (ACEEE) and Steve Rosenstock from the Edison
Electric Institute (EEI).
11
assumption in either scenario. Appendix B provides assumptions for the codes and standards
changes modeled in this paper.
The moderate scenario includes standards for commercial IT equipment, home electronics,
furnace fans, and commercial refrigeration equipment. We say that this scenario can be
considered likely because it assumes standards requiring levels of efficiency that can be met by
products already available in the marketplace, such as ENERGY STAR appliances. The
aggressive scenario was developed by adding more aggressive efficiency assumptions onto those
embedded in the moderate case. Some of the assumptions are quite aggressive and this scenario
pushes the envelope. For example, the moderate case assumes that a new federal standard will
raise the minimum SEER rating for a central air conditioner to 15, effective in 2022. Under the
aggressive case, a new federal standard will raise the minimum SEER rating to 18, effective in
2022. The aggressive scenario also assumes a 2020 standard for residential and commercial
general service lamps equivalent to 65 lumens per watt, significantly higher than the 50 lumen
per watt mark contemplated in the moderate scenario and the 45 lumen per watt mark modeled in
the reference case. As an aside, each of the lumen per watt standards can be met by CFL and
LED lighting systems currently available in the market.
With regard to codes for residential buildings in the moderate scenario, it is assumed that IECC
2012, with estimated energy savings of 25% compared to IECC 2006, goes into effect in 2016,
and IECC 2015, with energy saving of 35%, goes into effect in 2019. The aggressive case uses
the same assumptions as the moderate scenario until 2024, when it is assumed that a new code,
with energy savings of 60%, goes into effect.6 Again, the aggressive case pushes the envelope,
with similar assumptions for commercial codes as well. Appendix Tables B-1 thru B-5 provides
the detailed assumptions regarding codes and standards.
6 DOE’s multi-year program plan projects slightly higher savings than these values. Adjusted values were used
in this analysis to model the imperfect implementation of the building codes. In addition, the authors
recognize that issues related to code enforcement and code compliance can create a lag between when codes become effective and when the associated energy savings are actually realized. The scenarios do not
explicitly take into account this lag in savings realization, which could be addressed via more aggressive
local enforcement and/or ratepayer-funded programs to promote code compliance.
12
IMPACT OF CODES AND STANDARDS ON U.S. ELECTRICITY CONSUMPTION
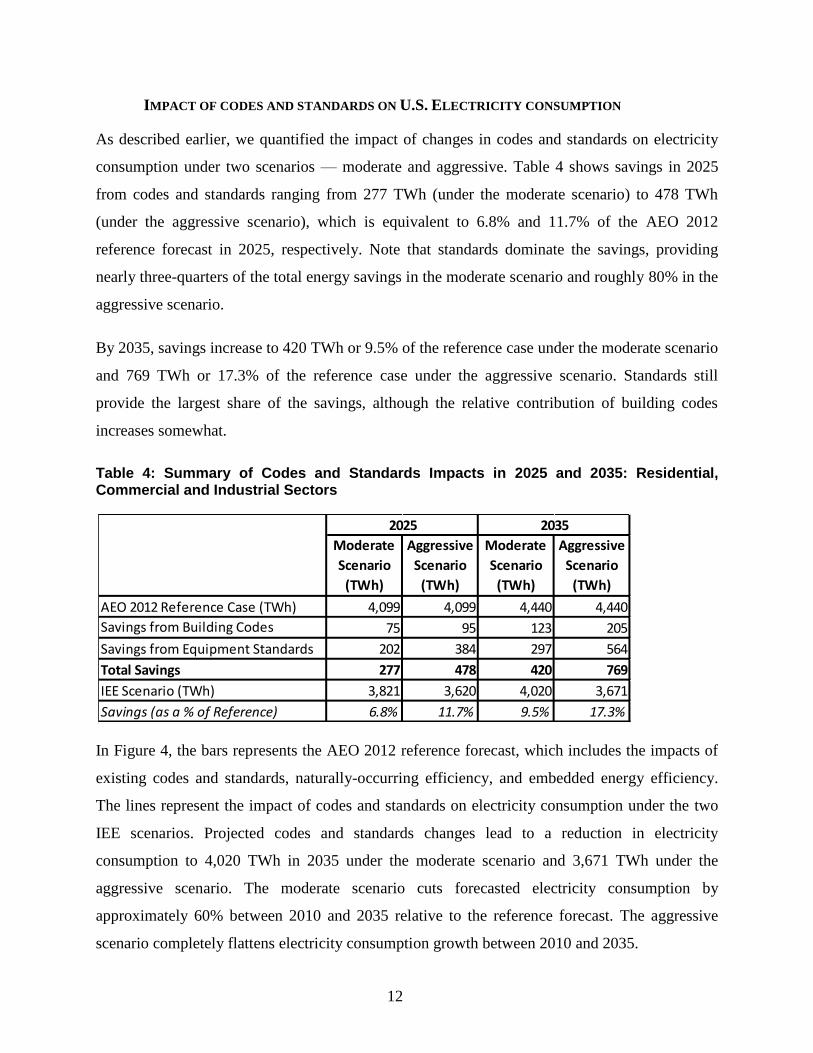
As described earlier, we quantified the impact of changes in codes and standards on electricity
consumption under two scenarios — moderate and aggressive. Table 4 shows savings in 2025
from codes and standards ranging from 277 TWh (under the moderate scenario) to 478 TWh
(under the aggressive scenario), which is equivalent to 6.8% and 11.7% of the AEO 2012
reference forecast in 2025, respectively. Note that standards dominate the savings, providing
nearly three-quarters of the total energy savings in the moderate scenario and roughly 80% in the
aggressive scenario.
By 2035, savings increase to 420 TWh or 9.5% of the reference case under the moderate scenario
and 769 TWh or 17.3% of the reference case under the aggressive scenario. Standards still
provide the largest share of the savings, although the relative contribution of building codes
increases somewhat.
Table 4: Summary of Codes and Standards Impacts in 2025 and 2035: Residential, Commercial and Industrial Sectors
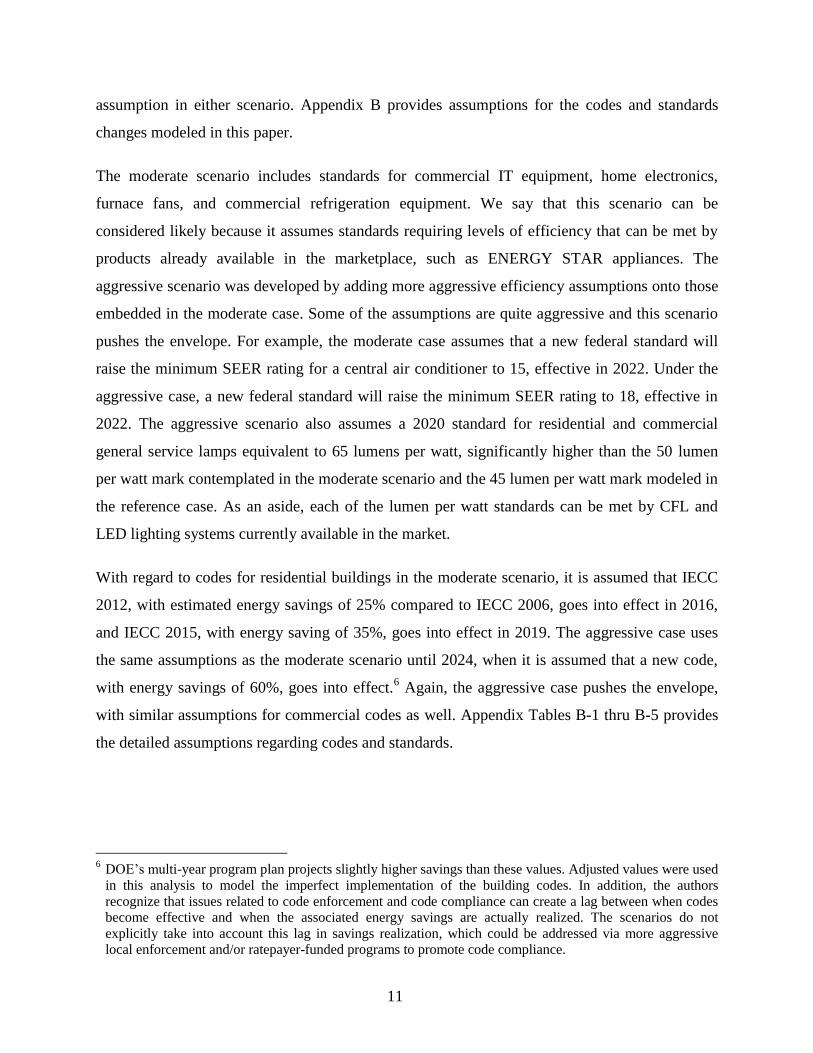
In Figure 4, the bars represents the AEO 2012 reference forecast, which includes the impacts of
existing codes and standards, naturally-occurring efficiency, and embedded energy efficiency.
The lines represent the impact of codes and standards on electricity consumption under the two
IEE scenarios. Projected codes and standards changes lead to a reduction in electricity
consumption to 4,020 TWh in 2035 under the moderate scenario and 3,671 TWh under the
aggressive scenario. The moderate scenario cuts forecasted electricity consumption by
approximately 60% between 2010 and 2035 relative to the reference forecast. The aggressive
scenario completely flattens electricity consumption growth between 2010 and 2035.
Moderate
Scenario
(TWh)
Aggressive
Scenario
(TWh)
Moderate
Scenario
(TWh)
Aggressive
Scenario
(TWh)
AEO 2012 Reference Case (TWh) 4,099 4,099 4,440 4,440
Savings from Building Codes 75 95 123 205
Savings from Equipment Standards 202 384 297 564
Total Savings 277 478 420 769
IEE Scenario (TWh) 3,821 3,620 4,020 3,671
Savings (as a % of Reference) 6.8% 11.7% 9.5% 17.3%
2025 2035
13
Figure 4: Impact of Codes and Standards on Total U.S. Electricity Consumption (TWh)
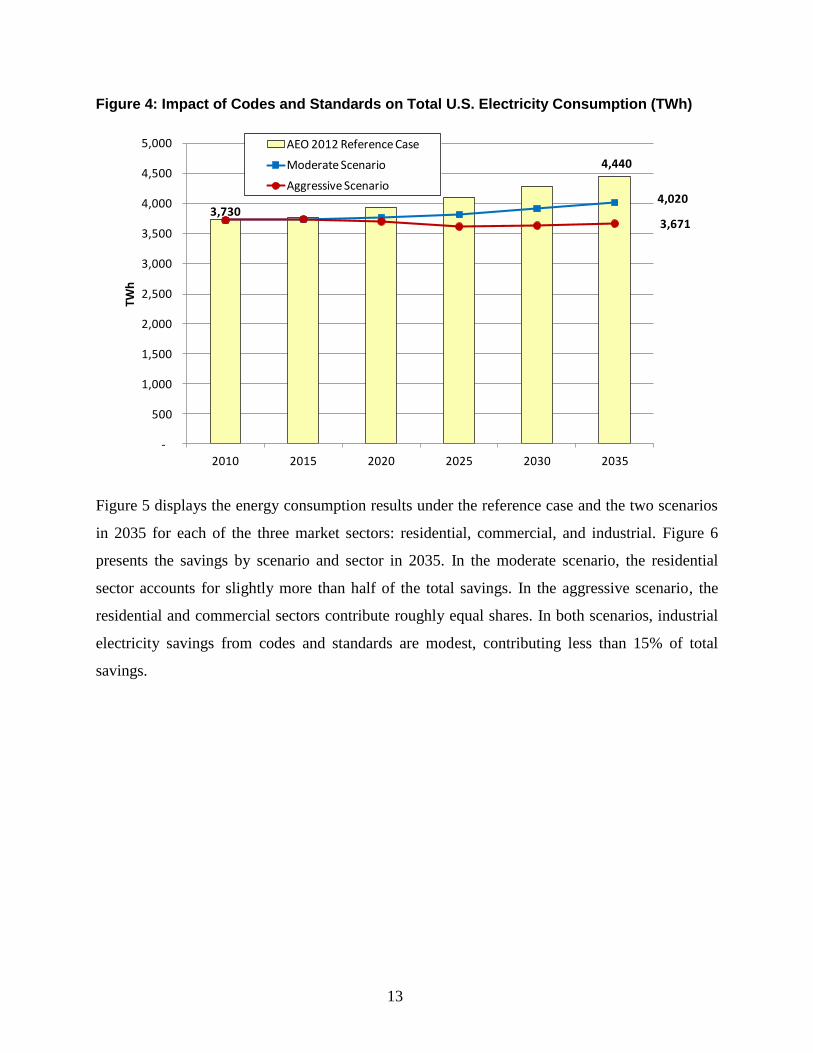
Figure 5 displays the energy consumption results under the reference case and the two scenarios
in 2035 for each of the three market sectors: residential, commercial, and industrial. Figure 6
presents the savings by scenario and sector in 2035. In the moderate scenario, the residential
sector accounts for slightly more than half of the total savings. In the aggressive scenario, the
residential and commercial sectors contribute roughly equal shares. In both scenarios, industrial
electricity savings from codes and standards are modest, contributing less than 15% of total
savings.
4,440
4,020
3,671
-
500
1,000
1,500
2,000
2,500
3,000
3,500
4,000
4,500
5,000
2010 2015 2020 2025 2030 2035
TWh
AEO 2012 Reference Case
Moderate Scenario
Aggressive Scenario
3,730
14
Figure 5: Electricity Consumption Forecast by Scenario and Sector in 2035 (TWh)
Figure 6: Electricity Savings by Scenario and Sector in 2035 (TWh)
3,730
4,440
4,020
3,671
1,4541,737
1,514 1,398
1,336
1,716
1,5721,402
940
986
934
871
0
500
1,000
1,500
2,000
2,500
3,000
3,500
4,000
4,500
5,000
AEO 2012 ReferenceCase in 2010
AEO 2012 ReferenceCase in 2035
Moderate Scenarioin 2035
Aggressive Scenario in 2035
Ele
ctri
city
Co
nsu
mp
tio
n (
TWh
)Industrial
Commercial
Residential
420
769
223
339
144
315
52
115
0
100
200
300
400
500
600
700
800
900
Moderate Scenarioin 2035
Aggressive Scenario in 2035
Ele
ctri
city
Sav
ings
(TW
h)
Industrial
Commercial
Residential
15
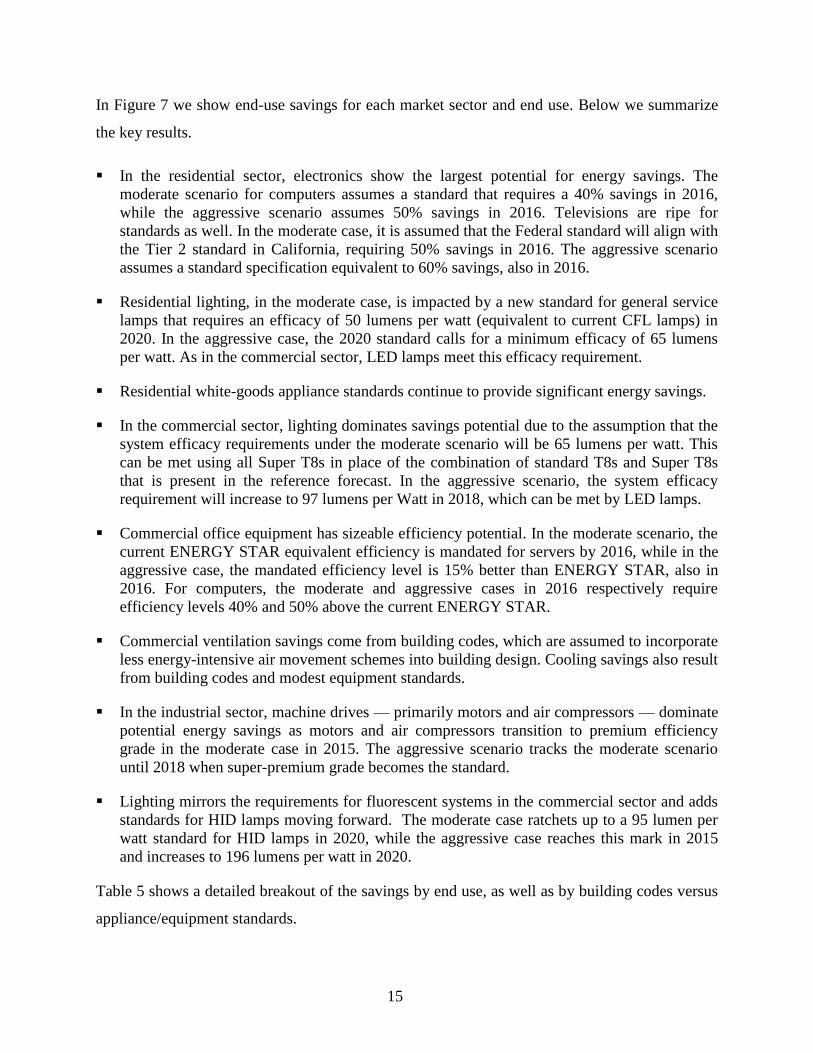
In Figure 7 we show end-use savings for each market sector and end use. Below we summarize
the key results.
In the residential sector, electronics show the largest potential for energy savings. The
moderate scenario for computers assumes a standard that requires a 40% savings in 2016,
while the aggressive scenario assumes 50% savings in 2016. Televisions are ripe for
standards as well. In the moderate case, it is assumed that the Federal standard will align with
the Tier 2 standard in California, requiring 50% savings in 2016. The aggressive scenario
assumes a standard specification equivalent to 60% savings, also in 2016.
Residential lighting, in the moderate case, is impacted by a new standard for general service
lamps that requires an efficacy of 50 lumens per watt (equivalent to current CFL lamps) in
2020. In the aggressive case, the 2020 standard calls for a minimum efficacy of 65 lumens
per watt. As in the commercial sector, LED lamps meet this efficacy requirement.
Residential white-goods appliance standards continue to provide significant energy savings.
In the commercial sector, lighting dominates savings potential due to the assumption that the
system efficacy requirements under the moderate scenario will be 65 lumens per watt. This
can be met using all Super T8s in place of the combination of standard T8s and Super T8s
that is present in the reference forecast. In the aggressive scenario, the system efficacy
requirement will increase to 97 lumens per Watt in 2018, which can be met by LED lamps.
Commercial office equipment has sizeable efficiency potential. In the moderate scenario, the
current ENERGY STAR equivalent efficiency is mandated for servers by 2016, while in the
aggressive case, the mandated efficiency level is 15% better than ENERGY STAR, also in
2016. For computers, the moderate and aggressive cases in 2016 respectively require
efficiency levels 40% and 50% above the current ENERGY STAR.
Commercial ventilation savings come from building codes, which are assumed to incorporate
less energy-intensive air movement schemes into building design. Cooling savings also result
from building codes and modest equipment standards.
In the industrial sector, machine drives — primarily motors and air compressors — dominate
potential energy savings as motors and air compressors transition to premium efficiency
grade in the moderate case in 2015. The aggressive scenario tracks the moderate scenario
until 2018 when super-premium grade becomes the standard.
Lighting mirrors the requirements for fluorescent systems in the commercial sector and adds
standards for HID lamps moving forward. The moderate case ratchets up to a 95 lumen per
watt standard for HID lamps in 2020, while the aggressive case reaches this mark in 2015
and increases to 196 lumens per watt in 2020.
Table 5 shows a detailed breakout of the savings by end use, as well as by building codes versus
appliance/equipment standards.
16
Figure 7: Savings by End Use and Scenario in 2035 (TWh)
17
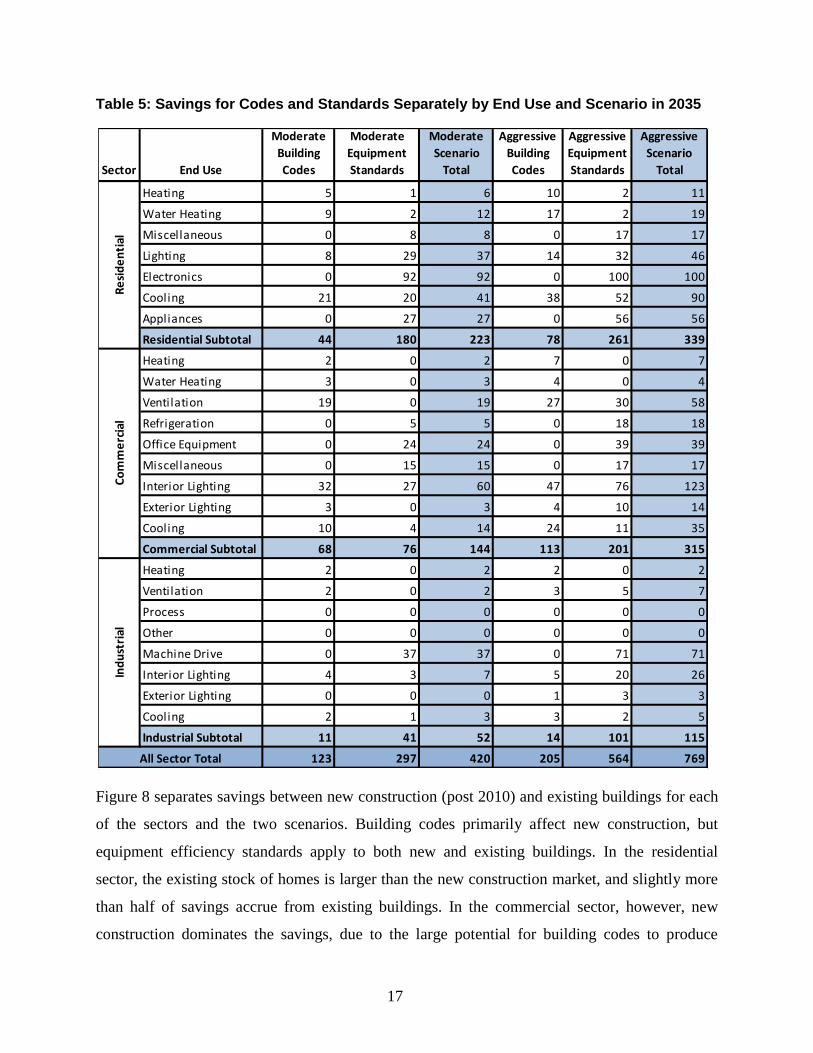
Table 5: Savings for Codes and Standards Separately by End Use and Scenario in 2035
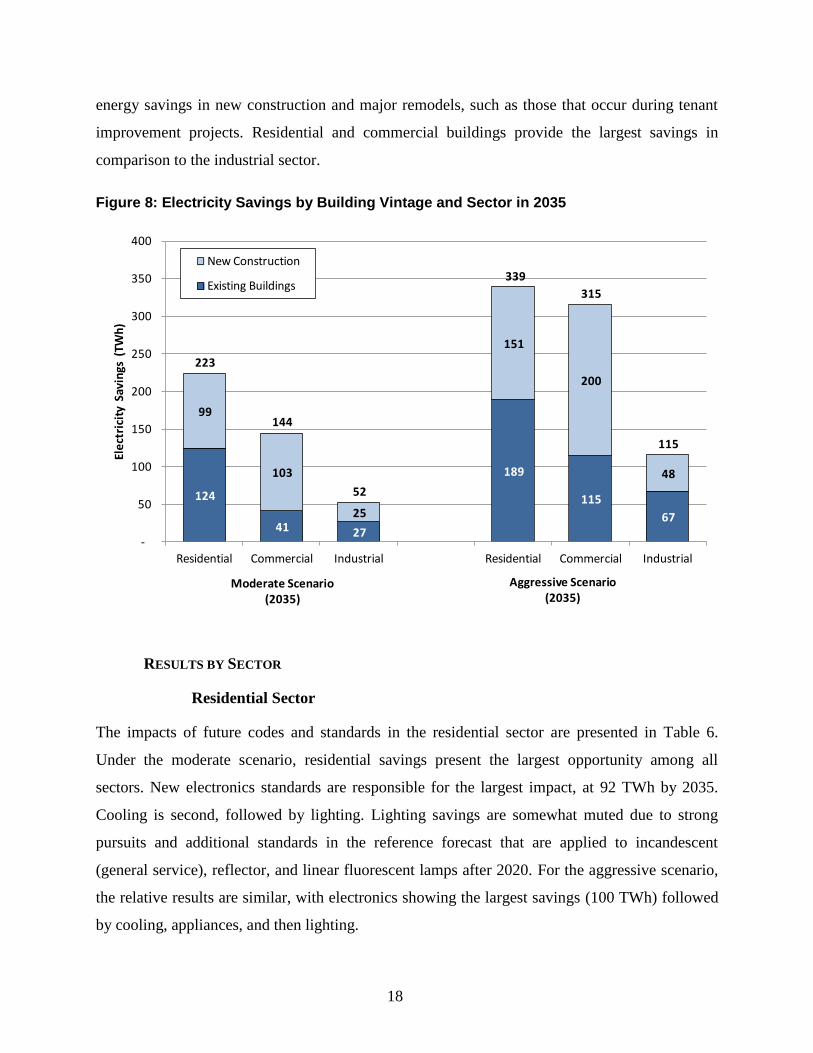
Figure 8 separates savings between new construction (post 2010) and existing buildings for each
of the sectors and the two scenarios. Building codes primarily affect new construction, but
equipment efficiency standards apply to both new and existing buildings. In the residential
sector, the existing stock of homes is larger than the new construction market, and slightly more
than half of savings accrue from existing buildings. In the commercial sector, however, new
construction dominates the savings, due to the large potential for building codes to produce
Sector End Use
Moderate
Building
Codes
Moderate
Equipment
Standards
Moderate
Scenario
Total
Aggressive
Building
Codes
Aggressive
Equipment
Standards
Aggressive
Scenario
Total
Heating 5 1 6 10 2 11
Water Heating 9 2 12 17 2 19
Miscellaneous 0 8 8 0 17 17
Lighting 8 29 37 14 32 46
Electronics 0 92 92 0 100 100
Cooling 21 20 41 38 52 90
Appliances 0 27 27 0 56 56
Residential Subtotal 44 180 223 78 261 339
Heating 2 0 2 7 0 7
Water Heating 3 0 3 4 0 4
Ventilation 19 0 19 27 30 58
Refrigeration 0 5 5 0 18 18
Office Equipment 0 24 24 0 39 39
Miscellaneous 0 15 15 0 17 17
Interior Lighting 32 27 60 47 76 123
Exterior Lighting 3 0 3 4 10 14
Cooling 10 4 14 24 11 35
Commercial Subtotal 68 76 144 113 201 315
Heating 2 0 2 2 0 2
Ventilation 2 0 2 3 5 7
Process 0 0 0 0 0 0
Other 0 0 0 0 0 0
Machine Drive 0 37 37 0 71 71
Interior Lighting 4 3 7 5 20 26
Exterior Lighting 0 0 0 1 3 3
Cooling 2 1 3 3 2 5
Industrial Subtotal 11 41 52 14 101 115
123 297 420 205 564 769All Sector Total
Re
sid
en
tial
Co
mm
erc
ial
Ind
ust
rial
18
energy savings in new construction and major remodels, such as those that occur during tenant
improvement projects. Residential and commercial buildings provide the largest savings in
comparison to the industrial sector.
Figure 8: Electricity Savings by Building Vintage and Sector in 2035
RESULTS BY SECTOR
Residential Sector
The impacts of future codes and standards in the residential sector are presented in Table 6.
Under the moderate scenario, residential savings present the largest opportunity among all
sectors. New electronics standards are responsible for the largest impact, at 92 TWh by 2035.
Cooling is second, followed by lighting. Lighting savings are somewhat muted due to strong
pursuits and additional standards in the reference forecast that are applied to incandescent
(general service), reflector, and linear fluorescent lamps after 2020. For the aggressive scenario,
the relative results are similar, with electronics showing the largest savings (100 TWh) followed
by cooling, appliances, and then lighting.
124
41 27
189
115
67
99
103
25
151
200
48
223
144
52
339
315
115
-
50
100
150
200
250
300
350
400
Residential Commercial Industrial Residential Commercial Industrial
Ele
ctri
city
Sav
ings
(TW
h)
New Construction
Existing Buildings
Aggressive Scenario(2035)
Moderate Scenario(2035)
19
Table 6: Residential Sector — Savings by End Use and Scenario in 2035
* Electronics and miscellaneous end uses are currently not subject to any standards.
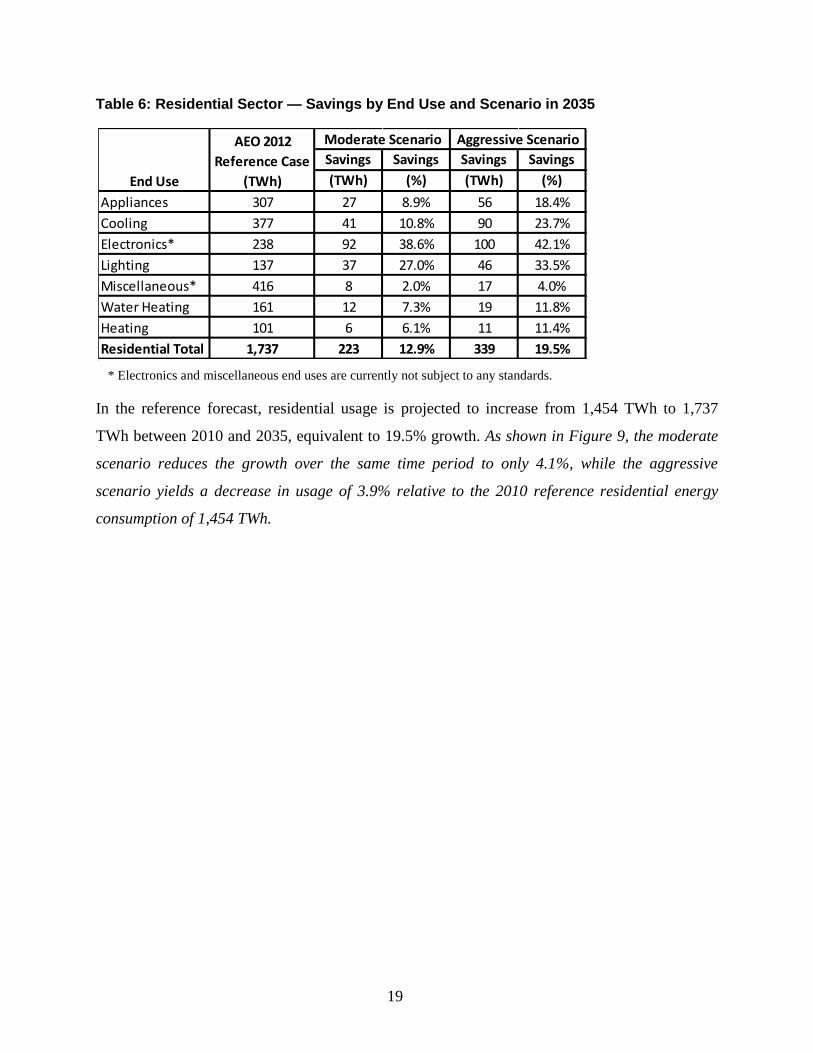
In the reference forecast, residential usage is projected to increase from 1,454 TWh to 1,737
TWh between 2010 and 2035, equivalent to 19.5% growth. As shown in Figure 9, the moderate
scenario reduces the growth over the same time period to only 4.1%, while the aggressive
scenario yields a decrease in usage of 3.9% relative to the 2010 reference residential energy
consumption of 1,454 TWh.
Savings Savings Savings Savings
(TWh) (%) (TWh) (%)
Appliances 307 27 8.9% 56 18.4%
Cooling 377 41 10.8% 90 23.7%
Electronics* 238 92 38.6% 100 42.1%
Lighting 137 37 27.0% 46 33.5%
Miscellaneous* 416 8 2.0% 17 4.0%
Water Heating 161 12 7.3% 19 11.8%
Heating 101 6 6.1% 11 11.4%
Residential Total 1,737 223 12.9% 339 19.5%
End Use
Moderate Scenario Aggressive ScenarioAEO 2012
Reference Case
(TWh)
20
Figure 9: Residential Sector — Impact of Codes and Standards on Electricity Consumption (TWh)
Commercial Sector
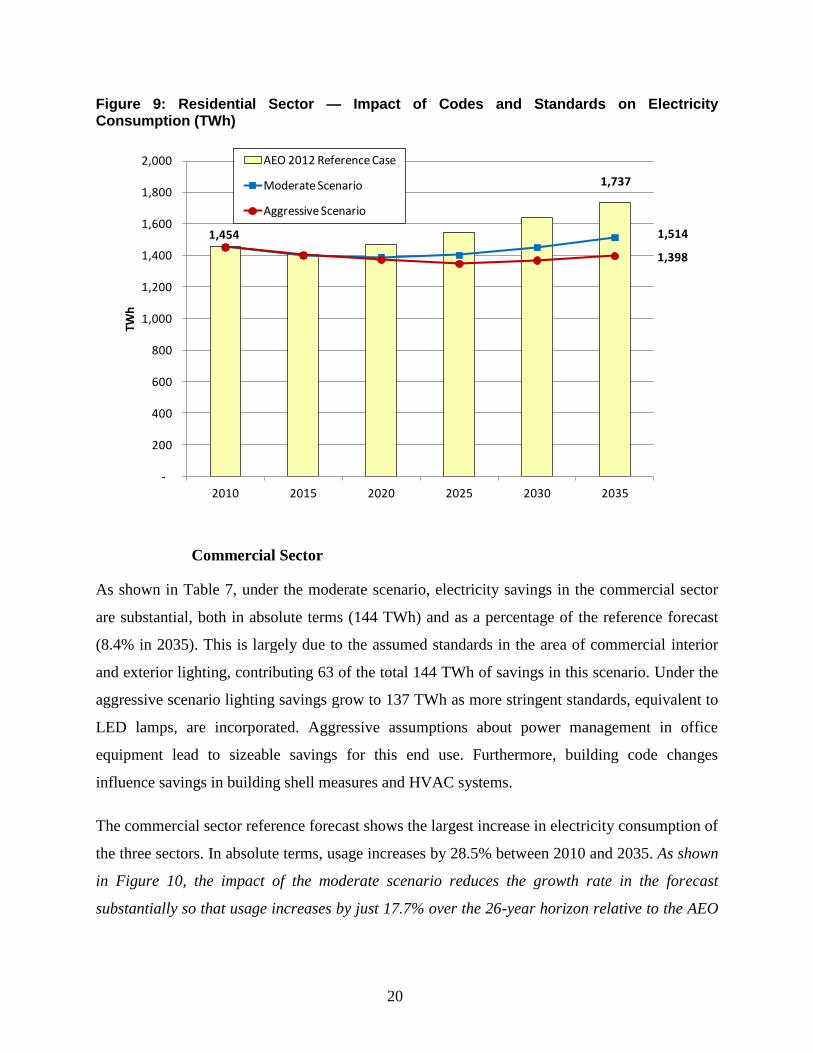
As shown in Table 7, under the moderate scenario, electricity savings in the commercial sector
are substantial, both in absolute terms (144 TWh) and as a percentage of the reference forecast
(8.4% in 2035). This is largely due to the assumed standards in the area of commercial interior
and exterior lighting, contributing 63 of the total 144 TWh of savings in this scenario. Under the
aggressive scenario lighting savings grow to 137 TWh as more stringent standards, equivalent to
LED lamps, are incorporated. Aggressive assumptions about power management in office
equipment lead to sizeable savings for this end use. Furthermore, building code changes
influence savings in building shell measures and HVAC systems.
The commercial sector reference forecast shows the largest increase in electricity consumption of
the three sectors. In absolute terms, usage increases by 28.5% between 2010 and 2035. As shown
in Figure 10, the impact of the moderate scenario reduces the growth rate in the forecast
substantially so that usage increases by just 17.7% over the 26-year horizon relative to the AEO
1,737
1,514
1,398
-
200
400
600
800
1,000
1,200
1,400
1,600
1,800
2,000
2010 2015 2020 2025 2030 2035
TWh
AEO 2012 Reference Case
Moderate Scenario
Aggressive Scenario
1,454
21
reference case commercial electricity consumption of 1,336 TWh in 2010. In the case of the
aggressive scenario, growth drops to 4.9% versus the AEO reference case in 2010.
Table 7: Commercial Sector – Savings by End Use and Scenario in 2035
* Miscellaneous and office equipment are currently not subject to any standards.
Figure 10: Commercial Sector – Impact of Codes and Standards on Electricity Consumption (TWh)
Savings
(TWh)
Savings
(%)
Savings
(TWh)
Savings
(%)
Cooling 161 14 8.9% 35 21.8%
Exterior Lighting 28 3 10.6% 14 49.5%
Interior Lighting 306 60 19.5% 123 40.2%
Miscellaneous 660 15 2.3% 17 2.7%
Office Equipment 202 24 11.7% 39 19.2%
Refrigeration 110 5 4.8% 18 16.5%
Ventilation 179 19 10.6% 58 32.4%
Water Heating 25 3 10.5% 4 15.3%
Heating 47 2 4.3% 7 15.7%
Commercial Total 1,716 144 8.4% 315 18.3%
End Use
AEO 2012
Reference Case
(TWh)
Moderate Scenario Aggressive Scenario
1,716
1,572
1,402
-
200
400
600
800
1,000
1,200
1,400
1,600
1,800
2,000
2010 2015 2020 2025 2030 2035
TWh
AEO 2012 Reference Case
Moderate Scenario
Aggressive Scenario
1,336
22
Industrial Sector
Electricity consumption in the industrial sector is dominated by machine drive (primarily motors
and air compressors) and process equipment, while uses related to the building envelope and
construction practices represent a smaller share of industrial energy use. Therefore, the impact of
aggressive building energy codes is very limited. However, building codes are a factor
nonetheless and are captured in the HVAC and lighting impacts shown in Table 8. In addition,
both scenarios assume improvements in motor efficiency, which contribute approximately 37
TWh to the industrial impact in the moderate scenario and 71 TWh in the aggressive scenario.
While the improvement in efficiency is often only a few percent, the abundance of machine
drives in industrial applications leads to significant savings from this standard. This is especially
evident in the aggressive scenario, which is represented by both premium efficiency and super-
premium efficiency motors as opposed to the NEMA standard equipment.
Table 8: Industrial Sector – Savings by End Use and Scenario in 2035
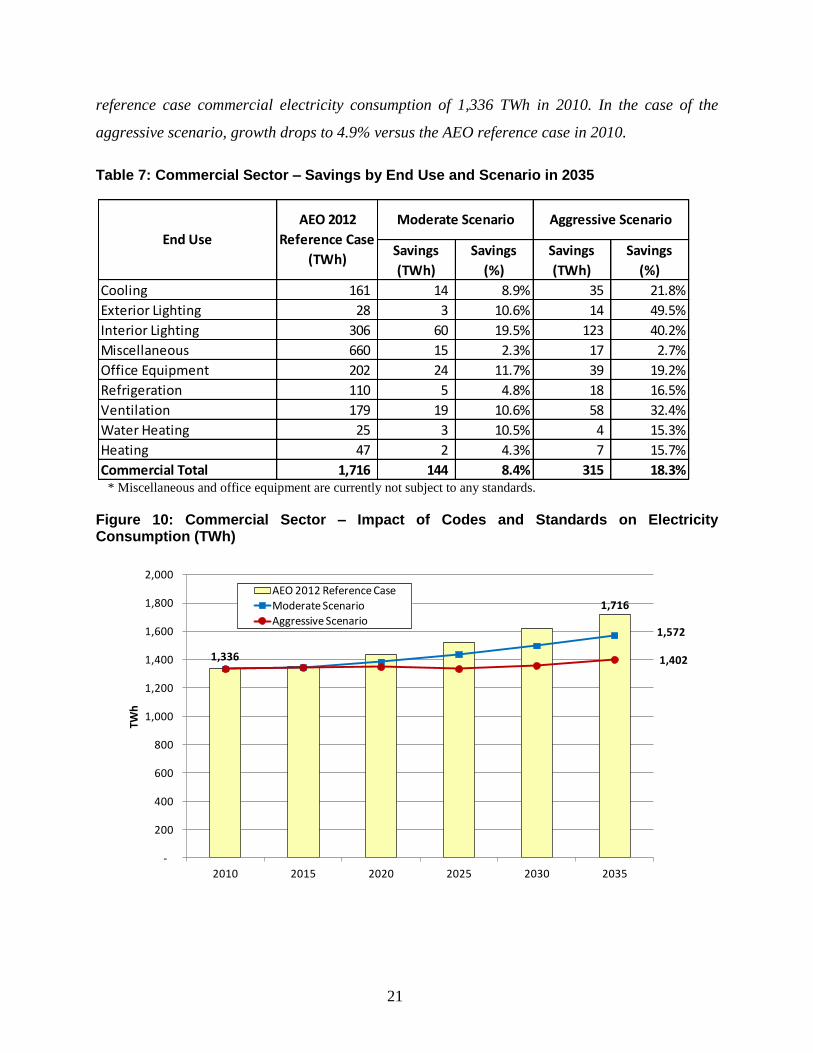
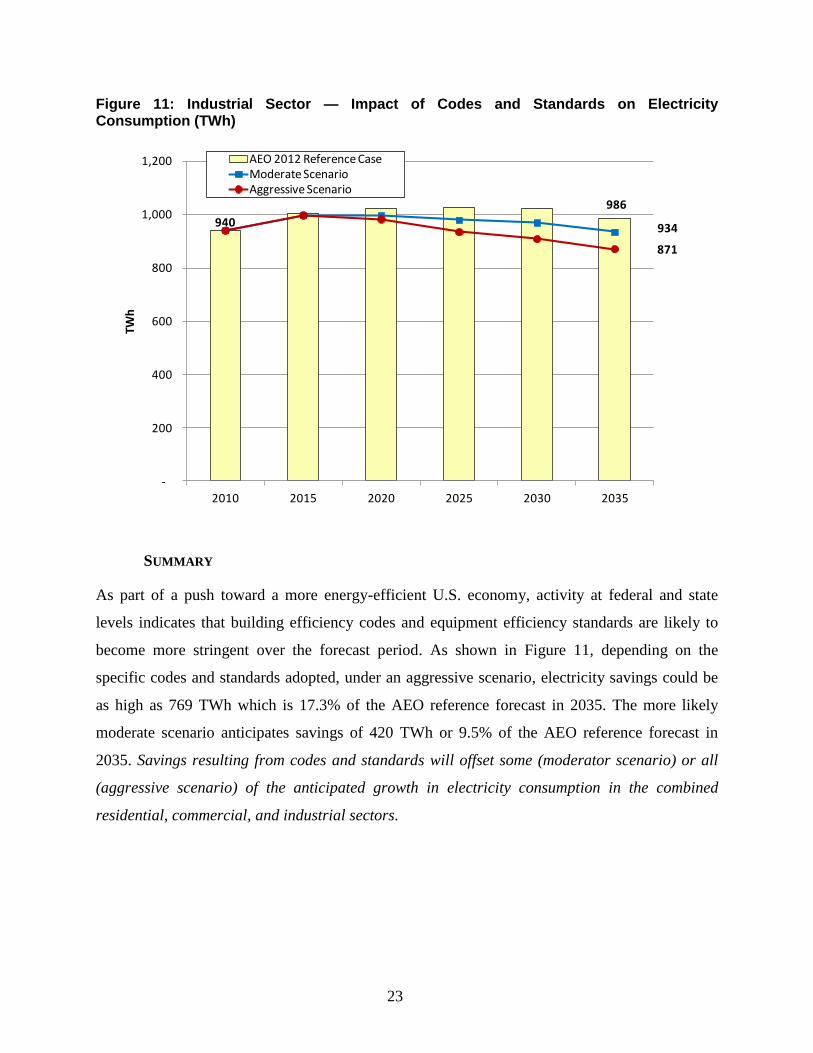
Figure 11shows that the reference forecast in the industrial sector, although declining slightly in
the final decade, still increases 4.9% over the 26-year horizon. The moderate codes and
standards scenario decreases usage during that time period by 0.6% relative to the 2010
reference industrial electricity consumption of 940 TWh. For the aggressive scenario case, usage
decreases by 7.3% versus the 2010 reference.
Savings
(TWh)
Savings
(%)
Savings
(TWh)
Savings
(%)
Cooling 34 3 9.6% 5 14.9%
Exterior Lighting 6 0 7.1% 3 53.2%
Interior Lighting 60 7 12.0% 26 43.2%
Machine Drive 488 37 7.6% 71 14.6%
Other 71 0 0.1% 0 0.1%
Process 276 - 0.0% - 0.0%
Ventilation 27 2 7.3% 7 27.3%
Heating 24 2 8.0% 2 10.2%
Industrial Total 986 52 5.3% 115 11.7%
End Use
AEO 2012
Reference Case
(TWh)
Moderate Scenario Aggressive Scenario
23
Figure 11: Industrial Sector — Impact of Codes and Standards on Electricity Consumption (TWh)
SUMMARY
As part of a push toward a more energy-efficient U.S. economy, activity at federal and state
levels indicates that building efficiency codes and equipment efficiency standards are likely to
become more stringent over the forecast period. As shown in Figure 11, depending on the
specific codes and standards adopted, under an aggressive scenario, electricity savings could be
as high as 769 TWh which is 17.3% of the AEO reference forecast in 2035. The more likely
moderate scenario anticipates savings of 420 TWh or 9.5% of the AEO reference forecast in
2035. Savings resulting from codes and standards will offset some (moderator scenario) or all
(aggressive scenario) of the anticipated growth in electricity consumption in the combined
residential, commercial, and industrial sectors.
986
934
871
-
200
400
600
800
1,000
1,200
2010 2015 2020 2025 2030 2035
TWh
AEO 2012 Reference CaseModerate ScenarioAggressive Scenario
940
24
RATEPAYER-FUNDED EFFICIENCY PROGRAMS
In most states, electric utilities or other entities have developed programs to deliver energy
efficiency (EE) programs and associated savings. These EE programs generally are ratepayer-
funded, through mechanisms such as a line item public benefits charge, to offset expenditures
such as the purchase price of energy efficient products, consumer education and information
activities which support market transformation, and behavior-based programs. In 2010,
approximately 85 percent of the dollars allocated to ratepayer-funded efficiency programs were
administered by the utility that provides electric service to the customer, with the remaining
dollars administered by an independent or state entity. To assess the impact of these ratepayer-
funded programs on future electricity use, we developed a forecast of savings and costs based on
historical program data as well as trends and forecasts in the different states and regions.
Some ratepayer-funded programs are beginning to focus their funding and efforts on the
strengthening and adoption of codes and standards. Arguably, changes to codes and standards are
a cost-effective means to achieve persistent savings. Indeed, changes in building codes and
equipment standards may make it increasingly challenging to achieve energy savings through
traditional ratepayer-funded energy efficiency programs, particularly those that target individual
appliances and equipment, since new codes and standards reap some of the “low-hanging fruit”.
In response, utility programs may need to turn to measures with higher costs per kWh of energy
or kW of demand shifted/saved. On the other hand, as the importance of codes and standards
grows, utilities and program implementers are finding new opportunities to partner with
government bodies, trade allies, and industry partners to increase effectiveness of new building
codes and equipment standards ― in many cases gaining credit for some of the savings toward
meeting their efficiency goals, creating a win-win situation.7
To avoid double counting between the codes and standards savings (C&S) developed in the
previous chapter and any ratepayer-funded codes and standards activities, we identify the
impacts due to ratepayer-funded C&S programs and remove them from the EE program tally. At
the national level the attribution of this overlap is moot as the net effect on U.S. electricity
consumption remains the same. However, for participating utilities, the attribution of energy
7 For additional information on this topic, please see IEE whitepaper, “Integrating Codes and Standards into
Electric Utility Energy Efficiency Portfolios” (August 2011).
25
savings resulting from ratepayer-funded codes and standards programs is very important. In the
face of increasing statewide and utility-specific energy efficiency program performance targets,
along with the rules and regulations that govern how energy savings are calculated, proper
attribution of energy savings from codes and standards programs is a very real business concern
for participating utilities.
RATEPAYER-FUNDED EE PROGRAM ANALYSIS APPROACH
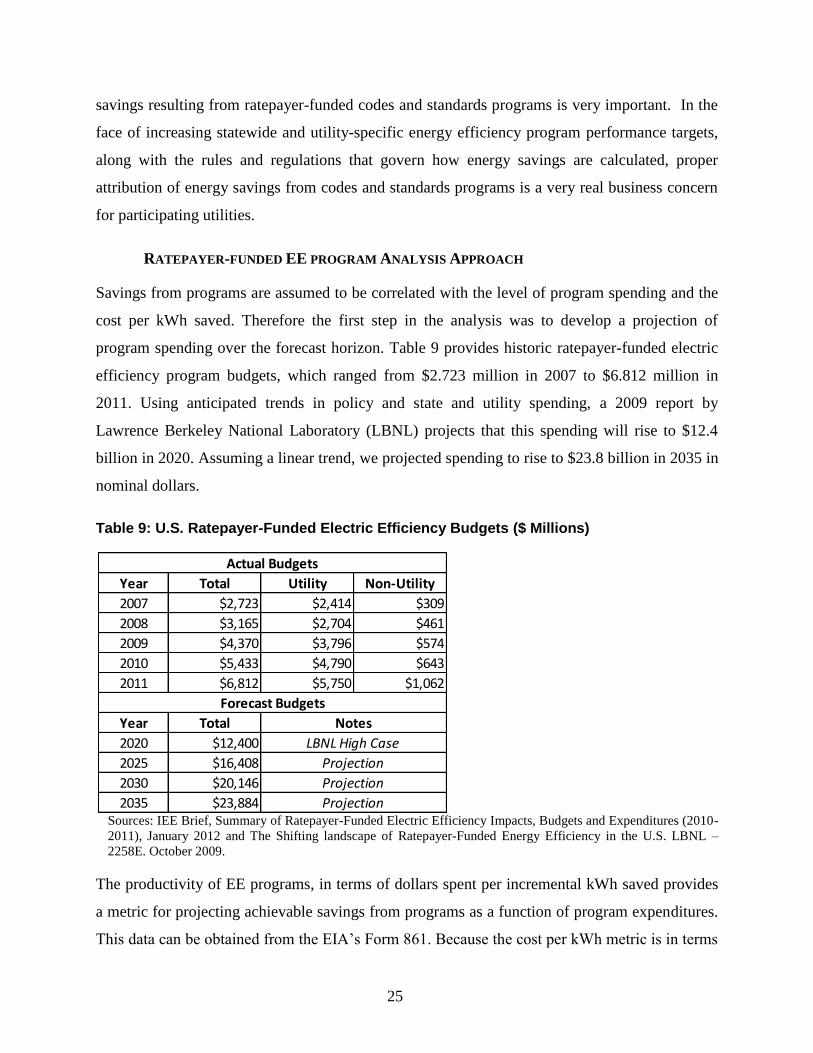
Savings from programs are assumed to be correlated with the level of program spending and the
cost per kWh saved. Therefore the first step in the analysis was to develop a projection of
program spending over the forecast horizon. Table 9 provides historic ratepayer-funded electric
efficiency program budgets, which ranged from $2.723 million in 2007 to $6.812 million in
2011. Using anticipated trends in policy and state and utility spending, a 2009 report by
Lawrence Berkeley National Laboratory (LBNL) projects that this spending will rise to $12.4
billion in 2020. Assuming a linear trend, we projected spending to rise to $23.8 billion in 2035 in
nominal dollars.
Table 9: U.S. Ratepayer-Funded Electric Efficiency Budgets ($ Millions)
Sources: IEE Brief, Summary of Ratepayer-Funded Electric Efficiency Impacts, Budgets and Expenditures (2010-
2011), January 2012 and The Shifting landscape of Ratepayer-Funded Energy Efficiency in the U.S. LBNL –
2258E. October 2009.
The productivity of EE programs, in terms of dollars spent per incremental kWh saved provides
a metric for projecting achievable savings from programs as a function of program expenditures.
This data can be obtained from the EIA’s Form 861. Because the cost per kWh metric is in terms
Year Total Utility Non-Utility
2007 $2,723 $2,414 $309
2008 $3,165 $2,704 $461
2009 $4,370 $3,796 $574
2010 $5,433 $4,790 $643
2011 $6,812 $5,750 $1,062
Year Total
2020 $12,400
2025 $16,408
2030 $20,146
2035 $23,884 Projection
Notes
Actual Budgets
Forecast Budgets
LBNL High Case
Projection
Projection
26
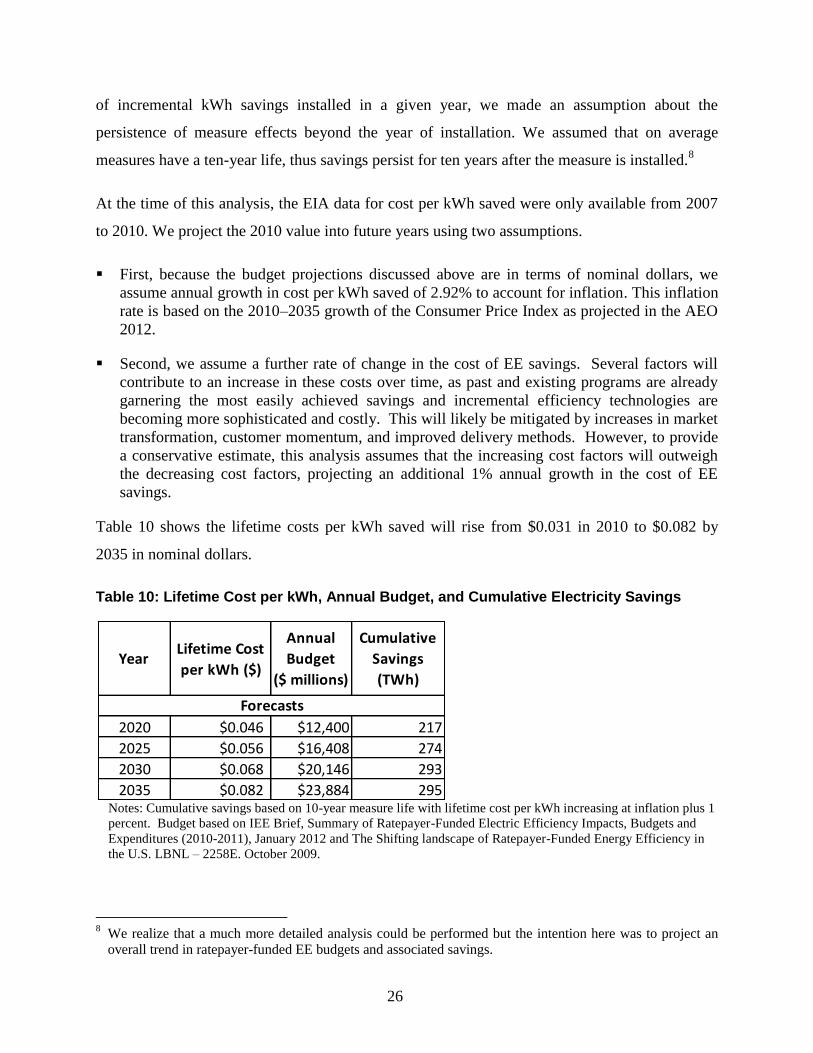
of incremental kWh savings installed in a given year, we made an assumption about the
persistence of measure effects beyond the year of installation. We assumed that on average
measures have a ten-year life, thus savings persist for ten years after the measure is installed.8
At the time of this analysis, the EIA data for cost per kWh saved were only available from 2007
to 2010. We project the 2010 value into future years using two assumptions.
First, because the budget projections discussed above are in terms of nominal dollars, we
assume annual growth in cost per kWh saved of 2.92% to account for inflation. This inflation
rate is based on the 2010–2035 growth of the Consumer Price Index as projected in the AEO
2012.
Second, we assume a further rate of change in the cost of EE savings. Several factors will
contribute to an increase in these costs over time, as past and existing programs are already
garnering the most easily achieved savings and incremental efficiency technologies are
becoming more sophisticated and costly. This will likely be mitigated by increases in market
transformation, customer momentum, and improved delivery methods. However, to provide
a conservative estimate, this analysis assumes that the increasing cost factors will outweigh
the decreasing cost factors, projecting an additional 1% annual growth in the cost of EE
savings.
Table 10 shows the lifetime costs per kWh saved will rise from $0.031 in 2010 to $0.082 by
2035 in nominal dollars.
Table 10: Lifetime Cost per kWh, Annual Budget, and Cumulative Electricity Savings
Notes: Cumulative savings based on 10-year measure life with lifetime cost per kWh increasing at inflation plus 1
percent. Budget based on IEE Brief, Summary of Ratepayer-Funded Electric Efficiency Impacts, Budgets and
Expenditures (2010-2011), January 2012 and The Shifting landscape of Ratepayer-Funded Energy Efficiency in
the U.S. LBNL – 2258E. October 2009.
8 We realize that a much more detailed analysis could be performed but the intention here was to project an
overall trend in ratepayer-funded EE budgets and associated savings.
YearLifetime Cost
per kWh ($)
Annual
Budget
($ millions)
Cumulative
Savings
(TWh)
2020 $0.046 $12,400 217
2025 $0.056 $16,408 274
2030 $0.068 $20,146 293
2035 $0.082 $23,884 295
Forecasts
27
Next, the trends in program budgets and the trends in costs to achieve savings were combined to
project a stream of savings on a year-by-year basis. Cumulative savings are relative to the start of
the IEE forecast period (2010) and accumulate from 2010. In summary, energy savings from
ratepayer-funded electric efficiency programs are projected to be 274 TWh in 2025 and 295
TWh in 2035.
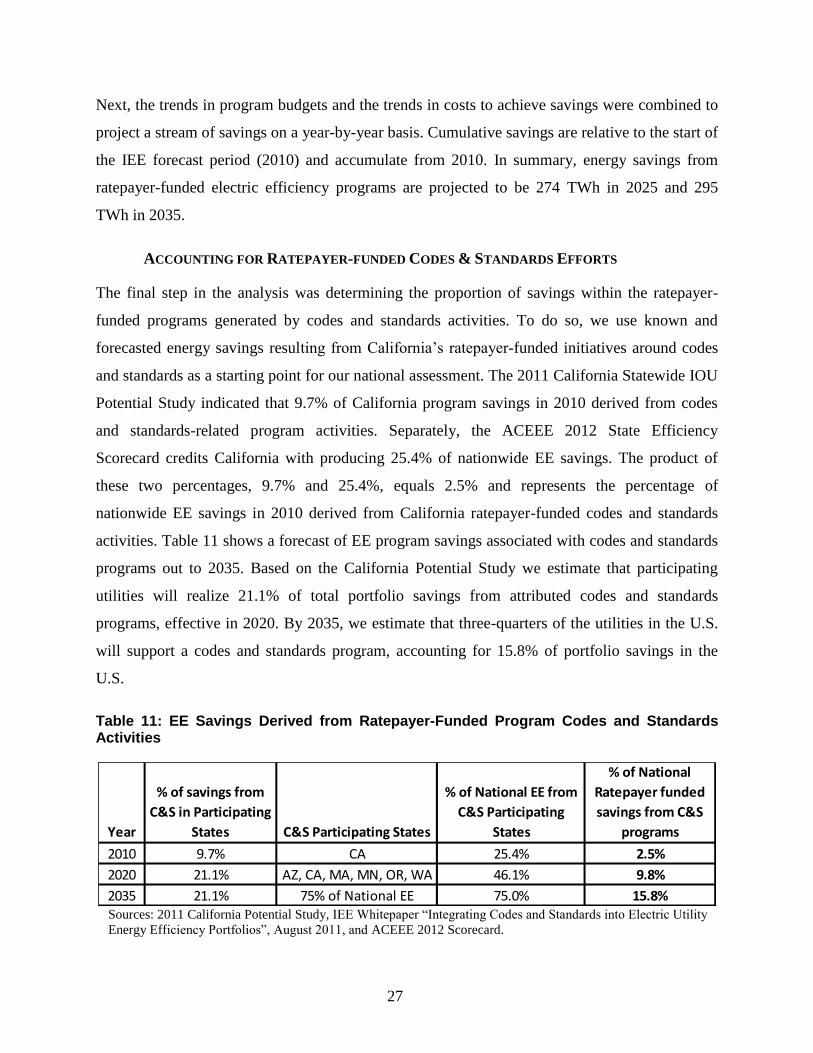
ACCOUNTING FOR RATEPAYER-FUNDED CODES & STANDARDS EFFORTS
The final step in the analysis was determining the proportion of savings within the ratepayer-
funded programs generated by codes and standards activities. To do so, we use known and
forecasted energy savings resulting from California’s ratepayer-funded initiatives around codes
and standards as a starting point for our national assessment. The 2011 California Statewide IOU
Potential Study indicated that 9.7% of California program savings in 2010 derived from codes
and standards-related program activities. Separately, the ACEEE 2012 State Efficiency
Scorecard credits California with producing 25.4% of nationwide EE savings. The product of
these two percentages, 9.7% and 25.4%, equals 2.5% and represents the percentage of
nationwide EE savings in 2010 derived from California ratepayer-funded codes and standards
activities. Table 11 shows a forecast of EE program savings associated with codes and standards
programs out to 2035. Based on the California Potential Study we estimate that participating
utilities will realize 21.1% of total portfolio savings from attributed codes and standards
programs, effective in 2020. By 2035, we estimate that three-quarters of the utilities in the U.S.
will support a codes and standards program, accounting for 15.8% of portfolio savings in the
U.S.
Table 11: EE Savings Derived from Ratepayer-Funded Program Codes and Standards Activities
Sources: 2011 California Potential Study, IEE Whitepaper “Integrating Codes and Standards into Electric Utility
Energy Efficiency Portfolios”, August 2011, and ACEEE 2012 Scorecard.
Year
% of savings from
C&S in Participating
States C&S Participating States
% of National EE from
C&S Participating
States
% of National
Ratepayer funded
savings from C&S
programs
2010 9.7% CA 25.4% 2.5%
2020 21.1% AZ, CA, MA, MN, OR, WA 46.1% 9.8%
2035 21.1% 75% of National EE 75.0% 15.8%
28
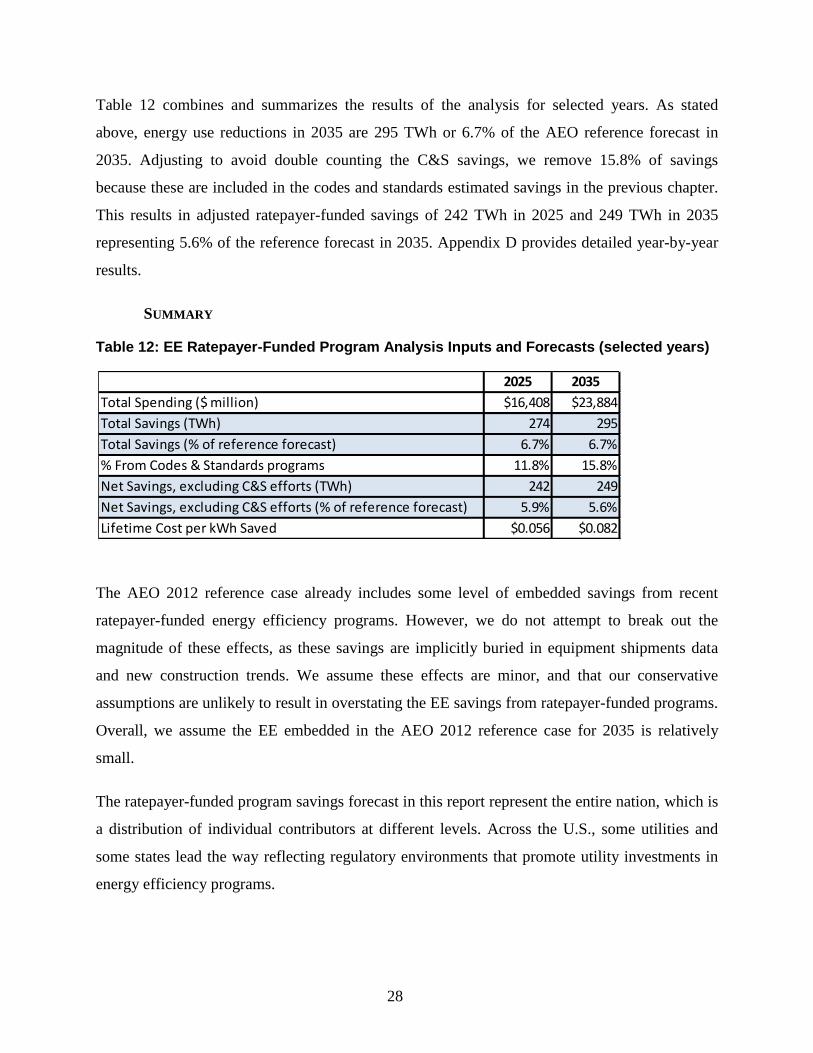
Table 12 combines and summarizes the results of the analysis for selected years. As stated
above, energy use reductions in 2035 are 295 TWh or 6.7% of the AEO reference forecast in
2035. Adjusting to avoid double counting the C&S savings, we remove 15.8% of savings
because these are included in the codes and standards estimated savings in the previous chapter.
This results in adjusted ratepayer-funded savings of 242 TWh in 2025 and 249 TWh in 2035
representing 5.6% of the reference forecast in 2035. Appendix D provides detailed year-by-year
results.
SUMMARY
Table 12: EE Ratepayer-Funded Program Analysis Inputs and Forecasts (selected years)
The AEO 2012 reference case already includes some level of embedded savings from recent
ratepayer-funded energy efficiency programs. However, we do not attempt to break out the
magnitude of these effects, as these savings are implicitly buried in equipment shipments data
and new construction trends. We assume these effects are minor, and that our conservative
assumptions are unlikely to result in overstating the EE savings from ratepayer-funded programs.
Overall, we assume the EE embedded in the AEO 2012 reference case for 2035 is relatively
small.
The ratepayer-funded program savings forecast in this report represent the entire nation, which is
a distribution of individual contributors at different levels. Across the U.S., some utilities and
some states lead the way reflecting regulatory environments that promote utility investments in
energy efficiency programs.
2025 2035
Total Spending ($ million) $16,408 $23,884
Total Savings (TWh) 274 295
Total Savings (% of reference forecast) 6.7% 6.7%
% From Codes & Standards programs 11.8% 15.8%
Net Savings, excluding C&S efforts (TWh) 242 249
Net Savings, excluding C&S efforts (% of reference forecast) 5.9% 5.6%
Lifetime Cost per kWh Saved $0.056 $0.082
29
ELECTRIC TRANSPORTATION
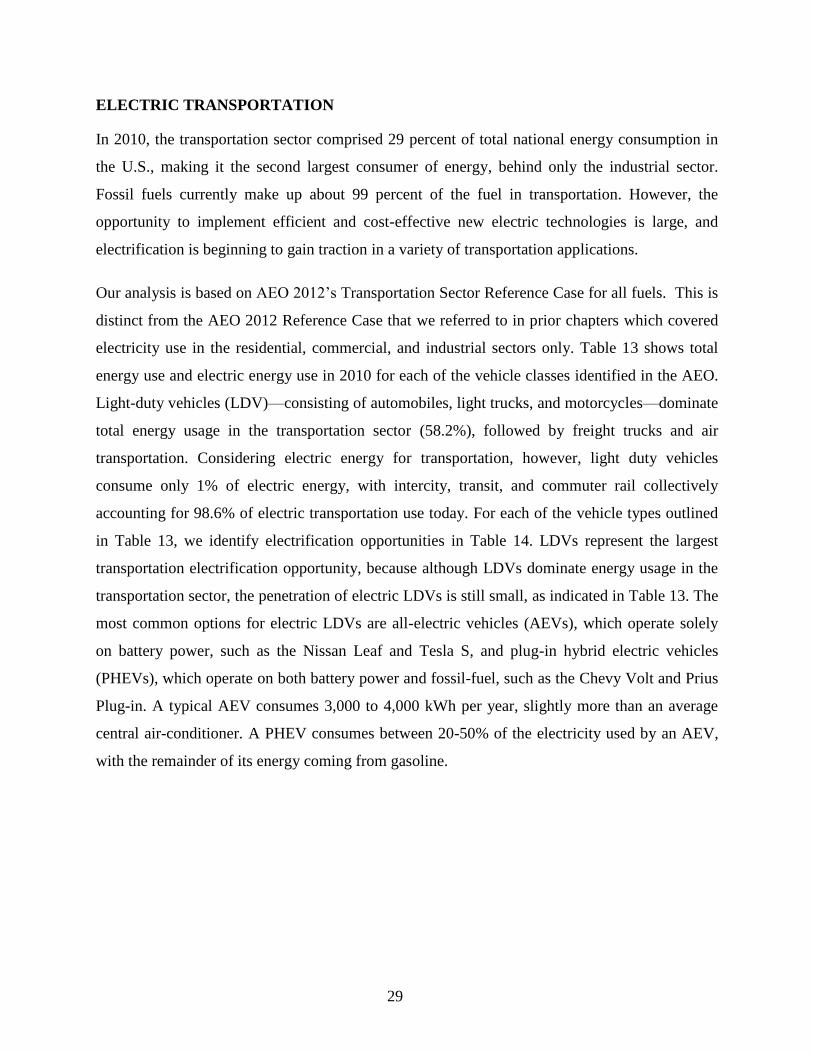
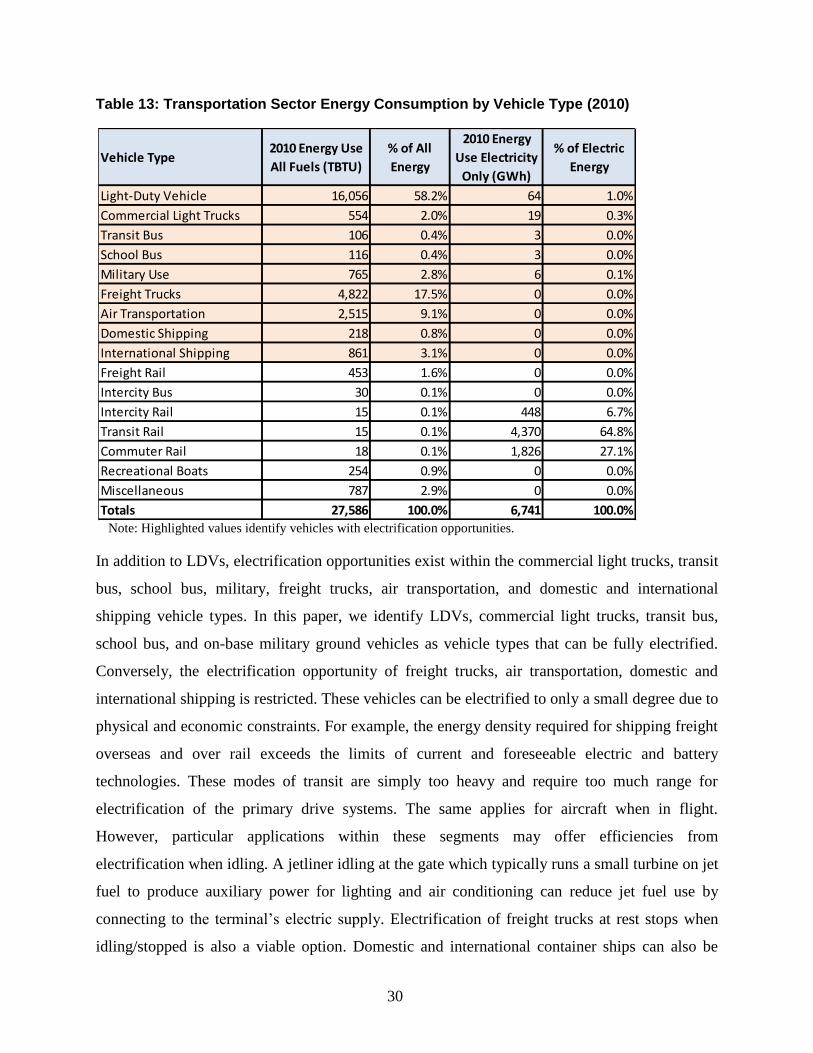
In 2010, the transportation sector comprised 29 percent of total national energy consumption in
the U.S., making it the second largest consumer of energy, behind only the industrial sector.
Fossil fuels currently make up about 99 percent of the fuel in transportation. However, the
opportunity to implement efficient and cost-effective new electric technologies is large, and
electrification is beginning to gain traction in a variety of transportation applications.
Our analysis is based on AEO 2012’s Transportation Sector Reference Case for all fuels. This is
distinct from the AEO 2012 Reference Case that we referred to in prior chapters which covered
electricity use in the residential, commercial, and industrial sectors only. Table 13 shows total
energy use and electric energy use in 2010 for each of the vehicle classes identified in the AEO.
Light-duty vehicles (LDV)—consisting of automobiles, light trucks, and motorcycles—dominate
total energy usage in the transportation sector (58.2%), followed by freight trucks and air
transportation. Considering electric energy for transportation, however, light duty vehicles
consume only 1% of electric energy, with intercity, transit, and commuter rail collectively
accounting for 98.6% of electric transportation use today. For each of the vehicle types outlined
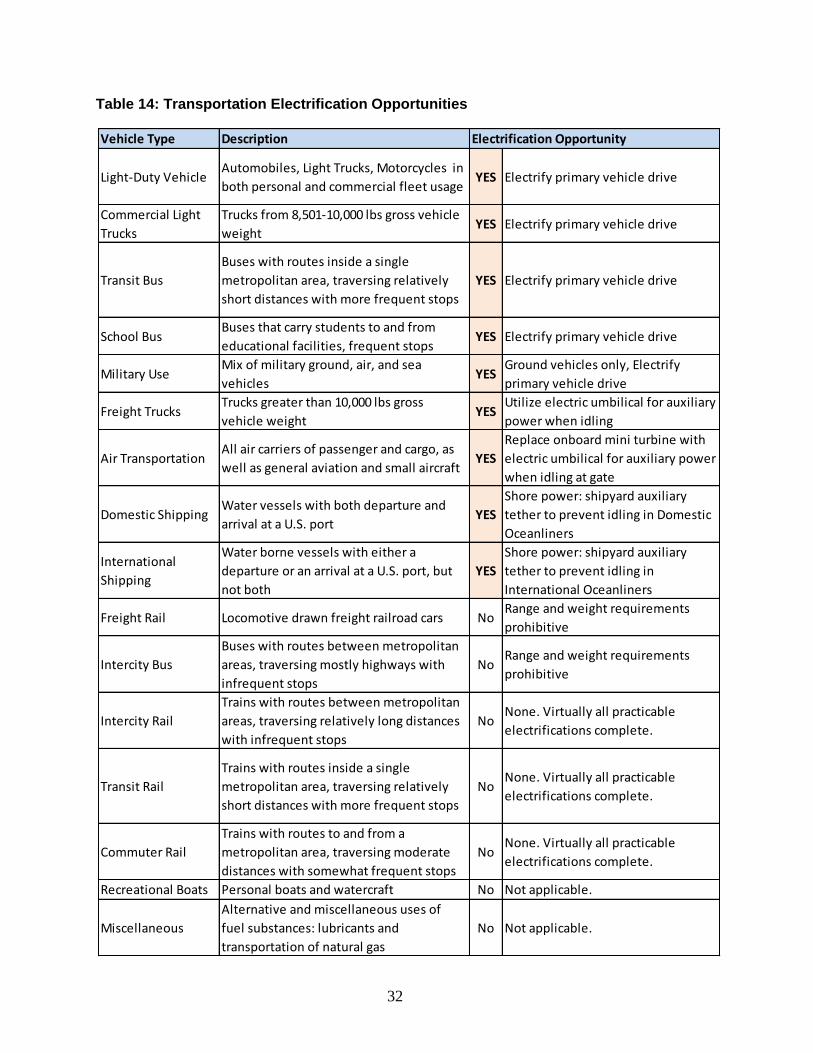
in Table 13, we identify electrification opportunities in Table 14. LDVs represent the largest
transportation electrification opportunity, because although LDVs dominate energy usage in the
transportation sector, the penetration of electric LDVs is still small, as indicated in Table 13. The
most common options for electric LDVs are all-electric vehicles (AEVs), which operate solely
on battery power, such as the Nissan Leaf and Tesla S, and plug-in hybrid electric vehicles
(PHEVs), which operate on both battery power and fossil-fuel, such as the Chevy Volt and Prius
Plug-in. A typical AEV consumes 3,000 to 4,000 kWh per year, slightly more than an average
central air-conditioner. A PHEV consumes between 20-50% of the electricity used by an AEV,
with the remainder of its energy coming from gasoline.
30
Table 13: Transportation Sector Energy Consumption by Vehicle Type (2010)
Note: Highlighted values identify vehicles with electrification opportunities.
In addition to LDVs, electrification opportunities exist within the commercial light trucks, transit
bus, school bus, military, freight trucks, air transportation, and domestic and international
shipping vehicle types. In this paper, we identify LDVs, commercial light trucks, transit bus,
school bus, and on-base military ground vehicles as vehicle types that can be fully electrified.
Conversely, the electrification opportunity of freight trucks, air transportation, domestic and
international shipping is restricted. These vehicles can be electrified to only a small degree due to
physical and economic constraints. For example, the energy density required for shipping freight
overseas and over rail exceeds the limits of current and foreseeable electric and battery
technologies. These modes of transit are simply too heavy and require too much range for
electrification of the primary drive systems. The same applies for aircraft when in flight.
However, particular applications within these segments may offer efficiencies from
electrification when idling. A jetliner idling at the gate which typically runs a small turbine on jet
fuel to produce auxiliary power for lighting and air conditioning can reduce jet fuel use by
connecting to the terminal’s electric supply. Electrification of freight trucks at rest stops when
idling/stopped is also a viable option. Domestic and international container ships can also be
Vehicle Type2010 Energy Use
All Fuels (TBTU)
% of All
Energy
2010 Energy
Use Electricity
Only (GWh)
% of Electric
Energy
Light-Duty Vehicle 16,056 58.2% 64 1.0%
Commercial Light Trucks 554 2.0% 19 0.3%
Transit Bus 106 0.4% 3 0.0%
School Bus 116 0.4% 3 0.0%
Military Use 765 2.8% 6 0.1%
Freight Trucks 4,822 17.5% 0 0.0%
Air Transportation 2,515 9.1% 0 0.0%
Domestic Shipping 218 0.8% 0 0.0%
International Shipping 861 3.1% 0 0.0%
Freight Rail 453 1.6% 0 0.0%
Intercity Bus 30 0.1% 0 0.0%
Intercity Rail 15 0.1% 448 6.7%
Transit Rail 15 0.1% 4,370 64.8%
Commuter Rail 18 0.1% 1,826 27.1%
Recreational Boats 254 0.9% 0 0.0%
Miscellaneous 787 2.9% 0 0.0%
Totals 27,586 100.0% 6,741 100.0%
31
powered by electricity while docked at the port. Appendix E shows our transportation
electrification modeling strategy by vehicle type in greater detail.
Non-road transportation equipment at airports, seaports, mines, warehouses, intermodal facilities,
and agriculture production sites also represent electrification opportunities, but this report
primarily focuses on on-road transportation opportunities.
32
Table 14: Transportation Electrification Opportunities
Vehicle Type Description
Light-Duty VehicleAutomobiles, Light Trucks, Motorcycles in
both personal and commercial fleet usageYES Electrify primary vehicle drive
Commercial Light
Trucks
Trucks from 8,501-10,000 lbs gross vehicle
weightYES Electrify primary vehicle drive
Transit Bus
Buses with routes inside a single
metropolitan area, traversing relatively
short distances with more frequent stops
YES Electrify primary vehicle drive
School BusBuses that carry students to and from
educational facilities, frequent stopsYES Electrify primary vehicle drive
Military UseMix of military ground, air, and sea
vehiclesYES
Ground vehicles only, Electrify
primary vehicle drive
Freight TrucksTrucks greater than 10,000 lbs gross
vehicle weightYES
Utilize electric umbilical for auxiliary
power when idling
Air TransportationAll air carriers of passenger and cargo, as
well as general aviation and small aircraftYES
Replace onboard mini turbine with
electric umbilical for auxiliary power
when idling at gate
Domestic ShippingWater vessels with both departure and
arrival at a U.S. portYES
Shore power: shipyard auxiliary
tether to prevent idling in Domestic
Oceanliners
International
Shipping
Water borne vessels with either a
departure or an arrival at a U.S. port, but
not both
YES
Shore power: shipyard auxiliary
tether to prevent idling in
International Oceanliners
Freight Rail Locomotive drawn freight railroad cars NoRange and weight requirements
prohibitive
Intercity Bus
Buses with routes between metropolitan
areas, traversing mostly highways with
infrequent stops
NoRange and weight requirements
prohibitive
Intercity Rail
Trains with routes between metropolitan
areas, traversing relatively long distances
with infrequent stops
NoNone. Virtually all practicable
electrifications complete.
Transit Rail
Trains with routes inside a single
metropolitan area, traversing relatively
short distances with more frequent stops
NoNone. Virtually all practicable
electrifications complete.
Commuter Rail
Trains with routes to and from a
metropolitan area, traversing moderate
distances with somewhat frequent stops
NoNone. Virtually all practicable
electrifications complete.
Recreational Boats Personal boats and watercraft No Not applicable.
Miscellaneous
Alternative and miscellaneous uses of
fuel substances: lubricants and
transportation of natural gas
No Not applicable.
Electrification Opportunity
33
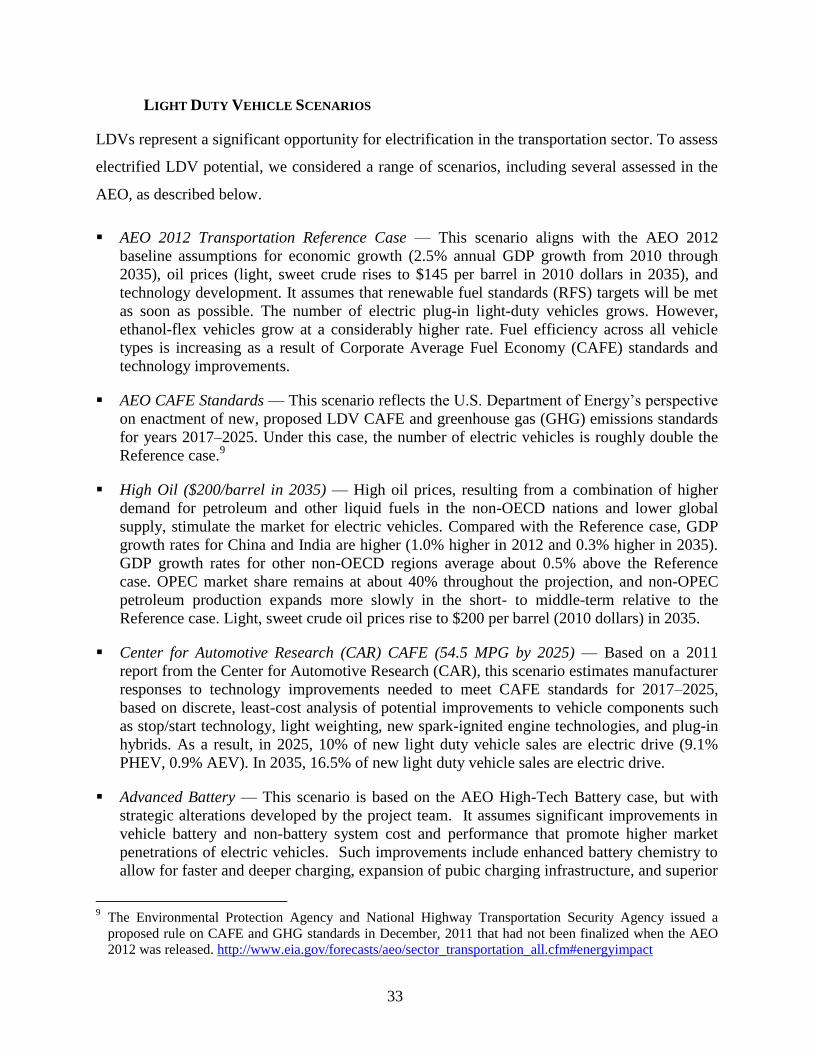
LIGHT DUTY VEHICLE SCENARIOS
LDVs represent a significant opportunity for electrification in the transportation sector. To assess
electrified LDV potential, we considered a range of scenarios, including several assessed in the
AEO, as described below.
AEO 2012 Transportation Reference Case — This scenario aligns with the AEO 2012
baseline assumptions for economic growth (2.5% annual GDP growth from 2010 through
2035), oil prices (light, sweet crude rises to $145 per barrel in 2010 dollars in 2035), and
technology development. It assumes that renewable fuel standards (RFS) targets will be met
as soon as possible. The number of electric plug-in light-duty vehicles grows. However,
ethanol-flex vehicles grow at a considerably higher rate. Fuel efficiency across all vehicle
types is increasing as a result of Corporate Average Fuel Economy (CAFE) standards and
technology improvements.
AEO CAFE Standards — This scenario reflects the U.S. Department of Energy’s perspective
on enactment of new, proposed LDV CAFE and greenhouse gas (GHG) emissions standards
for years 2017–2025. Under this case, the number of electric vehicles is roughly double the
Reference case.9
High Oil ($200/barrel in 2035) — High oil prices, resulting from a combination of higher
demand for petroleum and other liquid fuels in the non-OECD nations and lower global
supply, stimulate the market for electric vehicles. Compared with the Reference case, GDP
growth rates for China and India are higher (1.0% higher in 2012 and 0.3% higher in 2035).
GDP growth rates for other non-OECD regions average about 0.5% above the Reference
case. OPEC market share remains at about 40% throughout the projection, and non-OPEC
petroleum production expands more slowly in the short- to middle-term relative to the
Reference case. Light, sweet crude oil prices rise to $200 per barrel (2010 dollars) in 2035.
Center for Automotive Research (CAR) CAFE (54.5 MPG by 2025) — Based on a 2011
report from the Center for Automotive Research (CAR), this scenario estimates manufacturer
responses to technology improvements needed to meet CAFE standards for 2017–2025,
based on discrete, least-cost analysis of potential improvements to vehicle components such
as stop/start technology, light weighting, new spark-ignited engine technologies, and plug-in
hybrids. As a result, in 2025, 10% of new light duty vehicle sales are electric drive (9.1%
PHEV, 0.9% AEV). In 2035, 16.5% of new light duty vehicle sales are electric drive.
Advanced Battery — This scenario is based on the AEO High-Tech Battery case, but with
strategic alterations developed by the project team. It assumes significant improvements in
vehicle battery and non-battery system cost and performance that promote higher market
penetrations of electric vehicles. Such improvements include enhanced battery chemistry to
allow for faster and deeper charging, expansion of pubic charging infrastructure, and superior
9 The Environmental Protection Agency and National Highway Transportation Security Agency issued a
proposed rule on CAFE and GHG standards in December, 2011 that had not been finalized when the AEO
2012 was released. http://www.eia.gov/forecasts/aeo/sector_transportation_all.cfm#energyimpact
34
battery energy density. Based on these improvements, the project team adjusted the AEO
scenario by redistributing the electric vehicles to include 63% AEV’s, some of which will
have a 200-mile range. These assumptions better represent the battery advances than the
original AEO scenario, which estimated AEV’s at 52% of the electric LDV market and zero
presence of 200-mile vehicles.
Advanced Battery & High Oil ($200/barrel in 2035) — This scenario is a combination of two
of the previously described scenarios: Advanced Battery and AEO High Oil Price. This
scenario models a world affected by both high oil prices and rapid advancements in battery
technology. The vehicle stock and new EV sales resulting from those two scenarios are
summed, then multiplied by 0.90 to reflect that these sales would not be simply additive. A
portion of the purchases driven by high oil prices would also occur under the drivers of
advanced battery technology.
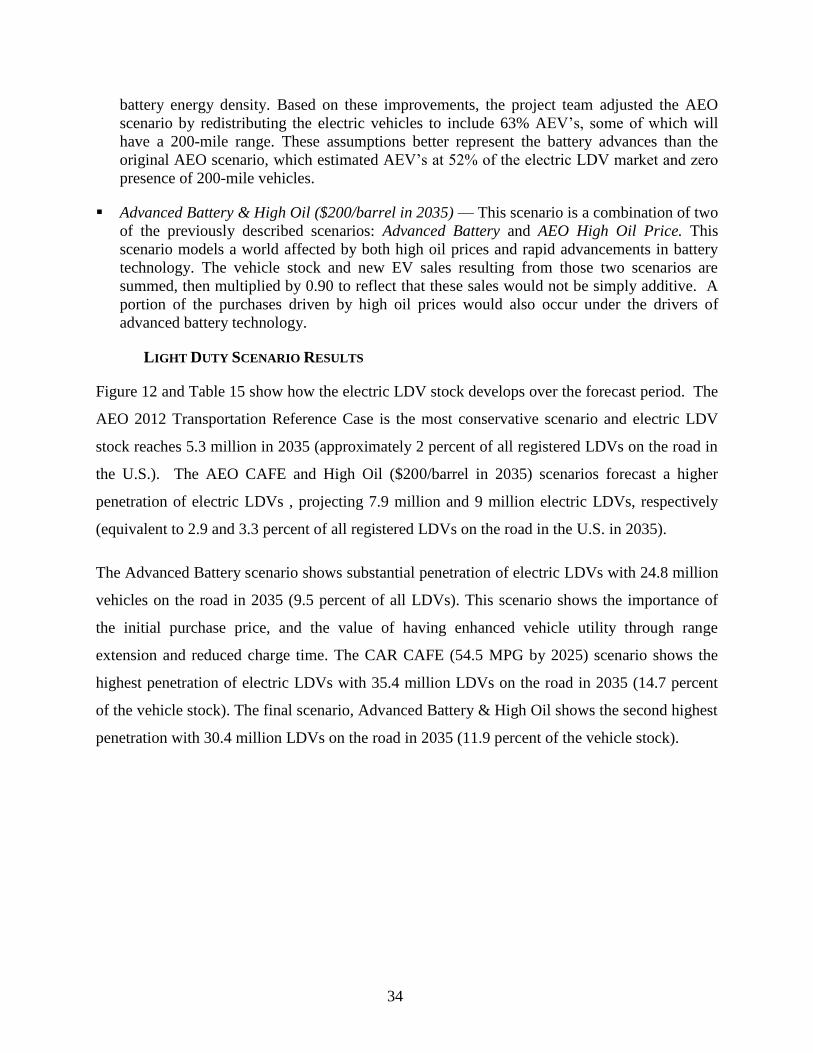
LIGHT DUTY SCENARIO RESULTS
Figure 12 and Table 15 show how the electric LDV stock develops over the forecast period. The
AEO 2012 Transportation Reference Case is the most conservative scenario and electric LDV
stock reaches 5.3 million in 2035 (approximately 2 percent of all registered LDVs on the road in
the U.S.). The AEO CAFE and High Oil ($200/barrel in 2035) scenarios forecast a higher
penetration of electric LDVs , projecting 7.9 million and 9 million electric LDVs, respectively
(equivalent to 2.9 and 3.3 percent of all registered LDVs on the road in the U.S. in 2035).
The Advanced Battery scenario shows substantial penetration of electric LDVs with 24.8 million
vehicles on the road in 2035 (9.5 percent of all LDVs). This scenario shows the importance of
the initial purchase price, and the value of having enhanced vehicle utility through range
extension and reduced charge time. The CAR CAFE (54.5 MPG by 2025) scenario shows the
highest penetration of electric LDVs with 35.4 million LDVs on the road in 2035 (14.7 percent
of the vehicle stock). The final scenario, Advanced Battery & High Oil shows the second highest
penetration with 30.4 million LDVs on the road in 2035 (11.9 percent of the vehicle stock).
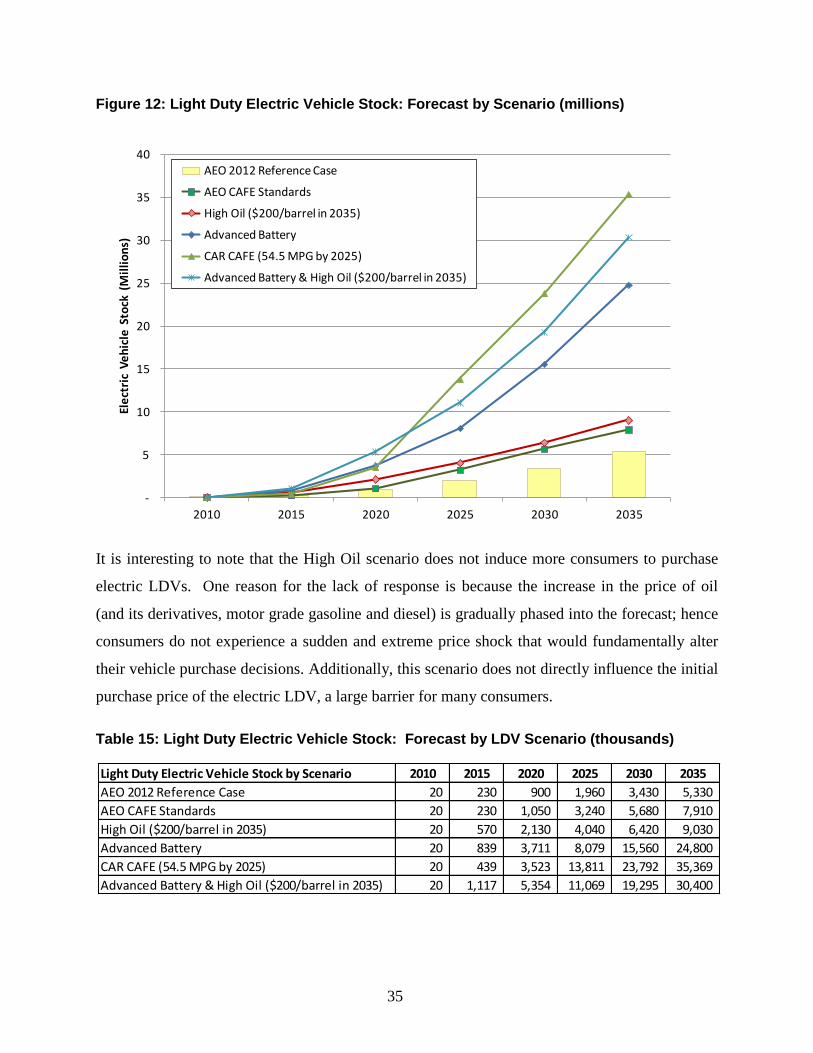
35
Figure 12: Light Duty Electric Vehicle Stock: Forecast by Scenario (millions)
It is interesting to note that the High Oil scenario does not induce more consumers to purchase
electric LDVs. One reason for the lack of response is because the increase in the price of oil
(and its derivatives, motor grade gasoline and diesel) is gradually phased into the forecast; hence
consumers do not experience a sudden and extreme price shock that would fundamentally alter
their vehicle purchase decisions. Additionally, this scenario does not directly influence the initial
purchase price of the electric LDV, a large barrier for many consumers.
Table 15: Light Duty Electric Vehicle Stock: Forecast by LDV Scenario (thousands)
-
5
10
15
20
25
30
35
40
2010 2015 2020 2025 2030 2035
Ele
ctri
c V
eh
icle
Sto
ck (
Mil
lio
ns)
AEO 2012 Reference Case
AEO CAFE Standards
High Oil ($200/barrel in 2035)
Advanced Battery
CAR CAFE (54.5 MPG by 2025)
Advanced Battery & High Oil ($200/barrel in 2035)
Light Duty Electric Vehicle Stock by Scenario 2010 2015 2020 2025 2030 2035
AEO 2012 Reference Case 20 230 900 1,960 3,430 5,330
AEO CAFE Standards 20 230 1,050 3,240 5,680 7,910
High Oil ($200/barrel in 2035) 20 570 2,130 4,040 6,420 9,030
Advanced Battery 20 839 3,711 8,079 15,560 24,800
CAR CAFE (54.5 MPG by 2025) 20 439 3,523 13,811 23,792 35,369
Advanced Battery & High Oil ($200/barrel in 2035) 20 1,117 5,354 11,069 19,295 30,400
36
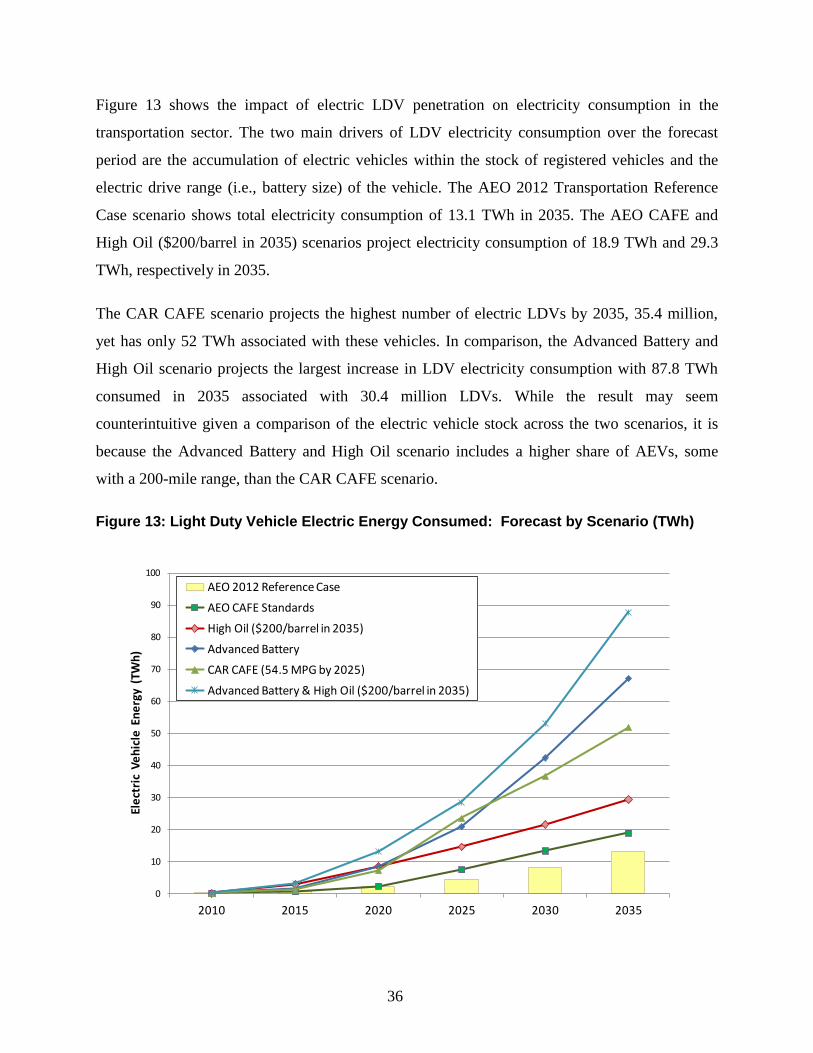
Figure 13 shows the impact of electric LDV penetration on electricity consumption in the
transportation sector. The two main drivers of LDV electricity consumption over the forecast
period are the accumulation of electric vehicles within the stock of registered vehicles and the
electric drive range (i.e., battery size) of the vehicle. The AEO 2012 Transportation Reference
Case scenario shows total electricity consumption of 13.1 TWh in 2035. The AEO CAFE and
High Oil ($200/barrel in 2035) scenarios project electricity consumption of 18.9 TWh and 29.3
TWh, respectively in 2035.
The CAR CAFE scenario projects the highest number of electric LDVs by 2035, 35.4 million,
yet has only 52 TWh associated with these vehicles. In comparison, the Advanced Battery and
High Oil scenario projects the largest increase in LDV electricity consumption with 87.8 TWh
consumed in 2035 associated with 30.4 million LDVs. While the result may seem
counterintuitive given a comparison of the electric vehicle stock across the two scenarios, it is
because the Advanced Battery and High Oil scenario includes a higher share of AEVs, some
with a 200-mile range, than the CAR CAFE scenario.
Figure 13: Light Duty Vehicle Electric Energy Consumed: Forecast by Scenario (TWh)
0
10
20
30
40
50
60
70
80
90
100
2010 2015 2020 2025 2030 2035
Ele
ctri
c V
eh
icle
En
erg
y (
TWh
)
AEO 2012 Reference Case
AEO CAFE Standards
High Oil ($200/barrel in 2035)
Advanced Battery
CAR CAFE (54.5 MPG by 2025)
Advanced Battery & High Oil ($200/barrel in 2035)
37
TRANSPORTATION SCENARIOS
We defined two electric transportation scenarios, moderate and aggressive, as defined below.
The moderate electric transportation scenario includes:
o The penetration of electric LDVs from the AEO 2012 Transportation Reference Case.
o Electrification of commercial light trucks, transit bus, school bus, and military
vehicle type stock at 50 percent the growth rate for electric LDVs in the AEO 2012
Transportation Reference Case. The battery and charging infrastructure technology
used by these vehicles types is similar to electric LDVs.
o Freight trucks, air transportation, and domestic and international shipping vehicle
types displace 20 percent of their fossil fuel energy demands with auxiliary electric
power while idled.
o Transit and commuter rail electrification are based on the AEO 2012 Transportation
Reference Case.
The aggressive electric transportation scenario includes:
o The penetration of electric LDVs from the Advanced Battery & High Oil ($200/barrel
in 2035) scenarios.
o Electrification of commercial light trucks, transit bus, school bus, and military vehicle
type stock at 50 percent the growth rate for electric LDVs in the Advanced Battery
&High Oil ($200/barrel in 2035) scenarios. The battery and charging infrastructure
technology used by these vehicles types is similar to electric LDVs.
o Freight trucks, air transportation, and domestic and international shipping vehicle
types displace 50 percent of their fossil fuel energy demands with auxiliary electric
power while idled.
o Transit and commuter rail electrification are based on the AEO 2012 Transportation
Reference Case.
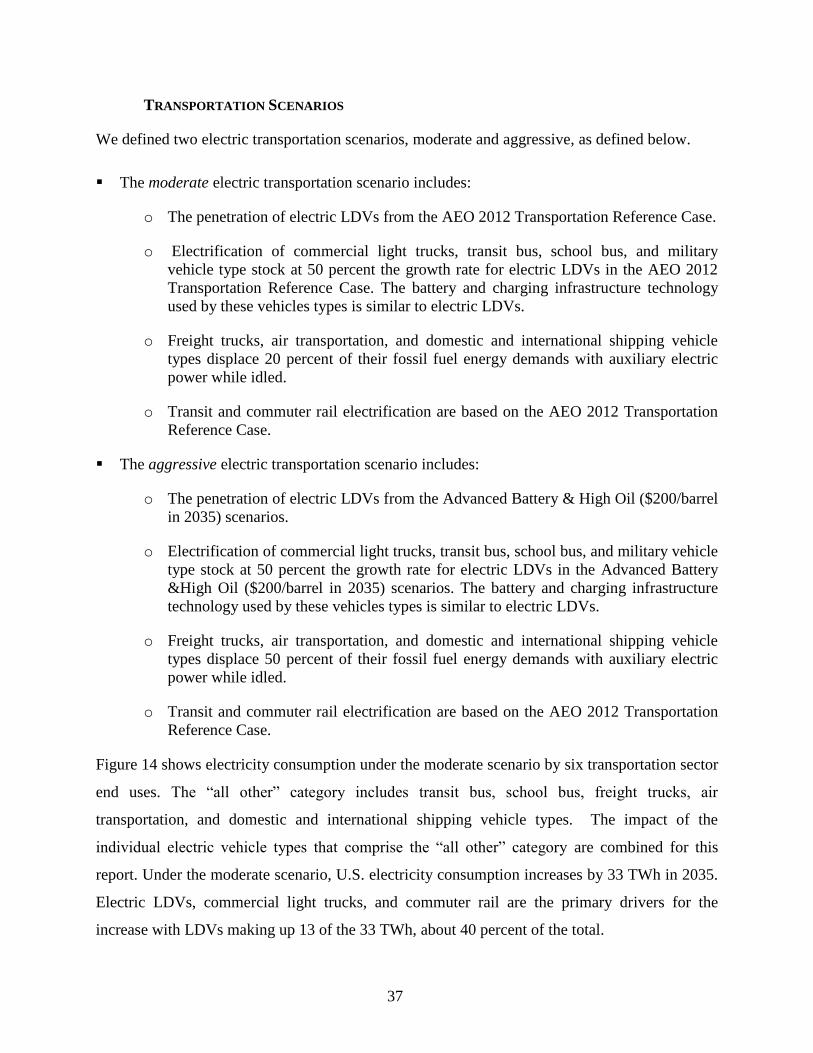
Figure 14 shows electricity consumption under the moderate scenario by six transportation sector
end uses. The “all other” category includes transit bus, school bus, freight trucks, air
transportation, and domestic and international shipping vehicle types. The impact of the
individual electric vehicle types that comprise the “all other” category are combined for this
report. Under the moderate scenario, U.S. electricity consumption increases by 33 TWh in 2035.
Electric LDVs, commercial light trucks, and commuter rail are the primary drivers for the
increase with LDVs making up 13 of the 33 TWh, about 40 percent of the total.
38
Figure 14: Electricity Use in Transportation Sector – Moderate Scenario (TWh)
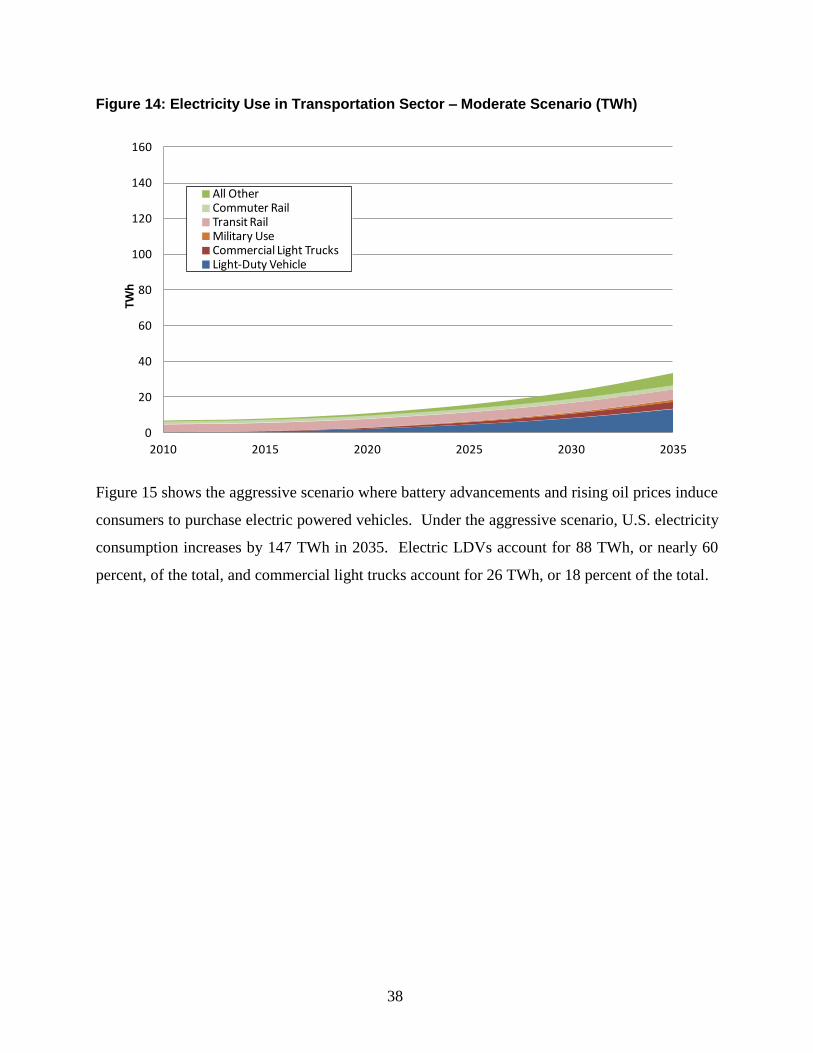
Figure 15 shows the aggressive scenario where battery advancements and rising oil prices induce
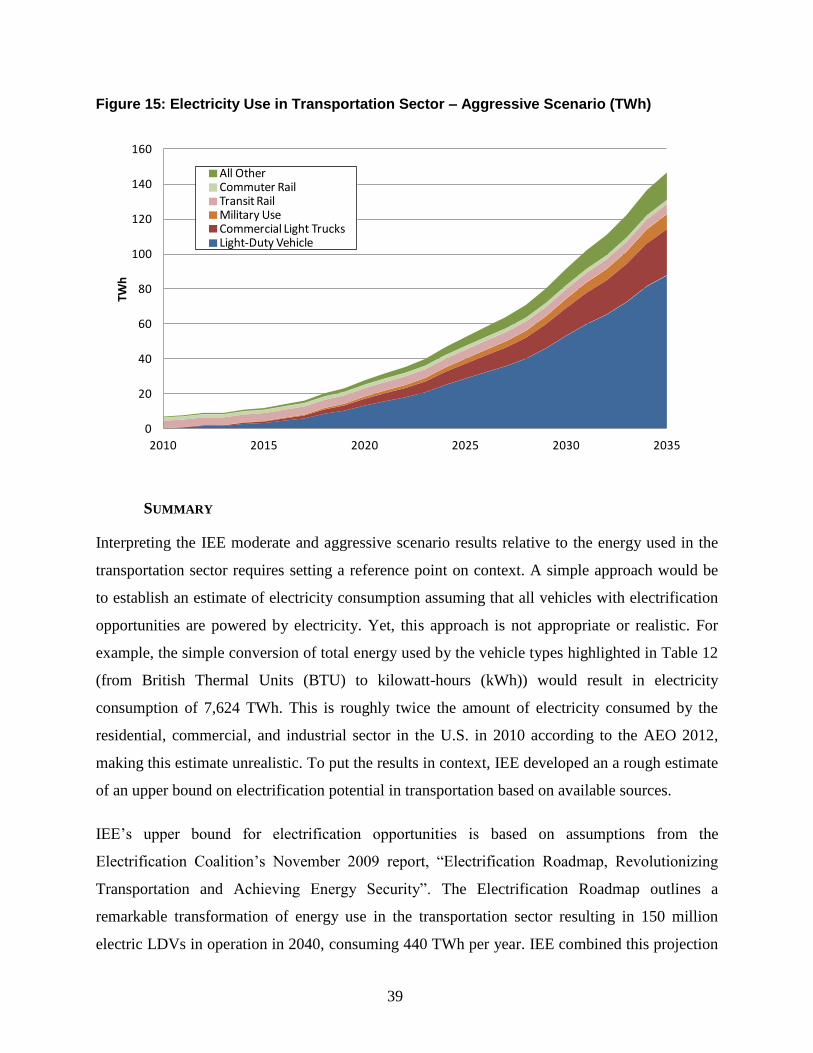
consumers to purchase electric powered vehicles. Under the aggressive scenario, U.S. electricity
consumption increases by 147 TWh in 2035. Electric LDVs account for 88 TWh, or nearly 60
percent, of the total, and commercial light trucks account for 26 TWh, or 18 percent of the total.
0
20
40
60
80
100
120
140
160
2010 2015 2020 2025 2030 2035
TWh
All OtherCommuter RailTransit RailMilitary UseCommercial Light TrucksLight-Duty Vehicle
39
Figure 15: Electricity Use in Transportation Sector – Aggressive Scenario (TWh)
SUMMARY
Interpreting the IEE moderate and aggressive scenario results relative to the energy used in the
transportation sector requires setting a reference point on context. A simple approach would be
to establish an estimate of electricity consumption assuming that all vehicles with electrification
opportunities are powered by electricity. Yet, this approach is not appropriate or realistic. For
example, the simple conversion of total energy used by the vehicle types highlighted in Table 12
(from British Thermal Units (BTU) to kilowatt-hours (kWh)) would result in electricity
consumption of 7,624 TWh. This is roughly twice the amount of electricity consumed by the
residential, commercial, and industrial sector in the U.S. in 2010 according to the AEO 2012,
making this estimate unrealistic. To put the results in context, IEE developed an a rough estimate
of an upper bound on electrification potential in transportation based on available sources.
IEE’s upper bound for electrification opportunities is based on assumptions from the
Electrification Coalition’s November 2009 report, “Electrification Roadmap, Revolutionizing
Transportation and Achieving Energy Security”. The Electrification Roadmap outlines a
remarkable transformation of energy use in the transportation sector resulting in 150 million
electric LDVs in operation in 2040, consuming 440 TWh per year. IEE combined this projection
0
20
40
60
80
100
120
140
160
2010 2015 2020 2025 2030 2035
TWh
All OtherCommuter RailTransit RailMilitary UseCommercial Light TrucksLight-Duty Vehicle
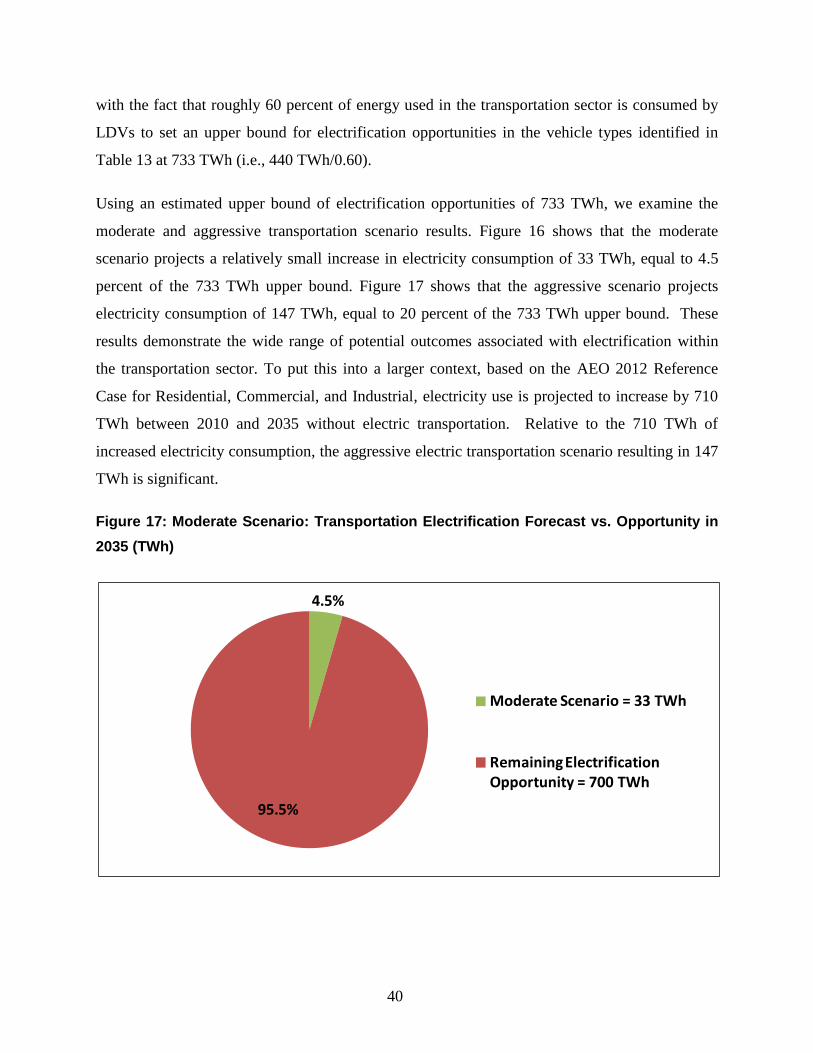
40
with the fact that roughly 60 percent of energy used in the transportation sector is consumed by
LDVs to set an upper bound for electrification opportunities in the vehicle types identified in
Table 13 at 733 TWh (i.e., 440 TWh/0.60).
Using an estimated upper bound of electrification opportunities of 733 TWh, we examine the
moderate and aggressive transportation scenario results. Figure 16 shows that the moderate
scenario projects a relatively small increase in electricity consumption of 33 TWh, equal to 4.5
percent of the 733 TWh upper bound. Figure 17 shows that the aggressive scenario projects
electricity consumption of 147 TWh, equal to 20 percent of the 733 TWh upper bound. These
results demonstrate the wide range of potential outcomes associated with electrification within
the transportation sector. To put this into a larger context, based on the AEO 2012 Reference
Case for Residential, Commercial, and Industrial, electricity use is projected to increase by 710
TWh between 2010 and 2035 without electric transportation. Relative to the 710 TWh of
increased electricity consumption, the aggressive electric transportation scenario resulting in 147
TWh is significant.
Figure 17: Moderate Scenario: Transportation Electrification Forecast vs. Opportunity in
2035 (TWh)
4.5%
95.5%
Moderate Scenario = 33 TWh
Remaining Electrification Opportunity = 700 TWh
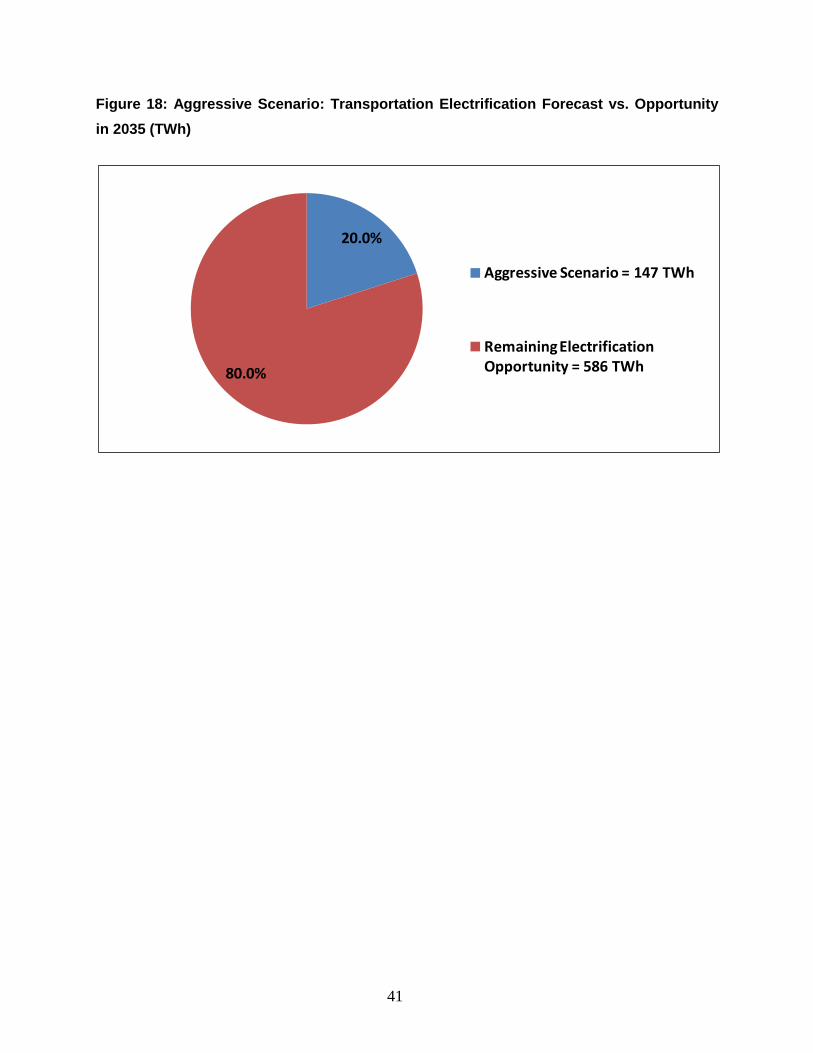
41
Figure 18: Aggressive Scenario: Transportation Electrification Forecast vs. Opportunity
in 2035 (TWh)
20.0%
80.0%
Aggressive Scenario = 147 TWh
Remaining Electrification Opportunity = 586 TWh
42
CONCLUSION
The results presented in this paper provide two scenario views of U.S. electricity consumption
through 2035 different than the AEO 2012 forecast. Combined, the three drivers—advancements
in building energy codes and appliance/equipment efficiency standards, ratepayer-funded EE
programs, and electric transportation—have a major impact on electricity consumption in the
U.S., with building energy codes and appliance/equipment standards having the largest impact
and electric transportation having the smallest impact under both scenarios.
Under the moderate scenario, today’s most efficient appliances and equipment become the
minimum standard, newly constructed buildings use 35 percent less energy, ratepayer-funded EE
programs grow at current trends, and electric vehicles make up 2 percent of the registered vehicle
stock by 2035. This scenario is very plausible.
The aggressive scenario expands on the assumptions made in the moderate scenario. By 2035,
newly constructed buildings use 60 percent less energy, electric vehicles constitute 12 percent of
the registered vehicle stock, and some appliance and equipment efficiency standards are pushed
to engineering limits. Ratepayer-funded EE programs follow the same path as in the moderate
scenario.
The effect of each factor is summarized below.
Building codes and equipment standards have the largest impact among the factors
examined, with the potential to decrease electricity consumption by 420 TWh (9.5%) in 2035
under a moderate scenario and 769 TWh (17.3%) under an aggressive scenario.
Ratepayer-funded electric energy efficiency (EE) programs, including both utility
programs and those administered by state or regional program administrators decrease
national electricity consumption. Following current trends, these programs reduce electricity
consumption by 295 TWh (6.7%) by 2035.
Electrification of the transportation sector has some impact on energy consumption in the
U.S. Growth is mainly due to the progressive use of electric light duty and commercial
vehicles in 2020 and beyond. Various policy and economic drivers as well as consumer
demand will determine the ultimate levels of electric vehicle adoption, including: advances in
battery technology, oil prices, and government mandates on fleet fuel efficiency (or CAFE)
standards. However, under both scenarios, the electricity growth is modest. It should be
noted that this analysis does not capture the electrification of non-road transportation
equipment.
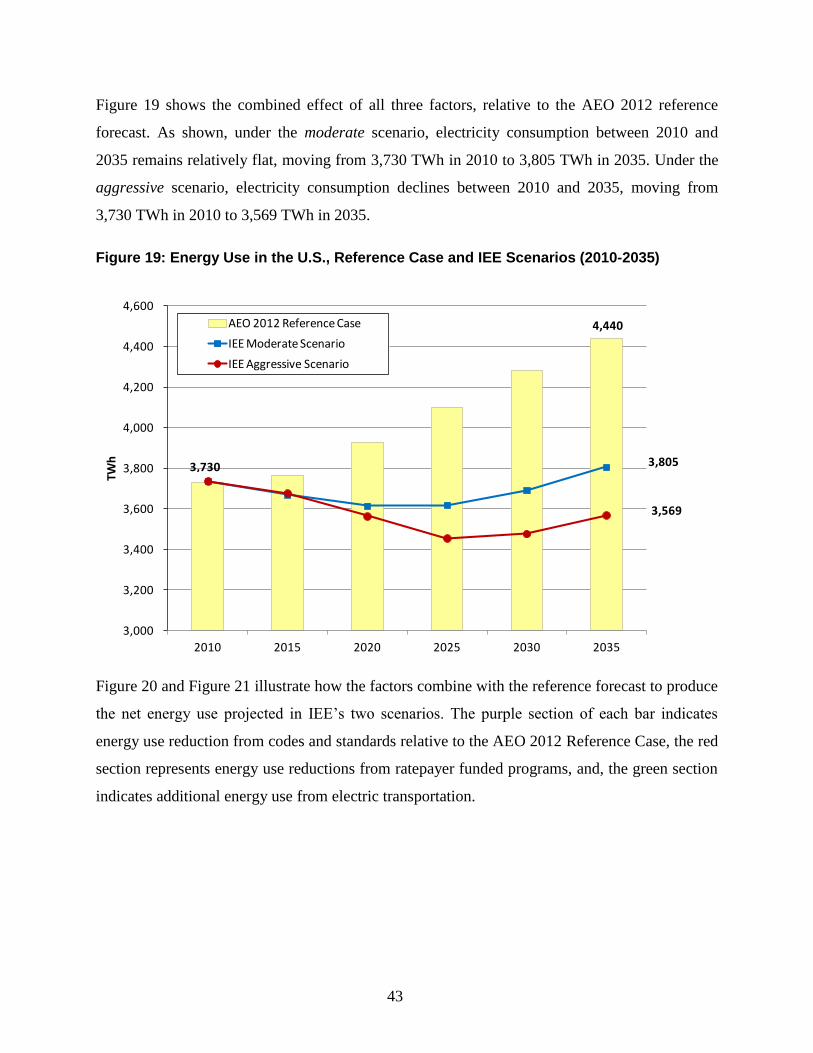
43
Figure 19 shows the combined effect of all three factors, relative to the AEO 2012 reference
forecast. As shown, under the moderate scenario, electricity consumption between 2010 and
2035 remains relatively flat, moving from 3,730 TWh in 2010 to 3,805 TWh in 2035. Under the
aggressive scenario, electricity consumption declines between 2010 and 2035, moving from
3,730 TWh in 2010 to 3,569 TWh in 2035.
Figure 19: Energy Use in the U.S., Reference Case and IEE Scenarios (2010-2035)
Figure 20 and Figure 21 illustrate how the factors combine with the reference forecast to produce
the net energy use projected in IEE’s two scenarios. The purple section of each bar indicates
energy use reduction from codes and standards relative to the AEO 2012 Reference Case, the red
section represents energy use reductions from ratepayer funded programs, and, the green section
indicates additional energy use from electric transportation.
4,440
3,805
3,569
3,000
3,200
3,400
3,600
3,800
4,000
4,200
4,400
4,600
2010 2015 2020 2025 2030 2035
TWh
AEO 2012 Reference Case
IEE Moderate Scenario
IEE Aggressive Scenario
3,730
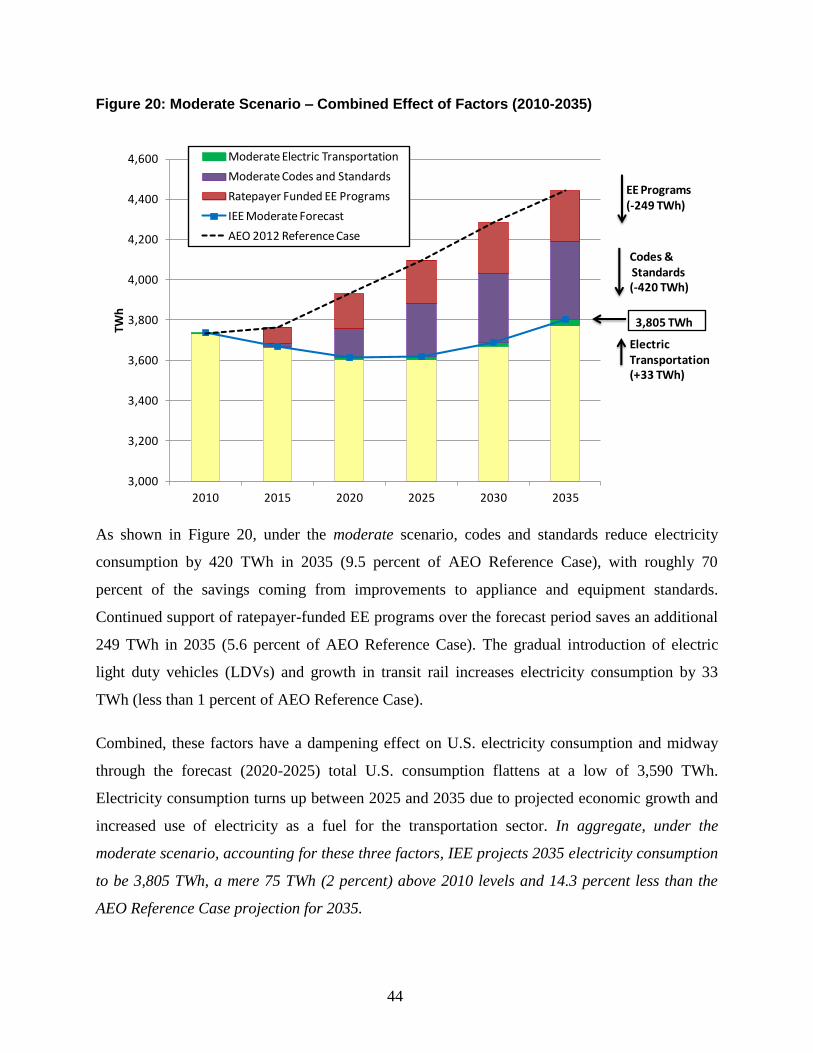
44
Figure 20: Moderate Scenario – Combined Effect of Factors (2010-2035)
As shown in Figure 20, under the moderate scenario, codes and standards reduce electricity
consumption by 420 TWh in 2035 (9.5 percent of AEO Reference Case), with roughly 70
percent of the savings coming from improvements to appliance and equipment standards.
Continued support of ratepayer-funded EE programs over the forecast period saves an additional
249 TWh in 2035 (5.6 percent of AEO Reference Case). The gradual introduction of electric
light duty vehicles (LDVs) and growth in transit rail increases electricity consumption by 33
TWh (less than 1 percent of AEO Reference Case).
Combined, these factors have a dampening effect on U.S. electricity consumption and midway
through the forecast (2020-2025) total U.S. consumption flattens at a low of 3,590 TWh.
Electricity consumption turns up between 2025 and 2035 due to projected economic growth and
increased use of electricity as a fuel for the transportation sector. In aggregate, under the
moderate scenario, accounting for these three factors, IEE projects 2035 electricity consumption
to be 3,805 TWh, a mere 75 TWh (2 percent) above 2010 levels and 14.3 percent less than the
AEO Reference Case projection for 2035.
3,000
3,200
3,400
3,600
3,800
4,000
4,200
4,400
4,600
2010 2015 2020 2025 2030 2035
TWh
Moderate Electric Transportation
Moderate Codes and Standards
Ratepayer Funded EE Programs
IEE Moderate Forecast
AEO 2012 Reference Case
EE Programs (-249 TWh)
Codes &Standards (-420 TWh)
Electric Transportation (+33 TWh)
3,805 TWh
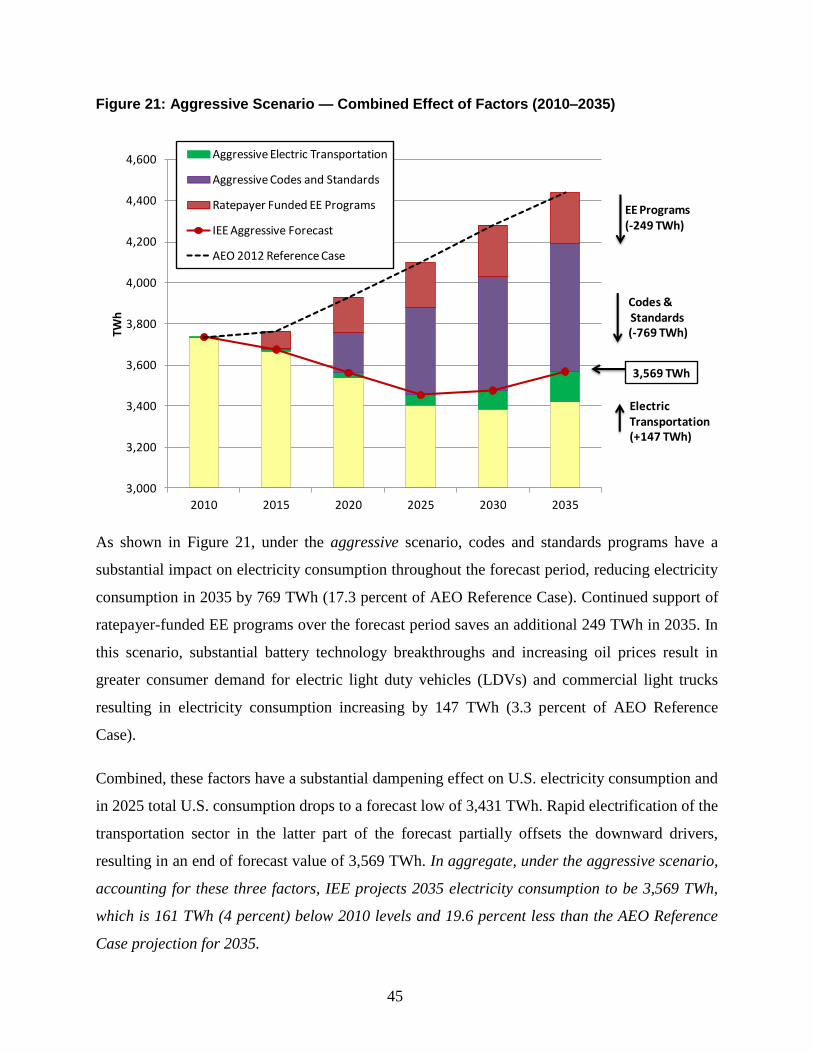
45
Figure 21: Aggressive Scenario — Combined Effect of Factors (2010–2035)
As shown in Figure 21, under the aggressive scenario, codes and standards programs have a
substantial impact on electricity consumption throughout the forecast period, reducing electricity
consumption in 2035 by 769 TWh (17.3 percent of AEO Reference Case). Continued support of
ratepayer-funded EE programs over the forecast period saves an additional 249 TWh in 2035. In
this scenario, substantial battery technology breakthroughs and increasing oil prices result in
greater consumer demand for electric light duty vehicles (LDVs) and commercial light trucks
resulting in electricity consumption increasing by 147 TWh (3.3 percent of AEO Reference
Case).
Combined, these factors have a substantial dampening effect on U.S. electricity consumption and
in 2025 total U.S. consumption drops to a forecast low of 3,431 TWh. Rapid electrification of the
transportation sector in the latter part of the forecast partially offsets the downward drivers,
resulting in an end of forecast value of 3,569 TWh. In aggregate, under the aggressive scenario,
accounting for these three factors, IEE projects 2035 electricity consumption to be 3,569 TWh,
which is 161 TWh (4 percent) below 2010 levels and 19.6 percent less than the AEO Reference
Case projection for 2035.
3,000
3,200
3,400
3,600
3,800
4,000
4,200
4,400
4,600
2010 2015 2020 2025 2030 2035
TWh
Aggressive Electric Transportation
Aggressive Codes and Standards
Ratepayer Funded EE Programs
IEE Aggressive Forecast
AEO 2012 Reference Case
EE Programs (-249 TWh)
Codes &Standards(-769 TWh)
Electric Transportation(+147 TWh)
3,569 TWh

46
A-1
APPENDIX A
COMPARISON OF AEO 2009, 2010, 2011, AND 2012
Table A-1 and Figure A-1 compare the reference forecasts for AEO 2009 (used for the original
2009 IEE White Paper) through AEO 2012 (used in this paper). Comparing the forecast energy
use in 2030, the AEO 2012 forecast is 6.4% lower than the 2009 forecast. The AEO 2012
forecast includes the following assumptions:10
Existing codes and standards as shown in Appendix B.
o Both local and federal building codes
o Appliance standards officially signed (National Appliance Energy Conservation Act
and DOE review process)
o Other energy-relevant legislation, including the Energy Improvement and Extension
Act of 2008, the Energy Independence and Security Act of 2007(EISA), and the
Energy Policy Act of 2005 (EPACT 2005)
o The assumed standards for six categories of residential white-goods appliances from
the consensus agreement reached by the American Council for an Energy-Efficient
Economy (ACEEE), the Association of Home Appliance Manufacturers (AHAM),
and the appliance manufacturers in the fall of 2010
o Appliance and equipment standards approved through 2011
International Energy Conservation Code (IECC) 2009 and the American Society of Heating,
Refrigeration, and Air Conditioning Engineers (ASHRAE) 90.1 2007 phased-in through
2018 and naturally occurring efficiency
o Technological improvements in energy-consuming equipment
o Conservation response to rising energy prices (based on usage elasticity)
o Market trends toward “green” affecting both energy purchases and usage behaviors.
Embedded demand-side management defined as future impacts of past programs and future
trends in appliance and equipment purchases in the forecast period; these impacts yield from:
o Utility information and incentive programs
10
With the exception of some technical data on unit efficiency as a function of standards (e.g., EISA 2007), all
of these factors are implicit in the National Energy Modeling System (NEMS) modeling framework, which is used to develop the AEO. In other words, they are manifested as they affect average energy usage values
that form the core of the demand-side modules within NEMS (only in the residential and commercial
sectors).

A-2
o State funding and regulatory mechanisms
o Funding for energy efficiency through the American Reinvestment and Recovery Act
(ARRA)
Table A-1: Comparison of Annual Energy Outlook Forecasts for Residential, Commercial, and Industrial Sectors (TWh)
Figure A-1: AEO 2009 and AEO 2011 Forecasts for the Residential, Commercial and Industrial Sectors
Year
AEO
2012
AEO
2011
AEO
2010
AEO
2009
Difference
2011-12
Difference
2010-12
Difference
2009-12
2010 3,743 3,684 3,610 3,730 1.6% 3.6% 0.3%
2015 3,745 3,751 3,862 3,912 -0.2% -3.1% -4.4%
2020 3,898 3,913 4,073 4,116 -0.4% -4.5% -5.6%
2025 4,077 4,074 4,262 4,335 0.1% -4.5% -6.3%
2030 4,241 4,244 4,457 4,511 -0.1% -5.1% -6.4%
2035 4,393 4,405 4,643 -
% Increase (2008-2030) 17% 20% 29%
Avg. annual growth rate 0.7% 0.8% 1.1%
2,500
3,000
3,500
4,000
4,500
5,000
2010 2012 2014 2016 2018 2020 2022 2024 2026 2028 2030 2032 2034
TWh
AEO 2012
AEO 2011
AEO 2010
AEO 2009
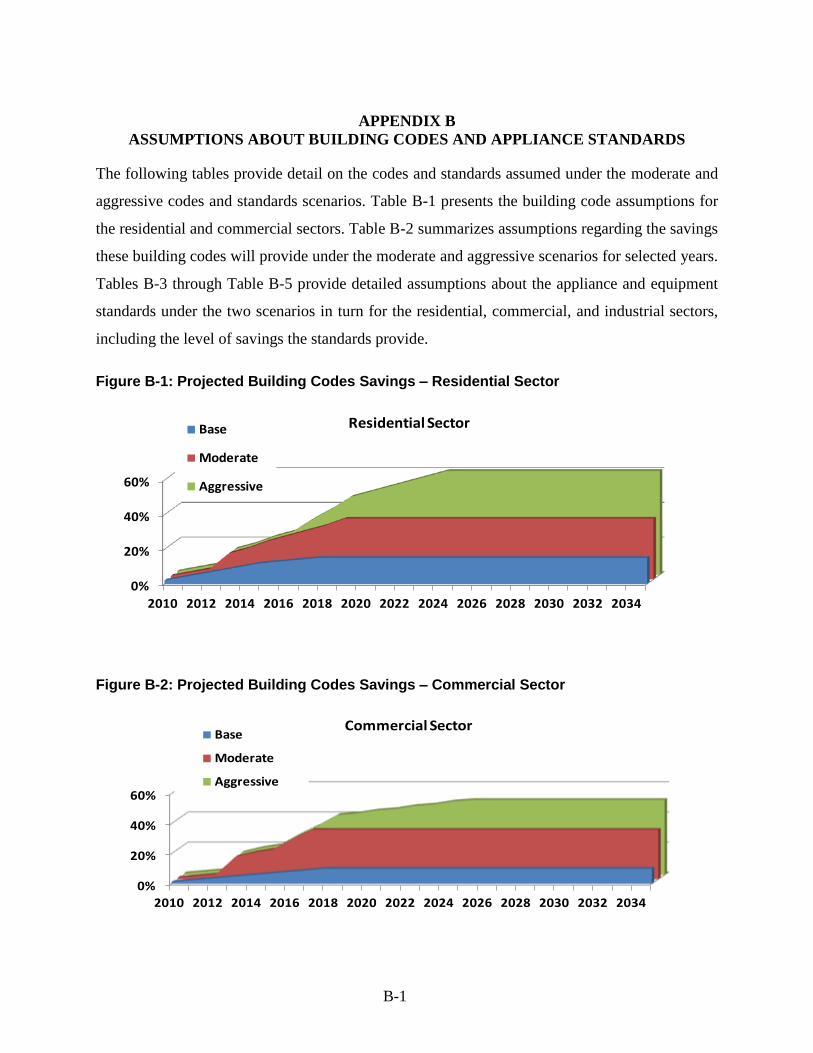
B-1
APPENDIX B
ASSUMPTIONS ABOUT BUILDING CODES AND APPLIANCE STANDARDS
The following tables provide detail on the codes and standards assumed under the moderate and
aggressive codes and standards scenarios. Table B-1 presents the building code assumptions for
the residential and commercial sectors. Table B-2 summarizes assumptions regarding the savings
these building codes will provide under the moderate and aggressive scenarios for selected years.
Tables B-3 through Table B-5 provide detailed assumptions about the appliance and equipment
standards under the two scenarios in turn for the residential, commercial, and industrial sectors,
including the level of savings the standards provide.
Figure B-1: Projected Building Codes Savings – Residential Sector
Figure B-2: Projected Building Codes Savings – Commercial Sector
0%
20%
40%
60%
2010 2012 2014 2016 2018 2020 2022 2024 2026 2028 2030 2032 2034
Residential SectorBase
Moderate
Aggressive
0%
20%
40%
60%
2010 2012 2014 2016 2018 2020 2022 2024 2026 2028 2030 2032 2034
Commercial SectorBase
Moderate
Aggressive

B-2
Table B-1: Building Code Assumptions
Base level 2nd Standard (relative to Base)
1st Standard (relative to Base) 3rd Standard (relative to Base)
Residential 201
0
201
1
201
2
201
3
201
4
201
5
201
6
201
7
201
8
201
9
202
0
202
1
202
2
202
3
202
4
202
5
202
6
202
7
202
8
202
9
203
0
203
1
203
2
203
3
203
4
203
5
IECC 2006/IECC 2009
(15% phased-in)IECC 2009 (15% savings)Base Case
Moderate
Case
Aggressive
CaseIECC 2006
IECC 2009
(15%)
IECC 2012
(25%)IECC 2015 (45%) 60% Savings
IECC 2006/IECC 2009
(15% phased-in)IECC 2009 (15% savings)
IECC 2006IECC 2009
(15%)
IECC 2012
(25%)IECC 2015 (35%)
Commercial
201
0
201
1
201
2
201
3
201
4
201
5
201
6
201
7
201
8
201
9
202
0
202
1
202
2
202
3
202
4
202
5
202
6
202
7
202
8
202
9
203
0
203
1
203
2
203
3
203
4
203
5
2004 ASHRAE 90.1 /
2007 ASHRAE 90.1 (10% phased-
in)
2007 ASHRAE 90.1 (10%)Base Case
Moderate
Case
Aggressive
Case
2004
ASHRAE
90.1
2007
ASHRAE
(15%)
2010
ASHRAE
90.1 (25%)
2013 ASHRAE 90.1 (33%)
2004
ASHRAE
90.1
2007
ASHRAE
(15%)
2010
ASHRAE
90.1 (20%)
2013 ASHRAE 90.1 (40%) 50% Savings
2004 ASHRAE 90.1 /
2007 ASHRAE 90.1 (10% phased-
in)
2007 ASHRAE 90.1 (10%)
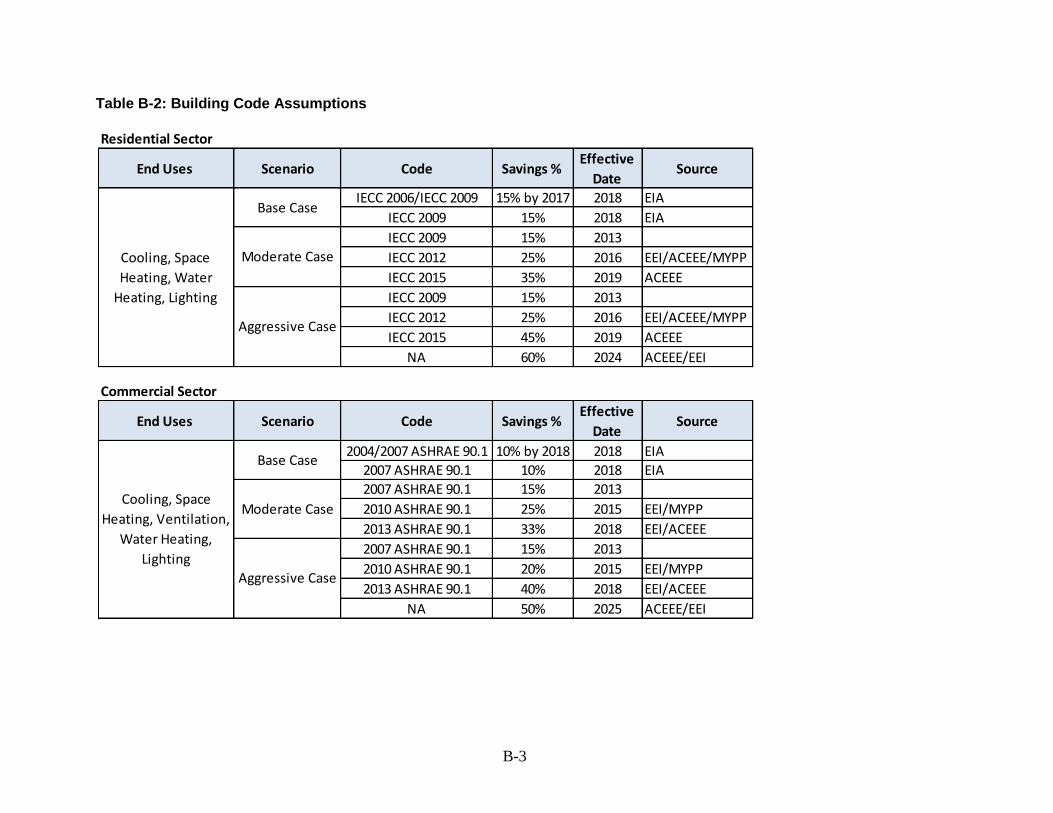
B-3
Table B-2: Building Code Assumptions
Residential Sector
End Uses Scenario Code Savings % Effective
DateSource
IECC 2006/IECC 2009 15% by 2017 2018 EIA
IECC 2009 15% 2018 EIA
IECC 2009 15% 2013
IECC 2012 25% 2016 EEI/ACEEE/MYPP
IECC 2015 35% 2019 ACEEE
IECC 2009 15% 2013
IECC 2012 25% 2016 EEI/ACEEE/MYPP
IECC 2015 45% 2019 ACEEE
NA 60% 2024 ACEEE/EEI
Commercial Sector
End Uses Scenario Code Savings % Effective
DateSource
2004/2007 ASHRAE 90.1 10% by 2018 2018 EIA
2007 ASHRAE 90.1 10% 2018 EIA
2007 ASHRAE 90.1 15% 2013
2010 ASHRAE 90.1 25% 2015 EEI/MYPP
2013 ASHRAE 90.1 33% 2018 EEI/ACEEE
2007 ASHRAE 90.1 15% 2013
2010 ASHRAE 90.1 20% 2015 EEI/MYPP
2013 ASHRAE 90.1 40% 2018 EEI/ACEEE
NA 50% 2025 ACEEE/EEI
Cooling, Space
Heating, Ventilation,
Water Heating,
Lighting
Base Case
Moderate Case
Aggressive Case
Cooling, Space
Heating, Water
Heating, Lighting
Base Case
Moderate Case
Aggressive Case
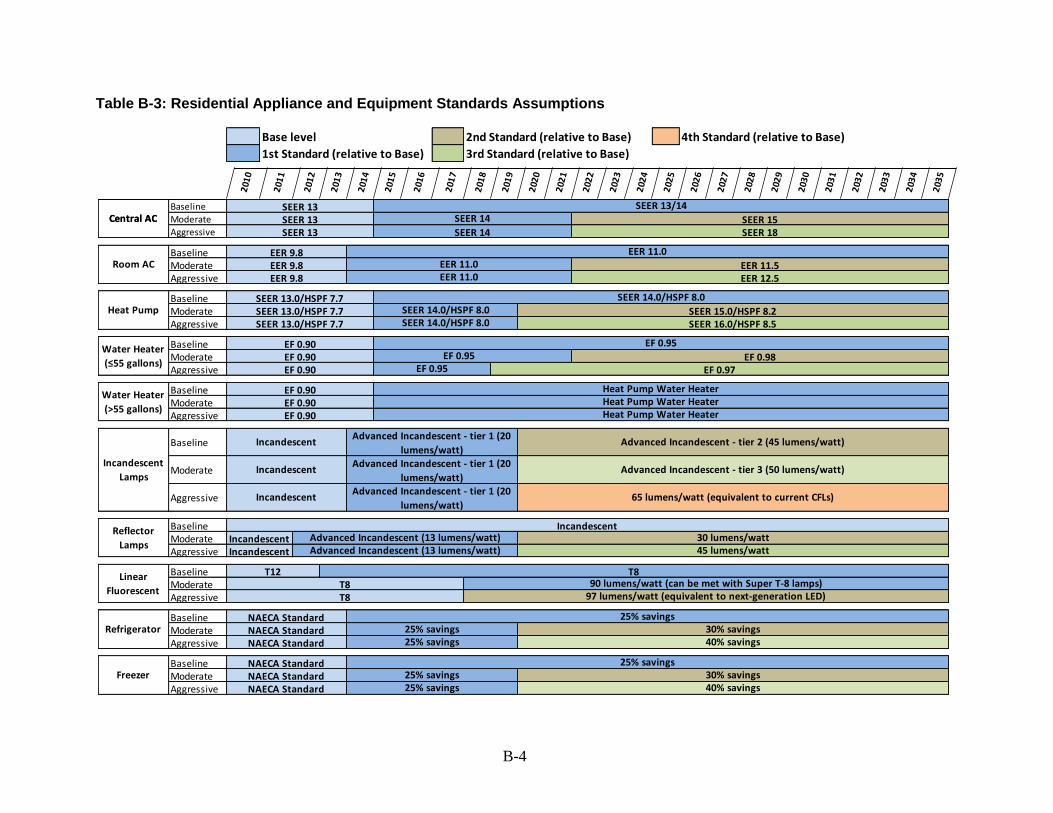
B-4
Table B-3: Residential Appliance and Equipment Standards Assumptions
Base level 2nd Standard (relative to Base) 4th Standard (relative to Base)
1st Standard (relative to Base) 3rd Standard (relative to Base)
201
0
201
1
201
2
201
3
201
4
201
5
201
6
201
7
201
8
201
9
202
0
202
1
202
2
202
3
202
4
202
5
202
6
202
7
202
8
202
9
203
0
203
1
203
2
203
3
203
4
203
5
Central ACSEER 13 SEER 13/14Baseline
Moderate
Aggressive
BaselineModerateAggressive
BaselineModerateAggressive
BaselineModerateAggressive
BaselineModerateAggressive
Baseline
Moderate
Aggressive
BaselineModerateAggressive
BaselineModerateAggressive
BaselineModerateAggressive
BaselineModerateAggressive
Central ACSEER 13 SEER 13/14
SEER 13 SEER 14 SEER 15SEER 13 SEER 14 SEER 18
Room ACEER 9.8 EER 11.0
EER 9.8 EER 11.0 EER 11.5EER 9.8 EER 11.0 EER 12.5
Heat PumpSEER 13.0/HSPF 7.7 SEER 14.0/HSPF 8.0
SEER 13.0/HSPF 7.7 SEER 14.0/HSPF 8.0 SEER 15.0/HSPF 8.2SEER 13.0/HSPF 7.7 SEER 14.0/HSPF 8.0 SEER 16.0/HSPF 8.5
Water Heater
(>55 gallons)
EF 0.90 Heat Pump Water Heater
EF 0.90 Heat Pump Water Heater
EF 0.90 Heat Pump Water Heater
Water Heater
(≤55 gallons)
EF 0.90 EF 0.95
EF 0.90 EF 0.95 EF 0.98EF 0.90 EF 0.95 EF 0.97
Incandescent
Lamps
IncandescentAdvanced Incandescent - tier 1 (20
lumens/watt)Advanced Incandescent - tier 2 (45 lumens/watt)
IncandescentAdvanced Incandescent - tier 1 (20
lumens/watt)Advanced Incandescent - tier 3 (50 lumens/watt)
IncandescentAdvanced Incandescent - tier 1 (20
lumens/watt)65 lumens/watt (equivalent to current CFLs)
Linear
Fluorescent
T12 T8 T8 90 lumens/watt (can be met with Super T-8 lamps)
T8 97 lumens/watt (equivalent to next-generation LED)
Reflector
Lamps
IncandescentIncandescent Advanced Incandescent (13 lumens/watt) 30 lumens/watt
Incandescent Advanced Incandescent (13 lumens/watt) 45 lumens/watt
RefrigeratorNAECA Standard 25% savings
NAECA Standard 25% savings 30% savings
NAECA Standard 25% savings 40% savings
FreezerNAECA Standard 25% savings
NAECA Standard 25% savings 30% savings
NAECA Standard 25% savings 40% savings
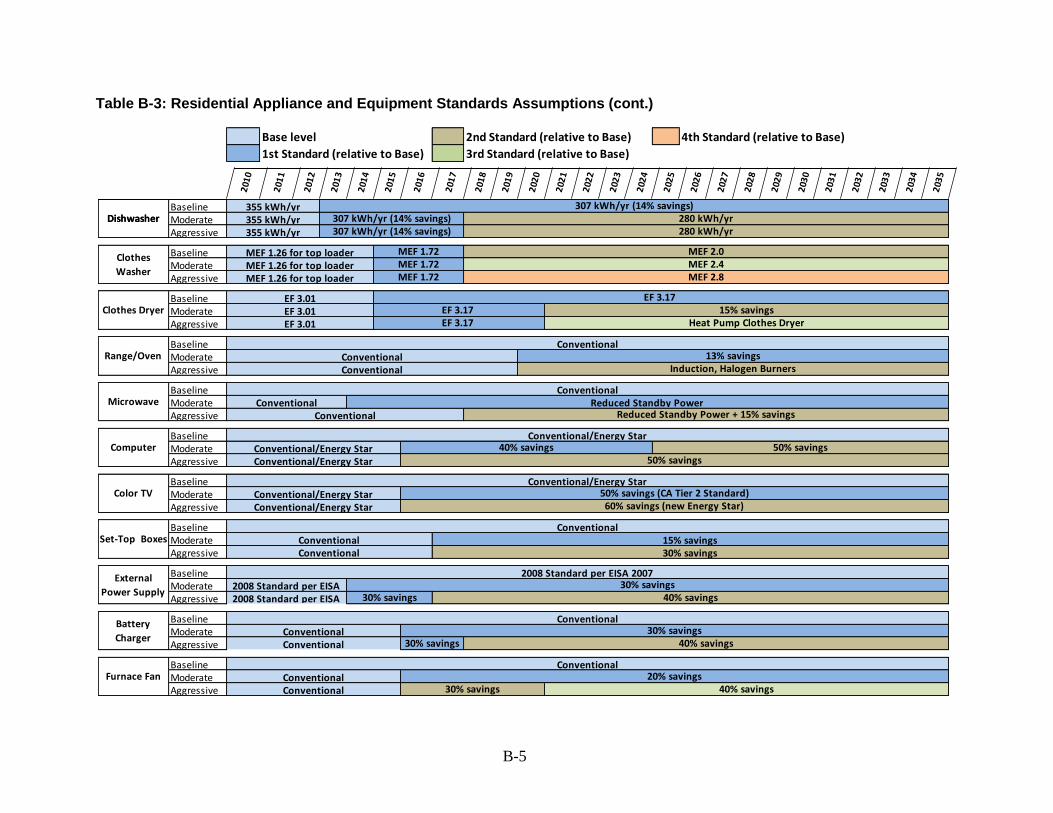
B-5
Table B-3: Residential Appliance and Equipment Standards Assumptions (cont.)
Base level 2nd Standard (relative to Base) 4th Standard (relative to Base)
1st Standard (relative to Base) 3rd Standard (relative to Base)
201
0
201
1
201
2
201
3
201
4
201
5
201
6
201
7
201
8
201
9
202
0
202
1
202
2
202
3
202
4
202
5
202
6
202
7
202
8
202
9
203
0
203
1
203
2
203
3
203
4
203
5
Dishwasher355 kWh/yr 307 kWh/yr (14% savings)Baseline
ModerateAggressive
BaselineModerateAggressive
BaselineModerateAggressive
BaselineModerateAggressive
BaselineModerateAggressive
BaselineModerateAggressive
BaselineModerateAggressive
BaselineModerateAggressive
BaselineModerateAggressive
BaselineModerateAggressive
BaselineModerateAggressive
Dishwasher355 kWh/yr 307 kWh/yr (14% savings)
355 kWh/yr 307 kWh/yr (14% savings) 280 kWh/yr
355 kWh/yr 307 kWh/yr (14% savings) 280 kWh/yr
Clothes
Washer
MEF 1.26 for top loader MEF 1.72 MEF 2.0
MEF 1.26 for top loader MEF 1.72 MEF 2.4
MEF 1.26 for top loader MEF 1.72 MEF 2.8
Clothes DryerEF 3.01 EF 3.17
EF 3.01 EF 3.17 15% savings
EF 3.01 EF 3.17 Heat Pump Clothes Dryer
MicrowaveConventional
Conventional Reduced Standby PowerConventional Reduced Standby Power + 15% savings
Range/OvenConventional
Conventional 13% savings
Conventional Induction, Halogen Burners
Color TVConventional/Energy Star
Conventional/Energy Star 50% savings (CA Tier 2 Standard)
Conventional/Energy Star 60% savings (new Energy Star)
ComputerConventional/Energy Star
Conventional/Energy Star 40% savings 50% savings
Conventional/Energy Star 50% savings
External
Power Supply
2008 Standard per EISA 20072008 Standard per EISA 30% savings
2008 Standard per EISA 30% savings 40% savings
Set-Top BoxesConventional
Conventional 15% savingsConventional 30% savings
Furnace FanConventional
Conventional 20% savings
Conventional 30% savings 40% savings
Battery
Charger
ConventionalConventional 30% savings
Conventional 30% savings 40% savings
B-6
Table B-4: Commercial Appliance and Equipment Standards Assumptions
Base level 2nd Standard (relative to Base) 4th Standard (relative to Base)
1st Standard (relative to Base) 3rd Standard (relative to Base)
201
0
201
1
201
2
201
3
201
4
201
5
201
6
201
7
201
8
201
9
202
0
202
1
202
2
202
3
202
4
202
5
202
6
202
7
202
8
202
9
203
0
203
1
203
2
203
3
203
4
203
5
Packaged
Terminal
AC/HP
EPACT EER 11.0/11.2Baseline
Moderate
Aggressive
BaselineModerateAggressive
BaselineModerateAggressive
BaselineModerateAggressive
Baseline
Moderate
Aggressive
BaselineModerateAggressive
BaselineModerateAggressive
BaselineModerateAggressive
BaselineModerateAggressive
Packaged
Terminal
AC/HP
EPACT EER 11.0/11.2
EPACT EER 11.0/11.2 EER 11.8
EPACT EER 11.0/11.2 EER 12.5
Heat PumpEER 11.0/COP 3.3
EER 11.0/COP 3.3 EER 11.5/COP 3.4EER 11.0/COP 3.3 EER 13.0/COP 3.6
Roof Top
Units
EER 11.0/11.2EER 11.0/11.2 EER 11.8EER 11.0/11.2 EER 12.5
Air Handling
System
Constant Air Volume/Variable Air VolumeConstant Air Volume/Variable Air Volume
Constant Air Volume/Variable Air Volume Variable Air Volume
Incandescent
Lamps
IncandescentAdvanced Incandescent - tier 1
(20 lumens/watt)Advanced Incandescent - tier 2 (45 lumens/watt)
IncandescentAdvanced Incandescent - tier 1
(20 lumens/watt)Advanced Incandescent - tier 3 (50 lumens/watt)
IncandescentAdvanced Incandescent - tier 1
(20 lumens/watt)65 lumens/watt (equivalent to current CFLs)
Reflector
Lamps
Halogen (14.6 lumens/watt)Halogen Advanced Halogen (18 lumens/watt) 45 lumens/watt
High Intensity
Discharge
88 lumens/watt88 lumens/watt 95 lumens/watt
75 lumens/watt 95 lumens/watt 196 lumens/watt
Halogen Advanced Halogen (18 lumens/watt) 67 lumens/watt
Linear
Fluorescent
T12 T8 T8 65 lumens/watt (can be met using Super T-8 lamps)T8 97 lumens/watt (next generation of LED lamps)
ComputerConventional/Energy Star
Conventional/Energy Star 40% savings 50% savingsConventional/Energy Star 50% savings
B-7
Table B-4: Commercial Appliance and Equipment Standards Assumptions (cont.)
Base level 2nd Standard (relative to Base) 4th Standard (relative to Base)
1st Standard (relative to Base) 3rd Standard (relative to Base)
201
0
201
1
201
2
201
3
201
4
201
5
201
6
201
7
201
8
201
9
202
0
202
1
202
2
202
3
202
4
202
5
202
6
202
7
202
8
202
9
203
0
203
1
203
2
203
3
203
4
203
5
ServerConventionalBaseline
ModerateAggressive
BaselineModerateAggressive
BaselineModerateAggressive
Baseline
Moderate
Aggressive
BaselineModerateAggressive
Baseline
Moderate
Aggressive
BaselineModerateAggressive
BaselineModerateAggressive
BaselineModerateAggressive
BaselineModerateAggressive
Baseline
Moderate
Aggressive
ServerConventional
Conventional Energy Star Conventional Energy Star + 15% savings
MonitorConventionalConventional
Conventional Energy Star
Printer/CopierConventionalConventional
Conventional Energy Star
Reach-in
Refrigeration
EPACT 2005 StandardEPACT 2005 Standard 15% savingsEPACT 2005 Standard 15% savings 20% savings
Walk-in
Refrigerator /
Freezer
EISA 2007 Standard
EISA 2007 Standard 5% savings
EISA 2007 Standard 15% savings 20% savings
Vending
Machines
EPACT 50% savingsEPACT 50% savingsEPACT 50% savings 55% savings
Supermarket
and Other
Refrigeration
EPACT 25% savings
EPACT 25% savings 30% savings
EPACT 25% savings 40% savings
Low-V
Transformers
NEMA 2007 StandardNEMA 2007 Standard 98.4% EfficiencyNEMA 2007 Standard 98.4% Efficiency 98.6% Efficiency
Icemaker2010 Standard
2010 Standard 15% savings2010 Standard 15% savings 25% savings
Commerial
Laundry
(Washers)
MEF 1.26 MEF 1.6
MEF 1.26 MEF 1.6
MEF 1.26 MEF 1.6 MEF 2.4
Small Motors62.3% Efficiency 70% Efficiency62.3% Efficiency 70% Efficiency 80% Efficiency62.3% Efficiency 70% Efficiency 80% Efficiency
B-8
Table B-5: Industrial Appliance and Equipment Standards Assumptions
Base level 2nd Standard (relative to Base) 4th Standard (relative to Base)
1st Standard (relative to Base) 3rd Standard (relative to Base)
201
0
201
1
201
2
201
3
201
4
201
5
201
6
201
7
201
8
201
9
202
0
202
1
202
2
202
3
202
4
202
5
202
6
202
7
202
8
202
9
203
0
203
1
203
2
203
3
203
4
203
5
MotorsEISA 2007 StandardsBaseline
ModerateAggressive
Baseline
Moderate
Aggressive
BaselineModerateAggressive
BaselineModerateAggressive
BaselineModerateAggressive
Baseline
Moderate
Aggressive
BaselineModerateAggressive
BaselineModerateAggressive
Baseline
Moderate
Aggressive
MotorsEISA 2007 Standards
EISA 2007 Standards Premium EfficiencyEISA 2007 Standards Premium Super Premium Efficiency
Packaged
Terminal
AC/HP
EPACT EER 11.0/11.2
EPACT EER 11.0/11.2 EER 11.8
EPACT EER 11.0/11.2 EER 12.5
Roof Top UnitsEER 11.0/11.2
EER 11.0/11.2 EER 11.8EER 11.0/11.2 EER 12.5
Heat PumpEER 11.0/COP 3.3
EER 11.0/COP 3.3 EER 11.5/COP 3.4EER 11.0/COP 3.3 EER 13.0/COP 3.6
Incandescent
Lamps
IncandescentAdvanced Incandescent - tier 1
(20 lumens/watt)Advanced Incandescent - tier 2 (45 lumens/watt)
Incandescent
Air Handling
System
Constant Air Volume/Variable Air VolumeConstant Air Volume/Variable Air Volume
Constant Air Volume/Variable Air Volume Variable Air Volume
Advanced Incandescent - tier 1
(20 lumens/watt)Advanced Incandescent - tier 3 (50 lumens/watt)
IncandescentAdvanced Incandescent - tier 1
(20 lumens/watt)65 lumens/watt (equivalent to current CFLs)
T8 97 lumens/watt (next generation of LED lamps)
High Intensity
Discharge
88 lumens/watt88 lumens/watt 95 lumens/watt
75 lumens/watt 95 lumens/watt 196 lumens/watt
Linear
Fluorescent
T12 T8 T8 65 lumens/watt (can be met using Super T-8 lamps)
Low-V &
Medium
Transformers
NEMA 2007 Standard
NEMA 2007 Standard 98.4% Efficiency
NEMA 2007 Standard 98.4% Efficiency 98.6% Efficiency
C-1
APPENDIX C
OVERVIEW OF MODELING APPROACH
To perform this analysis, the Load Management Analysis and Planning tool (LoadMAPTM
),
developed by Global Energy Partners, was utilized. LoadMAP was developed in 2007 and has
been used for numerous studies of energy efficiency and demand response potential for utilities,
state agencies, and other organizations. It has the following key features:
Embodies the basic principles of rigorous end-use models (such as EPRI’s REEPS and
COMMEND) but in a more simplified, accessible form.
Includes stock-accounting algorithms that treat older, less efficient appliance/equipment
stock separately from newer, more efficient equipment. Equipment is replaced according to
the measure life defined by the user.
Isolates new construction from existing equipment and buildings and treats purchase
decisions for new construction, replacement upon failure, early replacement, and non-owner
acquisition separately.
Uses a simple logic for appliance and equipment decisions. Some models embody decision
models based on efficiency choice algorithms or diffusion models. While these have some
merit, the model parameters are difficult to estimate or observe and sometimes produce
anomalous results that require calibration or even overriding. LoadMAP allows the user to
drive the appliance and equipment choices year by year directly in the model, which allows
us to easily align with the AEO forecasts.
Includes appliance and equipment models customized by end use. For example, the logic for
lighting equipment is distinct from refrigerators and freezers.
Accommodates various levels of segmentation. Analysis can be performed at the sector level
(e.g., total residential) or for customized segments within sectors (e.g., housing type or
income level).
For this analysis, model inputs consistent with the AEO 2012 forecast were developed and the
forecast results were calibrated to AEO 2012 forecast results. To assess the two codes and
standards scenarios, model inputs were modified according to the details provided in Appendix
B. Additional details are available from EnerNOC upon request.

D-1
APPENDIX D
RATEPAYER-FUNDED EE PROGRAM ANNUAL IMPACTS
Table D-1: Annual Impacts of Ratepayer-funded EE Programs
Year
Total Spending
($ Millions)
Lifetime Cost
per kWh ($)
Ratepayer-
Funded
Programs -
Cumulative
Savings (TWh)
% of National
Ratepayer-
Funded
Savings from
C&S programs
Overlapping
Savings:
Ratepayer
funded C&S
programs
(TWh)
Ratepayer-
Funded Programs:
Excludes C&S
Program Efforts
(TWh)
2012 $6,689 $0.034 20 3.9% 1 19
2013 $7,437 $0.035 41 4.6% 2 39
2014 $8,185 $0.036 63 5.4% 3 60
2015 $8,932 $0.038 87 6.1% 5 82
2016 $9,680 $0.039 112 6.8% 8 104
2017 $10,427 $0.041 137 7.6% 10 127
2018 $11,175 $0.043 163 8.3% 14 150
2019 $11,922 $0.044 190 9.0% 17 173
2020 $12,400 $0.046 217 9.8% 21 196
2021 $13,418 $0.048 245 10.2% 25 220
2022 $14,165 $0.050 254 10.6% 27 227
2023 $14,913 $0.052 262 11.0% 29 233
2024 $15,660 $0.054 268 11.4% 31 238
2025 $16,408 $0.056 274 11.8% 32 242
2026 $17,156 $0.058 279 12.2% 34 245
2027 $17,903 $0.060 283 12.6% 36 248
2028 $18,651 $0.063 287 13.0% 37 250
2029 $19,398 $0.065 290 13.4% 39 251
2030 $20,146 $0.068 293 13.8% 40 252
2031 $20,893 $0.070 294 14.2% 42 252
2032 $21,641 $0.073 295 14.6% 43 252
2033 $22,389 $0.076 296 15.0% 44 251
2034 $23,136 $0.079 296 15.4% 46 250
2035 $23,884 $0.082 295 15.8% 47 249

E-1
APPENDIX E
TRANSPORTATION SECTOR ANALYSIS APPROACH
Table E-1 Transportation Electrification Modeling Strategy
Vehicle Type
AEO 2012
Reference Moderate Scenario Aggressive Scenario
Light-Duty VehicleLDV Penetration
Data
LDV data from
Reference Case of AEO
2012 (13.1 TWh in 2035)
LDV data from High Tech Battery
+ High Oil (combination of two
cases from AEO 2012) (87.8 TWh
in 2035)
Commercial Light Trucks No electrification
Electrified Stock% = 0.50
x LDV's Electrified
Stock%
Electrified Stock% = 0.50 x LDV's
Electrified Stock%
Transit Bus No electrification
Electrified Stock% = 0.50
x LDV's Electrified
Stock%
Electrified Stock% = 0.50 x LDV's
Electrified Stock%
School Bus No electrification
Electrified Stock% = 0.50
x LDV's Electrified
Stock%
Electrified Stock% = 0.50 x LDV's
Electrified Stock%
Military Use No electrification
Electrified Stock% = 0.10
x LDV's Electrified
Stock%
(Ground vehicles only)
Electrified Stock% = 0.10 x LDV's
Electrified Stock% (Ground
vehicles only)
Freight Trucks No electrification20% auxiliary power
electrification
50% penetration of auxiliary
power electrification
Air Transportation No electrification20% auxiliary power
electrification
50% penetration of auxiliary
power electrification
Domestic Shipping No electrification20% auxiliary power
electrification
50% penetration of auxiliary
power electrification
International Shipping No electrification20% auxiliary power
electrification
50% penetration of auxiliary
power electrification

F-1
APPENDIX F
REFERENCES
AHAM, “Today’s Energy Standards for Refrigerators Reflect Consensus by Advocates, Industry
to Increase Appliance Efficiency,” September 27, 2010 press release,
<http://www.aham.org/ht/a/GetDocumentAction/i/50432>.
American Council for an Energy-Efficient Economy (ACEEE). “HR. 2454 Addresses Climate
Change Through a Wide Variety of Energy Efficiency Measures.” 1 June 2009.
<http://www.aceee.org/energy/national/HR2454_Estimate06-01.pdf>.
American Council for an Energy-Efficient Economy, “Ka-BOOM! The Power of Appliance
Standards, Opportunities for New Federal and Appliance and Equipment Standards”, July
2009
Appliance Standards Awareness Project: http://www.standardsasap.org/
Electrification Coalition, “Electrification Roadmap: Revolutionizing Transportation and
Achieving Energy Security”, November 2009
Energy Independence and Security Act of 2007. Pub. L. 110-140. 19 December 2007. Stat.
121.1492.
Energy Information Administration, “Annual Energy Outlook 2012”, June 2012,
http://www.eia.doe.gov/forecasts/aeo/
Energy Information Administration, “EIA Technology Forecast Updates – Residential and
Commercial Building Technologies – Reference Case, Second Edition (Revised)”, Navigant
Consulting, September 2007
Energy Information Administration, “EIA Technology Forecast Updates – Residential and
Commercial Building Technologies – Reference Case”, Navigant Consulting, September
2008
Institute for Electric Efficiency, “Assessment of Electricity Savings in the U.S. Achievable
through New Appliance/Equipment Efficiency Standards and Building Efficiency Codes
(2010-2020)”, December 2009.
Institute for Electric Efficiency, “Integrating Codes and Standards Into Electric Utility Energy
Efficiency Portfolios”, August 2011.
Institute for Electric Efficiency, “Summary of Ratepayer-Funded Electric Efficiency Impacts,
Budgets and Expenditures (2010-2011)”, January 2012.
U.S. Department of Energy’s Appliances and Commercial Equipment Standards Program:
http://www1.eere.energy.gov/buildings/appliance_standards/index.html
F-2
U.S. Department of Energy, “Multi Year Program Plan – Building Regulatory Programs -
Energy Efficiency and Renewable Energy, Building Technologies Program”, October 2010

About IEEIEE is an Institute of The Edison Foundation focused on advancing the adoption of innovative and efficient technologies among electric utilities and their technology partners that will transform the power grid. IEE promotes the sharing of information, ideas, and experiences among regulators, policymakers, technology companies, thought lead-ers, and the electric power industry. IEE also identifies policies that support the business case for adoption of cost-effective technologies. IEE’s members are committed to an affordable, reliable, secure, and clean energy future.
IEE is goverened by a Management Committee of 23 electric industry Chief Executive Officers. IEE members are the investor-owned utilties who represent about 70% of the U.S. electric power industry. IEE has a permanent Advisory Committee of leaders from the regulatory com-munity, federal and state governement agencies, and other informed stakeholders. IEE has a Strategy Committee of senior electric industry executives and 33 smart grid techology company partners. Visit us at: www.edisonfoundation.net/IEE
For more information contact:Adam Cooper Research Manager IEE 701 Pennsylvania Avenue, N.W. Washington, D.C. 20004-2696 202.508.5551 [email protected]