factors affecting initial cyclosporine a level and its correlation with clinical outcome inacute...
TRANSCRIPT
FACTORS AFFECTING INITIAL CYCLOSPORINE
A LEVEL AND ITS CORRELATION WITH
CLINICAL OUTCOME IN
ACUTE LEUKEMIA PATIENTS UNDERGOING
ALLOGENEIC STEM CELL TRANSPLANTATION
Alok Gupta 1, Sachin Punatar 1, Jayant Gawande 1, BhausahebBagal 1, Libin Mathew 1, Sadhana Kannan 2, Navin Khattry 1
1 Medical Oncology, Bone Marrow Transplant Unit, ACTREC, Tata Memorial Centre, 2Biostatistics, ACTREC, Tata Memorial Centre,
Mumbai, India

Introduction
• Trough Cyclosporine A (CsA) blood level is known to influence
incidence of Graft versus Host Disease (GVHD) and relapse in acute
leukemia patients undergoing allogeneic stem cell
transplantation(ASCT).
• Higher CsA levels decrease incidence and severity of GVHD but may
increase risk of relapse while lower levels is a risk factor for severe
GVHD.
• Tailoring CsA dose based on regular trough level monitoring is required
to maintain a balance between the risk of GVHD and risk of relapse.

• Few studies have suggested that trough CsA levels during the first
few weeks post transplant had more relevance to outcome
compared to levels during later period.
• Also, despite being in use for more than 30 years, factors affecting
initial CsA levels (CSA-1) are not well established.
• Therefore this study attempts to evaluate whether such a correlation
between CSA-1 & post transplant outcomes exists and to explore
potential factors affecting CSA-1.
Introduction
Aim
To determine factors that may affect initial trough CsA level (CSA-1)
& the impact of CSA-1 on acute and chronic GVHD, relapse and
overall survival in acute leukemia patients undergoing ASCT.
Objectives
• Primary: To determine factors associated with higher or lower CSA-1
• Secondary: To determine & compare the following parameters in
patients with high, low or normal CSA-1
Incidence of acute & chronic GVHD
Severity of acute GVHD
Transplant related mortality (TRM)
Incidence of relapse
Relapse Free Survival (RFS)
Overall Survival (OS)
Study Design
• Retrospective study
• Study Period: January 2008 to March 2013
• Study centre: Bone Marrow Transplant Unit, ACTREC, Tata Memorial
Centre, Mumbai, India
• Study population: All patients who underwent ASCT for acute
leukemia.

Methods
• GVHD prophylaxis
CsA and Methotrexate (MTX) or CsA and Mycophenolate Mofetil
(MMF) was used.
CsA and MMF was started on day -1 of transplant at 3 mg/kg/day
and 600 mg/m2 /twice daily respectively. MTX was given at 15
mg/m2 on day+1 and 10 mg/m2 on day+3, +6, +11.
CSA-1 was measured on day 4 or day 5 of starting CsA.
Dose of CsA was modified depending on CSA-1 to achieve
therapeutic level of 150-200 ng/ml subsequently.
• Patients were divided into three groups based on initial modification
of CsA dose –
Group A (CsA dose escalated)
Group B (CsA dose de-escalated)
Group C (CsA same dose continued)

Methods
• Comparisons were done between 3 groups for discrete variables
which may affect CSA-1 was done by chi-square test while continuous
variables were compared by Kruskal-Wallis Test.
• Multivariate analysis was carried out using logistic regression to
determine factors predicting high or low CSA-1 between Group A and
B. The factors were split into 2 separate models due to small sample
size. Model 1 included patient related factors and model 2 included
transplant conditioning regimen related factors.
• Comparisons were done between 3 groups for transplant outcomes
including incidence of acute and chronic GVHD, incidence of relapse,
TRM, RFS and OS. Survival outcomes were compared by Kaplan-
Meier method.

Results

ALL- HR- High Risk (TLC > 100 x 109 /L at baseline or poor risk cytogenetics or not achieving CR after induction or persistent disease at transplant or > CR-2 ), SR-
Standard Risk (according to cytogenetics)
AML- PR- Poor Risk (TLC > 100 x 109 /L at baseline or poor cytogenetics or not achieving CR after induction or persistent disease at transplant or > CR-2) , IR-
Intermediate Risk (according to cytogenetics), GR- Good Risk (according to cytogenetics)
NK- Not Known
M68%
F32%
Gender
ALL30%
AML67%
Biphenotypic
Leukemia3%
Diagnosis
Biphenotypic Leukemia (3%)
CR155%CR2
26%
19%
Disease status at transplant
Relapse/Refractory
Baseline Characteristics (n = 77)P
erc
en
t
GR
IR
PR
0
20
40
60
80
100
ALL AML
4 10
74
40
22
8
42 NK
HR
SR
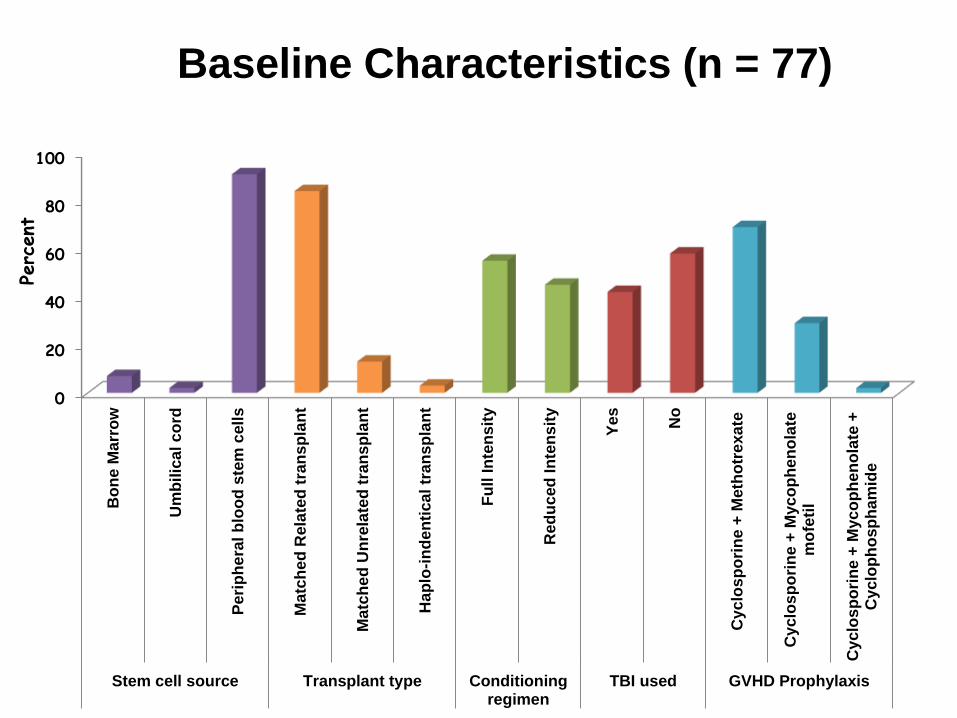
Baseline Characteristics (n = 77)
0
20
40
60
80
100
Bo
ne
Ma
rro
w
Um
bilic
al c
ord
Peri
ph
era
l b
loo
d s
tem
cell
s
Ma
tch
ed
Rela
ted
tra
ns
pla
nt
Ma
tch
ed
Un
rela
ted
tra
ns
pla
nt
Hap
lo-i
nd
en
tica
l tr
an
sp
lan
t
Fu
ll In
ten
sit
y
Red
uc
ed
In
ten
sit
y
Yes
No
Cyclo
sp
ori
ne
+ M
eth
otr
exa
te
Cyclo
sp
ori
ne
+ M
yc
op
hen
ola
tem
ofe
til
Cy
clo
sp
ori
ne
+ M
yc
op
hen
ola
te +
Cyclo
ph
osp
ham
ide
Stem cell source Transplant type Conditioningregimen
TBI used GVHD Prophylaxis
Percent

Analysis of potential factors affecting CSA-1
Group A – Dose
escalated
(n=27)
Group B – Dose
de-escalated
(n=13)
Group C –
Same dose
continued
(n=37)
P
value
Median age at transplant 27 34 25 0.309
Males, n (%) 20 (74) 5 (39) 27 (73) 0.050
ABO mismatched transplants, n (%) 12 (44) 4 (31) 16 (43) 0.684
Gender mismatched transplants, n(%) 12(44) 6(46) 22(60) 0.445
Diagnosis
Acute Lymphoid Leukemia (ALL), n(%)
Acute Myeloid Leukemia (AML), n (%)
Biphenotypic leukemia, n (%)
9 (33)
17 (63)
1 (4)
1 (8)
11 (85)
1 (8)
13 (35)
24 (65)
0 (0)
0.226
Baseline Risk (n=68)
ALL
Standard Risk
Poor Risk
AML
Good Risk
Intermediate Risk
Poor Risk
Biphenotypic Leukemia
0
9
2
10
4
1
0
1
1
5
5
1
1
7
2
6
13
0
0.718

Group A Group B Group C P value
Disease status at transplant
Complete remission – 1
Complete remission – 2
Refractory/Relapse (in disease)
15
4
8
5
5
2
21
11
5
0.375
Stem cell source, n (%)
Bone Marrow
Umbilical Cord
Peripheral blood stem cells
2 (7)
2 (7)
23 (85)
2 (15)
0 (0)
11 (85)
1 (3)
0 (0)
36 (97)
0.167
Type of transplant, n (%)
Matched Related transplant
Matched Unrelated transplant
Haplo-indentical transplant
20 (74)
6 (22)
1 (4)
12 (92)
1 (8)
0 (0)
33 (89)
3 (8)
1 (3)
0.443
Type of conditioning regimen, n (%)
Full intensity
Reduced intensity
18(67)
9(33)
2(15)
11(85)
22(60)
15(41)0.007
Total body irradiation used, n (%) 13 (48) 0 (0) 19 (52) 0.004
Analysis of potential factors affecting CSA-1

Group A Group B Group C P value
Drugs used in conditioning, n (%)
Fludarabine
Melphalan
Cyclophosphamide
Busulphan
Mitoxantrone
Cytarabine
Treosulfan
16(60)
11(41)
13(48)
3(11)
1(4)
6(22)
2(7)
13(100)
8(62)
0(0)
4(31)
0(0)
2(15)
1(8)
21(57)
12(32)
20(54)
4(11)
0(0)
5(37)
2(5)
0.014
0.183
0.003
0.176
0.391
0.648
0.932
GVHD prophylaxis, n (%)
Cyclosporine + Methotrexate
Cyclosporine + Mycophenolate mofetil
17 (63)
10 (37)
8 (62)
5 (39)
28 (76)
9 (24)
0.458
Analysis of potential factors affecting CSA-1
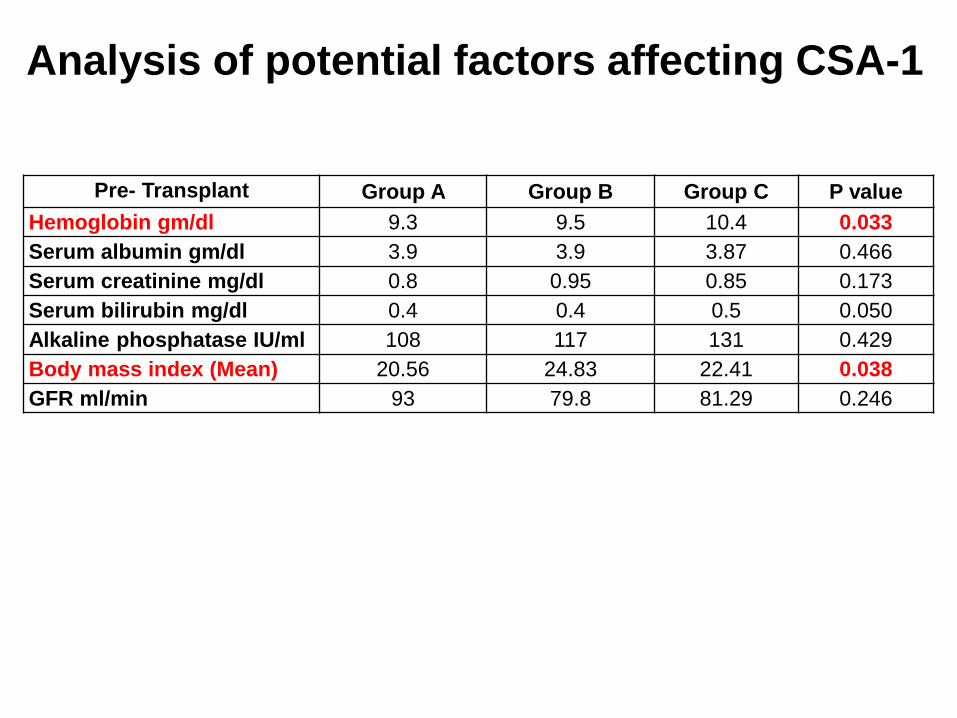
Pre- Transplant Group A Group B Group C P value
Hemoglobin gm/dl 9.3 9.5 10.4 0.033
Serum albumin gm/dl 3.9 3.9 3.87 0.466
Serum creatinine mg/dl 0.8 0.95 0.85 0.173
Serum bilirubin mg/dl 0.4 0.4 0.5 0.050
Alkaline phosphatase IU/ml 108 117 131 0.429
Body mass index (Mean) 20.56 24.83 22.41 0.038
GFR ml/min 93 79.8 81.29 0.246
Analysis of potential factors affecting CSA-1

Factor OR 95% CI p value
Model 1
BMI-Pre transplant * 0.835 0.708-0.986 0.034
Hemoglobin 0.914 0.521-1.603 0.753
Bilirubin 2.595 0.053-127.153 0.631
Model 2
TBI use 1.901 0.176-20.537 0.597
Fludarabine use * 0.184 0.011- 3.18 0.244
Cyclophosphamide use 0.678 0.039-11.686 0.789
Conditioning regimen- Full
Intensity2.28 0.456-11.389 0.315
Multivariate Analysis
* Factors significant in stepwise selection
Factor OR 95% CI p value
Model 1 BMI-Pre transplant * 0.83 0.705-0.977 0.025
Model 2 Fludarabine use * 0.101 0.012- .877 0.038

On univariate analysis
Use of FI regimen, cyclophosphamide and TBI and lower
Body Mass Index (BMI) were associated with lower CSA-1
Use of RI regimen, fludarabine, and higher BMI were
associated with higher CSA-1
On multivariate analysis
Fludarabine use and increased BMI predicted for higher CSA-
1 requiring CSA dose de-escalation.
Summary of factors affecting CSA-1

Analysis of transplant outcomes based
on CSA-1
Group A Group B Group C P value
Median days to achieve therapeutic CSA level 10 10 4 -
Median days to platelet engraftment 12 10 13 0.705
Median days to WBC engraftment 13 13 14 0.351
Incidence of acute GVHD (all grades), n (%) 13 (48) 5 (39) 16 (43) 0.836
Incidence of acute GVHD (grade III-IV), n (%) 3 (11) 4 (31) 7 (19) 0.316
Incidence of chronic GVHD, n (%)
Overall
Limited stage
Extensive stage
14 (52)
6(22)
9(33)
5 (39)
3(23)
2(15)
21 (57)
7(19)
13(35)
0.738
Incidence of relapse, n (%) 11 (41) 3 (23) 12 (32) 0.527
Slippage of chimerism, n (%) 10(31) 4(31) 8(22) 0.396
Treatment related mortality, n (%) 2 (7) 5 (39) 4 (11) 0.064
Median overall survival (years) 2.15 1.85 not reached 0.40
Toxicity of cyclosporine, n (%)
Nephrotoxicity
Hypertension
Neurotoxicity
7 (26)
11 (41)
1 (4)
2 (15)
7 (54)
0 (0)
12 (32)
14 (38)
4 (11)
0.485
0.599
0.304

Survival Analysis
RFS at 4 years
29% in group A
46% in group B
45% in group C (P=NS).
OS at 4 years
33% in group A
43% in group B
53% in group C (P=NS).
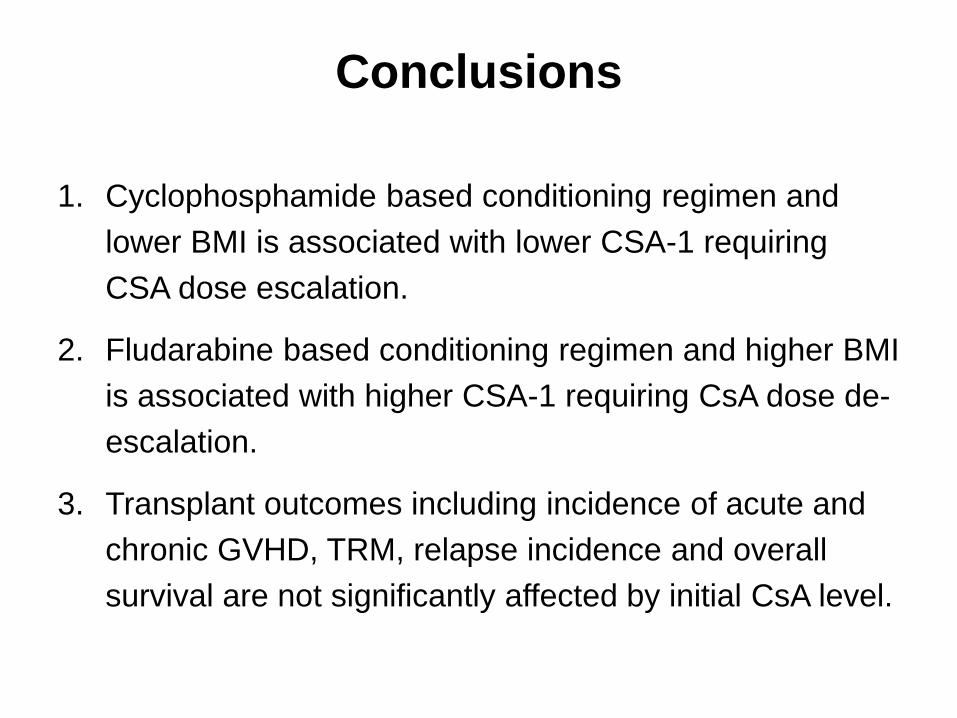
Conclusions
1. Cyclophosphamide based conditioning regimen and
lower BMI is associated with lower CSA-1 requiring
CSA dose escalation.
2. Fludarabine based conditioning regimen and higher BMI
is associated with higher CSA-1 requiring CsA dose de-
escalation.
3. Transplant outcomes including incidence of acute and
chronic GVHD, TRM, relapse incidence and overall
survival are not significantly affected by initial CsA level.

Thank You