factors affecting learning and memory: implications for ... aamir malik...learning through classical...
TRANSCRIPT

Click to edit Master title style
© 2016 INSTITUTE OF TECHNOLOGY PETRONAS SDN BHD
All rights reserved. No part of this document may be reproduced, stored in a retrieval system or transmitted in any form or by
any means (electronic, mechanical, photocopying, recording or otherwise) without the permission of the copyright owner.
Factors affecting Learning and Memory: Implications for Intervention
Aamir MalikAssoc. Prof., Univ. Tech. PETRONAS

Outline
Introduction
The Learning Process
Memory Model
Factors Affecting Learning and Memory
Long-term Memory Assessment
Experimental Evidences of use of 3D Technology
Neurofeedback Research
References

Introduction
• Learning and memory are two interrelated but different cognitive processes.
• Learning is a process to get new skills, knowledge and experience; while memory is the ability to retain the learned experience and reuse later

Learning
“The acquisition of knowledge or skills through study, experience, or being taught.”
“any relatively permanent changein behaviour that occurs as a result of practice and experience”
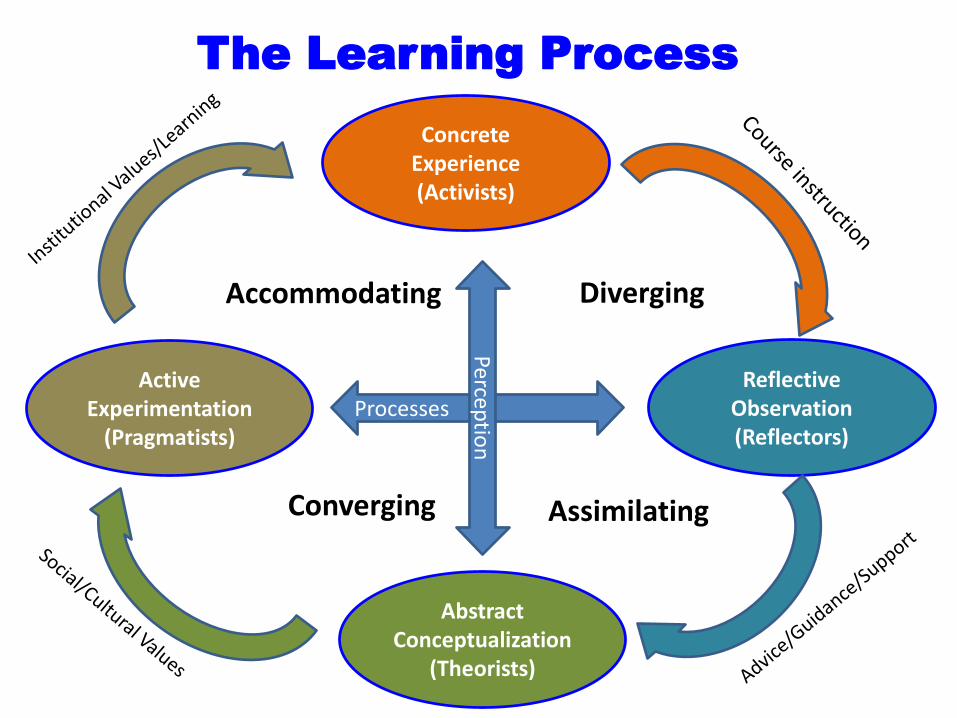
The Learning Process
Concrete Experience (Activists)
Abstract Conceptualization
(Theorists)
Reflective Observation (Reflectors)
Active Experimentation
(Pragmatists)Processes
Perceptio
n
Diverging
AssimilatingConverging
Accommodating
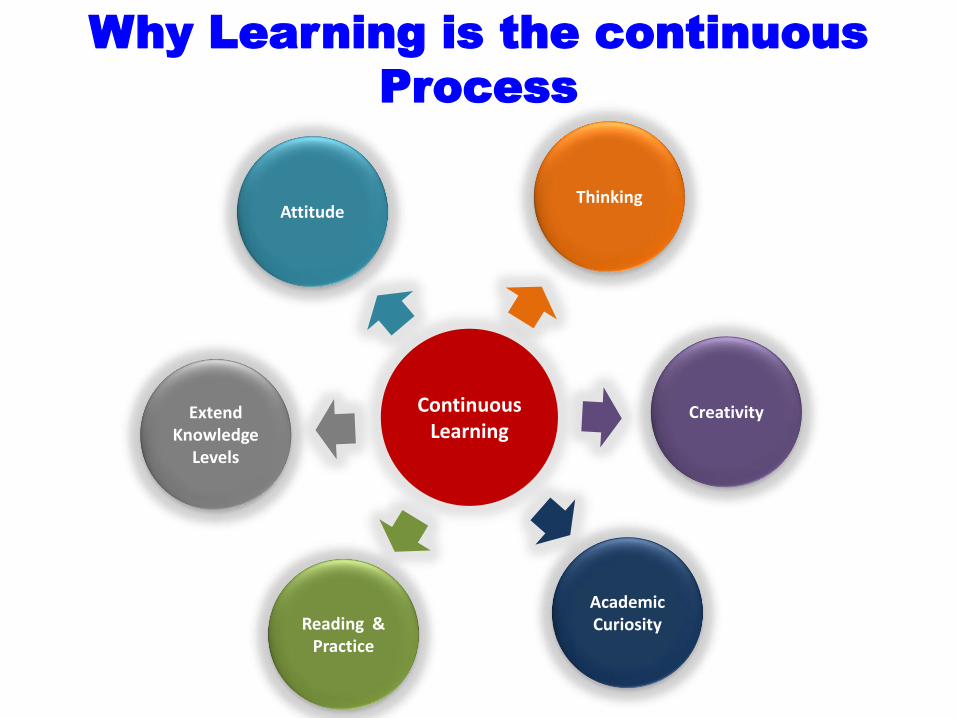
Why Learning is the continuous
Process
Continuous Learning
ThinkingAttitude
Extend Knowledge
Levels
Reading & Practice
Academic Curiosity
Creativity

How Does Learning Occur?
• To explain how and when learning occurs, a number of different psychological theories have been proposed.
Classical Conditioning
Operant Conditioning
Social learning

Learning through Classical conditioning
Before Classical Conditioning
During Classical Conditioning
After Classical Conditioning

Operand Conditioning
• For example, when a lab rat presses a green button, it receives a food pellet as a reward, but when he presses the red button he receives a mild electric shock.
• As a result, he learns to press the green button but avoid the red button.

Social Learning
• Albert Bandura (1961)
• Four requirements for learning:
– observation (environmental),
– retention (cognitive),
– reproduction (cognitive), and
– motivation (both).

Memory
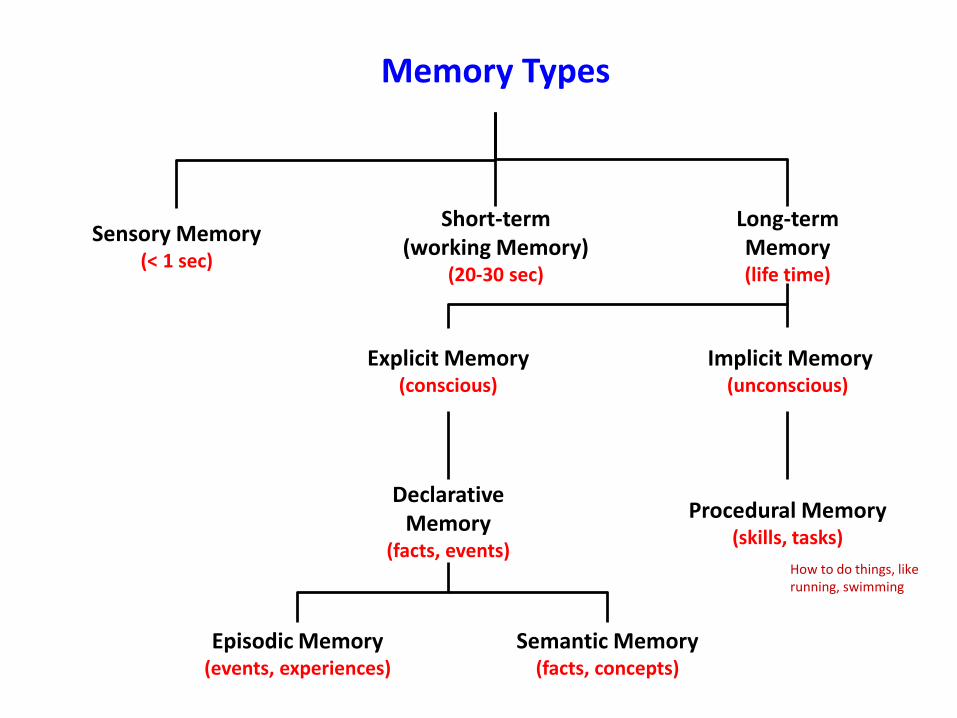
Memory Types
Sensory Memory(< 1 sec)
Short-term (working Memory)
(20-30 sec)
Long-term Memory(life time)
Implicit Memory (unconscious)
Explicit Memory (conscious)
Procedural Memory (skills, tasks)
Declarative Memory
(facts, events)
Semantic Memory (facts, concepts)
Episodic Memory(events, experiences)
How to do things, like running, swimming

Memory Processes
The three main processes involved in human memory are therefore encoding, storage and recall (retrieval). Additionally, the process of memory consolidation (which can be considered to be either part of the encoding process or the storage process).
Memory Encoding: It allows the perceived information of interest to be converted into construct that can be stored within the brain, which can later be recalled.
Memory Storage: It allows to retain the encoded information in the brain.
Memory Retrieval/Recall: It refers to recollect the stored information from memory.
External INPUT
ENCODINGInformation is
placed in memory
STORAGEInformation is
retained in memory
RETRIEVALInformation
stored in memory is found
as needed

MEMORY MODEL
Environmental Stimuli
Sensory Memory
Short-TermMemory
Long-termMemory
Information is forgotten due to interference, decay or retrieval failure
Retrieval
Storage
Selective Attention
Information that is not encoded gets forgotten
Echoic Memory
Haptic Memory
Gustatory Memory
Iconic Memory

Factor Affecting Learning and Memory
18

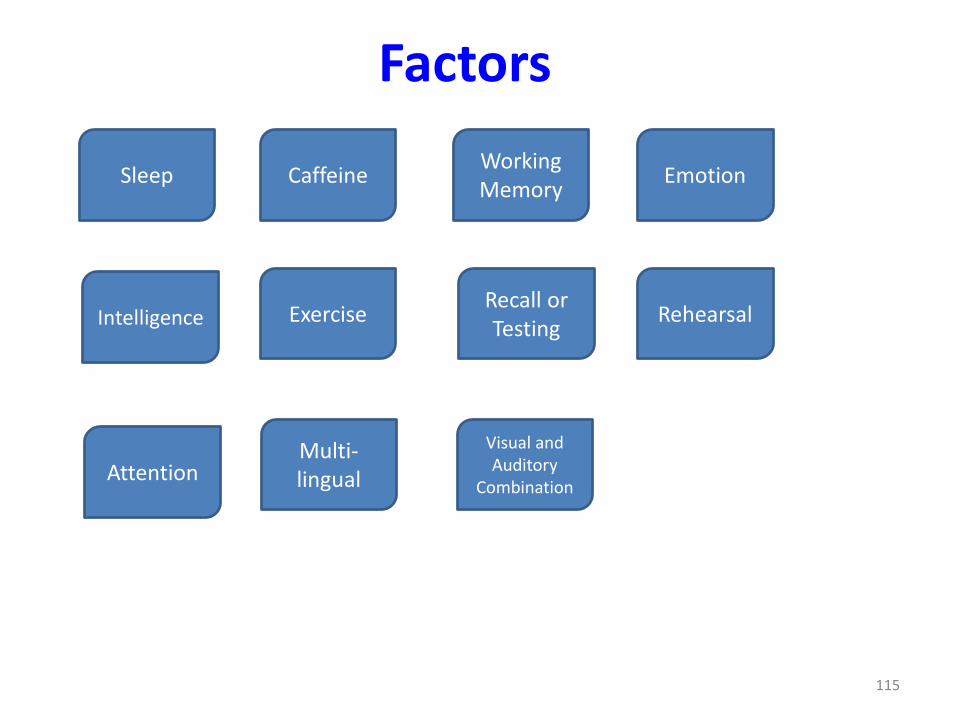
Factors
19
Sleep Caffeine Working Memory
Intelligence Exercise
Emotion
AttentionMulti-lingual
Recall or Testing
Rehearsal
Visual and Auditory
Combination
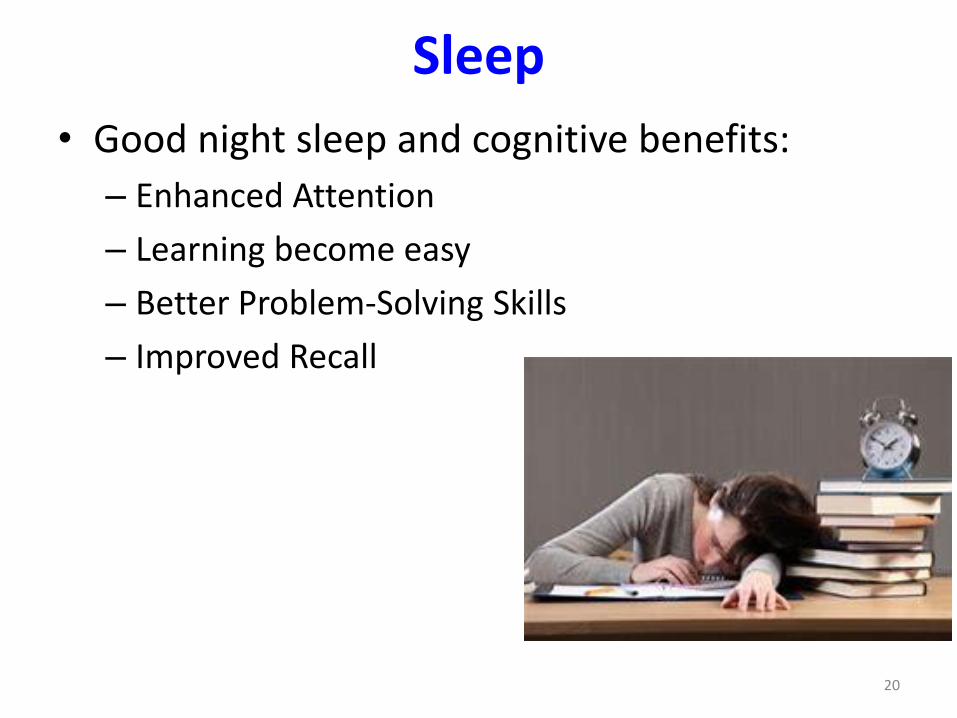
Sleep
• Good night sleep and cognitive benefits:
– Enhanced Attention
– Learning become easy
– Better Problem-Solving Skills
– Improved Recall
20

Research studies linked Sleep with academic performance
21
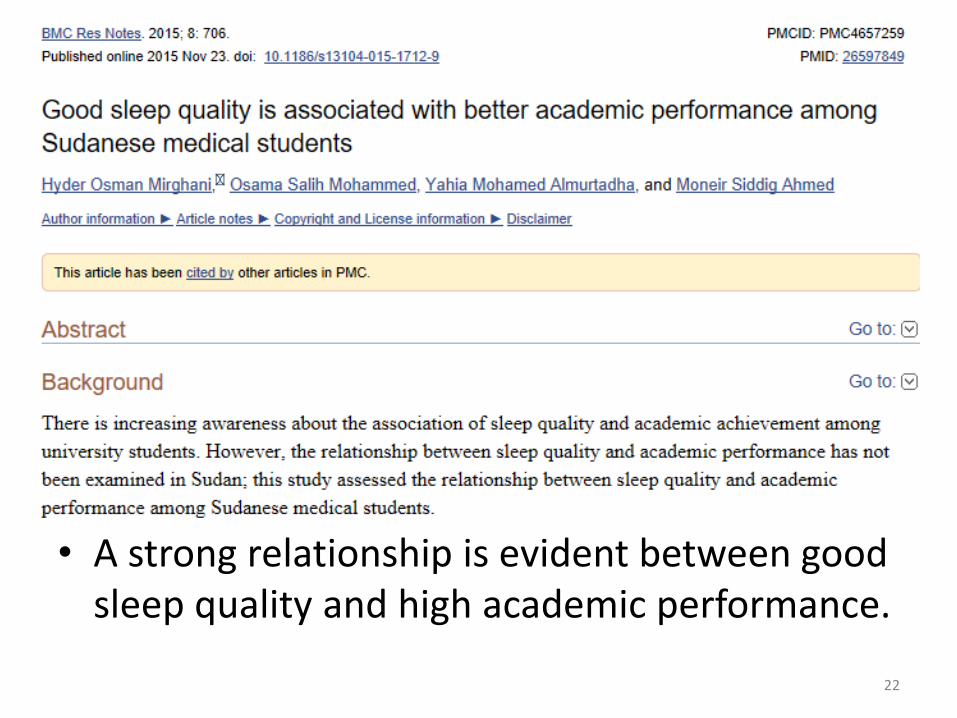
• A strong relationship is evident between good sleep quality and high academic performance.
22

23
Conclusion: Adequate sleep the night prior to an examination was positively associated with student course grades and semester GPAs.
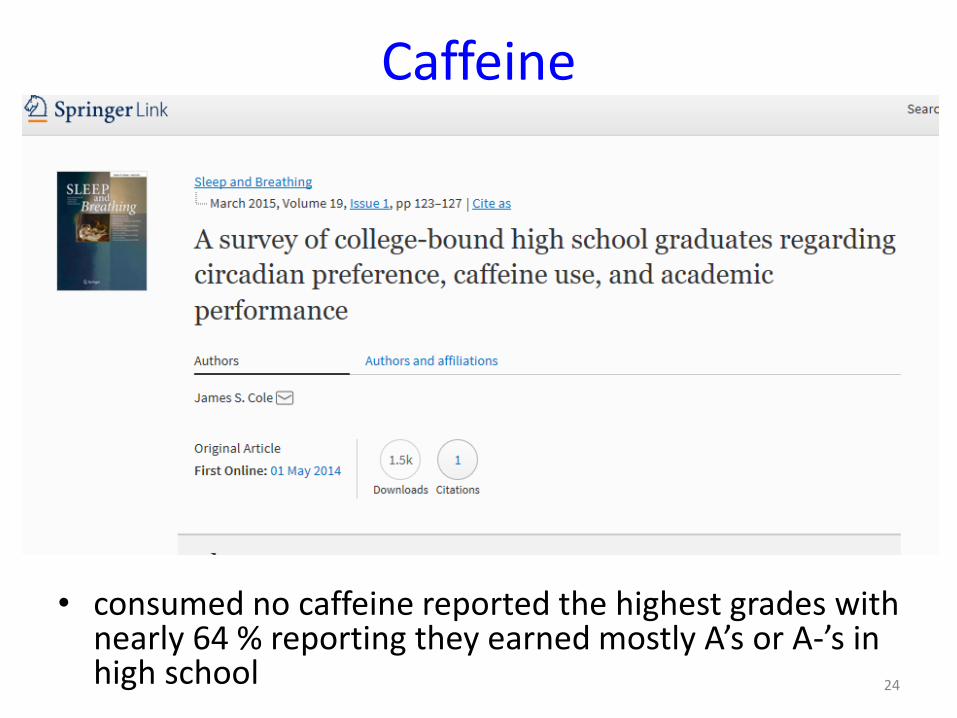
Caffeine
• consumed no caffeine reported the highest grades with nearly 64 % reporting they earned mostly A’s or A-’s in high school 24

Working Memory
Outcome: Results reveal that children with sub-average school achievement showed deficits in working memory functioning, irrespective of intelligence. By contrast, children with regular school achievement did not show deficits in working memory, again irrespective of intelligence. 25
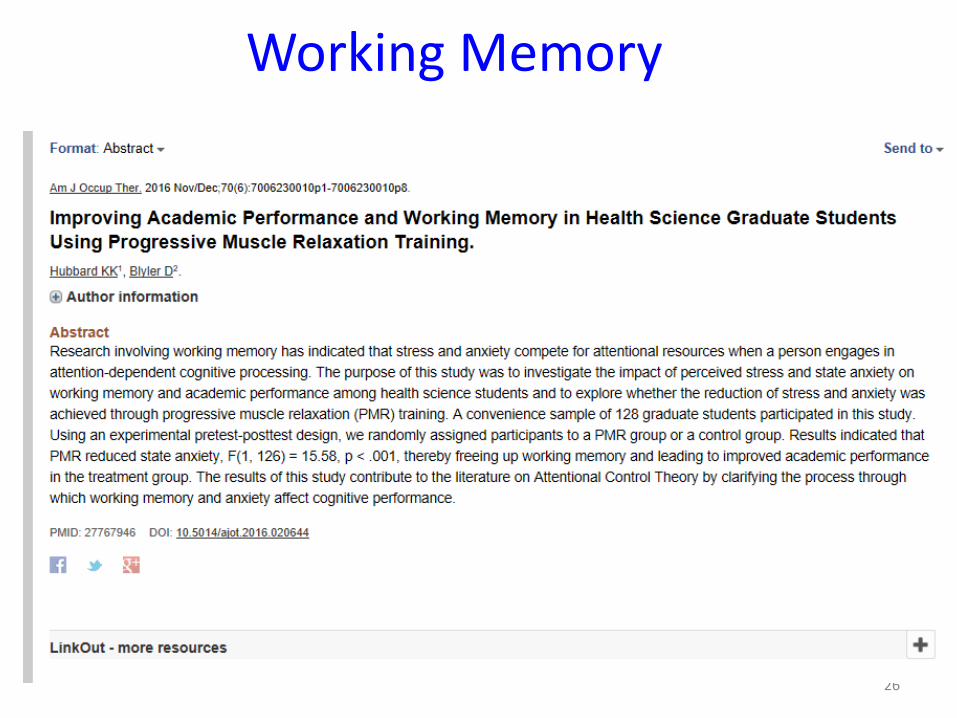
Working Memory
26

Emotion
• Emotions Plays important role in learning and memory
• Its drive attention, which in turn drives learning and memory
27

Results indicated students' emotion regulation, general affective dispositions, and academic affect were related to each other, each of these variables also made a unique significant contribution to students' GPA.
28
Intelligence
• It is the ability to learn or understand or to deal with new or trying situations
• There is an established relationship between intelligence and learning performance
29

30
Outcome: The results of proper analyses are consistent with the conclusion that performance on learning tasks and on conventional tests of intelligence, or IQ, both reflect common factors, principally Spearman's g, or the general factor common to all cognitive abilities.

31

Exercise
• Exercise Improves Cognitive functions
• Regular exercise changes the brain to improve memory, thinking skills
32

33
Results demonstrate that controlled training (CT), if performed with an appropriate combination of speed and duration, improves memory performance and neurogenesis.

Recall or Testing
• Testing or retrieval practice is the process in which the studied items or stored memory are recollected
• The testing effect was first studied by Karpicke and Roediger in comparison with rehearsal for long-term retention
Proportion of memory recall in three different retention durations for rehearsal and testing effects

Recall or Testing
• In short-term retention, ‘SSSS’ condition recalled more than the rest of two conditions ‘SSST’ and ‘STTT’. However, the recalled performance was reversed for long-term retention
• The work of Karpicke and Roediger
Comparison of three experimental conditions for memory retrieval with two types of retention intervals (S=Study; T=Test)

Attention
• Working Memory capacity is limited
• Attending to (focusing on) a fact/event will increase the likelihood of memorization.
• The acceptable view among the memory experts of this relation between attention and memory is that focusing on or attending to a fact or event means allocation of processing resources of the brain for certain task

Rehearsal
• The functions of rehearsal are to maintain information active in the working memory and to create new memory traces for long-term retention

Multi-lingual
• We use language to communicate our thoughts and feelings, to connect with others
• Learners who are multi-lingual can better understand and learn as compared to mono-lingual


Multimedia (Visual and Auditory Combination)
• Brain process auditory and visual info in different pathways
• Instructions in visual and auditory combination improves learning performance


Use of Technology
• Multimedia Tools
• 3D & VR Technology
• Mobile Apps
• Web based learning
• Online Forums and chats

Factors
44
Sleep Caffeine Working Memory
Intelligence Exercise
Emotion
AttentionMulti-lingual
Recall or Testing
Rehearsal
Visual and Auditory
Combination

3D Multimedia in Education
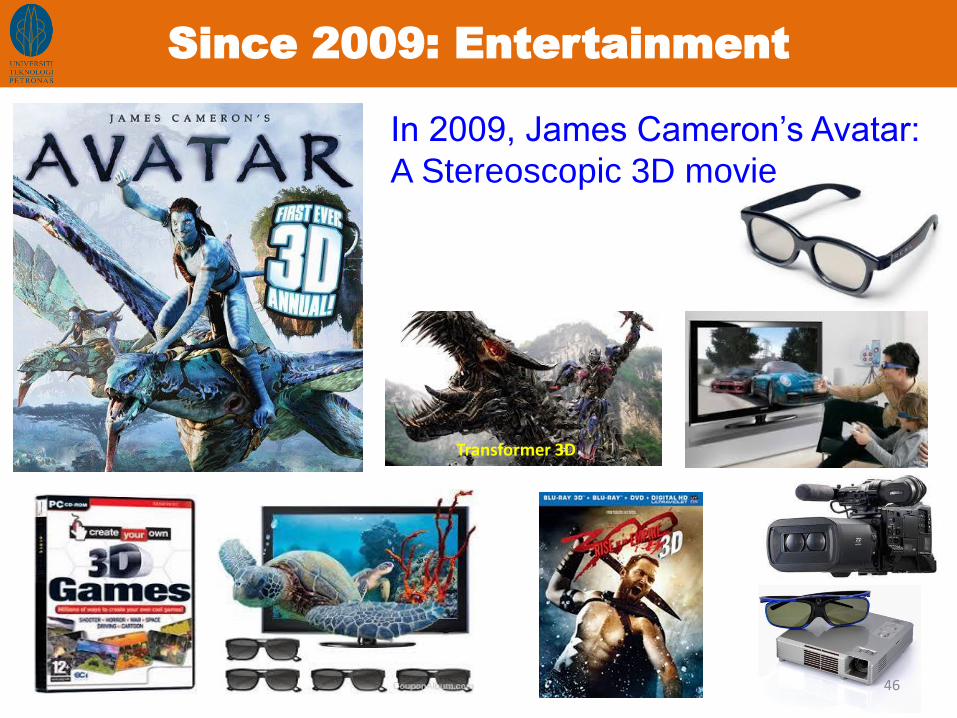
Since 2009: Entertainment
46
In 2009, James Cameron’s Avatar:
A Stereoscopic 3D movie
Transformer 3D

Such as education & research, architecture design (3D CAD), health & medicine
(training, imaging, therapy, and surgery).
Stereoscopic 3D in Serious Domain
47
Education

• The impact of 3D on academic results (Anne Bamford, 2011)
– The experimental results of the research indicated a positive effect of the use of 3D animations on learning and memory recall.
– 86% of students improved from the pre-test to the post-test in the 3D classes, compared to only 52% who improved in the 2D classes.
– Individuals improved test scores by an average of 17% in the 3D classes, compared to only an 8% improvement in the 2Dclasses between pre-test and post-test.
S3D in Education
Prof. A. BamfordUniversity of Arts Landon & Director of Int. Research Agency
The research study involved 740 students as a sample, 47 teachersand 15 schools across France, Germany, Italy, Netherlands, Turkey,United Kingdom and Sweden. 48

3D in Education (1)
• Objectives:
– to identify the most effective way of 3D presentation in classrooms
– to measure the effect and benefit of this experience to learning and achievement of the pupils.

3D in Education (2)
• The research took place between October 2010 and May 2011 across seven countries in Europe.
• The study focused on pupils between the ages of 10-13 years learning science-related content.
• The research project involved 740 students, 47teachers and 15 schools across France, Germany, Italy, Netherlands, Turkey, United Kingdom and Sweden.

3D in Education (3)
• The study involved: – Private and public schools;
– single sex schools; city schools and rural schools; high and low academic achieving schools;
– technology-rich and technology-poor schools; large schools and small schools; primary, middle and secondary schools;
– experienced and less experienced teachers.
– In each school there was a ‘control’ class and a 3D class.
– Both classes had the same instruction, but the 3D class also had the 3D resources.

3D in Education (4)
• During study, several tests were undertaken
– Teachers were asked to note the pupils’ retention (memory) after one month, between 3D and 2D classes
– Open-ended tasks were given to determine the impact both on retention and on recall.
– The teachers noted changes in the manner in which the 3D and 2D pupils recalled the learning.
– For Example
• The 3D learners had better ordering (sequence) of concepts

3D in Education (5)
• The impact of 3D on academic results – The experimental results of the research indicate a
marked positive effect of the use of 3D animations on learning, recall and performance in tests.
– 86% of pupils improved from the pre-test to the post-test in the 3D classes, compared to only 52% who improved in the 2D classes.
– The rate of improvement was also much greater in the classes with the 3D.
– Individuals improved test scores by an average of 17%in the 3D classes, compared to only an 8%improvement in the 2D classes between pre-test and post-test.

3D in Education (6)
• The marked improvement in test scores was also supported by qualitative data i.e,
– 100% of teachers agreed or strongly agreed that 3D animations in the classroom made the children understand things better,
– 100% of teachers agreed or strongly agreed that the pupils discovered new things in 3D learning that they did not know before.
– The teachers commented that the pupils in the 3D groups had deeper understanding, increased attention span, more motivation and higher engagement.

3D in Education (7)
• The findings from the teachers was also evident in the findings from the pupils, with a higher level of reported self-efficacy in the pupils within the 3D cohort compared to the 2D control groups.
– The pupils felt strongly (84% agreed or strongly agreed) that 3D had improved their learning.
– High levels of pupil satisfaction with 3D learning were also evident with an 83% approval rating.
– The pupils in the 3D class were more likely to recall detail and sequence of processes in recall testing than the 2D group.

3D in Education (8)
• Teachers and Pupils Comments:
– Both pupils and teachers stated that 3D made learning more “real” and that these concrete, “real” examples aided understanding and improved results.
– The pupils in the 3D classes could remember more than the 2D classes after four weeks.
– Not only were there differences in the quantity of material recalled, but the pupils who studied with 3D remembered in a more connected ‘systems’ manner.

3D in Education (9)
• Teachers and Pupils Comments:
“When the teacher shows a model if it is small you can't see it, but with 3D even if the teacher moves around or a big kid is in front of you the 3D will always move in front so you can always see things clearly.” – Pupil comment
“It gives the pupils a better chance to visualize various parts of the lesson. The children can easily imagine and it makes these imaginings visual.” – Teacher comment

3D in Education (10)
• Principal Comment:
“In this school we find that theoretical retention is a problem. As I see it, the 3D increases visual retention and this boosts learning.” – Principal comment
“We are sure that the system should be in every school and be available for every teacher.” – Principal comment

Strategies for implementing 3D in
the classroom
• To begin teaching with 3D, a teacher would need access to:
– 3D-enabled projector
– A laptop or PC with good graphic capability
– 3D content
– 3D glasses

WHY?
• There are many other studies which followed this main study proving the same results
• The question is WHY 3D is producing such good results?
• Another question is WHICH 3D technology is the best?

3D Perception
3D objects
Binocular disparity
Left image Right image

The imitation of 3D vision
Left eye Right eye
Left image Right image

Anaglyph Glasses
Left eye Right eye
Left images Right images

3D Passive Polarized Glasses
• Linear polarization

3D Passive Polarized Glasses
• Circular polarization

3D Active Shutter Glasses
Left eye Right eye
LR
1080
1920

Methodology

Experimental Design
PS
3
Experimenter
TV
2.0 m
Data acquisition
computerAmplifier
Subject
EEG & ECG
electrodes
0 5 10 30 35 55 8060
Eyes
Closed
Eyes
Open2D
Eyes
Open
3D
Active
Eyes
Open
min
3D
Passive

Delta Theta Alpha Beta High Beta Gamma
3D
A –
2D
3D
P –
2D
3D
A –
3D
P
EEG Power Difference
• Brain is implicated with global processing under 3DP viewing at lower frequencies
• 2D viewing results in high engagement in local processing at higher frequencies
3DP > 2D
2D > 3DA
3DP > 3DA
2D > 3D P
2D > 3DA
3DA > 3DP

Absolute Power (P<0.05)Delta Theta Alpha Beta High Beta Gamma
3D
A –
2D
F3, F4, C4, F8, FZ,*C3, *CZ,
*P3, *P4, *PZ, *T3, *T4, *T5, *T6, *O1, *O2
*T3, *T4 O1, *O2
*F4, *F7, *C3, *C4, *CZ, *P3, *P4, *PZ, *T3,
*T4
*T3, *T4 *T3, *T4
3D
P –
2D C3, P4, O1, T3,
T5, CZ,*T4, *T6,
*O2
O1, FZ C4, FZ
FP1, FP2, C3, P4, *F3, *F4,
*F7, *PZ, *T3, *T4
FP1, *F3, *F4, *F7, *T3, *T4
F7, *F3, *F4, *T3, *T4
3D
A –
3D
P
F3, F4, C4, T5, *FZ, *T3, *O2
FP1, O1, *FP2, *T3, *T4, *O2
O2, T4,*F7, *O1
FZ, PZ,*C4, *CZ
*FP2, *F3, F4 *F3, F4
*P < 0.0167
P – Values in blue indicate that activation in 2D are greater than 3D active/ passive
P – Values in red indicate that activation in 3D active are greater than 3D passive
P – Values in green indicate that activation in 3D passive are greater than 2D/ 3D active
Lower bands (θ – α): global & distributed processingi.e. working memory, attention
3DP > 2D
2D > 3DA
3DP > 3DA
Higher bands (θ – α): local processing
i.e. problem solving, hearing
2D > 3DA
2D > 3DP
3DA > 3DP

EEG Coherence Difference
3DP –hyper
3DA –hyper
3DP –hypo
3DA –Hyper (anterior)Hypo (posterior)
3DP –Hyper (anterior)Hypo (posterior)
3DP –Hyper (anterior)Hypo (posterior)
3DA –Hypo (anterior)
Hyper (posterior)
3DP –Hyper
3DP –Hyper

Signal Regularity
0.75
0.77
0.79
0.81
0.83
0.85
0.87
EC EO 2D 3DP 3DA
CP
EI
II. CPEI
Frontal Central Parietal Temporal Occipital
5.0
5.5
6.0
6.5
7.0
7.5
EC EO 2D 3DP 3DA
Co
mp
lex
ity
I. Hjorth - Complexity
Lower complexity:Signal is closer to sinusoidal behavior (more
regular)
Higher complexity:More sudden frequent changes in the
signal over time

SSQ
2D
3DA
3DP
0.00
50.00
100.00
150.00
200.00
250.00
300.00
Total SSQ Score

Subjective Feedback
15%
20%
37%
28%
NoYes
Somewhat
Slight
Active25%
Passive75%
Do you like 3D movies better than 2D movies?3D Active or 3D Passive?
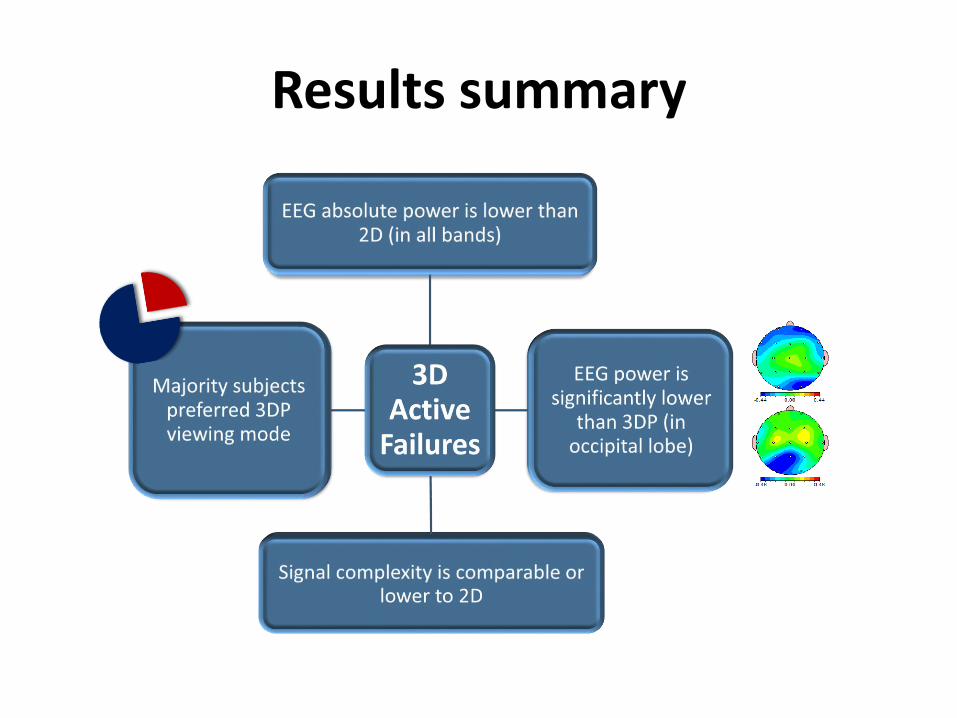
Results summary

Why 3D Active results in lower brain activation than 2D?

Left eye Right eye
LR
1st image at
time ‘t’ ms
Why 3D Active results in lower brain activation than 2D? (a) Sequential 2D images presentation
2nd image at
time ‘t + 4’ ms
3DTV

Left eye Right eye
1st right image
at time ‘t’ ms
Why 3D Active results in lower brain activation than 2D? (b) Eye blinks
1st left image at
time ‘t + 4’ ms
3DTV
2nd right
image
R-2L-2L-1
R-1
2nd left
image

References[1] S. Geiger. (2011, July 2012). 3DTV Owners: A Closer Look at The New World of Immersive Home Entertainment.
Available: http://www.degonline.org/pressreleases%5C2011%5Cf_3DTV%20Research.pdf
[2] I. P. Howard, "Neurons that respond to more than one depth cue," Trends in Neurosciences, vol. 26, pp. 515- 517, 2003.
[3] D. Y. Tsao, W. Vanduffel, Y. Sasaki, D. Fize, T. A. Knutsen, J. B. Mandeville, et al., "Stereopsis Activates V3A and Caudal Intraparietal Areas in Macaques and Humans," Neuron, vol. 39, pp. 555-568, 2003.
[4] M. D. Menz and R. D. Freeman, "Stereoscopic depth processing in the visual cortex: a coarse-to-fine mechanism," Nat Neurosci, vol. 6, pp. 59-65, Jan 2003.
[5] F. Gonzalez, "Evidence of Basal Temporo-occipital Cortex Involvement in Stereoscopic Vision in Humans: A Study with Subdural Electrode Recordings," Cereb Cortex, vol. 15, pp. 117-122, 2004.
[6] A. Anzai, S. A. Chowdhury, and G. C. DeAngelis, "Coding of stereoscopic depth information in visual areas V3 and V3A," The Journal of Neuroscience, vol. 31, pp. 10270-82, Jul 13 2011.
[7] E. Marx, A. Deutschländer, T. Stephan, M. Dieterich, M. Wiesmann, and T. Brandt, "Eyes open and eyes closed as rest conditions: impact on brain activation patterns," Neuroimage, vol. 21, pp. 1818-1824, 2004.
[8] R. J. Barry, A. R. Clarke, S. J. Johnstone, and C. R. Brown, "EEG differences in children between eyes-closed and eyes-open resting conditions," Clinical Neurophysiology, vol. 120, pp. 1806-1811, 2009.
[9] E. Niedermeyer, G. L. Krauss, and C. E. Peyser, "The Electroencephalogram and Mental Activation," Clinical EEG and Neuroscience, vol. 20, pp. 215-227, 1989.
[10] E. C. Thomeer, C. J. Stam, and T. C. A. M. van Woerkom, "EEG Changes during Mental Activation," Clinical EEG and Neuroscience, vol. 25, pp. 94-98, 1994.

References[11] A. G. Solimini, "Are there side effects to watching 3D movies? A prospective crossover observational
study on visually induced motion sickness," PLoS One, vol. 8, p. e56160, 2013.
[12] O. Dictionaries, "stereopsis". Oxford Dictionaries: Oxford University Press.
[13] G. C. DeAngelis, "Seeing in three dimensions: the neurophysiology of stereopsis," Trends in Cognitive Sciences, vol. 4, 2000.
[14] W. Robitza. (2012, 3D vision - Technologies and applications. SE Selected Topics in Multimedia 2012W.
[15] S. Hasegawa, M. Omori, T. Watanabe, K. Fujikake, and M. Miyao, "Lens accomodation to the stereoscopic vision on HMD.“
[16] G. G. Berntson, J. T. Bigger, D. L. Eckberg, P. Grossman, P. G. Kaufmann, M. Malik, et al., "Heart Rate Variability: Origins, methods, and interpretive caveats," Psychophysiology, vol. 34, pp. 623-648, 1997.
[17] T. E. S. o. Cardiology and T. N. A. S. o. P. a. Electrophysiology, "Heart Rate Variability," European Heart Journal, vol. 17, pp. 354–381, 1996.

Long-term Memory:
Assessment and Effects of Stereoscopic 3D
Educational Contents using EEG Signals

Summary of EEG Theta, Alpha and Gamma Frequency bands in LTM recall
Freq. Bands Location and reported changes Role in Memory Critics
Theta Power
(Fell et al.,
2011)
Medial Temporal (rhinal cortex and
hippocampus) Theta Power increased
before stimulus presentation reflects
preparation for stimulus-triggered memory
processing
Prediction of
LTM formation
Patients of temporal lobe epilepsy
were used for experimentation and
the memory material was word
recognition
Theta
Coherence
(Weiss et al.,
2000)
High coherence left frontal (Fp1,F7),
anterior and posterior temporal sites
(T4,T6) and right posterior parietal-
occipital regions (P4, O2).
LTM retrieval,
high information
processing
The material of memory was
abstract and concrete nouns
Theta Phase
(Rutishauser et
al., 2010)
Theta phase of single neurons at
hippocampus (bilateral) is associated with
the performance in memory task
Prediction of
successful LTM
formation
The experiment was performed in
patients of epilepsy and the memory
task was old-new paradigm
(recognition memory)
Alpha Power
(Fell et al.,
2011)
Medial Temporal Alpha Power increased
before stimulus presentation indicates
activation of contextual information
Prediction of
successful LTM
formation
Patients of temporal lobe epilepsy
were used for experimentation and
the memory material was word
recognition83

Freq. Bands Location and reported changes Role in Memory Critics
Alpha Power
(Klimesch et al.,
1997)
Variations in alpha power as a function
of memory performance
LTM retrieval The variations in alpha are not so clear
with respect to attentional demands,
memory load, and level of intelligence of
the participants.
Theta and Alpha
(Khader et al.,
2010)
High alpha power at parietal-occipital cortex
(P4, Pz, O2) and high theta power at mid-
frontal cortex (Fz, Cz) were observed for
subsequently remembered stimuli
LTM encoding and
retrieval
The retention duration was only 5 to 7
seconds in the delayed matching-to-sample
task
Gamma power
(Sederberg et al.,
2007)
Increased gamma power left temporal lobe,
hippocampus, inferior PFC and occipital
lobe during encoding of nouns
Prediction of LTM
correct retrieval
The results obtained from epileptic patients
and the study material was common nouns.
There may be effect of background
knowledge during encoding the nouns.
Theta and Gamma
power (Sederberg
et al., 2003)
Theta activity in tight temporal and frontal
cortex was high; while gamma was high
over widespread cortical sites
LTM retrieval The sample size was only 10 and the age
range was 8 to 17 years
Theta and Gamma
power (Osipova et
al., 2006)
High theta at right temporal and high gamma
power over occipital regions
Predicts encoding and
retrieval of LTM
The experiment was based on recognition
memory and used old/new paradigm, which
is ERP experiment
Summary of EEG Theta, Alpha and Gamma Frequency bands in LTM recall …
84

Study Feature Role in Memory Critics
P300 and face
recognition (Meijer et al., 2007)
P300 Amplitude Large P300 amplitude for recognized
faces at Pz site (semantic recognition
memory)
The stimuli were acquired through the participants
themselves, there may effect of picture recognition on
P300 amplitude instead of face recognition.
P300 and memory
recall (Jongsma et al., 2012)
P300 Amplitude Increase in the amplitude of P300 at Pz
site during semantic memory (recalling
digits)
The non-significant effect of the rehearsal of stimuli on
Fz and Cz amplitude is not well clear, either lack of
attention or any other reason inhibit the amplitude at
these sites.
P300 and visual
recognition (Vianin et
al., 2002)
P300 Amplitude Large P300 amplitude at posterior sites
(P3, P4, Pz, O1, O2, Oz) for semantic
recognition memory between healthy
and schizophrenic patients
The sample size used in this study was small, i.e., 10
participants in patient group and 14 participant in
control group.
P300 and LTM scanning
(Singhal and Fowler, 2004)
P300 Amplitude Amplitude of Visual P300 at Pz was
marginally high in LTM
The sample size was only 16 participants and the
retention time was 24 hours.
P300 and cognitive
impairment (Parra et al., 2012)
P300 Amplitude Reduced P300 amplitude at Fz and Pz
sites in mild cognitive impairment (MCI)
The sample size n=30 is relative small with three groups,
control, MCI and Alzheimer’s disease (AD).
P300 and Alzheimer’s
(Parra et al., 2012)
P300 Amplitude Smaller P300 amplitude in Alzheimer’s
patients at Fz, Cz, Pz sites
The variations in the P300 amplitude may be occurred in
sites (left or right hemisphere) other than the midline
sites, which is not discussed in this study.
Summary of P300 Studies related to LTM recall
85

• Problem Formulation The existing memory
assessment tools aresubjective in nature andlacking in automatic andquantitative assessment.
Problem Formulation
Raven’s Test (36+12 questions)45 min for test15 min for preparation
Expert Psychologist analyze the test results Compute relative score of
Cognitive ability
Associate with memory ability indirectly
Client
Compare with Population norm
Problems Subjective and indirect measurements Need of Expert Psychologists Need of Population norm Time consuming and High cost Inter-observer Variability Lack of individual’s motivation
Exis
tin
gP
ract
ice
Further, the existing techniques require an expertpsychologist/clinician to interpret the tests results and compare withthe population norm.
The assessment score is always relative with respect to thepopulation norm.
Therefore, the existing memory assessment techniques are unable todirectly measure an individual’s LTM ability.
86

• Further, the factors which influence the LTM, such as attention,
rehearsal, and testing are well studied in behavioral research.
• However, the use of S3D educational tools for learning & memory
is quite new; the effects of S3D display technology on LTM
performance and the brain behavior during LTM recall is
unknown.
• Only a behavioral study on S3D reported by Anne Bamford in
2011, where she found 86% of the students in 3D class improved
memory retention than 52% in 2D class.
• However, the reasons of why 3D class show better performance
in recall tests are unknown, because the study did not use
neuroimaging techniques.
• Therefore, the brain responses will be interesting to explore for
LTM using neuroimaging technique, such as EEG signals
Problem Formulation …
87

• To summarize limitations of existing studies related to
Long Term Memory (LTM) in Education, following two
points are found to be most significant:
1. There is no quantitative assessment of LTM (currently
subjective assessments are available only)
2. Out of the various factors affecting LTM in education,
S3D multimedia is least studied and understood
(attention, rehearsal & testing are well studied)
Problem Formulation …
88

Hypothesis
89
To address the two most significant limitations for LTM ineducation (as discussed in previous slide), following twohypotheses are proposed.
•Connectivity of brain regions using EEGfrequency bands (theta, alpha and gamma)may provide basis to propose aquantitative assessment tool for LTM.
H1
•The use of stereoscopic 3D multimedia educational tools may provide good effects on the brain in LTM recall. H2

Research Objectives
90
To develop a method for semanticlong-term memory (LTM) assessmentbased on resting state EEG signals,
To investigate the effects ofStereoscopic 3D educational contentson long-term memory (LTM) recallprocess using EEG signals.
Based on the hypotheses to address the two most significantlimitations for LTM in education (as discussed in previous twoslides), following are the two objectives of this study.

Experimental Design &
Proposed Methodology
91

30
min
Experiment Design & Flow Chart
1. RAPM Test (45 min)
2. EO, EC EEG (5min)
3. Study Contents (30 min)
4. Oddball Task (3 min)
5. Recall Test (10 min)
1. EO, EC EEG (5 min)
2. Recall Test (10 min)
3. Study Contents (10 min)
1. EO, EC EEG (5 min)
2. Recall Test (10 min)
3. Study Contents (10 min)
1. EO, EC EEG (5 min)
2. Recall Test (10 min)
1st
Sess
ion
2n
dSe
ssio
n3
rdSe
ssio
n4
thSe
ssio
n
2 months gap
2 months gap
2 months gap
Structure of Experiment
Flow Chart
Control Variables
General Intelligence
Age (18-30 Years)
Contents of Learning
EEG Recording
Sample Size 68
EGI EEG 128 Channels
Sampling rate 250
EEG Reference Cz
Learning Contents
Human Anatomy & Physiology animated contents (2D and S3D)
Duration of Contents 10 min (presented 3 times)
3D Technology
Passive Polarized
Screen 42 inch
Distance 1.5 meter
93
Experimental Tasks
RAPM Test
Learning Task
Oddball Task
Memory Recall Task
2 M
on
ths
4M
on
ths
6 M
on
ths

Data Analysis
Behavioral Data
EEG Signals
Accuracy (ACC %)
Reaction Time (RT)
ERP Signals
Proposed Feature Extraction Scheme for EEG
Signal to discriminate S3D and 2D Memory Recall
Proposed LTM Assessment Scheme based on
Resting State EEG Signals (eyes open)
EEG Source Analysis with LORETA-Key for S3D/2D
Proposed LTM Assessment Scheme based on P300
component of ERP Signals
94

Proposed LTM Assessment Scheme based on Resting State EEG
Step 1. Feature Extraction: Compute EEG absolute Phase delay of
theta, alpha and gamma frequency bands of 171*3=513 pairs from
19 electrodes
Step 2. Feature Selection: Apply correlation to identify significant
related electrodes pairs with memory score
Step 3. Prediction Model: Apply Multiple-Linear Regression
(MLR) on the selected features to train the model
Step 4. Proposed LTM Grading: The output of the trained MLR
model is used to grade the individual LTM ability.
Steps of the Proposed Scheme 1. 𝑛 ×𝑛−1
2, where n is the number of electrodes
2. Compute the cross-spectra of x and y, which produce
cospectrum (r―real) and quadspectrum (q―imaginary)
3. Phase angle (or 𝜃𝑥𝑦= 𝑎𝑟𝑐𝑡𝑎𝑛𝑞𝑥𝑦
𝑟𝑥𝑦).
4. Absolute phase delay in degree, 𝜃𝑥𝑦2
n
i
n
i
ii
n
i
ii
yyxx
yyxx
r
1 1
22
1
)()(
)))(((Where xi is EEG feature
and y is memory score
𝑌 = 𝛽0 + 𝛽1𝑋1 +⋯+ 𝛽𝑛𝑋𝑛 + 𝜀Or 𝑌 = 𝑋𝛽 + 𝜀
𝑌 is the dependent variable
𝑋𝑖 is the 𝑖𝑡ℎ independent variables
𝛽𝑖 is the 𝑖𝑡ℎ regression weight (unknown)
𝜀 is the error between actual and predicted value
Using Ordinary Least Squares to estimate the 𝛽 𝛽 = (𝑋𝑇𝑋)−1𝑋𝑇𝑌
MLR(Score %)
ValueRange
Grade Description
𝑺𝒄𝒐𝒓𝒆 (%)
= 𝑌 × 100
20
90% to 100% A Excellent long-term
memory ability in
retrieval of semantic
concepts, facts and
knowledge.
80% to 90% B Very Good
70% to 80% C Good
60% to 70% D Average
50% to 60% E Fair
49% and below F Unsatisfied
REF: R. W. Thatcher, D. North, and C. Biver, "EEG and intelligence: Relations betweenEEG coherence, EEG phase delay and power," Clinical Neurophysiology, vol. 116, pp.2129-2141, Sep 2005.
(REF)
95

Proposed LTM Assessment Based on P300 Component
Steps of the Proposed Scheme
Step 1: Preprocessing Filtering (0.3 to 30 Hz) Segmentation Artifacts Rejection Bad Channels Rejection Averaging Trials Re-Referencing
Step 2: Feature Extraction Amplitude Latency
Step 3: Multiple Linear Regression 𝑌 = 𝑋𝛽 + 𝜀
Step 4: Proposed LTM Grading
Amplitude (Smax)― It is the maximum signal value at some point in time for a specified window . Time window was 276–500ms.
𝑠𝑚𝑎𝑥,𝑖 = 𝑚𝑎𝑥𝑡 𝑠 𝑡 |𝑤𝑖 𝑡where,𝑤 𝑡 = 276𝑚𝑠 ≤ 𝑡 ≤ 500𝑚𝑠
Latency (tsmax)― The latency of an ERP component is that point in time where the maximum signal value occurs.
𝑡𝑠𝑚𝑎𝑥 = 𝑡|𝑠 𝑡 = 𝑆𝑚𝑎𝑥
Where smax is the maximum signal value (REF)
+
EEG
Trial 1
Trial 2
...
Trial N
Trial 1 Trial 2 …. Trial N
Averaged ERP Signal
Volt
age
(µV
)
-
P1 P2P3
N2N1
Time (ms)
Latency of P300
0 100 200 300 400 500 600
REF: V. Abootalebi, M. H. Moradi, and M. A. Khalilzadeh, "A new approach for EEG feature extraction in P300-based lie detection," Computer
Methods and Programs in Biomedicine, vol. 94, pp. 48-57, 2009.
96

Proposed EEG Feature Extraction Scheme
S3D vs. 2D
A completely periodic signal repeats itself with a constant period and can bemathematically defined, such as sin(x) (Hayes, 1998).
Example of periodic sine signal and EEG signal of 3-to-6 Hz with redundant information, CR (compression ratio), R (redundancy)
However, in case of EEG signal, itis not completely periodic likesin(x), but there is someperiodicity
97
Resting State …EEG has more redundant infoCognitive Tasks…EEG has less redundant info

Proposed EEG Feature Extraction Scheme
S3D vs. 2D
Discrete Wavelet
Transform (DWT)
Threshold &
Rounding-off
Arithmetic
Coding
Feature
Extraction
Features
Standardization
Features
SelectionClassifierCross Validation
𝐷𝑗𝑘 = 𝐷𝑗𝑘, 𝐷𝑗𝑘 ≥ 𝛼,
0, 𝐷𝑗𝑘 < 𝛼,
𝐸 =100 × 𝑋𝑟 2
2
𝑋 22 > 99%
= 𝜎 2𝑙𝑜𝑔𝑁
𝜎 =median Djk
0.6745
R =1
CR× 100
CR =size of original signal 𝑋
size of compressed signal 𝑋𝑐
𝑥𝑖 =𝑥𝑖 − 𝑥
𝜎Where, i=1, 2,…,N;
N is the number of instances in a
specific feature x;
𝜎 and 𝑥 are standard deviation and
mean of 𝑥𝑖 ;
and 𝑥𝑖 is the normalized feature
value.
𝐹𝐷𝑅 =𝑚1 −𝑚2
𝜎12 − 𝜎2
2
Where, 𝑚1 and 𝑚2 are
mean values
and 𝜎12 and 𝜎2
2 are the
respective variances of a
feature 𝑥𝑖 in two classes.
DWT Coefficients Optimum DWT Coefficients DWT Coefficients encoded to bit stream
R, C
r F
eatu
res
EEG Signals
Classes
Performance Evaluation Reduced Feature set Standardized Features set
Ai =1
M
n
x n .j,k n
Where, j,k n = 2j/2h 2jn−k
Di =1
M
n
x n .j,k n
Where, j,k n = 2j/2g 2jn−k
kNN classifier:
Input: D, the set of training objects, the
test object, z, and L, the set of classes
Output: 𝑐𝑧 ∈ 𝐿,the class of z
Foreach object 𝑦 ∈ 𝐷 do
| compute d(z,y), the distance between
z and y;
End
Select 𝑁𝐷,the of k closest training
objects for z;
𝑐𝑧=argma𝑥
𝑣∈𝐿 𝑦∈𝑁 𝐼 𝑣=𝑐𝑙𝑎𝑠𝑠 𝑐𝑦 ;
Where 𝐼 ∙ is an indicator function that
returns the value 1 if its argument is true and
0 otherwise.
K-Cross Validation:
Divide the given dataset into 𝐾 =10 subsets of equal size. A single
subset is retained as the
validation data for testing the
model, and K−1 subsets are used
as training data.
This process is repeated
K−𝑡𝑖𝑚𝑒𝑠, each time leaving out
one of the subsets from training,
which is used for testing.
Arithmetic Coding Algorithm:
Φk S = [αk, βk), k = 0,1,… , N,
Where S is the source data sequence, 𝛼𝑘 and 𝛽𝑘 are real numbers such that 0 ≤ 𝛼𝑘 ≤ 𝑎𝑘+1, and 𝛽𝑘+1 ≤ 𝛽𝑘 ≤ 1.
2D Class
S3D Class
Published in Brain Topo.Q1 Journal
98

Experimental Results
99

1. To develop a method based on EEG features for long-term memory (LTM) assessment
Proposed LTM Assessment Based on Resting State EEG Signals
Proposed LTM Assessment Based on P300 Component
Experimental Results
100

Steps of the Proposed Scheme
Step 1. Feature Extraction: Compute absolute Phase delay of theta,
alpha and gamma frequency bands of 171*3=513 pairs from 19
electrodes
Step 2. Feature Selection: Apply correlation to identify significant
related electrodes pairs with memory score
Step 3. Prediction Model: Apply Multiple-Linear Regression
(MLR) on the selected features to train the model
Step 4. Proposed LTM Grading: The output of the trained MLR
model is used to grade the individual LTM ability.
Results: Proposed LTM Assessment Scheme Based on Resting State EEG
EEG Electrode Pairs (Fp2-F7, Fz-C4, T3-Pz, T5-P4, T6-T4, Fp2-P3, F7-F4, C3-O1,Fp2-P3, F3-C3, F7-C3 and T3-O2) whichhave strong relationship with memoryrecall
Prediction Results:MLR model predicted the long-termmemory of all 4 sessions.
30 min retention:F(12,51)=4.421,p<0.0001, R=0.714,R2=0.560
2 months retention:F(12,47)=4.994, p<0.0001, R=0.749, R2=0.560
4 months retention:F(12,44)=2.816, p=0.006, R=0.659, R2=0.434
6 months retention:F(12,37)=2.019, p=0.050, R=0.629, R2=0.396
101
Theta Alpha Gamma
Pat
en
t Fi
led
(P
I 20
16
70
40
28
)

Results: Proposed LTM Assessment Scheme Based on Resting State EEG
Here, y1, y2, y3, and y4 are percentage observed LTM scores in session 1, session 2, session 3 and session 4.The corresponding percentage predicted LTM scores are represented as 𝒚𝟏, 𝒚𝟐, 𝒚𝟑, 𝒂𝒏𝒅 𝒚𝟒, respectively.
Su
bje
ct N
o
Session 1
(30 min Retention)
Session 2
(2 months Retention)
Session 3
(4 months Retention)
Session 4
(6 months Retention)
𝒚𝟏 𝒚𝟏
Gra
de
𝒚𝟐 𝒚𝟐
Gra
de
𝒚𝟑 𝒚𝟑
Gra
de
𝒚𝟒 𝒚𝟒
Gra
de
1 90 83.64 B 75 67.41 D 70 70.69 C 80 67.45 D
2 70 78.22 C 50 60.05 D 50 66.36 D 60 73.25 C
3 75 82.09 B 65 67.38 D 80 75.53 C 85 79.05 C
4 70 66.71 D 70 67.16 D 85 76.57 C 80 77.35 C
5 85 79.93 C 50 60.71 D 55 67.76 D 60 67.05 D
6 95 85.45 B 75 65.48 D 75 71.20 C 90 71.02 C
7 85 89.21 B 70 62.74 D 65 73.33 C 70 74.13 C
8 90 76.58 C 80 73.16 C 90 80.04 B 95 87.17 B
9 80 80.17 B 75 72.22 C 60 58.70 E 50 50.14 E
10 90 78.92 C 60 61.36 D 80 68.61 D 75 76.87 C
LT
M
Gra
din
g
90% to 100% A
80% to 90% B
70% to 80% C
60% to 70% D
50% to 60% E
49% and below F102

Results: Comparison of Proposed LTM prediction Scheme with RAPM Test
Session F-statistic p-value R-value R-squared Adjusted R2
RA
PM
tes
t 01 F(1,62)=10.235 0.002 0.376 0.142 0.128
02 F(1,58)=5.872 0.019 0.303 0.092 0.076
03 F(1,55)=6.422 0.014 0.323 0.105 0.088
04 F(1,48)=8.167 0.006 0.381 0.145 0.128
Pro
po
sed
EE
G
Sch
eme
01 F(12,51)=4.421 0.001 0.714 0.510 0.395
02 F(12,47)=4.994 0.001 0.749 0.560 0.448
03 F(12,44)=2.816 0.006 0.659 0.434 0.280
04 F(12,37)=2.019 0.050 0.629 0.396 0.200
The proposed EEG based LTM Assessment scheme was compared with Raven’s Advanced Progressive Matrices (RAPM) Test, which is an established indicator of learning and memory in educational psychology. However, the proposed scheme outperformed the RAPM.
Raven’s Test (36+12 questions)45 min for test15 min for preparation
Expert Psychologist analyze the test results Compute relative score of
Cognitive ability
Associate with memory ability indirectly
Client
Compare with Population norm
Problems Subjective and indirect measurements Need of Expert Psychologists Need of Population norm Time consuming and High cost Inter-observer Variability Lack of individual’s motivation
Exis
tin
gP
ract
ice
Pro
po
sed
EEG
bas
ed
LTM
A
sse
ssm
en
t
Quantitative LTM Assessment &
Grading
EEG Recording (5 min) EEG Analysis by proposed LTM assessment scheme
method (in sec)
EEG Machine setting (maxi. 5-10 min)
Advantages Quantitative and direct measurements Assign Grade No need of Expert Psychologists No need of Population norm Efficient and accurate
Raw EEG Signals
103

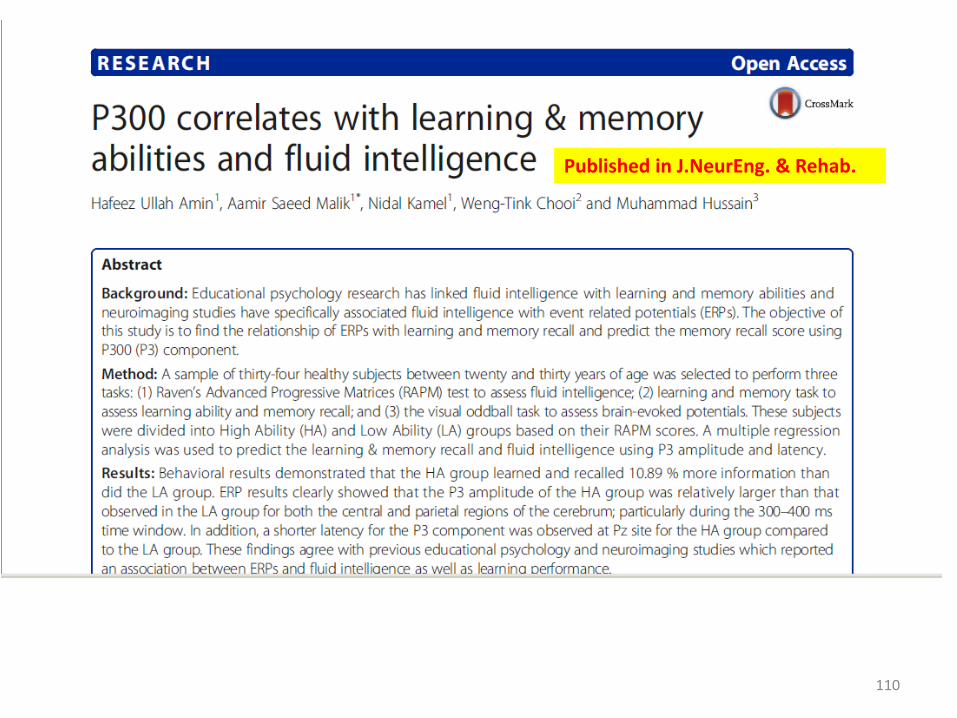
Results: Proposed LTM Assessment Scheme Based on P300 Component
Variables LTM Recall RAPM P3 amplitude P3 latency
LTM Recall 0.653** 0.554** -0.365*
RAPM 0.653** 0.540** -0.495*
P3 amplitude 0. 554** 0.540** -.328
P3 latency -0.365* -0.495* -.328
Correlation between P300 component (Pz) and LTM Recall
Correlation is significant at the level **p < 0.005, *p < 0.025 (2-tailed).
Pearson’s correlation was used, and sample size is (n=30).
The regression result showed that P300 amplitude successful predicted the LTM recall score of 30 min retention , F(1,28)=12.42, p=0.001, R=0.554 and R2= 0.307. However, unable to work for long retention, i.e., F(1,28)=1.928, p-value=0.165, R=0.353, R2=0.116, for LTM recall after 02 months, 4 months and 6 months of retention
Published in J.NeurEng. & Rehab.Q1 Journal (IF=2.740)
Steps of the Proposed Scheme
Step 1: Preprocessing Filtering (0.3 to 30 Hz) Segmentation ………
Step 2: Feature Extraction Amplitude Latency
Step 3: Multiple Linear Regression 𝑌 = 𝑋𝛽 + 𝜀
Step 4: Proposed LTM Grading
104

2. To investigate the effects of Stereoscopic 3D educational contents on memory recall process using EEG signals.
Comparison of S3D vs. 2D for LTM recall
Proposed EEG Feature Extraction Scheme for S3D and 2D comparison
Experimental Results
105

Comparison of S3D vs. 2D
The S3D group
involves widespread
brain neuronal
network as compared
to 2D group during
LTM recall.
2. To investigate the effects of Stereoscopic 3D educational contents on memory recall process using EEG signals.
Results of Memory Recall Results of Reaction Time (RT)
EEG sLORETA Results
The S3D group recalled
the semantic LTM faster
than the 2D group after 02
months retention duration.
(p-value<0.05)
106
Published in Annals of Neurology (Q1/IF 11.910) as a abstract
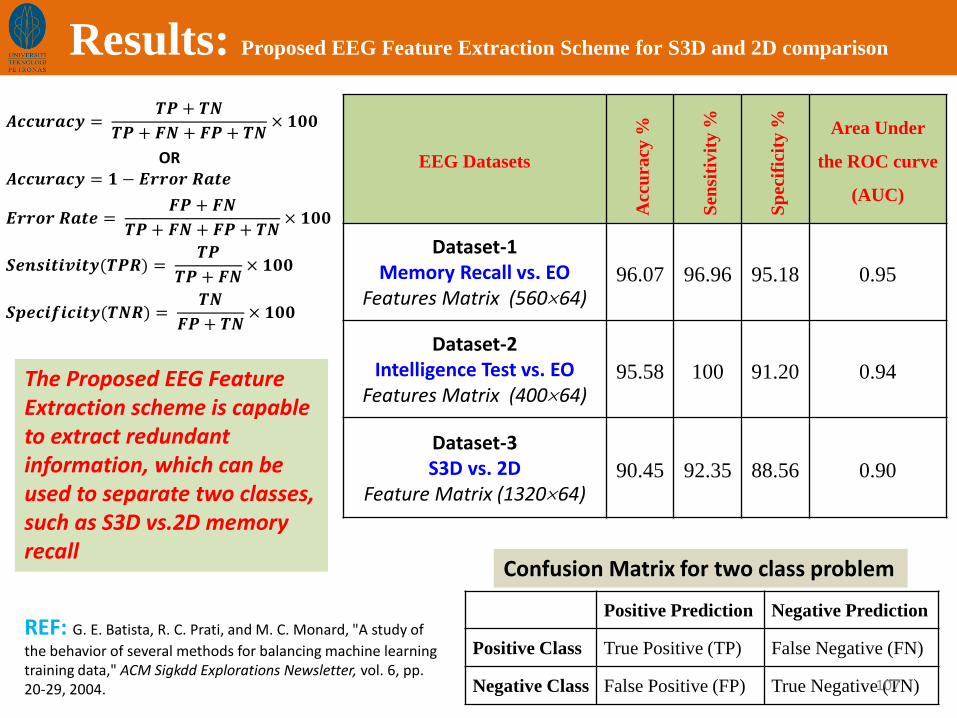
Results: Proposed EEG Feature Extraction Scheme for S3D and 2D comparison
EEG Datasets
Acc
ura
cy %
Sen
siti
vit
y %
Sp
ecif
icit
y % Area Under
the ROC curve
(AUC)
Dataset-1Memory Recall vs. EO
Features Matrix (56064)96.07 96.96 95.18 0.95
Dataset-2Intelligence Test vs. EO
Features Matrix (40064)95.58 100 91.20 0.94
Dataset-3S3D vs. 2D
Feature Matrix (132064)90.45 92.35 88.56 0.90
Positive Prediction Negative Prediction
Positive Class True Positive (TP) False Negative (FN)
Negative Class False Positive (FP) True Negative (TN)
Confusion Matrix for two class problem
𝑨𝒄𝒄𝒖𝒓𝒂𝒄𝒚 =𝑻𝑷 + 𝑻𝑵
𝑻𝑷 + 𝑭𝑵 + 𝑭𝑷 + 𝑻𝑵× 𝟏𝟎𝟎
OR𝑨𝒄𝒄𝒖𝒓𝒂𝒄𝒚 = 𝟏 − 𝑬𝒓𝒓𝒐𝒓 𝑹𝒂𝒕𝒆
𝑬𝒓𝒓𝒐𝒓 𝑹𝒂𝒕𝒆 =𝑭𝑷 + 𝑭𝑵
𝑻𝑷 + 𝑭𝑵 + 𝑭𝑷 + 𝑻𝑵× 𝟏𝟎𝟎
𝑺𝒆𝒏𝒔𝒊𝒕𝒊𝒗𝒊𝒕𝒚(𝑻𝑷𝑹) =𝑻𝑷
𝑻𝑷 + 𝑭𝑵× 𝟏𝟎𝟎
𝑺𝒑𝒆𝒄𝒊𝒇𝒊𝒄𝒊𝒕𝒚(𝑻𝑵𝑹) =𝑻𝑵
𝑭𝑷+ 𝑻𝑵× 𝟏𝟎𝟎
REF: G. E. Batista, R. C. Prati, and M. C. Monard, "A study of
the behavior of several methods for balancing machine learning training data," ACM Sigkdd Explorations Newsletter, vol. 6, pp. 20-29, 2004.
The Proposed EEG Feature Extraction scheme is capable to extract redundant information, which can be used to separate two classes, such as S3D vs.2D memory recall
107

Results: Comparison of Proposed EEG Feature Extraction Scheme with State of the art
EEG Feature Extraction Methods
Feature Methods
Dataset-1
Memory Recall vs. EO
Feature Matrix (56064)
Dataset-2
Intelligence Test vs. EO
Feature Matrix (40064)
Dataset-3
S3D vs. 2D
Feature Matrix (132064)
Proposed EEG Scheme 96.07 95.58 90.45
Delta Power 94.67 91.17 69.34
Theta Power 92.85 80.88 71.28
Alpha Power 89.1 67.64 69.29
Beta Power 87.35 73.52 69.78
Gamma Power 87.48 67.64 67.35
ApEn 68.75 87.5 53.46
SamEn 86.75 83.82 53.68
CPEI 68.5 75 60.81
Hjorth Complexity 73.5 75 65.51
Fractal Dimension 75 58.82 61.76
Performance Comparison of the Proposed EEG Feature Extraction Scheme (Accuracy: k-nearest neighbor)
The performance of discriminating two EEG classes of the proposed EEGFeature Extraction Scheme is better than the state of the art EEG featureextraction methods as mentioned by the accuracy of k-NN classifier
𝑨𝒄𝒄𝒖𝒓𝒂𝒄𝒚=
𝑻𝑷+𝑻𝑵
𝑻𝑷+𝑭𝑵+𝑭𝑷+𝑻𝑵×𝟏𝟎𝟎
108

Article Published
109
Published in Brain Topography.
110
Published in J.NeurEng. & Rehab.

111

112

How Neurofeedback can be used?
Factors
115
Sleep Caffeine Working Memory
Intelligence Exercise
Emotion
AttentionMulti-lingual
Recall or Testing
Rehearsal
Visual and Auditory
Combination

3D Stimuli • 3D Stimuli can be used in neurofeedback to
use wide spread neuronal network for training
• Virtual Reality environment
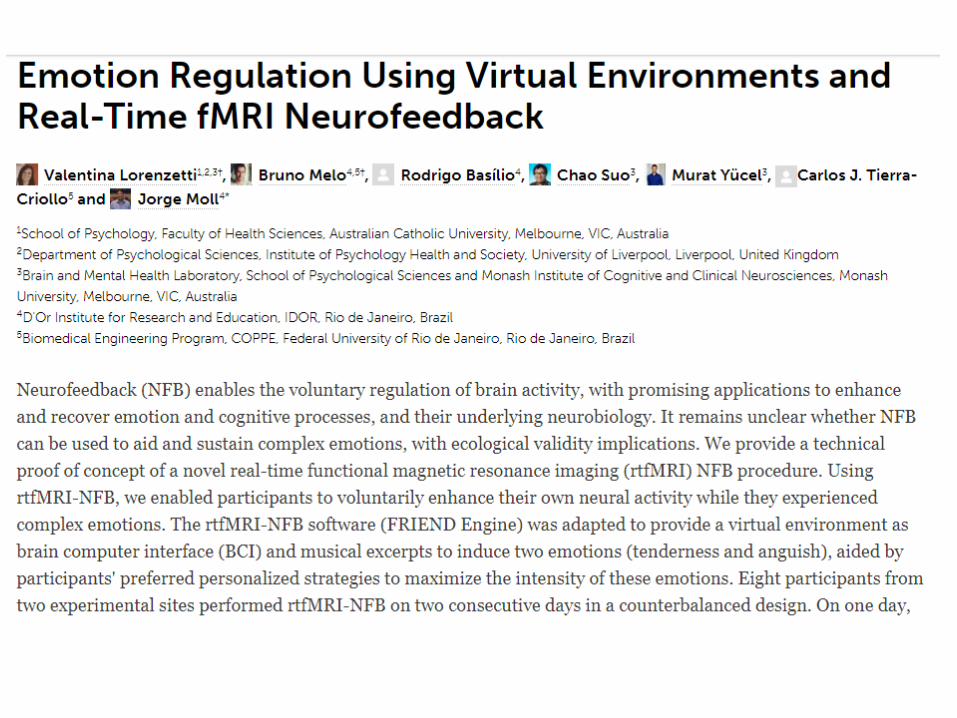
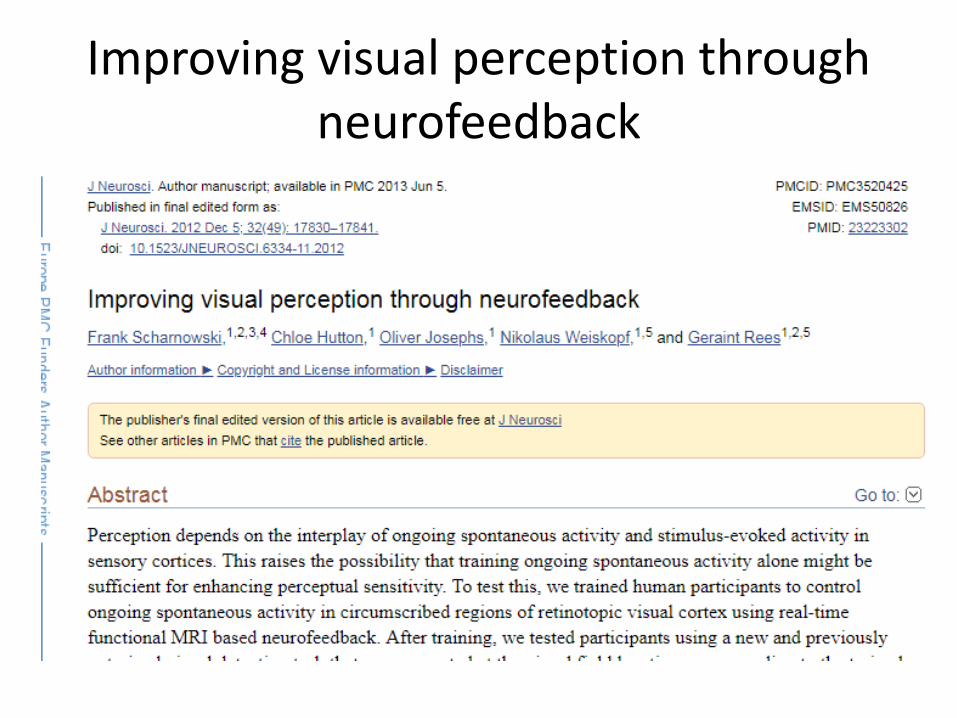
Improving visual perception through neurofeedback

Improve attention using NFB
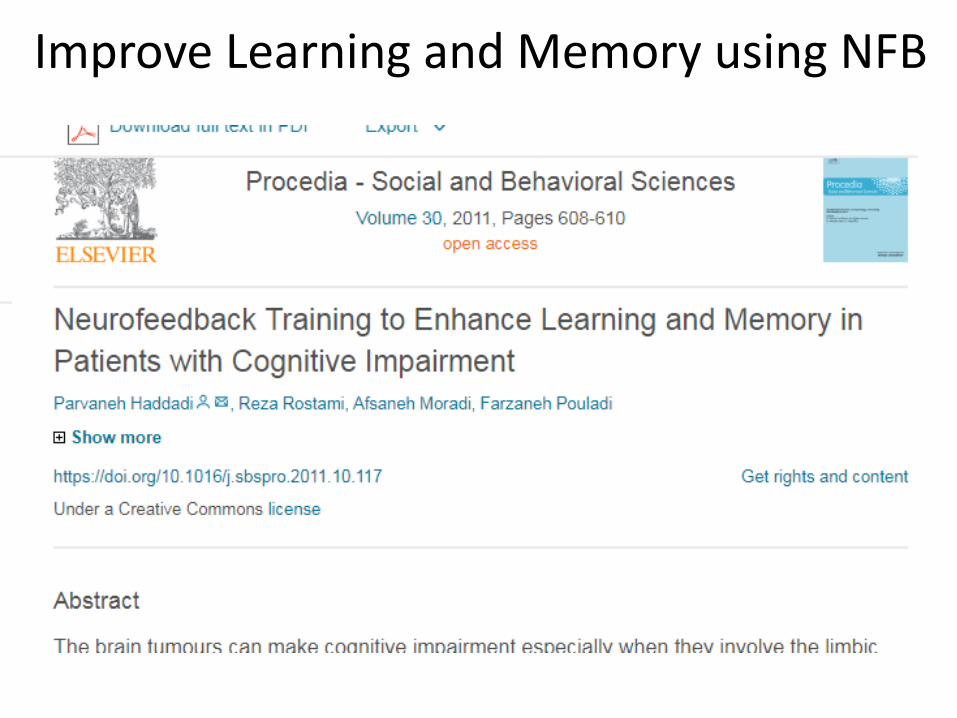
Improve Learning and Memory using NFB

Improve Working Memory using NFB
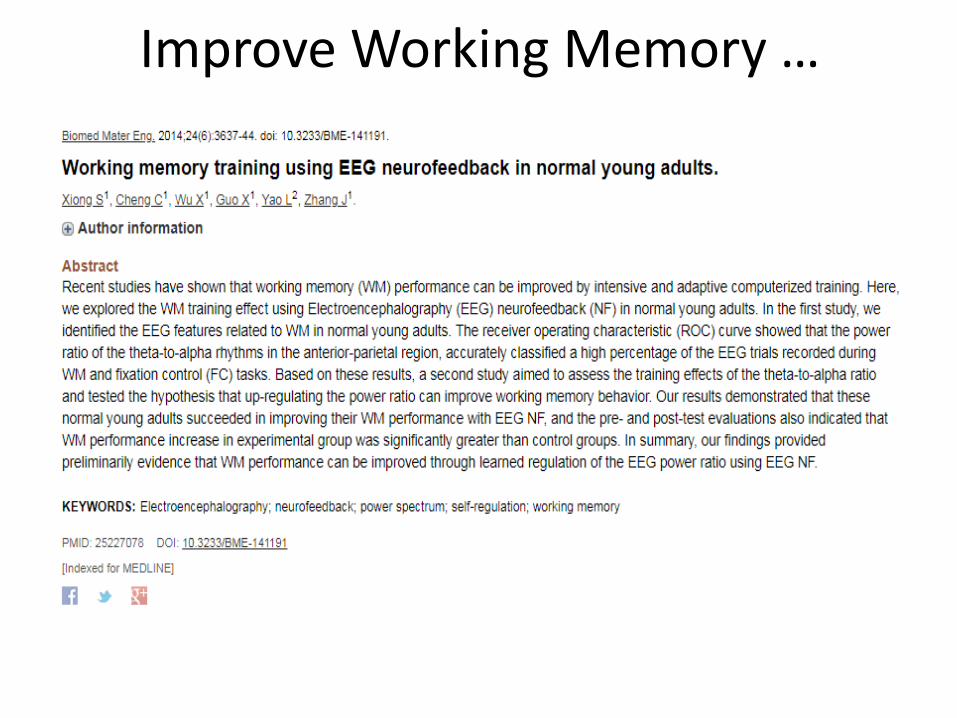
Improve Working Memory …
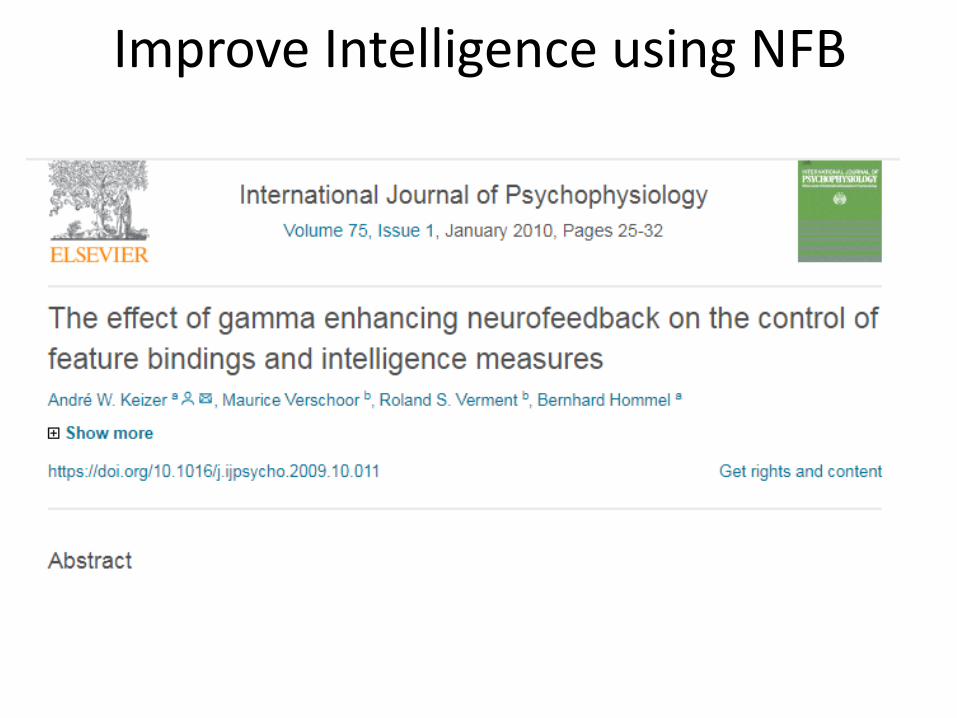
Improve Intelligence using NFB
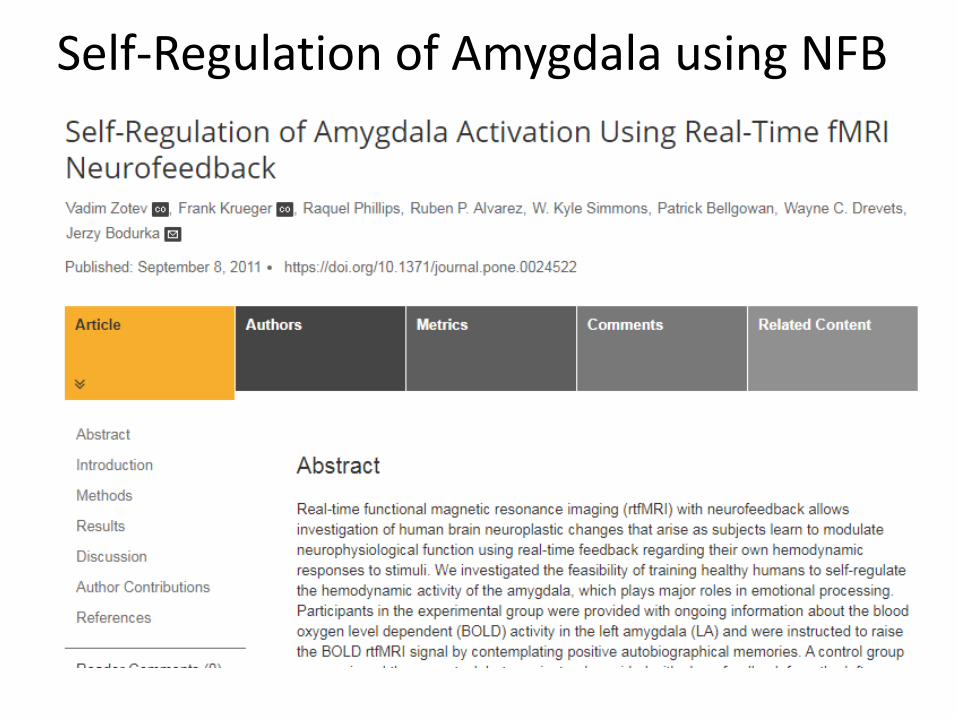
Self-Regulation of Amygdala using NFB

References
[1] T. W. K. Chang, Chen, N. S. Yu, P. T., "The effects of presentation method and information density on visual search ability and working memory load," Computers and Education, vol. 58, pp. 721-731, 2012.[2] A. D. Baddeley and G. Hitch, "Working memory," The psychology of learning and motivation, vol. 8, pp. 47-89, 1975.[3] A. D. Baddeley, R. J. Allen, and G. J. Hitch, "Binding in visual working memory: The role of the episodic buffer," Neuropsychologia, vol. 49, pp. 1393-1400, 2011.[4] M. C. Davidson, D. Amso, L. C. Anderson, and A. Diamond, "Development of cognitive control and executive functions from 4 to 13 years: Evidence from manipulations of memory, inhibition, and task switching," Neuropsychologia, vol. 44, pp. 2037-2078, 2006.[5] S. Tong and N. V. Thakor, Quantitative EEG analysis methods and clinical applications: Artech House, 2009.[6] T. a. F. Harmony, Thalıa. Silva, Juan. Bosch, Jorge. Valdés, Pedro. Fernández-Bouzas, Antonio. Galán, Lıdice. Aubert, Eduardo. Rodrıguez, Daniel, "Do specific EEG frequencies indicate different processes during mental calculation?," Neuroscience Letters, vol. 266, pp. 25-28, 1999.[7] W. Klimesch, "EEG alpha and theta oscillations reflect cognitive and memory performance: A review and analysis," Brain Research Reviews, vol. 29, pp. 169-195, 1999.[8] M. W. Grunwald, Thomas.Krause, Werner.Beyer, Lothar.Rost, Reinhard.Gutberlet, Ingmar.Gertz, Hermann-Josef, "Power of theta waves in the EEG of human subjects increases during recall of haptic information," Neuroscience Letters, vol. 260, pp. 189-192, 1999.[9] G. F. S. Wilson, Carolyne R. Ullsperger, Peter., "EEG power changes during a multiple level memory retention task," International Journal of Psychophysiology, vol. 32, pp. 107-118, 1999.[10] O. G. Jensen, J.Kounios, J.Lisman, J. E., "Oscillations in the alpha band (9-12 Hz) increase with memory load during retention in a short-term memory task," Cerebral Cortex, vol. 12, pp. 877-882, Aug 2002.

Factors
126
Sleep Caffeine Working Memory
Intelligence Exercise
Emotion
AttentionMulti-lingual
Recall or Testing
Rehearsal
Visual and Auditory
Combination

127
Improve Learning &
Memory
Improve Sleep
Improve Attention
Increase Exercise &
Reduce Toxins
Use 3D and VR Content
Incorporate Testing & Rehearsal
Learn New Language

Thank You
Email: [email protected]
AcknowledgementsNidal Kamel
Hafeezullah AminWajid Mumtaz
Raja Nur hamizah