factors affecting rate of reaction -...
TRANSCRIPT
Factors affecting rate of reaction What is the effect of the concentration of sodium thiosulphate (Na2S2O3) on the rate of reaction
with Hydrochloric Acid (HCl)?
Written by Muhammad Arif
Checked and assessed by Michael Ng
IB Diploma Chemistry Higher Level
MUHAMMAD ARIF BIN FAZIL 002206-015 2
Research question
What is the effect of the concentration of sodium thiosulphate (Na2S2O3) on the rate of reaction
with Hydrochloric Acid (HCl)?
Introduction
In this experiment, sodium thiosulphate (Na2S2O3) is the source of the thiosulphate ions,
and hydrochloric acid will be used as the source of hydrogen ions. The chemical reaction
between sodium thiosulphate and hydrochloric acid results in sulphur being precipitated slowly.
The equation is as below,
Sulfur dioxide is a gas at room temperature, but is very soluble in water. Sulfur is a water
insoluble solid. As a result, the solution first becomes cloudy and then opaque.
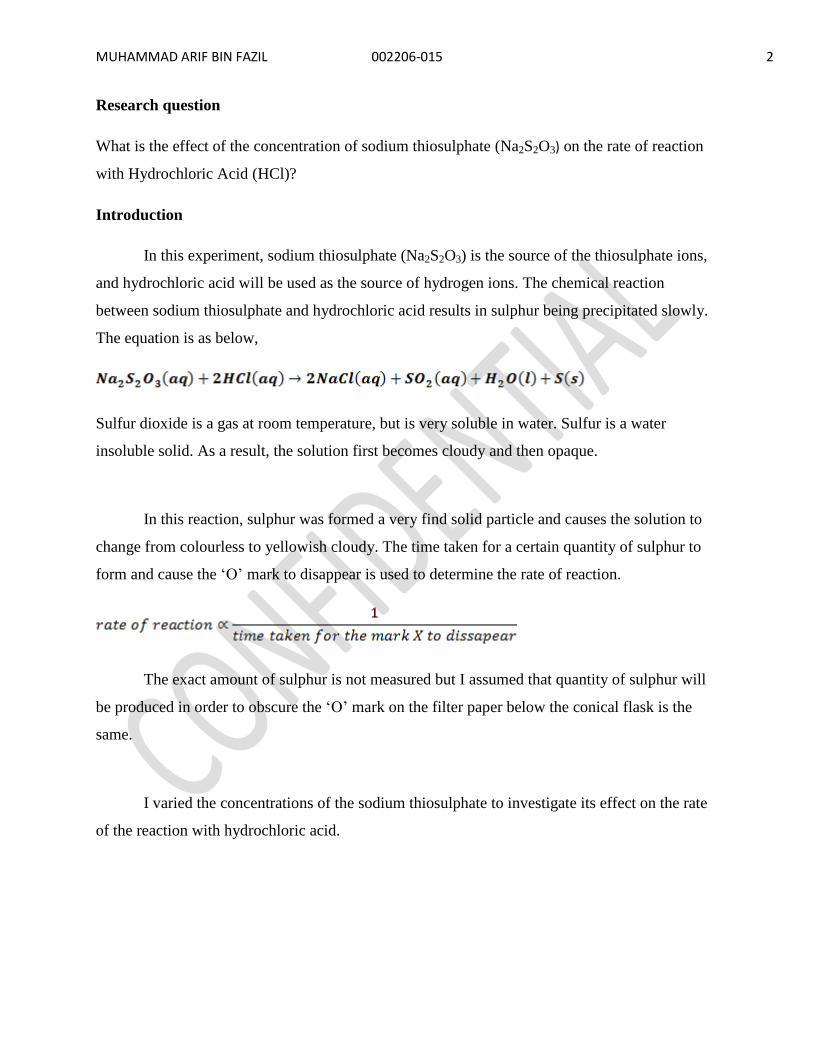
In this reaction, sulphur was formed a very find solid particle and causes the solution to
change from colourless to yellowish cloudy. The time taken for a certain quantity of sulphur to
form and cause the ‘O’ mark to disappear is used to determine the rate of reaction.
The exact amount of sulphur is not measured but I assumed that quantity of sulphur will
be produced in order to obscure the ‘O’ mark on the filter paper below the conical flask is the
same.
I varied the concentrations of the sodium thiosulphate to investigate its effect on the rate
of the reaction with hydrochloric acid.
MUHAMMAD ARIF BIN FAZIL 002206-015 3
Hypothesis
Increasing the concentration of the sodium thiosulphate means that there will be more
particles per dm3 of this substance.
The more particles that there are in the same volume, the closer to each other the particles
will be. This means that the particles collide more frequently with each other and the rate of the
reaction increases.
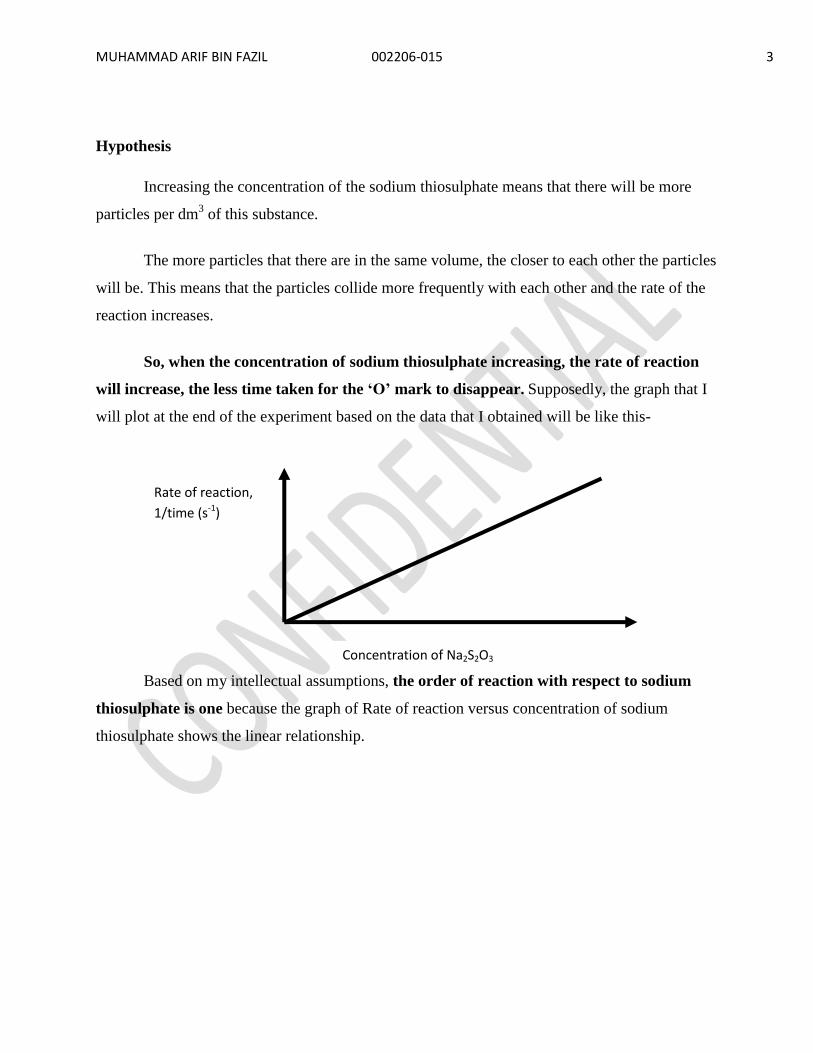
So, when the concentration of sodium thiosulphate increasing, the rate of reaction
will increase, the less time taken for the „O‟ mark to disappear. Supposedly, the graph that I
will plot at the end of the experiment based on the data that I obtained will be like this-
Based on my intellectual assumptions, the order of reaction with respect to sodium
thiosulphate is one because the graph of Rate of reaction versus concentration of sodium
thiosulphate shows the linear relationship.
Concentration of Na2S2O3
Rate of reaction,
1/time (s-1)
MUHAMMAD ARIF BIN FAZIL 002206-015 4
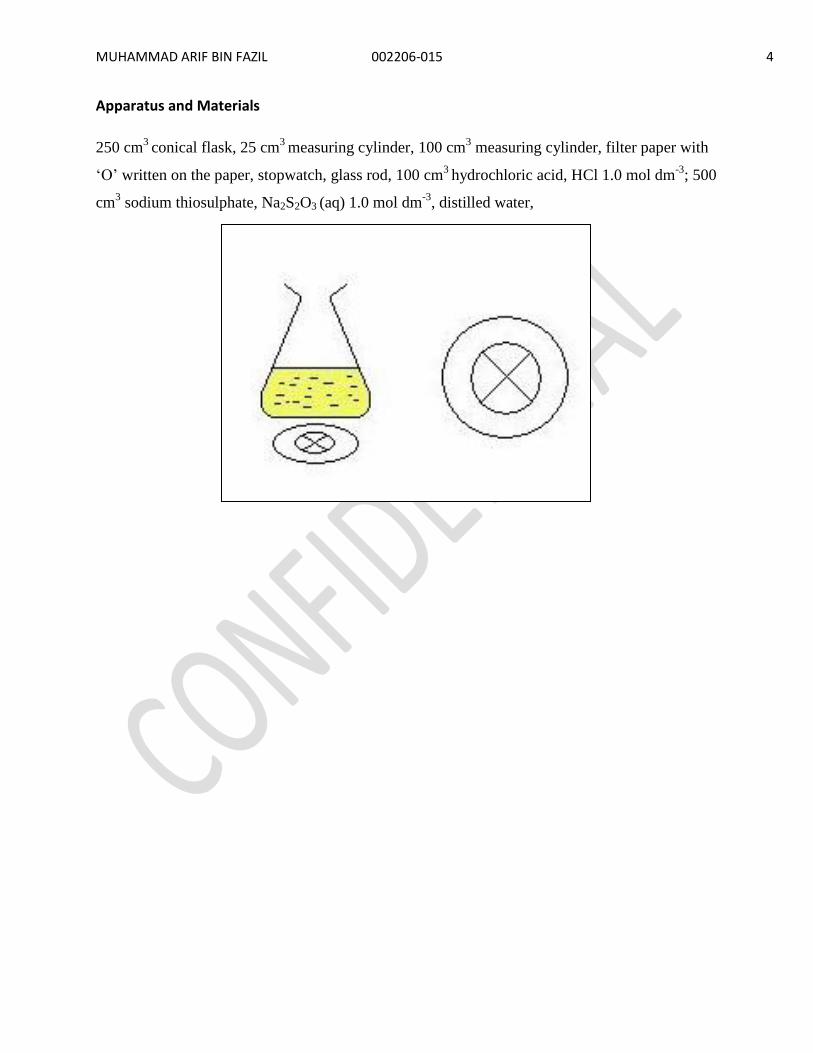
Apparatus and Materials
250 cm3
conical flask, 25 cm3
measuring cylinder, 100 cm3 measuring cylinder, filter paper with
‘O’ written on the paper, stopwatch, glass rod, 100 cm3
hydrochloric acid, HCl 1.0 mol dm-3
; 500
cm3 sodium thiosulphate, Na2S2O3 (aq) 1.0 mol dm
-3, distilled water,
MUHAMMAD ARIF BIN FAZIL 002206-015 5
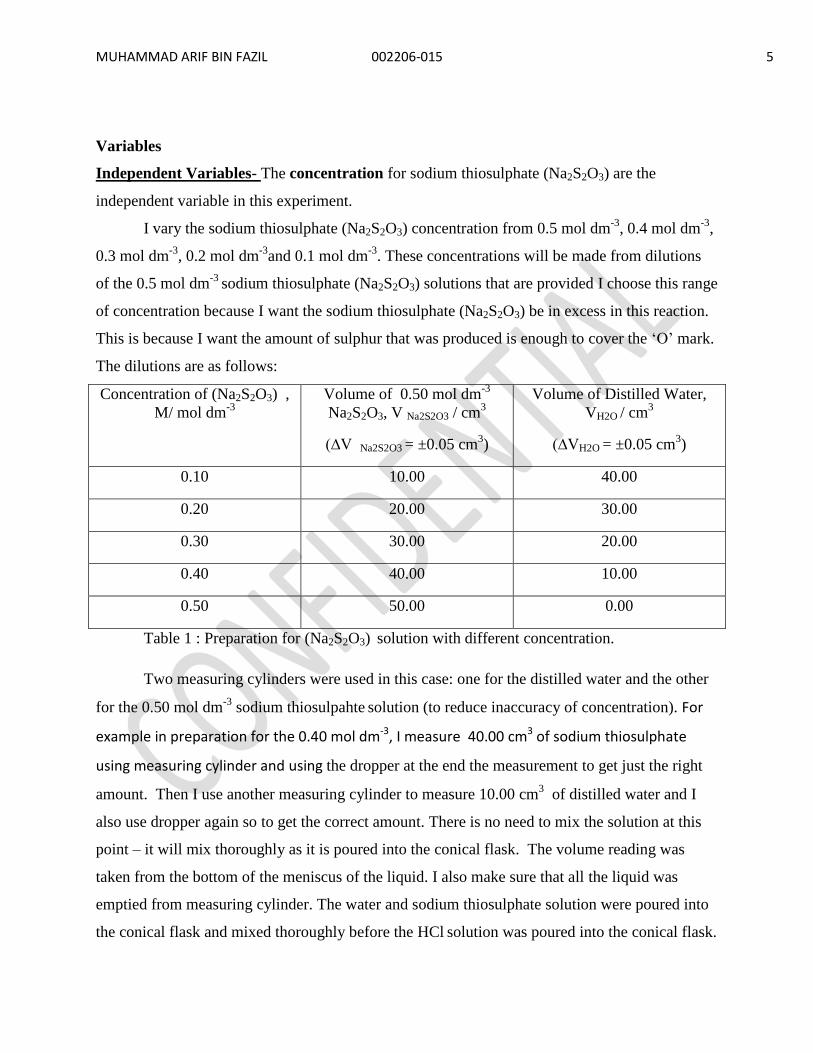
Variables
Independent Variables- The concentration for sodium thiosulphate (Na2S2O3) are the
independent variable in this experiment.
I vary the sodium thiosulphate (Na2S2O3) concentration from 0.5 mol dm-3
, 0.4 mol dm-3
,
0.3 mol dm-3
, 0.2 mol dm-3
and 0.1 mol dm-3
. These concentrations will be made from dilutions
of the 0.5 mol dm-3
sodium thiosulphate (Na2S2O3) solutions that are provided I choose this range
of concentration because I want the sodium thiosulphate (Na2S2O3) be in excess in this reaction.
This is because I want the amount of sulphur that was produced is enough to cover the ‘O’ mark.
The dilutions are as follows:
Concentration of (Na2S2O3) ,
M/ mol dm-3
Volume of 0.50 mol dm-3
Na2S2O3, V Na2S2O3 / cm3
(∆V Na2S2O3 = ±0.05 cm3)
Volume of Distilled Water,
VH2O / cm3
(∆VH2O = ±0.05 cm3)
0.10 10.00 40.00
0.20 20.00 30.00
0.30 30.00 20.00
0.40 40.00 10.00
0.50 50.00 0.00
Table 1 : Preparation for (Na2S2O3) solution with different concentration.
Two measuring cylinders were used in this case: one for the distilled water and the other
for the 0.50 mol dm-3
sodium thiosulpahte solution (to reduce inaccuracy of concentration). For
example in preparation for the 0.40 mol dm-3, I measure 40.00 cm3 of sodium thiosulphate
using measuring cylinder and using the dropper at the end the measurement to get just the right
amount. Then I use another measuring cylinder to measure 10.00 cm3 of distilled water and I
also use dropper again so to get the correct amount. There is no need to mix the solution at this
point – it will mix thoroughly as it is poured into the conical flask. The volume reading was
taken from the bottom of the meniscus of the liquid. I also make sure that all the liquid was
emptied from measuring cylinder. The water and sodium thiosulphate solution were poured into
the conical flask and mixed thoroughly before the HCl solution was poured into the conical flask.
MUHAMMAD ARIF BIN FAZIL 002206-015 6
Dependent Variable- Time taken for the „O‟ mark cannot be seen is the dependent variable
in this experiment.
I used digital stopwatch to take time for the ‘O’ mark cannot be seen. I will call this value
as time, t and it will measure in second, s. The time will start after I put the 10 cm3 of HCl in the
conical flask that have the sodium thiosulpate solution. After I started the stopwatch, I observed
the ‘O’ mark at the top of the conical flask mouth. Care was taken to ensure that my eyes were
parallel and straight with the ‘O’ mark. When the ‘O’ mark was completely cover by yellowish
solid and cannot be seen, I stop the stopwatch immediately and take the reading of the stopwatch
as time taken for the ‘O’ mark cannot be seen.
Time taken for the ‘O’ mark cannot be seen for each concentration was taken 2 times
and average of the three reading was calculated to improve accuracy. The rate of reaction for
different concentration on hydrochloric acid will been calculated by dividing 1 over the average
time taken for the ‘O’ mark cannot be seen.
MUHAMMAD ARIF BIN FAZIL 002206-015 7
Controlled Variable- The temperature of the reaction, volume and concentration of
hydrochloric acid, the size of the conical flask and the size of the „O‟ mark that been used in
this experiment are kept constant.
Temperature for this experiment was fixed by doing this experiment at the same place-
that is the school lab. It is important to ensure that the temperature is fixed because if the
temperature of the reaction were not constant, it will affect the rate of reaction.
In each of the reaction with sodium thiosulphate, I used10 cm3 of 1.0 mol dm
-3
hydrochloric acid. I measure the volume for each HCl that was been used in every reaction by
using measuring cylinder and dropper. The HCl solution was produced by the lab assistant, and
in this experiment, I can assume that the concentration is accurate 1.0 mol dm-3
because the
instrument that was been used to make this HCl are very accurate. There was a safety issue that
need be considered. If I choose a very high concentration for HCl, it is difficult to handle the
solution and it is very dangerous to do this experiment at school lab
I used the 250cm3 conical flask in every reaction to ensure that the size of the conical
flask is the same.
The size of the ‘O’ mark was fixed to be 5 cm diameter. It is to ensure that the same area
of ‘O’ mark is being used in each reaction.
All this factors are strictly controlled to ensure that my experiment is accurate.

MUHAMMAD ARIF BIN FAZIL 002206-015 8
Procedure
1. The apparatus was set up as shown in the diagram above.
2. 5cm x 5cm size of ‘O’ mark was drawn at a piece of filter paper.
3. 50 cm 3 sodium thiosulphate, Na2S2O3 1.0 mol dm
-3 was measured using a 50 cm
3 measuring
cylinder (using the dropper at the end to get just the right amount) and poured into a conical
flask. Care was taken to ensure that the volume were accurate with the burette reading taken
from the bottom meniscus. It also important to ensure that my eyes were parallel with the
meniscus to get accurate reading.
4. The conical flask was placed on top of a piece of filter paper with an X marked on the paper. It is
important to ensure that the ‘O’ mark is in the range of the conical flask bottom to ensure that
the sulphur that was produced will cover the ‘O’ mark.
5. 10 cm3
hydrochloric acid, HCl 1.0 mol dm-3
was measured by using measuring cylinder (using
the dropper at the end to get just the right amount) and immediately poured into the conical
flask. Care was taken to ensure that the volume were accurate with the burette reading taken
from the bottom meniscus. It also important to ensure that my eyes were parallel with the
meniscus to get accurate reading.
6. At the same time the stopwatch was started.
7. The mixture was stirred with a glass rod.
8. The mark ‘O’ was observed from above the solution as show in the diagram. A yellow
precipitate will slowly form at the base of the conical flask.
9. The stopwatch was stopped as soon as the ‘O’ mark was not seen. The time taken for the ‘O’
mark cannot be seen, t was recorded.
10. The mixture in the conical flask is poured into the sink and the conical flask was washed.
11. Step 1 to 10 was repeated one more times to get 2 sets of result reading for the time taken for
the ‘O’ mark cannot be seen. The average time taken for the ‘O’ mark cannot be seen was
calculated.
12. Step 1 until 11 was repeated by using different 6 volumes of sodium thiosulphate and distilled
water as shown in the Table 1 to vary the concentration to 0.40 mol dm-3, 0.3 mol dm
-3, 0.2 mol
dm-3
and 0.1 mol dm-3
.
MUHAMMAD ARIF BIN FAZIL 002206-015 9
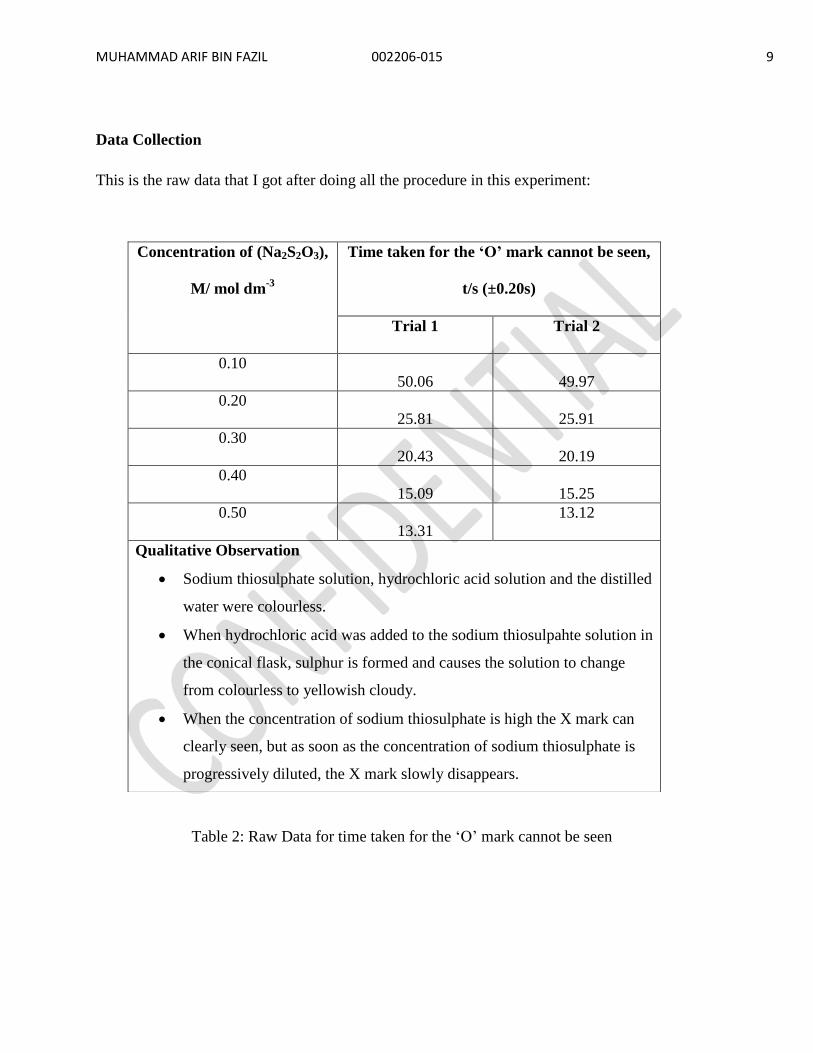
Data Collection
This is the raw data that I got after doing all the procedure in this experiment:
Table 2: Raw Data for time taken for the ‘O’ mark cannot be seen
Concentration of (Na2S2O3),
M/ mol dm-3
Time taken for the „O‟ mark cannot be seen,
t/s (±0.20s)
Trial 1 Trial 2
0.10
50.06 49.97
0.20
25.81 25.91
0.30
20.43 20.19
0.40
15.09 15.25
0.50
13.31
13.12
Qualitative Observation
Sodium thiosulphate solution, hydrochloric acid solution and the distilled
water were colourless.
When hydrochloric acid was added to the sodium thiosulpahte solution in
the conical flask, sulphur is formed and causes the solution to change
from colourless to yellowish cloudy.
When the concentration of sodium thiosulphate is high the X mark can
clearly seen, but as soon as the concentration of sodium thiosulphate is
progressively diluted, the X mark slowly disappears.
MUHAMMAD ARIF BIN FAZIL 002206-015 10
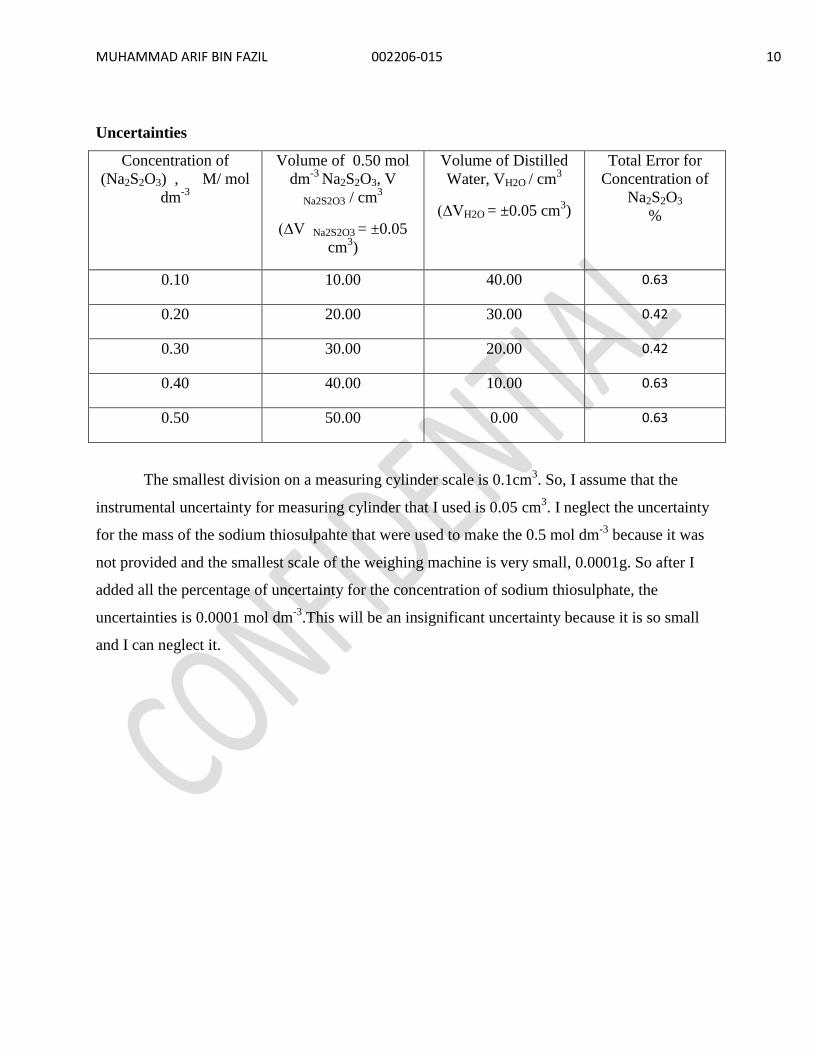
Uncertainties
Concentration of
(Na2S2O3) , M/ mol
dm-3
Volume of 0.50 mol
dm-3
Na2S2O3, V
Na2S2O3 / cm3
(∆V Na2S2O3 = ±0.05
cm3)
Volume of Distilled
Water, VH2O / cm3
(∆VH2O = ±0.05 cm3)
Total Error for
Concentration of
Na2S2O3
%
0.10 10.00 40.00 0.63
0.20 20.00 30.00 0.42
0.30 30.00 20.00 0.42
0.40 40.00 10.00 0.63
0.50 50.00 0.00 0.63
The smallest division on a measuring cylinder scale is 0.1cm3. So, I assume that the
instrumental uncertainty for measuring cylinder that I used is 0.05 cm3. I neglect the uncertainty
for the mass of the sodium thiosulpahte that were used to make the 0.5 mol dm-3
because it was
not provided and the smallest scale of the weighing machine is very small, 0.0001g. So after I
added all the percentage of uncertainty for the concentration of sodium thiosulphate, the
uncertainties is 0.0001 mol dm-3
.This will be an insignificant uncertainty because it is so small
and I can neglect it.
MUHAMMAD ARIF BIN FAZIL 002206-015 11
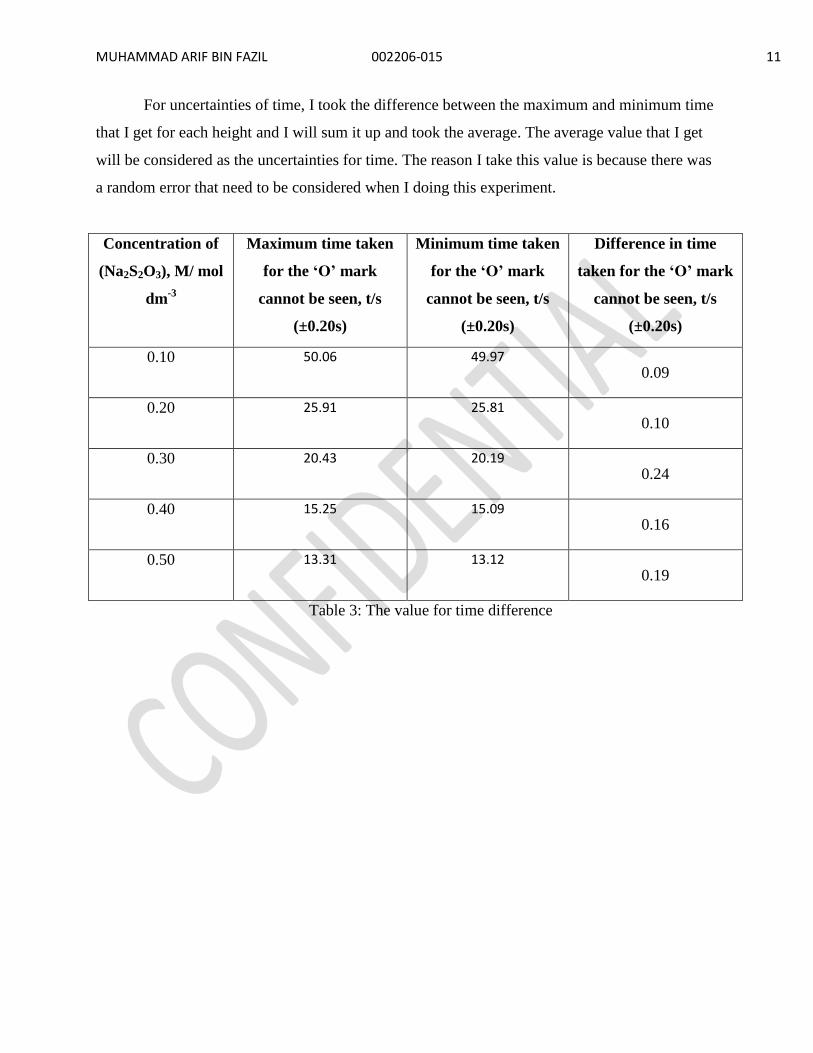
For uncertainties of time, I took the difference between the maximum and minimum time
that I get for each height and I will sum it up and took the average. The average value that I get
will be considered as the uncertainties for time. The reason I take this value is because there was
a random error that need to be considered when I doing this experiment.
Concentration of
(Na2S2O3), M/ mol
dm-3
Maximum time taken
for the „O‟ mark
cannot be seen, t/s
(±0.20s)
Minimum time taken
for the „O‟ mark
cannot be seen, t/s
(±0.20s)
Difference in time
taken for the „O‟ mark
cannot be seen, t/s
(±0.20s)
0.10 50.06 49.97 0.09
0.20 25.91 25.81 0.10
0.30 20.43 20.19 0.24
0.40 15.25 15.09 0.16
0.50 13.31 13.12 0.19
Table 3: The value for time difference

MUHAMMAD ARIF BIN FAZIL 002206-015 12
The total difference for all time taken for the ‘O’ mark cannot be seen is 0.78 s. The
average difference for time for each height is:
5
78.0
5
difference Total
s
difference average 0.16s
The average difference for time at each height is 0.16 second. So, I rounded it up to 0.20 second
and make it as the uncertainty for time. This value seems very reasonable because I consider the
random error that cause by human (that is me- maybe) and also the uncertainty for the instrument
(stopwatch) itself which is 0.1 second.
difference average
MUHAMMAD ARIF BIN FAZIL 002206-015 13
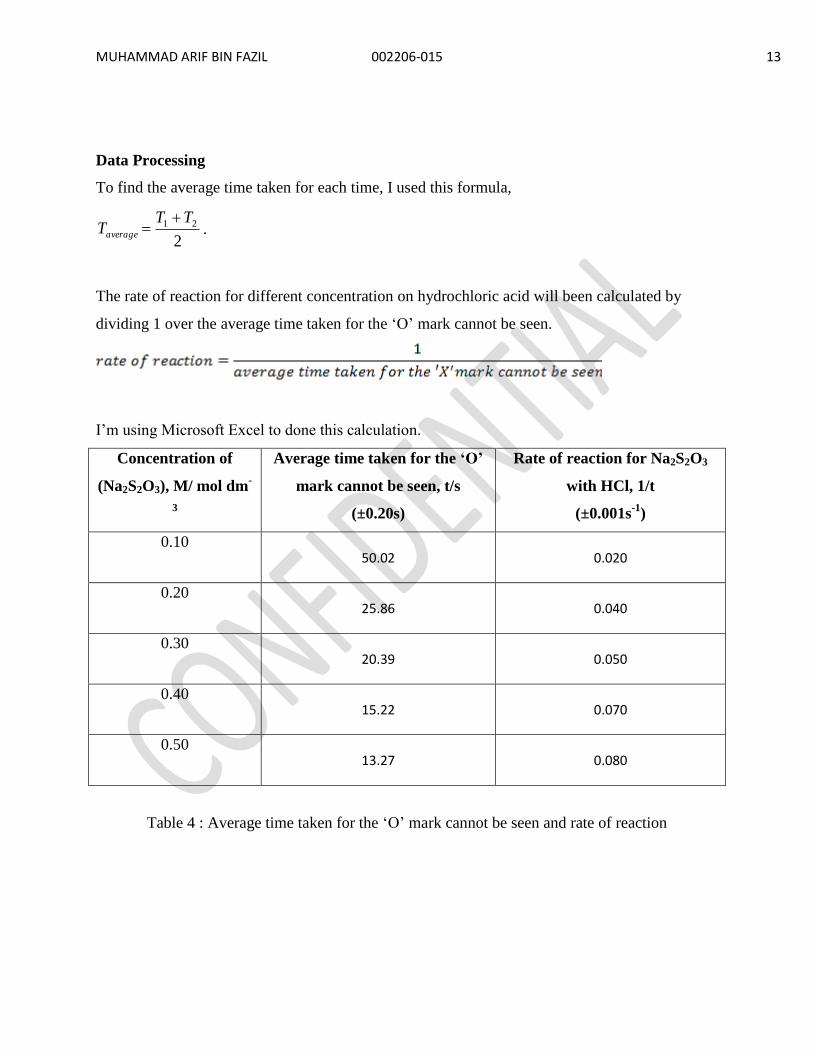
Data Processing
To find the average time taken for each time, I used this formula,
2
21 TTTaverage
.
The rate of reaction for different concentration on hydrochloric acid will been calculated by
dividing 1 over the average time taken for the ‘O’ mark cannot be seen.
I’m using Microsoft Excel to done this calculation.
Concentration of
(Na2S2O3), M/ mol dm-
3
Average time taken for the „O‟
mark cannot be seen, t/s
(±0.20s)
Rate of reaction for Na2S2O3
with HCl, 1/t
(±0.001s-1
)
0.10 50.02 0.020
0.20 25.86 0.040
0.30 20.39 0.050
0.40 15.22 0.070
0.50 13.27 0.080
Table 4 : Average time taken for the ‘O’ mark cannot be seen and rate of reaction
MUHAMMAD ARIF BIN FAZIL 002206-015 14
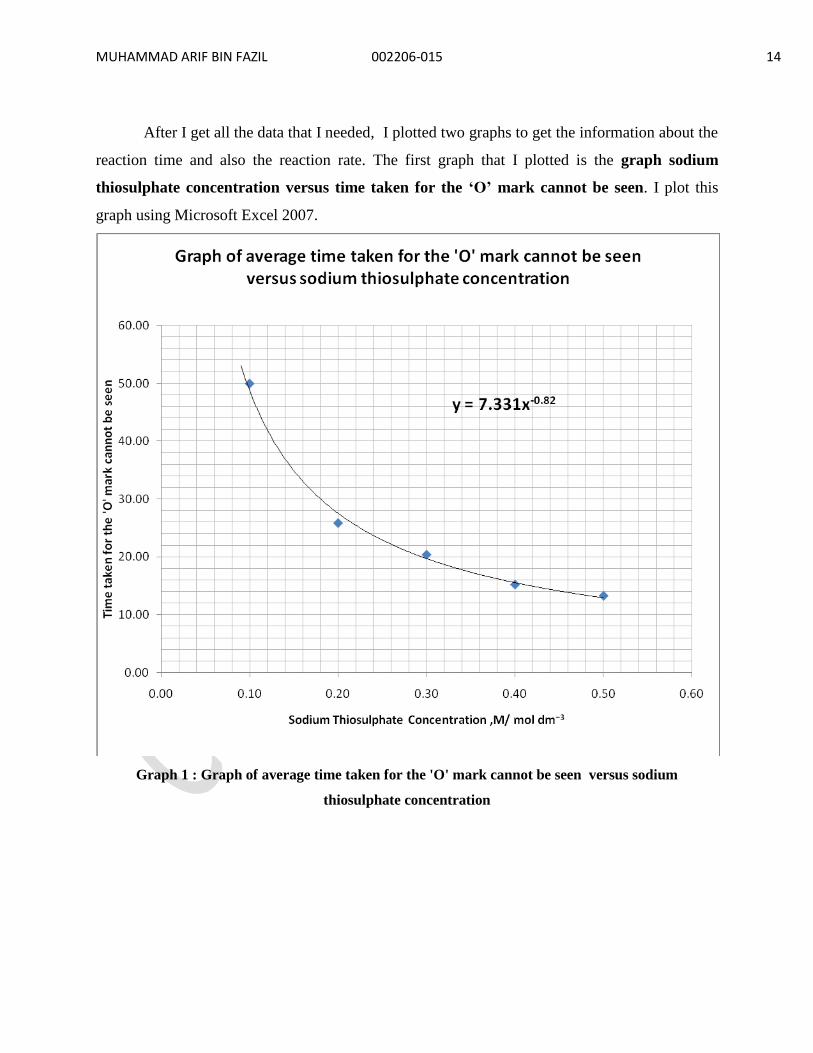
After I get all the data that I needed, I plotted two graphs to get the information about the
reaction time and also the reaction rate. The first graph that I plotted is the graph sodium
thiosulphate concentration versus time taken for the „O‟ mark cannot be seen. I plot this
graph using Microsoft Excel 2007.
Graph 1 : Graph of average time taken for the 'O' mark cannot be seen versus sodium
thiosulphate concentration
MUHAMMAD ARIF BIN FAZIL 002206-015 15
Analysis of Graph 1
Graph 1 is a curve graph where the gradient of the curve is steep at the beginning and
progressively becomes horizontal when the concentration is increasing.
Based on the Graph 1 that I plotted, when the concentration of sodium thiosulphate
lowered, the time taken for the ‘O’ mark cannot be seen will be longer. This means that the rate
of reaction is lower. Graph 1 show that the concentration is inversely proportional to average time
taken for the 'O' mark cannot be seen.
So, to get the straight line graph, I need to plot the graph of 1/time taken for the 'O' mark
cannot be seen versus concentration of sodium thiosulphate.
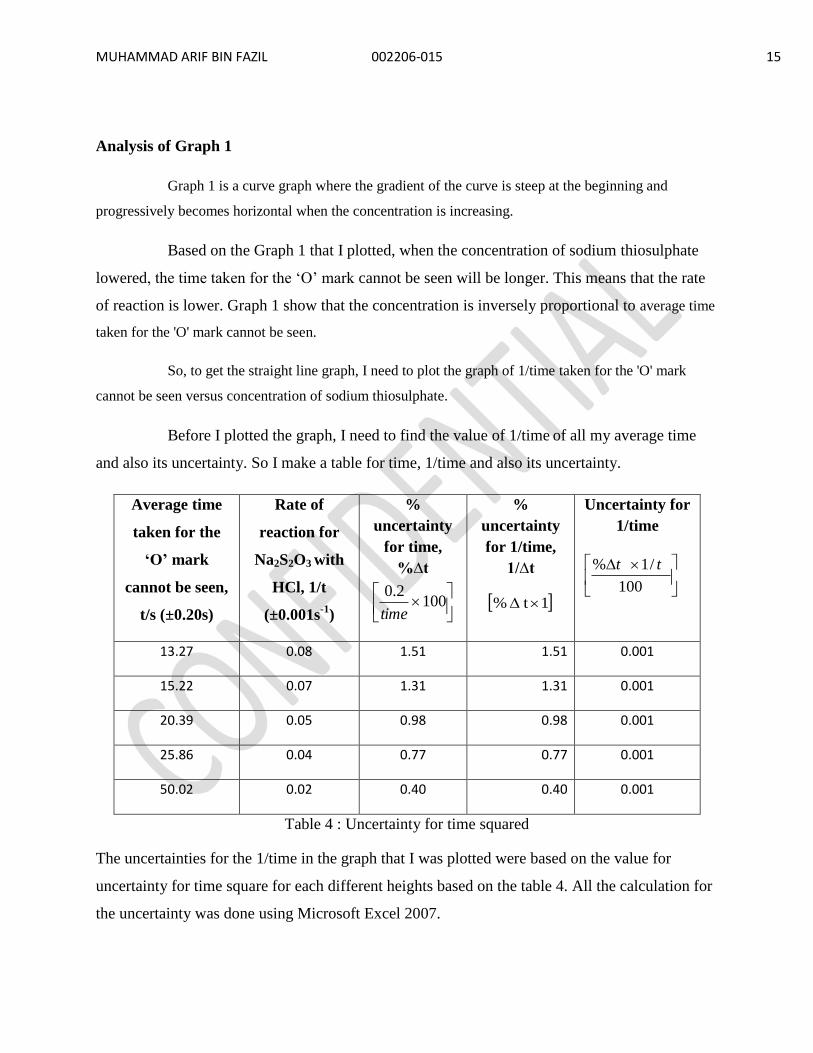
Before I plotted the graph, I need to find the value of 1/time of all my average time
and also its uncertainty. So I make a table for time, 1/time and also its uncertainty.
Average time
taken for the
„O‟ mark
cannot be seen,
t/s (±0.20s)
Rate of
reaction for
Na2S2O3 with
HCl, 1/t
(±0.001s-1
)
%
uncertainty
for time,
%∆t
100
2.0
time
%
uncertainty
for 1/time,
1/∆t
1 t %
Uncertainty for
1/time
100
/1% tt
13.27 0.08 1.51 1.51 0.001
15.22 0.07 1.31 1.31 0.001
20.39 0.05 0.98 0.98 0.001
25.86 0.04 0.77 0.77 0.001
50.02 0.02 0.40 0.40 0.001
Table 4 : Uncertainty for time squared
The uncertainties for the 1/time in the graph that I was plotted were based on the value for
uncertainty for time square for each different heights based on the table 4. All the calculation for
the uncertainty was done using Microsoft Excel 2007.
MUHAMMAD ARIF BIN FAZIL 002206-015 16
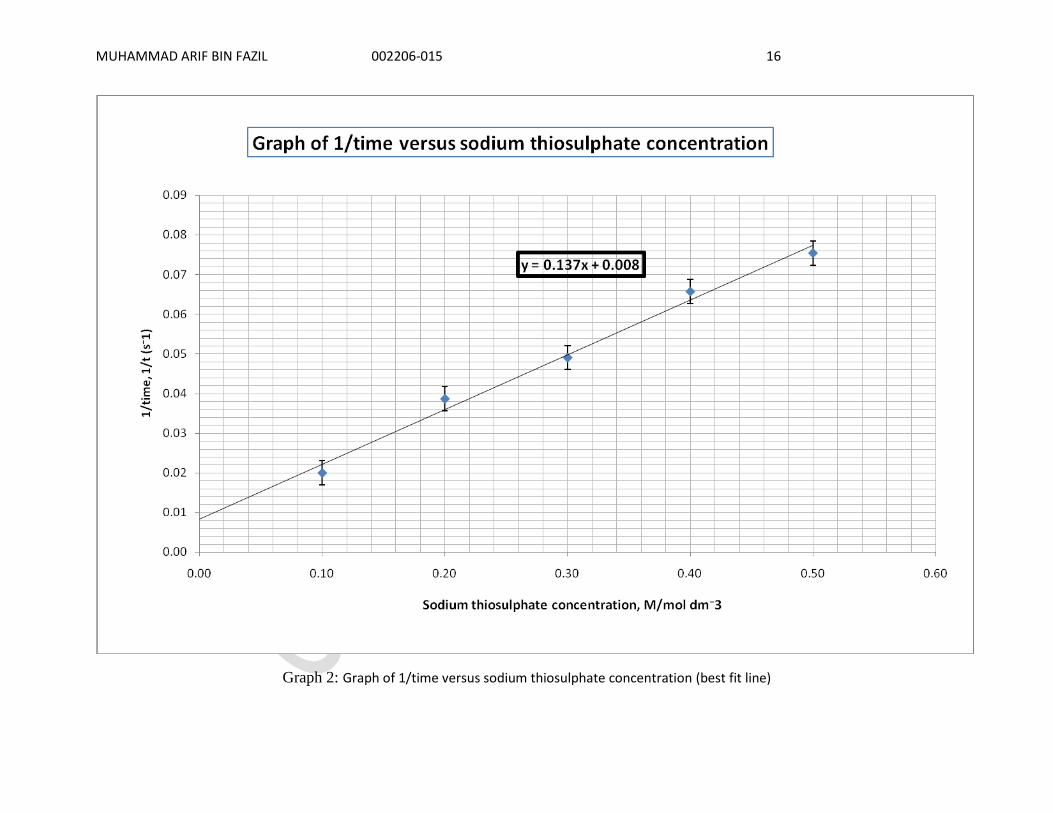
Graph 2: Graph of 1/time versus sodium thiosulphate concentration (best fit line)
MUHAMMAD ARIF BIN FAZIL 002206-015 17
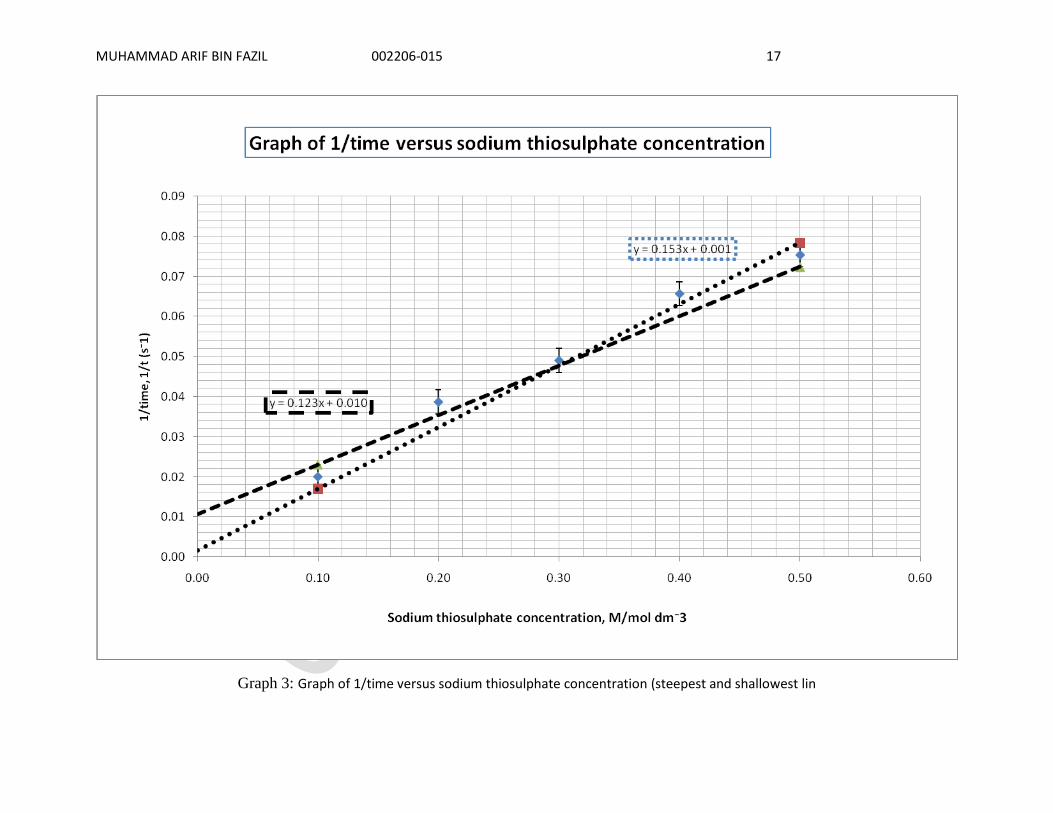
Graph 3: Graph of 1/time versus sodium thiosulphate concentration (steepest and shallowest lin
MUHAMMAD ARIF BIN FAZIL 002206-015 18
Analysis of Graph 2 and 3
From the best fit line graph (Graph 2) that I plotted using Microsoft Excel 2007, I can
see that the best fit line did not touch the origin. I suspect that there must be some mistake about
my graph equation, but after I consider the uncertainty and plotted the steepest and shallowest
line based on the uncertainty (Graph 3), the line was still above in the range origin. So, I
suspected that there must be some systematic errors that shift the graph up 0.008 units. I will
discuss the systematic error in the evaluation part.
Almost all the point that I have plotted for the best fit line also touches the line. It shows
that the correlation for my graph is almost to 1.
Graph 2 is a straight line where the concentration of sodium thiosulphate is proportional
to the rate of reaction( This also indicate that the order of reaction respect to sodium
thiosulphate is one.

MUHAMMAD ARIF BIN FAZIL 002206-015 19
CONCLUSION
The aim for this investigation is to investigate what is the effect of the concentration of
sodium thiosulphate (Na2S2O3) on the rate of reaction with Hydrochloric Acid (HCl). In my
hypothesis statement, I stated “when the concentration of sodium thiosulphate increasing, the
rate of reaction will increase, the less time taken for the „O‟ mark to disappear.” For this
statement, my hypothesis is proven true because when I plotted the graph of rate of reaction
versus concentration of sodium thiosulphate, the time will decrease when the concentration was
increased. The second statement in my hypothesis stated that when I plotted the graph of rate of
reaction versus concentration of sodium thiosulphate, “it will be directly proportional” is
proven true because the relationship was linear because the graph shows a straight line. I
conclude that it is directly proportional because when I consider the uncertainty for the best fit
line and also 0.008 shift form systematic error, it includes the origin. Based on my hypothesis,
“the order of reaction with respect to sodium thiosulphate is one”. This statement also was
proven true because based on the graph 2 that I plotted, it is a straight line where the
concentration of sodium thiosulphate is proportional to the rate of reaction(
Nevertheless, the aim for this experiment is to find what is the effect of the concentration
of sodium thiosulphate (Na2S2O3) on the rate of reaction with Hydrochloric Acid (HCl). And I
have found it- the order of reaction with respect to sodium thiosulphate is one. It is a great
success for me to find this relationship.

MUHAMMAD ARIF BIN FAZIL 002206-015 20
EVALUATION AND WAY OF IMPROVEMENT
There were some problems when I was doing this experiment and these errors have produced a
huge percentage of uncertainty in my experiment.
1. I suspect that there was systematic errors occur in this experiment because the best fit line
graph was shifted to 0.008. This condition occur maybe because the ‘O’ mark that I used
is big in size and this leads to more time taken for the ‘O’ mark to disappear when
hydrochloric acid was added to sodium thiosulphate. In the future experiment, I should
use a more suitable size of ‘O’ mark that can really suit with the base of the conical flask.
2. When I stirred the sodium thiosulphate and hydrochloric solution in the conical flask with
the glass rod, the rate and number of stirring is not constant and it affects the time taken
for the ‘O’ mark cannot be seen. In the future experiment, maybe I can use magnetic
stirrer to make my stirring process become constant.
3. It was also hard for me to observe when the ‘O’ mark completely cannot be seen. A light
sensor could be used in this experiment to measure the penetration of light that pass
through the solution. It would be more accurate this way because I can really observe
when the sulphur is formed and cover the entire conical flask base.
4. Due to the time factors, I only can do two trials for each of the sodium thiosulphate
solutions. So, in the future experiment, I can do more trials to get more results to
eliminate the random errors.