factors affecting sorption of organic compounds in natural ... · compounds are collected. the...
TRANSCRIPT
Factors Affecting Sorption of Organic Compounds in Natural Sorbent ÕWater Systems and Sorption Coefficients for Selected Pollutants. A Review
Alessandro Delle Site a…
ENEA, Environmental Department, AMB-TEIN, Via Anguillarese 301, 00060 Rome, Italy
~Received 11 August 1999; revised manuscript received 25 October 2000!
Factors affecting sorption of organic pollutants by natural sorbents~soils, sediments,clays, humic materials, and dissolved organic matters! and sorption coefficients for se-lected pollutants are reviewed on the basis of the literature results and interpretations;with 681 references examined. The most significant aspects of the sorption process arediscussed: sorption isotherms and sorption kinetics; effects of sorbent physico-chemicalcharacteristics~pH, cation exchange capacity, ionic strength, surface area, etc.!; effect ofthe temperature; sorption of volatile compounds; effect of the presence of a cosolvent;association with dissolved organic matter; effect of the sorbent concentration; ‘‘hyster-esis’’ or nonsingularity in the sorption–desorption process, and its implications in thetransport of these contaminants through soil columns. The experimental and predictionmethods adopted for the determination and estimation of the sorption coefficients are alsodescribed. Literature sorption coefficients for selected hydrophobic, polar, and ionizablecompounds are collected. The compounds taken into consideration belong to the follow-ing classes: monoaromatic hydrocarbons, polycyclic aromatic hydrocarbons, chlorinatedalkyl and aryl compounds, phenol and chlorinated phenols, polychlorobiphenyls, dioxins,and pesticides. The respective sorption coefficients (logKd) and organic carbon-referenced sorption coefficients (logKoc) are tabulated together with the most relevantcharacteristics of the respective sorbent, the measurement temperature, and the experi-mental methods. The logKoc values are averaged and compared with other experimentaland estimated literature data. Differences of sorption coefficients on soils and sedimentsand effect of pH on sorption coefficients for ionizable compounds are evidentiated.© 2001 American Institute of Physics.
Key words: halogenated alkyl hydrocarbons; halogenated benzenes; chlorinated biphenyls; chlorinateddioxins; chlorinated phenols; critical review; monoaromatic hydrocarbons; pesticides; polyaromatichydrocarbons; sorption coefficients.
8
4
3
Contents
1. Introduction . . . . . . . . . . . . . . . . . . . . . . . . . . . . . . . 182. Sorption Isotherms and Sorption Coefficients . . . .. 1893. Sorption Kinetics . . .. . . . . . . . . . . . . . . . . . . . . . . . 1924. Factors Affecting Sorption of Organic
Compounds . . . . . . . . . . . . . . . . . . . . . . . . . . . . . . . 194.1. Nonpolar Compounds . . . . . . . . . . . . . . . . . . . 1944.2. Polar and Ionizable Compounds . . .. . . . . . . . 1994.3. Volatile Compounds . . . .. . . . . . . . . . . . . . . . . 209
5. Temperature Effect . . . . . . . . . . . . . . . . . . . . . . . . . 2136. Binding to Dissolved Organic Matter . . . . . . . . . . 2167. Cosolvent Effect . . . . . . . . . . . . . . . . . . . . . . . . . . . 2208. Effect of Sorbent Concentration or ‘‘Solids
Effect’’ . . . . . . . . . . . . . . . . . . . . . . . . . . . . . . . . . . . 229. Desorption and Nonsingularity in Sorption–
Desorption Process . . . . . . . . . . . . . . . . . . . . . . . . . 224
a!Electronic mail: [email protected]© 2001 American Institute of Physics.
0047-2689Õ2001Õ30„1…Õ187Õ253Õ$35.00 187
10. Interpretation of ‘‘Solids Effect’’ andNonsingularity in Sorption–DesorptionProcess . . .. . . . . . . . . . . . . . . . . . . . . . . . . . . . . . . . 227
11. Experimental Methods for the Determination ofSorption Coefficients . . .. . . . . . . . . . . . . . . . . . . . . 232
11.1. Batch Equilibration~BE! . . . . . . . . . . . . . . 23211.2. Equilibrium Head Space~HS! . . . . . . . . . . 23411.3. Leaching Equilibration~LE! . . . . . . . . . . . . 23611.4. Miscible Displacement~MD! . . . . . . . . . . . 23611.5. Diffusion~DF! . . . . . . . . . . . . . . . . . . . . . . . 23711.6. Gas Purge~GP! . . . . . . . . . . . . . . . . . . . . . . 23711.7. Flow Equilibration~FE! . . . . . . . . . . . . . . . 23911.8. Field Measurement~FM! . . . . . . . . . . . . . . 23911.9. Batch Equilibration and Ultrafiltration
~BU! . . . . . . . . . . . . . . . . . . . . . . . . . . . . . . . 24011.10. Fluorescence Quenching~FQ! . . . . . . . . . . 24011.11. Equilibrium Dialysis~ED! . . . . . . . . . . . . . 24011.12. Reversed-Phase Separation~RS! . . . . . . . . 24011.13. Solubility Enhancement~SE! . . . . . . . . . . . 24111.14. Adsorption on the Glass~AG! . . . . . . . . . . 24111.15. Humic Acid Titration~HT! . . . . . . . . . . . . . 241
J. Phys. Chem. Ref. Data, Vol. 30, No. 1, 2001
1
2
28
3
2
6
0
4
4
fateel-therioushisro-re-onant
n,n-ity-st,
en-rp-or-
ebe
and
-af-of a-ionl ass
l
andnds
r-or-on
188188 DELLE SITE
12. Prediction Methods for the Evaluation ofSorption Coefficients . . .. . . . . . . . . . . . . . . . . . . . . 241
12.1. Correlations with Octanol/Water PartitionCoefficients . . . . . . . . . . . . . . . . . . . . . . . . . 241
12.2. Correlations with Water Solubility . . . . . . . 24312.3. Correlations with Capacity Factors in
RPLC . . .. . . . . . . . . . . . . . . . . . . . . . . . . . . 24612.4. Correlations with Molecular
Descriptors . . .. . . . . . . . . . . . . . . . . . . . . . . 24812.5. Prediction Based on Linear Solvation
Energy Relationship~LSER! . . . . . . . . . . . 25112.6. Prediction from Vapor Sorption~LSC! . . .
. . . . . . . . . . . . . . . . . . . . . . . . . . . . . . . . . . . 2512.7. Prediction by Flory–Huggins Model
~FH! . . . . . . . . . . . . . . . . . . . . . . . . . . . . . . . 25213. Analysis of the Data and Comments . . .. . . . . . . . 252
13.1. Data Collection and Effects of theExperimental Procedure . . . . . . . . . . . . . . . 252
13.2. Effects of Sorbent Properties on SorptionCoefficients . . . . . . . . . . . . . . . . . . . . . . . . . 410
13.3. Comments on Prediction Methods . . .. . . . 43114. Acknowledgment . . . . . . . . . . . . . . . . . . . . . . . . . . . 43115. Nomenclature . . .. . . . . . . . . . . . . . . . . . . . . . . . . . . 43116. References . . . . . . . . . . . . . . . . . . . . . . . . . . . . . . . . 43
List of Tables1. Sorption coefficients for monoaromatic
hydrocarbons. . . . . . . . . . . . . . . . . . . . . . . . . . . . . . . 2532. Sorption coefficients for polyaromatic
hydrocarbons~PAHs!. . . . . . . . . . . . . . . . . . . . . . . . 2613. Sorption coefficients for halogenated alkyl
hydrocarbons. . . . . . . . . . . . . . . . . . . . . . . . . . . . . . . 2724. Sorption coefficients for halogenated benzenes. . .5. Sorption coefficients for phenol and substituted
phenols. . . . . . . . . . . . . . . . . . . . . . . . . . . . . . . . . . . 296. Sorption coefficients for polychlorobiphenyls
~PCBs!. . . . . . . . . . . . . . . . . . . . . . . . . . . . . . . . . . . . 307. Sorption coefficients for
polychlorodibenzo-p-dioxins~PCDDS!. . . . . . . . . . 3178. Sorption coefficients for pesticides.. . . . . . . . . . . . 3199. Sorption coefficients for miscellaneous
compounds. . . . . . . . . . . . . . . . . . . . . . . . . . . . . . . . 4010. Comparison of sorption data on soils obtained
by batch equilibration and miscible displacementtechnique. . . . . . . . . . . . . . . . . . . . . . . . . . . . . . . . . . 41
11. Correlation coefficients~r! between averageKd
values and four soil or sediment properties. . . . . . 41212. Correlation coefficients~r! between logKoc
values and pH for some acidic and basiccompounds. . . . . . . . . . . . . . . . . . . . . . . . . . . . . . . . 41
13. Average logKoc data as a function of sorbenttype and organic carbon content. . . . . . . . . . . . . . . 415
14. Comparison between average logKoc values forsoils and sediments (OC>0.5%).. . . . . . . . . . . . . . 421
15. Comparison between averageKoc values forsoils and sediments and other literature averages..
J. Phys. Chem. Ref. Data, Vol. 30, No. 1, 2001
1
22
16. Comparison between averageKoc values forsoils and sediments (OC>0.5%) andprediction data. . . . . . . . . . . . . . . . . . . . . . . . . . . . . 425
List of Figures1. Typical isotherms describing sorption of organic
compounds in water and vapor phase~BET! bynatural sorbents. . . . . . . . . . . . . . . . . . . . . . . . . . . . . 191
2. Plot of the error factor as the ratio betweenFreundlich and linear isotherms as a functionof solution concentration~after Rao andDavidson87!. . . . . . . . . . . . . . . . . . . . . . . . . . . . . . . . 192
1. Introduction
Accurate procedures for estimating the behavior andof chemical pollutants in the environment have been devoped in the last tens of years. The interest is justified byawareness that chemical substances may constitute serisks for the health of man and other living organisms. Tis the reason why organizations like the Environmental Ptection Agency and the U.S. Department of Agriculturequire, for the registration of new chemicals, informationtheir environmental behavior and have published relevtest guidelines as those for pesticides.1–3
The prediction of transport, distribution, accumulatioand fate of a chemical is possible with the use of enviromental models,4–6 as those based on the concept of fugacproposed by Mackay.7–9 They require a number of equilibrium parameters characteristic of the chemical of interewhich are essentially water solubility, vapor pressure, Hry’s law constant, octanol/water partition coefficient, adsotion coefficient and bioconcentration factor. Rate of transfmation ~chemical, biochemical and photochemical! shouldalso be taken into consideration.10 Such parameters can bobtained with a series of experimental methods or canestimated using prediction methods.11 Their values for alarge number of organic pollutants have been collectedare available in the literature.12–17
The persistence of organic pollutants in topsoil,18,19 theirmigration to groundwater,20–22 and the evaluation of the degree of contamination expected in a groundwater systemter an accidental spill or as consequence of the presencewaste disposal site,23–25 are problems of particular environmental concern which require the knowledge of the sorptcharacteristics of the pollutants to be investigated as welthe knowledge of the type of soil and of itcharacteristics.26–28Sorption also affects volatility of organicpollutants,29–34 their bioavailability and bioactivity,35,36
phytotoxicity,37–44 and chemical or microbiatransformations.33,45–48
In an aquatic system, the residence time of a pollutantits distribution between water, sediments, and biota depeon its capacity to bound to suspended particles49 and accu-mulate in sediments. Thus, the affinity of hydrophobic oganic compounds for biotic and abiotic phases is an imptant determinant of both the rate of a lake’s detoxificati

e
stthtivenictu
th
oa
usluvteseeu-o
ctheerth
lutio-w
io
d–s
ed
alati-heu
mls
ren
iontione
ntsizecity,ralor
ate.re-of
l-llyg inD
eale.is-nt.nione-
ys.
sur-h-
-ate
onnt
thes ainfteneny athe
onlowiso-terill
189189SORPTION OF ORGANIC COMPOUNDS
and its response time to changing loadings.50 Pesticide–sediment–water interactions occurring within a watershand the associated aquatic system have been reviewed.51
The sorption of an organic chemical on a natural solid ivery complicated process,52,53 which involves many sorbenproperties, besides the physico-chemical properties ofchemical itself. These properties are especially the relaamount of the mineral and organic material in soil/sedimand their respective composition with associated physcharacteristics.28 Also, different regions of a soil or sedimenmatrix may contain different types, amounts, and distribtions of surfaces and of soil organic material, even atparticle scale.54
In this paper many studies regarding the distributionorganic chemicals between natural sorbent and water hbeen reviewed with the aim of examining the variophysico-chemical aspects of the sorption process. The vaof sorption coefficients available from the literature for seeral significant organic pollutants have also been collectogether with the most relevant experimental conditions ufor their measurement. An analysis of these data has bcarried out to get information on their variability and accracy. Differences between sorption on soils and sorptionsediments have also been examined as well as the effepH in sorption of ionizable compounds. A comparison of tdata obtained by prediction methods with average expmental data collected in this work allowed to evaluatereliability of those methods.
2. Sorption Isotherms and SorptionCoefficients
The sorption of a chemical on a solid from a water sotion may be seen as the result of a reversible reac~sorption–desorption! which reaches a final equilibrium condition between the concentration of the chemical in the tphases.
Often terms like ‘‘sorptive,’’ ‘‘sorbate,’’ and ‘‘sorbent’’are used to refer, in the order, to the free solute in solutsolute which undergo sorption by solid material~soil, sedi-ment, etc.!, and the sorbing phase. The interaction solisolute may be generally termed ‘‘sorption,’’ while the term‘‘adsorption’’ and ‘‘absorption’’ can be differentiated by thdegree to which the sorbate molecule interacts with anfree to migrate between the sorbent phase.28 Chiou55 sug-gested the term ‘‘partition’’ for the distribution of a chemicbetween the organic fraction of the sorbent and the wphase, while ‘‘adsorption’’ for the interaction of the chemcal with the sorbent mineral fraction. However, often tsorption process is indicated in the literature with varioterms like ‘‘sorption,’’ ‘‘adsorption,’’ or ‘‘partition’’ withouttaking into account the mechanism involved, and the sahappens with the sorption coefficient, which is indicated aas ‘‘adsorption coefficient,’’ ‘‘partition coefficient,’’ or ‘‘dis-tribution coefficient.’’
To have reliable and reproducible data, sorption testsquire an initial accurate preparation of the soil/sedim
d
a
eet
al
-e
fve
es-dden
nof
i-e
-n
o
n,
is
er
s
eo
e-t
sample including sieving, homogenization and sterilizatprocedure; the latter is used to avoid microbial degradaof the chemical under investigation during thexperiment.56–58 The sorption capacity of a given sorbemay depend on a series of properties, which are grain-distribution, specific surface area, cation exchange capapH, organic matter or organic carbon content, and mineconstituents. These properties may affect sorption moreless depending on chemical characteristics of the sorbMethods of measurement of soil/sediment properties areported in a series of publications of the American SocietyAgronomy and American Soil Science Society.59–61The JRCIspra of the European Commission62,63published in 1994 theresults of the EURO-SOIL project for the identification, colection, preparation, and characterization of five regionarepresentative soils as reference soils for chemical testinthe European Union~EU!, according to the respective OECtest guidelines56 and Annex V of the EU-Directive79/831/EEC.64 Ball et al.65 reported a detailed study for thcharacterization of a sandy aquifer material at the grain scThe study included particle density, porosity, pore size dtribution, specific surface area, and organic carbon conte
Specific surface area~SA! is measured by gas adsorptioon dry sorbent; the low temperature nitrogen adsorptmethod~BET method!66 gives only external surface area bcause nitrogen does not penetrate pores less than 5 Å indiameter. Krypton67 and carbon dioxide,68 on the contrary,are able to penetrate pores less than 5 Å in diameter, but arenot able to measure interlayer surfaces of soils and claFinally, ethylene glycol monoethyl ether~EGME method!has the capacity to measure both external and interlayerfaces of soils and clays.69,70 Other methods, based on metylene blue71 and water vapor72,73 adsorption, have beenadopted.
Organic carbon~OC! content can be obtained with different methods. The wet procedures are based on dichrom~Walkley–Black method!74,75or persulfate76 oxidation of thesorbent organic matter~OM!, while the dry combustionmethods use high temperature to oxidize OM to carbdioxide.74,77The OC content can be converted to OM conteusing the factor 1.724 for mineral soils74,78 and 1.862 forpeats.78
The sorption process is generally studied by plottingequilibrium concentration of a compound in the sorbent afunction of its equilibrium concentration in gas phase orsolution at a given temperature. Sorption isotherms are ononlinear. A classification of isotherms has bereported79–81 and each isotherm has been interpreted bspecific model. However, some of them, such asLangmuir,82 BET,66 and Gibbs83,84 models often fail to de-scribe sorption data in water phase adequately81 and onlyFreundlich85 and linear models seem to better fit the sorptidata. However, all the models approach linear model atsorbate concentration. Figure 1 shows some of thesetherms of interest in sorption of organic compounds in wasolution by natural sorbents. In particular, BET isotherm w
J. Phys. Chem. Ref. Data, Vol. 30, No. 1, 2001

as
ng
asu
en
ao
ac
k
nd
nteara
i
n
tim
ot
ed
r
eb-
nil
aap-n-s of
ro--
aton
olu-andent
For
lyent
ity
ntncee inn-in-ede
by
tantiso--
iso-heinantges
for
190190 DELLE SITE
be met in sorption of organic compounds in vapor ph~Sec. 4.3!.
O’Connor and Connolly86 reported the basis of calculatioof the Langmuir isotherm, originally derived for describinsorption of gases by solids, but adopted also for some cof sorption of a chemical by natural solids from an aqueosolution.
A sorbing system has a sorption capacity,qc , defined asthe ratio of the mass of sorbate to the unit mass of sorbThe total sorption capacity is thereforeqcm, in which mequals the mass of the sorbent. The rate of sorption issumed to be proportional to the dissolved concentrationthe chemicalC and to the difference between the total capity, qcm, and the amount sorbed,q m, whereq is the actualconcentration of the sorbate in the solid phase. Thus thenetic equation may be written
dC/dt52k1m C~qc2q!1k2q m, ~1!
wherek1 and k2 are the rate constants for the sorption adesorption, respectively.
At equilibrium, Eq.~1! reduces to the Langmuir isotherm
q5qcC b/~11b C!, ~2!
in which
b5k1 /k2 .
In the Langmuir model the mass of solute sorbed per umass of sorbent,q, increases linearly by increasing the soluconcentrationC at low surface coverages, approaching toasymptotic valueqc when adsorption sites approach satution. Three important assumptions made in deriving Eq.~2!are:87 ~i! the energy of sorption is the same for all sites andindependent of degree of surface coverage,~ii ! sorption oc-curs only on localized ‘‘sites,’’ with no interaction betweeadjoining sorbed molecules, and~iii ! the sorption maximum(qc) represents a monolayer coverage. Given these restricassumptions, it is not surprising that the Langmuir isotherare observed only in a few cases88–94 for the sorption oforganic compounds in such a complex and heterogenemedia as soils. They are the most useful to representadsorption of polycyclic aromatic hydrocarbons~PAH! fromwater onto activated carbon.95
In natural systems,qc is invariably an order of magnitudgreater thanq, and, in many cases, many orders of magnitugreater. Under this condition, Eq.~2! reduces to the lineaequation
b qc5Kd5q/C, ~3!
whereKd is the partition coefficient equal to the ratio of thsolute ~sorbate! concentration in the solid phase at equilirium, q ~indicated also asx/m, wherex is the amount ofcompound sorbed on the massm of sorbent!, to the soluteconcentration in the aqueous phase at equilibriumC. By con-vention, concentration units are chosen with the volume uin solution equivalent in mass to the mass unit for sosediment; typical units forKd are dm3 kg21 or cm3 g21.52
J. Phys. Chem. Ref. Data, Vol. 30, No. 1, 2001
e
ess
t.
s-f-
i-
it
n-
s
ves
ushe
e
it/
Mackay8 described the environmental behavior ofchemical on a thermodynamic basis using the fugacityproach. Fugacity~f ! can be regarded as the ‘‘escaping tedency’’ of a chemical substance from a phase. It has unitpressure and can be related to concentration. Karickhoff52,96
reported the thermodynamic treatment of the sorption pcess for dilute systems~linear isotherms! based on these concepts. Sorption equilibrium can be defined as the statewhich the pollutant fugacities in the sorbed and solutiphases are equal; thus
f s5 f w,
where the superscripts s and w refer to the sorbed and stion phases, respectively. In composite systems, as soilsediments, the fugacity within each sorptive compartmmust be equal at equilibrium
f is5 f w,
which is valid for all sorptive compartments~i!. The fugacitycan be related to pollutant concentration in each phase.example, for the aqueous phase,
f w5fwC,
wherefw is the fugacity coefficient~fw,fs,f is, for water,
total sorbent, and single fraction of sorbent, respective!commonly expressed as the product of an activity coeffici~g! and the corresponding reference state fugacity (f 0). Thisfugacity coefficient is the reciprocal of the fugacity capacused by Mackay.8 For example
fw5gwf 0w .
The numerical evaluation of any given fugacity coefficie~f! requires the specification of the standard or referestate and its associated fugacity. Concentrations must bmole fraction units but, for low concentrations, more coventional units can be used; unit conversion factors arecorporated into the fugacity coefficient, but are only requirfor numerical evaluation of the individual coefficients. Thsorbed and solution pollutant concentrations are related
q5Cfw/fs.
In general, fugacity coefficients are dependent upon polluconcentration and, therefore, the corresponding sorptiontherms are nonlinear. In ‘‘sufficiently’’ dilute systems, however, these coefficients approach limiting values and thetherms approach linearity. In simplistic terms, this is tlimit in which solute–solute interactions can be ignoredeach phase; the molecular environment of the pollutwithin each phase remains relatively constant with chanin solute concentration. It is this ‘‘low loading’’ limit thatshould be quite typical of most environmental situationswhich Eq. ~3! is valid, where Kd5fw/fs or Kd
5fwS iYi /f is, for composite sorbent.
Often the experimental data do not follow Eq.~3! but maybe fitted by the empirical Freundlich isotherm85
q5K fC1/n, ~4!

t
hei
ruto
n-
nrn
r-ote
pn.ini
oi
erby
er-m-nd
llymic
beds a
ypre-
ng
ree-
rity.
-cti-rgenderver-
e-m
irts ofnol,elieule
fm
vedof
rt in
rme ofo-
the
n-ne
s
wa
191191SORPTION OF ORGANIC COMPOUNDS
whereK f and 1/n are constants, andq andC have the samemeaning as in Eq.~3!. Equation ~4! can be given in thelinearized logarithmic form
logq5 logK f11/n logC. ~5!
The plot of logq as a function of logC has a slope equal to1/n and an intercept equal to logKf . LogK f equals logqwhenC equals unity. When 1/nÞ1, the value ofK f dependson the units with whichq and C are expressed. In mospapersq is given in mg/g of sorbent andC in mg cm23 ofsolution; thus,K f(mg121/n cm3/n g21) is equal toq when C51 mg cm23. Hassettet al.97 observed thatKd may be ex-pressed on a mass basis or a molar basis, whileK f should beexpressed on a molar basis~typically, q in mmol g21 andC inmmol cm23!.
The value of 1/n represents a joint measure of both trelative magnitude and diversity of energies associated wa particular sorption process.54,98 A 1/n51 indicates linearadsorption and, therefore, equal adsorption energies fosites. Linear adsorption generally occurs at very low solconcentrations and low loading of the sorbent. A value1/n.1 represents a concave, curved upward, S-type~Solventaffinity-type!78,79 isotherm, where the marginal sorption eergy increases with increasing surface concentration.98 It canbe interpreted also with strong adsorption of the solvestrong intermolecular attraction within the adsorbent layepenetration of the solute in the adsorbent, and monofutional nature of the adsorbate.99 S-type isotherms, characteistic of cooperative sorption, are more common for the sfine fractions, which have a higher total amount of associaorganic matter, than for the coarse fractions.100,101A value of1/n,1 represents a convex, curved downward, L-ty~Langmuir-type!78,79 isotherm, where the marginal sorptioenergy decreases with increasing surface concentration98 Itmay arise where the competition of solvent for sites is mmum or the absorbate is a planar molecule.99 When 1/n val-ues are lower than 1 the mobility of a compound in s
FIG. 1. Typical isotherms describing sorption of organic compounds inter and vapor phase~BET! by natural sorbents.
th
allef
t,s,c-
ild
e
-
l
columns can be significantly greater for the highconcentrations.102 Thus, serious errors may be introducedassuming a linear sorption isotherm.
The Freundlich-type isotherms can result from the ovlapping patterns of several Langmuir-type sorption phenoena occurring at different sites on complex sorbent ashowing different interaction energies.54 Although previousattempts to interpret the Freundlich equation theoreticahave had only limited success, a meaningful thermodynainterpretation of this equation has been developed103 using afugacity approach with a proposed standard state for sorherbicide, which assumes that soil organic matter formsolid solution with the herbicide.
It has been pointed out87 that the error factor introduced bassuming the Freundlich isotherm to be linear can be resented as the ratio of Eq.~4! on Eq. ~3! and is equal toC(1/n)21. This error factor has been evaluated by plottiC(1/n)21 versusC in the range of 0.1–10mg cm23 and for1/n values ranging from 0.5 to 1.0~Fig. 2!. In this way, it isshown that an error factor of 1.0 represents perfect agment between linear and nonlinear isotherms, while forC,1.0 the amount sorbed is underpredicted, and forC.1.0the amount sorbed is overpredicted by assuming lineaThe maximum deviation for 0.1,C,10.0mg cm23 and 0.5,1/n,1.0 will be by a factor of 3 if linear isotherm is assumed. Such error factors may be tolerable for many pracal applications as in nonpoint source models, but for lasolution concentrations, such as those encountered uwaste disposal sites, the amount sorbed could easily be oestimated by an order of magnitude or more.102,104Lyman105
tabulated the values of deviation from linearity for the Frundlich adsorption isotherm as a function of equilibriuconcentration inmg cm23 and the value of 1/n.
All the three empirical models~Freundlich, linear, linearwith nonzero intercept! and the theoretically based Langmusorption model, were able to describe the observed resulbatch experiments, carried out with pentachlorophe~PCP!–soil systems (r 2.0.92).106 The conclusion was thatif the measured 1/n value in Freundlich equation is in thrange of 0.75 and 0.95, a linear isotherm can be used inof the Freundlich isotherm without incurring unacceptaberror. However, it was found107 that sorption coefficients ohydrophobic chemicals with aquifer materials derived frocolumn experiments were consistent with the batch-deriFreundlich isotherms, thus demonstrating the importanceisotherm type on breakthrough curves and solute transpoground water.
How dilute the system must be to show linear isothevaries from system to system depending upon the naturthe solute and type of sorption interaction. Sorption istherms for hydrophobic chemicals were linear whenequilibrium water concentration was kept below 1025 M orbelow one half of the solute water solubility.52,108,109Chiouet al.55 found no isotherm curvature at equilibrium concetrations extending to 60%–90% of saturation with benzeand its two Cl derivatives on soil.
Ball and Roberts88 reported that nonlinear isotherm
-
J. Phys. Chem. Ref. Data, Vol. 30, No. 1, 2001

ponns
ohema
ard
neae
u-
eth-d
itioth
erh
ibf-
eeic
sue
he
-
s
z
dn
ae de-endorp-byn-toof
soofrmodelea-is.
ilib-f 1 hh
d-ied
–3tem
ear
192192 DELLE SITE
~Langmuir and Freundlich! of tetrachloroethene~PCE! and1,2,4,5-tetrachlorobenzene~TeCBz! on sandy aquifer solidsfit the entire range of data much better than does the simlinear relationship, although selection between the two nlinear isotherm types is difficult. At the low concentratio~,50 mg dm23! relevant to the rate studies110,111 and fieldexperiment24,112 the isotherm data appear more linear. Istherm nonlinearity of PCE and TeCBz observed at higsolute concentrations suggests that physical adsorptionbe important in sorbent having a low content of organic mter ~0.021%!.88 Young and Ball113 observed that althoughPCE sorption on aquifer material follows isotherm nonlineity, a linear approximation of sorption capacity might be aequate for modeling purposes.
Due to the heterogeneous composition of natural sorbesorption may be expressed by composite linisotherms.52,114,115The relative equation may be of the typ
q5(i51
m
xiqiS (i51
m
xiKdiDC5KdC,
whereq is the total solute mass sorbed per unit mass of bsolid at equilibrium,xi is the mass fraction of the soil comprising reaction region or component i,qi is the sorbed phasconcentration at equilibrium expressed per unit mass ofregion or component,Kdi is the partition coefficient for reaction i expressed on a per mass of component i basis, anKd
is the mass-averaged partition coefficient.If one or more of the component elements of sorption
governed by a nonlinear relationship between the soluand sorbed phases expressed by Freundlich isotherms,the composite isotherm will deviate from linearity. Webet al.54 proposed the ‘‘distributed reactivity model’’ whictakes the form
q5x1KdC1(i51
m
~xnl! iKfiCni,
wherex1 is the summed mass fraction of solid phase exhiting linear sorption,Kd is the mass-averaged sorption coeficient for the summed linear components, (xnl!i is the massfraction of the ith nonlinear sorbing component, andKfi isthe Freundlich sorption coefficient for reaction i expresson a per mass of component i basis. The model has bapplied to soil having components with different organmatter content.
Another way to express nonlinear isotherms has beengested by Lambert116 who proposed an equation of the typ
x/m5aC1bC21gC31¯ , ~6!
wherea, b, g are the adjustable coefficients used to fit tdata,x is the quantity of chemical sorbed, andm the mass ofsorbing medium andC is the concentration of solute in solution at equilibrium. For most practical purposes, whenCbecomes very small andb andg are small numbers the serieconverge without the second and third terms anda may betaken as a measure ofKd . Equation~6! accounted for thecurvature observed in the adsorption isotherm of metribu
J. Phys. Chem. Ref. Data, Vol. 30, No. 1, 2001
le-
-rayt-
--
ts,r
lk
at
snen
-
den
g-
in
better than the Freundlich equation117 and has been provevalid for the first desorption equilibration of fluometurofrom soils.118
Isotherm models describing equilibrium distribution ofsolute between a solid phase and an aqueous phase arpicted in Fig. 1. The different shape of the isotherms depon the sorption mechanism involved and the associated stion energy. In particular, linear model is characterizeduniformly distributed sorption energy with increasing cocentration. At low solute concentration all models reducelinear. Therefore, linear model can be applied to casesenvironmental contamination where concentration is low,producing a simplification of the mathematical treatmentenvironmental models. However, when sorption isothecannot be considered linear, the appropriate isotherm mmust be used. Finally, sorption coefficients have to be msured at equilibrium; therefore, a previous kinetic studynecessary to know the time required to reach equilibrium
3. Sorption Kinetics
Sorption measurements must be carried out when equrium has been reached. It has been reported that times oor few hours119–129 to 1 day are often sufficient to reacequilibrium, but sometimes are necessary some days130–133
or several days, months, or years.110,113,134–136
Many examples exist of rapid equilibration time. The asorption kinetics for bromacil and napropamide on air-drclay soil with high OC content~7.3%–9.1%! indicated thatbromacil attains equilibrium almost instantaneously.137
Napropamide, however, does not reach equilibrium for 2h. When napropamide was added to a prewet soil, the syswas still not at equilibrium after 48 h.
FIG. 2. Plot of the error factor as the ratio between Freundlich and linisotherms as a function of solution concentration~after Rao andDavidson87!.
ndtad
nt
it
ti
cip-r
nasld-
ucrpnttc
cuabdetio
ixh
ur
su
tiogs
i-spn
biororica
o
n-ao
te
areast, attontofhethe
ent
rala
icthat
tedith
istic
s in
Eq.rlyiveon
theilefor
ion
ntion
CBays.e-
a
ffu-ro-onon-
ates,ionyn-
193193SORPTION OF ORGANIC COMPOUNDS
No significant increase in adsorption of aldrin by soils aclays was observed between 5 min and 5 days of contime.138 Also with parathion equilibrium is quickly reachewithin 1 min.139 The rapid equilibration~2 h! of organophos-phorous and carbamate insecticides with soils has been ipreted as due to a physical type adsorption mechanism.122
A study of cyanazine adsorption on peat saturated wcations showed that equilibrium is reached within 1 h.140 Thethermodynamic parameters seem to point to an adsorpmechanism by hydrogen bonds.141
The rate of binding of diquat and paraquat on humic awas rapid;142 equilibrium was reached within 3 h. The sortion data suggested that the interaction between the hecides and humic acid was mainly electrostatic in nature.
The adsorption of several insecticides and herbicidesdifferent nature on inorganic sorbents~kaolinite, sand! wasvery fast~minutes!, while the adsorption on substrates cotaining organic matter increased with time; equilibrium wnot reached in 104 min, but extrapolation suggested it coube reached before 105 min, indicating that sorption is a multistage process.114 Kookanaet al.,143 in a study of simazineand linuron adsorption by soils, reported that a well strtured soil with high OM content showed slower rate of sotion compared with a dispersed soil with low OM conteMoreover, a comparison of sorption data obtained by a batechnique and a flow technique revealed that sorption ocat a much faster rate under batch conditions, presumbecause of shaking and high solution to soil ratio. Unbatch conditions, the instantaneous component of sorpwas very high~up to 90% of 24 h sorption value!.
Hance144 studied the sorption of four herbicides on sdifferent sorbents. Equilibration time ranged from 1 to 24Nylon and silica gel, which do not possess a crumb structcame to equilibrium with linuron very quickly. The slowadsorption by some sorbents may depend on: the slowvent action of the aqueous solution which causes themasking of some adsorbing sites; the slow chemical fixaprocesses which may operate in some instance; swellinthe sorbent after long exposure to water and, in some cathe slow diffusion of the solute into the sorbent.
Hamaker and Thompson123 postulated that the sorption knetics depends on the sorption process and on the tranof the compound to the sorption sites which consists of traport to the outer sorption sites~macrotransport! and diffusioninto micropores and capillaries. Talbert and Fletchall145 sug-gested that the small increases in sorption of triazinessoils may be due to: delay in the wetting of small intercapillaries; slow diffusion of the solute into these interisurfaces; slow irreversible fixation reaction due to chemforces; mechanical breakage of solid particles; formationcomplexes.
A detailed study of 2,4-D adsorption kinetics on clay mierals indicated that the rate-limiting step in adsorption wdiffusion to the reactive sites within the clay matrix and nthe kinetics of reaction at the site.146 The adsorption of 2,4-Dand picloram on humic acid revealed an initial rapid rafollowed by slower rates at longer times.125 The amount of
ct
er-
h
on
d
bi-
of
-
--.hrslyrn
.e,
ol-n-nofes,
orts-
y
lf
st
pesticide adsorbed was plotted as a function of the squroot of time. In each instance the linearity in the plots wusually attained after about 1 or 1.5 h. Thus it appears thalonger times, intraparticle diffusion of the compounds inthe interior of the humic acid particles was the dominarate-limiting process. The rate-limiting step for sorptionparathion on soil organic matter was the diffusion of tinsecticide molecules to the surface of the adsorbent forfirst 10 min of adsorption.147 At longer times, intraparticlediffusion of the adsorbate into the interior of the adsorbparticles was rate limiting.
Thus, the sorption kinetics of organic pollutants on natusorbents shows often a rapid initial uptake followed byslow approach to equilibrium.148–155 Karickhoff andMorris156 described sorption dynamics of hydrophobchemicals on sediments by a two compartment modeldistinguish rapid or ‘‘labile’’ exchange~requiring at most afew hours to achieve! from highly retarded or ‘‘nonlabile’’sorption requiring days or weeks to occur. They colleckinetic and sorption data for hydrophobic compounds wseveral sediments obtained in two studies.151,156When thesedata were combined, an equation relating the charactertime (1/k2) for nonlabile sorption toKd (cm3 g21) was foundthat seemed to hold over a range of characteristic timeexcess of 3 orders of magnitude~hours to months!:
1/k2~h!'0.03Kd r 50.87. ~7!
The authors observed that individual data deviate from~7! by as much as a factor of 3, but the relationship cleadefines the appropriate time frame for nonlabile sorptevents. In conclusion, times to reach equilibrium can bethe order of 0.1Kd ~h!. For chemical/sediment systems wiKd.105, equilibration times in excess of 1 year would bexpected. The fraction of the total sorption that was labwas typically 0.25–0.60, but decreased to 0.1 or lesshighly sorbed chemicals at high solid concentrations.
A mathematical approximation of such a two-step sorptreaction for batch experiments can be simplified152 to
x/c5Kd~12e2k2t!, ~8!
where the time constantk2 for accessing compartment 2 cabe estimated by an iterative least-squares approximabased on a Taylor progression ofk2 . Equation~8! has beenproved valid for polychlorobiphenyl~PCB! congeners.153
The results demonstrated that with strongly adsorbing Pcongeners equilibrium cannot be obtained even after 7 d
Wu and Gschwend,155 in order to develop an accurate dscription of hydrophobic compound transport, proposedmodel of sorption kinetics~‘‘radial diffusion’’ model! basedon known physical and chemical processes, molecular dision, and phase partitioning. The effects of sorbate hydphobicity, sorbent particle size, and system temperaturesolid–solution exchange were examined. The results demstrated that the bigger aggregates have lower uptake rthat compounds with higher values of octanol/water partitcoefficient (Kow) show slower sorption, as already found bKarickhoff151 with PAHs, and that desorption rates are co
J. Phys. Chem. Ref. Data, Vol. 30, No. 1, 2001
mifodd
ain
a
oepda
ted
thear
ha
oy b.
or–
tino
cs
c
ngea
ial
onomc
er
enlo
in
er-
ndchichsol-s onical
e-nedtic.eenr-oci-
ofdi-
is-hy-n–peoci-
ing–
nedsecter
on-
en
the
ast
ibb-elyndcurto-hat
194194 DELLE SITE
sistent with a reversible diffusive exchange mechanisModel simulation analysis indicate that a single effective dfusivity parameter, which is predictable from compound slution diffusivity, octanol–water partition coefficient, ansorbent organic content, density, and porosity, can be usequantify the sorption kinetics.
Thus, diffusion limitations seem the most likely explantion for the long time often necessary to attain equilibriumsorption process. However, Ball and Roberts157 observed thataccuratea priori estimation of sorption rates does not appeto be feasible.
Sorption of PCE and 1,2,4,5-TeCBz by sandy aquifer sids required contacting times on the order of tens to hundrof days to reach equilibrium. However, equilibrium was aproached much faster when pulverized material was use88
For a given solute, the distribution coefficients differed byfactor of 30 among the various size fractions, being greafor the largest grains. The results have been interprete110
with an ‘‘intraparticle diffusion’’ model and diffusive rateconstants were determined for different size fractions ofsorbent as well as with pulverized material. Based on msured particle size and independent estimates of porosityinternal retardation, effective pore diffusion coefficients weestimated to be roughly 2–3 orders of magnitude lower tbulk aqueous diffusivities.
Alachlor retention follows Freundlich isotherm;158–160 itseems to react at different rates with different sites on sbent, suggesting that a multireaction kinetic approach maconsidered to describe alachlor retention kinetics in soils159
On this basis, Xue and Selim161 presented a ‘‘multireactionkinetic’’ model to determine both the kinetics of alachlretention and the nonreversibility of the adsorptiondesorption in soils. The model also was capable of predicalachlor desorption kinetics based solely on parameterstained from adsorption experiments.
Some effects of the complexity of the sorption kinetiare:
~a! Sorption may not be reversible showing the existenof ‘‘hysteresis’’ in the sorption–desorption process162 ~Sec.9!. Sometimes, part of the sorbed compound may be stroretained; covalent binding with soil surface may be one rson for the formation of nonextractable residues.163 Quanti-tative recovery of paraquat from a field soil required chemcal ‘‘dissolution’’ of the sorbent matrix to achieve chemicrelease.89
~b! Experimental sorption measurements may require ltimes and, therefore, special attention is necessary, due tpossibility of continuing losses of chemical from the systechemical or biological transformations, and possible artifain experimental sorption and desorption work.157,164In addi-tion, soil properties may change after many treatments.165
~c! Due to rate-limited sorption, models which assumequilibrium between dissolved and sorbed species, maysult in significant error in prediction of fate, especially whthe sorptive exchange ‘‘reactions’’ or mass transfer are swith respect to advective flow of the pore fluid.155 A non-equilibrium model can successfully simulate transport
J. Phys. Chem. Ref. Data, Vol. 30, No. 1, 2001
.--
to
-
r
l-ds-.
st
ea-nden
r-e
gb-
e
ly-
-
gthe,ts
e-
w
aquifer materials performed at a faster velocity~;1 cm h21!,whereas the equilibrium model was adequate for the slowvelocity ~;0.2 cm h21! experiments166 ~Secs. 9 and 10!.
4. Factors Affecting Sorption of OrganicCompounds
The distribution of an organic solute between sorbent asolvent phases results from its relative affinity for eaphase, which in turn relates to the nature of forces whexist between molecules of the solute and those of thevent and sorbent phases. The type of interaction dependthe nature of the sorbent as well as the physico-chemfeatures of the sorbate~hydrophobic or polar at variousdegrees!.123
Weber et al.28 summarized the possible interactions btween solute and sorbent included into three loosely deficategories of sorption: physical, chemical, and electrostaThe physical sorption processes involve interactions betwdipole ~permanent or induced! moments of sorbate and sobent molecules. The relatively weak bonding forces assated with physical sorption are often amplified in the casehydrophobic molecules by substantial thermodynamic graents for repulsion from the solution in which they are dsolved. Chemical interactions involve covalent bond anddrogen bond. Finally, electrostatic interactions involve ioion and ion–dipole forces. In a more detailed way, the tyof interactions and the approximate values of energy assated are:163 van der Waals interactions~4–8 kJ mol21!, hy-drophobic bonding~4 kJ mol21!, hydrogen bonding~2–40 kJmol21!, charge transfer, ligand-exchange and ion bond~40 kJ mol21!, direct and induced ion–dipole and dipoledipole interactions~2–29 kJ mol21!, and chemisorption~co-valent bond! ~60–80 kJ mol21!.
Sorption of organic pollutants sometimes can be explaiwith the simultaneous contribution of two of more of themechanisms, especially when the nonpolar or polar charaof the compounds is not well defined.
4.1. Nonpolar Compounds
Clay minerals can be considered good sorbents for nionic compounds. It is hypothesized167,168that the methylenegroups of the aliphatic chain may form a kind of hydrogbonding with the clay mineral~Ca-montmorillonite! of thetype C–H••••O–Si. The degree of adsorption depends onactivity of the methylene groups and on chain length.168
Sorption of acetoaceticethylester and b,b-oxydipropionitrile on clay minerals~gibbsite, kaolinite, Ca-and Na-montmorillonite! was studied by Brindleyet al.169
The order of decreasing sorption per unit of surface wgibbsite.kaolinite.montmorillonite. It was suggested thathe hydroxyl surfaces, which comprise the basal area of gsite and half the basal area of kaolinite, sorb more effectivthan the oxygen surfaces which occur in montmorillonite acomprise half the basal area of kaolinite. Sorption may octhrough hydrogen bonding from the hydroxyl surfacesward oxygen atoms in the organic molecules. It may be t

rbm
canthwa
abieathot
ticth
nyed-
adtholr
rpreanso
mou
itolinte
thrpswoffi
here
nd
ro
n
icin-of
r ofeendt
Cett
nts
nsAs
D,
oilsere
the
sedn-
kedofsnifi-e of
ing
ofM,
ed
isd byof
gtern
d
195195SORPTION OF ORGANIC COMPOUNDS
oxygen surfaces of montmorillonite are less effective in soing organic molecules by hydrogen bonding, due to the copetition of water molecules. Moreover, the exchangeableions of montmorillonite, Ca and Na, readily form hydratiocomplexes which may screen an appreciable portion ofavailable surface. Kaolinite is thought to have relatively feexchangeable cations in the extended basal surfaces,gibbsite probably has none. Therefore, it appears reasonfrom this point of view that these minerals should exhihigher surface sorption than does montmorillonite. Howevbenzene sorption on Al-saturated montmorillonite clay wseven times greater than for soils and three times greaterfor Ca-saturated clay.170 The reason of this behavior has nbeen explained.
SA may be an important factor in sorption of aromahydrocarbons by clay materials. Hydrogen bonding withoxygen of the clay surface may occur. TheK f values forbenzene, toluene, and xylenes were lower in kaolinite thamontmorillonite or illite.171 This result, already reported bBailey and White,172 may be explained on the basis of thfollowing considerations: montmorillonite is a 2:1 expanable lattice clay with a large SA (83106 m2 kg21); illite isnonexpandable 2:1 clay with SA of 105 m2 kg21; kaolinite isa nonexpandable 1:1 clay with a SA of 33104 m2 kg21. An-other significant result was that the amount of toluenesorbed from a hydrocarbon mixture was smaller thanamount of toluene adsorbed from a single hydrocarbon stion, showing thereby a competitive adsorption in a mixtuof hydrocarbons. Pierceet al.173 found that montmorilloniteadsorbed four times as much DDT as did kaolinite. Adsotion on clay was inversely proportional to temperatuwhich is indicative of physical adsorption. This was substtiated by the similarity of the adsorption and desorption itherms.
The type of solvent may affect sorption of nonpolar copounds. Sorption of lindane on several sorbents from varisolutions increased in the order ethanol,benzene,hexane<water.174 The sorption differences were assumed duepart to the differing solubilities of lindane in the differensolvents, and in part to the structure and affinity of the svent molecule for the particular sorbent. It appears thatdane competes for sorption sites most effectively with waand least effectively with ethanol. This was attributed toimportance of dipole–dipole interactions in the lindane sotion. Griffin and Chou175 investigated the adsorption of PCBin hexane and ethanol solutions on soils. The results shovirtually no adsorption, indicating that potential migrationPCBs and other similar compounds could occur in a landif these compounds were dissolved in organic solvents.
The contribution of the OM of soils or sediments to tsorption of nonpolar compounds was found much moreevant than the contribution of other components.26,116,176TheKd values of a chemical with different sorbents were foudirectly proportional to the OM~or OC! content. The strongtendency of humic acid extracted from soils to retain hydphobic organic compounds~HOC! was investigated by Khanand Schnitzer.177 They found that 100 g of humic acid ca
--t-
e
ndbletr,san
e
in
-eu-e
-,--
-s
n
l--r
e-
ed
ll
l-
-
firmly retain up to 2 g, and possibly more, of hydrophoborganic compounds by a mechanism that most likelyvolves sorption on external surfaces and in internal voidsa molecular sieve-type structural arrangement. The ordeincreasing adsorption rates for PCB congeners has bfound to be: Del Monte sand, illite clay, Woodburn soil, anhumic acid.178 The vapor loss of Aroclor 1254 is significanfrom the sand but negligible from the soil.30
A good correlation between sorption of HOCs and Ocontent of the soil and sediment was found by Hasset al.179 with dibenzothiophene on 14 soils and sedime(r 250.904). The other factors [email protected]., total clay, claymineralogy, cation exchange capacity~CE!, SA, pH#, werenonsignificant. Similar results were obtained by Meaet al.180 investigating the sorption of four PAHs on 14 EPsoils. Also the variability in lindane sorption on soils waalmost entirely due to OC.119
The sorption behavior of naphthalene, 2,4-p-chloroaniline, hexachlorobenzene~HCBz!, and lindane onseveral organic and inorganic materials and natural shave shown that the organic constituents of the soils wmainly responsible for their sorption properties.181 Celluloseappeared to be a well-suited model sorbent for simulatingrelative sorption behavior of the chemicals.
Sorption of PCBs on three marine sediments increawith the hydrophobicity of the PCBs and with the OC cotent of the sediments.182 However, the removal of OM re-sulted in a decrease of the sorption coefficients, more marfor those congeners with a relative lower degreechlorination.183 Sorption of PCBs on the mineral particlewhose OM has been removed becomes increasingly sigcant as the hydrophobicity of the PCBs and the percentagsilt–clay fraction of the sediments increase.
The role of OM has been also demonstrated by removthe soil OM using a series of extractants~ether, ethanol, hotwater, 2% HCl!185 or by oxidation with hydrogenperoxide.138,184,185These procedures reduced the amountsorbed HOCs. However, other soil properties, besides Oappeared responsible for adsorption,185 but their role couldbe masked by that of the OM, as reported for parathion.129 Atlow OM content, clay content and free iron oxide seemimplicated in lindane sorption on soils.185 The decreasedsorption of lindane by anaerobic soils low in OM contentattributed to the decrease in inorganic surface area causethe reduction of ferric to ferrous ion and the high statehydration attained by ferric oxides upon flooding.186 On thebasis of the relevant importance of the OM in controllinadsorption of organic nonpolar compounds of limited wasolubility (,1023 M!,52 the following constants have beedefined:
Kom5Kd / f om or Koc5Kd / f oc, ~9!
wheref om and f oc are the fractions of OM or OC in the solisorbent respectively.Kom andKoc are expressed in cm3 g21
or dm3 kg21 of OM or OC, respectively. In Eq.~9! the OC
J. Phys. Chem. Ref. Data, Vol. 30, No. 1, 2001

r
olob
icg
adbiheanng
i
cecsorem
faa
o
-
oteda
earaatr-d
he-dies
d
es
d
hte
ac-olecia--s of
omr-la-
theter,of
aryessicbe
sol-enendhen
ter
tict ofe
-s of
se:s
re-
ofhas
ee-olu-ces-An-u-
ner-
snts toThe
196196 DELLE SITE
content in soil is assumed constant andKoc is expected tohave an equal value, within the experimental errors, fochemical in sorption with different soils.
Wershawet al.187 reported that the adsorption of DDT thumic acid was not affected by the addition of sodium chride, indicating that the association was not due to coulomattraction. Khan and Schnitzer177 suggested that hydrophobmolecules could be trapped by internal voids formed throuhydrogen bonding between humic polymers. The highsorbing capacity of humic acid was due to hydrophobonding in humic acid–DDT interaction, because of tpresence of nonpolar portions of the humic acid polymerlipoidal molecules trapped within the polymer, or to trappiof DDT molecules within voids in the polymer.173 Thus, theassociation of nonpolar organic compounds to soil OMattributable to ‘‘hydrophobic bonding.’’123 This type ofbonding is due to the combination of van der Waals forand a ‘‘thermodynamic gradient’’ driving nonpolar organiof low solubility out of solution, because the interactionsthese compounds with natural OM are energetically pferred to interactions compound/water or compound/copound.28,188
In comparing several sorbents, the PCB concentrationtors were found to be inversely related to their average pticle size and linearly related to their SA.189 The concentra-tions of chlorinated hydrocarbons from Los Angeles Arbare closely related to the OC content and to particles of 8mmor less in size.190 Retention of DDT, endosulfan and methoxichlor was studied with two soils.191 A portion of each soilwas treated with hydrogen peroxide to study the effectOM on pesticide retention. In the untreated soils the grearetention of the three insecticides was on the colloi~, 0.08mm! and 0.08–0.5mm fractions. Removing the OMfrom both soils reduced the retention on these fractions.
Karickhoff et al.108 also have identified, in addition to thprimary effect of OC, sediment particle size as a secondfactor in the sorption of hydrophobic chemicals on natusediments. TheKoc for the whole sediment approximates thof the fines fraction, which contains the majority of the oganic carbon. TheKd for a series of PAHs was determineand correlated to the fraction of OC of sediments.96 Correla-tion coefficients~r! exceeded 0.90 in all cases. Moreover, tzero intercept in the plotKd– f oc showed clearly that an inorganic sorption contribution was contraindicated. NkeKizza et al.192 also found that OC content in soil increasexponentially with decreasing particle size; theKd values fordiuron and 2, 4, 5 T increase accordingly.
Sorption of toluene by two samples of soil~0.23% and0.41% OC, respectively! and by commercial humic acid anthe same humic acid coated Al2O3 was investigated.193 Koc
values varied by a factor of 2.5, with the sorbents of highand lowest OC content~humic acid and a soil!. Moreover,the Koc values for trichloroethene~TCE! and toluene ontohumic acid were more than 2.5 times greater than thosetermined for the same humic acids when coated onto Al2O3.The same authors194 carried out sorption experiments witTCE and toluene on soil and on humin fraction extrac
J. Phys. Chem. Ref. Data, Vol. 30, No. 1, 2001
a
-ic
h-
c
d
s
s
f--
c-r-
r
fstl
ryl
-
t
e-
d
from the same soil. The results indicated that the humin frtion shows an increased sorption capacity over the whsoil, thus suggesting the possibility that the intimate assotion of soil OM with the soil inorganic matrix strongly modifies the particle surfaces and/or the nature and propertiesoil OM, thus influencing its binding capacity.
Chiou et al.,55 on the basis of their own results,195–198ob-served that sorption of nonionic organic compounds frwater on soil consists primarily of partition into the soil oganic phase; adsorption by the soil mineral fraction is retively unimportant in wet soils presumably because ofstrong dipole interaction between soil minerals and wawhich excludes neutral organic solutes from this portionthe soil. The linear isotherms obtained with single and bincompound indicated no competition in the sorption procof the two compounds. Therefore, partitioning of organsolutes between the soil organic phase and water maytreated in a manner similar to that between an organicvent phase and water. Also the adsorption of naphthaland fluorene in a mixture with other PAHs was linear awas suppressed slightly compared to measurements wonly one compound was in solution.199 Partitioning of or-ganic solutes between soil and water was analyzed195,196byusing the conventional solution concept for solutes in waand the Flory–Huggins200,201 treatment for solutes in thepolymeric humic phase. Sorption determined for 12 aromaand chlorinated compounds on soil shows that the extensolute insolubility in water is the primary factor affecting thsoil OM–water partition coefficient (Kom) and that the effectof solute incompatibility with soil OM is significant but secondary. This explains the commonly observed correlationlogKom vs logKow ~octanol–water partition coefficient! andof logKom vs log S~water solubility! ~Secs. 12.1 and 12.2!.
However, Spurlock and Biggar202 pointed out that iso-therm linearity is not a prerequisite for partitioning, becau~i! nonlinear uptake~dissolution! of organic vapors and gasein polymers is often observed,~ii ! a number of studies onnonionic organic compound–humic acid sorption haveported nonlinear isotherms, and~iii ! solvent–polymer inter-actions sometimes vary with concentration.203 On the basisof the chemically heterogeneous macromalecular naturehumic substances, a more general view of partitioningbeen taken into consideration;202,204,205organic carbon-basedsorption is viewed as a solute distribution between a thrdimensional macromolecular humic phase and the bulk stion phase and the solute–sorbent interactions are not nesarily restricted to nonspecific London interactions.general thermodynamic partition model for organic carbobased linear and nonlinear sorption from solution was formlated in order to characterize sorbate partial molar free egies.
Chin and Weber206 applied the modified Flory–Hugginmodel in conjunction with solute aqueous activity coefficiedata to estimate the association of organic contaminanthumic and other organic polymers in the aqueous phase.correlation between log(Koc)obsd and log(Koc)pred for 14 aro-

e
ntteinr
uie
nn
onb
sh-reerean
radoclinn
e-ndg,
-th
nb-om-n
stiec
ertepese
ifiedin
on-on-n,
nifi-ing
of
nts.
yifi-be
eesde
e-a
n
ic-as
Eils,
chse
oficC
nesasc-
ds,y-
e inic
ent
197197SORPTION OF ORGANIC COMPOUNDS
matic and chlorinated hydrocarbons showed good agreem~Sec. 12.7.!.
For sorbents with OC content greater than 0.1%,207 ahighly significant correlation was found between theKds ofsome halogenated alkenes and benzenes and the OC coof a series of sediment samples. These findings indicavery similar lipophilicity of the organic materials presentthese natural sorbents. SmallKd values have been found fo‘‘organic poor’’ sorbents (OC,0.1%), even for those with ahigh SA. Therefore, the compounds investigated are qmobile in such media. The limit of about 0.1% OC has beindicated also by other authors,208,209although others88 foundthat theKd values of PCE and 1,2,4,5 TeCBz on differesize fractions of an aquifer material low in OC conte~0.021%! correlate linearly with thef oc values of the singlefractions; however, this occurs at low sorbate concentratiwhile physical adsorption to heterogeneous sites maypresent at higher concentrations where nonlinear relationis observed. Khanet al.210 studied the adsorption of acetophenone on 14 sediment and soil samples of diffecomposition. The linear partition coefficient was correlatsignificantly with percent OC. The amount of clay appeato be important in some cases, where OC was too lowdid not mask the effect of the clay minerals.
The adsorption on mineral surface~clay! dominates or-ganic matter partitioning at high clay to OM ratio.52,54,98
Karickhoff52 collected the data regarding the role of minein pollutant sorption38,129,185,211,212and defined a thresholfor onset of mineral contribution, given by the ratio cm/530, where cm and oc are the fractional masses of swelclay minerals and organic carbon in the whole sedimeThat is, for cm/oc,30 mineral contributions are masked, rgardless of the mineral content. However, this ratio depeon hydrophobicity of the sorbate. For a compound havinvalue of logKow52.14, the critical clay to OM ratio is 15:1which corresponds to cm/oc530. Mc Carty et al.115 sug-gested that the criticalf oc( f oc* ) below which mineral adsorption dominates over OM partitioning can be calculated byequation
f oc* 5SA/@200~Kow!0.84#,
where SA is the mineral-specific surface area.Sorption isotherms for naphthalene, 1-methylnaphthale
and o-dichlorobenzene~DCBz! were measured on seven susurface aquifer materials having OC content ranging fr0.0096 to 0.156%.213 Multivariate statistic was used to investigate possible relationships between sorption coefficieand OC content and other sorbent properties~percentagesand, percentage silt, percentage clay, CE, SA, etc.!. Thesorption coefficient, for aquifer materials containing lethan 0.10% OC, does not correlate with any of the properof the sorbent, including the OC content. No single surfaappears to control sorption on the aquifer material and, thfore, it is recommended that sorption coefficients be demined experimentally on each different sorbent of this tyHumic acid-modified silica shows similarities with the
nt
entsa
ten
tt
seip
ntddd
l
gt.
sa
e
e,
ts
ssee-r-.
aquifer materials and has been proposed as a simplmodel to examine organic solute transport processesground water.107
Lara and Ernst182 reported thatKoc values for PCB conge-ners with three different sediment samples, having OC ctents of 0.50%, 1.47%, and 2.33%, respectively, depart csiderably from constancy with the degree of chlorinatioincreasing with decreasingf oc. This is probably a result ofthe assumption that OM is the sole sorbent, whereas sigcant sorption of highly hydrophobic congeners is also takplace on exposed mineral surfaces of the sediments.
The contribution of the mineral fraction to the sorptionnonionic compounds may be computed by plottingKd versusf oc for the adsorption of a compound on a series of sorbeA more general formulation of Eq.~9! can be153,214,215
Kd5Koc8 f oc1K0,
where the interceptK0 expresses a fraction of adsorption bsoil constituents other than OC. This fraction may be signcant especially in soils with a low OC content and cansubtracted to theKd values of all soils to get amendedKoc
values.153
Although all this evidence thatKoc or Kom is constant foreach chemical whenf oc.0.001, it has been found that thKom values for a single compound may show differencranging from a factor of 3 to over an order of magnitufrom soil to soil.123,163,216,217
A study of partitioning of two PCBs and fluoranthene btween sediments and interstitial water demonstratedmarked dependence ofKoc on the source of organic carboand a two to 17-fold deviation of measuredKoc values fromthose predicted by logKoc– logKow empirical relationships~Sec. 12.1!.218
The diversity in composition and structure of the organmatter can give a variation in the sorptivity of organic compounds, due to the presence of different fractions suchhumic and fulvic acids, lipids, and humins.188,194,219,220Gar-barini and Lion194 investigated the sorption behavior of TCand toluene on two humic acid samples extracted from sotannic acid, lignin, corn protein zein, cellulose, and Aldrihumic acid. TheKd values for the two compounds on thesorbents do not converge to a similarKoc value, when nor-malized by the fraction of OC, indicating that componentsOM found in soils may have affinities for nonionic organcompounds which cannot simply be explained by their Ocontent. The results are consistent with the observatio221
that an organic material’s ability to sorb organic pesticidwas related to its relative hydrophilic/hydrophobic balanceindicated, in part, by its number of oxygen-containing funtional groups. Lignin, as compared to humic and fulvic acihas a notable lack of carboxylic groups, making it less hdrophilic and possibly accounting for its higherKds andKocs. Thus, a decrease greater than an order of magnitudsorption can be found using humin, humic acid, or fulvacid in the order.
However, sorption of naphthalene on EPA-6 sedimmodified by sorption of poly~N, N-dimethylaminoethyl
J. Phys. Chem. Ref. Data, Vol. 30, No. 1, 2001
d
th
migp
e
inioowairy
anyee
su
rpi
d
e-siw
onMneaA
s
dnip
onsithi-
l tndic
-
w-tion
larnceith
on-ing
fi-
thensisu-foride.eneeencent
ralub-, thetionthence,sur-theionp-hu-
h-thatenl-ar-he
in-onlees-
nsoily
198198 DELLE SITE
methacrylate! ~PDAM! showed an unexpected behavior.132
PDAM has a high carbon-to-oxygen ratio of 4-to-1. Preasorption of PDAM increasedKd values of naphthalene from3.35 to 56 mL/g, an increase of about a factor of 17, butKoc
values were 940 for the modified sediment and 465 forunmodified sediment.
Soils exchanged with organic cations of the for@~CH3!3NR#1, where R is a C9–C16 hydrocarbon, have snificantly higher OM contents and display high sorptive utake of common groundwater contaminants~benzene, tolu-ene, chlorobenzenes, and alogenated alkanes!.222 Theisotherms were linear. The organic phase derived fromchanged hexadecyltrimethylammonium~HDTMA ! was atleast ten times more effective than natural OM for removthese compounds from water. This simple soil modificatmight be used to improve the retardation capabilities of lOM soils and aquifer materials, and to enhance the contment capabilities of clay landfill liners and bentonite slurwalls.223
Other studies regarding the sorption of tetrachlorometh~TeCM! on clay modified by replacing inorganic ions bdifferent quaternary ammonium compounds have breported.92,93,224Decyltrimethyldiammonium~DTMDA ! cat-ions, in particular, have both ends attached to the silicaface of the clay mineral.92 TeCM sorption to DTMDA–clayis characterized by nonlinear isotherms, competitive sotion, strong solute uptake, and relatively high, exothermheat of sorption. An adsorption-dominated process insteaa partition-dominated process is suggested.
HDTMA is adsorbed on different clay minerals up to thCE.225 X-ray diffraction analysis of the HDTMA clays revealed basal spacings higher for vermiculite and decreain the order for high-charge, intermediate-charge, and locharge smectites. In general, both the greater HDTMA ctent and the larger basal spacings of high-charge HDTclays increased the partition of benzene, alkylbenzenaphthalene, and biphenyl. Alkylbenzenes showed gresorption than the other compounds by high-charge HDTMclays. This was attributed to the capability of the large baspacings to accommodate larger solute molecules.
Grathwohl226 studied sorption of trichloromethane~TCM!,1,1,1-trichloroethane~TCA!, TCE, and PCE on 39 soil ansediment samples from different geological formations aareas. The results indicate a decrease in sorption withcreasing proportions of oxygen-containing functional grouin sorbent OM of the most recent soils. A first approximatito estimate sorption coefficients for various OM compotions is provided by an empirical correlation betweenhydrogen/oxygen~H/O! atomic ratio as an index of the oxdation of the OM and theKoc values for TCE
logKoc51.52 log~@H#/@O# !11.54 r 250.95.
Therefore, many of the experimental and estimatedKoc val-ues reported in the literature for nonionic compounds faiaccount for variations in the composition of natural OM aare therefore likely to be misleading when used to predsorption coefficients such asKd . Moreover, differences be
J. Phys. Chem. Ref. Data, Vol. 30, No. 1, 2001
-
e
--
x-
gn
n-
e
n
r-
-cof
ng--
As,
ter
al
dn-s
-e
o
t
tween OC content obtained using both high- and lotemperature methods are found with respect to the sorpcapacity.54
The composition of the OM shows a decrease of the pogroups also by increasing the depth of a soil horizon. Sithe concentration of OM in soils is typically decreasing wthe depth, a nonlinear correlation betweenKd and f oc isexpected227
Kd5Kocf ocn ,
wheren is less than unity. This behavior has been demstrated with atrazine sorption on 24 soil profiles, compris109 soil horizons. In a logarithmic correlation betweenKd
and f oc the nonlinearity constant proved statistically signicant from unity
logKd51.8110.75 logf oc,
which indicates that not only the concentration, but alsocomposition of the OM play important roles in soil sorptioof atrazine. Moreover a multiple linear regression analybetweenKd and the various OM fractions revealed that hmic acid explained 71% of the variance compared to 26%humin plus free organic matter and 3% for manganese ox
Sorption of carbazole, dibenzothiophene, and anthracwas investigated on hematite and kaolinite that had bcoated with natural humic substances over a mass percarbon range of 0.01%–0.5%.228 Humic acids were invari-ably more strongly adsorbed than fulvic acids on minesurfaces and increasing quantities of sorbed humic sstances greatly enhanced HOC sorption, with anthracenemost hydrophobic compound, showing the greatest sorpenhancement. The type of humic coating influencedamount of HOC adsorbed, and the most aromatic substapeat humic acid, was the strongest sorbent. The mineralface also influenced the amount of HOC adsorbed onorganic coating, with hematite giving the greater adsorptdue to the distribution of surface hydroxyl sites, which reresents points of attachment for carboxyl groups on themic substance.
Sorption of benzene and TeCM from water on three higorganic-content soils~muck, peat, and peat extracted wiNaOH! and on cellolose was determined in order to evaluthe effect of sorbent polarity on the solute partitiocoefficient.229 The isotherms are highly linear for both soutes on all the OM samples, which is consistent with a ptition model. TheKom values increase by decreasing tpolar-nonpolar group ratio@~O1N!/C# of the sorbentsamples from cellulose to extracted peat. The relativecrease is similar for both solutes and the limiting sorpticapacity~LSC, Qom
0 ! on a given OM sample is comparabbetween the solutes. LSC is defined by the following exprsion
Qom0 5KomS,
whereS is the water solubility of the solute. This observatiosuggests that one can estimate the polarity effect of aOM on the value ofKom for various nonpolar solutes b

teh
o
poo-
ilta
pong
ni
pam-ra
h
sse
efhehithnd
ntplit
thTentttosve
tne
a
ntained
tionan
weenr-sr ar,ehy
ally
atthe
.d
tionthens
p-of
omheed
ion.effi-mffi-seatera
the
gep-soil
ionsswasn be
ol-rbo-lu-
in
be-ay’s
of
199199SORPTION OF ORGANIC COMPOUNDS
determining the partition coefficient of single nonpolar soluwhen compositional analysis of the OM is not available. Tobserved dependence ofKom on sample polarity is used taccount for the variation ofKom values of individual com-pounds on different soils that results from change in thelar group content of OM. On the assumpion that the carbcontent of OM in ‘‘ordinary soils’’ is 53%–63%, the calculated variation ofKom is a factor of;3.123,217This value is inagreement with the limit of variation of mostKom data withsoils of relatively high OM content. Karickhoffet al.108 re-ported an averageKoc of 83 for benzene with the coarse sfractions of two sediment samples, which is far greater ththe values obtained with muck and peat~7.67 and 12.5, re-spectively!. Following the above discussion, the authors229
concluded that sediment OM should have extremely lowlar group content, with the partition efficiency approachithat of a good organic solvent.
Thus, Koc values depend on the nature of the sorbewhich influences the amount of compound sorbed onHowever, for all nonpolar compounds, which have comrable sorption mechanisms, this influence will be the saSchrap and Opperhuizen,209 selecting the sorption coefficients of nine nonpolar organic compounds from the liteture, demonstrated that the ratio of theKd values for twocompounds, independent of the sediment, is constant. Wthis ratio is known, it is possible, by the knowledge ofKd fora reference compound, to obtainKd for a second compoundwithout knowing thef oc value of the sorbent. This result ivalid for chemicals which are not sensitive to the third pha(Kow,5) ~Sec. 10!, which have aqueous solubilities in thmg/dm3 range and which have relatively high sorption coficients. Although the simplicity of the procedure and trestricted number of compounds to which it is devoted, tmethod would require more proofs that the influence ofnature of the sorbent is the same for all nonpolar compou
Kile et al.230 determined the partition coefficients (Koc) ofTeCM and 1,2 DCBz for a large set of soils, bed sedimeand suspended solids from the United States and the PeoRepublic of China. The values for both solutes are quinvariant either for the soils or for the bed sediments;values on bed sediments are about twice those on soils.similarity of Koc values between normal soils and betwenormal bed sediments suggests that natural organic main soils ~or sediments! of different geographic origins exhibicomparable polarities and possibly comparable comptions. The results also suggest that the process that coneroded soils into bed sediments brings about a change inorganic matter property. The difference between soil asedimentKoc values provides a basis for identifying thsource of suspended solids in river waters. The very highKoc
values observed for some special soils and sedimentsdiagnostic of severe anthropogenic contamination.
In conclusion, both clay minerals and soils or sedimecan sorb nonpolar compounds. Different types of bondsinvolved in sorption of organic chemicals by clay, while,the case of sorption of these compounds by soils or sments, hydrophobic interactions are prevailing andKd values
e
-n
n
-
t,t.-e.
-
en
e
-
ses.
s,e’seehe
ers
i-rtshed
re
sre
i-
depend linearly on the OC content in sorbent. Thus, sorpmay be assimilated to a partitioning of the solute betweenorganic phase and an aqueous phase. Relationships betsorption coefficients (logKoc) by soils or sediments and patitioning into n-octanol (logKow) were derived on this basi~Sec. 12.1!. Therefore, if the organic phase is the same foseries of sorbents,Koc is expected to be the same; howeveoften this is not the case, andKoc decreases by increasing thpolar character of the organic matter. This is the reason wKocs for nonpolar compounds on sediments are normhigher than those on soils.
4.2. Polar and Ionizable Compounds
Sorption of polar and ionizable compounds dependsvarious degrees on moisture content in sorbing system,presence of exchangeable cations,221 electrolyte concentra-tion and pH.231 Water solubility may also affect sorptionBailey and White35 published a review on adsorption andesorption of these compounds by soil colloids as a funcseveral factors as colloid type, physicochemical nature ofpesticide, soil moisture content, and others, with implicatioconcerning pesticide bioactivity.
Hance221 demonstrated a significant competition for sortion sites between diuron and water. The mineral fractionan oxidized soil adsorbed considerably more diuron frpetroleum spirit solution than from aqueous solution. Torganic matter from a peat soil, on the other hand, showgreater sorption from aqueous than from petroleum solutSo, presumably, in the first case water competed moreciently with diuron for mineral fraction than does petroleuspirit, while in the second petroleum competes more eciently with diuron for organic matter than does water. Theresults suggest that under field conditions, when excess wis not always present, the soil mineral fraction may playmore important part in adsorption than is indicated byslurry type sorption experiments.
Sorption of atraton and monuron by soil did not chansignificantly by reducing water content until the level aproached that needed to produce a monolayer on thesurfaces, when it increased sharply.232
The strong competition of water molecules in adsorptof 52 aniline, acetalinide, and carbamate pesticide analog233
and of hexazinone234 on cellulose from aqueous solutionwas evidentiated. In the absence of water, hexazinoneadsorbed from hexane solution, thus suggesting that it caadsorbed to cellulose in the absence of competing water mecules through hydrogen bond formation between the canyl groups of hexazinone and the hydroxyl groups of cellose.
Adsorption of parathion by attapulgite clay was studiedboth organic and aqueous media.235 In hexane solution thepresence of hygroscopic moisture resulted in competitiontween parathion and water so that an increase in the clmoisture content reduced parathion adsorption.
The same effect was detected for adsorptionparathion139 and parathion and lindane198 on soils. In a dry
J. Phys. Chem. Ref. Data, Vol. 30, No. 1, 2001

ioorsnomer
bisrbi
n-et
ychilsf
bynglan
hthysth
tu
ela
y
a-in
gllle
oiorrp
fe
ionetut
.dioniais,
pH,batefbedeith
ayscat-an
hatdenta
the
cityy
ho-he
eoricno-. Inthe
in
ried
rp-extreya-
by
e pHm
as-heril-
yor
s ining
r
tedt at
200200 DELLE SITE
soil–hexane–parathion system the slightly polar parathmolecules efficiently compete with the apolar hexane mecules for adsorption sites.139 Generally as the soil watecontent increases, parathion adsorption decreases becauthe decreasing contribution of the soil mineral fractioWhen soils are fully hydrated, adsorption of the organic sutes by soil minerals becomes relatively insignificant copared to the uptake by partitioning into soil organic mattpresumably because water is preferentially adsorbedminerals.198 Lindane shows an uptake on dry soil whichlower than that of parathion and a reduced amount adsoat 2.5% water in soil. These differences are consistent wthe low polarity of lindane relative to parathion, making lidane a less potent adsorbate, and thus a weak compagainst water, for adsorption on mineral surfaces.
It was suggested236 that the sorption of parathion on drsoils occurs by cation–dipole interaction, which is mustronger than the hydrogen bonding interaction in wet so
Bowman et al.237 studied the adsorptive behavior omalathion on Na-, Ca-, Cu-, Fe-, and Al-montmorilloniteIR spectroscopy and x-ray diffraction. At RH exceedi40%, malathion penetrated the interlayer region of the cand was adsorbed as a double layer, giving an expansio5.6 –6.5 Å. The mechanism of adsorption was througH-bonding interaction between the carbonyl O atoms andhydration shell of the saturating cation. In dehydrated stems, a direct ion–dipole interaction occurred betweencarbonyl O atoms and the saturating cations. The magniof both interactions increased with cationic valence.
Spenceret al.238,239found that the vapor density of lindanand dieldrin was high when more than a monomoleculayer of water was present in soil and decreased markedldecreasing the soil water content.
Diffusion coefficients of disulfoton and dimethoate insilt loam soil varied little with concentration of both compounds, but increased rapidly for dimethoate with increasmoisture content from 10% to 41%.240 In contrast, for disul-foton, which is more volatile, less soluble, and more stronsorbed than dimethoate, diffusion coefficients were smabut did not change much as the soil became drier.
Dao and Lavy241 reported that a decrease in water:sratio and in soil moisture content led to an increased adstion of atrazine. At water to soil ratio equal to 0.4:1, adsotion of atrazine increased by increasing the CaCl2 concentra-tion.
The pH values of the clay systems did not appear to afadsorption of slightly polar linuron and malathion.242
Hance212 studied the effect of pH and exchangeable caton the adsorption of two substituted urea and five triaziby a montmorillonite. The adsorption of the ureas was virally independent of pH and exchangeable cation, whereasadsorption of the triazines was influenced by both factorswas postulated that the less polar ureas are adsorbephysical forces and possibly the formation of coordinatcomplexes with exchangeable cations, while the basic trines are adsorbed by a combination of these two mechanplus protonation and consequent ion exchange reactions
J. Phys. Chem. Ref. Data, Vol. 30, No. 1, 2001
nl-
e of.l--,y
edth
itor
.
yofae-e
de
rby
g
yr
lp--
ct
ns-heItby
z-msthe
relative importance of each process being determined byexchangeable cation and the characteristics of the sormolecule. Infrared studies243 suggested that adsorption odiuron among other phenyl ureas on montmorillonite mayattributed to an interaction of the carbonyl of the herbiciwith exchangeable cations on external surfaces and wedge aluminum groups.
In general, the adsorption of substituted ureas on clincreased with the polarizing power of the exchangeableion, indicating that electrostructured water molecules playimportant role in the adsorption process.244 The effect of saltconcentration was almost negligible up to 1.0 N; above trange the adsorption increased and became very depenon the ionic strength. The salting-out effect was due todecrease in solubility of the nonelectrolyte in water uponaddition of a salt.244,245
The K–clay systems showed a greater adsorption capafor linuron and malathion than Ca-, Mg-, and H/Al–clasystems, due to the greater dispersing effect of K ion.242 Thereduced adsorption of the pesticides by Mg and Camoionic clays, particularly with linuron, was ascribed to tformation of polyplatelets.
Bowman and Sans246 investigated the influence of thsaturating cation on the adsorption of organo-phosphpesticides, parathion, methyl parathion, fenitrothion, amiparathion, and paraoxon by montmorillonite suspensionsall cases the saturating cation distinctly influencedFreundlich-type adsorption, with adsorption decreasingthe following sequence: Fe2
31, Ca221, Na2
1 montmorillonite.Adsorption of these compounds at low concentrations vainversely with their water solubilities in Na1- andCa21–montmorillonite suspensions. Only paraoxon adsotion was slightly greater than the compound with the nlower solubility, aminoparathion. Aminoparathion was mothan 99.9% adsorbed from solution bFe31–montmorillonite, suggesting the possibility of protontion of the – NH2 group by the acidic clay surfaces.
The effect of pH on the adsorption of basic s-triazinesmontmorillonite clay was very similar for all compounds.247
The amount of each compound adsorbed increased as thof the solution was lowered, until an adsorption maximuwas reached. Lowering the pH still further resulted in releing a portion of each of the compounds into solution. Tmaximum adsorption of each compound by the montmolonite clay occurs in the vicinity of the pKa value.248,249AtpH values higher than pKa the compound is present primarilin the molecular form and is adsorbed by H bondingthrough polar adsorption forces. A decrease of pH resultincreasing the protonation; the adsorption of the resultmonovalent cation occurs by displacing a Na1 ion from theclay surface. At pH values lower than the pKa the increasedconcentration of H1 ions may compete with the cation fosites on the clay. The presence of other ions like Na1 orBa11 has the effect of decreasing the amount of protonacompound adsorbed because of some competition effecthe sorption sites~e.g., carboxyl groups! of the organic col-loids.

n
g,xeltsthslcaa
xtaoteia
tednit
he
alhxiac,lsnsio
t ts
adulth
inon-en
oyst
c
no
ex
tionat-ighP
ex-nu-om-byry-ereto
rrbed,thesfka-inglayof
re-
o--
ondes-
n-
u-ce
nstent
e
c
ine,usingsely
lar
he
ad-soil
ady
ed,
201201SORPTION OF ORGANIC COMPOUNDS
Several mechanisms can be postulated for adsorptioorganic compounds ~basic or acidic! by clayalumino-silicates:250 physical adsorption, hydrogen bondincoordination complexes, association or bridging compleand chemical adsorption. Some of them may occur simuneously, depending on the nature of the functional groupthe molecules, the type of clay mineral, and the acidity ofsystem. The authors studied the adsorption of memberherbicide families as s-triazines, substituted ureas, phenybamates, aniline, anilides, phenylalkanoic acids, benzoicids, and picolinic acids on 1–0.2mm montmorillonite clayadjusted to two pH values: 3.35 and 6.80. Regardlesschemical character, adsorption occurred to the greatest eon the highly acid H–montmorillonite compared to the neneutral Na–montmorillonite. The magnitude of adsorptionorganic compounds with widely different chemical characis governed by the degree of water solubility, the dissoction constant of the adsorbate, and the pH of the clay sysA basic compound can be considered 100% associatecompletely dissociated when the pH is approximately 2 ubelow or above the pKa, respectively. For atrazine, pKa is1.68. If the pH of the clay surface is equal to the pH of tsuspension~3.35!, then it would be expected that,10% ofthe compound would be adsorbed. However, experimentit was found that the material was completely adsorbed. Twould indicate that the surface acidity would be appromately 3 units lower than the suspension pH. If the surfpH is greater than the pKa by a magnitude of 1.5–2 pH unitsthen adsorption will be principally due to van der Waaforces. For acidic compounds, on the contrary, adsorptioprincipally dependent upon the pH of the bulk solution; potive adsorption will commence when the pH of the bulk slution is approximately 1–1.5 pH units above the pKa. Ad-sorption increases by decreasing the pH. It seems thaprimary mechanism of acid adsorption is due to proton asciation and adsorption occurring by van der Waals’ typesorption, that is, the compound is adsorbed in the molecform. Hydrogen bonding between the carbonyl group ofacidic compound and the surface also may occur.
Thermodynamic parameters for adsorption of cyanazby peat and montmorillonite saturated with several cati(H1, K1, Mg21, Ca21, Co21, Cu21) seem to indicate that adsorption occurs with a mechanism involving hydrogbonds.140 However, for peat in the acidic~pH 6! and Cu21
samples, a protonation process and adsorption of the prnated species is also likely. For montmorillonite–cation stems the thermodynamic parameters seem to point tofollowing mechanisms: for montmorillonite–Cu21 samples adirect coordination cyanazine–Cu21; for montmorillonite–Co21 samples physical bonding; for montmorillonite–H1
samples physical adsorption plus ionic adsorption.The chemical characteristics of the sorbate strongly affe
the sorption behavior. Harris and Warren251 studied the ad-sorption of herbicides, diquat, 4,6-dinitro-o-sec-butylphe~DNBP!, atrazine, isopropyl N-~3-chlorophenyl!carbamate~CIPC!, and monuron, from aqueous solution by muck~or-ganic soil!, bentonite, an anion exchanger, and a cation
of
sa-ofeofr-c-
ofentrfr-
m.ors
lyis-e
’is--
heo--
are
es
to--
he
ts
l
-
changer. Lowering of the pH resulted in increased adsorpby bentonite of all of the herbicides, except the organic cion, diquat, which was completely adsorbed at both a hand a low pH. The influence of pH was greatest for DNBand atrazine. The DNBP was adsorbed by an anionchanger, but not by a cation exchanger, while CIPC, moron, and atrazine were adsorbed by both. Diquat was cpletely adsorbed by the cation exchanger and only slightlyan anion exchanger. All were adsorbed by muck but to vaing extents. Diquat and paraquat, both organic cations, wadsorbed by montmorillonite and kaolinite at pH 6 up tothe cation-exchange capacity.249
Dioctahedral montmorillonite exhibited a high affinity foparaquat, since when less than 50 me/100 g were adsono paraquat was detected in the solution, irrespective ofsaturating cation.252 Interlamellar adsorption of paraquat wadetected. Weber and Weed253 investigated the adsorption odiquat, paraquat, and prometone by montmorillonite andolinite clays and their desorption using several extractsolutions. The two compounds were adsorbed by the cminerals to approximately the cation exchange capacitythe clays. Approximately 80% of each of herbicides wasplaced from kaolinite clay with Ba21 ions, while a total of5% of each of the compounds was removed from montmrillonite using 1 M BaCl2 solution. Paraquat was preferentially adsorbed over diquat by both clays in competitive istudies. Prometone adsorbed on clays was more readilyorbed with de-ionized water than with BaCl2.
Hayeset al.254 reviewed the interaction between clay mierals and bipyridylium herbicides.
Sorption of low polarity pesticides, like monuron and diron, by soils depends only little by soil pH and the presenof soluble anions and cations.255 OM ~or OC! content in soilswas found to be of primary importance. High correlatiobetween sorption on soils and sediments and OM conwere observed for diuron,245,256,257 fluometuron,258 alkyl-,chloro-, and chlorophenoxy-urea,259 phenyl-ureaherbicides,260 fensulfothion and its sulfide and sulfonderivatives,261 disulfoton,262 and organochloridepesticides.263 Sorption of linuron and malathion by humiacid was higher than that in clay systems.242 Sorption of aseries of insecticides, representative of the organochlororganophosphorus, and carbamate groups, was studiedthree soils and a stream sediment and was found invercorrelated with solubility in water264 and significantly corre-lated with the OC content in soils and sediment. Simiresults were found with carbofuran265,266 and dieldrin.265
Positive correlation was also found betweenKd and CE, be-cause OM is known to contribute from 25% to 90% of ttotal exchange capacity of many soils.265
Organophosphorous and carbamate insecticides weresorbed to greater extents as the OM content of theincreased.122 Destruction of OM by oxidation with H2O2
markedly reduced adsorption. Similar results were alrefound with parathion adsorption by soils.129,267,268It was sug-gested that, in OM rich soils~.2%!, the contribution ofother factors affecting parathion sorption may be mask
J. Phys. Chem. Ref. Data, Vol. 30, No. 1, 2001

rprpathio
Mc
ivebthioaacllo
asneitthe
onut
le
raain
tthon
t
inin
dtia
rre,
e-an
enP
o
io
nlyly-nd
d-
inh
b-c-e-
s ofure
ndndl
onofto
fmssesac-
co-ptor
hy-cerp-nted.sthentonre-ntosi
ndac-os-ndibly-HA
esi-heedof
nicx-n of
202202 DELLE SITE
because the inorganic adsorption surface is covered upOM.129 When the OM was destroyed by oxidation, the sotion decreased considerably. However, with two soils sotion remained very high, in spite of the considerable decreof the OM to less than 0.1%. It was hypothesized thatinorganic soil constituents are very important in parathsorption in soils with very low OM. Biggaret al.269 observedthat parathion has highly polar Pd1 – Od2 and PvS bonds, aswell as a conjugated ring and a polar2NO2 group and isstrongly adsorbed on the clay surface as well as on the O
Soil OM content was the most important factor influening the sorption of phenylurea herbicides by soils.72 Hance259
studied the adsorption of urea and a number of its derivatby different soils. Increasing chain length in the alkyl sustituents and choro- and chlorophenoxy substitution inaryl substituent increased adsorption. There was no relatship between sorption and water solubility; OM content wthe only soil property that could be related to sorptive capity. Then, model adsorbents were prepared by treating celose phosphate powder with a series of alkyltrimethylammnium compounds in which the size of the alkyl group wvaried from C8 to C18. The adsorption of linuron, atraziand EPTC by these materials increased logarithmically wincreasing chain length and was large compared withadsorption of these herbicides by a humic acid and by porganic matter. Since soil organic matter is thought to ctain alkyl groups, it was concluded that the possible inflence of such groups should be considered in discussingmechanisms involved in the adsorption of organic molecuby soil.270
Sorption of diuron was studied with a series of sevearid-zone soil samples having different composition, pH vues ranging from 6.5 to 9.3, and low OM percentage rangfrom 0.1 to 1.7.271 Statistical analysis renderedr 2 values fordiuron adsorbed in relation to CE, SA, and OC equal0.785, 0.754, and 0.476, respectively. It was concludedCE or SA can account for the variability of diuron adsorptiin these soils. Several mechanisms were postulated forsorption of diuron by soils.243,250,272Mainly these includephysical adsorption by van der Waals forces and H bondthat could occur via both the carbonyl oxygen and the amhydrogen. Electrophoretic studies272 showed that substituteurea molecules become positively charged upon dissociain water. Thus, sorption on soils could be explained asion-exchange process. Sorption of monuron is highly colated with soil OM content, while the correlation with pHpercent silt, and percent clay is not significant.273 However,Savage274 did not detect any significant linear correlation btween the Freundlich constant values of chlorbromuronsoil texture, OM content, pH, or water-holding capacity.
OM arising from cane leaf burning in topsoil have befound factors of considerable importance in sorption of PClinuron, diuron, simazine, monuron, and atrazine, in theder, on sugar cane soils.275
No correlations were found betweenKd values measuredfor napropamide on 36 samples of a soil and soil OC fractmeasurements.276 The distribution ofKoc values was more
J. Phys. Chem. Ref. Data, Vol. 30, No. 1, 2001
by--
seen
.-
s-en-s-
u--
heat--hes
ll-g
oat
he
go
onn-
d
,r-
n
variable than the originalKds. However, Gerstl and Yaron277
found that adsorption of napropamide and bromacil was oslightly correlated with the soil clay content but was highcorrelated with soil OM content. The mobility of napropamide in soil columns was reduced with an increase in clay aOM content.278
Kozak et al.279 studied the adsorption of prometryn anmetolachlor by different fractions of soil OM, including humic substances~humic and fulvic acids!, humin, and nonoxi-dable soil organic matter. At pH 6 most of the prometrynsolution is in the molecular form, while metolachlor, whicis a nonionic compound, is totally in this form. Humic sustances showed high affinity for both herbicides. Humin frations adsorbed significant amounts of prometryn, but not mtolachlor. These differences were interpreted on the basidifferent sorption mechanisms due to the different structof the two molecules.
Alachlor and metolachlor adsorption on soils was foupositively correlated with soil OM content, clay content, aSA~EGME! and inversely correlated with herbicidaactivity.280 Other authors281 found that OM content was thepredominant adsorbent for metolachlor in soils. Applicatiof carbon-rich wastes to sandy soil increases sorptionalachlor and may be useful for reducing pesticide leachinggroundwater.282
In a recent review paper, Senesi283 discussed the nature othe binding forces involved and the types of mechanisoperating, often simultaneously, in the adsorption procesof several pesticides onto soil humic substances, humicids, and fulvic acids. These include ionic, hydrogen andvalent bonding, charge transfer or electron donor–accemechanisms, van der Waals forces, ligand exchange, anddrophobic bonding or partitioning. Experimental evidenobtained and interpretation provided for the various adsotion processes proposed were presented and commeSenesiet al.160 showed that multifunctional hydrogen bondand charge-transfer bonds were preferentially involved inadsorption of alachlor at low concentrations, especially owell humified, highly aromatic soil humic acids rich iO-containing groups. Hydrophobic bonding appeared to pdominate at higher alachlor concentration, especially olow-humified, highly aliphatic sludge humic acids. Seneand Testini141 studied the adsorption of two s-triazines atwo substituted urea herbicides by three different humicids ~HA! using elementary analysis and infrared spectrcopy. Adsorption involved ionic bonds for s-triazines ahydrogen-bonding, van der Waals forces, and posscharge transfer in both s-triazines- and substituted ureacomplexes.
Weberet al.284 studied the adsorption of seven s-triazinby organic soil colloids at pH levels from 1.0 to 5.2. Maxmum adsorption occurred at pH levels in the vicinity of tpKa values of the respective compounds. It was concludthat the adsorption of s-triazines was due to complexingthe triazine molecules with functional groups on the orgacolloids and/or adsorption of s-triazine cations by ion echange forces. These mechanisms, based on protonatio

iins
rti
rcbi
itesiuic
bi
Thae
s-hifa
dioppH
in
tly
ig
thtoi
soited
meh
nil
aut
anas
forne,
eent,dro-ynehlo-ely
ys-itu-ils,
tra-soil
-fornts
de-ide
be-hing
ility
ap-t ofattione is
orp-
ult
ide
il
byi-hepHue-onas
tedaskrp-
203203SORPTION OF ORGANIC COMPOUNDS
such weakly basic compounds, may be less important wmetribuzin, which is a weaker base than the s-triazherbicides.285 TheKd value for atrazine on soil at pH 3.9 wamore than twice that at pH 8.286 It was observed that foatrazine it is unlikely that ionic forces are appreciable unthe pH nears the pKa value ~1.68 at 22 °C!. Therefore, thisincreased sorption can be attributed to van der Waals foand adsorption via SiOH groups. Adsorption of four hercides having basic properties~buthidazole, pKa50.6; VEL3510; pKa50.9; tebuthiuron, pKa51.2; fluridone, pKa51.7!by H-organic matter, Ca-organic matter, Ca-montmorillonand Cape Fear sandy loam soil, increased with decreapH, suggesting that the adsorption mechanism was molecunder neutral pH conditions and ionic under acidconditions.287
Sorption of metribuzin, an asymmetrical triazine hercide, was measured in surface and subsurface soils.288 Theresults showed that clay was the single best predictor.combination of two variables most related to sorption wclay and pH (r 250.860), while organic matter was not onof the primary variables related to sorption. Savage117 foundthat metribuzin sorption and mobility were significantly asociated with clay content, OM, and water content. Tcompound has a pKa50.99.289 As atrazine, the adsorption ometribuzin increased gradually and its mobility decreasedthe soil pH decreased toward the pKa value. However,metribuzin had greater mobility than atrazine because offerences in water solubility and basicity. Degradationmetribuzin by soil microrganisms decreased as the soildecreased. This compound is more phytotoxic in highsoils than at lower pH levels.290 Soil OM, clay content andSA ~EGME! were correlated with metribuzin adsorptionsoils and activity.291
The Kd values of atrazine were strongly and significancorrelated to the OC content of sandy soils (r 250.84).292
Also, clay contents in the lower subsoil horizons were snificantly correlated to theKd (r 250.51). TheKoc valuesvaried considerably among soils and within soils with depand this was attributed to differences in the ability of OMadsorb atrazine and in contributions from clay mineralsthe lower subsoil horizons.
Binding of atrazine with fulvic acid~FA!293 and HA294
extracted from Laurentian soil, and with the whole soil94 didnot follow the phase distribution model~partition! often dis-cussed for hydrophobic organic compounds. Binding itherms were clearly of the Langmuir type with a definstoichiometric complexing capacity limit, which was founat low solution atrazine concentration. The concentrationwhich bound atrazine reached a saturation limit becasmaller as pH increased. The difference in behavior betwthe atrazine–soil and the atrazine–FA and atrazine–HAbeen interpreted as due to the simultaneous adsorptioorganic fractions and on clay mineral fraction of the sowith the clay term being less pH dependent.
The complexing of atrazine by fulvic acid was studied25 °C and over the pH range of 1.3–6.0 with and withoaddition of 0.1 M KCl or Cu~II!.295 The results indicated tha
the
l
es-
,nglar
-
es
s
s
f-fH
-
,
n
-
ate
enason,
tt
atrazine is hydrogen bonded in a labile equilibrium toidentifiable set of protonated carboxyl groups, which actBronsted acid catalyst for hydrolysis.
In general, the order of increasing sorption by 25 soilsfive triazines was propazine, atrazine, simazine, prometoand prometryne.145 Correlation coefficients between thproperties of the soils andKd values of these triazines havshown that sorption was most closely related to OM conteclay content, CE and exchangeable magnesium and hygen. However, the sorption of prometone and prometrwas less closely associated with percent OM than the crotriazines. There was a tendency for pH to be negativcorrelated withKd values. For atrazine, sorption studies296
indicate that, besides OM, the noncrystalline to poorly crtalline Al and Fe components and other inorganic constents present in a series of particle size fractions of the soespecially,20 mm fractions, provide adsorption sites.
It has been demonstrated that the sorption ability for azine and trifluralin was decreased considerably when thewith high OM content was treated with sodiumhypochlorite.297 However, theKoc values for atrazine sorption by oxidized soil were three times greater than thoseuntreated soil, indicating that the soil mineral componemight have affected sorption of this herbicide.298
Sorption isotherms of dipropetryn and prometryn weretermined using six adsorbent materials possessing a wrange in CE, percent OM, clay levels, and pH valuestween 7.3 and 5.3.299 They showed increasing sorption witincreasing clay content, CE, and OM levels, and decreaspH values. Prometryne sorption was increased and mobwas decreased by increasing the CaCl2 concentration from0.01 to 0.5 N, the pH value remaining constant.300 This effectof increasing sorption by increasing salt concentrationpeared to be due to an increase of the activity coefficienthe herbicide in solution without significantly affecting thnear the clay surface. On the contrary, fluometuron sorpdecreases by increasing salt concentration. If ion exchangassumed to be the primary mechanism of fluometuron stion in an acid environment~pH 5.9–6.4!, the reduction insorption with an increase in salt concentration could resfrom an increase in the ratio of Ca11 to fluometuron ionspresent in the double layer.
Hexazinone is the most water-soluble triazine herbicand acts like a very weak base (pKa;1) by accepting a pro-ton at low pH.234 Sorption of hexazinone correlates to soOC.234,301
Sorption of benzidine, which also may form cationsprotonation of the amino groups, by ‘‘whole’’ soils and sedments was controlled primarily by the concentration of tionized species and was highly correlated with pH, sincecontrols the ratio of neutral to ionized benzidine in the aqous phase.302 When the isotherms were corrected for sorptiof the neutral species, sorption of the ionized benzidine whighly correlated with surface area and negatively correlawith OC content. The OM appeared to coat and hence mionized benzidine sorption sites. On the contrary, the sotion of three nitrogen–heterocyclic compounds~acridine,
J. Phys. Chem. Ref. Data, Vol. 30, No. 1, 2001

-g
ot.stanndo
i
e, ando
O
nb
me
cenglis
-untlomachtean
tve
oftrpee,
ob
s oy-Ao
ra-t
atic-y.tra-.
eri-quattely
hens-
ofosolor-n
ite
47undm-
fol-a
in--ngingorp-elypri-ngetion-c-
arergeh
dm-
wasbyid.ferm-as
m-he
na-in
y,ture
204204 DELLE SITE
biquinoline, and dibenzocarbazole! on 14 soils and sediments was significantly correlated only with the percentaof OC in the soils or sediments.303
Sorption of prometryn, sencor, fluometuron and 2,4-D48 soils304 was found highly correlated with OM contenAlso CE was significantly correlated with sorption of the firthree compounds. Correlation between clay contentsorption was statistically significant only for fluometuron asencor. The effect of pH on the sorption of ametryne by swas significantly greater than that of diuron.256 Kd values forametryne decrease from about 28 to about 3 when pHcreases from 4 to 8. In the same range of pH,Kd values fordiuron range between about 8 and 13. Both compounds wpositively correlated with soil OM content. For ametrynemultiple regression analysis including OM, silt content, apH of the soil gave a good explanation for adsorption. Fdiuron, a correlation was found between adsorption andcontent, and CE.
Organic cations show a different behavior. Diquat aparaquat sorption–desorption behavior was studiedTucker et al.305 Each compound was adsorbed on loamuck, sand, and silt loam soils, which were then washwith water and ammonium chloride solution in sequenThe soil was then treated with 18 N sulfuric acid by refluxifor 5 h. The analysis of these solutions allowed to estabthe amount of ‘‘unbound,’’ ‘‘loosely bound,’’ and ‘‘tightlybound’’ compound, respectively. At high levels of compound in soils, some of the paraquat or diquat is unboand can be leached with water. The ratio of loosely to tighbound compound adsorption capacities varies greatly amsoil types, being approximately 4, 27, and 107 for loasand, and muck, respectively. While the loosely bound frtion was the result of an ion exchange process, the tigbound compound became trapped in the lattice structurthe soil particles. In particular, for muck soil, the high totcation exchange capacity parallels its high loosely boucompound capacity.
Paraquat sorption on a series of sorbents306 decreases inthe following order: Fuller’s earth~Ca–montmorillonite!.humic acids.peat soils.lignin.sandy loam soil.cellulose. Fuller’s earth adsorbed paraquat almost up toCE. Adsorption on peat is low in the presence of high leof calcium. The results indicated that paraquat sorbedweak sorption sites of organic matter can be inactivated, aincorporation into the soil, by transfer to the strong adsotion sites of clays. The adsorption of paraquat by a rangsoils follows the Langmuir isotherm. Up to a limiting valudefined as the strong adsorption capacity~SAC!, the solutionconcentration of paraquat is reduced below the levelchemical detection by suspended soil: this strongly adsorparaquat is preferentially held against 0.1–0.2 N solutionammonium ion. Removal of soil OM by treatment with hdrogen peroxide usually does not greatly change the SThus, strong adsorption of paraquat is primarily a propertyclay minerals, and the presence of expanding lattice mineis of particular importance. Taken with the difficulty of displacement, this indicates that the adsorption of paraqua
J. Phys. Chem. Ref. Data, Vol. 30, No. 1, 2001
e
n
d
il
n-
re
rM
dy,d.
h
dyng,-
lyofld
helner-of
fedf
C.fls
is
strongly influenced by factors other than simple electrostinteraction. Another study45 indicated that paraquat adsorption by the soil organic fraction is faster than that by the claPossibly surface adsorption is instantaneous while penetion into the crystal lattice of the clay is relatively slowUltimately of course, as demonstrated in the dialysis expments, all the paraquat ends up in the clay lattice. Paraadsorbed into the interstices of the clay particle is compleunavailable to microbial attack45 and almost de-activatedherbicidally,306 while the paraquat reversibly adsorbed on tsurface of the organic colloid particles during the early trafer stages can be degraded.
Best et al.307 demonstrated competitive adsorptionparaquat, diquat, and Ca on various adsorbents. A Histand its humic and humin fractions showed preference inder: paraquat>diquat.Ca when adsorption occurred ostrong acid sites and Ca.paraquat>diquat when adsorptionoccurred with weaker acid groups.
Sorption of diquat and paraquat on soils conformed quwell with the linear form of the Langmuir isotherm.308 Sorp-tion maxima obtained for eight soils ranged from 17 tome/100 g. The cation exchange capacity of a soil was foto be the determining factor of adsorption for the two copounds. Paraquat sorbs on sediments by ion exchangelowing Langmuir isotherms, and sorption coefficients showdefinite correlation with the cation exchange capacity ofdividual size fractions.89,309 However, exchange sites in different fractions differed in their effectiveness in sorbiparaquat, with the fine silt and clay exchange sites bemore effective than those of the larger separates. The adstion mechanisms of paraquat by soil organic colloids largdepend on the Donnan properties of the adsorbent. Themary adsorption mechanism appears to involve ion-exchaprocesses where the adsorbents have well-defined caexchange capacities.309 However, secondary specific interations are possible when Donnan potentials in adsorbentslow ~e.g., hydrogen bonding, van der Waals forces, chatranfer processes, etc.!. Such interactions determine the higaffinity of paraquat for humic substances.
Khan310 studied the binding or complexing of diquat anparaquat by humic acid and fulvic acid. Paraquat was coplexed by humic compounds in greater amounts thandiquat, but the amounts of the two herbicides complexedhumic acid were higher than those complexed by fulvic acEvidence is presented for the formation of charge-transcomplexes between the two herbicides and humic copounds. Binding of diquat and paraquat to humic acid wmainly electrostatic in nature.142 Two binding sites are in-volved. Variation in pH suggested that hydrogen ions copeted strongly with the herbicides for the binding sites. Tacidic functional groups on humic acid~carboxylic and phe-nolic! are characterized by an average pKa value of 5.0;therefore at pH values lower than 5.0 an extensive prototion is expected. This is reflected in the large reductionbinding of both paraquat and diquat at low pHs.
Sorption of an organic cation, dodecylpyridinium, on claaquifer materials, and soil strongly depends upon the na
bu
pyi-off hrd
by
awthne-
esan-or
d
x
la
td,ubeo
de
mo
lenslaea
o-n
oangig
th
me
oil
toof
Zn,ex-x-d
en
on
rgex-.forfintbeic,
dic,om
ashtly.
atro-ol-a.
ouldad-nd-ilepH
dif-m-
ionfer-
os-
bybederygto
gen.in-ndsics
c-s
205205SORPTION OF ORGANIC COMPOUNDS
and concentration of the inorganic cations in solution,virtually independent of solution pH.311 Two types of sorp-tion reactions were found to be significant: exchange ofridinium with an alkaly–metal cation, and sorption of pyrdinium with chloride counterion. The sorption behavioracidic compounds, when undissociated, resembles that odrophobic compounds; on the other hand, much lower sotion coefficients are expected for dissociated compoundsto their high water solubility and possibly the repulsionthe surface negative charge of the OM.195
The importance of OC content on sorption ofa-naphthol(pKa59.34) by soils and sediments was evidentiated by Hsettet al.97 However, when the ratio %OC/% clay is belo0.1, clay surfaces are more accessible, and sorption ofcompound is apparently controlled by the clay fraction atheKoc values do not converge. Also bromacil behaves likweak acid (pKa59.3). At pH values lower than 9.3 the major fraction of bromacil is present as neutral moleculTherefore, at these pH values it is adsorbed in this formcorrelates with OC content.312 However, as the pH approaches 9.3, the portion of bromacil present as anionic fincreases, and thus adsorption is retarded.
Picloram is an herbicide of acidic character (pKa53.4). Itssorption by soils and hydrated metal oxides increases bycreasing the pH.313,314 OM is responsible for sorption bysoils, but, when OM content is lower than 0.3%, metal oides are the main sorbing agents.314 Biggaret al.269 estimatedthe relative quantities of picloram adsorbed by the c~0.14%!, OM ~93.79%! and free iron oxide~6.07%! fractionsof the Palouse soil~3% OM, pH 5.9!. The low total adsorp-tion in general and, on clay in particular, may be attributedthe fact that most of picloram is in its anionic form antherefore, interactions with the negatively charged clay sface is highly unfavorable. Sorption on iron oxide canexplained considering that anionic picloram is capablechelating with metal ions with its pyridinium nitrogen anthe carboxyl group forming a five-membered ring. Othauthors313 reported thatK f values for picloram in soils werecorrelated with extractable Al and clay content. Picloramolecule may undergo protonation of the carbonyl groupannular nitrogen from water associated with adsorbed A31.
The effect of pH on sorption of picloram by soils has bestudied by other authors,315–317 who demonstrated that thicompound is sorbed on soil OM especially in the molecuform, while in the ionized form is not readily sorbed. Thaddition of salt to the aqueous solution produces an increof adsorption.316 Also the pH-dependent adsorption of piclram by humic acids and humin is largely due to the ucharged molecules.318 However it has been demonstrated315
that on a sandy loam soil with pH 7.2 and on a silty loam swith pH 5.9 the percentage of sorption was 1.9%–3.6%,26%–33%, respectively, where the range was dependinthe concentration of the solution. These results for so hpH values indicate a significant adsorption of picloram inanionic form.
Picloram sorption was determined on an Aiken silt loaon three cation exchange resins and on a single anion
t
-
y-p-ue
s-
isda
.d
m
e-
-
y
o
r-
f
r
r
r
se
-
ildonhe
,x-
change resin.319 The study was extended to the same ssaturated with some cations (Fe31, Al31, Cu21, Zn21, Ca21),which showed increased picloram adsorption comparedthe native soil. This result was explained on the basisdecreases in the equilibrium solution pH, except for Fe,and especially the Cu treatment, which could not beplained readily by pH changes. The possibility of compleing of the polyvalent cation with soil organic colloids anpicloram was suggested.
Sorption of picloram was observed at pH values betwe6.0 and 7.8, while dicamba was not adsorbed.320,321Dicambais a benzoic acid herbicide with pKa51.9. Low sorption ofdicamba was detected on a soil at pH 6.1, but no sorptionother soils at higher pH values.322 However, dicamba may beadsorbed strongly by soils dominated by variable cha~‘‘pH dependent’’! clays which can have large anion echange capacities due to a net positive charge323
Alkylammonium–clay complexes are effective sorbentsdicamba.324 Solution pH significantly affected the sorption odicamba by organo-clays, with the isotherm inflection ponear the pKa value. Nearly twice as much dicamba couldsorbed in the molecular form as compared to its aniondeprotonated form. Sorption and desorption of basic, aciand nonionic pesticides were studied with OM prepared fra peaty muck soil and with Ca–montmorillonite.121 Asulam(pKa54.82), like dicamba, is an organic acid; dicamba wnot adsorbed by OM, whereas asulam was adsorbed sligAlthough the pH of the water suspension was 5.5, the pHthe colloid surface was probably much lower due to hydgen saturation. At the lower pH, a majority of asulam mecules in solution would be in their molecular form, whilemajority of dicamba molecules would be in anionic formSince OM has a net negative charge, dicamba anions wbe repelled by the OM and asulam molecules would besorbed by weak physical forces or through hydrogen boing. Dicamba was adsorbed by Ca–montmorillonite, whasulam was not. Both herbicides are 100% ionized at theof the clay suspension. One possible explanation of thisference is that the negatively charged dicamba ion coplexes with the Ca ion on the clay surface, while asulamcannot form complexes due to some type of steric interence.
Bentazon is a herbicide of acidic character due to the psible ionization of the N–H group (pKa53.2).325 The herbi-cide was not adsorbed by any of twelve selected soils orcation exchange resin, but was almost completely adsorby charcoal and by an anion exchanger. Bentazon is vmobile in soils due to its high water solubility and stronanionic characteristics which result in a lack of attractionthe predominately negatively charged soil colloids. Tillapractices affect sorption of bentazon and its degradatio46
Under no-tillage, accumulation of plant residue leads tocreased soil organic matter near the soil surface, which teto enhance sorption of nonpolar or moderately polar organand affects degradation processes.
Chlorsulfuron is a sulfonylurea herbicide of acidic charater (pKa53.58)326 owing to the acidic sulfonamide group. It
J. Phys. Chem. Ref. Data, Vol. 30, No. 1, 2001
tele
e
eto. I
aistebstse
ob
e7
ona
tosiby-Dng,bere
paheermc
ththe.itfeo
ubxre
a-ob-
andith
tho--by
flownsthe
ility
redro-re-enen-tionthateeenhe-tage
the
6.5-
rallat,ofose
atact-of
om-
entf
us
206206 DELLE SITE
adsorption is positively correlated with soil organic matand negatively correlated with pH, while no or negligibadsorption occurs to clay silicates.326–328Also, chlorsulfuronphytotoxicity increased with increasing soil pH and reacha maximum at pH 6.9.329 Chlorimuron, belonging to thesame class, has a pKa54.2 and behaves in the samway.330,331Its adsorption was higher in no-tilled soils, dueenhanced plant residue accumulation, than in tilled soilsadsorption in soil decreased with increased soil pH.
2,4-D is a weak acid with a pKa of 2.73332 or 2.99.181 Inthe soil slurries the pH of the solutions is normally neneutral or slightly alkaline, so that very little of the 2,4-Din the molecular form. Thus, a reduced sorption is expecconsidering that the buffering capacity of the soils shouldsufficient to prevent a measurable shift in the pH value aresult of the addition of the compound in the experimenHowever, in some cases it was observed that the pH valuthe surface of the soil can be significantly reduced, withcertain amount of compound being adsorbed. Another psible explanation of anomalous partition coefficients maythe biotic decomposition of 2,4-D in the soil.
In general, soil OM (r 50.83), exchangeable aluminum(r 50.82), and low soil pH (r 520.79) promote 2,4-Dadsorption.333 By considering only the surface horizons, thcorrelation of adsorption with soil organic matter was 0.7but improved markedly with soil pH (r 520.92). For sub-soil horizons the exchangeable aluminum becomes the msignificant soil parameter (r 50.93), whereas the correlatiowith soil OM was 0.83. Sorption data were obtained ationic strengthm50.075 (CaCl2). By increasingm in solu-tion, adsorption is enhanced; this result is probably duecorresponding decrease of the pH value of the suspendue to replacing of acidic hydronium and aluminum ionsCaCl2. This mechanism may promote the molecular 2,4sorption to the colloid surfaces through hydrogen bondiThe results of a ring test124 indicated that the influence of pHwhich is important for atrazine, dominates the sorptionhavior of 2,4-D in soils. Clay content and OM content aonly of limited importance.
Montmorillonite ~M! and vermiculite~V! were modifiedby treatment with decyammonium~D! chloride to obtain therespective organo–clay sample.334 Langmuir and Freundichsorption parameters indicated an increase of sorption caity for 2,4-D of clays after decyammonium exchange. Tsorption at different pHs showed that molecular forms wpreferentially adsorbed on D–M, whereas anionic forwere adsorbed on D–V. The D–V sample showed muhigher and stronger sorption capacity than D–M, due todifferent arrangement of D cations in the interlayer of bominerals, as a consequence of their different layer charg
Boyd335 studied sorption of undissociated phenol andderivatives on a soil sample at pH 5.7 to evaluate the efof the presence of other functional groups in the phenol mecule. Introduction of – CH3, – OCH3, – NO2, or –Cl groupsresulted in increased sorption due to decreased water solity. Moreover, sorption of substituted phenols, with the eception of o-nitrophenol, was generally greater than p
J. Phys. Chem. Ref. Data, Vol. 30, No. 1, 2001
r
d
ts
r
d,ea.atas-e
,
st
n
aon
.
-
c-
eshe
sctl-
il---
dicted for hydrophobic sorption (logKoc– logS) ~Sec. 12.2!,probably due to H-bond formation. In particular, for metand para-substituted phenols a positive relationship wasserved between substituent electron-donating abilitysorption. These phenols apparently formed H bonds wsites on soil surfaces by acting as a proton acceptor. Orsubstitution of – CH3, – OCH3, and –Cl resulted in less sorption than para-substitution, suggesting steric hindrancethe ortho substituents of H-bond formation.
Sorption and desorption of phenol, 2-chlorophenol~2-MCP!, and 2,4-dichlorophenol~2,4-DCP! by a fine andcoarse sediment fraction were measured in a continuousstirred cell.100 The pHs of uninteracted sediment suspensiowere in the range 6.21–6.35. The extensive sorption,shape of the isotherms~S-type!, and the very highKoc valueswith respect to those predicted on the basis of the soluband the octanol/water partition coefficient~Secs. 12.1 and12.2!, indicate a substantial contribution to sorption by mospecific sorbate–sorbent interaction than by general hyphobic forces. The mechanism of sorption is likely, thefore, to involve extensive hydrogen-bond formation betwethe sorbate phenolic hydroxyl groups and the hydrogbonding sites on the sediment organic matter. The sorpof these phenolic compounds was also greater thanfound by Boyd335 with soil samples. This result should binterpreted on the basis of the complex relationship betwthe behavior of soils and sediments. Sorption of some pnols on soils has been found dependent on the perceniron oxides and solution pH.336
Laboratory experiments have been conducted to studysorption of nine chlorinated phenols~from di- to penta-! bysediments and aquifer materials in the pH range betweenand 8.5.337 It was shown that sorption not only of the nondissociated phenols but also of their conjugate bases~pheno-lates! can occur. However, the marked increase of the ovedistribution coefficients with decreasing pH suggests thunder the conditions used, the contribution of the sorptionthe deprotonated species is generally small except for thcases where the difference between pH and pKa is large. Thishappens with 2,3,4,6-tetrachlorophenol~2,3,4,6-TeCP! andPCP. Thus, as a first approximation, the experimental dwere analyzed by using a simple partitioning model negleing phenolate sorption as well as a possible dissociationthe phenol in the organic phase. The sorption of these cpounds can be examined by the following equations:
sorption: Kd5@AH#s/@AH#w ,
dissociation: Ka5@A2#w@H1#w /@AH#w ,
At5@A2#w1@AH#w1~M s/Vw!@AH#s,
Aw* 5@A2#w1@AH#w ,
where the subscripts w and s refer to water and sorbphases, respectively,At is the total initial concentration othe phenol in the aqueous phase~before sorbent is added!,Aw* is the total equilibrium concentration in the aqueophase~after equilibration with sorbent!, Vw is the volume of
e
u-
e
CpH
eleinno
eextsscotlya
lasoo
ithdih
,5
tely
P
30lc
to
s-cies
arolu-
tion
theex-
e-thesti-
o a
r-heici-k
u-ng
n-
tedf
Eq.
7,
207207SORPTION OF ORGANIC COMPOUNDS
the aqueous phase, andM s is the mass of the sorbent phasCombination of the previous equations yields the relation
D5KdQ, ~10!
whereD is the experimentally determined overall distribtion ratio
D5@~At2Aw* !/Aw* #~Vw /M s!
andQ is the degree of protonation
Q51/~11Ka/@H1#w!. ~11!
Thus, sorption coefficientKd for nonionized phenol can bobtained from the linear regression ofD vs Q @Eq. ~10!#. Agood fit was obtained for all compounds except 2,3,4,6-Teand PCP, which are almost fully deprotonated in therange of the experiments. For these two compoundsKd val-ues of protonated species were derived from the linear rtionship between logKd of the remaining phenols and thlogarithms of their corresponding relative retentionreversed-phase liquid chromatography, using methawater, 1/1 v/v at an apparent pH;2. In natural waters of lowionic strength~i.e., m<;1023 M! and of pH not exceedingthe pKa of the compound by more than one log unit~i.e.,pH2pKa<1!, the contribution of phenolate sorption may bneglected and the overall distribution coefficient may bepressed by Eq.~10!. However, the results of the experimenconducted with these systems indicate that, in certain cathe sorption of the phenolate species must be taken intosideration. This indication derives from the significanpositive intercepts found when the experimental dataanalyzed with a linear regression according to Eq.~10!.Similarly to the nonionized species, the degree of phenosorption is strongly dependent on the OC content of thebent. It depends also on the ionic strength in the aquephase.
Lagas111 conducted a series of sorption experiments wfive chlorophenols and natural and synthetic soils havingferent composition and pHs ranging from 3.4 and 7.5. TKd values were obtained for 3-MCP, 3,4-DCP, 2,4trichlorophenol~TCP!, 2,3,4,6-TeCP, and PCP. TheKoc val-ues for the undissociated species were obtained with thelation
Koc5Kd / f ocf nd,
where f nd is the fraction of undissociated species calculaas in Eq. ~11!. The calculation has been conducted onwhen pH~soil!,pKa11. The logKoc values for the five com-pounds were then correlated with logKow . The standard er-ror of fit wass50.19. TheKd values corresponding to TeCand PCP on loamy soils (pH.pKa11) allowed to calculateKocs for the dissociated species of these two compounds~280and 500, respectively!. These values resulted in about 15–times lower than those of the undissociated species, calated with the correlation logKoc2 logKow ~8000 and 25 000,respectively!. Bellin et al.338 adopted the same procedurecalculateKoc for undissociated species of PCP from theK f
values, using the relation logKoc(und.)5 log(Kfoc /Q).
.
P
a-
l/
-
es,n-
re
ter-us
f-e-
re-
d
u-
Lee et al.339 derived an equation which allows us to dicriminate sorption of dissociated and undissociated speto obtain the totalKd value.
The fraction of neutral phenol in aqueous solution,Q, canbe expressed also in terms of pH (2 log@H1#) and pKa
(2 logKa)
Q5@AH#/~@AH#1@A2# !5~1110pH2pKa!21
PCP (pKa;5) is essentially 100% neutral at pH,3 and iscompletely ionized at pH.7.
For sorption by soils, the distribution of the moleculform of phenol and phenolate between the sorbed and stion phases may be defined as
Kd5~@AH#s1@A2#s!/~@AH#w1@A2#w!,
where the subscripts s and w refer to sorbed and soluphases, respectively.
The predictedKd for the neutral~n! and ionized~i! form ofa weak organic acid can be expressed as
Kdn5@AH#s/@AH#w
and
Kdi5@A2#s/@A2#w ,
respectively.Assuming that only the neutral form is sorbed and that
OC content of the sorbent predominantly determines thetent of sorption, then
Koc,p5Koc,nQ, ~12!
whereKoc,n5Kdn/ f oc, and the subscript p refers to the prdicted value. If there is a transfer of the ionized species toorganic phase, the predicted sorption would be underemated by Eq.~12!.
Assuming that also the ionized forms can be sorbed thydrophobic surface~by formation of neutral ion pair or bysorption of the hydrophobic part of the organic anion!, then
Koc,p5Koc,nQ1Koc,i~12Q!, ~13!
whereKoc,i5Kdi / f oc. The sorption predicted for a weak oganic acid in its ionized form would be less than that for tneutral form because of the difference in their hydrophobties. Equation~13! may better describe sorption of a weaorganic acid than Eq.~12!, because sorption of both the netral and the ionized forms are accounted for, while allowithe magnitude of the individual sorption coefficientsKoc,n
andKoc,i to be different. If the anionic species does not cotribute significantly to the overall sorption process~i.e., ifKoc,n@Koc,i!, Eq. ~13! reduces to Eq.~12!. The authors339
reported several PCP sorption data, some of which collecfrom the literature, and plotted logKoc values as a function opH. The model given by Eq.~13!, where the sorption of theionized species is also considered, describes better than~12! the data over the entire pH range. LogKoc shows aconstant value of about 4.3 between pH 0 and pH 3.5~sorp-tion of neutral species!, then a gradual decrease until pHand finally a constant value of about 2.6 until pH 14~sorp-
J. Phys. Chem. Ref. Data, Vol. 30, No. 1, 2001

ofts
5
on
s
th
Texe
ice
.4r
0gre
le
/el-
l-
tu
iclcucere
epTh
ed
ths theeiso-earbe-a-
wo-epHility
eousatednic
ndci-
rp-
or
car-
einonssticoftheby
ext
d-
-
n-ms.
or-il
nceby
lant,
208208 DELLE SITE
tion of ionized species!. In this study an increased sorptionPCP2 with increasing ionic strength for batch experimenconducted in aqueous CaCl2 solutions was observed. TheKd
values for PCP by Eustis soil in the pH,3 increased by afactor of 1.3 over them range of 0.0015–1.5. A value of 1.was predicted by Karickhoff.52 For the pH.7 region sorp-tion by the same soil was studied from aqueous solutiwith m50.01– 1.4. PCP sorption increased by a factor of;6over thism range. Moreover, the data by the same author339
and those by Westallet al.340 on the distribution of PCP inoctanol–water systems and by Schellenberget al.337 on theretention of chlorophenols on a C-18 column, supportedconclusion that for pH.7 the formation of neutral metal–phenolate ion pair must be involved in these processes.ionic strength of most environmental settings does notceed 1023 M; thus, ionic strength effects can usually be nglected.
A recent study106 regarding the effect of dissolved organmatter ~DOM! on sorption of PCP by soil confirmed thresults obtained in previous investigations. TheK f , Kd , andKoc values were generally lower at pH 6.1 than at pH 5The Q values were 0.183 and 0.043 at pH 5.4 and 6.1,spectively. In the DOM-poor fraction, theKoc for nonionizedand that for ionized PCP were found to be 27800 and 3respectively, at the ionic strength of 0.02. These results aquite well with the predicted or measured values obtainfrom solutions ofm50.015.339 The contribution of neutraion pair in the sorption of PCP2 is possible but needs to bevaluated.
The averageKoc values for 2,4,6-TCP with two soils at pH6,7, and 7.7 were 2.200, 620, and 170, respectively.341 Sorp-tion isotherms followed Freundlich equation with 1n50.76. Sorption of the phenolate anion was considered nligible. The Koc,n value for the undissociated form was caculated as follows:
@AH#oc5Koc,n@AH#w1/n
5Koc,n$~@AH#w1@A2#w!Q%1/n
5Koc~@AH#w1@A2#w!1/n.
Therefore,Koc,n is given by
Koc,n5Koc/Q1/n,
which is Eq.~10! applied to a nonlinear isotherm. The caculated value ofKoc,n was 3590.
Jafvert342 examined the sorption to sediments and sarated soils of selected organic acid compounds, 4-~2,4-dichlorophenoxy!butiric acid and silvex. By varying intrinsiccompound properties~pKa and hydrophobic character! andsediment properties~ionic strength and composition, organcarbon content and aqueous pH! sorption of both the neutraand anionic forms of these compounds was shown to oc
Stapletonet al.343 observed that the pH range of surfaand groundwater is approximately from 4 to 9. Therefoionizable organic compounds with a pKa in the same rangeare of special interest because both the protonated and dtonated species may be found in the aqueous phase.
J. Phys. Chem. Ref. Data, Vol. 30, No. 1, 2001
s
e
he-
-
.e-
5,eed
g-
-
r.
,
ro-ey
investigated the sorption of PCP to a surfactant-modificlay ~hexadecyltrimethylammonium-montmorillonite! andthe solubility of PCP as a function of pH and ionic strengand developed a model that described the sorption acrosexperimental pH range~4–8.5!. The model represented thsorption of the deprotonated species by a Langmuir-typetherm and the sorption of the protonated species by a linisotherm. It was suggested a partitioning mechanismtween the hydrophobic section of the modified clay and wter for the undissociated species, and sorption to the tdimensional lipophilic surface with a counterion in thdouble layer for the phenolate species. Between pH 4 and8.5, the sorption decreased by three times and the solubincreased by 3 orders of magnitude as the dominant aquspecies changed from the protonated to the deprotonform. Sorption of the phenolate species increased with iostrength when pH was.8.
Seipet al.344 found that at pH 7.4, TCPs, TeCPs, PCP, atetrachloroguaiacol, which are almost completely dissoated, move fairly easily through the soil.
In conclusion, OM may have a great importance in sotion of polar organic compounds.39,262,275,345However, thespread inKoc values is generally greater than that found fhydrophobic compounds. A comparison of the literatureKoc
values showed a variance of a factor of 40.163 For the mostpolar and ionizable compounds, like amines, amides orboxilic acids on soils, the variation inKoc values was up to 2orders of magnitude.
Stevenson48 reported the literature results indicating thmajor role played by the OM in sorption of herbicidessoils. The conclusion of his analysis was that divalent cati~diquat and paraquat! would be expected to be the mostrongly bound due to their large affinities for soil organcolloids, followed by the weakly basic s-triazines capablebeing protonated under moderately acidic conditions. Fors-triazines, differences in sorption can be accounted forvariations in pKa, with the more basic compounds~high pKa!being the strongest sorbed. Herbicides included in the norder of sorption are those having very low pKa values butwhich contain one or more polar groups suitable for H boning ~phenylcarbamates, substituted ureas!. Finally anionicpesticides~alkanoic acids! may or may not be sorbed, depending upon the soil reaction.
The Koc values fora-naphthol decreased from;436 to;3 cm3 g21 with increasing polarity index@~O1N!/C# anddecreasing aromaticity of organic sorbents, lignin~organo-solv!, lignin ~alkali!, collagen, chitin, cellulose, andcollagen–tannic acid mixture!.346 It was concluded that thequality of organic sorbents significantly influences partitioing of hydrophobic organic chemicals in aqueous systeAtrazine and terbuthylazine have greaterKoc values with aloamy clay soil showing the highest degree of humifiedganic matter~85.9%! compared to a calcareous clay so~73.1%! and a high clay soil~68.3%!.347
Nonionic surfactants are often added to post-emergeherbicide sprays. They affect herbicide–plant interactionsincreasing the area of contact between herbicide and p

er
tacaoisr
iokyn-s
nanins
nt
ao
tiou.rpma
su
n
defi
olaics
tin
minasedillpr’’sehein
yfu-nt.t toes,ur-A
ffu-e,ulkffi-
eveorshan
pacetile-ca-
gly
il-of
s-msoilla-as
linof
aster
ent,C.antin
rep inintheh abedn-is-toheolu-r.ldov-C
209209SORPTION OF ORGANIC COMPOUNDS
and by assisting in plant uptake of the herbicide. The effof three nonionic surfactant on 2,4-D adsorption and degdation in soil was investigated.348 Adsorption of 2,4-D wassignificantly decreased by the least water-soluble surfacand degradation was also significantly delayed. Severalionic surfactants increase the adsorption of diuron onto swhile the nonionic surfactants did not affect thadsorption.349 It is suggested that, due to the cationic natuof the surfactant, it is chemically adsorbed by ionic attractonto soil particles which are negative, thus leaving the alchains to form lipophilic layers on these particles. Diurowhich shows affinity for lipophilic materials, is thus adsorbed into these layers by physical van der Waals force
In an attempt to find a way to reduce the soil contamition by pesticides, the effect of the presence of a catioanionic or nonionic surfactant on sorption of diazinoacephate, atrazine, and ethofumesate by a sandy loamwas investigated.350 Although the increase in the apparewater solubility, this effect is extremely complex, becausedepends on the degree of hydrophobicity of the pesticidethe type of surfactant, as well as on the concentrationsurfactant in the system. For instance, picloram adsorpfrom aqueous solutions and from nonionic and anionic sfactant solutions was greater on soils at pH 5 than at pH 7313
The anionic surfactant competed with picloram for adsotion sites on the soils at pH 5. Picloram adsorption frosolutions containing 0.1% and 1% cationic surfactant wgreater than that from aqueous and anionic and nonionicfactant solutions.
Several important results regarding sorption of polar aionizable compounds have been obtained:~i! water competeswith chemicals for sorption sites; sorption increases bycreasing water content. Such an effect, already mentionednonpolar compounds, will be evidentiated much bettersorption of volatile compounds~Sec. 4.3!; ~ii ! also for polarcompounds organic matter is involved in sorption, butKoc
values show variations larger than those found for nonpcompounds;~iii ! Koc values for ionizable compounds, basor acidic, which can exist as dissociated or neutral formdepend on pH and on pKa of the compound. A differentvalue of Koc is found for the two forms, due to differensorption mechanisms, with the undissociated form behavlike a nonpolar compound.
4.3. Volatile Compounds
Ehlerset al.352 developed equations to describe the cobined vapor and ‘‘nonvapor’’ phase diffusion of lindanesoils. The quantity of diffused lindane appears to increlinearly with increased lindane concentration in air-driGila silt-loam soil up to about 20 ppm, when lindane wreach maximal vapor density. Then, vapor diffusion aproaches zero and all the diffusion is in the ‘‘nonvapophase. At a 10% soil water content, 50% of lindane diffuin the Gila silt loam in the vapor phase, and 50% in t‘‘nonvapor’’ phase. At near saturation, total diffusion isthe ‘‘nonvapor’’ phase. In a second paper the authors353 gave
cta-
ntt-
il,
enl,
.-c,,oil
itndfn
r-
-
sr-
d
-orn
r
,
g
-
e
-
s
further information on how lindane diffusion is influenced bsoil water content, bulk density, and temperature. The difsion coefficient is nearly zero in soil of 1% water conteWith an increase to 3% water content, which is equivalentwo layers of water between the montmorillonite clay platwater is able to displace the lindane from the adsorbing sface so that the diffusion coefficient becomes maximal.small additional increase in water content reduces the dision coefficient to about one-half of the maximal valuwhich remains constant up to saturation. Decreasing bdensity or increasing temperature raises the diffusion coecient.
Harvey351 studied the adsorption of seven dinitroanilinherbicides to a silt loam soil in relation to their respectiphytotoxicity. The results indicated that absorption of vapof these herbicides by plants may be more important tabsorption of them from soil solution.
The movement of organic vapors in the gaseous headsof unsaturated aquifers may be a significant aspect of volaorganic compounds~VOCs! transport. It has been demonstrated that dry soils and clays have sizeable adsorptionpacities for VOCs, but the presence of water may stronreduce these adsorption capacities.35,354,355 Therefore, thewater content in soil plays a very important role in volatization of organic compounds. The vapor densitydieldrin,239 lindane238 and trifluralin356 decreases by decreaing the water content in soils and it is reduced to minimuvalues in the presence of dry soils. For example, at 19%water content, the trifluralin vapor density, or potential votility, was 3000–5000 times greater than when the soil wair dry. As the soil water content was reduced, trifluravapor density began to decrease. Vapor densitiesdieldrin239 at 100mg g21 or lindane238 at 10mg g21 in Gilasilt loam did not decrease until the soil water content wreduced below approximately one molecular layer or waequivalent to approximately 2.7% water in Gila silt loam.
Wade357 studied sorption on soils of ethylene dibromid~ED! in the vapor phase as a function of moisture contestarting from soil samples dried in a current of air at 32 °The results were calculated as the number of mg of fumigsorbed per 100 g of dry soil from a constant concentrationair of 10 mg dm23. The curves, amount adsorbed-moistucontent, were at first linear, and represented a sharp drothe amount of fumigant sorbed for an initial small increasemoisture content. The rate of fall became less step asmoisture content continued to increase, passed througminimum, and then became linear again, the amount sorrising slightly with increasing moisture content. This last liear part of the curve ranged roughly from 40% to 70% moture content with the Black Fen soil and could be takencorrespond with the field range of moisture content. Tsmall increase of amount sorbed was attributed to the stion of the fumigant in the increasing amount of soil wateComparison of ED sorption on three soils, over the fierange of moisture content, demonstrated that the factor gerning the amount of fumigant sorbed by a soil is its Ocontent.
J. Phys. Chem. Ref. Data, Vol. 30, No. 1, 2001

%thRger ioedna
thntu
beao
andmdnl-s–
thn
esDthe
ne,
aseen
he
foeatn
-tiooray
d,t
ci-la-dg
1.7
heil.of
um-the
oil;s ofdly
tiesre-theof
eousr ofthe90%ithctor
M,en
ingporple.po-
at
hee-
e,
en-
210210 DELLE SITE
The sorption isotherms of ED on dry soils354 appeared tobe of BET type II ~BET-BDDT classification!.358 The iso-therms for the 5% and 10% relative humidity~RH! weresimilar but showed progressively lower sorption. Above 20RH, the isotherms passed over into type III, the knee ofcurve having disappeared. The isotherms for 30%–50%were mostly linear. The great influence of small percentaof water at lower humidities seems to indicate that watecompeting more successfully for the soil surface than dED. Experimental results indicated that water alone formemonolayer at about 10% RH. At this value of water contesorption of ED is approximately halved with respect to thon dry soil and at humidities greater than 10%–20%mechanism of sorption appears no longer predominacompetitive. The competitive nature of sorption at low hmidities was further demonstrated showing that ED soron dry soil can be displaced by water vapor. Finally, it hbeen shown that, when the water content in soil is that cresponding to field capacity, solution of ED in soil water caccount for a fraction of the material sorbed, while the adtional ED is sorbing on the water interfaces. The isotherfor ED sorption on Ca-montmorillonite at 5%, 10%, an20% RH lie above that for the dry clay, indicating an expasion of the crystal lattice which allows entry to ED moecules. Jurinak and Volman359 studied the thermodynamicof ED vapor adsorption by Ca–montmorillonite and Cakaolinite.
Sorption of ED in the vapor phase was studied inpresence of air on 20 different soils at moisture contecorresponding to field capacity.360 All isotherms were linearand the sorption coefficient~slope of the isotherm! could becorrelated with SA, OM content, moisture content and lclosely with clay content. In a study of the diffusion of Evapor through soil, the importance of blocked pores anddynamic equilibrium existing between vapor and sorbphases has been evidentiated.361
Chiou et al.362 determined vapor sorption isotherms ooven-dried~140 °C! Woodburn soil at 20–30 °C for benzenchlorobenzene ~MCBz!, m- and p-DCBz, 1,2,4-trichlorobenzene~TCBz!, and water as single vapors andfunctions of RH. Isotherms were plotted as milligrams takup per gram of whole soil versus the relative vapor conctration of the compound (P/P0), whereP is the equilibriumpartial pressure andP0 the saturation vapor pressure at tsystem temperature. The use ofP/P0 in the isotherm nor-malizes the activity~or chemical potential! of each com-pound with respect to its own pure state. The isothermsall compounds on dry soil samples are distinctively nonlin~BET type-II isotherms!, with water showing the greatescapacity. The coincidence of two isotherms for m-DCBz a1,2,4-TCBz on dry soil at 20 and 30 °C atP/P0.0.05 isevidence that the enthalpies of~mineral! adsorption are essentially the same as the enthalpies of vapor condensaThis is the basic assumption in the BET adsorption thewith adsorbates approaching and exceeding the monolcapacity. The BET equation is
J. Phys. Chem. Ref. Data, Vol. 30, No. 1, 2001
eHs
ssattely-dsr-
i-s
-
ets
s
ed
n-
rr
d
n.yer
~P/P0!/@Q~12P/P0!#5@~C21!P/P0#/CQm11/CQm,~14!
whereQm is the monolayer adsorption capacity~mg g21 ofsoil! and C is related to the net molar enthalpy~DHm, kJmol21! of adsorption atQ<Qm
2 ln C;~DHm1DHv!/RT,
whereDHv is the enthalpy of vaporization of the compounR is the gas constant, andT is the system temperature. A ploof (P/P0)/@Q(12P/P0) vs P/P0 should yield a straightline, with a slope of (C21)/(CQm) and an intercept of1/(CQm), from which Qm and C can be determined. Theisotherms are very well described by Eq.~14! over the rangeP/P050.05– 0.30. The BET monolayer adsorption capaties for all compounds with dry soil were established at retively low P/P0 ~<0.18!, except for benzene which occurreat P/P0;0.23.Qm values ranged between 5.54 and 9.53 mg21 for alkylbenzenes and that for water was equal to 1mg g21. The DHm values atQ<Qm were noticeably moreexothermic than respective2DHv values by about 6.3–10.5kJ mol21; these enthalpy effects are consistent with tdominance of mineral adsorption with dry Woodburn soSorption on dry soil increases by increasing the polaritythe sorbate; thus it increases by increasing the chlorine nber in the benzene ring. Water vapor sharply reducedsorption capacities of organic compounds with the dry son water-saturated soil, the reduction was about 2 ordermagnitude and the isotherms become linear. The markehigher sorption of organic vapors at subsaturation humidiis attributed to adsorption on the mineral matter, which pdominates over the simultaneous uptake by partition intoorganic matter. At about 90% RH, the sorption capacitiesorganic compounds become comparable to those in aqusystems, because of the effect of displacement by wateorganics adsorbed on the mineral matter. However,amont of these compounds sorbed from vapor phase atRH was still more than that sorbed in water phase, wbenzene showing the higher deviation by more than a faof 5.
Vapor sorption of water, ethanol, benzene, hexane, TeC1,1,1-TCA, TCE, PCE, and ED on soil humic acid has bedetermined.363 The uptake~mg g21! of these compounds ishighly linear over a wide range of relative pressure (P/P0),characteristic of the partitioning~dissolution! of the organiccompounds in soil humic acid. Isotherms approachP/P051 show a general steep rise due to an induced vacondensation onto the exterior surface of the humic samThe overall vapor sorption is essentially reversible. Extralating the linear portion of the vapor phase isothermsP/P051 the ‘‘limiting sorption ~partition! capacity’’ ~LSC!is obtained (Qha
0 ). The values of LCSs are used to predict tKoms for nonpolar organic compounds following the procdure described in Sec. 12.6.
Rhueet al.366 studied the vapor-phase sorption of toluenp-xylene~p-X!, and ethylbenzene~EBz! on bentonite, kaolin,two soil samples, an aquifer material, and a silica gel ovdied at 140 °C prior to use. Sorption~mg g21! was reported

Trera
m
icaEf
yrp
eilso
znn
nifiic
troeathC
Bbn
nit
effo
on
eoi
rete
ula
eb
-n
byelesthanorp-oiloillesn-tra-hanmltsofpor
por
se
ide-urepro-entas
ionre
is-ted
rfor
eirentptiontu-el-eri-pion
the
edva-
een
211211SORPTION OF ORGANIC COMPOUNDS
as a function ofP/P0; the isotherms conformed to the BEtype-II isotherms. Differences in the amounts of the thalkylbenzenes adsorbed on a given adsorbent were genequite small. With the exception of bentonite, the isotherfor water adsorption were also BET type-II isotherms.Qm
andC @Eq. ~14!# were estimated; the values ofC are indica-tive of the low interaction energies associated with physadsorption process. Surface areas calculated from Bmonolayer capacities indicated that the surface availablealkylbenzene adsorption was essentially that measured b2
adsorption except for silica gel. Plots of the relative adsotion (Q/Qm) vs P/P0 for water and p-X were similar forseveral of the adsorbents used. Overlapping isotherms walso reported for p-X and TCE adsorption on oven-dry soand clays.367 This suggests that sorbent surface area hapredominant effect on VOC adsorption on anhydrous sbents. In another paper368 the competitive adsorption of EBand water on bentonite and of p-X and water on kaolin asilica gel was reported. EBz adsorption on bentonite wasaffected by water at RH near 0.23, but was reduced sigcantly at RHs near 0.50. p-X adsorption on kaolin and silgel decreased with increasing RH, especially above a RHabout 0.2. Increasing RH not only decreased the amounalkylbenzene adsorption but also resulted in a change ftype-II isotherms to ones that were essentially linear. Linisotherms could not be attributed to organic matter, sinceclays and oxide used had very low to trace amounts of OBased on solubility considerations alone, partitioning of Eand p-X into adsorbed water films was not considered toan important adsorption mechanism in this study. p-X aTCE adsorption on air-dry soils and clays~water contents25–40 mg g21! was about 1000-fold less than that on ovedry sorbents, indicating that water effectively competes wVOCs for the sorbent surface.367 Isotherms of p-X adsorptionon air dry sorbents~water content: 30 mg g21 for Webstersoil, 25 mg g21 for Lula aquifer, 25 mg g21 for kaolin,corresponding to values in equilibrium at RH.50%! werelinear. The temperature dependence of adsorption cocientsKd was used to calculate the enthalpy of adsorptionseveral VOCs. These values ranged from230 to 240 kJmol21, and were more similar to enthalpies of vaporizatithan to enthalpies of solution.
Sorption of TCE and benzene on a desert soil has binvestigated at two different temperatures and various mture content, using a gas-chromatographic method.369 Sorp-tion of these two VOCs to the unmodified soil was compato sorption onto the same soil that was alternately treawith hydrogen peroxide~to remove organic carbon! or withhumic acid~to add organic carbon! in order to examine therole of soil organic matter in vapor phase sorption. Resfrom this study indicate that organic carbon plays onlyminor role in sorption at low moisture content.
Also Smithet al.370 agreed with this result. Using vadoszone soil, at 0% RH, soil uptake of TCE appears tocaused mainly by adsorption onto mineral surfaces~BETtype-II isotherms!. At higher relative humidity the competition of water reduces TCE adsorption by the minerals a
elly
s
lT
orN-
resa
r-
dot-
aofofmre.
zed
-h
fi-r
ens-
dd
ts
e
d
isotherms become more linear. At 100% RH, TCE uptakesoils is in all likelihood predominated by partition into thsoil organic matter. The moisture content of soil sampcollected from the vadose zone was found to be greaterthe saturation soil-moisture content, suggesting that adstion of TCE by the mineral fraction of the vadose zone sshould be minimal relative to the partition uptake by sorganic matter. Analysis of TCE in soil and gas sampcollected from the field indicated that the ratio of the cocentration of TCE on the vadose-zone soil to its concention in the soil gas was 1–3 orders of magnitude greater tthe ratio predicted by using an assumpion of equilibriuconditions. This apparent disequilibrium presumably resufrom the slow desorption of TCE from the organic matterthe vadose-zone soil relative to the dissipation of TCE vafrom the soil gas.
When sorption takes place from the vapor phase, a vasorption analog toKd can be derived.98 The linear sorbed/vapor distribution parameterKsg can be defined similarly toKd as
q5KsgCg , ~15!
whereq is the concentration of solute in sorbent~mg kg21!,Cg is the equilibrium concentration of solute in vapor pha~mg dm23!.
Vapor phase sorption of TCE by a porous aluminum oxsurface coated with humic acid~to simulate an aquifer material! was observed to be highly dependent on moistcontent.364 The authors used an experimental headspacecedure to measure linear solid-vapor sorption coeffici(Ksg) of TCE onto the oven-dried simulated soil, which w11 870 cm3 g21. This value was over 105 times greater thanthe aqueous-phase linear sorption coefficient. The soil regoverlying the water table could conceivably contain moistufrom a few percent to near saturation. A typical field moture content for the intermediate zone of a partially saturasoil layer is approximately 10%. The authors364 found thatthe TCE sorption coefficient (Ksg) for the synthetic soil at8.2% water content was 207 cm3 g21, and at 11.6% the valuedecreased to 53.9 cm3 g21. Both of these values are still 2 omore orders of magnitude greater than that determinedthe saturated synthetic soil (Kd50.29 cm3 g21). Obviouslythe magnitude of TCE vapor sorption coefficients and thdependence on moisture content will be different on differsorbents. However, these results indicate that the assumthat vapor sorption coefficients may be equated with sarated sorption coefficients can lead to large errors in modling TCE transport through unsaturated zone, unless expmental data are available, demonstrating that this assumis reasonable for the soil of interest.
Alumina coated with humic acid was used to evaluatesorption of mixtures of organic vapors~chorinated and non-chlorinated hydrocarbons! under partially saturatedconditions.365 Vapor interactions resulted in both enhancand suppressed sorption relative to the uptake of singlepors. These interactions may result from interaction betw
J. Phys. Chem. Ref. Data, Vol. 30, No. 1, 2001
,
net
trisof
nepo
on
atonpo
ivsonuno
id
sp-ona
c-Ctoapree
wan-utsacibis
ridonthic
ha
it
tiovi
by
lo-
ilehu-de-rre-
iesbyofof
inguege,an
lity.onlayerelseAt
ingrp-er
nltsterhetheinat aorp-. Itn atand
ousy.
andhic
en-me
Ther isby
tan-byt atfor
212212 DELLE SITE
adjacent molecules at the surface, solvophobic effectsnonlinear sorption isotherms.
Ong and Lion371 observed that the validity of applicatioof the Henry’s law constant in vadose zone transport modfor organic chemicals required specific investigations duethe poor information available in the literature.238,362 TheHenry’s law constant is a measure of the equilibrium disbution of a pollutant between the aqueous and vapor phaand is coupled with the sorption distribution coefficientthe same pollutant dissolved in water phase~soil/water equi-librium! to describe uptake of organic vapors in that zoThe authors carried out a detailed study on TCE va(P/P0,2%) sorption on several minerals~alumina, aluminacoated with humic acid, iron oxide, kaolinite, and montmrillonite! over a wide range of moisture contents. For ovedry minerals, surface area was found to be a good indicof the sorptive capacity of the solid phase. As moisture ctent was increased, the partition coefficients of TCE vadecreased by several orders of magnitude, attained a mmum, and then gradually increased. Mechanisms of TCEpor sorption were proposed corresponding to three regionsorbent moisture content. In region 1, from oven-dried cditions to one monolayer coverage of water on the solid sface, direct solid–vapor sorption was evident with strocompetition between water and TCE for adsorption sitesthe sorbents. Enthalpy of sorption for all oven-dried solwere between240 and 280 kJ mol21, with the humic-coated alumina having the highest value of the five solid269 kJ mol21. Values of this magnitude indicate that sortion of TCE on oven-dried solids was a physical sorptiprocess. In region 2, between a monolayer coverage toproximately five layers of water molecules, likely interations between TCE vapor and water include sorption of Tonto surface-bound water and limited TCE dissolution insorbed water with some ‘‘salting out’’ effects caused by wter structure. In region 3, extending from a minimum of aproximately five layers of water molecules to the watertention capacity of the soil, TCE dissolution into condenswater-dominated vapor uptake along with sorption at theter solid interface. Enthalpy of sorption in this region icreases to the same magnitude as the enthalpy of dissol~239 kJ mol21!. Application of Henry’s law and aqueouphase partitioning coefficients to model TCE vapor intertion with water condensed on the solid surface is possonly after '5 layers of water molecules have formed. Thassumption may not be valid for soils in arid or semiaregions or for the top surface soil layer in temperate region a seasonal basis. The implications of these results arefor low moisture content soils, volatilization loss of organvapors to the atmosphere will be more highly retarded twhen they are at their water retention capacity.
Petersenet al.372 measured theKsgs of TCE using fouroven-dry soils. They ranged between 61 and 3400 cm3 g21.In the dry range, adsorption was dominated by soils whigher specific areas~i.e., high clay content!, while soils withhigher organic carbon content manifested higher adsorpamounts in the wet moisture range. The adsorption beha
J. Phys. Chem. Ref. Data, Vol. 30, No. 1, 2001
or
lso
-es,
.r
--or-r
ni-a-of-r-gf
s
at
p-
E
---d-
ion
-le
sat,
n
h
nor
from dry to wet conditions was similar to that reportedOng and Lion.371 The point at which measuredKsg falls onthe line where Henry’s law can be applied seems to becated at approximately four molecular layers of water.
Goss373 studied the sorption of 17 volatile and semivolatorganic compounds on quartz sand at different relativemidities and temperatures. The enthalpy of sorption wastermined for each substance and compared with the cosponding enthalpy of condensation. At relative humiditgenerally present in the environment, quartz was coveredat least a monolayer of water. In this case adsorptionorganic compounds took place on the liquid-gas interfacean adsorbed water film. The results suggest higher bindforces for polar than for nonpolar compounds, probably dto hydrogen bonds. Above the water monolayer coverasorption occurred on the adsorbed water film and showedexponential decrease with increasing relative humidity.
The adsorption of organic vapors on polar surfaces~quartzsand, Ca–kaolinite! depends primarily on two environmentaparameters: ambient temperature and relative humidGoss374 presented an empirical model to predict sorptionthese sorbents when they are covered by at least 1 monoof water~RH above 30%!. It has been shown that the modis still valid at 100% RH and that this interesting special cacorresponds to the adsorption on a bulk water surface.RHs above 100% RH condensation of water occurs, leadto an unlimited increase of water film. In this case, adsotion on the water film is equivalent to that on a bulk watsurface.
Pennellet al.375 studied the adsorption of p-X vapors ooven-dried silica gel, kaolinite, and Webster soil. The resudemonstrated that dissolution of p-X into adsorbed wafilms was insignificant at 67 and 90% RH. In contrast, tadsorption of p-X at the gas-liquid interface, predicted byGibbs equation, contributed significantly to p-X sorptionthe presence of water vapor. All these results indicate thmultimechanistic approach should be used to describe stion of nonpolar organic vapors by hydrated soil materialsincorporates adsorption on mineral surfaces, adsorptiothe gas-liquid interface, dissolution into adsorbed water,partitioning into soil organic matter.
The vapor phase sorption of several VOCs by a calcaresoil has been measured using inverse gas chromatograph376
For dry soil, sorption isotherms are apparently nonlinear,finite desorption kinetics contribute to the chromatograppeak shapes. Even a small addition of water~1.5%–15%RHs! drastically decreased the sorption of nonhydrogbonding VOCs by the soil, chromatographic peaks becasymmetrical and the sorption isotherms became linear.results seem to indicate that the effect of additional wateto simply reduce the available surface area of the soilfilling some of the soil pores. Because water can substially reduce the surface activities of inorganic surfacesoccupying the high-energy sorption sites, it is possible thahigh humidity only organic carbon would be responsiblevapor-phase sorption. Hydrogen-bonding compounds~dieth-ylether, acetone, acetonitrile!, on the contrary, still exhibited

rlp
o
anres
heotacti-asn
Ou
noonrmteIsornde
ftiop
-
uic
esvdeorms
inakeo
pinooi
diforo
oil–tion
, es-
e ata-
ndednds ofant
mlybe-are
1-ma-ra-
ureaf-
iontesterso-ene-inat-
rt of
the
rbate
of
ro-ces
atetedec-
ingilib-
213213SORPTION OF ORGANIC COMPOUNDS
nonlinear sorption isotherms and finite sorption and desotion kinetics in the presence of water. The values of enthaof sorption obtained at 52% RH~1.65% w/w! for silt andclay fractions ranged between237.6 and264.8 kJ mol21
for six nonpolar VOCs, while enthalpy of condensationthe neat compounds ranged between230.8 and238.7 kJmol21.
The sorption isotherms of MCBz and toluene on a stdard EPA soil at different relative humidities were measuusing a dynamic technique based on frontal analychromatography.377 A mechanistic approach to evaluate tcontribution of the possible sorption mechanisms to the tsorption indicated that adsorption at the gas-liquid interfwas important, while dissolution in liquid water and partioning into organic matter from the adsorbed water phwere negligible. However, these three mechanisms couldaccount for the total sorption which suggests that the Vmay be competing with water for available sites on the sface at high VOC partial pressure.
Farrell and Reinhard98 measured the sorption–desorptioisotherms spanning 4–5 orders of magnitude in vapor ccentration for TCM, TCE, and PCE under unsaturated cditions at 100% RH. The mechanisms affecting isotheshape were investigated using model solids, aquifer maals, and soil spanning a range in physical properties.therms in log–log scale for the total uptake of all three sbates coincided on the montmorillonite, Norwood, aLivermore soils. On all but the Norwood soil, where thorganic matter~1.4% OC! was likely responsible for most othe uptake, mineral adsorption was the dominant sorpmechanism. Linear isotherms were observed on the nonrous solid~montmorillonite! and on the solids with the highest external surface area~Livermore clay and silt! absent ofmicroporosity. The adsorption was nonlinear on microporosolids, like silica gels, glass beads, and soil sand, whshow structural heterogeneity in the form of microporMoreover, for organic species adsorbed in a lipophilic enronment created by their own adsorption in a micropore,sorption is not expected to follow the same path as adstion and hysteresis between adsorption and desorptionresult due to cooperative adsorption on micropores. Thithe case of the Santa Clara aquifer solids~0.15% OC!. Fi-nally, the adsorption isotherm of a soil withf oc51.4% ismore linear than those regarding soils withf oc;0.1%; thisgreater linearity may indicate that organic matter partitiondominate sorbate uptake. The contribution of mineral uptin soils is greater when the organic matter content is low
Battermanet al.378 described models and measurementsdiffusion, dispersion, and retardation parameters develofor several hydrocarbon vapors in unsaturated soils uslaboratory column systems. The experiments clearly demstrated the role of humidity in absorption and transportvapors in soils. Soil gas humidities below 30% resultedconsiderable retardation of hydrocarbon vapors in all meRetardation factors ranged up to 80 for toluene and to 46trichloroethylene. Retardation coefficients decrease butmain large with increasing humidity in organic rich soils. N
p-y
f
-dis
ale
eotCr-
n--
ri-o--
no-
sh.i--
p-ayis
ge
r.f
edg
n-fna.r
e-
significant retardation is seen for methane. Based on swater isotherms, these results suggest competitive sorpbetween hydrocarbon and water vapors on soil surfacespecially the mineral fraction.
Sorption of benzene, toluene, and EBz in vapor phasinfinite dilution on soils was studied by inverse gas chromtography in the Henry’s law region.379 The results indicatedthat the adsorption processes was exothermic and depemainly on the chemical nature, pore size distribution apore shape, and especially on the microporous structurethe soils. Intraparticle mass transfer might play a significrole in the adsorption of VOCs on soils.
It has been demonstrated that various VOCs may be firbound to natural sorbents with sufficient exposure time,cause they are entrapped in soil micropores so that theydifficult to extract.380–382 Incubation of soil samples withvolatile organic solvents~benzene, toluene, EBz and 1,1,TCA! at part-per-thousand concentrations leads to the fortion of a residual firmly bound fraction that resists evapotion and may persist in the soil for long periods of time.383
The concentration of this fraction increases with temperatand solvent concentration. Its formation is not greatlyfected by the water concentration in the soil.
In conclusion, dry soils and clays show sizable sorptcapacities for volatile organic compounds. Water compewith them for sorption sites; therefore the presence of wamay strongly reduce the sorption capacities. Sorption itherms, which are of the BET type II, change to linear whrelative humidity is in the range 30%–50%. Due to this bhavior, sorption of volatile compounds may be importanttheir transport through soil columns, especially in the unsurated zone of soils and aquifers. Shoemakeret al.384 pro-posed analytical models to describe subsurface transpovolatile chemicals.
5. Temperature Effect
Sorption of a chemical on a solid sorbent occurs whenfree energy of the sorptive exchange is negative163,385,386
DG5DH2TDS, ~16!
whereDG is the change of the Gibbs free energy~kJ mol21!;DH is the change in enthalpy~kJ mol21!, and DS is thechange in entropy~kJ mol21 K21!. DH represents the differ-ence in binding energies between the sorbent and the so~solute! and between the solvent and the solute.
Thus, sorption may occur as the result of two typesforces: enthalpy-related and entropy-related forces.123 Hy-drophobic bonding is an example of an entropy-driven pcess; it is due to a combination of London dispersion for~instantaneous dipole-induced dipole! associated with largeentropy changes resulting from the removal of the sorbfrom the solution. For polar chemicals, the enthalpy-relaforces are greater, due to the additional contribution of eltrostatic interactions.
Generally sorption coefficients decrease with increastemperature. However, some examples of increasing equ
J. Phys. Chem. Ref. Data, Vol. 30, No. 1, 2001

t o
stana-n-hodmtilit
ne1ic
oflthi
ie
enre
ilser°s
cuo
at
rmi
int-
.ncge
urio
r
n-
u
io
ileor--
cess,s,
uren-ute
nda
ndith
lap,ap-
ndli or
thead-
betivitythath a
, ashejus-talsed
is-
hets
ting
ytheelyer-
ofandthat
darden-foror-s a.
1 to
-
214214 DELLE SITE
rium sorption with increasing temperature and of no effectemperature on sorption equilibrium were also found.386
Chiou et al.195 observed that an inverse relationship exifor organic compounds between sorption coefficientssolubilities. LowerKd values are found at higher tempertures for most organic compounds for which solubility icreases with temperature, while increased sorption at higtemperatures can be expected for compounds for which sbility decreases with temperature. Therefore, due to thependence of both sorption coefficients and solubility on teperature, the measured effect of temperature on sorpisotherms is the result of combined sorption and solubicontributions.387
Podoll et al.132 reported that adsorption of naphthale(Kd) on soil decreases with increasing temperature fromto 50 °C and isosteric enthalpy of adsorption is exothermThe heat evolved during adsorption~between28.8 and212kJ mol21! is probably dominated by the heat of dilutionliquid naphthalene in water, evaluable to about 7.5 kJ mo21
between 5 and 30 °C. Assuming this value constant inrange of 15–50 °C, the corresponding enthalpy of solutionthe sorbent phase would be between21.3 and 24.6 kJmol21. These data indicate that the enthalpy of solutionthe sorbent phase is smaller and of opposite sign to thethalpy of solution in bulk water. Therefore, the displacemof water by naphthalene at the soil surface is slightly favoenergetically.
He et al.388 studied the sorption of fluoranthene on soand lava. The sorption coefficients of fluoranthene wfound to decrease with temperature between 5 and 25The measured decreasing extent of sorption correspondthat evaluated introducingDHs (26.1 kJ mol21!, the enthal-pic contribution to excess free energy of the solution callated from the relation between aqueous solubility of fluranthene and the corresponding temperature, in the equreported by Schwarzenbachet al.389
The temperature effect on Freundlich adsorption isotheof b andg isomers of hexachlorocyclohexane was studiedthe temperature range of 10–40 °C.390 Sorbents were: a highorganic soil with mixed mineral fraction, a clay soil highmontmorillonite containing a little organic matter, a monmorillonite clay ~Ca–bentonite!, and a crystalline silicaPlots of x/m againstC for the two isomers show that aincrease in temperature lowers sorption uniformly for easystem. Proportionally, the decrease is least with silicaand greatest with Ca–bentonite. Contributing to this netfect of isotherm displacement downward with temperatare not only the energy contributions in the sorption reactitself, but also the change in solubility of the solute asresult of the temperature change. This change is closelylated to the change in the reduced concentration,C/C0 , withtemperature, whereC, the solute concentration, may be cosidered constant, andC0 is the solubility of the solute in thesolvent at a specified temperature. In addition to the Fredlich constantK f , another constant,K f8 , is obtained whenlog(x/m) is plotted against log(C/C0). The K f8 values can beconsidered as the hypothetical amount sorbed from solut
J. Phys. Chem. Ref. Data, Vol. 30, No. 1, 2001
f
sd
erlu-e--
ony
5.
en
nn-td
eC.to
--ion
sn
helf-enae-
n-
ns
having a nearly constant equilibrium solute fugacity. Whthe K f values decrease with temperature, the solubility crected intercept values,K f8 , increase in each case as temperature increases. Thus it appears that the sorption prowhich is indicated to be exothermic by the normal isothermis at least partially so because of the solubility–temperatinteraction. The 1/n constants of the Freundlich equation icreased with temperature according to the theory of dilsolutions.
On the basis of these considerations, Yaron aSaltzman139 reported the amount of solute adsorbed asfunction of its reduced concentration in water. They fouthat the reduced adsorption isotherms for parathion wthree soils at temperatures of 10, 30, and 50 °C overshowing that parathion is adsorbed by soils without anypreciable thermic effect.
Sorption of fenuron and monuron on montmorillonite abentonite was studied as a function of exchangeable alkaearth–alkali cation, temperature, and ionic strength.244 Nor-mal adsorption isotherms were exothermic but, whentemperature effect on solubility was accounted for, thesorption reaction changed to endothermic and tended tomore and more temperature independent as electronegaof the exchangeable cation increased. It was postulatedsubstituted urea is associated with the metal ions througbridging effect of coordinated water.
However, the use of reduced concentration conceptwell as the terms organophilic and hydrophilic applied to tadsorption of organic molecules, appears not universallytified because it lacks theoretical and experimensupport.391 The concept of reduced concentration can be ufor those systems where it has been proven to apply.
Anyway, the temperature effect on sorption isothermsnormally low for both hydrophobic and polar organic compounds.
A negative enthalpy of sorption~214.6 kJ mol21! hasbeen derived from the Gibbs–Helmholtz equation for tpartition coefficients of 1,2,3,4-TeCBz in water/sedimensystems at temperatures ranging from 24 to 55 °C, indicaan exothermic binding reaction.155
Wauchopeet al.392 studied the sorption of naphthalene ba loam soil with 1% organic matter content. Becausesolubility and vapor pressure of naphthalene were precisknown over the range of temperature taken into considation ~6.5–37 °C!, a complete thermodynamic descriptionthe differences between standard vapor, crystal, solution,soil-adsorbed states was possible. The results indicateenthalpies and entropies of the solution and surface stanstates are quite similar resulting in a near-zero standardthalpy difference and a small standard entropy increaseadsorption from solution. The results emphasize the imptance of the unique structured nature of water acting asolvent, and the competition of water for adsorption sites
An increase ofDH from 210.9 to 28.4 kJ mol21 wasobserved when the sorbed concentration varied from 0.00.07 mmol g21 in TeCM/DTMDA–clay system.92
Sorption of p,p8-DDT to marine sediment, montmorillo

ur-
ithnd
ae
a
nt
tesnth
o
rnedo
ghledinait
tsre
at
5anr
icth
tllp
in
ermbe-are
omealsa iso-en-bed
nd.foren-
icalrac-en-ad-
ing
y–dtod-
ic;tion,w-sicale
fectforture
cid
don
ureed;his
nebariondif-ardshe
e ins of
tic
215215SORPTION OF ORGANIC COMPOUNDS
nite clay and humic acid was studied in the temperatrange between 5 and 25 °C.173 The respective isosteric enthalpies were found to be 12, 16, and28 kJ mol21.
Binding of 2,28,5,58-tetrachlorobiphenyl~TeCB! by dis-solved humic acid was not significantly correlated wtemperature.393 This indicates a low enthalpy of interactioof this compound with humic acid and implies that the bining is primarily entropy driven.
Also sorption of PAHs to dissolved organic carbon fromlake decreased with increasing temperature over a tempture range between 16 and 45 °C.394 DH° values ranged from218.3 kJ mol21 for fluoranthene to240.6 kJ mol21 for ben-zo~ghi!perylene. A temperature decrease of 10 °C leads toaverage increase ofKdoc with 60%.
A study was carried out with alachlor adsorption on momorillonite saturated with several cations~Al31, Cu21,Ca21, Mg21, NH4
1 , Na1, Li1, Rb1, and Cs1,! at 5 and22 °C.395 A decrease in temperature from 22 to 5 °C resulin an increase in adsorption except for Al-, Rb-, and Cmontmorillonite, for which the adsorption process was edothermic. The isosteric changes of enthalpy were inrange between21.97 and 11.2 kJ mol21 for all systems andindicated that the interaction energy of homoionic montmrillonite was weak and consistent with physical bonding~hy-drogen bond or van der Waals forces!. A correlation betweenadsorption~Freundlich isotherms! and the polarizing poweof the exchangeable cation was observed. The interactioalachlor with homoionic montmorillonites was also studiby Fourier transform infrared spectroscopy in an organic svent. The results indicated that the molecule is adsorbedmonoionic montmorillonite by a coordination bond, throua water bridge, between CvO groups and the exchangeabcation of the clay. Further, the coordination strength isrectly correlated with the polarizing power of the catioX-ray diffraction analyses showed that the herbicide wable to penetrate the interlayer space of montmorillonsaturated with polyvalent cations.
Measurements ofK f values for diuron on three sedimenat 5, 25, and 40 °C showed that sorption was inverselylated to temperature;DH values of29.6 kJ mol21 for twosediments and212.6 kJ mol21 for the third were consideredcharacteristic of weak sorption forces of the van der Watype.257 Temperature appeared to have a greater effect onsorption of diuron than on the sorption of ametryne.256 Kd
values of diuron with a clay soil~3.2% OM! decrease fromabout 9 to about 7 cm3 g21 by increasing temperature fromto 45 °C. Those of ametryne remain practically const(Kd;2) at the same conditions. The same effect of tempeture on diuron was found by other authors.245
The isosteric enthalpy of adsorption of linuron on humacid saturated with several cations was calculated fromadsorption data at 5 and 25 °C396 and ranged from abou20.71 to23.1 kJ mol21. These values are relatively smaand are of the order which is consistent with a physical tyof adsorption.
A thermodynamic study was carried out by Spurlock397 onsubstituted phenylureas–soil interactions for understand
e
-
ra-
n
-
d–-e
-
of
l-on
-.se
-
lshe
ta-
e
e
g
various aspects of sorption phenomena, including isothnonlinearity. The results suggest that specific interactionstween the phenylureas and soil organic matter moietiesdominant at low sorbed phase concentrations, but becless important relative to nonspecific London–van der Waforces as sorbed phase concentration increases. The uretherms are therefore nonlinear, with nonlinearity fundamtally related to the nature of substituted phenylurea-sorphase interactions.
The adsorption of monuron, atrazine, simazine, CIPC aDNBP by bentonite was greater at 0 °C than at 50 °C251
Adsorption by muck was similar at the two temperaturesall compounds. Comparisons between the muck soil and btonite results should be valid since both received identtreatment, and temperature effects on solute–solvent intetions would be expected to be the same. Adsorption by btonite exhibited a greater temperature dependence thansorption by muck. This result suggests a higher bondenergy on bentonite than on muck.
TheKd values for simazine and atrazine sorbed by a siltclay–loam soil (OM54.2%) decreased of about 60% an45%, respectively, with increasing temperature from 050 °C.145 A small temperature effect was detected with asorption of atrazine286 by soil; the averageKd value ~in therange of pH 3.9–8! at 30 and 40 °C was 7.2 cm3 g21 while at0.5 °C was 9.6 cm3 g21. Sorptive processes are exothermtherefore, an increase in temperature should reduce sorpespecially if sorption forces are weak. Ionic sorption, hoever, tends to be less temperature dependent than physorption. If ionic forces are involved in sorption of atrazinover the soil pH range studied, then the temperature efshould be less at the lower pH values. This was not trueatrazine–soil system where there was a greater temperaeffect at a low than at a high pH. Sorption of atrazine on ahumic acid ~pH 2.5! was ten times greater (Kd
5627 cm3 g21) than on neutral humic acid (pH57.0) (Kd
562.2 cm3 g21). This pH effect was attributed to increaseionic bonding caused by protonation of the amino groupsthe atrazine molecule at low pH. The effect of temperaton the sorption of atrazine on humic acid was quite marksorption was nearly twice as great at 40 °C as at 0.5 °C. Tis opposite of what usually occurs with mineral systems.
Dao and Lavy241 reported that greater amounts of atraziwere adsorbed at 30 °C than at 5 °C on four soils at 0.1moisture content. This indicated an endothermic reactwhich was observed both before and after correction forferential atrazine solubility due to temperature. The standfree energy changeDG° of the adsorption reaction wanegative in all four soils indicating the spontaneity of tprocess. The standard enthalpy changeDH° was positive,ranging from 0.016 to 2.78 kJ mol21 and indicating the en-dothermic nature of the reaction. There was an increasthe entropy of the system as shown by the positive valueDS°(0.010– 0.017 kJ K21 mol21).
The effect of equilibration temperature~5 and 28 °C! onsorption of metribuzin and metolachlor by Alaskan subarsoils was investigated.398 For surface soil, metribuzin
J. Phys. Chem. Ref. Data, Vol. 30, No. 1, 2001

reot
ontea
ica
insueeursicgner
th
eer-vadx
f
a-otio
a
anicnt
iot
-D-
esro
heina
rar
rety
ibase
-tly
nd
ere
ass
on-
h-
cal
nsals
er
he-pid
orsaP
nd
ndes
sedthatthe
ftoof
216216 DELLE SITE
showed increased sorption at lower temperature, whemetolachlor had greater sorption at 28 °C. However, for bherbicides equilibration temperature did not affectK f valuesfrom the lower soil depth. Furthermore, of the total variatiof K f values within the surface soil, temperature accounfor less than 10%, while soil type accounted for greater th80% for both herbicides.
Sorption of isocil and bromacil on silica, clays and humacid is exothermic.99 The sorption enthalpies calculated asfunction of chemical sorbed become more positive withcreasing surface coverage. The behavior of humic acidface is quite different as far as the magnitude and changDH is concerned. TheDH value is small and also its changwith surface coverage is insignificant. For most of the sfaces the probable mechanism of the adsorption is a phyor van der Waals-type adsorption as indicated by the matude ofDH. Some hydrogen bonding is also probable at vlow surface coverage.
Temperature was shown to exert a small influence onbinding of diquat and paraquat to humic acid.142 On bento-nite diquat was completely adsorbed at 0 and 50 °C.251
A slight effect of temperature on adsorption has also bfound with picloram315,316and this behavior has been intepreted as due to physical adsorption. Also, the negativeues of DG° and DS° for the same systems evidentiateadsorption-type processes and stable adsorption complerespectively. Biggaret al.269 studied the sorption kinetics opicloram on Palouse silt~pH 5.9! and of parathion onPanoche clay~pH 7.5! and Palouse silt. From the temperture dependence of the relative sorption constant, theytained the activation energies associated with the sorpkinetics of the three systems equal to 11.3, 5.4, and 18mol21. Such energy levels are comparable to van der Wabonding ~2–8 kJ mol21! and hydrogen bonding~17–21 kJmol21! that occur on clay surfaces and with such groupsthe carboxyl, hydroxyl, and amino groups of the orgafraction. Mechanisms of interaction based on experimeresults and thermodynamic considerations emphasize theportance of organic matter for picloram sorption and bclay and organic matter in sorption of parathion.
Temperature had little effect on the amount of 2,4sorbed on clay materials.146 Activation energies for the sorption process laid between 12.5 and 21 kJ mol21, with claysof larger surface area giving higher activation energiThese values are characteristic of diffusion controlled pcesses.
In conclusion, sorption processes are generally exotmic; therefore sorption coefficients decrease with increastemperature. However, this effect is inversely related to wter solubility which, on the contrary, increases with tempeture for most organic compounds. Therefore, the measuvariation of sorption coefficients with temperature is thesult of both the contribution of sorption effect and solubilieffect.
A review on the effect of temperature on sorption equilrium and sorption kinetics of organic micropollutants hbeen recently published.386 The conclusions of this study ar
J. Phys. Chem. Ref. Data, Vol. 30, No. 1, 2001
ash
dn
-r-of
-ali-
y
e
n
l-
es,
b-n
kJls
s
alm-h
.-
r-g--ed-
-
in summary:~a! the transfer of hydrophobic organic compounds from solution to sediment generally involves slighnegative enthalpy changes~on the average20.25 kJ mol21!;~b! when favorable electrostatic interactions~e.g., H bond-ing! are possible, equilibrium sorption enthalpies were fouto be more exothermic~on the average28 kJ mol21!; ~c! theactivation energies for fast adsorption and desorption wfound to be between 0 and 50 kJ mol21 ~on the average 18 kJmol21!, while the activation energy for slow desorption wfound to be of 66 kJ mol21, similar to the activation energiefor diffusion in polymers, which averaged 60 kJ mol21. Thiswas interpreted as an indication that diffusion causes nequilibrium sorption effects.
6. Binding to Dissolved Organic Matter
Natural waters contain various concentrations of higmolecular-weight organic substances~humic and fulvic acid,humine! indicated as dissolved organic matter~DOM! or asdissolved organic carbon~DOC!, which may bind organicchemicals.
The association constant DOM- or DOC-organic chemican be defined as
Kdom or Kdoc5~mg compound bound/
g or kg DOM or DOC!/
~mg compound freely dissolved/cm3
or dm3 solution! ~17!
Kdom andKdoc ~cm3 g21 or dm3 kg21! of Eq. ~17! are similarto Kom andKoc are measures of the binding affinity of DOMor DOC for the organic chemical. The possible interactiochemical–DOM may be hydrogen bonding, van der Waforces or hydrophobic association.399 For neutral PAH mol-ecules it is believed that binding is dominated by van dWaals type interactions.188 The binding of benzo~a!pyrene~BaP! to dissolved humic material~DHM! is completely re-versible and the extent of reversibility is unrelated to tsorption time.400 The rate of binding of BaP to DHM, measured by the quenching of BaP fluorescence, is very raand the equilibrium is reached within 5–10 min. The authfound a relationship between the hydrophobicity of B(Kow) and the bonding affinity.
Johnsen401 studied the interactions between PAHs anatural aquatic humic substances~NHS! as a function of con-tact time. Eight PAH compounds were sorbed on NHS arecovered by cyclohexane extraction after storage timranging from 4 to 70 d. In general, the recoveries decreawith increasing storage time. The results suggestedstrong bonds were formed between PAH and NHS. Inearly part of the experiment~4 and 7 d! the recoveries of thedifferent PAHs decreased with increasingKow or decreasingwater solubility of the compounds.
Carter and Suffet402 observed that a significant fraction othe dissolved DDT found in natural waters may be boundDHM and that the extent of binding depends on the source

thhnhth
o-
tls
c
ooidti
wgororhnao
rea
naris
fla
da
vsif-a
nnaesth
faer
r-
1BM
ethe
ithfterd,
-n alle
st
ltsor-withwas
ayi-ers.
ulynlyre
r.t
d by
ndser-
so-t ofen
ringriner-
ayber
an-of
tioninco-lyhee
so-hethe
217217SORPTION OF ORGANIC COMPOUNDS
the humic material, the pH, the calcium concentration,ionic strength, and the concentration of humic materials. Tincrease of the hydrogen and metal ion concentration chathe structure of the humic polymer, which becomes lessdrophilic as its charge is neutralized. It seems reasonablethe less hydrophilic form of the polymer would bind hydrphobic compounds more effectively.
Sorption of anthracene on estuarine colloids significandecreased when the experimental pH of 8.01 was increato 9.0 or decreased to 5.0.399 The decrease inKoc values wasattributed to changes occurring within the polymeric struture of the colloids.
The addition of ammonia to soil produces an increaseboth the soil pH and the concentration of DOC in the ssolution.403 These ammonia-induced changes appeared tocrease atrazine sorption and to increase atrazine desorpthus increasing atrazine movement through soil.
The binding of benzene, naphthalene, and anthraceneestuarine colloids has been found at least an order of matude higher than those reported for corresponding ssediment systems.399 A possible explanation of this behaviois that soil/sediment OM may often be occluded by the inganic components, thus making fewer sites available fordrophobic association. The amount of diuron, bromacil, achlorotoluron complexed by water soluble soil organic mterial was about 70 times the amount sorbed by the soil frwhich the organic material was extracted.404
Natural estuarine colloids bind atrazine and hold thesulting aggregate of molecules in stable colloidsuspension.405 The highKdoc values of atrazine and linurofor colloidal matter suggest that the two compoundsstrongly bound.406 On an OC basis, the colloidal materialon the order of 10–35 times better as a sorptive substratethe herbicides than sediment or soil OM. However, the retive strengths of sorption of the two compounds on colloimatter as reflected in the ratio of theKdoc value of atrazine tolinuron appear to be the same as the ratio of theKoc valueson soil–sediment~170 vs 670 for soil as opposed to 18506750 for colloids!. Two hypotheses that may explain the dference between the values observed on soil–sedimenton colloidal matter are suggested. First, althoughKoc valuesare reported on the basis of total OC for a soil or sedimeall the OC is not available as a sorptive surface. Altertively, the surface acidity of sediment or soil clay particlmay have the effect of decreasing the sorptive capacity ofOM.
However, it has been observed407 that, when the nature othe DOM released from the soil/sediment bulk organic mter is similar to that of the soil/sediment bulk organic mattthe ratios ofKdoc/Koc of solutes will be close to 1. If theDOM is more hydrophilic than the soil/sediment bulk oganic matter, the ratios ofKdoc/Koc of these solutes will beless than 1. TheKdocs to nonsettling colloids were 0.5–times theKocs to sediments of the Lake Superior for PCcongeners.50,408 When the sources and nature of the DOand soil/sediment OM are different, the ratiosKdoc/Koc ofsolutes will have a broad range.
eegey-at
yed
-
fle-on,
ithni-il/
-y-d-m
-l
e
or-l
nd
t,-
e
t-,
A recent study394 on the sorption of PAHs to particulatand dissolved organic carbon from Lake Ketelmeer,Netherlands, has shown a linear relationship between logKoc
and logKdoc with a slope of nearly one.Great Lakes waters freshly collected were inoculated w
radiolabelled hydrophobic organic compounds and, aequilibration, separated into particle bound, DOM bounand freely dissolved phases.409 The mass distribution measurements among the three phases have shown that icases~73 water samples! most of the compound was in thfreely dissolved phase, with only a small fraction~rarely.5%! associated with the DOC. About 40% of the leawater soluble compounds, BaP and 2,28,4,48,5,58-hexa-chlorobiphenyl~HCB!, were particle associated. The resudemonstrated that DOC could be different from particleganic matter and that the associations of the compoundsthe two phases were unrelated. As a matter of fact thereno correlation between logKdoc and logKoc. Similar resultswere obtained with the same compounds in Green Bwaters,410 except for the binding to DOC that was approxmately 2–3 times the average for open Great Lakes wat
Brannonet al.411 examined theKdoc values of fluoranthenein pore water from 11 sediments. Concentrations of trdissolved organic contaminants in pore waters are commoestimated412 by assuming constant partitioning between powater ~truly dissolved! and organic carbon in pore wateMeasured values ofKdoc for fluoranthene were not constanover the 11 sediments, and were over or underestimateassuming thatKdoc5Koc. Therefore, current models96,412
used to predict the fate of hydrophobic organic compoumay require modifications to account for the observed diffence betweenKdoc andKoc.
The DOM concentration may affect the value of the asciation constant. A decrease of the association constanDDT by increasing the humic acid concentration has beobserved.402 The same effect has been detected in measuthe association constants for 26 PCB congeners with mahumic substances~HS!.413 A possible reason for this obsevation could be that an increase in HS concentration mincrease humic–humic interaction, thus reducing the numof available sites for humic-hydrophobe association.
Also the binding affinity for BaP, benzanthracene, andthracene to DHM decreases slightly as the concentrationDHM increases.400 Landrumet al.414 found thatKdoc of somePAHs and PCBs does not depend on pollutant concentrabut is inversely proportional to the concentration of DOCsolution. However, the trend toward decreased partitionefficients with increased HA concentration is relativeslight; it may be due to conformational differences of tHAs altering the pollutant binding and/or competition of thhumics for binding sites on other humics.
However, Gauthier et al.,415 using the fluorescencequenching method, did not detect any variation in the asciation constants of PAHs with the DOM concentration. Tauthors believed that this effect may be an artifact ofreverse phase method.414
Also Hassett and Milicic416 in their study of
J. Phys. Chem. Ref. Data, Vol. 30, No. 1, 2001

-n-
ndsatm
h
d
t;Alas-
anthbb
ath
c-non
oinre
ieasox
oo
a
nsair
oe
edly
e-d
Ahearso-r-he,
toric
u-heus,a-ic
torine-
andereasto
er-lar
e ofhengid
dn of
in-ater
ue-
ofe
es-tentiate
bs
offoratmfor
218218 DELLE SITE
2,28,5,58-TeCB binding by Aldrich HA by gas purge technique found thatKdoc is apparently independent of DOC cocentration. On the contrary, Yin and Hassett417 reported that,with increased HA concentration, the fraction of boumirex increased, butKdoc showed a declining trend. Thiresult was obtained using the same technique and indicthat binding may involve more complicated mechanisthan simple phase partitioning.
The magnitude of the binding interaction of DOM wit2,28,5,58-TeCB is affected by several parameters:393 ~i! Kdoc
decreases by increasing the pH of the medium, probablyto increased ionization of HA with increased pH;~ii ! increas-ing ionic strengthKdoc increases as a result of salting-ou~iii ! Kdoc decreases with decreasing molecular weight ofdrich HA; ~iv! HA extracted from soil and water samples hlower binding capabilities than Aldrich HA, but higher binding capabilities than fulvic acid~FA!. Moreover, theKdoc
increases with the degree of chlorination of the PCBsdecreases in general by increasing the number of the orchlorines within groups of isomers; this latter result mayattributed to the fact that o-substitution increases the soluity of PCB isomers.413
An effect of the organic pollutant/DOM association isgeneral enhancement of the apparent water solubility ofpollutant.187
The solubility enhancement can be expressed219,220as
Sw* 5Sw~11X Kdom!, ~18!
or
Sw* 5Sw~11X Kdoc!, ~19!
whereSw* andSw are the apparent water solubility in DOMor DOC solution and solubility in distilled water, respetively, X is the concentration of DOM or DOC. The apparesolute solubilities increase linearly with DOM concentratiand show no competitive effect between solutes.
Websteret al.418 measured by the generator column prcedure the solubility of three dioxins in pure water andwater containing known amounts of HA. Three HAs weused, one isolated from soil, a second from water~peat bog!,and a third commercial~Aldrich!. The solubility of dioxincompounds increases in the presence of HA and also bycreasing the temperature in the absence and in the presof HA. The enhanced solubility in the presence of HA wemployed to calculate the association constants of the dicompounds. The association constants decrease withtemperature. However, the data do not allow calculationthe exact value forDH of association, which is expected tbe very low~!40 kJ mol21!.
The aqueous solubilities of 1,2,3-TCBz, pentchlorobenzene~PCBz!, and hexachlorobenzene~HCBz! inan aqueous phase isolated from a sediment–water suspeare significantly higher than those measured in distilled wter. This effect has been attributed to the presence of a ‘‘thphase’’ material originating from the sediment,133 which pro-duces also a reduction of the experimental adsorption cficient (Kd).
J. Phys. Chem. Ref. Data, Vol. 30, No. 1, 2001
eds
ue
-
do-
eil-
e
t
-
n-nce
inthef
-
ion-d
f-
The effect of enhancing solubility is more pronouncwith hydrophobic organic compounds exhibiting extremelow water solubilities, and high values ofKow ~p,p8-DDT,PCBs, etc.!, while no noticeable water solubility enhancment is found for compounds like lindane an1,2,3-TCBz.220 The Kdom values of solutes with soil-derivedHA are approximately four times greater than with soil Fand 5–7 times greater than with aquatic HA and FA. Teffectiveness of DOM in enhancing solute solubility appeto be largely controlled by the DOM molecular size and plarity; less polar DOM forms stronger associations with oganic chemicals and produces higher solubility effects. TKdoc values for pyrene with six marine HAs, five soil HAsthree soil FAs and Aldrich HA varied by as much as a facof 10 depending upon the degree of aromaticity in the hummaterial.188 An increase in aromaticity of the dissolved hmic material may serve to increase the polarizability of tpolymer and increase the strength of PAH binding. Thdifferent sources of dissolved humic material in natural wters can have different affinities for binding organcontaminants.400
Chin and Gschwend419 used fluorescence quenchingmeasure the binding of pyrene and phenanthrene to mainterstitial water organic colloids from two sites. Both compounds were sorbed by porewater colloids. Sedimentsporewater colloids from a contaminated nearshore site wparticularly effective sorbents for these compounds. It wobserved that the high sorption coefficients may be duethe high lipid content of these sediments and colloids. Altnatively, they may be due to a very substantial nonpocharacter of the natural organic matter there.
Fluorescence enhancement of pyrene in the presencdifferent HAs showed significant variations, leading to tconclusion that large soil HAs are more effective in isolatismall molecules than smaller aquatic or structurally rigHAs.420
Caronet al.421 reported that the addition of HA extractefrom sediments to the aqueous phase reduced the sorptioDDT to sediments, but had no effect on the sorption of ldane. In the absence of added DOC, the sediment–wsorption coefficient (Kd ,cm3 g21) for DDT was 20 650,while in the presence of 6.95 mg dm23 of DOC it was 5170.Using the free DDT concentration rather than the total aqous phase DDT concentration, the value ofKd (19 776) wasindistinguishable from the value obtained in the absenceadded DOC~20,650!. For lindane at the same conditions, thvalues ofKd were 84 and 90 in the absence and in the prence of added DOC, respectively. This result is consiswith the observation that the compound does not assocwith humic material to any great extent.220 Also sodium hu-mate can solubilize DDT, whereas HA strongly adsor2,4,5-T from solution.187
No enhanced solubility effects, due to the presenceDOM up to 100 ppm organic carbon, has been foundsimazine, which shows a relatively high water solubility20 °C ~3.5 ng/ml!.422 Adsorption experiments on sandy loasoil also demonstrated no statistically significant effect

ont tic
om
orryms-ithA
mpH
crea
ivet-
am
softnravengmicmineubct
x-att psdhe
inth
phict
thureifi
g
e-ro--
re-ithre-
valon
edns-di-
CPow-her
5.4as-bern.ef-
n-lut-cedn
nts-ulesr:-
byed
x’’
nti-s
in-
tud-
e or
ousma-on
219219SORPTION OF ORGANIC COMPOUNDS
simazine concentrations between 30 and 1900 mg ml21 inthe presence of 45 ppm soluble OC. Other authors404,405pre-viously demonstrated a substantial effect of DOMs-triazine adsorption. These contrasting results suggespossibility that the interaction between DOM and nonionorganic compounds may be a function of the source frwhich the DOM is obtained.
Napropamide, which is more water soluble and therefconsidered less hydrophobic than lindane and promethad a greater extent of association with peat-dissolved huacid ~DHA!, suggesting that hydrophobicity of nonionic peticides is not the only factor governing their interaction wDOM.423 When comparing DOM from several sources, DHhad a higher affinity than dissolved fulvic acid~DFA! fornapropamide, DDT, and lindane. Association of napropaide with peat-DHA increased with increasing pH above6.4, decreasing ionic strength, and decreasing charge onions added to the system. In addition, DHA and DFAleased from two soils showed a different affinity for napropmide compared to bulk soil organic matter. The relatefficiency of OM fractions taken from two soils in associaing with napropamide is DHA.bulk OM.DFA. Dissocia-tion studies showed that the interaction between napropide and peat-DHA was not fully reversible.
Thus, the interaction PAH–DOM, measured on the baof increased solubility, is dependent upon the ‘‘quality’’naturally occurring DOM.424 An investigation carried ouwith a series of PAH indicated that these compounds doundergo significant interaction with oceanic DOM at natuconcentrations, while significant interactions are obserwhen terrestrial DOM is employed at naturally occurriconcentrations. This difference seems due to the higherlecular weight of the terrestrial DOM. Also terrestrial humsubstances are believed to originate from lignin whereasrine humics are believed to be primarily derived from marplancton. These different origins result in marine humic sstances having less aromatic and more aliphatic charaalong with more protein and carbohydrate components.
The Kdoc values of BaP and PCP with HAs and FAs etracted from river sediments and sea sediments or isolfrom river water and sea water have been measured avalues of 5.0, 6.5, and 8.0.425 The results showed that HAhave a greater affinity for binding hydrophobic compounthan FAs and thatKdoc values decreased as the polarity of tsorbent, measured by the ratio@~O1N!/C#, increased. Thebinding of PCP with HAs strongly decreased with increaspH, suggesting that only unionized form can interact withhumic material. Change in pH only weakly affectsKdoc val-ues for BaP.
Hassett and Anderson426 found that DOM derived fromnatural water and sewage reduces the sorption of hydrobic organic compounds by river- and sewage-borne partlate matter. They suggest that this observation is due toformation of soluble complexes between the DOM andcompounds. DOM in water solution reduces also the amoof a nonpolar compound bound to soil or sediment. Thefore, the presence of DOM in natural systems can sign
he
en,ic
-
at---
-
is
otld
o-
a-
-er,
edH
s
ge
o-u-heent--
cantly affect the mobility of organic pollutants by increasintheir transfer to groundwaters.427
Experiments428 were carried out to evaluate the effectivness of a solution of HA to enhance the removal of six amatic hydrocarbons~benzene, toluene, p-xylene, ethyltoluene, sec-butylbenzene, and tetramethylbenzene! from asandy material. None of the compounds were completelymoved from the material. Nonetheless, the compounds wthe highest water solubility, benzene and toluene, weremoved effectively~up to 99%! with the use of either the HAsolution or water. For the less soluble compounds, remowas more difficult and was enhanced by the HA soluticompared to water.
Pierce et al.173 reported that humic particles associatwith chlorinated hydrocarbons may contribute to the traport of these pollutants from the water column to the sement.
The effect of natural DOM onKd values of PCP with soilwas negligible at pH 5.2–6.1 and low concentration of P~,0.4 nmol cm3!.106 At these conditions DOM showed nsignificant effect on PCP transport in a soil column. Hoever, the PCP adsorption isotherms obtained from a higconcentration range of PCP~,3 nmol cm3! showed thatDOM may increase the adsorption of PCP on soil at pHand 6.1. It appears that natural DOM may play an increingly important role in the adsorption of PCP as the numof free ‘‘sites’’ decreases with higher PCP concentratioHowever the mechanism responsible for such a possiblefect remains unclear and needs to be investigated.
Thus, if colloids are stabilizing hydrophobic organic cotaminants in porewaters, then the transport of organic polants from sediments to overlying waters could be enhanthrough a combination of bioirrigation and colloid sorptioeffecs.419 They may also alter the transport of contaminain the subsurface environment.21 Column experiments demonstrated that the effect of the presence of macromolecon the mobility of HCBz through soil was in the ordegroundwater DOC.humic acid.dextran at respective concentrations of 50, 50, and 500 mg dm23.429 Also the retarda-tion factor of phenanthrene in a sand column was reducedan average factor of 1.8 in the presence of DOM derivfrom soil, suggesting that a phenanthrene-DOM ‘‘compleenhanced the transport of phenanthrene.430 The same effectof enhanced mobility in the presence of DOC was evideated studying 2,28,4,48,5,58-HCB transport through columncontaining aquifer material.431 Contaminant mobility wasfound to increase as solution DOC concentrations werecrementally changed from 0 to 20.4 mg dm23. Thus, the fateand transport of contaminants in groundwaters can be sied on the basis of three-phase distribution~immobile solidphase, mobile solution phase, and mobile colloidal phasDOC!.
The one-dimensional transport of a single solute in pormedia, assuming constant fluid flow in a homogeneoustrix, can be described by a convection–dispersion equati
~r/u!]q/]t1]C/]t5D]2C/]X22V]C/]X, ~20!
J. Phys. Chem. Ref. Data, Vol. 30, No. 1, 2001

itfty
ldoyd-
s,.le
et
enhe
il
ne
T
ee-an
e-
-
ex-xt-
fordis-
edandn-
iciveenkesin
obic
testrsis-
edndidhedard-n-ith-h
ac-o-es
c-
nicits
M
inppli-
toeseri-ary
tion.
s–ted
220220 DELLE SITE
wherer is the porous medium bulk density,u is the volu-metric water content,q is the total adsorbed solute per unmass of solid,t is time, C is the resident concentration osolute in the mobile phase,D is the dispersion coefficienreflecting the combined effects of diffusion and hydrodnamic dispersion on transport,X is the distance, andV is themean pore water velocity. Contaminant distributions in fiesamples are usually characterized by total solution and sphase measurements; thus,C can contain solutes in the truldissolved form and/or solutes in a colloidal or colloiassociated phase. It has been shown432 that for solutions con-taining DOC, the ‘‘three-phase’’ distribution relationshiprepresented by Eqs.~21!–~23!, can be incorporated into Eq~20! using Eq.~25! to account for the presence of two mobisolute phases in porous media
Kd5q/Caq, ~21!
Kapp5q/~Caq1Cdoc@DOC# !, ~22!
Kapp5Kd /~11Kdoc@DOC# !, ~23!
Rt511~rKapp/u!, ~24!
Rt511~r/u!@Kd /~11Kdoc@DOC# !#. ~25!
In Eqs. ~21!–~25!, Kd is the equilibrium distribution of thecontaminant in the absence of mobile DOC,Kapp ~apparentKd! is the equilibrium distribution of the contaminant in thpresence of mobile DOC,q is the solid-phase contaminanconcentration,Caq is the aqueous phase contaminant conctration, Cdoc is the colloidal-associated contaminant in tmobile phase,Rt is the net retardation factor,@DOC# is theconcentration of dissolved organic carbon in the mobphase, andKdoc5Cdoc/Caq is the distribution coefficient ofthe contaminant between DOC and water.
The general form of the transport equation can be obtaicombining Eqs.~20! and ~24!
Rt]C/]t5D]2C/]X22V]C/]X. ~26!
Selection of Eq.~21! or Eq. ~23! for use with Eq.~26! willdepend on the presence or absence of mobile DOC.authors431 then introduced the two-sites transport model433
~Sec. 10!, which assumes instantaneous adsorption on typsites and first-order kinetic controlled adsorption on typsites to account of possible nonequilibrium for contamininteractions with the solid phase~Sec. 9!. The adsorption ratefor type-2 sites is described by
]q2 /]t5a@~12F !KappC2q2#,
whereq2 is the concentration of adsorbed solute on typsites,F is the fraction of type-1 sites, anda is the first orderrate coefficient. For a two-site adsorption process, Eq.~26!now takes the form of
b Rt]C/]t1r/u ]q2 /]t5D ]2C/]X22V ]C/]X,
whereb5(u1FrKapp)/(u1rKapp) is a dimensionless variable related to the fraction of type-1 sites.
J. Phys. Chem. Ref. Data, Vol. 30, No. 1, 2001
-
lid
-
e
d
he
-12t
2
Equation~23! was used to obtainKd and Kdoc values foranthracene, HCBz, and pyrene from batch and columnperiments with soil and aqueous solutions containing deran, humic acid, and groundwater DOC.429
Binding of BaP to DOM and to particles was measuredeach sorbent and in a mixed system containing bothsolved and particulate sorbents.434 DOM competed with par-ticles for binding of the dissolved contaminant and reducthe amount bound to particles. Binding was independentnoninteractive. Significant errors in estimating the enviromental partitioning and bioavailability of very hydrophobcompounds can result if the role of DOM as a competitsorbent is ignored. The influence of DOM is greatest whsuspended particle concentrations are low, such as in laand streams, or when DOM levels are high, such asswamps and bogs. In most cases, only the very hydrophcontaminants (Kow.105) will be significantly affected bybinding to DOM, but these compounds constitute the greaconcerns in terms of human health and environmental petence.
Thus, association of organic contaminants with dissolvhumic substances reduce their bioavailability atoxicity.435–438 The bioconcentration of dehydroabietic acand BaP into Daphnia magna is significantly lower in tpresence of such substances when compared with a stanized soft freshwater.439 Moreover, an increase in humus cocentration decreases the bioavailability of BaP in a logarmic manner.440 However, this effect is not observed witPCP, because at the pH of the experiment~6.6! it is in ionicform and does not associate with humic materials.439 Asso-ciation constants of hydrophobic chemicals with three frtions ~hydrophobic-acid, hydrophobic-neutral, and hydrphilic subcomponents! of DOC from a stream water wermeasured.441 The total water and the different DOC fractionreduced the uptake and accumulation of benzo~a! pyrene and2,28,5,58-HCB by Daphnia magna in proportion to the capaity of the DOC for binding the contaminants.442 Besides thequantity the qualitative differences in the nature of orgamaterial from different sources also have a large effect onaffinity for binding lipophilic organic xenobiotics.443 Thearomaticity and the portion of hydrophobic acids in DOcan play an important role.
7. Cosolvent Effect
Sorption coefficients for HOC are generally measuredaqueous systems and, therefore, may not be always acable to the prediction of groundwater contamination duethe presence of waste disposal or treatment sites. In thsituations often pollutants are in solution of water and vaous water-miscible organic solvents. It is therefore necessto develop a more general approach for describing sorpof HOC on soils from aqueous and mixed solvent systems444
Rao et al.445 applied the ‘‘solvophobic theory’’ for predict-ing sorption of HOC by soils from both water and aqueouorganic solvent mixtures. This approach was already adop
n
an
be
o
as
he
n
he
ecu
g’’
-
io
ere-
f theoruld
il/e,t of
-
e-
lu-ry
-
i.e.,her
antof
nter
zarbi--l–ionvenFor-
t ofn
221221SORPTION OF ORGANIC COMPOUNDS
by Amidon et al.446 and Yalkowskyet al.447 for predictingthe solubility of nonpolar and polar solutes in polar solvemixtures.
Yalkowsky et al.448 have shown that the solubility ofhydrophobic organic compound in a binary mixed solve~water and water-miscible organic solvent! can be related tothe aqueous solubility through the equation
logXm5 logXw1scf c, ~27!
whereX is the solubility in mole fraction with superscripts mand w indicating ‘‘mixed solvent’’ and ‘‘water;’’f c is thevolume fraction of cosolvent. The parametersc is a functionof the solvent surface tension and of the solute hydrophocharacteristics. Yalkowskyet al.447 suggested for the valuof sc the following expression:
sc5~DgcHSA/kT!1~D«cPSA/kT!, ~28!
where HSA and PSA are the hydrocarbonaceous and psurface areas of the solute molecule~nm2!, respectively;Dgc
and D«c are the interfacial free energies~J nm22! of thesolvent at the hydrocarbonaceous and polar surface arecontact with the solute, respectively;k is the Boltzman con-stant~J K21!; and T is the absolute temperature~K!. Equa-tion ~28! for many HOC can be approximated to448
sc5~DgcHSA/kT!,
sc may be determined by the logarithm of the ratio of thydrophobic compound solubilities in pure cosolvent (Xc)and in pure water (Xw)449,450
sc5 log~Xc/Xw!.
Morris et al.451 have demonstrated thatsc can be corre-lated toKow
sc5a logKow1b,
where a and b are empirical constants unique for a givecosolvent.
For multiple cosolvent systems, Eq.~27! becomes
logXm5 logXw1Ss i f i ,
where f i is the volume fraction of cosolvent i ands i corre-sponds to the logarithm of the ratio of the solubilities of tchemical in the pure solvent i and in water.
This approach was then adopted445 to explain the decreasof the sorption coefficients and, consequently, the enhanmobility of the organic chemicals through porous media dto the presence of a cosolvent in the aqueous solution.
Karickhoff52,96 derived the following equation, relatinKoc to water solubility and including a ‘‘crystal energyterm ~Sec. 12.2! for solutes which are solid at ambient temperature
logKocw 52a logXw2@DSf~Tm2T!#/~2.303RT!1b,
~29!
in which a andb are regression-fitted parameters. Equat~29! has been extended for binary solvent mixture444
t
t
ic
lar
at
ede
n
logKocm52a logXm2@DSf~Tm2T!#/~2.303RT!1b.
~30!
Replacing logXm by Eq. ~27! and rearranging terms
logKocm5 logKoc
w 2ascf c.
Taking into consideration thatKd5Kocf oc, we obtain
logKocm/Koc
w 5 logKdm/Kd
w52ascf c. ~31!
In these equations,Kd is the sorption coefficient and thsuperscripts m and w refer to mixed solvent and water,spectively. The parametersc explicitly accounts for sorbate–solvent interactions and is assumed to be independent osorbent.445 a is an empirical constant which accounts fsolute–sorbent or cosolvent–sorbent interactions. It shoapproach unity if the fugacity coefficient for solute in sosediment organic carbon is relatively independent of solut52
and if the soil organic carbon properties are independenchange in solution phase composition. Equation~31! showsthat the relative sorption coefficient (Kd
m/Kdw) decreases ex
ponentially as the fraction of organic cosolvent (f c)increases.340,452–454
For a mixture of water and multiple cosolvents Eq.~31!becomes446
logKdm5 logKd
w2aSscf c,
where f c andsc refer to each solvent in the mixture. Therfore, (f w1S f c)51.
It is important to recognize454 that in Eqs.~29!–~31! theunits of Koc must be consistent with the expression of sobility in terms of mole fraction. This is not strictly necessawhen Eq.~29! is used to compare different values of logKoc
w
~Sec. 12.2!. In this case the partition coefficient may be employed with customary units of dm3 kg21; the number ofmoles per liter is constant for dilute aqueous systems,55.34 mol dm23, and this value becomes incorporated in tregression constantb. However, for the case of solvent/watemixtures, the total number of moles per liter is not constand the partition coefficient must be expressed in unitsmol kg21. Thus, Eq.~31! becomes
log$@Kd~Vw/qw1Vs/qs!#/@~Kdw~55.34!#%52ascf c,
whereV refers to the solute-free volume of water or solvein the mixtures, andq represents the molar volume of wator solvent.
The solvophobic theory was tested by Nkedi-Kizet al.455 measuring the sorption of anthracene and two hecides~diuron and atrazine! by five soils from aqueous solutions and binary solvent mixtures consisting of methanowater and acetone–water. Using the batch equilibratmethod, the Freundlich constants were obtained for a gisorbate–soil combination and for each solvent mixture.each sorbate, the logKd
m (dm3 kg21) value decreased log linearly as the fraction organic cosolvent (f c) increased. Theslope of logKd
m vs f c plots, designed assc, was unique toeach sorbate–solvent combination and was independenthe soil ~sorbent!. Thus, the organic cosolvent effects o
J. Phys. Chem. Ref. Data, Vol. 30, No. 1, 2001

ane
he
tey
b
r-oe
try
-
s
-teThco
anacrfore
ertio
hilsod-se
fi-a
o-o
ms
ngi
astheil-sorbu-storp-
e-d
than
of
heonffi-
ear
for
nits
to
tohip
7x-e-snolnot
an-ted
ce-dan
asm-
222222 DELLE SITE
sorption could be specified by a single parameter (sc),which combines the coefficients characterizing solventthe sorbate properties. The solvophobic model does notplicitly account for the possible effects of the solvent on tsorbent. Deviations from log-linear relation betweenKd
m andf c for sorption from acetone–water mixtures were attributo this effect. The sorption coefficients of low solubilitcompounds~anthracene! from aqueous solutions (Kd
w) aredifficult to measure. However their value can be derivedextrapolating the values obtained from mixed solvents tof c
50. The same authors452 verified this theory also by measuing the sorption and leaching of diuron and atrazine in scolumns eluted with aqueous solutions and binary solvmixtures of methanol and water. The retardation factor (Rm)for both herbicides decreased drastically as the volumefraction of organic cosolvent (f c) was increased in the binarsolvent mixture. The log-linear decrease in (Rm21) ob-served with increasingf c was well predicted by the solvophobic theory. All breakthrough curves~BTCs! were asym-metrical in shape, but the extent of asymmetry decreawith increasingf c for 0< f c<0.5. At f c50.5, the BTCs forboth diuron and atrazine were similar in shape~symmetricaland sigmoidal! and location (Rm51) to that of tritiated wa-ter, a nonadsorbed tracer.
In a further study444 the application of a solvophobic approach for predicting the sorption of HOC was evaluawith data collected using synthetic sorbents and soils.experimental data consisted of batch equilibrium sorptionefficients, as well as soil-thin layer chromatography~TLC!and reversed-phase liquid chromatographic~RPLC! retentionfactors. All data were collected using aqueous solutionsbinary or ternary solvent mixtures of water, methanol,etone, and acetonitrile. As predicted by the theory, the chmatographic retention factors and sorption coefficientsHOC decreased log-linearly with increasing fraction of oganic cosolvent in binary solvents. Reasonable agreemwas found between model parameters reported in the litture and those estimated using the data from batch sorpsoil-TLC and RPLC studies.
Fu and Luthy454 measured sorption of naphthalene, napthol, quinoline, 3,5-dichloroaniline onto three different sofrom methanol-water and acetone-water mixtures. It wasserved that the sorption partition coefficients, expresseunits of mol kg21, decreased semilogarithmically with increase in volume fraction of solvent in the aqueous phaThe decrease of the sorption partition coefficients werepressed in terms of the parameters and the valueas, whichis the logarithmic term with which sorbent sorption coefcient decreases with volume fraction solvent in water. It wconcluded from this evaluation that the parametera wastypically in the range of 0.44–0.57 with an average value0.51. The magnitude of thea values show that the logarithmic decrease of sorption partition coefficient is about halfthat which could be expected on the basis of the logarithincrease in solute solubility in the solvent/water mixtureThis may be a result of the solvent/water mixture swellithe organic carbon associated with the soil, and thereby
J. Phys. Chem. Ref. Data, Vol. 30, No. 1, 2001
dx-
d
y
ilnt
ic
ed
de-
d-o-r
-nta-n,
-
b-in
e.x-
s
f
fic.
n-
creasing solute accessibility to the organic matter. It wshown that the more hydrophobic the solute, the greatereffect of solvent in solvent/water mixtures on solute solubity enhancement, and hence the less the tendency toonto soil. Thus the results of this investigation are particlarly significant for those aromatic solutes exhibiting loweaqueous phase solubility. The authors recalculated the stion coefficients ~dm3 kg21! reported by Nkedi-Kizzaet al.455 for anthracene in terms of mol kg21. Then, to com-pute thea value for anthracene sorption onto soil, they rgressed logKd against volume fraction solvent and dividethe regression coefficient by the appropriate value ofs. Val-ues of a'0.67 for methanol/water system anda'1.1 foracetone/water system were found. These values, largerthose found by the authors454 may signify that the solvent didnot have as large an impact on improving the accessibilitythe solute to the organic carbon.
Walters and Guiseppi-Elie456 studied the sorption of2,3,7,8-tetrachlorodibenzo-p-dioxin~TCDD! to soils fromwater methanol mixtures. Volume fraction methanol in tliquid phase (f c) was varied between 0.25 and 1.0. Sorptiisotherms were linear and, when sorption partition coecients in cm3 g21 were converted to mol g21, their valueswere log-linearly related tof c. TheKd
m values for two soils,when normalized onf oc, gave values ofKoc
m that collapsedonto a single line having the equation determined by linregression analysis
logKocm524.97f c15.30. ~32!
The intercept value of 5.30 in Eq.~32! is equal to thelogarithm of the aqueous-phase partition coefficientTCDD expressed in units of mol g21. This value can beconverted to correspond to conventional dimensionless uby adding to it logV for water (logV51.26). The value oflogKoc(cm3 g21) for aqueous phase sorption of TCDDsoils determined in this way is 6.660.7. The slope of24.97corresponds to the term2a sc of Eq. ~31!. The value ofsc
for TCDD in water/methanol systems, which is estimatedbe 6.2, corresponds to the slope of the log-linear relationsbetween mole fraction solubility andf c. The apparent valueof a was calculated by dividinga sc by sc. For water sorp-tion of hydrophobic solutes,a is expected to range from 0.to 0.92. For sorption of TCDD from water/methanol mitures, a value fora of 0.80 was observed. The authors rported for some compounds thea values which increase alogKow increases. The prewashing of the soils with methaprior to use in sorption experiments apparently doesmodify the sorptive behavior of TCDD.
The influence of an organic cosolvent~methanol! on thesorption and transport of three HOC, naphthalene, phenthrene, and diuron in a sandy surface soil was investigausing both batch equilibration and column miscible displament techniques.457 The sorption constant values obtainefrom the two techniques were comparable and exhibitedinverse log-linear dependence on the volume fraction (f c) ofmethanol in the mixed solvent. The slope of the plot wapproximately equal to the logarithm of the ratio of the co

rmoreen
Pya
thneesr o
c
il-
veeatiendoiig
laig
bumn
ro
ethyu
id
llyge
de
ffief
byby
ra-con-asm-eon--d atheus
tantstantents
as
anason-sous-
-e inn-
ei-of
ip
s-
-thefgthetedent
r-dmetheef-ised
on-
e-ent
223223SORPTION OF ORGANIC COMPOUNDS
pound solubilities in neat cosolvent and water. Long-teexposure to methanol-water mixtures had little effectsorption and transport properties of the soil, but columntardation factors were influenced by the short-term solvexposure history prior to solute elution.
Equilibrium batch isotherms for neutral and ionized PCwith Weber soil were measured also in methanol-water stems at pH,3 where PCP is completely undissociated andpH.9 where PCP is completely dissociated.339 An inverselog-linear relationship, as described in Eq.~31!, was ob-served betweenKd and the volume fraction of methanol (f c)for sorption of neutral and ionized PCP. The slope oflog-linear relationship (a sc) for ionized PCP is smaller thathat for neutral PCP. This reflects a change in the degrehydrophobicity between the two species and also suggthe dominance of solute–solvent interactions with transfesome type of neutral ion pair from solution.
The effect on the solubility of HOCs due to the presenof a partially miscible organic solvent~PMOS! in a com-pletely miscible organic solvent~CMOS!/water system wasexamined.458 It has been found that nonpolar PMOSs~e.g.,toluene and TCE! did not appreciably increase HOC solubity, while polar PMOSs~e.g., o-cresol and nitrobenzene! didsignificantly enhance HOC solubility. Polar PMOSs hagreater cosolvent effects because they are present in grconcentrations as a result of their higher aqueous solubiliThese changes in solubility of HOCs results in correspoing inverse variations of sorption coefficients on ssystems.459 The presence of nonpolar PMOSs does not snificantly influence HOC sorption by soils. In contrast, poPMOSs have sufficiently high aqueous solubilities that snificant decreases in HOC sorption can be measured.
The sorption data collected with mixed solvents canextrapolated to provide reliable estimates of both equilibri~solubility, Kd! and nonequilibrium parameters for sorptioof organic chemicals from aqueous solutions.460 The use ofmixed solvents is advocated especially for the more hydphobic compounds (logKow.4), because it greatly facili-tates batch and column experimentation and minimizesperimental artifacts. Methanol is recommended ascosolvent of choice, because data from mixed-solvent stems best conform to the log-linear cosolvency model. Fthermore, this method of determination ofKd on sedimentsallows us to minimize the effects of the presence of colloand DOC and the effect of the sediment concentration.461
8. Effect of Sorbent Concentrationor ‘‘Solids Effect’’
Sorption of a chemical on soil/sediment is generatreated as its distribution or partition between two homoneous phases, which can be totally separated. Thus, thetribution coefficients should be independent on the conctration of sorbent.
However, the results of several laboratory studies86 dem-onstrated an inverse relationship between partition coecient and concentration of adsorbing solids. The ‘‘solids
n-t
s-t
e
oftsf
e
ters.-
l-
r-
e
-
x-es-r-
s
-is-
n-
--
fect’’ is most pronounced for constituents characterizedlarge partitioning. For constituents that are representedintermediate partitioning, the effect of the solid concenttion is less pronounced, and the coefficient approaches astant value for substances of low partitioning. This effect hbeen found with a variety of elements and organic copounds sorbed on various solids; theKd values may decreasof some orders of magnitude when the range of solid ccentration~10–10.000 mg dm23! covers values normally existing in natural water systems. It has been suggestepower-law dependence of the partition coefficient onconcentration of solids. This effect may have very serioconsequences in assessing the fate of hydrophobic polluin natural water systems, because it means that the pollusorbed on suspended solids and accumulated in sedimcan be released to the interstitial water.
The sorption of linuron and atrazine on Begbroke soil wstudied as a function of the soil to water ratio.462 A fivefoldincrease in the sorption of linuron was found under 1:10 that 4:1 ratio. The sorption in a 1:1 soil:water mixture wintermediate. For atrazine the difference between slurry cditions and the 4:1 ratio was approximately threefold. Allindane sorption was shown to be affected by sediment spension concentration.463 A 50-fold increase in the water-tosediment ratio effects approximately a 1.5 times increasadsorption at an equilibrium concentration of 1 ppm of lidane~K f value!.
Voice et al.464 found that the linear regression of logKd asa function of log ~concentration! of three Lake Michigansediments for MCBz, naphthalene, 2,5,28-trichlorobiphenyl~TCB!, and 2,4,5,28,48,58-HCB had an average value of thslope of20.47, indicating approximately an order of magntude increase in partition coefficient for every 2 ordersmagnitude decrease in solid concentration.
Weber et al.465 found that the slope of the relationshvaried from20.16 to20.92 with an average value of20.40with Aroclor 1254-river sediments or montmorillonite sytems.
Di Toro et al.,466 in order to quantify the effect of suspended solids in sediment interstitial water, determineddiffusion coefficient and the partition coefficient o2,28,4,48,5,58-HCB in a sediment by using a dual radio-taexperiment that extended over 2 yrs. They found thatpartition coefficient is in close agreement with that predicfrom hydrophobic sorption correlations based upon sedimorganic carbon andKoc. It also corresponds to the low paticle concentration limit of the partition coefficients founwhen batch equilibrations of dilute suspensions of the sasediment were used. The conclusion is that, whateverreason for this behavior is, it appears that the partition coficient that applies to interstitial water-sediment sorptionthe low particle concentration limit obtained in suspendsediment experiments. However, Horzempa and Di Toro467
reported that, under approximately constant equilibrium ccentration of the same HCB compound~;7 mg dm23!, val-ues ofKd for adsorbed HCB on Saginaw Bay sediment dcreased by approximately a factor of 4, as sedim
J. Phys. Chem. Ref. Data, Vol. 30, No. 1, 2001

od-
ioceisnon
lyo
m
eth
a
of
io
lidsgudt
sos,gi-
reo
fte
ext
n
2tsrte
inifer
n-aticoil
ofsilt
asn-
soild
m
aricical,n
the
tsils,theith
r-tionon
asac-di-
ewithin-
e-umoas
eseoci-
s,o
me-asses.qui-at,
224224 DELLE SITE
concentrations were increased from 10 to 1000 mg dm23.Further evidence of the effect of suspended sediment c
centration~SSC! on theKd value was given by Servos anMuir468 with their work regarding the sorption of 1,3,6,8TCDD on lake sediments. The sediment to water partitcoefficient was determined for suspended sediment contrations ranging over 4 orders of magnitude. The truly dsolved~free! concentrations were estimated by four differemethods: centrifugation at 6000 g for 15 min, centrifugatiat 20 000 g for 30 min, reverse-phase C18 cartridges,414 anddynamic headspace analysis.417 The slope of the relationshipbetween logKd and log SSC resulted in being significantless negative for the last two methods than for the first twHowever, the four measurements did not completely elinate the negative correlation. The data of the logKds ob-tained as a function of log SSC were extrapolated at zsediment concentration. Four values were obtained withfour methods; they ranged between 5.98 and 6.23 cm3 g21.
Celorieet al.469 demonstrated by batch sorption tests thas the solid~kaolinite! concentration~SC! increased from0.01 to 270 g dm23, theKd for phenol decreased 4 ordersmagnitude, demonstrating the solids effect. A regressionlogKd as a function of log SC gave a slope of20.95. Thisvalue is consistent with similar data for heavy metal sorptto quartz and montmorillonite~20.67, 20.91!470 and forPCB sorption to lake sediments~20.68!.471 It wasobserved469 that the batch tests may be affected by the soeffect; therefore column studies may be conducted to emate Kd values by modeling the generated breakthroucurves with a solute transport model. However, column sties conducted with fine grained soils require a long timebe completed. Thus a centrifugation procedure of thecolumn was suggested to alleviate these disadvantageimposing a confining stress on the soil, and by producingreater pore water velocity.Kd values obtained in the centrfuge experiments were compared withKd values measured inbatch equilibrium tests. Although theKd values determinedin the centrifuge were slightly lower than the values pdicted by extrapolating the batch data, the results were csistent with the solids effect.
9. Desorption and Nonsingularityin Sorption–Desorption Process
A sorption process is sometimes reversible, however oa ‘‘hysteresis’’ effect is observed.
The lindane desorption from 32 soil samples, with theception of a lacustrine soil, was complete and independenall soil variables and the amount of lindane sorbed.119
Desorption of chlorinated benzenes from river sedimehas the same time scale as the sorption process.155 Both sorp-tion and desorption processes were completed in about
A variety of laboratory batch and column experimenhave been conducted to elucidate the sorption behaviohalogenated alkenes and benzenes in a river wagroundwater infiltration system.207 The results of this study
J. Phys. Chem. Ref. Data, Vol. 30, No. 1, 2001
n-
nn--t
.i-
roe
t,
of
n
sti-h-
oilbya
-n-
n
-of
ts
d.
ofr–
indicated that, for concentrations typically encounterednatural waters, the sorption of these compounds by aqumaterials was reversible.
No significant differences were found by comparing costants of adsorption and desorption for halogenated aliphand aromatic compounds using several different smaterials.472
No hysteresis effects were observed in the desorptionpyrene and methoxychlor from sediment coarsefraction.108
Also the binding of BaP to dissolved humic material wcompletely reversible and the extent of reversibility was urelated to the sorption time.400
Adsorption of napropamide and bromacil on soils277 andadsorption of parathion on organic matter extracted fromwere all reversible.147 Also metribuzin-soil systems showelittle tendency for irreversible sorption.288
Desorption of PCE or 1,2-dibromo-3-chloropropane froaquifer sediment~0.19% OC! was monitored following sorp-tion for 6 or 30 d.473 The compounds were desorbed bypurge technique in which a third phase of Tenax polymeadsorbent beads provided a sink for desorbed chemthereby simulating desorption to infinite dilution. More tha95% of the initial sorbed compound was desorbed withinfirst 4 d, but a persistent fraction~0.4%–1%! remained asso-ciated with the sediments for at least 35 d.
Rogerset al.170 demonstrated with desorption experimenthat 3% of the initial benzene remained sorbed to two sowhile 32% remained on the Al-saturated clays and 1% onCa-saturated clays. Also sorption-desorption of fluorene waquifer materials showed hysteresis effect.199
Adsorption–desorption studies of DDT with clay mineals, marine sediment, and humic acid showed that adsorpon clays and sediment was almost reversible, while thathumic acid was not.173 The very low apparent equilibriumshift observed for desorption from sediment probably wdue to DDT desorption from the more abundant mineral frtion and to alteration of the humic acid polymer in the sement, due to interaction with clay minerals.
Sorption of PAHs on sediments was achieved in fhours, but a drastic change in the ease of extraction whexane of sorbed chemical was frequently observed withcreased incubation time.151
Desorption of PCBs from Glendale soil was minimal, btween 2% and 9.5% per cycle depending on the equilibrisolution concentration.474 The addition of sewage sludge tthe soil increased PCB adsorption, while desorption wminimal, although depended on the incubation time. Thdata suggest that the transport by soil water of PCBs assated with sewage sludge additions should be minimal.
Hance144 reported that the desorption of four herbicidemonuron, linuron, atrazine, and chlorpropham, from twsoils, a soil OM fraction and bentonite appeared to be sowhat slower than adsorption. A period of 24 h or less wtaken for equilibria to be established in adsorption procesHowever, in seven cases out of eighteen the desorption elibrium had not been attained after 72 h. It appeared th

es
ichmx
a
onde
i-he
ilslyedera
tiodiec
ao
sentiop-lysod
agala
en
ylyae
oi
eid
adbeive
er
oner-
ith
ers-
ter;ible
ri-ls
zineaf-ofi-nd
the
i-
ifi-re
.
tion.byattureen-e-
wasv-mnlyedere
or
-ith
rednol
liedtent
as
sti-
225225SORPTION OF ORGANIC COMPOUNDS
when the value of the Freundlich constant 1/n was 1 ornearly so, the desorption equilibrium was achieved in lthan 24 h. The systems showing low values of 1/n werethose involving the ureas and bentonite or soil, for whdesorption is slower. This suggests the possibility that somechanism involving penetration of the interlayers of epanding clay minerals may operate.
Urea herbicides were easily desorbed from a sandy losoil ~1.77% OM! and a heavy clay soil~4.15% OM!, but notfrom a high organic loam soil~10.5% OM!.260 The sametrend of decreasing desorption rate with increasing OM ctent in four soils was found for fensulfothion and its sulfiand sulfone derivatives.261 Trifluralin and triallate werereadily desorbed from montmorillonite by water, with minmal desorption for peat moss, cellulose triacetate, and wstraw.475
The variability of diuron desorbed from arid-zone solow in organic matter was basically due to diuron initialadsorbed.271 As in adsorption, desorption could be predictfrom SA or CE and not from OC content in soils. Othauthors found that desorption of diuron from sediments wrelated to the amount of OM present.257 As reflected in thedifference between the sorption slope and the desorpslope, sediments low in organic matter readily desorbedron. As the organic matter increased, the differences betwthe slopes increased. The resistance to desorption, whichbe considered a measure of the binding energy, of diuronmonuron sorbed on sugar cane soils has been found trelated to adsorptive capacity.255 Thus, in highly adsorptivesoils these herbicides are not active enough to be used.
Fluometuron sorbed on a loam soil showed hystereeffect.476 The same effect was found with fluometuron wha soil was subjected to seven consecutive desorpequilibrations.118 It was suggested that the shift in the sortion equilibria with repeated equilibration was most likedue to a physical change in the sorptive character of thecomplex. This change may be associated with increasedpersion or weathering of the clay–organic matter microgregates with repeated wetting and shaking, resulting inincreased number of sites available for sorption. This expnation was similar to that suggested by Grover and Hanc462
to explain the effect of soil/water ratio on sorption of linuroand atrazine.
Graham-Bryce262 reported that adsorption of disulfoton bsoil was fully reversible if desorption took place immediateafter uptake when soils were still wet, but the release wmodified when the soils were allowed to dry thoroughly btween adsorption and desorption. However, with dried svalues ofK f were larger and values of 1/n smaller, indicatingthat drying made desorption more difficult. Moreover dsorption became progressively more difficult as insecticwas removed.
Monuron, atrazine, and prometryne were reversiblysorbed to montmorillonite even when the clay plus adsorherbicide was dried to a constant weight at 62% relathumidity.477 With peat there was an indication that sommonuron, linuron, atrazine, and prometryne became irrev
s
e-
m
-
at
s
nu-enan
ndbe
is
n
ilis--n-
s-ls
-e
-de
s-
ibly sorbed after a period of time. Thus, irreversible sorptito the OM in soil may be a mechanism by which some hbicides become phytotoxically inactive in the field.
The sorption and desorption of atrazine and linuron wsediment/water~1:9! mixtures are initially very fast, ap-proaching 75% of equilibrium values within 3–6 min.478
Herbicide sorption on the sediments was completely revible after 2 h of sorption time. Talbert and Fletchall145 re-ported that s-triazines could be eluted gradually with wahowever, the sorption reaction was not completely reversas indicated by the small amounts of simazine~10%! andatrazine~19%! not released during the course of the expement. Desorption of atrazine from geologic materia~0.09%–0.33% OC!479 and soils~2.6% and 2.8% OC!480 in-dicated hysteresis.
Soil samples containing residues of the herbicides atraand metolachlor were collected from fields 2–15 monthster their application to assess the sorptive reversibilitythese residues.481 The results indicated that these contamnated samples can contain a fraction of labile compouranging from 0.056 to 0.60 inversely related to the age ofresidue.
Desorption ofK f values of atrazine from field aging resdue increased slightly with aging.482 Also Ma et al.483 re-ported that desorption of atrazine from soil deviated signcantly from adsorption data. The deviation was mopronounced as incubation time increased from 1 to 24 d
Also atrazine adsorbed on two Ca21, Mg21, and Na1 satu-rated soils shows hysteresis effects indicating that adsorpand desorption of this compound are irreversible reactions127
Desorption of atrazine from a clay loam soil is affectedtemperature and pH.286 The average recovery was 85%0.5 °C and 98% at 30 and 40 °C. An increase of temperashould increase desorption for two reasons: desorption isdothermic and solubility increases with the temperature. Dsorption also increased as pH increased: the recovery89% from the soils at pH 3.9 and 4.7 while 98% was recoered from the soil at pH 8.0. Desorption of atrazine frohumic acid was quite low. The average recovery was o11% with humic acid at pH 2.5, while 69% was recoverwhen the pH was raised to 7.0. Desorption experiments wcarried out in batch for the same time~2 h! as sorption ex-periments.
Clay and Koskinen158 reported that nondesorbable alachl~as determined after methanol extraction! generally increasedon a Waukegan~W! silt loam and a Ves~V! clay loam dur-ing five 0.01 M CaCl2 desorptions. Atrazine was totally extracted with methanol from W soil after one desorption w0.01 M CaCl2. However, after five desorptions with 0.01 MCaCl2 an average of 5.5 and 15.5% of the total recoveatrazine from two atrazine application rates was methanondesorbable from the W and V soils, respectively.
Laboratory studies showed that more than 95% of apppermethrin was adsorbed on lake sediment with OM conof 43%, but less than 10% of the adsorbed insecticide wdesorbed by four 10 mL water rinses.126
The desorption of dipropetryn and prometryn was inve
J. Phys. Chem. Ref. Data, Vol. 30, No. 1, 2001
aic,est
oupdioceMe
aibl
quds
onth
O
tu
byn
ernTssrethe-
ila
amiode
gafrol
in
th
tio
tio
en-ghug-nre-
ti-a
eewasby
Clas
tud-1 N
ex-cing
inbed
is-, anthat
N
hisly.of
.9,
ilsof.Mofu-
v-tion
,4-uredhedeld.nt oftothe
rt topar-
–tudy-
s.-
226226 DELLE SITE
gated after a series of adsorption experiments using sixsorbent materials possessing a wide range of physchemical characteristics~CE, clay content, OM contentpH!.299 Generally, less dipropetryn than prometryn was dorbed after any given extraction. The adsorbents showinggreatest amount of adsorption also showed the least amof desorption. The clay and OM content in each soil apeared to significantly decrease the amount of herbicidesorbed from the soil matrix. The shape of the desorptisotherms also appeared to be influenced by the presenthe OM. With a sorbent of sand plus muck having an Ocontent of 2.1% and with a clay loam soil of 2.8% OM thisotherms were nearly flat (1/n;0.0) at low herbicide con-centrations. This suggests that the herbicide was firmlytached to the adsorbent and difficult to remove or irreversadsorbed.
The adsorption–desorption studies showed that the aous solution leached only a small quantity of the aldrin asorbed by the soil.138 The desorption rate from the soils wainversely proportional to their OM content. Also desorptiof parathion from attapulgite modified with treatment wian organic cation~hexadecyltrimethylammonium! was lowerthan desorption from the unmodified clay.235
It has been demonstrated that parathion sorbed onextracted from soil is reversibly released,147 while a hyster-esis effect was found when parathion was sorbed on nasoils with high OM content.267 The removal of the OM fromthe soils by hydrogen peroxide treatment followedadsorption–desorption experiments, allowed us to evideate the differences in desorption between OM and minfraction. The results demonstrated that parathion–orgacomplexes are stronger than parathion–mineral ones.hysteresis in the parathion adsorption–desorption proceespecially due to the very small amounts of parathionleased from the organic fraction, while the adsorption onmineral fraction is easily and totally reversible. Similar rsults were reported by other authors with parathion,129 orga-nophosphorous and carbamate insecticides,122 and hexachlo-rocyclohexane isomers.185
However, hysteresis effects were noted alsoadsorption–desorption studies of parathion with csuspensions.246 These effects were greater in Fe31- than inCa21–montmorillonite. The repeated desorption pathwwas dependent only on the initial concentration. The voluof solution removed in each cycle did not alter the desorptpathway, but only the rate at which the desorption proceedown the desorption isotherm.
Desorption of 12 insecticides, representative of ornochlorine, organophosphorus, and carbamate groups,three soils and a stream sediment was found proportionatheir water solubility.264 The compounds were desorbedgreatest amounts from the sand.sandy loam.sediment, butthe order of desorption for the 12 chemicals remainedsame.
Napropamide shows nonsingularity between adsorpand desorption in different soil–water systems.278 Also thedesorption data can be described by the Freundlich equa
J. Phys. Chem. Ref. Data, Vol. 30, No. 1, 2001
d-o-
-hent
-e-nof
t-y
e--
M
ral
ti-alicheis-e
ny
yend
-mto
e
n
n.
As for the other reported systems, the value ofK f for desorp-tion is not constant, but a function of the adsorbed conctration when desorption was initiated. The soils with hiOM contents had a larger retention ability and the data sgest that some of the napropamide may be fixed or noversibly adsorbed.
Carringeret al.121 compared the amounts of some pescides of different nature desorbed from OM prepared frompeaty muck soil and from Ca–montmorillonite after thrrepeated desorption steps. Asulam, an acid herbicide,weakly adsorbed by the OM. More asulam was desorbedde-ionized water~84.4%! than by 1 N CaCl2 ~58.5%!. Thismay have been due to a lower solubility of asulam in Ca2
than in water. Prometryn, a basic s-triazine herbicide, wadsorbed in great amount by the same OM. Desorption sies showed that much more prometryn was desorbed byCaCl2 ~69.4%! than by de-ionized water~5.89%!. This veri-fies that the mechanism of adsorption was by cationchange, since the excess Ca was very effective in displaprometryn from the colloid surface. Prometryn, adsorbedlarge amount also by clay mineral, was much more desorwith 1 N CaCl2 ~100%! than with deionized water~37%!,indicating that prometryn cations were probably being dplaced by excess Ca ions. Desorption studies of dicambaacidic herbicide, adsorbed by clay minerals, have shownlittle compound was desorbed by deionized water and 1CaCl2 ~32.8% and 41.6%, respectively!. The desorbedamounts were collected almost totally in the first step. Tsuggests that part of dicamba was adsorbed very strong
A high hysteresis effect has been found in desorption2,4,5-T from a Glendale clay loam soil, having a pH of 7and OC50.47%.484
Desorption experiments were undertaken with 18 soused in the adsorption studies to evaluate the stabilityadsorption complexes between 2,4-D and colloid surfaces333
The effect of successive washings with solutions of 0.025CaCl2 on desorption of 2,4-D was studied as a functionsoil pH, soil OM, and exchangeable aluminum. The calclated r values were 0.81,20.78, and20.81, respectively.
Sorption and desorption of picloram with a loam soil haing 1.7% OM content cannot be described by one equaand hence are not single valued.485
The sorption and desorption of phenol, 2-MCP, and 2DCP by a fine and coarse sediment fraction were measin a continuous flow stirred cell at pH values lower than trespective pKas.100 Desorption was slower than sorption, anin some cases up to 90% of the sorbate was irreversibly hPeroxide treatment of the sediment decreased the amouirreversible sorbate, but the partition coefficients referredthe residual organic matter increased. The increase inpercentage of reversible sorbate presumably is due in pasorbate held at inorganic surface sites, and hence, thesetition coefficients are overestimates.
The nonreversibility or nonsingularity of the sorptiondesorption process may have serious consequences in sing the movement of organics in soil/sediment systemTherefore, Rao and Davidson87 evaluated the errors intro

soio
o-
-
he
s
nas
-.
ths
r 3tioyftio
tia
en.rth
freeent
soilticle
f-heyn,on-
so-ad-inple
ini-asili-isblear
esctsccu-
istri-ses.
n
idedt ofbedateility,
-
lnd
p-
msionyr ofth-
thecsoil
hen-e auld
227227SORPTION OF ORGANIC COMPOUNDS
duced by not accounting for this effect. For nonsingular itherms, the Freundlich coefficients are different for sorptand desorption and the respective equations are
Sa5KaCNa, ~33!
Sd5KdCNd, ~34!
where the subscripts a and d denote, respectively, the stion ~adsorption! and desorption,S is the sorbed phase concentration@equal toq in Eq. ~4!#, C is the solution pesticideconcentration at equilibrium, andN is equivalent to 1/n inEq. ~4!. It has been demonstrated485 that the degree of nonsingularity depends on the maximum amount sorbed (Sm)before initiation of desorption, to which corresponds tmaximum concentration of the aqueous phase (Cm)
Kd5KabSm
12b, ~35!
whereb5Nd /Na. Equation~35! can be expressed in termof the maximum solution concentration (Cm) prior to de-sorption as follows:
Kd5KaCmNa2Nd. ~36!
The ratioSd /Sa may be calculated introducing in Eq.~36! therespective Eqs.~33! and ~34!, thus obtaining
Sd /Sa5~CmNa2Nd!~CNd2Na!. ~37!
Note that the ratio (Sd /Sa) in Eq. ~37! is equal to 1.0 whenC5Cm, the point where desorption is initiated, or wheNa5Nd , i.e., when the isotherm are singular. It wshown484 that the value ofNd was related toNa and Sm;however an average value ofb51/2.3 was found satisfactory ~i.e., Na52.3 Nd). Introducing this relationship in Eq~37!
Sd /Sa5~Cm20.565Na!~C20.565Na!
and assumingCm510mg/mL under normal agricultural fieldconditions, the authors have demonstrated graphicallythe error (Sd /Sa) is greater at low solution concentrationand decreases with increasing nonlinearity (Na,1) of thesorption isotherm. The conclusion is that, if a factor of 2 ois considered tolerable, then over a solution concentrarange of 0.4–10mg cm23 the effects of nonsingularity mabe ignored. Lyman105 reported a table with the values oerrors associated with assumption of reversible adsorpfor C51.0, 0.1, and 0.01mg mL21 and Cm510mg cm23
and as a function ofNa between 0.5 and 1.1.
10. Interpretation of ‘‘Solids Effect’’and Nonsingularity in
Sorption–Desorption Process
These two apparent anomalies observed in the interacof organic and inorganic sorbates with several sorbentsoften discussed together, because a number of experimresults indicate that they may be due to the same cause
A first interpretation of the solids effect and of the hysteesis effect is that they are due to artifacts connected to
-n
rp-
at
n
n
onretal
-e
experimental methods. Servos and Muir468 suggested that thesolids effect may be due to errors inherent in measuringwater concentrations, especially at high suspended sedimconcentrations. Grover and Hance462 evidentiated that theobserved solids effect can be due to the dispersion ofaggeregates in batch tests, which is greater at low parconcentration, thus resulting in greater adsorption.
Bowman and Sans486 studied the sorbent concentration efect on sorption of some insecticides by soils and clays. Tobserved that:~a! for those compounds, such as dieldriexhibiting strong tendencies to adsorb to glassware, the cventional adsorption blank, used in batch-type sorption itherm, is inadequate to properly compensate for glasssorption. Since glass adsorption is quite irreversibleaqueous solution, they proposed a sequential blank/samadsorption technique, whereby the stock solution wastially equilibrated in the glass bottle then a small aliquot wremoved for analysis before adding the sorbent for its equbration period;~b! to reduce the measurement error, itpreferable to adjust the sorbent concentration to a suitavalue~Sec. 11.1.!; ~c! sorbent concentration does not appeto significantly affect the distribution coefficient of pesticidover a fairly wide range of values. Reported solids effemay be ascribed to incomplete phase separation or to amulative relative errors in measuring concentrations;~d! thecentrifugation process does not appear to change the dbution of pesticides between the sorbent and water phaThus, the same authors487 proposed the use of a dilutiomethod in batch equilibration~Sec. 11.1.!, which allowed usto considerably reduce anomalous effects because it avophysical separation of the two phases. The small amounobserved hysteresis in the dilution method may be ascrito a combination of true hysteresis and/or small sorblosses due to degradation, glass adsorption, and volatwhich occurred during equilibration period.
Rao and Davidson87 identified three major causes for nonsingularity of the sorption–desorption processes:~i! artifactsdue to the specific method,~ii ! chemical and/or microbiatransformations of the chemical during the experiment, a~iii ! failure to establish complete equilibrium during sortion.
Artifacts ~i! may be connected to the batch equilibriumethod. It involves repeated centrifugation and resuspenof the soil followed by prolonged agitation, which mabreakdown the soil particles, thus increasing the numbesorption sites during the desorption phase. A similar hypoesis was already suggested by other authors.274 Modificationsof the batch method have been identified to eliminatecentrifugation step:488 ~a! using a water immiscible organisolvent as a third phase to desorb the compound from theand aqueous phase, and~b! desorption by dilution of thesoil–water-compound system~Sec. 11.1.!. This second pro-cedure was the same suggested by Bowman and Sans.487
The chemical and microbiological transformations of tcompound~ii ! may be sometimes important to explain nosingularity in sorption–desorption isotherms, but cannot bsignificant factor for the most persistent pesticides. It wo
J. Phys. Chem. Ref. Data, Vol. 30, No. 1, 2001
nix-oth
thb
eday
p-orta
c-orewoTre
glistiooB
rapaloonss
oo-D:rlyt
iti-
nghvebe
reththornnf
ce ofbedb-uat,ring-
ure-for
par-ive, as
thbe
n theof
lesase,mayus-undofts.
ude-
ho-lids.dict.testithdel
esisInili-r isthecedpor-ved
Pscon-at
ore-edafteriso-
228228 DELLE SITE
be a good practice to sterilize or to add antibiotics to mimize the microbial activity in soils during the sorption eperiments. Microbial decomposition is also responsiblethe apparent increase of phenol adsorption by soils withincrease of the equilibration time.489 When sterile soils areused, theK f and 1/n values do not change with time.
Point ~iii ! will be discussed later.Although artifacts may be important in some cases,
nonsingularity of sorption–desorption isotherms couldreal and significant for certain compounds.87 Di Toro andHorzempa490 studied the desorption process using tritiat2,4,5,28,48,58-HCB and a series of lake sediment and clmineral samples. They found that theKd for desorption issignificantly higher than that initially determined in the sortion experiment and that the results of consecutive destion studies indicate a presence of a significant componenthe adsorbed HCB extremely difficult to desorb. On this bsis they have defined a ‘‘resistant’’ and a ‘‘reversible’’ fration of it to build a model describing the desorption behaviThe resistant fraction does not desorb at all for the first fconsecutive desorptions; its existence accounts for theserved hysteresis in the single desorption experiments.authors have derived a computational method to allow pdiction of the magnitude of the reversible and more stronadsorbed HCB fractions, assuming linear the adsorptiontherm and the initial stages of the consecutive desorpisotherm. The kinetic data suggest that separate sites shbe responsible for reversible and resistent binding of HCThe results of a following study491 suggest that nonsingulaisotherm behavior cannot be attributable to microbiologickinetic, or experimental effects. Moreover, while HCB sortion may ultimately be reversible, desorption coefficient vues are substantially greater than those obtained for adstion. Release from sediments by consecutive equilibratiappears to involve desorption along two distinct isotherm
Sorption of lindane on chitin shows the same problemsorbent concentration effect and nonsingularitysorption–desorption.492 The reversible and resistant compnents have been determined following the method byToro and Horzempa.490 The main results of this work were~a! the reversible component sorption coefficient is faiconstant while the resistant component sorption coefficieninversely related to the chitin concentration. When the chconcentration is above 10 mg dm23, the sorption and desorption isotherms are almost the same;~b! at a fixed chitin con-centration, the resistant component is inversely proportioto temperature and is directly related to the salinity. At hitemperatures and low salinities, the process becomes reible and the resistant component sorption coefficientcomes zero.
A second interpretation of the solids effect and the nonversibility of the sorption process was that they are due topresence of DOM released from the sorbents. The role ofDOM from natural water and sewage in reducing sorptionhydrophobic organic compounds by river- and sewage-boparticulate matter was suggested by Hassett and Anderso426
Karickhoff and Brown89 reported that UV spectra o
J. Phys. Chem. Ref. Data, Vol. 30, No. 1, 2001
-
fe
ee
p-of-
.
b-he-
yo-nuld.
l,--rp-s
.:f
i
isn
al
rs--
-eefe
.
paraquat in a hectorite suspension revealed the presenmore than 50% of this compound in the water phase soron particulates not removed by centrifugation. They oserved that, for highly sorbed compounds such as paraqconventional phase separation techniques for measusorption may not distinguish sorbed versus ‘‘free’’ compounds.
Significant interferences were apparent in the measment of the water-phase concentrations of 2,3,7,8-TCDDsorption experiments involving a high-f oc soil.109 They wereattributed to the presence of nonseparable suspendedticles. Prewashing this soil from one to five consecuttimes with water appeared to reduce these interferencesindividual-point distribution ratios approached theKoc valuedetermined for the low-f oc soil.
Gschwend and Wu408 gave the same interpretation to bothe nonreversible effect and the solids effect, which canexplained with the release of organic matter~natural micro-particles or organic macromolecules! from the sorbent to wa-ter. It has been assumed that, if the phase separations isorption experiments are incomplete, noncentrifugablenonfilterable microparticles or organic macromolecu~NSPs! released from the solids remain in the aqueous phsorbing some of the compound. Thus, these materialscause the decline in partition coefficients with higher spended solid loading, by increasing the amount of compoin ‘‘solution.’’ This has been demonstrated by a seriesexperiments carried out with two lake and river sedimenAfter five washes of 12 000 mg dm23 sediment~2.5% OC!the NSP content dropped by about an order of magnitdown to 100 mg dm23. It did not appear that washing significantly affected the sedimentf oc and, therefore, it may bereasonable to assign to NSPs a similar affinity for hydropbic compounds as that exhibited by the larger mass of soOn this basis the authors have proposed a model to prethe decline ofKd with the initial sediment concentrationThis effect was strongest for the sediment with the greaorganic carbon content and for hydrophobic compounds wthe strongest tendencies to sorb. The good fit of the mowith the decreasing of the experimentalKd values by in-creasing the sediment concentration supported the hypoththat the NSPs are the primary cause of this behavior.desorption experiments, after the first sorptive batch equbration, the aqueous layer is discarded and clean wateadded to take its place for a new equilibration step. Thus,NSPs in this inadvertently prewashed condition are reduin quantity, and the resultant aqueous load contains protionately less NPS-sorbed material. Hence the obserKoc
desorptionis greater than the previousKocsorption. Further suc-
cessive desorption tests will continue to be effected by NSless and less. These results would lead to the erroneousclusions that irreversible binding was occurring and ththere was a hysteretic effect in the desorption process. Mover the authors408 have demonstrated that using prewashsediments the results obtained by Di Toro and Horzemp490
in desorption experiments could be reproduced and that, arepeated prewashes, the adsorption and the desorption

lB
.oi-t
ioe
exmte
obdth
akluthnt
rt-e
M’
-kes-tu’’
isncreabe
hp
dem
efoessin
ng
ni
as-
s a
s topar-lesssi-ofat,
rtainicals todel
re-is
ta.tionalles,on-ive
orp-
etionnicosetal
bylac-al.lli-
de-se.t
theheus-in aralus-ian
onre-
lidon-b-ere
er
e
229229SORPTION OF ORGANIC COMPOUNDS
therms were indistinguishable. The ‘‘three phase’’ mode408
was used to describe the sorption behavior of 1,2,3,4-TeCon three sediments at different sediment to water ratios493
On the same basis, another model was proposed by Vand Weber.464,494 The ‘‘solute complexation’’ model assumes that the liquid phase contains a certain amounorganic material~total organic carbon, TOC! which origi-nates mainly from the solid phase but remains in solutfollowing phase separation. The initial reaction that takplace in the system is an irreversible binding or complation of solute molecules to TOC. As a result of this coplexation phenomenon the solute can exist in two stawithin the liquid phase, ‘‘free’’ and ‘‘bound;’’ subsequent tthe binding reaction, both free and bound solute cansorbed by the organic fraction of the solid phase. The mopredictions gave a good fit to experimental data regardingsorption of some hydrophobic compounds on three LMichigan sediments. The authors concluded that the socomplexation model offers a plausible representation ofpartitioning of hydrophobic organic compounds to sedimecontaining moderate levels of organic compounds.
The importance of colloidal-sized, nonsettling micropaticles to the behavior of highly hydrophobic organic polluants has been evidenced by measurements of the sedimwater partitioning of PCB congeners in Lake Superior.50 Thestrong inverse variation ofKd with suspended solids~SS!concentration suggested the presence of this colloidal DOThe authors, starting from the ‘‘three phase equilibriummodel by Gschwend and Wu,408 introduced the inverse correlation betweenKd and SS concentration observed in LaSuperior to show that colloids contributing to the ‘‘disolved’’ concentration can explain PCB partitioning in naral waters. Their ‘‘three phase equilibrium speciationmodel allow readily calculating the relative amounts of dsolved, colloid-associated, and particle-bound contamina
Eadie et al.409 studied the distribution of hydrophobichemicals in Great Lakes water and demonstrated the pence of these compounds as free, bound to particles,bound to DOC. They noted a weak inverse relationshiptween the logKd and ambient particle concentration.
Schrapet al.495 attempted to quantify the ‘‘third phase’’ inthe suspension water of sediments by turbidity, dry weigand dissolved organic carbon measurements. Also, the apent enhanced solubilities of HCBz and two PCBs weretermined in the suspension water. Solubilities of these copounds were found to be considerably enhanced~up to abouteight times!. On the basis of these third-phase analyses,perimental sorption coefficients of HCBz were correctedthe third-phase influence. The sorption coefficients of lchlorinated benzenes did not decrease with increasediment/water ratios.
Di Toro et al.470 examined the desorption reaction startifrom some of the already reported results:
~a! the sorption reaction for heavy metals and orgacompounds is not completely reversible;
z
ce
of
ns--s
eeleetees
-
nt–
.’
-
-t.
s-nd-
t,ar---
x-rsg
c
~b! the sorption coefficient tends to decrease with increing particle concentration;
~c! sorption data demonstrate that reversibility varies afunction of particle concentration.
They carried out resuspension and dilution experimentdemonstrate that explanations that rely on nonseparatedticles and/or complexing ligands associated with the particshould be excluded. Then they hypothesized that the clacally conceived sorption coefficient is indeed descriptivereversible sorption at low particle concentrations and thwhen the particle concentration increases above a ceconcentration, which depends only on the type of chemand of the sorbent, the reversible sorption coefficient startdecrease. They presented a ‘‘particle interaction’’ mowhich assumes the existence of an additional desorptionaction that results from particle–particle interactions andindependent of ionic strength. This model470,496permits us tocalculateKd values consistent with the experimental daExperimental results indicate that the particle concentraeffect on reversible partitioning is not limited to just neutrorganic chemicals and organic carbon containing particbut is a ubiquitous feature of reversible component partitiing. However the authors admit that the model does not gindications on the mechanisms responsible for this destion reaction which remain still uncertain.
Mackay and Powers497 agreed with the principle that thparticle concentration may be responsible for the desorpof hydrophobic organic chemicals from particulate orgamatter. They assumed that the primary process is ‘‘losorption’’ in which an organic chemical reduces the toorganic–water interfacial area, and hence free energy,associating loosely with the natural organic surface, disping the water from the surface and from part of the chemicThis process is easily reversible as a result of particle cosions, thus the apparent sorption partition coefficientcreases as the particle concentration and collision rate ri
Lodge and Cook498 applied the solid concentration effecto obtain theKoc value for desorption of 2,3,7,8-TCDD froma contaminated lake sediment. To do this they modifiedsorption equation introducing a factor for accounting of tfraction of compound associated with dissolved and spended material. This fraction was assumed to dependlinear way on solid concentration. The model used seveexperimental data of concentration of solute, sediment, spended solid, dissolved organic carbon, as well as medsize of the material andf oc. The two Kocvalues~7.59 and7.25 cm3 g21! obtained using solids data or organic carbdata, respectively, were higher, as expected, than thoseported in the literature without taking into account the soconcentration effect. Also, the authors observed that the ctact period was likely too short for true desorption equilirium to be reached. Therefore, the water concentrations wprobably lower than at equilibrium, giving rise to a highsorption coefficient.
Schrap and Opperhuizen499 discussed the ‘‘third phasemodel,’’ the ‘‘resistant component model’’ and the ‘‘particl
J. Phys. Chem. Ref. Data, Vol. 30, No. 1, 2001

cathp
eso
stheanchveffindMtioioti-iv
n–leton
te
mucivt
i-
rbh
heooaptinoralnd0
tibate
nttinot
fuct
othle
hesionesid-s. Inareimeurs.be
elands,ad-
alo-ionsed
termi-its-
D.the
ed infu-laril
oci-im-le
anicofbyis-ntss.-
e-umEas
dif-.mnicletion
i-u-he
sed–
230230 DELLE SITE
interaction model.’’ Their conclusion, based on the applition of the three models to the experimental results, wasthere was not any evidence to support the resistant comnent model or the particle interaction model, while the prence of a third phase could be demonstrated. However, mexperimental data were needed to quantify the influencethe third phase on experimental sorption coefficients.
Another explanation of the sorption–desorption hystereand of the sorbent concentration effect is given by‘‘implicit-adsorbate’’ model.500 The model is based on thcompetitive sorption between a sorbate under study, A,an implicit sorbate, B, initially on the sorbent. During batsorption–desorption experiments B desorbs and uncosites for binding A, increasing the apparent sorption coecient. A similar interpretation was given by Hassett aAnderson,426 who suggested the possibility that natural DOcan compete with organic compounds for the same sorpsites. This interpretation however implies that the sorptmechanism is not a simple partition like liquid–liquid partioning, because this model predicts no role for competitsorption.195
The point ~iii ! suggested by Rao and Davidson87 as an-other explanation of the nonsingularity of the sorptiodesorption process was the ‘‘failure to establish compequilibrium between the soil and the solute prior to initiatiof desorption.’’156,501 Diffusion-controlled migration of thecompound to sorption sites within the soil organic matand/or clay matrix would result in a pseudoequilibrium.144,502
Karickhoff151 demonstrated that the approach to equilibriuin both sorption and desorption, involves a fast and a mslower component. The slower process may be a diffustransfer of the sorbate to sorption sites inaccessible to waKarickhoff and Morris156 studied the sorption–desorption knetics of pyrene, pentachorobenzene~PCBz!, and HCBz withsediment suspensions. The results demonstrated that pathe sorbing sites is readily accessible in minutes or hours,part requires days or months for sorption or desorption. Treason for this behavior may be a slow diffusion within torganic matrix, which is a function of the square roottime. On the basis of these assumptions, a ‘‘twcompartment’’ first-order model was proposed as anproach to describe sorption dynamics. The model disguished rapid or ‘‘labile’’ exchange from highly retarded‘‘nonlabile’’ sorption. In general, one-half or less of the totsorption is labile. For highly hydrophobic chemicals ahigh solid concentrations, the labile fraction decreases toor less in some systems. The kinetic exchange constannonlabile sorption varies inversely with the sorption equilrium constant. That is, the more highly sorbed chemicsorbed more slowly. Similar results were obtained by Coaand Elzerman,134 who conducted purge release experimeof chlorinated benzenes from sediments. However, plotthe increase of the nonextractable fraction for chlorophenas a function of the square root of time and extrapolatingt50, an intercept is evidentiated, which indicates that difsion is not the only process for the formation of nonextraable residues.111
J. Phys. Chem. Ref. Data, Vol. 30, No. 1, 2001
-ato--reof
ise
d
rs-
nn
e
e
r
,he
er.
t ofute
f---
.1for-lss
sglso--
On the basis of the concept that sorption may occur bon ‘‘labile’’ soil surface sites and on ‘‘restricted’’ soisites,478 the early concept of ‘‘hysteresis’’ was revised. Thadsorption/desorption kinetics and the reversibility of tsorption process of cyanazine and metribuzin in a suspenof soil was studied.503 A mathematical model of pesticidsorption kinetics based on Freundlich isotherm was conered in attempts to describe measured adsorption kineticthis model, the sorption kinetics of two classes of siteconsidered. The sites of the first class equilibrate at a tscale of minutes, those of the second at a time scale of hoMeasured desorption kinetics and equilibria were found toexplained well, quantitatively, by the Freundlich modwhose parameters were based on adsorption kineticsequilibria. Thus, no hysteresis was found in the isothermand desorption kinetics was found to proceed as fast assorption kinetics.
It has been shown that various one- to three-carbon hgenated alkanes and alkenes form slowly reversible fractin soils that comprise up to several percent of total sorbchemical.381 The slowly reversible fraction becomes greain magnitude as the sorption period increases. The soil fugant ED was found in agricultural topsoil up to 19 yr afterlast known application.380 This residual ED was highly resistent to both mobilization~desorption into air and water!and microbial degradation in contrast to freshly added EPulverization promoted release, both to the aqueous andgaseous phases. The results suggest that ED is entrappsoil micropores and that release into bulk solution is difsion controlled. Thus desorption is retarded by molecudiffusion of molecules from remote locations in the somatrix.382 It has been evidentiated that the residual is assated with organic matter and that this association is rate liting. The mineral fraction, however, plays an important roby shielding some of the sorbate associated with the orgmatter from equilibrium with bulk fluid. Hence, releasethe residual is promoted by breakup of soil particles andacidification of the soil suspension, which cause partial daggregation of particles by dissolution of cementing age~Fe and Al oxides! or hydrolysis of metal–humate linkage
The ‘‘intraparticle diffusion’’ model was proposed to explain slow intraparticle mass transfer.88,110,155,504It assumesthat diffusion occurs in water filled pores within homogneous particles and that diffusion is retarded by equilibrisorption within the pores. The breakthrough of TeCthrough packed columns of Borden aquifer material wstudied, and a transport model incorporating intraparticlefusion was used to simulate the experimental results113
Model predictions showed excellent agreement with colubreakthrough data, supporting the hypothesis of intrapartpore diffusion as the causative mechanism of slow sorpin this material.
McCall and Agin135 studied the desorption kinetics of pcloram as a function of incubation time in seven soils incbated for up to 300 days in the presence of picloram. Tamount of picloram readily released from the soil decreasignificantly with incubation time. A two step sorption
brnelrodtnc
osdonenarere
w-
mks
on
din
xdete
iuta
aor
tach
tu
elr
ithandowctav
lu
iq
ndq-tra-s.ionsthe
icalvedme-
ofiths
rp-ularar-
cal
hetooforp-rs-
asticsof
ns.nel,ith
onereearcu-
rp-or-o-
alsri-
andwasfor
terif-le
con-ate
ui-
231231SORPTION OF ORGANIC COMPOUNDS
desorption mechanism was used to model the observedhavior that can be described in terms of external and intesorption sites. Desorption from external sites is relativfast, taking place in less than 5 h, whereas desorption finternal sites can take up to 300 h to reach equilibrium ancharacterized by a first-order rate constant. The amounpicloram sorbed to internal sites increases with residetime in the soil.
Recently505 the mechanisms controlling desorption ratesTCE from various sorbents under unsaturated condition100% RH were investigated. The results indicated thatsorption proceeds on two distinct time scales; at TCE ccentrations near vapor saturation, the majority of TCE dorbs within 10 min while removal of the remaining fractiorequires weeks or months. The kinetic and isotherm dimplicate intragranular micropores of mineral solids assponsible for both isotherm nonlinearity and the slowlyleased fraction.
Pignatello154 reviewed a number of studies regarding slosorption or desorption kinetics of highly hydrophobic compounds as well as certain polar pesticides in soils. In soinstances it has been demonstrated or predicted that weeyears would be required to reach true equilibrium.
The nonsingularity of the sorption–desorption relatiforced to revise the earlier modeling approach155,207,506–508todescribe the movement of chemicals through porous meThose models assumed instantaneous sorption and a land single-valued sorption–desorption relation~‘‘one-site’’models!, but showed considerable deviations from the eperimental data especially at high flow velocities. Suchviations were due to the fact that those models predicsymmetrical breakthrough curves~BTC!, while experimentalresults gave asymmetrical curves, as result of nonequilibrsorption–desorption of chemicals in soils under steady-sflow conditions.
Thus, the two-stage approach to sorption equilibrium wtaken into consideration in modeling pollutant transpthrough porous media. It was assumed a rapid initial ratesorption or desorption, where roughly 30%–50% of the tosorption occurs within minutes to hours, followed by a muslower rate of sorption or desorption~days ormonths!.134–136,151,156
The miscible displacement techniques were used to sthe movement of picloram through soil.485 The equilibriumsorption–desorption isotherms were not single-valued rtions. Picloram mobility was reduced when the average powater velocity was decreased. Predictions were made wsimulation model using two kinetic rate equations andequilibrium Freundlich equation. The two kinetic models athe equilibrium model gave satisfactory results only at lpore water velocities provided the nonsingle valued charaof the sorption–desorption relation was included in the cculations, but were inadequate to predict the picloram moment at high pore water velocities.
In a following paper, the authors148 proposed a new modefor the movement of chemicals through a sorbing poromedium with lateral and intra-aggregates diffusion. The l
e-alymisofe
fate--
s-
ta--
eto
ia.ear
--d
mte
stofl
dy
a-e-a
n
erl-e-
s-
uid phase in the porous medium was divided into mobile aimmobile regions. Diffusional transfer between the two liuid regions was assumed to be proportional to the concention difference between the mobile and immobile liquidSorption processes in both the dynamic and stagnant regof the medium were assumed to be instantaneous andsorption isotherm was assumed to be linear. The analytmodel was able to describe the extensive tailing obserduring flow through an unsaturated, aggregate sorbingdium and to explain the often observed early breakthroughchemicals in the effluent. The model was then tested w2,4,5-T.509 On the same basis the ‘‘two region’’ model wadeveloped by Coats and Smith.510 Miller and Weber91,511,512
proposed the ‘‘dual resistance’’ model which describes sotion as a series of mass transfer steps involving molecdiffusion through a boundary layer surrounding a soil pticle followed by diffusion within the particle itself.
In another series of studies, instead of physidiffusion148,510 or chemical nonequilibrium,475,485 diffusion-controlled migration of pesticide to sorption sites within tsoil organic matter and/or clay matrix was taken inconsideration.513 In these models sorption on one groupsites was assumed to be instantaneous, while the rate of stion on the second group of sites followed nonlinear reveible kinetics ~‘‘bicontinuum’’ or ‘‘two-site’’models!.149,502,514
Ma and Selim515 presented a second-order model that wcapable of describing both adsorption and desorption kineof atrazine in soils. The model assumed heterogeneityadsorption sites and dominant nonequilibrium conditioAlso, Xue and Selim161 studied the adsorption–desorptiobehavior of alachlor through a multireaction kinetic modassuming that this compound reacts at different rates wdifferent sites of a soil matrix. Adsorption and desorptiisotherms showed extensive hysteretic behavior and wbest described by a model version incorporating nonlinequilibrium, a kinetic reversible mechanism, and a consetive irreversible mechanism.
Examination of the literature data on nonequilibrium sotion of a broad spectrum of organic solutes by natural sbents allowed to analyze values of equilibrium sorption cefficient (Kd) and sorption rate constant~k! with the linearfree energy relationship approach.516 An inverse linear rela-tionship was found between logk and logKd . After examin-ing the intercept value for hydrophobic organic chemicand that for polar/ionizable organic chemicals, the expemental conditions under which the data were collected,considering the nature of the sorbents and the sorbates, itpostulated that the following processes were responsiblethe observed sorption nonequilibrium: intraorganic matdiffusion for hydrophobic chemicals; intraorganic matter dfusion and chemical nonequilibrium for polar/ionizabchemicals. A regression equation relatingk and Kd may beused to estimate approximate values of the sorption ratestant for organic solutes. This provides a means to evalunonequilibrium potential and to attempt to predict noneqlibrium behavior.
J. Phys. Chem. Ref. Data, Vol. 30, No. 1, 2001

,rsp
a-vetainstame.esicut
av
c-atrl
o
iponoril
ion
enin-ndan
ehin
ste
uoai
ntioree
a
ltotkenede the
uniteenfterems
ofo-olute
aneg
lla-ingffi-edthethe
ing-hete
rbentnggh
y-ses.nsnicof
nol
ea-
oil
-
teralndaxi-
232232 DELLE SITE
Brannonet al.218 measured the partitioning of BCB 52PCB 151, and fluoranthene between sediments and intetial water. The compounds were incubated and sampledriodically over a 6 month period. Interstitial water was anlyzed for free compound and compound bound to dissolorganic matter. Results demonstrated that as time of conincreased, the value ofKoc increased, reflecting a decreasethe truly dissolved contaminant concentration in the intertial water. Decreases in concentrations of free contaminare consistent with movement of nonpolar organic contanants into interparticle spaces of organic matter over tim
A long series of researches were carried out to succfully predict by the bicontinuum model the BTCs of organchemicals and for investigating the transport of these solin soils and aquifers.166,517–524Experiments of elution of diu-ron, atrazine, and PAHs from soil columns452,525with aque-ous solutions containing various fractions of methanol hdemonstrated that the degree of BTC asymmetry~i.e., non-equilibrium sorption! decreases with increasing volume fration ( f c) of cosolvent and that the nonequilibrium mechnism involves organic matter. Also the desorption raconstant (k2) for the same compounds increases log-lineawith increasing volume fraction of organic cosolvent (f c).
526
This relationship was expected, based on the existencelog–log inverse relationship betweenk2 and the equilibriumsorption constant (Kd), and a log-linear inverse relationshbetweenKd and f c . It is suggested that decreased polaritythe mixed solvent, caused by the addition of a cosolveappears to influence the conformation of the polymericganic matter and, hence, the rate of sorbate diffusion. Simresults were obtained with chlorophenols regardless ofization status.460
A bicontinuum model was applied to describe experimtally determined breakthrough curves for atrazine, simazand cyanazine.527 The model considers sorption in two domains and includes a description of first-order degradatio
In summary, two main anomalous effects have beentected in sorption and desorption processes: solids effectnonsingularity in sorption–desorption. Some explanatiowere proposed for both effects. In particular, the solids effmay depend on:~i! dispersion of soil aggregates in batctests which is greater at low particle concentration, socreasing the number of soil sites available for sorption;~ii !presence of DOM released by the sorbent, which increawith the concentration of the sorbent itself and associawith the compound in water; and~iii ! particle interaction,which increases with the concentration of the sorbent inding a partial release of the compound. However, at the mment, it does not seem that a single theory can explaincases of solids effect. On the contrary, the nonsingularitysorption–desorption found a satisfactory explanation whetwo-step sorption process was evidentiated. A rapid sorpfollowed by a slower diffusion into the sorbent matrix wemodeled to reproduce successfully the breakthrough curva sorbate in a sorbent matrix.
J. Phys. Chem. Ref. Data, Vol. 30, No. 1, 2001
ti-e-
dct
i-nti-
s-
es
e
-ey
f a
ft,-ar-
-e,
.e-nds
ct
-
ess
c--llnan
of
11. Experimental Methods for theDetermination of Sorption Coefficients
11.1. Batch Equilibration „BE…
A known weight of sorbent~soil or sediment! is placed ina vial with a measured volume of solution containingknown concentration of the solute in water~distilled or con-taining known concentration of an electrolyte, NaCl, CaC2,etc., to simulate the ionic strength of soil solution andimprove phase separation!. A minimum of headspace is lefto avoid losses of solute in vapor phase. The vial is shafor a time suitable to reach equilibrium, then is centrifugand both phases are separated and analyzed to determinconcentration of the solute. The mass of sorbate permass of sorbent may be obtained also by difference betwthe initial concentration of solute and the concentration aequilibrium has been reached. The first procedure semore reliable because it takes into account the possibilityloss of solute by volatilization, degradation or by other prcesses causing disappearence or nonrecovery of the sfrom the measurement system.528 No differences were foundbetween the two procedures with napropamide and lindsorption by soil.529 The Kd or K f value are calculated usinEqs. ~3! and ~4!. Often labeled~14C or 3H! compounds areused and their concentration is measured by liquid scintition counting. However, much care is necessary in usradio-labeled compounds, especially when sorption coecients are extremely high. Their purity should be checkaccurately before use to avoid errors in measurement ofaqueous concentration after sorption. This can be termed‘‘standard batch’’ method.
Several sources of error may be introduced in determinsorption by this method:530 losses of chemicals by volatilization and biological or chemical degradation; length of texperiment non sufficient to reach equilibrium; no compleseparation between sorbent and water phase; water/soratio. To avoid bias in experiments requiring long contactitimes, it is of paramount importance to avoid losses throuvolatilization or transformations.88 Autoclaving has beenfound effective in inhibiting biotransformation, and emploing fire-sealed glass ampules precluded volatilization losBoyd and King531 recommended using anaerobic conditioduring measurement of sorption coefficients of labile orgacompounds to prohibit degradative losses. Autoclavingsoil was used to avoid the microbial degradation of pheduring the sorption experiments.489,532 However, the use ofautoclaved soil apparently resulted in a less accurate msurement of adsorption,531 while the use of sodium azidetreatment approximates sterilization without altering the sphysical and chemical properties.58,113,289
Bowman and Sans486 observed that factors involved in selecting experimental adsorbent concentrations include:~i!relative partitioning of compound between sorbent and waphases,~ii ! detection limits and working range of analyticmethods, and~iii ! concentrations at which the compound aadsorbent occur in natural aqueous environments. For m

tttivl
inn-
gth
th
dee
tiidbTesi
If
on
olturpit
lid
ifeiqlauidtcti
ibua
migit
iothiound-eb
ilit
s,x-en-er
achna-
ofofso-mlytionbil-onbe
chs.
assn
gewn
re:
so-
ndedese ischa
or aancu-
r:o-se--theter-
rthe
ereenper-sys-su-is
e in-blyilu-
ed
233233SORPTION OF ORGANIC COMPOUNDS
mum precision in adsorption experiments, it is preferableadjust the adsorbent concentration so that the percenmoved is in the 20%–80% range. Outside this range, relameasurement errors can become a dominant factor. AGreen and Yamane533 reported that the precision expectedsolute adsorption measurement~based on change of concetration in a solution equilibrated with an adsorbent! dependsupon the magnitude of the solution concentration chanImprovements can sometimes be achieved by alteringsoil:solution ratio to obtain larger concentration changes.
An accurate evaluation of the measurement error instandard batch method has been reported.534 The ratio masssorbent/volume solution may vary in batch experiments,pending upon sorption coefficient of the chemical undstudy. By examining the literature reports86,121,535this ratioranges between 1024 and 1 g cm23 with all the possibleintermediate values between these two extremes. If sorpis derived from the difference in the concentration in liquphase, the experimental error in the sorption coefficientscomes very large when this coefficient tends to zero.minimize experimental errors, the solid/liquid ratio of thsoil suspension should always be taken as large as pos~in practice 1 g cm23!, unless this results in an equilibriumconcentration that is too low to be measured accurately.solid/liquid ratio of about 0.2 g cm23 is used, the error in thesorption coefficient will usually be unacceptable for sorpticoefficients less than about 1 cm3 g21. If the expected valueof the sorption coefficient is below 0.3 cm3 g21, it will usu-ally be necessary to remove the liquid phase from the sphase as far as possible and to extract the remaining mixof solid and liquid phase in order to obtain an accurate sotion coefficient. However, in selecting the solid/liquid ratiois necessary to take account of the possibility of a soeffect, especially when conditions already described~highratio! ~Sec. 8! are verified.
Ball and Roberts88 measured by the batch technique theKd
values for TCE and 1,2,4,5-TeCBz sorption on sandy aqumaterial. They developed an accurate data analysis technto account for partitioning to sample headspace and gsurfaces of the ampules, monitored through the routineof blank samples containing solute and water but no solExperimental errors were determined for all important bameasurements and these propagated through the calculato provide estimates of error on reported apparent distrtion coefficients. In their study, relative errors in the mesurement ofKd
app were generally between 0.02 and 0.20 c3
g21 and, for most cases, were sufficiently low as to be insnificant compared to sorption variability due to heterogeneamong samples.
With the standard batch method the upper limit of sorptdata obtainable is dictated by affinity of the sorbent forcompound, compound water solubility, and sorbent/solutratio. When the sorbent has a great affinity for the compo~.95% adsorption! it becomes difficult to generate an asorption isotherm, since even the maximum solution conctration would be greatly depleted. Consequently, it wouldimpossible to obtain adsorption data at or near the solub
ore-e
so
e.e
e
-r
on
e-o
ble
a
idre-
s
ruessses.hons-
-
-y
nend
n-ey
limit of the compound using this technique. ThuBowman536 proposed another method which allows us to etend the isotherm to values of equilibrium aqueous conctrations closer to the water solubility of the compound undexamination. For obtaining the sorption isotherm, after eequilibration and centrifugation a certain volume of supertant is removed and substituted with an equal volumepreselected compound solution. The initial concentrationsthe compound and the volume and concentrations of thelutions added in each step are selected to produce unifordistributed data points. Usually, the compound concentraselected for the incremental additions is close to the soluity limit, but sometimes it can be established dependingthe affinity of the compound for the sorbent. This cantermed the ‘‘repeated addition’’ method.
Ou et al.537 proposed a continuous batch method whieliminated centrifugation with all the associated problemThe solid sorbent and the solution were stirred in a glampoule having a glass fiber filter on the bottom. At knowtime intervals the solution was circulated, using a syrinpump, through a closed system which allowed taking knoaliquots of solution for analysis.
Desorption may be carried out by the following procedu
~a! the sorbent is at first equilibrated with the aqueouslution;
~b! the compound-spiked sorbent is separated, resuspein pure water, equilibrated under swirling; the phasare separated again for the analysis. This procedurused to obtain one value of the desorption for eapoint of the sorption isotherm and allows to obtain‘‘single-point’’ desorption isotherm.
~c! the compound-spiked sorbent coming from~b! can beseparated again and resuspended in pure water ffurther determination of desorption. This procedure cbe repeated many times to get a series of ‘‘consetive’’ desorption steps.
However, method~c! is affected by two sources of erro~i! it is difficult to decant all the centrifuged supernatant slution without losing some sorbent, thereby affecting subquent desorption steps;~ii ! an indeterminate volume of solution is left behind, associated with the sorbent whensupernatant is decanted. This volume could be easily demined by weighing. However, Bowman536 proposed anotheprocedure to obtain the consecutive-desorption branch ofisotherm, similar to that used for the sorption isotherm~seeabove!, by adding a water increment rather than anothcompound increment. When the sorption isotherm has bcompleted, the system is centrifuged, a volume of the sunatant is removed, and a volume of water is added; thetem is equilibrated, centrifuged, and again a volume ofpernatant is removed for a new addition of water. Thprocedure can be repeated many times, selecting volumcrements to obtain successive desorption points suitaspaced. This procedure can be termed the ‘‘repeated dtion’’ method.
Finally, taking into consideration what has been expos
J. Phys. Chem. Ref. Data, Vol. 30, No. 1, 2001
twilitth
hi
tith
0;
:–4
a
ecles
--
%c
thing
odlid
btio--
sa
bob
rhei-
eaan
heeneense
e
r toe
tingof
f
stemm-arepofna-ch
ol-
of
ingter/
he
undwthe
of
,ts at-n
234234 DELLE SITE
in this section and in Sec. 8, it can be evidentiated thatmain problems may affect the BE procedure: the possibof measurement error and solids effect. Consequently,following suggestions may be given for a correct use of tprocedure:
~i! To reduce experimental errors sorbent/solution rashould be chosen so that the percent removed is in20%–80%486 range or in the 15%–70%563 range.However, this ratio depends on the value ofKd .WhenKd~cm3 g21! takes the values: 0.1; 1.0; 10; 101000; 10,000; 100,000, the corresponding rangessorbent concentration~g/dm3! have to be in the order2500–40 000; 250–4000; 25–400; 2.5–40; 0.250.025–0.4; 0.0025–0.04, to stay in the range 20%80% sorbate removed;
~ii ! However, these ranges of sorbent concentration mgive solids effect. Schrapet al.495 found with PCBsand chlorobenzenes that, to minimize the solids effdue to the potential influence of nonsettling particin BE, sediment concentrations should be<1 g/dm3.These values of concentration correspond toKd
>250 cm3 g21 for 20% sorbate removed. For compounds having smallerKds, larger sorbent concentrations are necessary to remain into the range 2080% removed; therefore, a significant solids effemay be present. However, it has been specifiedthis effect is decreasing in intensity by decreassorption of the substance examined.86
Therefore, the two problems connected with this methnecessity to minimize both, experimental errors and soeffect due to the presence of nonsettling particles, couldapproximately solved by selecting the sorbent concentraon the basis of the expectedKd as calculated above. However, whenKd is very low, the use of BE becomes problematic due to the very large concentrations of sorbent necesto stay in the range; therefore, at these values ofKd , anothermethod could be used~Secs. 11.2. and 11.4.!.
Thus, taking into consideration these points, it canworthwhile to list the main steps which are necessary totain a reliable value ofKd by BE:
~i! Define a rough value ofKd at ambient temperature fothe compound under investigation, through tknowledge ofKd for the same compound or for simlar compounds with other sorbing systems;
~ii ! Carry out a kinetic investigation to establish the timnecessary to reach equilibrium. To do this, selectsaid the sorbent concentration on the basis of theproximate value ofKd , and the aqueous concentratioof the compound below its water solubility; shake tvial at time intervals, and measure the water conctration of the solute up to obtaining a constant valu
~iii ! When these parameters, equilibration time, sorband solute concentration, and temperature are cho
J. Phys. Chem. Ref. Data, Vol. 30, No. 1, 2001
oye
s
oe
of
;–
y
t
–tat
:sen
ry
e-
sp-
-;tn,
a batch experiment for the determination ofKd can becarried out following the procedure outlined at thbeginning of this section;
~iv! In the absence of specific studies it would be bettecontrol if there is any evidence of solids effect for thsystem under study. This can be made by repeatheKd measurement at three or four concentrationssorbent.
11.2. Equilibrium Head Space „HS…
This method,364,371,372was used for the determination osorption coefficients@Eq. ~15!# for vapors on oven-dry ormoist sorbents in the absence of an aqueous phase. A sywith known gas volume and mass of sorbent may be copared to a control, which contains no sorbent. The vialssealed with Teflon-lined rubber disks and aluminum crimcaps. After equilibration at known temperature, a volumethe headspace vapor is withdrawn from the vials and alyzed. If the same mass of vapor is introduced into easystem, the mass balance equation must be equal
Cg1Vg15Cg2Vg21X, ~38!
whereCg1 is the vapor concentration for a control vial,Cg2 isthe vapor concentration at equilibrium for a sample vial,Vg1
is the volume of the control vial, andVg2 is the available gasvolume ~total volume less than the volume occupied by sids and moisture! of a sample vial andX is the mass of vaporthat is adsorbed. If linear sorption isotherm is assumed
X/M5KsgCg2, ~39!
whereKsg is the sorbent–vapor sorption coefficient andM isthe mass of sorbent. Combining Eq.~38! and ~39! results in
~Cg1Cg2/Vg1Vg2!215Ksg~M /Vg2!.
Ksg may be determined by calculating the slope of a plot@(Cg1Cg2/Vg1Vg2)21# vs M /Vg2.
Farrell and Reinhard98 observed thatKsg for moist sorbentincorporates all sorption mechanisms, including partitioninto the surface-bound water and adsorption at the wavapor interface—neither of which are incorporated byKd .To compare adsorption from solution to partitioning from tvapor phase,Ksg can be converted into an equivalentKd bysubtracting the sorbate partitioned into the surface-bowater. If partitioning into the water layer obeys Henry’s laand adsorption at the water/vapor interface is ignored,relation betweenKd andKsg is
Kd5KsgH2W,
whereW is the water loading on the solid, i.e., the volumewater adsorbed per mass of dry solid.
Grathwohl226 studied the sorption of TCM, 1,1,1-TCATCE, and PCE in gas phase on several natural sorbenrelative humidities~;98%! generally achieved at field conditions, when Henry’s law is valid. He found that sorptioisotherms follow the Freundlich equation

viehpo
s
esa
be
dt
o
-t-
acodeg
ys
orfo
uii
ns
bht
les,hs
re
y
g
mi-theasichm-ancen, aship
t,
thetionf
a
or-thelepe
adesx-olid
es
tionuntichtiveithf
entch-the
235235SORPTION OF ORGANIC COMPOUNDS
q5Ksg8 Cg1/n ,
logq51/n logCg1 logKsg8 ,
whereq is the sorbed concentration~mg kg21! andCg is thevapor phase concentration~mg dm23!, andKsg8 represents theFreundlich sorption coefficientK f in the system soil–gasphase. TheK f values in aqueous systems (K f5q/Cw
1/n) wereobtained by using the Henry’s law constant (H5Cg /Cw)
K f5Ksg8 H1/n.
For experiments in sorbent-water systems, on top of aa free space is left in which a VOC is partitioned betwewater and vapor phase. Thus, two equilibria are establisin the vial for the solute: sorbent–water and water–vaphase. This second equilibrium follows the Henry’s law.
A technique, named equilibrium partitioning in closed sytems~EPICS!193 was proposed for determiningH of volatileorganic compounds in water when the dimensionlessH isless than 3. In a first step, the activity coefficient~g! of thechemical is determined by comparing two identical bottlcontaining the same compound mass and the same liquidgas volumes, where the volatile solute in the first bottlehaves ideally~e.g., in distilled water! while the volatile sol-ute in the second bottle behaves nonideally~e.g., in an elec-trolyte!. From the equilibrium distribution of the compounin the gaseous and liquid phases of the two bottles andvalue of the Henry’s law constant, the activity coefficientthe chemical can be obtained using the relationship
H5Cg /gC1 , ~40!
whereC1 is the liquid concentration,Cg is the gaseous concentration, andg is the aqueous activity coefficient correcing for nonideal behavior. Wheng and H are known, theequilibrium gas concentration of a volatile chemical inclosed system serves as a direct measure of its liquidcentration and the EPICS method can logically be extento the examination of sorption equilibria. Again, partitioninequilibria can be determined by comparing two similar stems containing the same liquid volume (V1) and gas vol-ume (Vg), but in this case one system would contain a sbent, the other none. The final equation, obtainedequilibrium conditions and derived to calculateKd is the fol-lowing
~Cg1/Cg2!5~C11/C12!5Kd@M /~V11HgVg!#11,~41!
whereCg1 is the gas concentration of the chemical in eqlibrium with C11, the concentration in the aqueous phasethe system without sorbent, andCg2 is the gas concentratioin equilibrium with C12, the concentration in the aqueouphase in the system with sorbent, respectively;M is the massof sorbent employed.
The authors193 measured theH values at 25 °C for TCE~0.397! and for toluene~0.261!. Both values are within therange in which the EPICS technique is considered relia~i.e., H,3!. Activity coefficients were measured for botcompounds in NaCl solutions of variable ionic strength. Bo
alnedr
-
,nd-
hef
n-d
-
-r
-n
le
h
compounds showed behavior typical of neutral molecui.e., an increased salting out with increased ionic strengt
logg5km,
where k is the ‘‘salting coefficient’’ andm is the ionicstrength of the solution~mol dm23!. The salting coefficients~k! calculated for TCE and toluene in NaCl electrolyte we0.194 and 0.208, respectively.
From Eq. ~41!, Kd values for VOC can be obtained bplotting the equilibrium ratioC11/C12 as a function ofM /(V11VgHg). This should result in a straight line havin1 as the intercept.
This method has been used also by Petersonet al.364 intheir study on TCE vapor phase sorption by a porous alunum oxide surface coated with humic acid. To evaluatesorption process, a system with known liquid volume, gvolume, and mass of sorbent is compared to a control, whcontains no sorbent, if the total mass of the volatile copound in each system is the same, then the mass balequations for each system may be equated. If, in additiolinear adsorption isotherm is used to describe the relationbetween the sorbed and liquid concentrations, then
X/M5KdC1 , ~42!
whereX is the mass sorbed,M is the mass of solid sorbenand Kd is the solid–liquid sorption coefficient~cm3 g21!.Thus, a combination of the mass balance equations forcontrol and the system containing sorbent, and substituof Eqs.~40! and~42! can allow us to obtain a general form oEq. ~41!
~Cg1/Cg2!@~Vg1Hg1Vl1!/~Vg2Hg1Vl2!#
5Kd@M /~Vl21HgVg2!#11, ~43!
whereVl1 and Vg1 being the volume of liquid and gas instandard control bottle without sorbent~mL!, V12 and Vg2
being the liquid and gas volumes in bottles containing sbent, Cg1 being the headspace vapor concentration incontrol, andCg2 being the vapor concentration in the bottwith sorbent.Kd can be determined by calculating the sloof a plot of the left-hand side of Eq.~43! versusM /(V12
1HgVg2).Since the gas phase is analyzed, the technique ev
problems such as losses through volatilization, difficult etractions, the use of carrier solvents, and the incomplete sseparation~and therefore possible solid effects! which oftenburden other techniques.193 Other advantages are that it donot require analysis of the aqueous phase, and thatKd isdetermined by a concentration ratio, thus, when the sorpis low, it is not necessary to determine the small amosorbed by the difference between two large values, whmay introduce large errors. This technique is most sensifor solutes with low Henry’s constants and sorbents whigh sorption capacity (Kd). Sensitivity for measurement ocompounds with lowKd values~approximately 0.5 cm3 g21
and less! may be increased by increasing the mass of sorbemployed in analyses. A major advantage of the EPICS tenique is that knowledge of the total solute mass added to
J. Phys. Chem. Ref. Data, Vol. 30, No. 1, 2001

r-
owthnd
eb
e
k-–
etn
raes
r
d
-acheteac
te
e
eeio
ch-ringu-on
nedthe
ning
e-, in
fac-er
.
ive
ry to
eis
onue
oilsntals.
ris-ghtesorp-esenic
us
236236 DELLE SITE
system is not necessary for the determination ofH, g, and ofKd . However,H and g must first be independently detemined.
11.3. Leaching Equilibration „LE…
The solute dissolved in water is pumped at a given flrate via the inlet port at the base of a column containingsorbent.132,428The effluent samples are collected in vials aanalyzed. When sorption equilibrium is reached~equal inletand outlet concentrations! the inlet and outlet stopcocks arclosed and the pump is shut off. The same column mayeventually used for desorption experiments. TheKd value isgiven by
Kd5@~mi2m0!/ms#/C,
wheremi is the total mass~g! of the compound entering thcolumn; m0 is the total mass~g! of the compound leavingcolumn;ms is the mass~g! of sorbent in column; andC is theequilibrium breakthrough concentration of the compound~gcm23!. The symmetry of the BTCs indicates uniform pacing of the column and equilibrium of the sorptiondesorption process.
For desorption experiments, the inlet solution is changto either water or another water solution and pumped agiven flow rate through the column material. The effluesamples are collected as in sorption and analyzed.
Another way to use this technique is that538 which in-volves equilibrating a known weight of soil~W, kg! in aweighable leaching tube with a solution of known concenttion ~C, mmoles dm23! until the effluent has attained thsame concentration as the input solution. The volume oflution retained in the soil after equilibration~V, dm3! is thendetermined gravimetrically; subsequently, the adsorbatemaining ~adsorbed plus solution phase! is displaced with asuitable displacing solution or solvent~acetone for diuron,methanol for atrazine! into a known volume and measurequantitatively ~D, mmoles!. The quantity adsorbed~A,mmoles kg21! is calculated
A5~D2VC!/W.
With another procedure268 a small volume of dilute ethanol solution containing the compound is added to the surfof the soil column. After the solution has entered into tsurface of the soil, the column is slowly leached with waat the desired flow rate. The effluents are collected in frtions, which are analyzed. Distribution coefficients (Kd) canbe calculated using the expression first described by Keand Boyd539
Kd5@~Vp /Vv!21#Vv /W,
whereVp is the volume of effluent to leach one-half of thsolute through the column,Vv is the void volume in thecolumn, andW is the weight of adsorbent in column. Thresults obtained with this method gave results comparablthose obtained by the standard batch equilibratprocedure.540
J. Phys. Chem. Ref. Data, Vol. 30, No. 1, 2001
e
e
dat
-
o-
e-
e
r-
lle
ton
11.4. Miscible Displacement „MD…
The experimental technique is similar to that of the leaing equilibration.364,517,521,541It consists of displacing, undesaturated, steady water flow conditions, a solution containthe solute through a column packed with the soil. The inflent solution is injected continuously until the concentratiof the solute in the effluent~C! equals that in influent (C0),i.e., C/C051. The effluent may be collected with a fractiocollector or connected to a flow-through detector. Tritiatwater is employed as a nonsorbing tracer to characterizehydrodynamic properties of the column.
The distribution coefficient (Kd) can be calculated withthe following expression:542
Rt511~r/u!Kd , ~44!
whereRt is the retardation factor for water solutions,r is thebulk density~g cm23!, andu is the porosity or the volumetricsoil–water content~cm3 cm23!.
Rt can be estimated452 with a method which is based othe conservation of mass principle and involves computthe area above the breakthrough curve. It is given by
Rt5E0
pmax~12C* !dp,
whereC* is C/C0 and p is the dimensionless time in porvolume. The values ofRt determined in this manner are independent of the existence and degree of nonequilibriumcontrast to the batch equilibration technique.519
Johnson and Farmer529 reported that Kd values fornapropamide and lindane estimated using the retardationtor from the column experiments were consistently largthan those determined by the batch equilibration method
Seipet al.344 determined the concentration profiles~break-through curves,C/C0 as a function of pore volumes! of sol-utes after percolation through different soils. The relatretention with respect to tritiated water~Rf values! was cal-culated when a fairly stable concentration (Cs) level of com-pound is reached. The number of pore volumes necessareachCs/2 is denotedRx for compoundX andRw for tritiatedwater. Rf is equal toRx /Rw and is used in Eq.~44! at theplace ofRt .
Brousseauet al.517 in comparing gas purge with miscibldisplacement technique, observed that the viability of MDa function of the sorptivity of the solute/sorbent combinatiand of the texture/structure of the sorbent. This techniqseems ideal for investigating the transport of solutes in sand aquifer materials and, on the basis of some experimeresults, it seems especially useful for low-sorptivity systemIts efficacy, however, is greatly reduced for systems comping highly sorptive chemicals or sorbents containing hilevels of clay and/or OM. As the sorptivity of the soluincreases, time constraints and other problems, such astion to the apparatus, become of increasing concern. Thproblems can be overcome with the use of a miscible orgacosolvent, which results in reduced values ofKd and in-creased value ofk2 . Values of these constants in aqueo
rom
mal,o-
aTy
ffi-bsa
-
r-
methsd
lainb
asl.aldorerg
mente
thd
fge
ro-on-
er,
orp-ng
toder
tant,ithver-
nd-st
ns;
om-eseasesareina-
dethe
i-
ng
th-a
m
237237SORPTION OF ORGANIC COMPOUNDS
systems can be estimated successfully by extrapolation fcolumn experiments performed with mixed-solvent syste
11.5. Diffusion „DF…
This method466 is based on the relationship, derived frothe conventional reversible sorption theory, between theparent diffusion coefficient of total chemicaDs* (cm2 day21! and the adsorption–desorption partition cefficient,Kd~dm3 kg21!
Ds* 5Ds/~11mKd!/f,
whereDs is the aqueous diffusion coefficient~cm2 day21! inthe interstitial water for nonadsorbing chemicals,m is thesorbent concentrationm5rs(12f), andf is the porosity.For this equation to apply, adsorption and desorptionassumed to be described by a linear reversible isotherm.value of Ds* is related to the distance, l, from the initiallcontaminated sorbent layer and to the time,t, elapsed toreach this distance
l;A2Ds* t.
The experimental procedure is not without practical diculties, because this process is very slow. Thus, it cancalculated that it would be necessary to measure changeconcentration in distances on the order of 0.1 mm and to wfor time periods on the order of 102 d. The detailed description of this procedure is available in the original paper.466
11.6. Gas Purge „GP…
This technique can provide equilibrium and kinetic infomation from the same experiment. Karickhoff156 applied GPto study the sorption dynamics of hydrophobic organic copounds, which can be described by a two-compartmmodel. GP allowed us to obtain the kinetic constants forshort-term sorption and for the long-term desorptive releaThe experimental apparatus was conceived to follow thesorption kinetics and consists of a purge cell, having a gfrit on the bottom, in which a sediment suspension containg the test chemical is placed. Desorption is inducedcontinuous stripping the chemical from the aqueous phusing a purge gas~air! entering from the bottom of the celHead space is kept at a minimum. The sparged chemiccollected on a Tenax trap, which is changed and analyzesampling intervals chosen to provide the desired tempresolution in the chemical release profile. Chemical conctration in the water phase is determined just prior to puand the total chemical~sorbed plus solution phases! is deter-mined at the termination of each experiment. Similar systewere used to study the desorption kinetics of naphthalfrom soil132 and of chlorinated hydrocarbons from freshwasediments.136 Nitrogen was used as purge gas. Oliver136 useda purging apparatus in which a teflon-coated bar stirredsolution and a glass tubing entering from the top was useintroduce purging gas at a certain depth.
Hassett and Milicic416 used GP for the determination oequilibrium and rate constants for binding of a PCB con
ms.
p-
rehe
eofit
-ntee.e-ss-ye,
isataln-e
se
r
eto
-
ner by dissolved humic substances. The binding of a hydphobic compound at equilibrium can be described by a cstant
Kd5Cb /Caq5k21/k12, ~45!
whereCb is the concentration of bound compound in watCaq is the concentration of free compound,k21 and k12 arethe first order rate constants for the reverse and direct stion equilibrium reactions, respectively. In water containino binding agent, the loss of compound from solution duevolatilization can be described as an irreversible first-orreaction with a rate constant equal tok23. The value ofk23
depends on temperature, gas flow rate, Henry’s law consliquid volume, and, if the gas phase does not equilibrate wthe liquid phase, the gas–water interfacial area and the oall liquid-phase mass-transfer coefficient.543 In the study un-der examination416 these parameters were held constant athe value of k23 was determined by experiment in pHbuffered distilled water. The total concentration of the tecompound in solution (CT) at any time is
CT5Cb1Caq. ~46!
The rate expressions forCb , Caq, CT , andCg are
dCb /dt5k21Caq2k12Cb
dCaq/dt5k12Cb2~k211k23!Caq
dCT /dt52k23Caq
dCg /dt5k23Caq. ~47!
Implicit in this treatment are the following assumptions:~i!the binding reaction is a set of opposing first-order reactio~ii ! the bound test compound is not volatile; and~iii ! dis-solved organic matter does not affect the magnitude ofk23.This assumption is necessary only if the dissolved test cpound does not equilibrate with the gas phase. Given thassumptions, the system can be solved for three special cas well as the general case. Only the first two casesreported here, because they refer especially to the determtion of the sorption constants, while the last two provivalues for the forward and reverse rate constants forbinding reaction.
1st case:‘‘Equilibrium Binding’’ solution.If the rate of gas purging is sufficiently slow so that equ
librium is mantained betweenCb and Caq, then Eq.~45! isapplicable at any point in a purging experiment. CombiniEq. ~45! with Eq. ~46! and Eq.~47! yields an equation whichin integrated form is
ln CT52k23t/~11Kd!1 ln CT0,
where t is time andCT0 is the initial concentration ofCT .
Sincek23 can be determined by experiment using water wiout binding agent,Kd can be determined from the slope ofplot of lnCT vs t. No rate information is provided by thisapproach. Note that a plot of lnCT vs t should remain linearduring the entire course of the experiment if the equilibriubinding solution is valid.
J. Phys. Chem. Ref. Data, Vol. 30, No. 1, 2001
-soq
heer
to
-s
i-
o-c-
g
idori-
shiith
dei
astru
ri-
t inper-histhe
l themedses
o-i-6
nto
wis-is-so-
s a
ofsoil
u-edat ap
rebyterion.ent
238238 DELLE SITE
2nd case:‘‘Initial Slope’’ solution.If the initial rate of volatilization of the dissolved com
pound from solution is much greater than the rate of disciation of the bound compound into true solution, then E~40! can be written as
CT5Caq1Cb0 ~48!
for a period of time after the start of the experiment. If tsystem is allowed to equilibrate before the start of an expment, then the following initial (t50) conditions exist
CT05Caq
0 1Cb0, ~49!
Kb5Cb0/Caq
0 . ~50!
Solving Eq. ~47! and Eqs.~48!–~50! simultaneously yieldsan expression which, upon integration, becomes
CT5@CT0/~11Kd!#e
2k23t1@KdCT0/~11Kd!#.
Thus,Kd can be obtained from the ratio of the interceptthe slope of a plot ofCT vs e2k23t. Again, no kinetic infor-mation is obtained. Note that in this case, a plot ofCT vse2k23t will be linear only during the initial phase of an experiment. As release of the bound compound becomesnificant, the line will begin to curve.
Finally, it should be noted thatKd is a function of theconcentration of the binding agent. If this concentrationexpressed in terms of~DOC!, then the usual partition coefficient is obtained
Kdoc5Cdoc/Caq5Kd /~DOC!,
whereCdoc is the amount of test compound bound per unitDOC ~e.g., g g21 DOC! and ~DOC! is the DOC concentration. If Cdoc, Caq, and~DOC! are expressed as weight frations, thenKdoc is unitless.
Jota and Hassett393 used the previous equilibrium bindinapproach to obtainKdoc values for 2,28,5,58-TeCB bindingwith humic acids extracted from soil and Aldrich humic ac
Yin and Hassett417 determined the association constantmirex with Aldrich humic acid by GP technique. The expemental apparatus was a 20 dm3 glass carboy with a 13 cm~o.d.! metal screw cap, containing 19 dm3 of water samples.The purging tubing was 3.3 mm o.d. stainless steel with0.7 mm holes at a depth of 28 cm. Nitrogen bubbling at tdepth allowed sufficient time to approach equilibrium wthe solute in the water phase. At this condition
Cg5HCaq, ~51!
whereCg andCaq have the same meaning as before andH isthe nondimensional Henry’s law constant.Cg can be relatedto the fugacity of the solute in the aqueous phase by the igas law. During gas purging, the solution concentration wdecline as described by
dCaq/dt52~F/V!Cg , ~52!
whereF is the purge gas flow rate, andV is the water samplevolume. Assuming that the gas and the aqueous phequilibrate and that all solute in the aqueous phase is in
J. Phys. Chem. Ref. Data, Vol. 30, No. 1, 2001
-.
i-
ig-
s
f
.f
ixs
alll
ese
solution,Cg can be eliminated by combining Eqs.~51! and~52!. Integration of the resulting equation yields
ln Caq52~F/V!Ht1 ln Caq0 , ~53!
where t is the duration of purging, andCaq0 is the initial
concentration of the solute in water. Note that if an expement is carried out with sufficiently smallF or t or suffi-ciently largeV, Caq essentially equalsCaq
0 . Under these con-ditions, determination ofCg will yield Caq
0 from Eq.~51! if His known and will yield fugacity even ifH is not known. Thisapproach is advantageous if particles or DOM are presenthe sample since equilibria with these phases are notturbed and, therefore, do not have to be considered. Tapproach is similar to static headspace methods in thatgas and water phases equilibrate, but it makes practicause of large gas volumes. Therefore, this method was ter‘‘dynamic headspace’’ technique. For operational purpoin this study,Caq is considered essentially equal toCaq
0 ifCaq/Caq
0 .0.9.Preliminary experiments with mirex in distilled water s
lution allowed us to confirm reaching the equilibrium condtion. After a purging time of 120 min at a flow rate of 0.5dm3 min21, the value ofH was determined fromCg obtainedby analysis of mirex on Tenax trap, andCaq obtained byanalysis of mirex in water phase. Substituting this value iEq. ~53! along with the flow rate, the sample volume~19dm3!, and the purge time, yieldCaq/Caq
0 50.93.In Aldrich humic acid solution, the apparent Henry’s la
constant of mirex was significantly lower than that in dtilled water, because one portion of mirex was bound to dsolved humic acid and, therefore, was not volatile. The asciation constant of mirex can be defined
Kdoc5Cd /@Caq~DOC!# ~54!
and the apparent Henry’s law constant (H8) in humic acidsolution is
H85Cg /~Caq1Cb!, ~55!
where symbols have been already defined and~DOC! is thedissolved organic carbon concentration expressed aweight fraction. Equations~54! and ~55! can be combinedwith Eq. ~51! to give the expression
Kdoc5@~H/H8!21#@1/~DOC!#.
SinceH, H8 and ~DOC! can all be measured,Kdoc can becalculated.
Another system was used to study the sorption kineticschlorobenzenes to and from suspended sediment andparticles.155 It consists of a reaction vessel which is continously stirred with a magnetic stirrer. Stripping air is pumpand recycled in a closed-loop all-glass system except thsmall part of the flow is diverted through a parallel loocontaining a photoionization detector~PID!. The PID mea-sures the chemical concentration in the gas phase, thereflecting the activity of the dissolved compound in the waphase through the Henry’s law, and in the solid suspensThe sorption experiment is initiated by pouring the sorb
ohendnexth
tud
heth
t
ntn
ceemenaoshuexeinizthm
tiessetuiit
a:a
ehe-inn
em
1
locofm
wn
en-
o-te.
Theemcell,oiredby
har-owor-uentckeduateda-ll
riales.ed
hat
col-ofansagear-ss
-.
ratedn-
by
xi-heat a
ate
ith
ndsnthe
eseap-
239239SORPTION OF ORGANIC COMPOUNDS
suspension into the reaction vessel containing a water stion of the compound. The activity of the compound in tsolution is monitored continuously during the first hour ais measured intermittently afterwards. Typically, there ismeasurable change in activity after 1–2 d. Desorptionperiments are similar to sorption experiments exceptcontaminated sediments are poured into clean water inreactor.Kd values for sorption or desorption can be calclated from the observed dissolved concentration at the enthe kinetic experiments.
Brusseauet al.517 observed that a disadvantage of tKarickhoff156 apparatus is that it can only be operated indesorption mode. On the other hand disadvantages withdesign used by Wu and Gschwend155 are that:~i! desorptioncan only be studied by using the dilution approach, and~ii !the detection limit of the PID does not allow measuremewith sparingly soluble solutes and for those with small Hery’s constant values where small changes at minute contration levels may not be discernable. The apparatusployed by the authors517 was designed to combine thadvantageous features of the two systems and to elimithe associated disadvantages. It can operate in either clor open modes using three-way valves placed in line, tallowing, respectively, the performance of an adsorptionperiment and then, with the same slurry, the performanca desorption experiment. Moreover, a metering valve in-lcontrols the gas flux, thus enhancing the ability to optimexperimental conditions and an additional valve allowsuse of trapping devices when concentrations were too sto be detected by PID. The equilibrium sorption constantKd
can be determined in the following way. Measured quantiof sorbent, water, and solute are placed in the reaction vewhich is then sealed and shaken to allow the establishmof equilibrium. The vessel is attached to the GP apparaand the system is operated in the closed mode to determthe equilibrium gas-phase concentration of the solute. Wthis value,Kd can be determined from the following datgas volume, water volume, sorbent mass, solute mass,Henry’s constant.
The viability of the GP technique is a function of thHenry’s constant of the chemical and the sorptivity of tsolute/sorbent combination.517 It appears ideal for investigating the sorption dynamic of organic contaminantssediment/water systems. On the basis of some experimeresults, it appears that the GP technique is viable for systhavingKd values ranging from over 105 to less than 1 dm3/gand becomes unreliable forKd values in the range of 0.1–dm3/g.
11.7. Flow Equilibration „FE…
Sorption and desorption isotherms of phenol and chrophenols have been obtained by using a thermostatedtinuous flow stirred cell apparatus.100 This system consists oa suspension of sorbent contained by two hydrophilic mebranes~one 0.45mm and one 0.22mm! in a glass cell~;100cm3! with entry and outlet ports. Eluent solutions are dra
lu-
o-
athe-of
ehe
s-n--
teeds-
ofeeeall
sel,nts
neh
nd
tals
-n-
-
through the cell from a reservoir containing a known conctration of sorptive~sorption! or containing distilled water~desorption! and then through the flow cell of a spectrophtometer by using a peristaltic pump at a known flow raFlow rates in the range of 0.03–1.00 cm3 min21 have beenused to obtain mean residence times of 3000–100 min.amount of sorptive sorbed at any given time in this systcan be obtained through the mass balance around thewhich can be calculated knowing the volume of reservsolution input, and the concentration profile of the elutsolution. Sorptive concentration in the eluate is measuredcontinuous monitoring of absorbance at the wavelength cacteristic for each compound in the spectrophotometer flcell. Linear calibration curves of concentration versus absbance are obtained for each sorptive, over the range of elconcentrations used. The absorbance method is cheagainst quantitation by gas chromatography. Selected elfractions can be chromatographed to identify any degration products formed during the course of interaction. Asorbent are preeluted with distilled water to remove matecapable of passing through the end-of-cell membranBlank sorption and desorption experiments can be performfor each sorptive, in the absence of sorbent, to verify tthere was no interaction with the flow system.
11.8. Field Measurement „FM…
Measurements of pollutant concentrations in sampleslected in the field was used to investigate the influencecolloids on binding of PCBs by suspended sediments inaquatic system.50 Water samples were collected in bottleand the solute was isolated from the bulk water by passthrough a precombusted XAD-2 resin in a glass column. Pticles were isolated from bulk water samples with a glafiber filter ~0.6 mm pore size!. Nonfilterable PCB concentrations ~colloidal associated! were determined by differenceFilter and resin samples were extracted with 1/1~v/v!hexane/acetone, and the resulting extracts were concentby solvent removal, fractionated on Florisil columns, cocentrated, and analyzed by gas chromatography.
Sorption of PCBs and other chlorinated compoundslake and river sediments was investigated.49 Sedimentsamples were collected with traps, which consisted of pleglass tubes fitted at the bottom with removable caps. Ttraps were suspended in holders on a cable and placedcertain depth from the surface. The settling particulsamples were Soxhlet extracted with suitable solvent~s! andanalyzed. Water samples were filtered and extracted whexane.
This technique has been found satisfactory for compouhaving logKow.5.5, but for compounds with lower partitiocoefficients the field values are considerably higher thanpredicted values.49 The lower theKow , the larger the ob-served deviation, up to 40 times for dichlorobenzenes. Thresults show the difficulties that can be encountered inplying laboratory predictions to field situations.
Adsorption of PAHs on river sediments544 was determined
J. Phys. Chem. Ref. Data, Vol. 30, No. 1, 2001

olie.n
bdn
ys0.h-u
ve
Ca-ta
rac
ilibe-
fludnin
b
ie
ec
be
ir btioreblth
has
ue-s-
con-
aag
icn atum.theand
issists-
theon-nd
eter-tionnt,s a
con-
lu-at
otal.ndasedsre-pa-ghas
red
the
yon-edi-plesed
,ds
240240 DELLE SITE
by refluxing sediment or particulate samples with methanKOH, filtering, and extracting the filtrate with cyclohexanWater filtrate samples were extracted with dichlorometha
11.9. Batch Equilibration and Ultrafiltration „BU…
Batch equilibration was used also to measure sorptionhavior of colloid materials.399 Water samples are filterethrough 0.45mm filters to remove suspended particulates athen concentrated by ultrafiltration using a hollow fiber stem having a nominal molecular weight cutoff of 500Sample volumes are thus reduced, resulting in an enriccolloidal fraction ~ECF! and an ultrafiltrate. Solutions containing known amounts of the chemical are prepared intrafiltrate water, then sonicated, stirred in the dark at a gitemperature for 24–36 h, and filtered through a 0.2mm filterto remove any contaminant particle or crystals. The Efraction is divided in portions, and a given volume of ultrfiltrate containing a known amount of chemical is addedeach. The spiked samples are equilibrated in a shakerthen recirculated through the hollow fiber system to sepathe colloidal and ultrafiltrate fractions. The chemical in eafraction is concentrated and analyzed.
11.10. Fluorescence Quenching „FQ…
This method has been developed for determining equrium constants for the association of PAHs with dissolvhumic and fulvic acids188,415and to follow the rate of association between PAHs and dissolved humic matter.400 Themeasurement is based upon the observation that PAHsresce in aqueous solution but not when associated withsolved humic materials. If we assume that the fluoresceintensity is proportional to the concentration of free PAHsolution, then
F0 /F5@PAHT#/@PAHD#511Kd@Hu#, ~56!
where F0 and F are the fluorescence intensities in the asence and presence of humic material, respectively,@PAHT#is the total initial concentration of PAH and@PAHD# is thedissolved concentration of PAH in the presence of hummaterial. Since, at the concentrations used, a significantcess of humic acid is present,@Hu# can be taken as thamount of added humic acid without correction for the fration of humic that is associated with PAH.Kd can be calcu-lated from the slope of the plot ofF0 /F as a function of theconcentration of humic acid. A correction factor shouldcalculated to account of the apparent quenching due toattenuation of the excitation beam and/or absorption of emted radiation by an excess concentration of fluorophore othe presence of an additional absorbing species in solu~‘‘inner filter effect’’ !. The maximum value of this factor foa 13134 cm quartz fluorescence cuvette did not exce1.8, which was well within the recommended acceptarange.415 In general, the binding of a PAH compound widissolved organic carbon may be expressed as
F0 /F511Koc@DOC#.
J. Phys. Chem. Ref. Data, Vol. 30, No. 1, 2001
c
e.
e-
d-
ed
l-n
F
ondteh
-d
o-is-ce
-
cx-
-
ant-yn
de
A very detailed study on the correct use of this methodbeen presented with modifications of Eq.~56!, by taking intoaccount the possibility of substantial wall losses from aqous solutions and no full quenching of organic colloidassociated compound fluorescence.545
11.11. Equilibrium Dialysis „ED…
This method was used to measure the associationstants of organic chemicals with DOM.402,414
A water sample with known characteristics~pH, ionicstrength, etc.! is poured in a glass bottle and spiked withsolution of the compound under examination. A dialysis bis filled with a solution of known concentration of hummaterial and transferred to the bottle. The bottle is shakea fixed temperature for a time necessary to reach equilibriAt the end of this period aliquots are removed from bothdialysis bag and the solution outside the dialysis baganalyzed for the compound. In a dialysis experiment itassumed that the compound inside the dialysis bag conof two fractions: one fraction is free, truly dissolved compound, while the other is bound to humic materials. Sincefree compound can diffuse through the dialysis bag, the ccentration of free compound will be the same both inside aoutside the bag. The bound concentration can then be dmined as the difference between the compound concentrainside and outside the dialysis bag. A dialysis experimetherefore, measures the amount of bound compound afunction of the free compound concentration.
11.12. Reversed-Phase Separation „RS…
This method was also used to measure the associationstants of organic chemicals with DOM.414,546
The @14C# organic compound is added to humic acid sotion and allowed to equilibrate at room temperature forleast 18 h. Aliquots of the test solution are taken and the t14C activity is measured by liquid scintillation countingSeparation of humic-bound compound from free compoucan be made with a C-18 cartridge or C18 reverse-phHPLC column. It is assumed that humic bound compounwould pass through the resin with the humic acid. Measuments of the organic matter as DOC before and after seration can confirm that humic acid quantitively pass throuthe cartridge. The partition coefficient can be calculatedthe ratio of theg of pollutant perg of DOC ~determined fromthe 14C activity passing through the cartridge and measuDOC! divided by theg of pollutant per cm3 trapped~freelydissolved!. The amount trapped can be determined fromdifference of the14C activity total per cm3 minus the14Cactivity per cm3 passing through the cartridge. Harkeet al.547 used this procedure to measure the association cstants for BaP, transchlordane, pyrene, and endrin in sment porewater and elutriate. Before separation samwere filtered through two glass fiber filters or centrifugatto remove the particulate matter.
Great Lakes409 and Green Bay410 waters, freshly collectedwere inoculated with radiolabeled hydrophobic compoun

unai
eyc
beuhath
t
etete
th
nfeacoethco
thth
inuinly
thonimm
th-
-ytionties,een-in
ddsro-
of-
torshy.
la-
n-as-entralt ad-
er--
ex-us
-
t
utla-or-E,d,than
asesndr-
241241SORPTION OF ORGANIC COMPOUNDS
and, after batch equilibration, separated into particle-bousing glass fiber filter, DOC-bound using C-18 reverse phSep Pak, and freely dissolved phases, in order to determthe respectiveKoc andKdoc values.
11.13. Solubility Enhancement „SE…
The Kdom values for chemicals on humic acids have beobtained by Chiouet al.220 by measuring enhanced solubilitdue to the presence of various amounts of cosolutes andculating the association constants by Eqs.~18! and~19!. So-lutions containing cosolutes were placed in centrifuge tuwith Teflon-line screw caps, and the test compound was ssequently added to each tube in amounts slightly more trequired to saturate the solution. These samples wereequilibrated on a reciprocating shaker and centrifugedseparate the excess solute. Undissolved solute particleshering to the meniscus were aspirated from the surface. Ctrifugation and aspiration may be repeated to compleeliminate the excess solute. Subsequently, an aliquot ofsupernatant was carefully withdrawn with a volumetric pipand analyzed for determining solubility.
11.14. Adsorption on the Glass „AG…
This method has been used for the determination ofassociation constants of PCBs with humic material~HM!.413
It is based on the measurement of the fraction of compouadsorbed on the glass walls of the flask containing a reence solution without HM and the measurement of the frtions of compounds adsorbed in the presence of known ccentrations of HM. The PCBs adsorbed on the glass wdetermined by extraction with hexane and analysis ofhexane extracts. Equations derived to calculate sorptionstants are available in the original paper.413
11.15. Humic Acid Titration „HT…
Carboxyl groups in humic acid are responsible both ofcatalysis of atrazine hydrolysis to hydroxyatrazine and ofsorption of the two compounds by humic acid.548 Titration ofthe carboxyl groups and separate measurements of the kics of atrazine hydrolysis allowed us to determine the eqlibrium sorption constants for atrazine and hydroxyatrazand the rate constant for atrazine conversion on the catasites.
12. Prediction Methods for the Evaluationof Sorption Coefficients
The experimental methods for the determination ofenvironmental properties such as water solubility, bioccentration factor, and soil sorption are expensive and tconsuming and may be very inaccurate especially for copounds of low solubility. Therefore, some alternative meods were proposed for their prediction120 based on the general Collander549 equation
dsene
n
al-
sb-n
enoad-n-
lyhet
e
dsr--n-reen-
ee
et-i-etic
e-e-
-
logK15a logK21b, ~57!
whereK1 andK2 are organic solvent-water partition coefficients. The constantsa andb can be calculated knowing onlthe water concentration in the two organic solvents. Equa~57! has been extended to the cited environmental properwhich all may be regarded as partition of a chemical betwan organic phase and water.120 The measurement or calculation of one property allows prediction of the other to with1 order of magnitude.
Mc Gowan550,551 proposed to calculate solubilities anpartition coefficients for solutes not forming hydrogen bonusing correlations with the parachor; corrections were intduced to account for hydrogen-bonding interaction.551 Otherauthors116,552 applied these correlations to the predictionKom or Koc for pesticides.Kom or Koc values were also estimated using correlations withKow , solubility, specific sur-face area, indices of molecular structure, or capacity facin reversed-phase high-pressure liquid chromatograpSome reviews are available on this matter.105,553,554Gawliket al.555 reviewed and classified more than 200 existing retionships forKoc estimations.
12.1. Correlations with Octanol ÕWaterPartition Coefficients
The role of organic matter of soils and sediments in cotrolling the sorption of hydrophobic compounds may besumed to be similar of that of an organic phase in solvextraction.26,176Octanol has been chosen to simulate natuorganic phases and many authors have demonstrated thasorption coefficients (Koc) may be estimated from theoctanol–water partition coefficients (Kow) using suitablecorrelation equations.
The relative lipophilicity of organic phases may be detmined by comparing the solubility of a hydrophobic compound in each of them. This may be accomplished bytrapolating the observed partitioning to the aqueosolubility limit ~at saturation! (Sw), at which the sorbed concentration is designated as the ‘‘solubility’’ in OM (Som)197
Som5KomSw .
Chiou197 has reported that PCE solubilities (Som) in soil OMand humic acid are 42 and 27 mg g21, respectively, and thathe estimated solubility of PCE in octanol is 72 mg g21. Aprevious study363 has shown that the soil humic acid is abohalf as effective as soil organic matter in sorption of retively nonpolar organic compounds. Furthermore, both sbents show a lower solubility power than octanol for PCthus demonstrating a lower lipophilicity. On the other hanhumic substances can absorb a larger amount of wateroctanol, thus demonstrating a more polar character.55 There-fore humic substances are less favorable partitioning phthan octanol for nonpolar chemicals. Accordingly, Chin aWeber206 found that experimental binding constants of oganic compounds with humic acid (Koc) are consistently
J. Phys. Chem. Ref. Data, Vol. 30, No. 1, 2001
dr
ity
ert
dnd
nicrm
m-hter
ts
nd 2
y,theose
l
f
are
chen
-forandanic
ing
yous
242242 DELLE SITE
0.2–1.5 log units lower than their respectiveKow and thatthese differences appear to increase with increasing hyphobicity.
Karickhoff96 derived the following equation relatingKoc
to Kow on the basis of the fugacity model7
Koc5~f0/foc!Kow , ~58!
where the proportionality constant is the ratio of fugaccoefficients for the solute dissolved in octanol~saturatedwith water! (f0) on that bound to natural organic matt(foc). For Koc andKow to be linearly related, this ratio musbe independent of solute. Karickhoff96 found that sorptioncoefficients normalized to organic carbon,Koc, for hydro-phobic compounds were highly invariant over a set of sements and soils and that their values for five compou~benzene, naphthalene, phenanthrene, anthracene,pyrene! were related toKow through a relationship of thetype of Eq.~57!
logKoc50.989 logKow20.364 r 250.997.
The near-unity coefficient,a, for logKow substantiates theconstancy of the ratio of fugacity coefficients in the orgaphases for this series of compounds. Fitting the linear foEq. ~58!, gives
Koc50.411Kow r 250.994.
This equation allowed us to estimateKoc values for manycompounds of a different chemical nature, which were copared with the experimentalKocs. Compounds for which solute speciation could be expected~such as organic bases witpKa.3! were excluded. The agreement between calculaand measuredKoc values was good, within a factor of 3 o0.48 log units, comparable to typical deviations inKoc re-ported for a given compound on widely differing sedimenand soils.
A similar linear relationship~a51.00 andb520.21; r 2
we
--p
ee
J. Phys. Chem. Ref. Data, Vol. 30, No. 1, 2001
o-
i-s
and
,
-
d
51.00! betweenKoc andKow was derived in a study108 con-cerning the sorption on sediments of 7 PAHs, benzene, achlorinated hydrocarbons ~methoxychlor and2,4,6,28,48,68-HCB!. The same relationship was used bHassettet al.179 to predict theKoc value of dibenzothiophenewhich was in good agreement with that obtained fromsorption experiments. An equation with constants very clto the previous~a51.029 andb520.18! was found by Raoand Davidson87 with several pesticides
Schwarzenbach and Westall207 applied the linear free-energy relationships to partitioning of nonpolar solutes~6alkylbenzenes and 7 chlorobenzenes! between water and soiorganic matter. A highly significant linear correlation~a50.72 andb50.49! was found between the logarithms othe averageKoc values and the logarithms of theKow valuesfor these compounds. The slope parameter isa50.72, sug-gesting that the natural sorbents investigated in that studyless lipophilic than octanol and more similar to butanol.556
Dzombak and Luthy553 observed that for hydrophobicompounds a series of parallel lines can be obtained wlogKow is plotted against logKd(K f) for sorbents havingsingle OC contents.
Vowles and Mantoura128 determined by batch equilibration theKd values for benzene and six alkylbenzenes andnaphthalene, four alkylnaphthalenes, phenanthrenepyrene, using a surface estuarine sediment with an orgcontent of 4.02%. The correlation between logKd values andthe respective logKow values gives the equation witha51.15 andb522.53 (r 250.961), which accommodatingon organic carbon content of 4.0% gives the correspondlogKoc– logKow relationship in whichb changes to 1.13. Theauthors demonstrated that theKoc data are more sensiblcorrelated if the hydrocarbons are placed into homologgroups, like:
- benzene-naphthalene-phenenthrene-pyrene:a51.20; b51.13; r 250.998;
- alkylbenzenes: a50.904; b520.46; r 250.996;
- alkylnaphthalenes: a50.774; b50.37; r 250.992.
ts ast
rseell
k-
sionfi-
The equation obtained for alkylbenzenes agrees verywith that found for benzene, chlorobenzenes and PCBs~12compounds! sorbed on soils55
logKom50.904 logKow10.779 r 250.989. ~59!
Lara and Ernst182 found highly significant correlations between the experimental logKoc values for several PCB congeners obtained with each of three sediments and the restive logKow values. However, if theKocs of the threesediments were pooled, lower correlations were obtainThe correlation became significantly higher if a multiple r
ll
ec-
d.-
gression analysis were adopted, taking the pooled logKd val-ues of the same PCB congeners for the three sedimendependent variable and logfoc and logKow as independenvariables.
Brown and Flagg130 determined theKoc values of ninechloro-s-triazine and dinitroaniline compounds with a coasilt fraction of a pond sediment. These values, that were wcorrelated with theKow values, were compared with the worby Karickhoff et al.108 The more polar character of the compounds under examination, however, reduced the preciof estimating sorption from octanol/water partition coef

m
oftiota
il
ntt,ohdd
b
eaa
ul-an
qu
--
mese
si
drr
le,
ticta--ex-s
n ofus,
eencal
20t-tedrp-alsu-
re
er
ch
e
ionhencyent
a-
the
-
nliduchiddsn it
-
243243SORPTION OF ORGANIC COMPOUNDS
cients. A fit of the combined data sets for a total of 19 copounds of widely varied properties~5 orders of magnitudevariation in solubility! yielded a relationship witha50.937,b520.006, andr 250.95. Estimates ofKoc basedon this empirical equation were within a factor of 2 or 3the measured values. The authors concluded that predicof this quality would be adequate for many environmenmodeling applications.
A significant relationship exists betweenKoc andKow97,180
for the sorption of 22 nonpolar compounds by various soand sediments~a51.00; b520.317; r 250.980!, which isvery similar to the Karickhoff108 equation. However, whenthis equation is used to predictKoc values for amino-substituted PAHs, the calculated values are significalower than the observed values.557 These data suggest thaalthough the sorption of these aromatic amines is highly crelated with the OC content of the substrates, the strengtthe sorption is greater than can be accounted for basehydrophobic association of neutral aromatic nuclei to sement OM, as was observed for neutral PAHs.
Some equations were derived for polar compounds soron soils. They regard correlations logKoc– logKow for:
~i! 45 chemicals, mostly pesticides:217 a50.544; b51.377; r 250.74;
~ii ! 105 chemicals~anilines, anilides, nitrobenzenes, urderivatives, carbamates, organophosphates, halogencompounds, etc.!:120 a50.52; b50.64; r 50.95. This equa-tion, correlating logKom to logKow , was obtained from onlytwo soil series, but similar results can be derived from reswith widely differing soils. Briggs120 reported similar equations derived from the data obtained with 17 Australisoils,558 with Iowa soils,122 with Brazilian soils,559 and withsoils and a stream sediment from Eastern Canada,264
~iii ! Nonionized phenols:337 a50.82; b50.02; r 250.98,where theKoc values were obtained from theKd measuredwith three sorbents, lake sediment, river sediment, and afer material and the respectivef oc values ~0.094, 0.026,0.0084!;
~iv! Nonionized phenols:111 a50.75; b50.62 with a stan-dard error of fits50.19 which allows predictions within afactor of 2.
Estimates ofKdoc with this type of equations were obtained by Chin and Weber206 who collected data of the association or binding constants with humic acids for 14 copounds ~TCE, toluene, PAHs, PCBs, chlorobenzena-chlordane, and DDT! and obtained a correlation with threspectiveKow
560 having a50.82 and b50.1923 with r50.96. The experimental binding constants were contently 0.2–1.5 log units lower than their respectiveKow ;these differences appear to increase with increasing hyphobicity. They concluded that humic polymers are mopolar than octanol and thus comprise thermodynamicallyfavorable partitioning phases for nonpolar organic solutesalready suggested by Chiouet al.55
Correlation between log association constants (Kdocs) withhumic substances and logKow for PCB congeners413 gave arelationship witha50.377,b52.387, andr 50.974.
-
nsl
s
ly
r-ofoni-
ed
ted
ts
i-
-,
s-
o-essas
Sabljic et al.561 have recently carried out a systemastudy to evaluate the quality and reliability of the quantitive logKoc– logKow relationships. A system of QSAR models has been derived which is based on a reliable set ofperimental or estimated logKow data. Particular emphasis habeen made to clearly define the boundaries for applicatiodeveloped models as well as the quality of estimates. Thfor each developed model its application domain has buniquely defined by unambiguous description of its chemi~structural! domain, substituents domain, andX-variable do-main. As a result of this study, a series of logKoc– logKow
relationships has been obtained, which are specific forcompound types. Finally, the QSAR model with the firsorder molecular connectivity indices has been incorporain the derived system of QSAR models since the soil sotion estimates of the predominantly hydrophobic chemicbased on the logKow data have large uncertainties, particlarly in the logKow data range from 4 to 7.5.
Gerstl562 collected and analyzed sorption data for mothan 400 compounds. He found that the equations logKoc vslogKow for individual chemical groups were preferred ovthe general equation representing all data, which is
logKoc50.679 logKow10.663 r 250.831.
The individual class curves are mostly not parallel to eaother and intersect at aKow value of ;2. Both above andbelow this value ofKow the lines diverge so that use of th‘‘total’’ equation at extreme values ofKow will result in verylarge errors. Furthermore, application of a polarity correctterm (Fc) might improve the fit over a certain segment of tcurve, but will at the same time increase the discrepaalong the rest of the curve so that overall no improvemwill be noted. The correction termFc can be obtained by thefollowing expression:
Fc51/n(n
~ logKocpred– logKoc
obs!,
whereKocpred is theKoc value predicted from the general equ
tion. This enables us to calculate an adjustedKoc value
logKocadj5 logKoc
pred2Fc .
Fc is related to the polar character of the compounds;lower the value ofFc ~non-negative! the more nonpolar thegroup; similarly, the greater theFc , the more polar the compounds comprising that group.
12.2. Correlations with Water Solubility
Most of the Koc–S relationships were derived betwee1979 and 1990. In some of them, derived for liquid and socompounds, solubility of solid compounds was taken as swithout including any correction term. This procedure dnot take into consideration that solubility of solid compounmust be modified because of the melting point effect whehas to be examined together with solubility of liquid compounds.
J. Phys. Chem. Ref. Data, Vol. 30, No. 1, 2001

en%io
oe
kthy-
p
fe
usra
e
ts
sne
an
chlsla
c-
boftiv
io
s.oddector
rnts
ami-
utends,
ro-nicrac-ac-to
be
stal
-
c
gy
y
-
244244 DELLE SITE
Chiou et al.195 determined the linear isotherms for sevchlorinated hydrocarbons onto a silt loam soil with 1.6organic matter and collected from the literature the sorptdata for several chlorinated compounds~PCBs and pesti-cides!, which covered over seven orders of magnitudesolubilities ~S!. For all these 15 liquid compounds thlogKom values were correlated to logS, giving
logKom520.557 logS14.040 r 250.988,
whereS is in mmol m23. This result, together with the lacof isotherm curvature, is consistent with the idea thatuptake of neutral organic chemicals by soil is essentiallprocess of partitioning~dissolution! rather than physical adsorption, with a corresponding low enthalpy contribution.
Similar values of the slope were often obtained in this tyof relationships:
~i! An equation witha520.561 andb53.8 was foundby Gerstl and Mingelgrin563 for seven pesticides odifferent chemical composition, spanning eight ordof magnitude of solubility~mmol dm23!;
~ii ! Felsot and Dahm122 derived their equation (a520.539; b58.012; r 250.950! for five carbamateinsecticides in five soils with various OM content.Swas expressed in g m23.
~iii ! Kenaga and Goring217 and Kenaga564 estimated theKoc values for 358 compounds, mostly pesticides,ing an equation, derived from 106 experimental liteture data, havinga520.55 andb53.64, whereSwasin g m23. This relationship gave values of logKoc
61.23 order of magnitude from the calculated valuat 95% confidence limit.
~iv! Karickhoff et al.108 found the same slope of the plo~a520.54; b50.44; r 250.94! in which theKoc val-ues were averages for isotherms run on the coarsefractions of two sediments with seven PAHs, benzemethoxychlor and 2,4,6,28,48,68-HCB and S was inmole fraction.
A slightly different equation was derived97,180,210,565~a520.686; b54.273; r 250.933! with the data for a total of22 compounds including PAHs, chlorinated compounds,few polar compounds on soil/sediment systems,179 with S ing m23. The relationship between logKoc and logS (g m23!for benzene, naphthalene, and anthracene on estuarineloids gave a slope of20.693 and an intercept of 4.851 witr 250.985,399 demonstrating that natural colloids and soisediments exhibit similar sorption characteristics to nonpoorganic compounds.
Correlation between logKdocs and logS (mg m23! for theassociation of PCBs413 with humic substances allows to reognize the influence of the ortho-substitution becauseKdoc
decreases within groups of isomers with increasing numof ortho-chlorines. This is due to the fact that solubilityPCB isomers increases with ortho-substitution. The relaequation hasa520.973 andb56.186 (r 520.976).
As we have seen, some of the logKoc– logS equationsshown so far were derived without taking into considerat
J. Phys. Chem. Ref. Data, Vol. 30, No. 1, 2001
n
f
ea
e
r
--
s
ilt,
d
ol-
/r
er
e
n
any correction for the solubility of solid compoundBriggs120 observed that the solubility was not such a gopredictor asKow for theKoc values calculated by Kenaga anGoring216 for organic pesticides, probably because the effof melting point on solubility was not taken into account fsolid compounds.
Karickhoff52,96 reported theKoc expression for nonpolaorganic compounds as a function of the fugacity coefficiefor water and soil~sediment! OM
Koc5fw/foc. ~60!
In comparingKoc for a series of hydrophobic solutes ongiven soil or sediment, variations are expected to be donated by variations in the aqueous phase coefficient,fw, dueto solute–solvent dissimilarity, and can be related to solsolubility in the aqueous phase. For the series of compoutaken into consideration by the author~benzene, naphthalenephenanthrene, anthracene, and pyrene!, for which solubilitygoes from 1790 to 0.135 g m23, one would expect a 3–4order of magnitude increase in activity coefficients,gw , ingoing from benzene to pyrene. On the other hand, for hydphobic solutes in association with sediment or soil orgacarbon, one would expect solute–sorbent adhesive intetions to be quite similar to solute–solute cohesive intertions with a much smaller range of variability from solutesolute. For a series of hydrophobic solutes, Eq.~60! becomes
Koc } gw ,
where the reference fugacity state for the solute is taken tothe pure super-cooled liquid. For hydrophobic liquids,gw isequal to the reciprocal of the mole fraction solubilityXsol.For solutes that are solids at room temperature, a cryenergy term must be added
loggw52 logXsol2DSf~Tm2T!/~2.303RT!, ~61!
where Tm and T are the melting and equilibrium temperatures ~K!, DSf is the enthropy of fusion, andR is the gasconstant. The entropy of fusion (DH f /Tm) has beenfound566–568 to be not highly variable for many aromaticompounds having ‘‘rigid’’ molecules~generally 12–15 eu!,with an approximate value of 13.563 cal mol21 K21 or 56.5J mol21 K21. With these assumptions, the crystal enerterm in Eq.~61! becomes20.009 53 (Tm2298).
Thus, the dependence ofKoc on solubility can be ex-pressed as
logKoc52a logXsol20.009 53~Tm2298!2b, ~62!
whereb depends upon the fugacity coefficient,foc; ideally,if foc is relatively independent of solute,a approximatesunity.
Commonly, the linear regression of logKoc vs logXsol hasbeen used with no explicit crystal energcontribution.108,195,211,217 For the five cited aromatichydrocarbons,96 the linear regression without this contribution gives
logKoc520.594 logXsol20.197 r 250.945,
rm
oa
al
tin-
tee.-
fo47
fs
nl-ityncisena
uaonp
ic
he
leaef
-
erith
islarorec-
q.
-
ent
-ns
-stive
sla-
on
dente
ds
r-lar
rved.
sesut aer-of
likealr all
245245SORPTION OF ORGANIC COMPOUNDS
while linear regression including the crystal energy tegives the following form of Eq.~62!:
logKoc520.921 logXsol20.009 53~ tm225!21.405
r 250.995. ~63!
This crystal energy term significantly improves the qualityfit to the experimental data. For solutes that are liquids25 °C, the melting point is ‘‘set’’ at 25 °C and the crystterm vanishes. Also, the fitted coefficient,a, for the solubilityterm much more closely approximates unity, thus supporthe assumed dominance ofgw in Koc variations between solutes. Equation~63! has been used to deriveKoc values formany compounds~triazines, carbamates, organophosphaand chlorinated hydrocarbons!, and was found to estimatKoc usually within a factor of 2–3 of measured values52
Equation~63! worked well for low molecular weight compounds but tended to overestimate sorption coefficientshighly chlorinated, high molecular weight compounds,which thea value may be in the range of 0.7–0.8. Fororganic compounds the literatureKoc values allowed to ob-tain ana value of 0.83 and ab value of20.93.
Briggs120 derived the following relationship for a pool oseveral polar~mostly pesticides! and nonpolar compound~chlorinated hydrocarbons!:
logKom520.51@ logS1~0.01tm20.25!#10.8
r 520.88,
whereS is the molar water solubility,tm is the melting pointin °C.
Following Chiouet al.,55 to analyze the relative effects opartition coefficient of solute solubility in water, compatibiity with soil organic phase, and alteration of water solubilby soil organic components dissolved in water, a refereideal line relating sorption coefficient with water solubilityneeded. The authors, by considering the major componof soil humus to be amorphous polymeric substances,plied the Flory–Huggins theory200,201to account for the sol-ute activity in an amorphous polymer. They derived an eqtion describing a reference ideal line relating sorpticoefficient to water solubility. The equation, after some aproximations, is
logKom0 52 logSVm20.622, ~64!
whereKom0 is the theoreticalKom, S is the molar water solu-
bility, and Vm is the molar volume of the solute.The authors55 investigated the sorption of 12 aromat
compounds~benzene derivatives and PCBs! from aqueoussolutions on a soil having 1.9% organic matter content. Tderived the following regression equation:
logKom520.813 logSVm20.993 r 250.995, ~65!
whereS is in moles/L andVm in L/mole. The experimentalogKom values show a systematic deviation from the idline @Eq. ~64!# making the slope of the experimental linsignificantly different from 21. Therefore, the effect ologSVm is more important than the effect of solute incom
ft
g
s,
ofr
e
tsp-
-
-
y
l
patibility with soil organic phase, which was found greatthan the corresponding effect for the same compounds wthe octanol phase.569 This indicates that soil organic matterinferior to octanol as a partition phase for relatively nonpoorganic compounds in agreement with the generally mpolar nature of the soil organic matter with respect to otanol. Finally, since variability ofVm is small compared tothat ofS, the correlation between logKom and logSshould beessentially linear. Omitting the molar volume term from E~65!, the present study leads to
logKom520.729 logS10.001 r 250.996. ~66!
The coefficient of logKow for a selected group of compounds should approximate the ratio of the change of logKom
with logS to that of logKow with logS. The ratio of20.729in Eq. ~66! to 20.799 in logKow vs logS for the 12 com-pounds yields 0.912, in good agreement with the coeffici~0.904! of Eq. ~59!.55
Vowles and Mantoura128 obtained a good correlation between logKd for 14 aromatic and polyaromatic hydrocarbosorbed on a surface sediment and2 logSVm, whereS is theliquid or supercooled liquid molar solubility andVm is themolar volume of hydrocarbon
logKd521.142 logSVm23.132 r 250.955.
Alkylbenzenes are more closely correlated (r 250.994) withthe PAHs showing enhanced sorption.
Lara and Ernst182 found highly significant correlations between the experimental logKoc values for 33 PCB congenerobtained with each of three sediments and the respeclogS values. However, if theKocs of the three sedimentwere pooled, lower correlations were obtained. The corretions became significantly higher if a multiple regressianalysis were adopted, taking the pooled logKd values of thesame PCB congeners for the three sediments as depenvariable and logfoc and logS as independent variables. Thregression equation obtained was:
logKd54.66920.488 logS10.785 logf oc r 50.976
whereS was in g m23.The sorption of three groups of polar organic compoun
capable of H bonding with inorganic soil surfaces~ketones,alcohols, phenols! by three soils having different organic cabon contents was compared with the sorption of nonpocompounds by the same soils.570 A wide variation in Koc
values among the compounds and soils has been obseThe average range ofKoc for individual compounds amongthe three soils was a factor of 3–4 for all compound clasexcept phenols, for which the average range was of abofactor of 100. When phenols were excluded from considation, the relationship observed between water solubilitysubcooled liquid phase~g m23! andKoc in this work showeda constanta520.50 and a constantb53.94.
Gerstl562 derived logKoc– logS ~molar! correlations formore than 400 compounds. It was observed that,Koc–Kow relationship, the equations for individual chemicgroups were to be preferred over the general equation fo
J. Phys. Chem. Ref. Data, Vol. 30, No. 1, 2001

--ra
-
in
ne
biidlitystnt
di
is
eraec
ofth
thgr
ac
a
b-nch
nen
um
ityo-
g
nd
ne-
as
n is, ae
sed.ith
tion
ol--D.aryesngs
e
-mane
dt tohater-
246246 DELLE SITE
chemicals, but that a group correction term (Fc) added to thetotal equation gave similar results. Solubility of solid compounds was corrected (Scorr) for the crystal energy contribution. The results of this investigation showed that in genethe correlation betweenKoc and Kow is better than that between Koc and S or Scorr. In many cases the use ofScorr
instead ofSdoes not result in any significant improvementcorrelations. In particular, the classes for whichScorr resultsin the greatest increase in correlation are amides, triaziand dinitroanilines. For these compounds, which havesimilar structural unit based on an aromatic ring, the soluity correction term, which was derived basically for rigmolecules, is more apt to reflect true changes in solubiFor any other classes~carbamates, organophosphorous pecides, etc.! the combination of a large number of differestructures makes any correction inSof secondary importanceonly. An interesting point is that the slopes for each invidual class to more or less parallel for theKoc–S relation-ship. Thus, the adjusted curves~calculated usingFc! wouldbe shifted to more or less overlap the ‘‘total’’ curve, whichrepresented by the following equation:
logKoc520.508 logS10.953 r 250.757
or by
logKoc520.515 logScorr11.310 r 250.716.
The fact that theKoc–S curves for the different groups arnearly parallel would seem to indicate that the same intetions affecting a compound’s aqueous solubility also affits sorption by soil OM. The difference between groups~in-tercepts! might be indicative of differences in the naturethe sorbent OM or of basic solubility differences betweenchemical classes.
12.3. Correlations with Capacity Factors in RPLC
The partition concept for sorption appears to paralleltheory for reversed-phase high-pressure liquid chromatophy ~RP-HPLC or RPLC!.55,571–573Both processes involvepartition of the solute into the polymeric~organic! phase.The mineral fraction of soil and the column support interpreferentially with the polar solvent~water! and are thusrelatively inert to nonionic organic compounds.55
In RPLC the stationary phase is typically a nonpolar coing of a long chain hydrocarbon~e.g., C18! bonded to aninert support and the mobile phase is generally constitutedmethanol/water~given as v/v! mixtures of various compositions. Woodburnet al.574 have demonstrated the similarity isorption energetics and, therefore, in solute retention menism for PAH retention by the RPLC sorbents~trichloro-alkylsilanes: C2, C4, and C8! and by a soil from the binarymixed solvent~30/70 methanol/water!. The RPLC methodwould allow us to overcome the difficulty withlogKd (Koc) – logKow relationships; first, the uncertainty ithe Kow values, and second, the necessity of using differequations changing substrate or compound types.
The fundamental expression associated with equilibrisorption on chromatographic supports is
J. Phys. Chem. Ref. Data, Vol. 30, No. 1, 2001
l
s,al-
.i-
-
c-t
e
ea-
t
t-
y
a-
t
k85rK ,
wherek8 is the chromatographic retention factor or capacfactor, r is the volume phase ratio of the stationary and mbile phases, andK is the thermodynamic equilibrium bindinconstant.574 The k8 value is given by
k85~ t r2t0!/t0 ,
wheret0 is the retention time of an unretained compound at r is the retention time of the solute under study.
McCall et al.575 found a good linear correlation betweelogKoc for nine pesticides and retention time with C18 rverse phase column, using 85/15 methanol/water mixturethe mobile phase. This allows us to predictKoc values forany chemical from its retention time. Hamaker576 showedthat the distance a chemical moves through a soil columinversely proportional to its sorption coefficient. Thereforeplot of 1/(Koc3 f oc) or 1/Kd versus distance moved should blinear. Such a plot has been obtained by McCallet al.575 withthe nine pesticides and each of the three soils they uFrom these results they derived a classification system wgeneral mobility classes for chemicals based on the retentime andKoc values
Retention timerelative to 2,4-D Koc Mobility class
0–1 0–150 Very high1–1.8 50–150 High1.8–3.1 150–500 Medium3.1–4.5 500–2000 Low4.5–7.0 2000–5000 Slight.7.0 .5000 Immobile
2,4-D and carbofuran leached completely through the cumn, therefore retention times were referred to that of 2,4Chemicals which are more soluble in the organic stationphase, more hydrophobic, will exhibit longer retention timwhich can be correlated with the different partitiocoefficients.573,575 Linear regression analysis of a log–loplot of the measuredKoc values for the nine pesticides versutheir RPLC retention times (t r) gave the following linearregression equation:
ln Koc53.446 lnt r11.029 r 50.98.
Estimation ofKoc by this equation appeared to providnearly as good a value as the actual measurement.
Vowles and Mantoura128 determined for a series of hydrophobic compounds theKd values for a sediment/water sisteand the capacity factors on RPLC using an octadecylsilphase ~ODS! ~75/25 methanol/water! and an alkylcyanophase~CN! ~55/45 methanol/water!, respectively. They ob-tained a series of logKd– logk8 relationships and concludethat the alkylcyano phase is behaving as a similar sorbensediment organic matter for all 14 hydrocarbons and toctanol and octadecylsilane show progressively larger divgences; thus an order may be generated
organic matter;alkyl CN.octanol.ODS.
aicuanaacil
ro
rntioonws,
tyle
-ng
lestffi
ddio
-cyth
n
ree
e
esw
omr
-al
l-
ded to
lserc-
n-s-anrif-withhicef-al’s
dhase
ed
one
ro-con-ds
ndinging-
r-g-be-
ata
on-
-
edH
ter-d.nds
247247SORPTION OF ORGANIC COMPOUNDS
The divergences in the behavior of these four phasesinterpreted on the basis of different polarity, with organmatter being the most polar due to the presence of grosuch as carboxyl, phenol, and amine in humic materialsoctadecylsilane the least polar. Octanol and alkylcyanointermediate. Aromatic hydrocarbons are more polar thaliphatic hydrocarbons; modification of the aromatic struture may then cause greater change in partition to a simphase~organic matter! than to one that is not~octanol orODS!.
Therefore, ODS phase is not the most suitable for the pdiction of Koc values for polar compounds, due to nonhydrphobic interactions involved in sediment adsortion.577 Thecorrelation logKoc– logk8 improves with increasing watecontent; one reason may be that the higher water contethe mobile phase more closely represents the conditwhich prevail when measuring the real soil/water partiticoefficients. However, the correlation coefficient is still lo(r 250.755); it may be improved if two types of variablewhich reflect polar interactions, are included. One is theDxterm, which is derived from molecular connectiviindices578 ~Sec. 12.4!, and the other is an indicator variabwhich expresses hydrogen-bonding actions~HA, the numberof electron acceptor groups1HD, the number of electron donor groups!. The regression equation obtained introducithe two independent variables are
logKoc50.43210.588 logkw8 10.529D0x ~r 250.878!
logKoc50.47110.578 logkw8 10.172~HA1HD!
~r 250.863!,
where kw8 is the capacity factor at 100% water in mobiphase. Therefore, using retention data from a nonpolartionary phase can be a tool for estimating adsorption coecients on soil for both nonpolar and polar chemicals by aing a second variable that takes nonhydrophobic interactinto account.
Hodson and Williams579 found a great increase in correlation on changing from the octadecylsilane column to theanopropyl column. An increase of the water content ofmobile phase~water–methanol! from 25% to 45% results inan improvement in correlation. They used seven referecompounds~three benzene derivatives and four PAH! havingreliable logKoc values taken from the literature and measutheir capacity factors~cyanopropyl column, mobile phas45% water!. A very high correlation was found witha52.70,b52.04, andr 250.992. Using this relationship, thvalue of logKoc was determined from the measuredk8 valuesfor 22 compounds of different types, including pesticidbenzene derivatives, and phenols. In most cases theregood agreement between the reported value (60.1 logKoc)and that obtained by RPLC. In some cases~halogenatedcompounds and phenols! the logKoc values obtained byRPLC were higher than the literature values obtained frsoil adsorption measurements. Two possible causes of ehave been suggested:~a! when measuring logKoc values, us-
re
psd
ren-ar
e--
inns
a---
ns
-e
ce
d
,as
ror
ing soil, insufficient time is allowed for equilibrium conditions to be reached;~b! the pH may be such that the chemicis measured in the ionized form.
Also Kordel et al.580,581reported that the cyanopropyl coumns were the most suitable to predictKoc values. The cor-relation equation for 48 compounds of various classes ha580
a51.8, b52.4, andr 50.93, using 55/45 methanol/citratbuffer as the mobile phase. This method was compareother approaches based on logKow , connectivity indices,molar refraction, and molecular fragment.582 For the data setunder consideration~66 compounds from different chemicaclasses! only the RPLC screening method and, to a lesextent, the logKow method proved to be suitable for preditiong soil sorption coefficients with acceptable accuracy.
Gawlik et al.583 tested the applicability of the same screeing technique580 to adsorption coefficients derived from clasical batch experiments with five most frequent Europesoil types~EUROSOLS!.63 The adsorption data obtained fomore than 40 nonionic organic chemicals belonging to dferent substance classes could be correlated successfullythe respective retention behavior in a liquid-chromatograpsystem, thus allowing the estimation of soil adsorption coficients based on a single measurement of a chemicHPLC capacity factor.
Relative retentions,k8, of protonated and deprotonatechlorinated phenols were measured on C18 reversed-pcolumns.337 For the protonated phenols~2–4 chlorine substi-tution! the mobile phase was 50/50 methanol/water, acidifito pH;2. Correlation logk8–logKd , whereKd values weremeasured by batch experiments with two sediments andaquifer material, were allowed to obtainKd values for2,3,4,6-TeCP and PCP, for which the contribution of deptonated species were large at the adopted experimentalditions. Similar correlations derived for the same compounpredominantly as phenolate anions (pH;11.5) showed thatthey are retained in the same sequence as the correspononionized phenols, i.e., increasing retention with increasoctanol/water partition coefficient of the nonionized compound.
Szaboet al.584 prepared an RPLC packing material beaing immobilized humic acid and studied the effect of chaning the mobile phase water content on the correlationtween log~capacity factor! and logKoc. In order to eliminateselective solute–solvent interactions, they used logkw8 , thecapacity factor obtained by extrapolation of retention dfrom binary eluents to 100% water instead of using logk8,the capacity factor obtained from binary eluents. They cstructed a calibration curve using the logKoc values from theliterature for ten compounds~benzene, five benzene derivatives, and four PAHs! and experimentally determined logkw8 .By using this calibration curve they have redeterminlogKoc for the same compounds and for four other PAcompounds. By way of comparison they have also demined logKoc on ethylsilica phase they have synthetizeThe correlation equations for the ten reference compouare the following:
J. Phys. Chem. Ref. Data, Vol. 30, No. 1, 2001
aan
de
hidrt
thinenn
ithhioabi
ts
o.
ioioit
thhe
acoce
n
es,
on-orp-n-
d
es,
-
the
ar
s re-om-is aehis
-ntri-thatture
tiong
low
orbe-ccu-.
y
terlaranpa-ec-
ti-
248248 DELLE SITE
octanol phase: logKoc51.023 logKow20.578
r 250.922
ethylsilica phase: logKoc51.370 logkw8 11.545
r 250.950
humic acid phase: logKoc50.948 logkw8 11.781
r 250.986. ~67!
These equations indicate that it is more accurate to estimlogKoc from kw8 , determined from the humic acid phase, thvia a single relationship between logKoc and logkw8 on theethyl phase or by a logKoc – logKow relationship. Thus, fromthe divergences for the ten chemicals, the following orcan be generated:
organic matter on the soil
.immobilized humic acid.ethylsilica.octanol.
This is the order of decreasing polarity of the media. TlogKoc values obtained by using the immobilized humic acphase are in good agreement with the reported values fothe reference compounds. Finally by increasing the wacontent from 40% to 60% in the mobile phase improvescorrelation; this is partially due to the reduction of errorscalculating the capacity factor when water content is highAlso, the high water content of the mobile phase represemore closely the conditions of soil/water sorption in the evironment.
Szaboet al.585 have then used the same technique wtwo humic acid columns prepared with two different tecniques. The first was the same already used in the prevwork,584 named chemically immobilized humic acid silicgel ~CIHAC! and the second was named physically immolized humic acid silica phase~PIHAC!. The potential of thetwo columns for determining soil adsorption coefficien(Koc) was compared; logKoc values were estimated fromlogKoc versus logkw8 using the same reference compoundsthe previous work.584 While the CIHAC column gives Eq~67!, the PIHAC column gives the following equation:
logKoc50.963 logkw8 12.436 r 250.994. ~68!
From a comparison of Eqs.~67! and~68! it is evident that thephysically immobilized humic acid phase is slightly superto the chemically bonded humic acid. Perhaps this superity reflects the nature of the association of humic acids wthe mineral phase in the environment. The authors havecalculated theKd values for the same compounds using trelationship
Kd5kw8Vv /Vs,
where Vv is the volume of the solvent required to elutesolute associated with the stationary phase in the RPLCumn, corrected for the volume retained in the pore spaand Vs is the volume of the solid phase. TheseKd valueswere then transformed to theKoc values by using the carbocontent of the humic acid on the phases. TheseKoc values
J. Phys. Chem. Ref. Data, Vol. 30, No. 1, 2001
te
r
e
allere
r.ts-
-us
-
f
rr-hen
l-s,
were in very good agreement with the literature valushowing that humic acid phases are useful to determineKoc
values without using calibration curves. It has been demstrated that the mineral phase has little influence upon stion of organic pollutants by humic acid, which is the pricipal organic component of soil.586
The same authors,587 as part of the development of a liquichromatographic procedure for predictingKoc values of or-ganic pollutants, evaluated two silica-derivatized phasformed by immobilizing salicylic acid ~SaA! and8-hydroxyquinoline~HQ! on silica, to simulate the constituent groups of humic acids. The correlations between logKoc
and logkw8 were similar and appeared to be better thancorrelation made between logKoc and logKow . The correla-tions arefor SaA:
logKoc51.037 logkw8 10.471 r 250.948
for HQ:
logKoc51.002 logkw8 10.201 r 250.931.
Then, it has been demonstrated588 that the prediction of thesoil adsorption factor logKoc, by usingKow or the retentionfactors determined by RPLC, can be improved by multilinerelations in which the Hildebrand parameterd589,590 repre-sents the second independent variable. This parameter ilated to the cohesion energy and the molar volume of a cpound and the cohesion energy between liquid moleculesfunction of polarizability, ionization potential, and dipolmoment. The results indicate that the contribution of tvariable is higher for more apolar stationary phases~octade-cyl and phenyl silica phases!. When the capacity factors obtained from the humic acid phase are considered, this cobution seems to be negative. This may be due to the factextracted humic acid may be somewhat more polar in nathan undisturbed soil organic matter.
12.4. Correlations with Molecular Descriptors
It has been observed that the experimental determinaof Kom(Koc) values is often a costly and time-consuminprocess and it is also very inaccurate for compounds ofwater solubility ~DDT, lindane, and PCBs!.591 The alterna-tive methods based on correlations with solubilityoctanol–water partition coefficients are inaccurate too,cause it is impossible to determine these parameters arately for compounds whose solubility is below 1 ppmTherefore Sabljic591 proposed applying molecular topologand quantitative structure–activity relationship~QSAR!analysis to this problem, with the aim of finding a paramethat will describe the relationship between the molecustructure of the compounds and their sorption by soil withaccuracy independent of its magnitude. The structuralrameters used in this investigation are the molecular conntivity indices ~MCIs!, that were successfully applied to esmate both biological parameters~enzyme induction,
-
r-odntrly
i
bb
nthsicmisona
thypan
te
vae
nc
nex
r
ea-anals
e
the-
ds
re
,tedandtedlar
oilre-
logted,5-re-thorare
allined
ityf-
eus,tyThealore
itsvesoiloilartyer-oef-
nganin-
f
nicntmslar
249249SORPTION OF ORGANIC COMPOUNDS
biodegradation, toxicity, etc.!592 and constants of environmental interest~solubility, Henry’s law constant, partitioncoefficients, etc.!.11
Another possibility of computing thermodynamic propeties of organic compounds is the use of prediction methbased on the consideration that a molecule is a collectiomolecular fragments. Each of them makes a distinct conbution to the thermodynamic property, which is relativeindependent of the rest of the molecule.52 This concept wasintroduced by Leoet al.556 for the estimation of theKow
values and was used to predict also sorptionsoil.96,116,108,211
The concept of molecular connectivity was introducedRandic593 and further developed and extensively usedKier and Hall.594,595MCIs are derived from the assignmeof a numerical adjacency value to each atom other thandrogen in the molecular skeleton. This value correspondthe bond number or the valence of each atom. Simple ind~x! are calculated by assigning to each nonhydrogen atodelta value~d! equal to the number of atoms to which itbonded. Valence indices (xv) are calculated by assigning teach atom ad value equal to the number of valence electronot involved in bonds to hydrogen atoms. These indices mbe identified by an order and a type. The order refers tonumber of bonds in the molecular structure and the trefers to the structural fragment: path, chain, cluster,path cluster. Different orders correspond to each type.
For instance, the first order valence MCI can be calculaby dissecting the skeleton structure into first order~onebond! fragments. Each fragment is defined by two deltalence values; for each fragment one can calculate a fragmindex according to the algorithm
Ci , j5~d ivd j
v!20.5 ~69!
and sum of fragment index values to get first-order valemolecular connectivity index
1xv5S~d ivd j
v!20.5. ~70!
On this basis Koch596 found a good correlation betweelogKoc and first order valence molecular connectivity indfor a series of 18 hydrophobic organic compounds
logKoc50.44510.673~1xv! r 50.974.
The simple first order MCI (1x) can be calculated in thesame way@Eqs. ~69! and ~70!#, but by assigning to eachnonhydrogen atom itsd value, which is equal to the numbeof adjacent nonhydrogen atoms.
Sabljic591 derived the simple zero, first and second-ordMCIs for 37 compounds: eight PAHs and their alkyl derivtives, seven chlorobenzenes, eight PCB’s plus DDTDDE, and 12 chloro- and bromoalkanes or alkenes. Hecollected from the literature the respective experimentalKom
values. The best linear relationship was obtained betwlogKom and the first order molecular connectivity index
logKom5~0.5560.02! 1x1~0.4560.12! r 50.973.~71!
sofi-
n
yy
y-toesa
syeed
d
-nt
e
r
do
en
Statistically, Eq.~71! accounts for 95% of the variation inthe logKom data. This is as good as can be expected sinceaccuracy of theKom data is approximately 10% for compounds with high water solubility~low Kom! and up to 1order of magnitude poorer for weakly soluble compoun~high Kom!.217 The alternative correlations logS vs logKom
and logKow vs logKom were also examined, and both wefound to be inferior to Eq.~71!.
Equation~71! was then597 applied to other 31 compoundsincluding chlorobenzenes, PAHs, alkylbenzenes, chlorinaalkanes and alkenes, heterocyclic and substituted PAHs,chlorophenols. Comparison of the observed and predicsoil sorption coefficients demonstrated that the molecuconnectivity model is very accurate in predicting the ssorption coefficients. The average difference between pdicted and observed soil sorption coefficients is only 0.24unit, and more than 90% of the coefficients are predicwithin 2 standard deviations. Only 1,2,3,4- and 1,2,4TeCBz and 2,3,4,5-TeCP soil sorption coefficients are pdicted outside the 2 standard deviation range. The aunoted that the experimental soil sorption coefficientsfrom a laboratory which tends to report higherKom valuesfor chlorinated compounds than other investigators. Thenthese compounds except the three outliers were combwith the compounds of the previous study591 into a singleregression model. The resulting molecular connectivmodel for the quantitative description of soil sorption coeficients was
logKom50.531x10.54 r 50.976. ~72!
Equations~71! and~72! are statistically significant above th99% level and both have similar levels of accuracy. Ththe range of applicability of the molecular connectivimodel is extended to all the cited classes of compounds.author then examined the predictive ability of empiricmodels based on the octanol/water partition coefficientswater solubility for the compounds used in this work. Hfound a surprisingly high variability in the experimentalKow
data~the ranges are varying between 0.5 and 3.3 log un!.This variability and the wide variety of reported quantitatilinear models describing the relationships used to predictsorption fromKow values resulted in a range of predicted ssorption coefficients over 1.5 log units. This result is finferior to that obtained by the molecular connectivimodel, for which the standard error and/or average diffence between the predicted and observed soil sorption cficients is below 0.3 log unit.
The problem of having a single correlation model relatilogKoc to MCIs for hydrophobic and polar compounds cbe solved by introducing one index or a combination ofdices to estimate the nonhydrophobic contribution toKoc.Bahnick and Doucette578 obtained a large improvement othe regression model of the type used by Sabljic597 includinga nondispersive force factor term to take into account orgachemicals with substantial hydrophilicity. This improvemewas accomplished by replacing oxygen and nitrogen atowith carbon atoms to compute MCIs related to molecu
J. Phys. Chem. Ref. Data, Vol. 30, No. 1, 2001

ar
reo-sen
-
t
se
in
eu
lam
li-esef
-mng
-
odre
thoein
f
of
thatBs
nd
rslysisentfle
,
andb-
mcalutes
vityst
byule,effi-d
fu-
by
Thesedas-nic
stiveno-
250250 DELLE SITE
size. In this way the resulting molecule is largely nonpolThe nondispersive force factor can be computed by
Dx5~x!np2x,
where (x)np is the MCI for the nonpolar molecular structuandx is the MCI for the corresponding polar structure. Ftesting the effects of inclusion of theDx values in the regression model, a subset of 56 organic compounds was uValues for logKoc were obtained from the literature. Whethe values were given as logKom, they were converted tologKoc by adding 0.24 log unit to the tabulated logKom. Thelinear regression involving only logKoc and1x was
logKoc50.441x10.34 r 50.71,
while using 1x and D1xv the following equation was obtained:
logKoc50.531x22.09D1xv10.64 r 50.969.
This model was then tested by choosing a different subse40 organic chemicals and their corresponding logKoc fromthe literature. Predicted logKoc values obtained in this wayshowed a standard deviation from the experimental value0.37. The largest difference between calculated and expmental values was 0.82.
Dobbset al.535 found that logKom obtained for ten com-pounds~alkylchlorides, chlorobenzene, pesticides! sorbed onwastewater solids correlated with the modified Randicdexes giving the relationship
logKom51.7910.291xv r 50.97.
Meylanet al.598 developed a new estimation method bason 1x and a series of statistically derived fragment contribtion factors to predict soil sorption coefficients for nonpoand polar compounds. The general equation used to estithe logKoc of any compound is
logKoc50.531x1SPfN,
whereSPfN is the summation of the products of all appcable correction factors multiplied by the number of tim~N! that fragment occurs in the structure. The combintraining set includes 189 compounds. Summary statisticsthe correlation of experimental versus calculated logKoc forthe 189 compounds are correlation coefficient,r 50.977,standard deviation, SD50.230, and mean error, ME50.182.
Sabljic et al.599 used first order MCIs to accurately describe the association of PCBs with dissolved marine husubstances. The association coefficients for 26 PCB coners were those measured by Lara and Ernst.413 The bestcorrelation is obtained betweenKdom coefficients and a quadratic function of the first-order MCI
logKdom5221.4215.301x20.25~1x!2 r 50.974.
Then, three additional indicator variables, the numberortho, meta, and para chlorine substituents, were testemultivariate regression analysis. The best two variablegression model is
logKdom5219.4414.831x20.22~1x!2
J. Phys. Chem. Ref. Data, Vol. 30, No. 1, 2001
.
r
d.
of
ofri-
-
d-rate
dor
ice-
fin-
20.16~NoCl0! r 50.995. ~73!
The introduction of the second variable, the number of orchlorine (NoCl0) made significant improvements to thmodel, and helped to explain all of the remaining variationthe logKdom data. Equation~73! accounts for almost 99% othe variation in the logKdom data. The NoCl0 variable seemsto provide a good estimation for the extent of nonplanarityPCBs, thus correcting imperfections of the1x index which isonly a two dimensional descriptor. The authors observedthis model, when compared with existing models for PCassociation with humic substances~correlations withKow , S,and TSA!,413 shows superior performance in accuracy afuture applications.
Lara and Ernst182 measured sorption of 18 PCB congeneon three sediments. They used a multiple regression anabetweenKd , as the dependent variable, and the OC cont( f oc) of the sediments, the1x value, and the number oortho-chlorines (NoCl0), as the independent variables. Whithe two combinations logKd2(1x, log foc) and logKd
2@1x,(1x)2,log foc# resulted in high significant correlationsthe model developed using the quadratic function of1x,NoCl0 and logfoc
logKd5216.17014.6631x20.246~1x!2
20.060~NoCl0!10.692 logf oc
r 50.964
was able to explain almost 93% of the observed varianceto predict logKd with an average difference between oserved and predicted values of 0.056 log units.
The dependency of both equilibrium and nonequilibriusorption coefficients with soil–solute systems on topologidescriptors representing structural properties of the solwas investigated.600 For both equilibrium and nonequlibriumparameters, the first order valence molecular connecti(1xv) was found to be the best topological descriptor. Moof the rate-limited sorption behavior could be explainedaccounting for the size and structure of the solute molecas indicated by the good correlation between the rate cocient and1xv. This supports the contention that rate-limitesorption in these systems is controlled by a physical difsion mechanism.
The characteristic root index~CRI! model was proposedas a valuable tool for estimating soil–sorption coefficientsthe application of QSPR technique.601 The model was ap-plied to chlorinated benzenes, phenols, and biphenyls.calculation of the CRI starts from the hydrogen suppresskeleton of a molecule. First, each nonhydrogen atom issigned a delta value, which is calculated from their electroconfiguration by the following equation:
dv5~Zv2h!/~Z2Zv21!,
whereZv is the number of valence electrons in an atom,Z isthe atomic number, andh is the number of hydrogen atombound to the same atom. The CRI is the sum of the posicharacteristic roots obtained from the characteristic poly
c
e-s.
exon
g
s
eiohea
lyd
l--andyt
byt
ityth
ic
amt
io
dIn-
terorof
csthe
ec-ssol-t as
al-tallogate
dryiono-ofatbym.r in.
teml
theear
us-
ar
avelyrre-fi-
of
d-ug-
tively
251251SORPTION OF ORGANIC COMPOUNDS
mial of the matrix with the entries calculated from the eletronic input information~atomicdv values! by the followingequation:
wi j 5~d ivd j
v .....dnv!21/2,
wherei , j ,.....,n correspond to the consecutive nonhydrogatoms. The entries,wij, of the matrix are calculated by considering the shortest path to any other nonhydrogen atomthe case of equal paths (wi j 5w ji ) clockwise direction waschosen. So, all possible orders of the connectivity indexcept zero order for each chemical are included in the cstructed square matrix (m* m). Diagonal entries~wii, wjj! ofthe matrix are zero assuming that there is no path bondinthe atom itself. The final equation, relating logKoc to CRI,was obtained from 36 literature data forKoc and is
logKoc51.034 CRI10.441 r 250.964.
The average difference between predicted and observedsorption coefficients is only 0.17 log units.
Despite these often encouraging results, correlationsmore than 400Koc data by Gerstl562 with the respectiveMCIs demonstrated that the use of these indices alone winadequate for predicting sorption values with the exceptof a few homologous groups. Multivariate analysis of tentire data base failed to improve regressions. Simplemultiple regression analysis indicated that the use ofS orKow for each individual group of compounds was highpreferable and use of MCIs for predictive purposes, base20 test compounds, does not provide adequateKoc values.
12.5. Prediction Based on the Linear SolvationEnergy Relationship „LSER…
Park and Lee602 reported the use of the Kamlet–Taft sovatochromic parameters603 in the linear solvation energy relationship~LSER!604 to correlate and estimate bioconcentrtion factors in fish, adsorption coefficients on soil asediments, and interfacial tensions of organic nonelectrolwith water. The LSER equation for a property~SP! has theform
SP5SP01mVI/1001sp* 1dd1bb1aa, ~74!
whereVI is the intrinsic solute molecular volume, scaled1/100 so that it should cover roughly the same range asother independent variables,p* , b, and a are the solvato-chromic parameters that measure dipolarity/polarizabilhydrogen bond acceptor basicity, and donor acidity ofcompound, respectively, andd is a ‘‘polarizability correc-tion’’ parameter. Equation~74! allows us to give quantitativeinformation on the solute–target system interactions whdetermine the property of interest. TheKoc data were as-sembled for 42 compounds whose solvatochromic pareters were known or could be estimated. The coefficienawas found to be statistically zero and thus the term (aa) wasremoved in the correlation. The resulting multiple regressequation was
logKoc50.2314.84VI/10020.5p* 20.59d21.11b
-
n
In
--
to
oil
of
ren
nd
on
-
es
he
,e
h
-
n
r 50.968.
IncreasingVI leads to decreasing solubility in water anthereby increasing adsorption to soil/sediment organics.creasing dipolarity and polarizability lead to increasing wasolubility, which in turn decrease adsorption to the soilsediment. Increasing hydrogen bond acceptor basicitycompound favors solubility in water over the soil organiand should lead to decreased adsorption. Accuracy ofLSER predictions is comparable to that of molecular conntivity models, while range of applicability of the LSER iless wide than molecular connectivity models, becausevatochromic parameters for complex molecules are noeasily found by the present parameter estimation rules. Cculated logKoc values are compared with the experimenvalues for 11 compounds. The average difference is 0.36units, which is the same as the standard error of estimobtained from the LSER model.
12.6. Prediction from Vapor Sorption „LSC…
The sorption of compounds in vapor phase onto thevadose-zone soil HA is measured with a static sorptchamber.363 Either water vapor or compound vapor are intrduced into the sorption chamber containing 10–15 mgvacuum-dried soil HA on an electrical microbalance23 °C. The mass of vapor sorbed to the HA is determinedthe increase in the weight of the soil sample at equilibriuThe corresponding vapor pressure of compound or watethe system is measured with a Baratron pressure gauge
The uptake of volatile compounds~mg g21! on soil HA ishighly linear over a wide range of relative pressure (P/P0),where P is the equilibrium partial pressure andP0 is thesaturation vapor pressure of the compound at the systemperature. Isotherms approachingP/P051 show a generasteep rise due to an induced vapor condensation ontoexterior surface of the humic sample. Extrapolating the linportion of the vapor phase isotherms atP/P051 the LSC isobtained. The values of LSC, converted to volume basising the density of the sorbed liquid, gives the values ofQha
0 s,which are strikingly similar among the relatively nonpolorganic liquids~the averageQha
0 value is 0.018 cm3 g21 ofhumic acid!. The relative invariance of LSCs suggestsmeans for assessing the sorption capacities of other relatinonpolar compounds on HA and, consequently, the cosponding capacities on soil OM, if the relative sorption efciency of HA and soil OM is known. The equation
Qom0 5KomSw ~75!
gives a means of calculating the limiting partition capacitythe solute on soil OM (Qom
0 ) knowing the partition coeffi-cient of the solute between soil OM and water (Kom) and thewater solubility of the solute (Sw). It has been demonstratethat the ratiosQom
0 /Qha0 for five compounds are fairly con
stant and their average value is about 2.3. This result sgests that the soil OM as a whole is about twice as effecas the HA isolated from soil OM in uptake of relativenonpolar organic compounds. Given thatQom
0 /Qha0 is ap-
J. Phys. Chem. Ref. Data, Vol. 30, No. 1, 2001

m
ro
lu
mesn
esntse
lum
ils
syoou
e-
r
rm-ercatagb
g
ol-les
neci-in
m-fer-re isres
x--
fi-
tra-sed.um
dorp-
for
andbut
ofencesbe-ed,
ing
ingsed
lcu--nt
as
252252 DELLE SITE
proximately 2, one can predict the approximateKom valuesfor other relatively nonpolar compounds from Eq.~75!. Fororganic liquids, the calculation is carried out first by assuing Qom
0 (cm3 g21)52Qha0 (cm3 g21) with Qha
0 being 0.018cm3 g21 and then convertingQom
0 (cm3 g21) to Qom0 (mg g21)
by using the liquid density of the compound. The same pcedure applies for solids except that theQha
0 (cm3 g21) valueis to be corrected for the melting point effect on solid sobility, that is, theQha
0 (cm3 g21) is to be multiplied by theactivity of the solid~in reference to its supercooled liquid! atthe system temperature, which is defined~see also Sec. 12.2!as
ln a52~DH f /R!@~Tm2T!/~TTm!#,
where a is the solid activity at the system temperatureT,DH f is the enthalpy of fusion of the solid,R is the gas con-stant, andTm is the melting point. TheQom
0 (mg g21) so cal-culated is then divided bySw to give the estimatedKom @Eq.~75!#. The Kom values estimated for a series of ten copounds with this procedure are only slightly greater, by lthan a factor of 2, than the literature observed values. Othe estimatedKom for p,p8-DDT is about four times as largas the observed value. This difference may be due to anificant reduction in solubility, other than the melting poieffect, in OM as the size of the organic compound increaIt is quite possible that the lower observedKom for DDTresults partly from an enhancement of the DDT water sobility by dissolved and suspended OM in soil–water systeThe small differences amongKom of the other compoundsmay be due to variations of OM composition between so
12.7. Prediction by Flory–Huggins Model „FH…
Chin and Weber206 applied a modified Flory–Hugginmodel~Sec. 12.2! in conjunction with solute aqueous activitcoefficients data to estimate the association of organic ctaminants to humic and other organic polymers in aquephase. They used an expression similar to that derivedChiou et al.55
logKd5 log~g iw!1 log~Vw /Vi!2 logr2~11x!/2.303,
~76!
whereg iw is the activity coefficient for the solute in the aqu
ous phase, Vw is the molar volume of water,Vi is the molarvolume of the target compound,r the density of the polymeadded to ultimately expressKd in terms of volume per unitmass, andx is the Flory parameter. Equation~76! was ap-plied to predict the equilibrium binding constants for 14 taget compounds in Aldrich or Fluka humic acid/water systeThe solubility parameters of ‘‘humic like’’ organic ‘‘surrogates’’ having well-defined physicochemical properties wused to calibrate the model. Predictions based on modelbrations to methyl salicylate agreed well with experimenvalues for the binding of the target compounds, exhibitinwide range of properties, to commercial humic acid sustrates. The predicted logKd values were converted to logKoc
ones; these logKocs agreed within less than 0.5 order of manitude with observed values for all cases studied.
J. Phys. Chem. Ref. Data, Vol. 30, No. 1, 2001
-
-
-
-sly
ig-
s.
-s.
.
n-s
by
-.
eli-la-
-
13. Analysis of the Data and Comments
13.1. Data Collection and Effects of theExperimental Procedure
The sorption coefficients in aqueous phase for organic plutants belonging to different classes are collected in Tab1–9 together with the sorbent characteristics@texture, or-ganic carbon~OC! content, cation exchange capacity~CE!,specific surface area~SA!, etc.# and the presence of salt ithe aqueous solution. When the presence of salt is not spfied, sorption coefficients are intended to be measureddistilled water. The last columns are concerned with teperature, experimental method adopted, and literature reence. When temperature is not specified, room temperatuassumed. Sorption data obtained with prediction proceduare also listed.
The first column contains the sorption coefficients, epressed as logKd (cm3 g21) or logKf values and their respective exponents (1/n).
Taking into account that the empirical Freundlich coefcientK f is equal toq whenC equals unity@Eqs.~4! and~5!#,its value depends on the units in which both the concention in sorbent and the concentration in water are expresThus, considering that most authors used the equilibriconcentration in sorbent,q in mg g21, and the equilibriumconcentration in water,C, in mg cm23, all otherK f data wereconverted tomg121/n cm3/n g21. This conversion appearenecessary to have a common basis of comparison of the stion data, especially when the values of 1/n were not veryclose to 1. As a matter of fact, it was found that, wheninstance theK fs were given on a molar basis~q in mmol kg21
and C in mmol dm23!149,158,403,643,668and 1/n was on theorder of 0.98 or 1.02, the difference between their valuesthose calculated on mass basis could be of few percent,became as large as more than 10% if 1/n was 0.90 or 1.10.Many otherK f data were obtained with a great varietydifferent q and C units which, when converted using thappropriate equation, sometimes showed sensible differeincreasing more and more by increasing the differencetween 1/n and 1. When such conversions were completonly the Freundlich data having the respective 1/n values inthe range of;0.9 and;1.1 were used to calculateKoc val-ues, taking into account that the error involved assumlinear isotherm was acceptable.87,105,562
In the second column the logKoc or logKdoc data~cm3 g21
of OC! are given as found in the literature or calculated usthe OC fraction in sorbents. Sorption coefficients expresasKom were transformed toKoc using the factor 1.724. Thesame factor was used to transform OM data to OC. Calated values for logKd or logKoc are indicated in square parentheses. Only the logKoc values obtained when the sorbeOC content was>0.1% were reported.
For single-point sorption data,Kd and Koc values werereported only if the equilibrium solution concentration w

0
253253SORPTION OF ORGANIC COMPOUNDS
TABLE 1. Sorption coefficients for monoaromatic hydrocarbons
log Kd
log Kf0
(1/n) log Koc
Sorbent composition~%!Other sorbent and solution data;
prediction procedureTemp.~°C! Meth. Ref.Sand Silt Clay OC
Benzene
20.86° 100 Montmorillonite~,0.125 mm! 22 BE 171~0.84! treated with H2O2
20.86° 100 Illite~,0.125 mm! treated with 22 BE 171~0.75! H2O2
21.58° 100 Kaolinite~,0.125 mm! treated 22 BE 171~0.98! with H2O2
1.73° 100 Montmorillonite-Al;pH 4.2; 25 BE 170~1.08! CE580 me/100 g0.61° 100 Montmorillonite-Ca; pH 6.6; 25 BE 170
~0.99! CE580 me/100 g1.00 @1.74# 18 Muck ~,1 mm! 22 GP 517
21.10 @1.31# 95.5 3.2 1.3 0.39 Eustis soil~,1 mm! MD 51720.15 1.58 49.8 30.7 19.4 1.84 Riddles soil top layer below corn
residue; pH 5.0; CE59.0 cmol/kg20 BE 605
20.54 1.49 49.8 26.0 24.2 0.94 Idem; below top layer; pH 5.3;CE518.3 cmol/kg
605
21.96 @0.58# 98 1 1 0.29 Borden soil; 0.01 N CaCl2 MD 6000.49 @1.39# 60.3 24.0 15.7 12.6 Mt. Lemmon soil; 0.01 N CaCl2 MD 6000.05° 1.63 1 31 2.6 Hastings soil; pH 5.6; 25 BE 17
~0.89! CE517 me/100 g0.08° 1.82 15 34 1.8 Overton soil; pH 7.8; 25 BE 170
~0.94! CE529 me/100 g21.12 1.58 97.3 2.2 0.5 0.2 Forest soil; pH 5.6;
CE50.48 me/100 gMD 344
20.02 1.64 65.2 25.6 9.2 2.2 Agricultural soil; pH 7.4;CE59.0 me/100 g
MD 344
0.30 1.73 69.5 20.5 10.1 3.7 Forest soil; pH 4.2;CE52.9 me/100 g
MD 344
20.09 1.74 1.49 Captina sil soil; pH 4.97;0.01 M CaNO3
BE 606
20.37 1.81 0.66 Mc Laurin sl soil; pH 4.43;0.01 M CaNO3
BE 606
20.24 @1.34# 56.6 22.0 21.4 5.18* Marlette soil~A horizon!; 20 BE 222,2.59 pH 6.4; CE516.4 me/100 g 223
0.89 @2.08# 10.0* Idem-HDTMA complex 222,6.48 223
0.68 @2.04# 7.43*4.37
Idem-DDTMA complex 222
1.22 @2.65# 4.85* Marlette soil~Bt horizon!- 20 BE 222,3.71 HDTMA complex 223
0.89 @2.59# 2.73*1.98
Idem-DDTMA complex 222
0.32 @2.25# 1.74*1.18
Idem-NTMA complex 222
1.20 @2.69# 4.38* St. Clair soil~Bt horizon!- 20 BE 2223.25 HDTMA complex
0.58 @2.66# 1.12* Oshtemo soil~Bt horizon!- 20 BE 2220.83 HDTMA complex
@20.46# @1.50# 9 68 21 1.9*@1.1#
Woodburn soil; CE514 me/100 g 20 BE 55
@1.32# @1.51# 64.0 Peat extracted with 0.1 M NaOH;0.005 M CaCl2
24 BE 229
@1.10# @1.34# 57.1 Peat; SA~N2)51.5 m2/g;0.005 M CaCl2
24 BE 229
@0.88# @1.16# 53.1 Houghton muck soil;SA~N2!50.8 m2/g;0.005 M CaCl2
24 BE 229
1.83 @2.62# 16.44 VSC; vermiculite-HDTMA; BE 22520.5* CE580 cmol/kg
1.59 @2.67# 8.46 1 Mt-1; illite-HDTMA; BE 22510.5* CE524 cmol/kg
J. Phys. Chem. Ref. Data, Vol. 30, No. 1, 2001

254254 DELLE SITE
TABLE 1. Sorption coefficients for monoaromatic hydrocarbons—Continued
log Kd
log Kf0
(1/n) log Koc
Sorbent composition~%!Other sorbent and solution data;
prediction procedureTemp.~°C! Meth. Ref.Sand Silt Clay OC
2.26 @2.91# 23.00 SAz-1; smectite~high-charge!- BE 22528.7* HDTMA; CE5130 cmol/kg
2.09 @2.78# 20.60 SWa-1; smectite-HDTMA; BE 22525.7* CE5107 cmol/kg
1.72 @2.48# 17.46 SWy-1; smectite~low charge!- BE 22521.8* HDTMA; CE587 cmol/kg
1.77 @2.52# 18.15 SAC; smectite~low-charge!- BE 22522.6* HDTMA; CE590 cmol/kg
0.48 @2.44# 0.94 KGa-2; kaolinite-HDTMA; BE 2251.17* CE54 cmol/kg
@0.10# 44.4 Cellulose; SA~N2!52.3 m2/g0.005 M CaCl2
24 BE 229
1.79 @2.55# 21.6*17.3
HDTMA-smectite complex BE 224
1.71 @2.59# 16.2*13.0
Idem 224
0.96 @2.11# 8.9*7.1
Idem 224
20.33 @1.89# 91 8 1 0.6 Aquifer material LE 42821.05 95 3 2 0.071 Allerod-1 aquifer material~a. m.!;
SA51.7 m2/gBE 208
20.92 96 4 0 0.048 Allerod-2 a.m.; SA~N2!52.0 m2/g BE 20821.40 98 2 0 0.020 Borris a.m.; SA~N2!50.3 m2/g21.30 97 2 1 0.010 Brande-1 a.m.; SA~N2!51.7 m2/g BE 20821.15 97 2 1 0.020 Brande-2 a.m. BE 20820.52 @2.15# 97 2 0 0.213 Finderup-2 a.m.; SA~N2!52.5 m2/g BE 20821.40 99 0 1 0.009 Gunderup-1 a.m.; SA~N2!51.0 m2/g BE 20821.00 96 4 0 0.021 Gunderup-2 a.m.; SA~N2!52.5 m2/g BE 20820.19 @2.48# 98 2 0 0.213 Herborg a.m.; SA~N2!50.5 m2/g BE 20820.89 99 0 1 0.016 Rabis a.m.; SA~N2!50.4 m2/g BE 20820.92 96 2 3 0.048 Tirstrup-1 a.m.; SA~N2!53.3 m2/g BE 20820.96 97 0 2 0.035 Tirstrup-2 a.m.; SA~N2!51.9 m2/g BE 20820.74 @2.05# 94 2 4 0.159 Tylstrup a.m.; SA~N2!53.3 m2/g BE 20821.22 97 2 1 0.012 Vasby a.m.; SA~N2!50.8 m2/g BE 20821.15 98 1 1 0.029 Vejen-1 a.m.; SA~N2!51.7 m2/g BE 20820.72 98 0 3 0.032 Vejen-2 a.m.; SA~N2!52.6 m2/g BE 20821.30 99 0 1 0.006 Vorbasse-1 a.m.; SA~N2!51.8 m2/g BE 20821.30 98 2 0 0.007 Vorbasse-2 a.m.; SA~N2!50.3 m2/g BE 20820.64 @2.28# 98 1 1 0.122 Vorbasse-3 a.m.; SA~N2!50.1 m2/g BE 208
1.92av 2.78, Coarse si fractions of Doe Run 25 BE 1083.27 and Hickory Hill sediments
0.02 @1.42# 4.02 Tamar estuary sediment~,60 mm! BE 1282.96 Estuarine colloids~Chesapeake
Bay! 42.0 mg/l20 BE 399
1.78av 7– 1– 0.11– 17 sediments and soils 25 BE 9675.6 69.1 2.38
1.92 Soil; experimental~literature! 2171.82, Humic acid-silica column 20–23 RPLC 584,1.87 5851.57 Humic acid-silica column 20–23 RPLC 5871.62 Salicylic acid-silica column 20–23 RPLC 5871.74 8-Hydroxyquinoline-silica column 20–23 RPLC 5871.82 C18 column; correlation logKoc-
(log k81D0x)RPLC 577
1.84 C18 column; correlation logKoc-~log k81hydrogen bonding index!
RPLC 577
1.72 Correlation logKoc– logKow 961.90 Correlation logKoc– logKow 1082.01 Correlation logKoc– logKow 2071.85 Correlation logKoc– logS 5641.82 Correlation logKoc– logS 961.72 Correlation logKoc– logS~mp! 96
@2.33# Correlation logKom–MCI 591
J. Phys. Chem. Ref. Data, Vol. 30, No. 1, 2001

255255SORPTION OF ORGANIC COMPOUNDS
TABLE 1. Sorption coefficients for monoaromatic hydrocarbons—Continued
log Kd
log Kf0
(1/n) log Koc
Sorbent composition~%!Other sorbent and solution data;
prediction procedureTemp.~°C! Meth. Ref.Sand Silt Clay OC
1.71 Correlation logkoc–CRI 6011.60 Correlation logkoc–LSER 602
Toluene20.72° 100 Montmorillonite~,0.125 mm! 22 BE 171~0.79! treated with H2O2
20.87° 100 Illite~,0.125 mm! treated with 22 BE 171~0.76! H2O2
20.94° 100 Kaolinite~,0.125 mm! treated 22 BE 171~0.90! with H2O2
21.30 @1.59# 97.1 2.3 0.6 0.13 Tampa aquifer; pH 8;0.01 N CaCl2
MD 521
20.70 @1.71# 95.5 3.2 1.3 0.39 Eustis soil; 0.01 N CaCl2 MD 52220.36 2.28 0.23 Offutt AFB soil~11-13 ft. depth! 25 HS 19320.50 1.89 0.41 Whiteman AFB soil~3–4.7 ft. depth! 25 HS 193
1.05 2.18 7.51 Sapsucker Woods~SW! soil 25 HS 1941.06 2.21 7.05 SW soil, ethyl ether extracted 25 HS 1940.37 2.43 0.88 SW soil humin 25 HS 1941.00 1.91 12.4 SWsoil humic acid 25 HS 1940.41 1.13 19.2 SW soil fulvic acid 25 HS 1940.89 1.19 50.5 Tannic acid 25 HS 1941.99 2.18 64.6 Lignin 25 HS 1941.85 2.09 57.2 Zein 25 HS 194
21.7 21.3 45.3 Cellulose 25 HS 1941.63 1.95 47.9 Aldrich humic acid 25 HS 194
21.80 @0.74# 98 1 1 0.29 Borden soil; 0.01 N CaCl2 MD 6000.75 @1.65# 60.3 24.0 15.7 12.6 Mt. Lemmon soil; 0.01 N CaCl2 MD 600
@20.85# 92 5.9 2.1 0.09 Lincoln soil; fine sand; pH 6.4;CE53.5 me/100g
20 LE 541
20.43 @2.39# 0.15 KB 1H soil~63–125mm!;SA~N2!54.9 m2/g
20 LE 207
20.21 @2.01# 91 8 1 0.6 Aquifer material LE 42820.96 1.74 97.3 2.2 0.5 0.2 Forest soil; pH 5.6;
CE50.48 me/100 gMD 344
0.32 1.98 65.2 25.6 9.2 2.2 Agricultural soil; pH 7.4;CE59.0 me/100 g
MD 344
0.69 2.13 69.5 20.5 10.1 3.7 Forest soil; pH 4.2;CE52.9 me/100 g
MD 344
0.40 2.22 1.49 Captina sil soil; pH 4.97;0.01 M CaNO3
BE 606
20.02 2.16 0.66 Mc Laurin sl soil; pH 4.43;0.01 M CaNO3
BE 606
0.11 @1.70# 56.6 22.0 21.4 5.18* Marlette soil~A horizon!; 20 BE 2222.59 pH 6.4; CE516.4 me/100 g
1.31 @2.50# 10.0*6.48
Idem-HDTMA complex 222
1.03 @2.39# 7.43*4.37
Idem-DDTMA complex 222
1.43 @2.86# 4.85* Marlette soil~Bt horizon!- 20 BE 2223.71 HDTMA complex
1.16 @2.86# 2.73*1.98
Idem-DDTMA complex 222
0.52 @2.45# 1.74*1.18
Idem-NTMA complex 222
20.77 @1.59# 21.0 34.9 44.1 0.88* St. Clair soil~Bt horizon!; 20 BE 2220.44 pH 6.72; CE518.3 me/100 g
1.54 @3.03# 4.38*3.25
Idem-HDTMA complex 222
0.82 @2.90# 1.12* Oshtemo soil~Bt horizon!- 20 BE 2220.83 HDTMA complex
2.23 @3.02# 16.44 VSC; vermiculite-HDTMA; BE 22520.5* CE580 cmol/kg
1.89 @2.96# 8.46 IM t-1; illite-HDTMA; BE 225
J. Phys. Chem. Ref. Data, Vol. 30, No. 1, 2001

256256 DELLE SITE
TABLE 1. Sorption coefficients for monoaromatic hydrocarbons—Continued
log Kd
log Kf0
(1/n) log Koc
Sorbent composition~%!Other sorbent and solution data;
prediction procedureTemp.~°C! Meth. Ref.Sand Silt Clay OC
10.5* CE524 cmol/kg2.50 @3.15# 23.00 SAz-1; smectite~high-charge!- BE 225
28.7* HDTMA; CE5130 cmol/kg2.29 @2.98# 20.60 SWa-1; smectite-HDTMA; BE 225
25.7* CE5107 cmol/kg1.87 @2.63# 17.46 SWy-1; smectite~low charge!- BE 225
21.8* HDTMA; CE587 cmol/kg1.85 @2.60# 18.15 SAC; smectite~low-charge!- BE 225
22.6* HDTMA; CE590 cmol/kg0.85 @2.86# 0.94 KGa-2; kaolinite-HDTMA; BE 225
1.17* CE54 cmol/kg0.60 @2.00# 4.02 Tamar estuary sediment~,60 mm! BE 128
2.34 50.2 Aldrich and Fluka humic acid;predicted~Flory–Huggins Model!
206
1.80 2.27 33.5 ICN humic acid 25 HS 19320.40 1.87 0.54 ICN humic acid coated Al2O3 25 HS 193
2.10, Humic acid-silica column 20–23 RPLC 584,2.26 5852.21 Humic acid-silica column 20–23 RPLC 5872.31 Salicylic acid-silica column 20–23 RPLC 5872.21 8-Hydroxyquinoline-silica column 20–23 RPLC 587
@2.02# 58.0 Prediction by limiting vaporsorption on soil humic acid
23 LSC 363
2.17 C18 column; correlation logKoc-(log k81D0x)
RPLC 577
2.18 C18 column; correlation logKoc-~log k81hydrogen bonding index!
RPLC 577
1.93 Correlation logKoc– logS(180) 1932.43 Correlation logKoc– logKow (207) 1932.49 Correlation logKoc– logKow (108) 1932.32 Correlation logKoc– MCI 5972.09 Correlation logKoc– LSER 602
o-Xylene
21.16° 100 Montmorillonite~,0.125 mm! 22 BE 171~1.08! treated with H2O2
21.02° 100 Illite~,0.125 mm! treated with 22 BE 171~0.88! H2O2
21.18° 100 Kaolinite~,0.125 mm! treated 22 BE 171~0.99! with H2O2
20.68 @1.73# 95.5 3.2 1.3 0.39 Eustis soil; 0.01 N CaCl2 MD [email protected]# @2.33# 1.01 Narragansett sil soil BE 6070.95 @2.35# 4.02 Tamar estuary sediment~,60 mm! BE 128
20.60 .98 0.007 Rabis aquifer mat. 10 MD 1662.40, Humic acid-silica column 20–23 RPLC 584,2.37 5852.36 Humic acid-silica column 20–23 RPLC 5872.65 Salicylic acid-silica column 20–23 RPLC 5872.65 8-Hydroxyquinoline-silica column 20–23 RPLC 5872.73 Cyanopropyl column 20–25 RPLC 5792.45 C18 column; correlation logKoc-
(log k81D0x)RPLC 577
2.45 C18 column; correlation logKoc-~log k81hydrogen bonding index!
RPLC 577
2.65 Correlation logKoc– MCI 598
m-Xylene
20.90° 100 Montmorillonite~,0.125 mm! 22 BE 171~0.90! treated with H2O2
20.88° 100 Illite~,0.125 mm! treated with 22 BE 171~0.92! H2O2
21.46° 100 Kaolinite~,0.125 mm! treated 22 BE 171~1.08! with H2O2
J. Phys. Chem. Ref. Data, Vol. 30, No. 1, 2001

257257SORPTION OF ORGANIC COMPOUNDS
TABLE 1. Sorption coefficients for monoaromatic hydrocarbons—Continued
log Kd
log Kf0
(1/n) log Koc
Sorbent composition~%!Other sorbent and solution data;
prediction procedureTemp.~°C! Meth. Ref.Sand Silt Clay OC
@0.32# @2.32# 1.01 Narragansett sl soil BE 60721.31 @1.23# 98 1 1 0.29 Borden soil; 0.01 N CaCl2 MD 60020.60 2.11 97.3 2.2 0.5 0.2 Forest soil; pH 5.6;
CE54.8 me/100 gMD 344
0.54 2.20 65.2 25.6 9.2 2.2 Agricultural soil; pH 7.4;CE590 me/100 g
MD 344
1.03 2.46 69.5 20.5 10.1 3.7 Forest soil; pH 4.2;CE529 me/100 g
MD 344
2.62 C18 column; correlation logKoc-(log k81D0x)
RPLC 577
2.63 C18 column; correlation logKoc-~log k81hydrogen bonding index!
RPLC 577
2.53 Correlation logKoc– MCI 5972.48 Correlation logKoc– LSER 602
p-Xylene
21.15° 100 Montmorillonite~,0.125 mm! 22 BE 171~0.79! treated with H2O2
21.10° 100 Illite~,0.125 mm! treated with 22 BE 171~0.78! H2O2
21.49° 100 Kaolinite~,0.125 mm! treated 22 BE 171~1.07! with H2O2
20.31 @2.09# 95.5 3.2 1.3 0.39 Eustis soil; 0.01 N CaCl2 MD 5220.49 1.87 55.0 20.0 25.0 4.14 Webster soil; SA~N2!52.6 m2/g;
0.01 N CaCl2
BE 375
0.01 2.66 55.0 20.0 25.0 0.23 Webster soil, oxidized with H2O2 ;SA~N2!533.0 m2/g; 0.01 N CaCl2
BE 375
@0.32# @2.32# 1.01 Narragansett sil soil BE 6070.90 2.72 1.49 Captina sil soil; pH 4.97;
0.01 M CaNO3
BE 606
0.21 2.39 0.66 Mc Laurin sl soil; pH 4.43;0.01 M CaNO3
BE 606
0.02 @2.24# 91 8 1 0.6 Aquifer material LE 42821.07 52.3 41.5 6.2 0.03 Barksdale aquifer; 0.005 M CaSO4 MD 51920.85 @2.03# 97.1 2.3 0.6 0.13 Tampa aquifer; pH 8;
0.01 N CaCl2
MD 521
20.64 96 0.025 Borden aquifer; SA~N2!50.3 m2/g 22 HS 52020.32 93 0.034 Lula aquifer; SA~N2!57.7 m2/g 22 HS 52020.30 @2.52# 0.15 KB 1 H soil ~63–125mm! 20
SA54.9 m2/gLE 207
1.02 @2.42# 4.02 Tamar estuary sediment~,60 mm! BE 1282.43 C18 column; correlation logKoc-
(log k81D0x)RPLC 577
2.44 C18 column; correlation logKoc-~log k81hydrogen bonding index!
RPLC 577
2.65 Correlation logKoc– MCI 5782.53 Correlation logKoc– MCI 5972.49 Correlation logKoc– LSER 602
1,2,3-Trimethylbenzene
20.02 @2.80# 0.15 KB 1H soil~63–125mm!SA54.9 m2/g
20 LE 207
2.89 Correlation logKoc– MCI 5782.77 Correlation logKoc– MCI 5972.97 Correlation logKoc– LSER 602
1,2,4-Trimethylbenzene
20.51 @1.90# 95.5 3.2 1.3 0.39 Eustis soil; 0.01 N CaCl2 MD 522
1,3,5-Trimethylbenzene
0.00 2.82 0.15 KB 1H soil~63–125mm!SA~N2!54.9 m2/g
20 LE 207
2.85 Correlation logKoc– MCI 578
J. Phys. Chem. Ref. Data, Vol. 30, No. 1, 2001
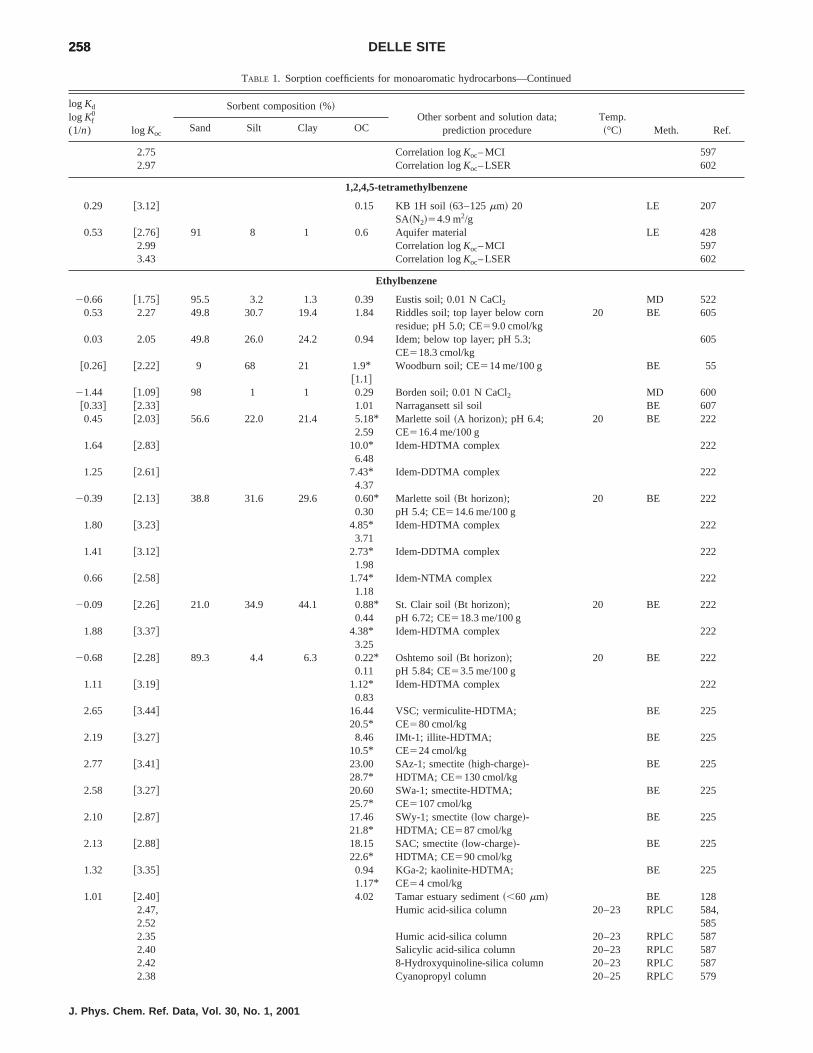
258258 DELLE SITE
TABLE 1. Sorption coefficients for monoaromatic hydrocarbons—Continued
log Kd
log Kf0
(1/n) log Koc
Sorbent composition~%!Other sorbent and solution data;
prediction procedureTemp.~°C! Meth. Ref.Sand Silt Clay OC
2.75 Correlation logKoc– MCI 5972.97 Correlation logKoc– LSER 602
1,2,4,5-tetramethylbenzene
0.29 @3.12# 0.15 KB 1H soil~63–125mm! 20SA~N2!54.9 m2/g
LE 207
0.53 @2.76# 91 8 1 0.6 Aquifer material LE 4282.99 Correlation logKoc– MCI 5973.43 Correlation logKoc– LSER 602
Ethylbenzene
20.66 @1.75# 95.5 3.2 1.3 0.39 Eustis soil; 0.01 N CaCl2 MD 5220.53 2.27 49.8 30.7 19.4 1.84 Riddles soil; top layer below corn
residue; pH 5.0; CE59.0 cmol/kg20 BE 605
0.03 2.05 49.8 26.0 24.2 0.94 Idem; below top layer; pH 5.3;CE518.3 cmol/kg
605
@0.26# @2.22# 9 68 21 1.9*@1.1#
Woodburn soil; CE514 me/100 g BE 55
21.44 @1.09# 98 1 1 0.29 Borden soil; 0.01 N CaCl2 MD [email protected]# @2.33# 1.01 Narragansett sil soil BE 6070.45 @2.03# 56.6 22.0 21.4 5.18* Marlette soil~A horizon!; pH 6.4; 20 BE 222
2.59 CE516.4 me/100 g1.64 @2.83# 10.0*
6.48Idem-HDTMA complex 222
1.25 @2.61# 7.43*4.37
Idem-DDTMA complex 222
20.39 @2.13# 38.8 31.6 29.6 0.60* Marlette soil~Bt horizon!; 20 BE 2220.30 pH 5.4; CE514.6 me/100 g
1.80 @3.23# 4.85*3.71
Idem-HDTMA complex 222
1.41 @3.12# 2.73*1.98
Idem-DDTMA complex 222
0.66 @2.58# 1.74*1.18
Idem-NTMA complex 222
20.09 @2.26# 21.0 34.9 44.1 0.88* St. Clair soil~Bt horizon!; 20 BE 2220.44 pH 6.72; CE518.3 me/100 g
1.88 @3.37# 4.38*3.25
Idem-HDTMA complex 222
20.68 @2.28# 89.3 4.4 6.3 0.22* Oshtemo soil~Bt horizon!; 20 BE 2220.11 pH 5.84; CE53.5 me/100 g
1.11 @3.19# 1.12*0.83
Idem-HDTMA complex 222
2.65 @3.44# 16.44 VSC; vermiculite-HDTMA; BE 22520.5* CE580 cmol/kg
2.19 @3.27# 8.46 IMt-1; illite-HDTMA; BE 22510.5* CE524 cmol/kg
2.77 @3.41# 23.00 SAz-1; smectite~high-charge!- BE 22528.7* HDTMA; CE5130 cmol/kg
2.58 @3.27# 20.60 SWa-1; smectite-HDTMA; BE 22525.7* CE5107 cmol/kg
2.10 @2.87# 17.46 SWy-1; smectite~low charge!- BE 22521.8* HDTMA; CE587 cmol/kg
2.13 @2.88# 18.15 SAC; smectite~low-charge!- BE 22522.6* HDTMA; CE590 cmol/kg
1.32 @3.35# 0.94 KGa-2; kaolinite-HDTMA; BE 2251.17* CE54 cmol/kg
1.01 @2.40# 4.02 Tamar estuary sediment~,60 mm! BE 1282.47, Humic acid-silica column 20–23 RPLC 584,2.52 5852.35 Humic acid-silica column 20–23 RPLC 5872.40 Salicylic acid-silica column 20–23 RPLC 5872.42 8-Hydroxyquinoline-silica column 20–23 RPLC 5872.38 Cyanopropyl column 20–25 RPLC 579
J. Phys. Chem. Ref. Data, Vol. 30, No. 1, 2001

259259SORPTION OF ORGANIC COMPOUNDS
TABLE 1. Sorption coefficients for monoaromatic hydrocarbons—Continued
log Kd
log Kf0
(1/n) log Koc
Sorbent composition~%!Other sorbent and solution data;
prediction procedureTemp.~°C! Meth. Ref.Sand Silt Clay OC
2.51 C18 column; correlation logKoc-(log k81D0x)
RPLC 577
2.51 C18 column; correlation logKoc-~log k81hydrogen bonding index!
RPLC 577
@2.55# 58.0 Prediction by limiting vaporsorption on soil humic acid
23 LSC 363
@2.85# Correlation logKom– MCI 591
n-Propylbenzene
20.48 @1.93# 95.5 3.2 1.3 0.39 Eustis soil; 0.01 N CaCl2 MD 52220.92 @1.62# 98 1 1 0.29 Borden soil; 0.01 N CaCl2 MD 600
3.21 @4.00# 16.44 VSC; vermiculite-HDTMA; BE 22520.5* CE580 cmol/kg
3.15 @3.79# 23.00 SAz-1; smectite~high-charge!- BE 22528.7* HDTMA; CE5130 cmol/kg
2.96 @3.65# 20.60 SWa-1; smectite-HDTMA; BE 22525.7* CE5107 cmol/kg
2.52 @3.28# 17.46 SWy-1; smectite~low charge!- BE 22521.8* HDTMA; CE587 cmol/kg
2.60 @3.34# 18.15 SAC; smectite~low-charge!- BE 22522.6* HDTMA; CE590 cmol/kg
1.47 @2.87# 4.02 Tamar estuary sediment~,60 mm! BE 1282.98, Humic acid-silica column 20–23 RPLC 584,2.83 5852.81 Humic acid-silica column 20–23 RPLC 5872.84 Salicylic acid-silica column 20–23 RPLC 5872.87 8-Hydroxyquinoline-silica column 20–23 RPLC 5872.98 Correlation logKoc– MCI 598
n-Butylbenzene
20.38 @2.03# 95.5 3.2 1.3 0.39 Eustis soil; 0.01 N CaCl2 MD 52220.21 @2.32# 98 1 1 0.29 Borden soil; 0.01 N CaCl2 MD 600
0.57 @3.39# 0.15 KB 1H soil~63–125mm!SA54.9 m2/g
20 LE 207
3.41 @4.20# 16.44 VSC; vermiculite-HDTMA; BE 22520.5* CE580 cmol/kg
3.01 @3.78# 17.46 SWy-1; smectite~low charge!- BE 22521.8* HDTMA; CE587 cmol/kg
2.00 @3.40# 4.02 Tamar estuary sediment~,60 mm! BE 1283.32, Humic acid-silica column 20–23 RPLC 584,3.15 5853.35 Humic acid-silica column 20–23 RPLC 5873.38 Salicylic acid-silica column 20–23 RPLC 5873.39 8-Hydroxyquinoline-silica column 20–23 RPLC 5873.51 Cyanopropyl column 20–25 RPLC 5793.25 Correlation logKoc– MCI 5783.16 Correlation logKoc– MCI 5973.53 Correlation logKoc– LSER 602
sec-Buthylbenzene
0.49 @2.71# 91 8 1 0.6 Aquifer material LE 428
3-Ethyltoluene
0.20 @2.42# 91 8 1 0.6 Aquifer material LE 428
Nitrobenzene
0.74° 2.32 4 7 2.58 Gribskov soil; B-hor.; pH 3.59; 5 BE 131~0.90! CE59.6 me/100 g; 0.01 M CaCl2
0.64° 2.23 4 7 2.58 Gribskov soil; B-hor.; pH 3.59; 21 BE 131~0.92! CE59.6 me/100 g; 0.01 M CaCl2
0.49° 3 5 1.82 Gribskov soil; C hor.; pH 4.07; 5 BE 131~0.82! CE57.0 me/100 g; 0.01 M CaCl2
0.83° 3 5 1.82 Gribskov soil; C hor.; pH 4.07; 21 BE 131
J. Phys. Chem. Ref. Data, Vol. 30, No. 1, 2001

260260 DELLE SITE
TABLE 1. Sorption coefficients for monoaromatic hydrocarbons—Continued
log Kd
log Kf0
(1/n) log Koc
Sorbent composition~%!Other sorbent and solution data;
prediction procedureTemp.~°C! Meth. Ref.Sand Silt Clay OC
~0.66! CE57.0 me/100 g; 0.01 M CaCl2
21.54° 0.12 Delta soil; pH 5; BE 91~0.86! CE55.0 me/100 g; 0.01 N CaSO4
20.77 @2.15# Idem 9120.66° 1.14 Ann Arbor soil; pH 8; BE 91~0.73! CE56.9 me/100 g; 0.01 N CaSO40.83 @2.77# Idem 91
21.21 1.49 97.3 2.2 0.5 0.2 Forest soil; pH 5.6;CE54.8 me/100 g
MD 344
0.29 1.95 65.2 25.6 9.2 2.2 Agricultural soil; pH 7.4;CE590 me/100 g
MD 344
0.58 2.01 69.5 20.5 10.1 3.7 Forest soil; pH 4.2;CE529 me/100 g
MD 344
@0.16# 92 5.9 2.1 0.09 Lincoln fine s soil; pH 6.4;CE53.5 me/100 g
20 MD 541
0.12 1.95 1.49 Captina sil soil; pH 4.97;0.01 M CaNO3
BE 606
20.16 2.02 0.66 Mc Laurin sl soil; pH 4.43;0.01 M CaNO3
BE 606
@1.94#av 1.09* –4.25* 4 arable sil soils; 20 BE 1202.05 Humic acid-silica column 20–23 RPLC 5872.16 Salicylic acid-silica column 20–23 RPLC 5872.15 8-Hydroxyquinoline-silica column 20–23 RPLC 5871.99 C18 column; correlation logKoc -
(log k81D0x)RPLC 577
1.84 C18 column; correlation logKoc -(log k81hydrogen bonding index!
RPLC 577
1.85 Correlation logKoc– logS 5642.17 Correlation logKoc – MCI 5781.85 Correlation logKoc– LSER 602
Values in square parentheses have been calculated by the author.*% OM content.av: average value.Idem refers to the sorbent reported just above; only the data~texture, OC, temperature, method! which were changed are specified.
J. Phys. Chem. Ref. Data, Vol. 30, No. 1, 2001

2
1
1
1
1
1
1
1
261261SORPTION OF ORGANIC COMPOUNDS
TABLE 2. Sorption coefficients for polyaromatic hydrocarbons~PAHs!
log Kd
log Kf0
(1/n) log Koc
Sorbent composition~%!Other sorbent and solution data;
prediction procedureTemp.~°C! Meth. Ref.Sand Silt Clay OC
Naphthalene
1.16 3.29 0.74 Eustis soil~,250 mm!; Kd BE, 457extrapolated from logKd– f c plots~methanol-water!; 0.01 M CaCl2
MD
20.03 @2.38# 96.4 1.8 1.8 0.39 Eustis soil; 0.01 N CaCl2 MD 5260.90 @2.61# 1.94 Hagerstown sil soil;
0.01 N CaCl2
23 BE 454
0.93 @2.48# 2.85 Berkeley sil soil; 0.01 N CaCl2 23 BE 4540.30 @2.60# 0.50 Tifton s soil; 0.01 N CaCl2 23 BE 454
21.31 @1.23# 98 1 1 0.29 Borden soil; 0.01 N CaCl2 MD 6002.58 @3.48# 60.3 24.0 15.7 12.6 Mt. Lemmon soil; 0.01 N CaCl2 MD 6001.42 3.21 1.6 Menlo Park soil; pH 5.7;
0.01 M CaSO4
15 LE 132
1.36 3.15 Idem 25 BE,LE
132
1.30 3.10 Idem 35 LE 1321.20 3.00 Idem 50 LE 1320.38 2.76 0.42 Eustis s soil; pH 5.1; 25 BE, 13
CE51.8 me/100 g; 0.01 M CaSO4 LE0.80° 2.64 1.42 Soil; cl;~kaolinite!; 20 BE 214
~0.91! pH 5.91; CE512.4 me/100 g1.10° 1.51 Soil; light c;~montmorillonite!; 20 BE 214
~0.84! pH 5.18; CE513.2 me/100 g1.38° 3.23 Soil; light c;~montmorill.-illite!; 20 BE 214
~0.81! pH 5.26; CE528.3 me/100 g1.52° 7.91 Soil; sl;~allophane!; 20 BE 214
~0.79! pH 5.41; CE526.3 me/100 g1.75° 2.73 10.4 Soil; cl;~allophane!; 20 BE 214
~1.0! pH 4.89; CE535.0 me/100 g1.26° 6 3 1.41 Gribskov soil; A hor.; pH 3.23; 6 BE 131
~0.82! CE54.8 me/100 g; 0.01 M CaCl2
1.15° 4 7 2.58 Idem; B hor.; pH 3.59; 131~0.76! CE59.6 me/100 g; 0.01 M CaCl2
0.95° 3 5 1.82 Idem~C hor.!; pH 4.07; 131~0.84! CE57.0 me/100 g; 0.01 M CaCl2
1.48° 2.76 5 4 5.11 Strodam soil; AB hor.; pH 3.88; 6 BE 13~0.88! CE513.0 me/100 g; 0.01 M CaCl2
0.28° 3 3 0.09 Idem~C hor.!; pH 4.95; 131~0.73! CE51.6 me/100 g; 0.01 M CaCl2
0.38° 1 2 0.15 Tisvilde soil; C hor.; pH 4.21; 6 BE 131~0.57! CE51.3 me/100 g; 0.01 M CaCl2
1.15° 18 12 1.64 Roskilde soil; agric.; pH 5.40; 6 BE 13~0.84! CE514.0 me/100 g; 0.01 M CaCl2
20.49° 4 18 0.06 Esrum soil; subsurface; pH 4.71; 6 BE 13~0.77! CE59.1 me/100 g; 0.01 M CaCl2
20.04° 7 3 0.05 Tirstrup soil; subsurf.; pH 6.14; 6 BE 13~0.87! CE51.4 me/100 g; 0.01 M CaCl2
0.32° 34 41 0.13 Bjodstrup soil; subsurf.; pH 7.64; 6 BE 13~0.72! CE540.5 me/100 g; 0.01 M CaCl2
1.34° 3.50 0.69 Speyer soil 2.1~0.15–0.5 mm!; 22 BE 181~1.04! pH 7.02.79° 4.43 2.24 Speyer soil 2.2~0.15–0.5 mm!; 22 BE 181
~1.05! pH 5.81.26° 3.21 1.12 Speyer soil 2.3~0.15–0.5 mm!; 22 BE 181
~0.97! pH 7.10.99° 3.11 12.9 64.3 19.6 0.76 Alfisol; pH 7.45 22 BE 18
~0.88! LE1.20° 8.5 68.3 20.6 1.11 Entisol; pH 7.9 22 BE 18
~0.61!2.10° Cellulose 22 BE 181
~1.42!0.48 Silica gel 22 BE 181
J. Phys. Chem. Ref. Data, Vol. 30, No. 1, 2001
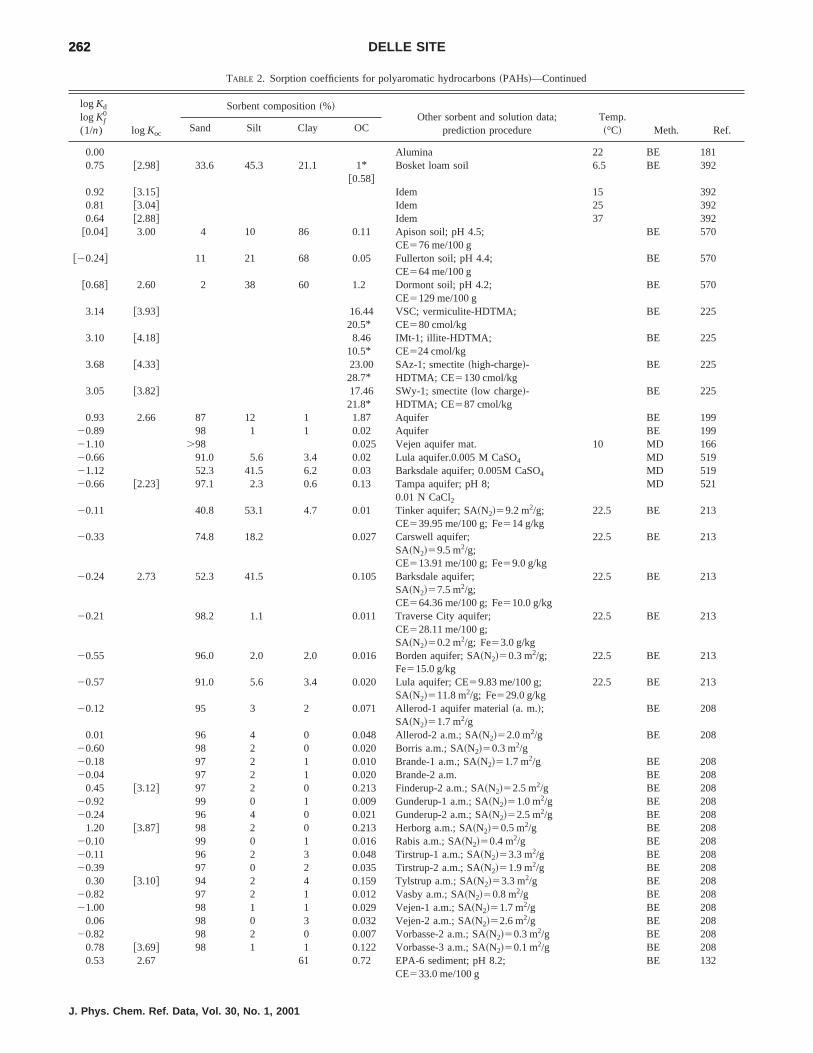
262262 DELLE SITE
TABLE 2. Sorption coefficients for polyaromatic hydrocarbons~PAHs!—Continued
log Kd
log Kf0
(1/n) log Koc
Sorbent composition~%!Other sorbent and solution data;
prediction procedureTemp.~°C! Meth. Ref.Sand Silt Clay OC
0.00 Alumina 22 BE 1810.75 @2.98# 33.6 45.3 21.1 1*
@0.58#Bosket loam soil 6.5 BE 392
0.92 @3.15# Idem 15 3920.81 @3.04# Idem 25 3920.64 @2.88# Idem 37 392
@0.04# 3.00 4 10 86 0.11 Apison soil; pH 4.5;CE576 me/100 g
BE 570
@20.24# 11 21 68 0.05 Fullerton soil; pH 4.4;CE564 me/100 g
BE 570
@0.68# 2.60 2 38 60 1.2 Dormont soil; pH 4.2;CE5129 me/100 g
BE 570
3.14 @3.93# 16.4420.5*
VSC; vermiculite-HDTMA;CE580 cmol/kg
BE 225
3.10 @4.18# 8.4610.5*
IMt-1; illite-HDTMA;CE524 cmol/kg
BE 225
3.68 @4.33# 23.0028.7*
SAz-1; smectite~high-charge!-HDTMA; CE5130 cmol/kg
BE 225
3.05 @3.82# 17.4621.8*
SWy-1; smectite~low charge!-HDTMA; CE587 cmol/kg
BE 225
0.93 2.66 87 12 1 1.87 Aquifer BE 19920.89 98 1 1 0.02 Aquifer BE 19921.10 .98 0.025 Vejen aquifer mat. 10 MD 16620.66 91.0 5.6 3.4 0.02 Lula aquifer.0.005 M CaSO4 MD 51921.12 52.3 41.5 6.2 0.03 Barksdale aquifer; 0.005M CaSO4 MD 51920.66 @2.23# 97.1 2.3 0.6 0.13 Tampa aquifer; pH 8;
0.01 N CaCl2
MD 521
20.11 40.8 53.1 4.7 0.01 Tinker aquifer; SA~N2!59.2 m2/g;CE539.95 me/100 g; Fe514 g/kg
22.5 BE 213
20.33 74.8 18.2 0.027 Carswell aquifer;SA~N2!59.5 m2/g;CE513.91 me/100 g; Fe59.0 g/kg
22.5 BE 213
20.24 2.73 52.3 41.5 0.105 Barksdale aquifer;SA~N2!57.5 m2/g;CE564.36 me/100 g; Fe510.0 g/kg
22.5 BE 213
20.21 98.2 1.1 0.011 Traverse City aquifer;CE528.11 me/100 g;SA~N2!50.2 m2/g; Fe53.0 g/kg
22.5 BE 213
20.55 96.0 2.0 2.0 0.016 Borden aquifer; SA~N2!50.3 m2/g;Fe515.0 g/kg
22.5 BE 213
20.57 91.0 5.6 3.4 0.020 Lula aquifer; CE59.83 me/100 g;SA~N2!511.8 m2/g; Fe529.0 g/kg
22.5 BE 213
20.12 95 3 2 0.071 Allerod-1 aquifer material~a. m.!;SA~N2!51.7 m2/g
BE 208
0.01 96 4 0 0.048 Allerod-2 a.m.; SA~N2!52.0 m2/g BE 20820.60 98 2 0 0.020 Borris a.m.; SA~N2!50.3 m2/g20.18 97 2 1 0.010 Brande-1 a.m.; SA~N2!51.7 m2/g BE 20820.04 97 2 1 0.020 Brande-2 a.m. BE 208
0.45 @3.12# 97 2 0 0.213 Finderup-2 a.m.; SA~N2!52.5 m2/g BE 20820.92 99 0 1 0.009 Gunderup-1 a.m.; SA~N2!51.0 m2/g BE 20820.24 96 4 0 0.021 Gunderup-2 a.m.; SA~N2!52.5 m2/g BE 208
1.20 @3.87# 98 2 0 0.213 Herborg a.m.; SA~N2!50.5 m2/g BE 20820.10 99 0 1 0.016 Rabis a.m.; SA~N2!50.4 m2/g BE 20820.11 96 2 3 0.048 Tirstrup-1 a.m.; SA~N2!53.3 m2/g BE 20820.39 97 0 2 0.035 Tirstrup-2 a.m.; SA~N2!51.9 m2/g BE 208
0.30 @3.10# 94 2 4 0.159 Tylstrup a.m.; SA~N2!53.3 m2/g BE 20820.82 97 2 1 0.012 Vasby a.m.; SA~N2!50.8 m2/g BE 20821.00 98 1 1 0.029 Vejen-1 a.m.; SA~N2!51.7 m2/g BE 208
0.06 98 0 3 0.032 Vejen-2 a.m.; SA~N2!52.6 m2/g BE 20820.82 98 2 0 0.007 Vorbasse-2 a.m.; SA~N2!50.3 m2/g BE 208
0.78 @3.69# 98 1 1 0.122 Vorbasse-3 a.m.; SA~N2!50.1 m2/g BE 2080.53 2.67 61 0.72 EPA-6 sediment; pH 8.2;
CE533.0 me/100 gBE 132
J. Phys. Chem. Ref. Data, Vol. 30, No. 1, 2001

263263SORPTION OF ORGANIC COMPOUNDS
TABLE 2. Sorption coefficients for polyaromatic hydrocarbons~PAHs!—Continued
log Kd
log Kf0
(1/n) log Koc
Sorbent composition~%!Other sorbent and solution data;
prediction procedureTemp.~°C! Meth. Ref.Sand Silt Clay OC
1.75 2.97 5.96 Idem modified by sorption of85 mg/g of poly~N,N-dimethylaminoethyl methacrylate!
132
1.30 3.12 1.6 42.91 55.4 1.5 Mississippi River sediment;pH 7.7; CE520.9 me/100 g
BE 151
1.53 @2.93# 4.02 Tamar estuary sediment~,60 mm! BE [email protected]# 3.3 2.9 Offshore Grand Haven sediment;
~solute complexation model!BE 464,
[email protected]# 3.5 3.8 Benton Harbor sediment;
~solute complexation model!BE 464,
4943.11 2.07 Lake Oostvaardersplassen sediment 25 BE 582.80 1.87 Lake Ketelmeer sediment 25 BE 58
3.04 3.59 28 Syntetic ‘‘sludge’’ of autoclavedyeast obtained by culturing bakers’yeast in sucrose solution
25 BE 608
2.18 27 Municipal sludge from Oak Ridgewastewater treatment plant
25 BE 608
2.88 14 Oily biosludge 913 from ORNL~4% oil content!
25 BE 608
3.56 25 Oily biosludge 969 from ORNL~14% oil content!
25 BE 608
3.35 33 Oily biosludge 972 from ORNL~24% oil content!
25 BE 608
3.78 Oil extracted from waste 972 25 BE [email protected]#av 1.09* –
4.25*5 soils; pH 6.1–7.5;0.01 M CaCl2
20 BE 120
3.11 Soil; experimental~literature data! 2172.94av 7–
75.61–
69.10.11–2.38
17 sediments and soils 25 BE 96
5.00av 3.38av 23 Brisbane River sediments FM 5443.11av 2.78,
3.27Coarse si fractions of Doe Runand Hickory Hill pond sediments
25 BE 108,
3.16,3.15
Humic acid-silica column 20–23 RPLC 584,585
3.16 Humic acid-silica column 20–23 RPLC 5873.05 Salicylic acid-silica column 20–23 RPLC 5873.06 8-Hydroxyquinoline-silica column 20–23 RPLC 587
@3.04# 50.2 Aldrich humic acid~2.5 mg C/l! 23 ED 4002.89 50.2 Aldrich and Fluka humic acid FH 2063.61 Estuarine colloids~Chesapeake
Bay! 43.3 mg/l20 BE 399
2.97 Correlation logKoc – logKow 963.15 Correlation logKoc – logKow 1082.91 Correlation logKoc – logKow 2072.81 Correlation logKoc – logS 5642.98 Correlation logKoc – logS 963.00 Correlation logKoc – logS~mp! 963.27 Correlation logKoc – MCI 578
@3.42# Correlation logKom – MCI 5913.11 Correlation logKoc – LSER 602
1-Methylnaphthalene
20.36 40.8 53.1 4.7 0.0096 Tinker aquifer; SA~N2!59.2 m2/g;CE539.95 me/100 g; Fe514 g/kg
22.5 BE 213,609
20.35 74.8 18.2 0.027 Carswell aquifer;SA~N2!59.5 m2/g;CE513.91 me/100 g; Fe59.0 g/kg
22.5 BE 213,609
20.02 2.96 52.3 41.5 0.105 Barksdale aquifer;SA~N2!57.5 m2/g;CE564.36 me/100 g;Fe510.0 g/kg
22.5 BE 213,609
J. Phys. Chem. Ref. Data, Vol. 30, No. 1, 2001
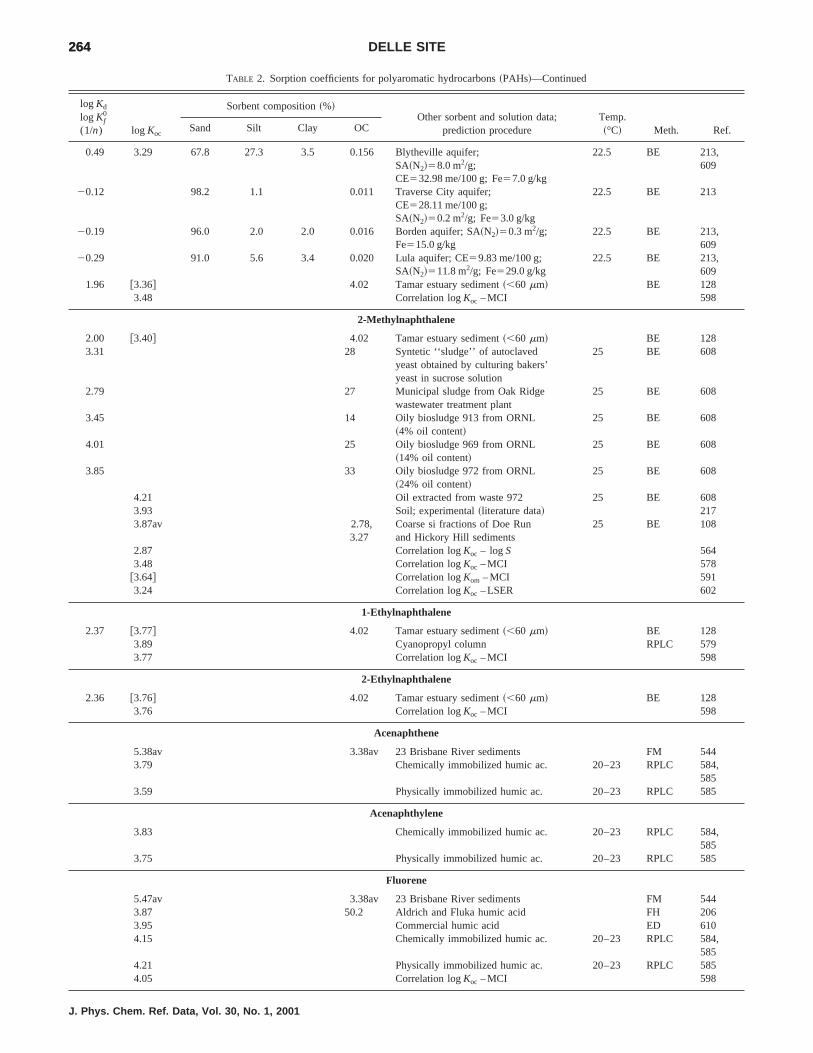
264264 DELLE SITE
TABLE 2. Sorption coefficients for polyaromatic hydrocarbons~PAHs!—Continued
log Kd
log Kf0
(1/n) log Koc
Sorbent composition~%!Other sorbent and solution data;
prediction procedureTemp.~°C! Meth. Ref.Sand Silt Clay OC
0.49 3.29 67.8 27.3 3.5 0.156 Blytheville aquifer;SA~N2!58.0 m2/g;CE532.98 me/100 g; Fe57.0 g/kg
22.5 BE 213,609
20.12 98.2 1.1 0.011 Traverse City aquifer;CE528.11 me/100 g;SA~N2!50.2 m2/g; Fe53.0 g/kg
22.5 BE 213
20.19 96.0 2.0 2.0 0.016 Borden aquifer; SA~N2!50.3 m2/g;Fe515.0 g/kg
22.5 BE 213,609
20.29 91.0 5.6 3.4 0.020 Lula aquifer; CE59.83 me/100 g;SA~N2!511.8 m2/g; Fe529.0 g/kg
22.5 BE 213,609
1.96 @3.36# 4.02 Tamar estuary sediment~,60 mm! BE 1283.48 Correlation logKoc – MCI 598
2-Methylnaphthalene
2.00 @3.40# 4.02 Tamar estuary sediment~,60 mm! BE 1283.31 28 Syntetic ‘‘sludge’’ of autoclaved
yeast obtained by culturing bakers’yeast in sucrose solution
25 BE 608
2.79 27 Municipal sludge from Oak Ridgewastewater treatment plant
25 BE 608
3.45 14 Oily biosludge 913 from ORNL~4% oil content!
25 BE 608
4.01 25 Oily biosludge 969 from ORNL~14% oil content!
25 BE 608
3.85 33 Oily biosludge 972 from ORNL~24% oil content!
25 BE 608
4.21 Oil extracted from waste 972 25 BE 6083.93 Soil; experimental~literature data! 2173.87av 2.78,
3.27Coarse si fractions of Doe Runand Hickory Hill sediments
25 BE 108
2.87 Correlation logKoc – logS 5643.48 Correlation logKoc – MCI 578
@3.64# Correlation logKom – MCI 5913.24 Correlation logKoc – LSER 602
1-Ethylnaphthalene
2.37 @3.77# 4.02 Tamar estuary sediment~,60 mm! BE 1283.89 Cyanopropyl column RPLC 5793.77 Correlation logKoc – MCI 598
2-Ethylnaphthalene
2.36 @3.76# 4.02 Tamar estuary sediment~,60 mm! BE 1283.76 Correlation logKoc – MCI 598
Acenaphthene
5.38av 3.38av 23 Brisbane River sediments FM 5443.79 Chemically immobilized humic ac. 20–23 RPLC 584,
5853.59 Physically immobilized humic ac. 20–23 RPLC 585
Acenaphthylene
3.83 Chemically immobilized humic ac. 20–23 RPLC 584,585
3.75 Physically immobilized humic ac. 20–23 RPLC 585
Fluorene
5.47av 3.38av 23 Brisbane River sediments FM 5443.87 50.2 Aldrich and Fluka humic acid FH 2063.95 Commercial humic acid ED 6104.15 Chemically immobilized humic ac. 20–23 RPLC 584,
5854.21 Physically immobilized humic ac. 20–23 RPLC 5854.05 Correlation logKoc – MCI 598
J. Phys. Chem. Ref. Data, Vol. 30, No. 1, 2001
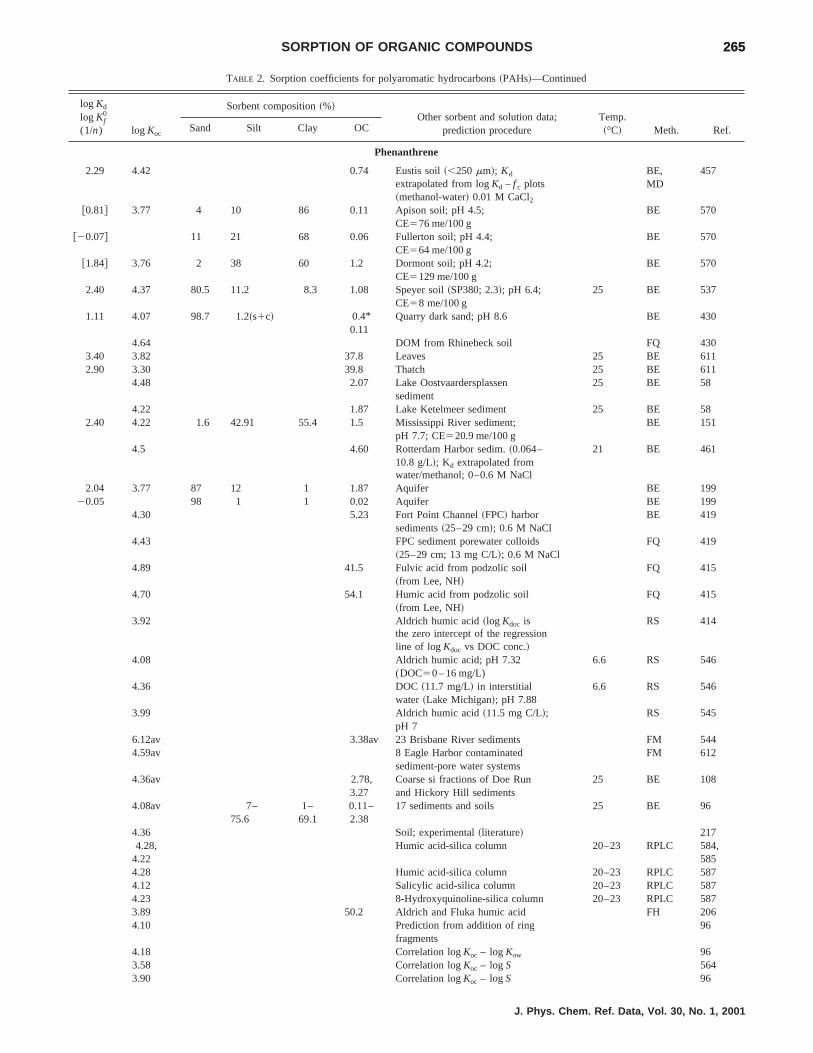
265265SORPTION OF ORGANIC COMPOUNDS
TABLE 2. Sorption coefficients for polyaromatic hydrocarbons~PAHs!—Continued
log Kd
log Kf0
(1/n) log Koc
Sorbent composition~%!Other sorbent and solution data;
prediction procedureTemp.~°C! Meth. Ref.Sand Silt Clay OC
Phenanthrene
2.29 4.42 0.74 Eustis soil~,250 mm!; Kd
extrapolated from logKd – f c plots~methanol-water! 0.01 M CaCl2
BE,MD
457
@0.81# 3.77 4 10 86 0.11 Apison soil; pH 4.5;CE576 me/100 g
BE 570
@20.07# 11 21 68 0.06 Fullerton soil; pH 4.4;CE564 me/100 g
BE 570
@1.84# 3.76 2 38 60 1.2 Dormont soil; pH 4.2;CE5129 me/100 g
BE 570
2.40 4.37 80.5 11.2 8.3 1.08 Speyer soil~SP380; 2.3!; pH 6.4;CE58 me/100 g
25 BE 537
1.11 4.07 98.7 1.2~s1c! 0.4*0.11
Quarry dark sand; pH 8.6 BE 430
4.64 DOM from Rhinebeck soil FQ 4303.40 3.82 37.8 Leaves 25 BE 6112.90 3.30 39.8 Thatch 25 BE 611
4.48 2.07 Lake Oostvaardersplassensediment
25 BE 58
4.22 1.87 Lake Ketelmeer sediment 25 BE 582.40 4.22 1.6 42.91 55.4 1.5 Mississippi River sediment;
pH 7.7; CE520.9 me/100 gBE 151
4.5 4.60 Rotterdam Harbor sedim.~0.064–10.8 g/L!; Kd extrapolated fromwater/methanol; 0–0.6 M NaCl
21 BE 461
2.04 3.77 87 12 1 1.87 Aquifer BE 19920.05 98 1 1 0.02 Aquifer BE 199
4.30 5.23 Fort Point Channel~FPC! harborsediments~25–29 cm!; 0.6 M NaCl
BE 419
4.43 FPC sediment porewater colloids~25–29 cm; 13 mg C/L!; 0.6 M NaCl
FQ 419
4.89 41.5 Fulvic acid from podzolic soil~from Lee, NH!
FQ 415
4.70 54.1 Humic acid from podzolic soil~from Lee, NH!
FQ 415
3.92 Aldrich humic acid~log Kdoc isthe zero intercept of the regressionline of logKdoc vs DOC conc.!
RS 414
4.08 Aldrich humic acid; pH 7.32(DOC50 – 16 mg/L)
6.6 RS 546
4.36 DOC~11.7 mg/L! in interstitialwater ~Lake Michigan!; pH 7.88
6.6 RS 546
3.99 Aldrich humic acid~11.5 mg C/L!;pH 7
RS 545
6.12av 3.38av 23 Brisbane River sediments FM 5444.59av 8 Eagle Harbor contaminated
sediment-pore water systemsFM 612
4.36av 2.78,3.27
Coarse si fractions of Doe Runand Hickory Hill sediments
25 BE 108
4.08av 7–75.6
1–69.1
0.11–2.38
17 sediments and soils 25 BE 96
4.36 Soil; experimental~literature! 2174.28,
4.22Humic acid-silica column 20–23 RPLC 584,
5854.28 Humic acid-silica column 20–23 RPLC 5874.12 Salicylic acid-silica column 20–23 RPLC 5874.23 8-Hydroxyquinoline-silica column 20–23 RPLC 5873.89 50.2 Aldrich and Fluka humic acid FH 2064.10 Prediction from addition of ring
fragments96
4.18 Correlation logKoc – logKow 963.58 Correlation logKoc – logS 5643.90 Correlation logKoc – logS 96
J. Phys. Chem. Ref. Data, Vol. 30, No. 1, 2001

266266 DELLE SITE
TABLE 2. Sorption coefficients for polyaromatic hydrocarbons~PAHs!—Continued
log Kd
log Kf0
(1/n) log Koc
Sorbent composition~%!Other sorbent and solution data;
prediction procedureTemp.~°C! Meth. Ref.Sand Silt Clay OC
4.22 Correlation logKoc – logS~mp! 964.32 Correlation logKoc – MCI 578
@4.51# Correlation logKom – MCI 5913.92 Correlation logKoc – LSER 602
Anthracene
1.53 @4.94# 96.4 1.8 1.8 0.39 Eustis soil; 0.01 N CaCl2 MD 5260.87 @3.41# 98 1 1 0.29 Borden soil; 0.01 N CaCl2 MD 6001.41 4.11 0.2 Fine sand soil; soil1dextran/
water systemMD 429
4.62 2.07 Lake Oostvaardersplassen sediment 25 BE 584.20 53.1 Fulvic acid from podzolic soil
~North Conway, NH!FQ 415
4.51 41.5 Fulvic acid from podzolic soil~Lee, NH!
FQ 415
4.72 38.2 Aldrich humic acid FQ 4154.57 54.1 Humic acid from podzolic soil
~Lee, NH!FQ 415
4.93 54.1 Idem FQ 4154.81 54.6 Humic acid from dark lignite soil FQ 4153.95 Aldrich humic acid (DOC59.4 mg/L);
pH 5.8–6.8RS 414
4.46 Idem ED 4144.15 Idem~log Kdoc is the zero intercept
of the regression line of logKdoc
vs DOC concentration!
RS 414
3.95 DOC in Lake Erie water~9.6 mg/L! RS 4144.73 Idem ED 4144.87 DOC in Huron River wat.~7.8 mg/L! RS 4145.70 Idem ED 414
1.63° @4.24# 0.25 Kaolinite coated with Phohokee 25 BE 228~0.91! peat humic acid; 0.1 M NaClO4
0.78°~0.82!
0.02 Idem 25 BE 228
213° @4.68# 0.28 Cecil/Pacolet clay coated with 25 BE 228~0.95! Pahokee humic acid; 0.1 M NaClO4
0.89°~0.84!
0.02 Idem 25 BE 228
@4.20# 50.2 Aldrich humic acid(DOC52.5 mg/L)
23 ED 400
4.32 Aldrich humic acid; pH 7.32(DOC50 – 14.5 mg/L)
6.6 RS 546
5.71 Estuarine colloids~ChesapeakeBay! 43.1 mg/L
20 BU 399
4.20av 6–94
3–66
3–35
0.8–3.9
5 soils; 0.01 N CaCl2 25 BE 455
4.22 5 soils; extrapolated from logKd –f c plots ~methanol–water!
25 BE 455
4.23 5 soils; extrapolated from logKd –f c plots ~acetone–water!
25 BE 455
4.42 Soil; experimental~literature! 2174.20av 7–
75.61–
69.10.11–2.38
17 sediments and soils 25 BE 96
4.41av 2.78,3.27
Coarse si fractions of Doe Runand Hickory Hill pond sediments
25 BE 108
5.76av 3.38av 23 Brisbane River sediments FM 5444.42,4.53
Humic acid-silica column 20–23 RPLC 584,585
4.34 Humic acid-silica column 20–23 RPLC 5874.38 Salicylic acid-silica column 20–23 RPLC 5874.32 8-Hydroxyquinoline-silica column 20–23 RPLC 5874.38 Cyanopropyl column 20–25 RPLC 579
J. Phys. Chem. Ref. Data, Vol. 30, No. 1, 2001

267267SORPTION OF ORGANIC COMPOUNDS
TABLE 2. Sorption coefficients for polyaromatic hydrocarbons~PAHs!—Continued
log Kd
log Kf0
(1/n) log Koc
Sorbent composition~%!Other sorbent and solution data;
prediction procedureTemp.~°C! Meth. Ref.Sand Silt Clay OC
3.92 50.2 Aldrich and Fluka humic acidpredicted~Flory–Huggins model!
FH 206
4.10 Prediction from addition of ringfragments
96
4.15 Correlation logKoc – logKow 964.26 Correlation logKoc – logS 5644.63 Correlation logKoc – logS 964.25 Correlation logKoc – logS~mp! 964.31 Correlation logKoc – MCI 578
@4.50# Correlation logKom – MCI 5913.92 Correlation logKoc – LSER 602
Fluoranthene
2.62 4.81 92.5 4.4 3.1 0.64 Speyer soil~Sp 180!; pH 6.0 25 BE 3883.00 4.65 89 4.9 6.1 2.24 Idem~Sp 280!; pH 5.6 25 BE 3882.83 4.80 80.5 11.2 8.3 1.08 Idem~Sp 380!; pH 6.4 25 BE 3882.93 4.90 1.08 Idem 15 BE 3883.02 4.99 1.08 Idem 5 BE 3882.79 4.82 54 24 22 0.93 Soil~Shenyang Ecol. Station,
P.R. China!; pH 7.025 BE 388
@1.86# 4.16 0.0 93.8 6.3 0.50 WES reference soil; 6 monthsincubation~m.i.!
25 BE 218
@2.43# 4.51 5 70 25 0.84 Brown’s lake sedim.; 6 m.i. 25 BE [email protected]# 5.05 55 32.5 12.5 4.76 Hamlet City lake sedim.; 6 m.i. 25 BE [email protected]# 5.28 1.06 Oakland Harbor sedim,/
interstitial saline water system;15 d incubation; Nereis virensbioaccumulation~BA! study
15 BE 613
@2.70# 4.67 Idem; Macoma nasuta BA study [email protected]# 4.47 2.92 Red Hook sedim./interstitial
saline water; 15 d incubation;Nereis virens BA study
15 BE 613
@3.08# 4.62 Idem; Macoma nasuta BA study [email protected]# 5.4 5.1 Lake Ketelmeer sedim. 20 GP 394
4.93 DOC from Lake Ketermeer sedim. 45 GP 3945.05 Idem 35 3945.18 Idem 20 3945.25 Idem 16 3944.16– DOC in sediment interstitial water RS 4115.03 ~from 11 harbors and lakes!5.32 2.07 Lake Oostvaardersplassen sediment 25 BE 584.89 1.87 Lake Ketelmeer sediment 25 BE 586.38av 3.38av 23 Brisbane River sediments FM 5444.79av 6 Eagle Harbor contaminated
sediment-pore water systemsFM 612
4.74 Chemically immobilized humic ac. 20–23 RPLC 584,585
4.62 Physically immobilized humic ac. 20–23 RPLC 5854.81 Correlation logKoc – logKow (180) 3885.09 Correlation logKoc – logKow(96) 6134.73 Correlation logKoc – logS(180) 3884.85 Correlation logKoc – MCI 598
Pyrene
1.64 @4.18# 98 1 1 0.29 Borden soil; 0.01 N CaCl2 MD 6001.62 4.51 0.13 Hickory Hill pond s sediment
~.50 mm!25 BE 108
3.48 4.96 3.27 Idem; coarse si~50–20mm! 1083.40 5.11 1.98 Idem; medium si~20–5mm! 1083.18 5.04 1.34 Idem; fine si~5–2 mm! 1083.15 5.08 1.20 Idem; c~.2 mm! 1080.97 4.04 0.086 Doe Run s sediment 25 BE 1083.32 4.88 2.78 Idem; coarse si 108
J. Phys. Chem. Ref. Data, Vol. 30, No. 1, 2001
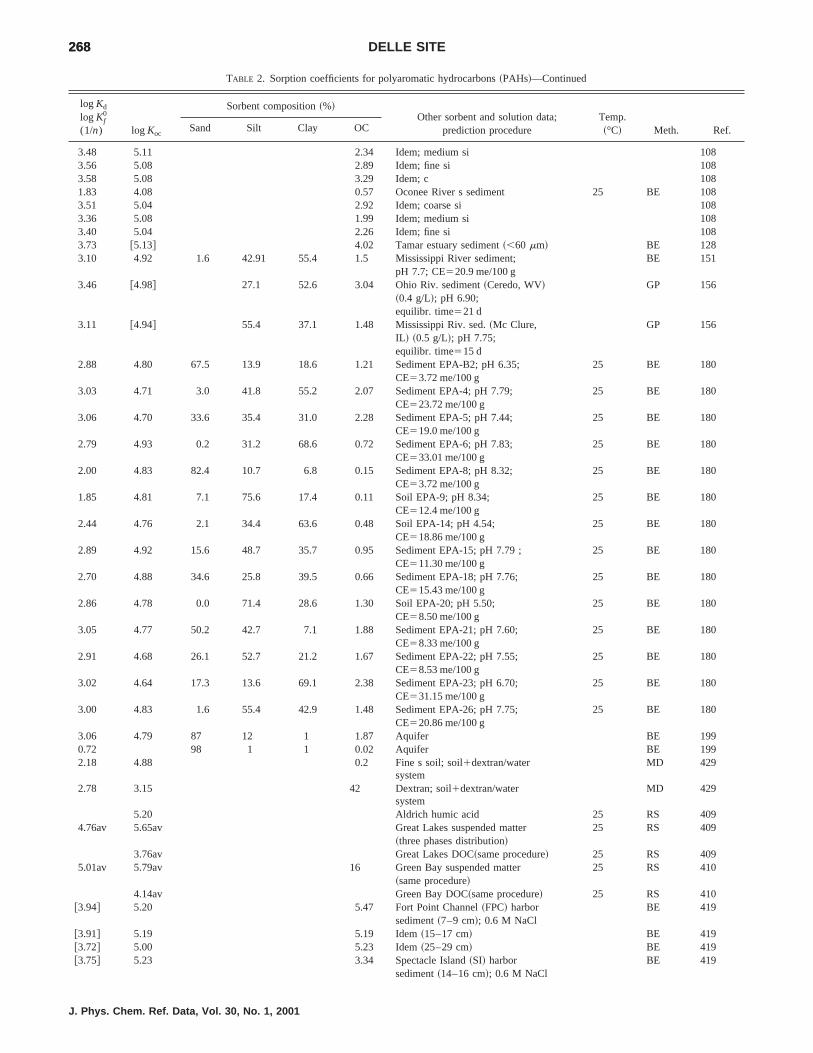
268268 DELLE SITE
TABLE 2. Sorption coefficients for polyaromatic hydrocarbons~PAHs!—Continued
log Kd
log Kf0
(1/n) log Koc
Sorbent composition~%!Other sorbent and solution data;
prediction procedureTemp.~°C! Meth. Ref.Sand Silt Clay OC
3.48 5.11 2.34 Idem; medium si 1083.56 5.08 2.89 Idem; fine si 1083.58 5.08 3.29 Idem; c 1081.83 4.08 0.57 Oconee River s sediment 25 BE 1083.51 5.04 2.92 Idem; coarse si 1083.36 5.08 1.99 Idem; medium si 1083.40 5.04 2.26 Idem; fine si 1083.73 @5.13# 4.02 Tamar estuary sediment~,60 mm! BE 1283.10 4.92 1.6 42.91 55.4 1.5 Mississippi River sediment;
pH 7.7; CE520.9 me/100 gBE 151
3.46 @4.98# 27.1 52.6 3.04 Ohio Riv. sediment~Ceredo, WV!~0.4 g/L!; pH 6.90;equilibr. time521 d
GP 156
3.11 @4.94# 55.4 37.1 1.48 Mississippi Riv. sed.~Mc Clure,IL ! ~0.5 g/L!; pH 7.75;equilibr. time515 d
GP 156
2.88 4.80 67.5 13.9 18.6 1.21 Sediment EPA-B2; pH 6.35;CE53.72 me/100 g
25 BE 180
3.03 4.71 3.0 41.8 55.2 2.07 Sediment EPA-4; pH 7.79;CE523.72 me/100 g
25 BE 180
3.06 4.70 33.6 35.4 31.0 2.28 Sediment EPA-5; pH 7.44;CE519.0 me/100 g
25 BE 180
2.79 4.93 0.2 31.2 68.6 0.72 Sediment EPA-6; pH 7.83;CE533.01 me/100 g
25 BE 180
2.00 4.83 82.4 10.7 6.8 0.15 Sediment EPA-8; pH 8.32;CE53.72 me/100 g
25 BE 180
1.85 4.81 7.1 75.6 17.4 0.11 Soil EPA-9; pH 8.34;CE512.4 me/100 g
25 BE 180
2.44 4.76 2.1 34.4 63.6 0.48 Soil EPA-14; pH 4.54;CE518.86 me/100 g
25 BE 180
2.89 4.92 15.6 48.7 35.7 0.95 Sediment EPA-15; pH 7.79 ;CE511.30 me/100 g
25 BE 180
2.70 4.88 34.6 25.8 39.5 0.66 Sediment EPA-18; pH 7.76;CE515.43 me/100 g
25 BE 180
2.86 4.78 0.0 71.4 28.6 1.30 Soil EPA-20; pH 5.50;CE58.50 me/100 g
25 BE 180
3.05 4.77 50.2 42.7 7.1 1.88 Sediment EPA-21; pH 7.60;CE58.33 me/100 g
25 BE 180
2.91 4.68 26.1 52.7 21.2 1.67 Sediment EPA-22; pH 7.55;CE58.53 me/100 g
25 BE 180
3.02 4.64 17.3 13.6 69.1 2.38 Sediment EPA-23; pH 6.70;CE531.15 me/100 g
25 BE 180
3.00 4.83 1.6 55.4 42.9 1.48 Sediment EPA-26; pH 7.75;CE520.86 me/100 g
25 BE 180
3.06 4.79 87 12 1 1.87 Aquifer BE 1990.72 98 1 1 0.02 Aquifer BE 1992.18 4.88 0.2 Fine s soil; soil1dextran/water
systemMD 429
2.78 3.15 42 Dextran; soil1dextran/watersystem
MD 429
5.20 Aldrich humic acid 25 RS 4094.76av 5.65av Great Lakes suspended matter
~three phases distribution!25 RS 409
3.76av Great Lakes DOC~same procedure! 25 RS 4095.01av 5.79av 16 Green Bay suspended matter
~same procedure!25 RS 410
4.14av Green Bay DOC~same procedure! 25 RS [email protected]# 5.20 5.47 Fort Point Channel~FPC! harbor
sediment~7–9 cm!; 0.6 M NaClBE 419
@3.91# 5.19 5.19 Idem~15–17 cm! BE [email protected]# 5.00 5.23 Idem~25–29 cm! BE [email protected]# 5.23 3.34 Spectacle Island~SI! harbor
sediment~14–16 cm!; 0.6 M NaClBE 419
J. Phys. Chem. Ref. Data, Vol. 30, No. 1, 2001

269269SORPTION OF ORGANIC COMPOUNDS
TABLE 2. Sorption coefficients for polyaromatic hydrocarbons~PAHs!—Continued
log Kd
log Kf0
(1/n) log Koc
Sorbent composition~%!Other sorbent and solution data;
prediction procedureTemp.~°C! Meth. Ref.Sand Silt Clay OC
5.05 FPC porewater organic colloids~7–9 cm; 7.3 mg C/L!; 0.6 M NaCl
FQ 419
5.00 Idem~15–17 cm; 7.7 mg C/L! FQ 4194.88 Idem~25–29 cm; 13 mg C/L! FQ 4194.71 SI sediment porewater organic
colloids ~14–16 cm; 21.5 mg C/L!;0.6 M NaCl
FQ 419
5.23 54.1 Humic acid from podzolic soil~Lee, NH!
FQ 415
5.08 41.5 Fulvic acid from podzolic soil~Lee, NH!
FQ 415
4.74 53.1 Fulvic acid from podzolic soil~North Conway, NH!
FQ 415
5.00 51.3 Suwannee River, GA, fulvic acid FQ 4154.54 39.07 Marine sediment humic acid~MH-1! FQ 1884.70 47.22 Idem~MH-2! 1884.46 47.76 Idem~MH-3! 1884.81 45.10 Estuarine sediment humic acid
~MH-4!FQ 188
4.60 40.60 Idem~MH-5! 1884.74 48.58 Idem~MH-6! 1885.10 37.61 Soil humic acid~SH-1! FQ 1884.94 47.23 Podzolic soil humic acid~SH-2! FQ 1885.21 54.15 Idem~SH-3! 1885.51 54.66 Dark lignite soil humic acid~SH-4! FQ 1885.38 57.53 Idem~SH-5! 1884.82 41.52 Podzolic soil fulvic acid~SF-1! FQ 1884.73 53.1 Idem~SF-2! 1885.02 51.3 Suwannee River fulvic acid~SF-3! FQ 1885.02 38.23 Aldrich humic acid FQ 1885.15 Aldrich humic acid; pH 7.32
(DOC50 – 16.7 mg/L)6.6 RS 546
4.55– DOC in porewater of Lake RS 5475.64 Michigan~LM ! sediment after
filtration5.54– DOC in porewater of LM sediment RS 5475.92 after centrifugation4.79– DOC in elutriate of LM sediment RS 5475.68 after filtration4.65– DOC in elutriate of LM sediment RS 5475.18 after centrifugation4.67av 8 Eagle Harbor contaminated
sediment-pore water systemsFM 612
4.92 Soil; experimental~literature! 2174.85av 33 literature data 5624.83av 7–
75.61–
69.10.11–2.38
17 sediments and soils 25 BE 96
6.51av 3.38av 23 Brisbane River sediments FM 5444.77, Humic acid-silica column 20–23 RPLC 584,4.82 5854.80 Humic acid-silica column 20–23 RPLC 5874.81 Salicylic acid-silica column 20–23 RPLC 5874.72 8-Hydroxyquinoline-slicia column 20–23 RPLC 5874.79 Correlation logKoc – logKow 964.97 Correlation logKoc – logKow 1084.22 Correlation logKoc – logKow 2074.11 Correlation logKoc – logS 5644.51 Correlation logKoc – logS 964.64 Correlation logKoc– logS~mp! 964.84 Correlation logKoc– MCI 578
@5.05# Correlation logKom – MCI 5914.50 Correlation logKoc – LSER 602
J. Phys. Chem. Ref. Data, Vol. 30, No. 1, 2001

270270 DELLE SITE
TABLE 2. Sorption coefficients for polyaromatic hydrocarbons~PAHs!—Continued
log Kd
log Kf0
(1/n) log Koc
Sorbent composition~%!Other sorbent and solution data;
prediction procedureTemp.~°C! Meth. Ref.Sand Silt Clay OC
Benzo„a…anthracene
5.77 2.07 Lake Oostvaardersplassen sediment 25 BE 585.47 1.87 Lake Ketelmeer sediment 25 BE 586.30av 3.38av 23 Brisbane River sediments FM 5445.49av 8 Eagle Harbor contaminated
sediment-pore water systemsFM 612
5.30 Aldrich humic acid~log Kdoc isthe zero intercept of the regressionline of logKdoc vs DOC conc.!
RS 414
5.92 Aldrich humic acid; pH 7.32(DOC50 – 1.9 mg/L)
6.6 RS 546
@5.23# 50.2 Aldrich humic acid(DOC52.5 mg/L)
23 ED 400
5.36 Correlation logKoc – MCI 598
Benzo„a…pyrene
7.0 4.60 Rotterdam Harbor sedim.~0.064–10.8 g/L!; K0 extrapolated from water/methanol; 0–0.6 M NaCl
21 BE 461
6.4 5.1 Lake Ketelmeer sedim. 20 GP 3946.08 DOC from Lake Ketelmeer sedim. 45 GP 3946.14 Idem 35 3946.52 Idem 20 3946.54 Idem 16 3945.99 2.07 Lake Oostvaardersplassen sediment 25 BE 585.53 1.87 Lake Ketelmeer sediment 25 BE 585.73av 58.1 Humic acid from Arno River
sediments; pH 5.0–8.020 ED 425
4.76av 51.7 Fulvic acid from Arno Riversediments; pH 5.0–8.0
20 ED 425
5.74av 64.1 Humic acid from Tyrrenhian Seasediments; pH 5.0–8.0
20 ED 425
4.88av 45.6 Fulvic acid from Tyrrenhian Seasediments; pH 5.0–8.0
20 ED 425
5.37av 53.3 Humic acid from Arno River water;pH 5.0–8.0
20 ED 425
4.66av 54.6 Fulvic acid from Arno River water;pH 5.0–8.0
20 ED 425
5.78av 6.66av Great Lakes suspended matter~three phases distribution!
25 RS 409
4.57av Great Lakes DOC~same procedure! 25 RS 4095.60av 6.38av 16 Green Bay suspended matter
~same procedure!25 RS 410
4.77av Green Bay DOC~same procedure! 25 RS 4105.95 Aldrich humic acid~log Kdoc is
the zero intercept of the regressionline of logKdoc vs DOC conc.!
RS 414
6.42 Aldrich humic acid; pH 7.32(DOC50 – 0.47 mg/L)
6.6 RS 546
5.81 DOC~11.7 mg/L! in interstitialwater ~Lake Michigan!; pH 7.88
6.6 RS 546
5.53 Lake Maridalsvannet; water DOC~3.5 mg C/L!; pH 6.6
20 ED 440
5.35 Lake Louhilampi: water DOC~18.0 mg C/L!; pH 4.6
20 ED 440
4.88 Hellerudmyra bog; water DOC~20.6 mg C/L!; pH 4.4
20 ED 440
4.89 Nordic fulvic acid~19.4 mg C/L!;pH 4.31
20 ED 440
4.96 ‘‘NIVA-concentrate;’’ water humicsample~19.4 mg C/L!; pH 4.42
20 ED 440
5.18– DOC in porewater of Lake RS 547
J. Phys. Chem. Ref. Data, Vol. 30, No. 1, 2001

271271SORPTION OF ORGANIC COMPOUNDS
TABLE 2. Sorption coefficients for polyaromatic hydrocarbons~PAHs!—Continued
log Kd
log Kf0
(1/n) log Koc
Sorbent composition~%!Other sorbent and solution data;
prediction procedureTemp.~°C! Meth. Ref.Sand Silt Clay OC
6.07 Michigan~LM ! sediment afterfiltration
6.40– DOC in porewater of LM sediment RS 5476.41 after centrifugation4.72– DOC in elutriate of LM sediment RS 5476.73 after filtration6.02– DOC in elutriate of LM sediment RS 5476.99 after centrifugation6.26 50.2 Aldrich humic acid~2.5 mg C/L! 23 ED 4006.21 Aldrich humic acid~5 mg C/L! 23 ED 4346.56 Aldrich humic acid ED 4356.26av 3.38av 23 Brisbane River sediments FM 5445.81av 8 Eagle Harbor contaminated
sediment-pore water systemsFM 612
5.90 Correlation logKoc –MCI 598
Tetracene
5.81 Soil; experimental~literature data! 2175.81av 2.78, Coarse si fractions of Doe Run 25 BE 108
3.27 and Hickory Hill sediments5.26 Prediction from addition of ring
fraction96
4.74 Correlation logKoc – logKow 2075.69 Correlation logKoc – logKow 1085.51 Correlation logKoc – logKow 965.25 Correlation logKoc – logS~mp! 96
@5.58# Correlation logKom – MCI 5915.36 Correlation logKoc – MCI 5785.09 Correlation logKoc – LSER 602
Values in square parentheses have been calculated by the author.*% OM content.av: average value.Idem refers to the sorbent reported just above; only the data~texture, OC, temperature, method! which were changed are specified.
J. Phys. Chem. Ref. Data, Vol. 30, No. 1, 2001

5
665
533333
2
272272 DELLE SITE
TABLE 3. Sorption coefficients for halogenated alkyl hydrocarbons
log Kd
log Kf0
(1/n) log Koc
Sorbent composition~%!Other sorbent and solution data;
prediction procedureTemp.~°C! Meth. Ref.Sand Silt Clay OC
Dichloromethane
2.06*av 65* –85* Three municipal wastewater solids 22.5 BE 531.44 Correlation logKoc – MCI 5961.39 Correlation logKoc – MCI [email protected]# Correlation logKom – MCI 5911.03 Correlation logKoc – LSER 602
Trichloromethane
20.25 1.57 1.49 Captina sil soil; pH 4.97;0.01 M CaNO3
BE 606
20.72 1.46 0.66 Mc Laurin sl soil; pH 4.43;0.01 M CaNO3
BE 606
1.44av Soil, sand, loess 20 HS 2261.98av Weathered shale, mudrock 20 HS 222.79av Unweathered shale, mudrock 20 HS 222.15*av 65* –85* Three municipal wasterwater solids 22.5 BE 53
@21.16# 92 5.9 2.1 0.09 Lincoln soil; fine s; pH 6.4CE53.5 me/100 g
20 MD 541
1.65 Correlation logKoc – MCI 5961.56 Correlation logKoc – MCI [email protected]# Correlation logKom – MCI 5911.59 Correlation logKoc – LSER 602
Tetrachloromethane „TeCM…
2.65*av 65* –85* Three municipal wastewater solids 22.5 BE 530.13 1.26 3.6 7.3 89.1 7.56 DTMA-Wyoming bentonite 20 BE 90.18 1.34 3.6 7.3 89.1 6.97 TTMA-Wyoming bentonite 20 BE 90.49 1.70 3.6 7.3 89.1 6.16 HTMA-Wyoming bentonite 20 BE 90.82 1.96 3.6 7.3 89.1 7.13 BDHA-Wyoming bentonite 20 BE 90.88 2.07 3.6 7.3 89.1 6.57 DDPA-Wyoming bentonite 20 BE 91.97°~0.64!
3.6 7.3 89.1 2.6 30% DTMDA-Wyoming bentonite 20 BE 92
2.03°~0.68!
4.5 61% Idem 20 92
2.20°~0.71!
5.8 80% Idem 10 92
2.16°~0.71!
5.8 80% Idem 20 92
2.07°~0.72!
5.8 80% Idem 35 92
0.65 1.69 3.6 7.3 89.1 9.0 80% DTMA-Wyoming bentonite 10–35 BE [email protected]# 1.72 2.40 U.S. EPA ref soil 2;
SA~N2!57.85/m2/g;0.005 M CaCl2
24 BE 230
@20.12# 1.72 1.43 U.S. EPA ref soil 3;0.005 M CaCl2
24 BE 230
@0.14# 1.80 2.21 U.S. EPA ref soil 7;SA~N2!522.4 m2/g;0.005 M CaCl2
24 BE 230
@0.07# 1.76 2.04 U.S. EPA ref soil 10;SA~N2!58.84 m2/g;0.005 M CaCl2
24 BE 230
@0.11# 1.76 2.25 U.S. EPA ref soil 12;SA~N2!59.38 m2/g;0.005 M CaCl2
24 BE 230
@0.07# 1.83 1.73 U.S. EPA ref soil 19;SA~N2!53.75 m2/g;0.005 M CaCl2
24 BE 230
@20.18# 1.79 1.08 Anoka soil; Sa~N2!51.07 m2/g;0.005 M CaCl2
24 BE 230
@20.11# 1.72 1.49 Piketon soil; SA~N2!57.77 m2/g;0.005 M CaCl2
24 BE 230
J. Phys. Chem. Ref. Data, Vol. 30, No. 1, 2001

273273SORPTION OF ORGANIC COMPOUNDS
TABLE 3. Sorption coefficients for halogenated alkyl hydrocarbons—Continued
log Kd
log Kf0
(1/n) log Koc
Sorbent composition~%!Other sorbent and solution data;prediction procedure
Temp.~°C! Meth. Ref.Sand Silt Clay OC
@20.09# 1.65 1.80 Marlette soil; SA~N2!53.99 m2/g;0.005 M CaCl2
24 BE 230
@20.18# 1.81 1.03 Spinks soil; SA~N2!51.51 m2/g;0.005 M CaCl2
24 BE 230
@0.15# 1.69 2.90 Elliot~IHSS ref soil!;0.005 M CaCl2
24 BE 230
@20.09# 1.81 1.26 Woodburn soil;SA~N2!511.2 m2/g;0.005 M CaCl2
24 BE 230
@0.15# 1.77 2.40 Renslow soil;SA~N2!511.6 m2/g;0.005 M CaCl2
24 BE 230
@0.61# 1.83 6.09 Sanhedrin soil;SA~N2!57.88 m2/g;0.005 M CaCl2
24 BE 230
@0.36# 1.87 3.12 Cathedral soil;SA~N2!55.58 m2/g;0.005 M CaCl2
24 BE 230
@0.37# 1.83 3.47 Wellsboro soil;SA~N2!55.73 m2/g;0.005 M CaCl2
24 BE 230
@0.48# 1.73 5.61 Fangshan District Beijing,China ~C.!; SA~N2!54.96 m2/g;
24 BE 230
@0.28# 1.83 2.83 Anda, Heilongjiang, China;0.005 M CaCl2
24 BE 230
@20.75# 1.72 0.34 Jinxian County, Jiangxi,~C.!;0.005 M CaCl2
24 BE 230
@20.18# 1.79 1.08 Nanjing, Jiangsu,~C.!;0.005 M CaCl2
24 BE 230
@0.01# 1.74 1.77 Changshu, Jiangsu,~C.!;0.005 M CaCl2
24 BE 230
@20.45# 1.72 0.67 Xuyi County, Jiangsu,~C.!;SA~N2!554.0 m2/g;0.005 M CaCl2
24 BE 230
@0.41# 1.81 4.02 Jinhu County, Jiangsu,~C.!;0.005 M CaCl2
24 BE 230
@20.24# 1.85 0.81 Hongze County, Jiangsu,~C.!;SA~N2!522.8 m2/g;0.005 M CaCl2
24 BE 230
@0.19# 1.79 2.54 Dushan County, Guizhou,~C.!;SA~N2!58.20 m2/g;0.005 M CaCl2
24 BE 230
@20.16# 1.79 1.12 Gangcha County, Qinghai,~C.!;SA~N2!54.21 m2/g;0.005 M CaCl2
24 BE 230
@21.03# 1.77 0.16 Xinghai County, Qinghai,~C.!;SA~N2!52.8 m2/g;0.005 M CaCl2
24 BE 230
@20.52# 1.82 0.46 Luochuan County, Shanxi,~C.!;0.005 M CaCl2
24 BE 230
@20.36# 1.82 0.66 Yishan County, Guangxi,~C.!;SA~N2!540.2 m2/g;0.005 M CaCl2
24 BE 230
@20.27# 1.81 0.83 Yangchun County, Guangdong,~C.!; 0.005 M CaCl2
24 BE 230
@20.45# 1.74 0.64 Xuwen County, Guangdong,~C.!;0.005 M CaCl2
24 BE 230
@20.68# 1.79 0.34 Qiongzhong County, Hainan,~C.!; SA~N2!54.85 m2/g;0.005 M CaCl2
24 BE 230
@1.87# @2.06# 64.0 Peat extracted with 0.1 M NaOH;0.005 M CaCl2
24 BE 229
@1.65# @1.89# 57.1 Peat; SA~N2!51.5 m2/g;0.005 M CaCl2
24 BE 229
J. Phys. Chem. Ref. Data, Vol. 30, No. 1, 2001

274274 DELLE SITE
TABLE 3. Sorption coefficients for halogenated alkyl hydrocarbons—Continued
log Kd
log Kf0
(1/n) log Koc
Sorbent composition~%!Other sorbent and solution data;prediction procedure
Temp.~°C! Meth. Ref.Sand Silt Clay OC
@1.45# @1.72# 53.1 Houghton muck soil;SA~N2!50.8 m2/g; 0.005 M CaCl2
24 BE 229
@0.60# 44.4 Cellulose; SA~N2!52.3 m2/g;0.005 M CaCl2
24 BE 229
0.33 2.16 1.49 Captina sil soil pH 4.97;0.01 M CaNO3
BE 606
20.49 1.69 0.66 Mc Laurin sl soil; pH 4.43;0.01 M CaNO3
BE 606
@0.00# 1.82 1.50 U.S. EPA ref sediment 11;SA~N2!520.2 m2/g; 0.005 M CaCl2
24 BE 230
@20.09# 2.01 0.79 U.S. EPA ref sediment 18;SA~N2!522.1 m2/g; 0.005 M CaCl2
24 BE 230
@0.40# 2.06 2.20 U.S. EPA ref sediment 22;SA~N2!53.39 m2/g; 0.005 M CaCl2
24 BE 230
@20.05# 1.95 0.99 U.S. EPA ref sediment 25;SA~N2!57.60 m2/g; 0.005 M CaCl2
24 BE 230
@0.15# 1.97 1.50 Mississippi River sed.~pool 2!;SA~N2!55.90 m2/g; 0.005 M CaCl2
24 BE 230
@20.01# 1.94 1.13 Mississippi River sed.~pool 11!;SA~N2!54.86 m2/g; 0.005 M CaCl2
24 BE 230
@0.11# 1.96 1.40 Mississippi River sed.~pool 26!;SA~N2!515.5 m2/g; 0.005 M CaCl2
24 BE 230
@0.24# 2.04 1.60 Mississippi River sediment;SA~N2!512.8 m2/g; 0.005 M CaCl2
24 BE 230
@20.16# 2.08 0.58 Yazoo River sediment;SA~N2!519.7 m2/g; 0.005 M CaCl2
24 BE 230
@20.32# 2.08 0.40 Mississippi River sediment;SA~N2!58.09 m2/g; 0.005 M CaCl2
24 BE 230
@0.34# 2.05 1.97 Lake Charles sediment;SA~N2!513.3 m2/g; 0.005 M CaCl2
24 BE 230
@0.09# 2.02 1.17 Suisin Bay marine sediment;SA~N2!515.7 m2/g; 0.005 M CaCl2
24 BE 230
@0.20# 2.03 1.48 Suisin Bay marine sediment;SA~N2!521.6 m2/g; 0.005 M CaCl2
24 BE 230
@0.28# 2.03 1.78 Suisin Bay marine sediment;SA~N2!521.3 m2/g; 0.005 M CaCl2
24 BE 230
@0.70# 2.03 4.73 Tangwang River sed., China~C.!;SA~N2!512.8 m2/g; 0.005 M CaCl2
24 BE 230
@0.12# 2.07 1.12 Sonhuajiang River sed.~C.!0.005 M CaCl2
24 BE 230
@0.27# 1.97 1.99 Tumen River sediment~C.!;SA~N2!54.93 m2/g; 0.005 M CaCl2
24 BE 230
@0.62# 2.01 4.12 Xuanwu Lake sediment~C.!;0.005 M CaCl2
24 BE 230
@0.06# 1.97 1.24 Guchen Lake sediment~C.!;0.005 M CaCl2
24 BE 230
@0.02# 2.00 1.04 Lake Hongze sediment~C.!;SA~N2!529.9 m2/g; 0.005 M CaCl2
24 BE 230
@0.51# 1.98 3.37 Zhujiang River sediment~C.!;0.005 M CaCl2
24 BE 230
@20.91# 2.05 0.11 Yellow River sediment~C.!;0.005 M CaCl2
24 BE 230
@20.96# 2.00 0.11 Yinghe River sediment~C.!;SA~N2!51.85 m2/g; 0.005 M CaCl2
24 BE 230
@0.37# 2.03 2.19 Ziya River sediment~C.!;SA~N2!55.83 m2/g; 0.005 M CaCl2
24 BE 230
@20.11# 2.05 0.70 Ganjiang River sediment~C.!;SA~N2!55.32 m2/g; 0.005 M CaCl2
24 BE 230
@0.41# 1.96 2.82 Zishui River sediment~C.!;SA~N2!58.97 m2/g; 0.005 M CaCl2
24 BE 230
@20.35# 2.06 0.29 Liuyanghe River sediment~C.!;0.005 M CaCl2
24 BE 230
J. Phys. Chem. Ref. Data, Vol. 30, No. 1, 2001

275275SORPTION OF ORGANIC COMPOUNDS
TABLE 3. Sorption coefficients for halogenated alkyl hydrocarbons—Continued
log Kd
log Kf0
(1/n) log Koc
Sorbent composition~%!Other sorbent and solution data;prediction procedure
Temp.~°C! Meth. Ref.Sand Silt Clay OC
@0.05# 1.96 1.22 Youshui River sediment~C.!;SA~N2!511.9 m2/g; 0.005 M CaCl2
24 BE 230
@20.43# 1.98 0.39 Niqu River sediment~C.!;SA~N2!54.84 m2/g; 0.005 M CaCl2
24 BE 230
@20.25# 2.05 0.50 Huaihe River sediment~C.!;SA~N2!517.6 m2/g; 0.005 M CaCl2
24 BE 230
@20.39# 1.96 0.45 Huaihe River sediment~C.!;SA~N2!58.21 m2/g; 0.005 M CaCl2
24 BE 230
@20.11# 2.03 0.73 Jinghe River sediment~C.!;SA~N2!512.1 m2/g; 0.005 M CaCl2
24 BE 230
@20.41# 2.01 0.38 Sangonghe River sediment~C.!;SA~N2!54.00 m2/g; 0.005 M CaCl2
24 BE 230
@20.32# 2.03 0.45 Yaluzangbu River sediment~C.!;SA~N2!54.94 m2/g; 0.005 M CaCl2
24 BE 230
@0.29# 2.00 1.94 Lake Pumo sediment~C.!;SA~N2!53.87 m2/g; 0.005 M CaCl2
24 BE 230
@20.30# 1.97 0.54 Niyanghe River sediment~C.!;SA~N2!53.12 m2/g; 0.005 M CaCl2
24 BE 230
20.77 0.02 Borden aquifer mat.;CE50.52 me/100 g;SA~N2!50.8 m2/g
21 BE 614
20.97 .98 0.007 Rabis aquifer mat. 10 MD 1662.04 Correlation logKoc– logS 5641.85 Correlation logKoc– MCI 5961.70 Correlation logKoc– MCI [email protected]# Correlation logKom– MCI 5912.17 Correlation logKoc– LSER 602
1,2-Dichloroethane„ÀDCA…
@20.52# @1.51# 3.3 69 26 1.6*@0.93#
Willamette soil; pH 6.8 20 BE 195
@21.16# 92 5.9 2.1 0.09 Lincoln soil; fine s; pH 6.4;CE53.5 me/100 g
20 MD 541
1.06 Correlation logKoc– logKow 961.48 Correlation logKoc– logS 961.19 Correlation logKoc– logS ~mp! [email protected]# Correlation logKom– MCI 5911.54 Correlation logKoc– LSER 602
1,2-Dibromoethane„Ethylene dibromide, ED…
@20.24# @1.79# 3.3 69 26 1.6*@0.93#
Willamette soil; pH 6.8 20 BE 195
@0.31# @1.06# 29.1 14.3 56.6 30.6*@17.7#
Whittlesey soil; SA5197.0 m2/g 20 BE 615
@20.40# @1.22# 84.1 8.1 7.8 4.15* Ashurst soil; SA528.1 m2/g; 20 BE [email protected]# analysis by a catalytic
combustion [email protected]# @1.02# Idem; analysis by a radiotracer
method615
0.17 2.13 1.11 Lockwood fine sl soil;0.01 M CaCl2
25 BE 380
0.32 2.11 1.61 Warehouse Point fine sl soil;0.01 M CaCl2
25 BE 380
0.23 2.01 1.65 Broad Brook fine sl soil;0.01 M CaCl2
25 BE 380
20.93 1.76 1.49 Captina sil soil; pH 4.97;0.01 M CaNO3
BE 606
20.52 1.66 0.66 Mc Laurin sl soil; pH 4.43;0.01 M CaNO3
BE 606
1.64 Soil; experimental~literature! 217,21.0 @,1.86# 0.24*
@0.14#Aquifer fines~,100 mm! BE 504
J. Phys. Chem. Ref. Data, Vol. 30, No. 1, 2001
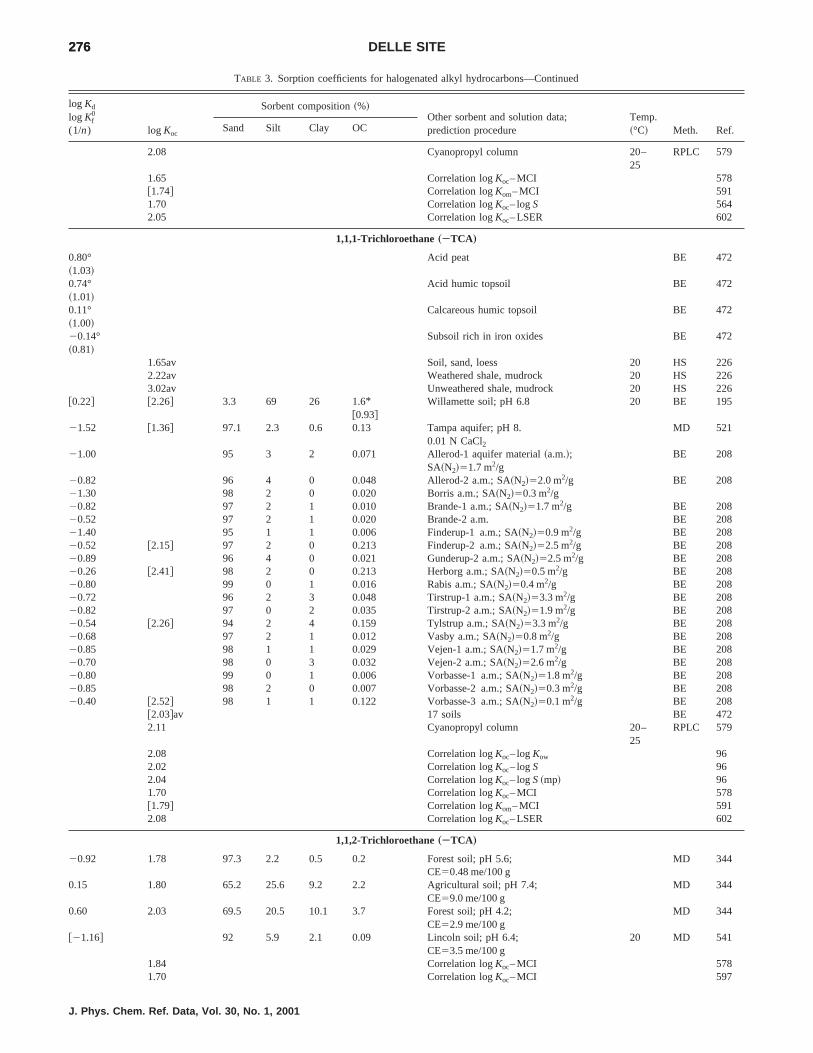
276276 DELLE SITE
TABLE 3. Sorption coefficients for halogenated alkyl hydrocarbons—Continued
log Kd
log Kf0
(1/n) log Koc
Sorbent composition~%!Other sorbent and solution data;prediction procedure
Temp.~°C! Meth. Ref.Sand Silt Clay OC
2.08 Cyanopropyl column 20–25
RPLC 579
1.65 Correlation logKoc– MCI [email protected]# Correlation logKom– MCI 5911.70 Correlation logKoc– logS 5642.05 Correlation logKoc– LSER 602
1,1,1-Trichloroethane„ÀTCA …
0.80°~1.03!
Acid peat BE 472
0.74°~1.01!
Acid humic topsoil BE 472
0.11°~1.00!
Calcareous humic topsoil BE 472
20.14°~0.81!
Subsoil rich in iron oxides BE 472
1.65av Soil, sand, loess 20 HS 2262.22av Weathered shale, mudrock 20 HS 2263.02av Unweathered shale, mudrock 20 HS 226
@0.22# @2.26# 3.3 69 26 1.6*@0.93#
Willamette soil; pH 6.8 20 BE 195
21.52 @1.36# 97.1 2.3 0.6 0.13 Tampa aquifer; pH 8.0.01 N CaCl2
MD 521
21.00 95 3 2 0.071 Allerod-1 aquifer material~a.m.!;SA~N2!51.7 m2/g
BE 208
20.82 96 4 0 0.048 Allerod-2 a.m.; SA~N2!52.0 m2/g BE 20821.30 98 2 0 0.020 Borris a.m.; SA~N2!50.3 m2/g20.82 97 2 1 0.010 Brande-1 a.m.; SA~N2!51.7 m2/g BE 20820.52 97 2 1 0.020 Brande-2 a.m. BE 20821.40 95 1 1 0.006 Finderup-1 a.m.; SA~N2!50.9 m2/g BE 20820.52 @2.15# 97 2 0 0.213 Finderup-2 a.m.; SA~N2!52.5 m2/g BE 20820.89 96 4 0 0.021 Gunderup-2 a.m.; SA~N2!52.5 m2/g BE 20820.26 @2.41# 98 2 0 0.213 Herborg a.m.; SA~N2!50.5 m2/g BE 20820.80 99 0 1 0.016 Rabis a.m.; SA~N2!50.4 m2/g BE 20820.72 96 2 3 0.048 Tirstrup-1 a.m.; SA~N2!53.3 m2/g BE 20820.82 97 0 2 0.035 Tirstrup-2 a.m.; SA~N2!51.9 m2/g BE 20820.54 @2.26# 94 2 4 0.159 Tylstrup a.m.; SA~N2!53.3 m2/g BE 20820.68 97 2 1 0.012 Vasby a.m.; SA~N2!50.8 m2/g BE 20820.85 98 1 1 0.029 Vejen-1 a.m.; SA~N2!51.7 m2/g BE 20820.70 98 0 3 0.032 Vejen-2 a.m.; SA~N2!52.6 m2/g BE 20820.80 99 0 1 0.006 Vorbasse-1 a.m.; SA~N2!51.8 m2/g BE 20820.85 98 2 0 0.007 Vorbasse-2 a.m.; SA~N2!50.3 m2/g BE 20820.40 @2.52# 98 1 1 0.122 Vorbasse-3 a.m.; SA~N2!50.1 m2/g BE 208
@2.03#av 17 soils BE 4722.11 Cyanopropyl column 20–
25RPLC 579
2.08 Correlation logKoc– logKow 962.02 Correlation logKoc– logS 962.04 Correlation logKoc– logS~mp! 961.70 Correlation logKoc– MCI [email protected]# Correlation logKom– MCI 5912.08 Correlation logKoc– LSER 602
1,1,2-Trichloroethane„ÀTCA …
20.92 1.78 97.3 2.2 0.5 0.2 Forest soil; pH 5.6; MD 344CE50.48 me/100 g
0.15 1.80 65.2 25.6 9.2 2.2 Agricultural soil; pH 7.4;CE59.0 me/100 g
MD 344
0.60 2.03 69.5 20.5 10.1 3.7 Forest soil; pH 4.2;CE52.9 me/100 g
MD 344
@21.16# 92 5.9 2.1 0.09 Lincoln soil; pH 6.4;CE53.5 me/100 g
20 MD 541
1.84 Correlation logKoc– MCI 5781.70 Correlation logKoc– MCI 597
J. Phys. Chem. Ref. Data, Vol. 30, No. 1, 2001

277277SORPTION OF ORGANIC COMPOUNDS
TABLE 3. Sorption coefficients for halogenated alkyl hydrocarbons—Continued
log Kd
log Kf0
(1/n) log Koc
Sorbent composition~%!Other sorbent and solution data;prediction procedure
Temp.~°C! Meth. Ref.Sand Silt Clay OC
1.99 Correlation logKoc– LSER 602
1,1,2,2-Tetrachloroethane„ÀTeCA…
@20.13# @1.90# 3.3 69 26 1.6*@0.93#
Willamette soil; pH 6.8 20 BE 195
2.00 Correlation logKoc– logKow 961.87 Correlation logKoc– logS 961.80 Correlation logKoc– logS~mp! 962.04 Correlation logKoc– MCI [email protected]# Correlation logKom– MCI 5912.33 Correlation logKoc– LSER 602
1,1-Dichloroethylene
2.23*av 65* –85*
Three municipal wastewater solids 22.5 BE 535
1,2-trans-Dichloroethylene
21.30 @1.59# 97.1 2.3 0.6 0.13 Tampa aquifer; pH 8;0.01 N CaCl2
MD 521
Trichloroethylene „TCE…
2.09av Soil, sand, loess 20 HS 2262.56av Weathered shale, mudrock 20 HS 2263.43av Unweathered shale, mudrock 20 HS 2262.63 26.8 Shale~tertiary! 20 HS 2263.19 9.7 Shale~jurassic! 20 HS 2262.23 33.4 Peat 20 HS 2262.43 18.5 Lignite 20 HS 2263.24 83.6 Bitominous coal 20 HS 2263.64 80.1 Anthracite 20 HS 226
0.90 2.03 7.51 Sapsucker Woods~SW! soil 25 HS 1940.94 2.09 7.05 SW soil; ether extracted 25 HS 1940.11 2.16 0.88 SW soil humin 25 HS 1940.85 1.76 12.4 SW soil humic acid 25 HS 19420.10 0.62 19.2 SW soil fulvic acid 25 HS 1940.94 1.24 50.5 Tannic acid 25 HS 1941.89 2.08 64.6 Lignin 25 HS 1941.80 2.05 57.2 Zein 25 HS 19420.04 0.30 45.3 Cellulose 25 HS 1941.51 1.83 47.9 Aldrich humic acid 25 HS 1941.61 @2.36# 18 Muck ~,1 mm! 22 GP 5170.04 @2.37# 92 6.2 1.8 0.47 Grayling soil~,1 mm! 22 GP 5170.07 @2.14# 87.6 10.1 2.3 0.85 Keweenaw soil~,1 mm! 22 GP 51720.64 @1.77# 95.5 3.2 1.3 0.39 Eustis soil~,1 mm! 22 GP 51720.60 @1.81# 95.5 3.2 1.3 0.39 Eustis soil; 0.01 N CaCl2 MD 52221.96 @0.58# 98 1 1 0.29 Borden soil; 0.01 N CaCl2 MD 6000.80 @1.70# 60.3 24.0 15.7 12.6 Mt. Lemmon soil; 0.01 N CaCl2 MD 60020.06 @1.53# 56.6 22.0 21.4 5.18* Marlette soil~A horizon!; 20 BE 222
2.59 pH 6.4; CE516.4 me/100 g1.43 @2.61# 10.0*
6.48Idem-HDTMA complex 20 BE 222
0.76 @2.12# 7.43*4.37
Idem-DDTMA complex 20 BE 222
1.47 @2.90# 4.85* Marlette soil~Bt horizon!– 20 BE 2223.71 HDTMA complex
0.80 @2.50# 2.73*1.98
Idem-DDTMA complex 20 BE 222
1.06°~1.08!
Acid peat BE 472
0.96°~1.16!
Acid humic top soil BE 472
0.09°~0.93!
Calcareous humic top soil BE 472
J. Phys. Chem. Ref. Data, Vol. 30, No. 1, 2001

278278 DELLE SITE
TABLE 3. Sorption coefficients for halogenated alkyl hydrocarbons—Continued
log Kd
log Kf0
(1/n) log Koc
Sorbent composition~%!Other sorbent and solution data;prediction procedure
Temp.~°C! Meth. Ref.Sand Silt Clay OC
20.25°~0.88!
Subsoil rich in iron oxides BE 472
20.62°~0.70!
Clay subsoil BE 472
20.69°~0.71!
Sandy subsoil BE 472
0.45 @2.04# 36 8 2.57 Agawam soil; 0.01 M CaCl2 20–22
BE 381
20.85 1.86 97.3 2.2 0.5 0.2 Forest soil; pH 5.6;CE50.48 me/100 g
MD 344
0.32 1.98 65.2 25.6 9.2 2.2 Agricultural soil; pH 7.4;CE59.0 me/100 g
MD 344
0.72 2.15 69.5 20.5 10.1 3.7 Forest soil; pH 4.2;CE52.9 me/100 g
MD 344
@0.40# 1.80 60 26.5 13.5 4.02 Soil from a vadose zone 25 BE [email protected]# 1.86 24 Soil; composite sample from
a peat layer20 BE 616
@21.05# 92 5.9 2.1 0.09 Lincoln soil; pH 6.4;CE53.5 me/100 g
20 MD 541
20.28 94 4 2 ,0.1 Aquifer mat.; pH 8.2;SA~E!518.7 m2/g;CE52.3 me/100 g
25 HS 372
20.24 @1.74# 33 49 18 1.05 Yolo soil; pH 7.9;SA~E!580.6 m2/g;CE521.1 me/100 g
25 HS 372
0.08 @1.93# 57.5 26.4 13.7 1.41 O” dum soil; pH 7.1;SA~E!540.1 m2/g;CE513.97 me/100 g
25 HS 372
20.16 @1.79# 80.2 13.2 4.8 1.12 Lundgaard soil; pH 6.1;SA~E!510.84 m2/g;CE58.78 me/100 g
25 HS 372
21.96 0.02 Alumina; pH 4.5 25 HS 37120.61 0.06 Iron oxide; pH 6.5 25 HS 37121.3 0.02 Montmorillonite; pH 8.3 25 HS 37120.57 0.01 Kaolinite; pH 4.2–5.2 25 HS 37120.51 @1.83# 0.45 Humic acid coated alumina; pH 7.18 25 HS 37121.05 @1.84# 97.1 2.3 0.6 0.13 Tampa aquifer; pH 8;
0.01 N CaCl2
MD 521
20.97 .98 0.007 Rabis aquifer mat. 10 MD 16621.00 96 0.025 Borden aquifer; SA~N2!50.3 m2/g 22 HS 52020.77 93 0.034 Lula aquifer; SA~N2!57.7 m2/g 22 HS 52020.74 2.03 23 42 35 0.169 Upper aquitard layer~OSCL!;
CE515.5 me/100 gBE 617
0.79 2.63 17 65 18 1.49 Lower aquitard layer~DGSL!;CE529 me/100 g
BE 617
20.54 1.79 0.48 Porous alumina coated with humicacid; 0.1 M NaCl
25 HS 364
20.42 @1.90# 0.48 Idem 25 MD [email protected]#av 18 soils BE 4722.28 50.2 Aldrich and Fluka humic acid FH 206
1.72 2.20 33.5 ICN humic acid 25 HS 19320.64 1.76 0.40 ICN humic acid coated Al2O3 25 HS 1931.64 @2.41# 21.6*
17.3HDTMA-smectite complex BE 224
1.52 @2.40# 16.2*13.0
Idem BE 224
0.64 @1.79# 8.9*7.1
Idem BE 224
2.11 Cyanopropyl column 20–25
RPLC 579
1.66 Correlation logKoc– logS(180) 1932.14 Correlation logKoc– logKow(207) 1932.09 Correlation logKoc– logKow(108) 1931.70 Correlation logKoc– MCI 597
J. Phys. Chem. Ref. Data, Vol. 30, No. 1, 2001

279279SORPTION OF ORGANIC COMPOUNDS
TABLE 3. Sorption coefficients for halogenated alkyl hydrocarbons—Continued
log Kd
log Kf0
(1/n) log Koc
Sorbent composition~%!Other sorbent and solution data;prediction procedure
Temp.~°C! Meth. Ref.Sand Silt Clay OC
1.84 Correlation logKoc– MCI 578
Tetrachloroethylene „TeCE…
20.06 @2.35# 95.5 3.2 1.3 0.39 Eustis soil; 0.01 N CaCl2 MD 5221.23°~1.04!
Acid peat BE 472
1.38°~1.12!
Acid humic topsoil BE 472
0.49°~0.91!
Calcareous humic topsoil BE 472
0.30°~0.98!
Subsoil rich in iron oxides BE 472
20.45°~0.95!
Clay subsoil BE 472
21.25°~0.60!
Sand subsoil BE 472
2.64av Soil, sand, loess 20 HS 2263.29av Weathered shale, mudrock 20 HS 2264.03av Unweathered shale, mudrock 20 HS 226
@0.53# @2.56# 3.36 70.2 26.4 1.6*@0.93#
Willamette soil; pH 6.8 20 BE 195
20.13 @2.28# 95.5 3.2 1.3 0.39 Eustis Soil~,1 mm! 22 GP 51721.28 @1.26# 98 1 1 0.29 Borden soil; 0.01 N CaCl2 MD 6001.35 @2.25# 60.3 24.0 15.7 12.6 Mt. Lemmon soil; 0.01 N CaCl2 MD 60020.77 @1.75# 38.8 31.6 29.6 0.60* Marlette soil~Bt horizon!; 20 BE 222
0.30 pH 5.4; CE514.6 me/100 g1.44 @2.87# 4.85* Idem-HDTMA complex 20 BE 222,
3.71 2231.08 @2.78# 2.73*
1.98Idem-DDTMA complex 20 BE 222
0.42 @2.00# 56.6 22.0 21.4 5.18* Marlette soil~A horizon!; 20 BE 222,2.59 pH 6.4; CE516.4 me/100 g 223
1.57 @2.76# 10.0* Idem-HDTMA complex 20 BE 222,6.48 223
1.17 @2.53# 7.43*4.37
Idel-DDTMA complex 20 BE 222
3.00*av 65* –85*
Three municipal wastewater solids 22.5 BE 535
0.86 @2.45# 36 8 2.57 Agawam soil; 0.01 M CaCl2 20–22
BE 381
20.46 2.25 97.3 2.2 0.5 0.2 Forest soil; pH 5.6;CE50.48 me/100 g
MD 344
0.65 2.31 65.2 25.6 9.2 2.2 Agricultural soil; pH 7.4;CE59.0 me/100 g
MD 344
20.25 @2.57# 0.15 KB 1H soil~63–125mm!;SA~N2!54.9 m2/g
20 LE 207
@20.65# 92 5.9 2.1 0.09 Lincoln fine s soil; pH 6.4;CE53.5 me/100 g
20 MD 541
20.34° 0.03 Augusta subsurface soil~Spinks!; BE 54~1.20! median grain size50.13 mm;
SA~N2!51.2 m2/g20.17° @2.62# 0.16 Delta subsurface soil~Ottokee!; BE 54~0.93! median grain size50.20 mm;
SA~N2!51.6 m2/g0.20° @2.44# 0.58 Ann Arbor II subsurface soil BE 54~1.06! ~Bookston!; median grain size5
0.16 mm; SA~N2!54.2 m2/g1.12° 2.49 Wagner subsurface soil~Miami!; BE 54~0.78! median grain size50.53 mm;
SA~N2!51.3 m2/g1.09° 1.24 Ypsilanti subsurface soil~Wasepi!; BE 54~0.79! median grain size50.31 mm;
SA~N2!51.2 m2/g1.59° 1.29 Ann Arbor I subsurface soil BE 54
J. Phys. Chem. Ref. Data, Vol. 30, No. 1, 2001

280280 DELLE SITE
TABLE 3. Sorption coefficients for halogenated alkyl hydrocarbons—Continued
log Kd
log Kf0
(1/n) log Koc
Sorbent composition~%!Other sorbent and solution data;prediction procedure
Temp.~°C! Meth. Ref.Sand Silt Clay OC
~0.78! ~Brookston!; SA~N2!52.4 m2/g20.66 2.06 60.9 37.7 1.6 0.19 Simsbury subsurface aquifer sed.;
0.01 M CaCl2
BE 473
20.13 0.021 Borden sandy aquifer material BE 8820.46 0.02 Idem; SA~N2!50.23 m2/g;
0.005 M CaSO4
20 BE 113
20.60 91.0 5.6 3.4 0.02 Lula aquifer; 0.005 M CaSO4 MD 51920.62 52.3 41.5 6.2 0.03 Barksdale aquifer; 0.005 M CaSO4 MD 51920.46 @2.43# 97.1 2.3 0.6 0.13 Tampa aquifer; pH 8;
0.01 N CaCl2
MD 521
20.64 .98 0.007 Rabis aquifer mat. 10 MD 16620.72 78 5 2 0.007 Gravely orange sand;
CE50.8 me/100 gBE 617
20.37 2.40 23 42 35 0.169 Upper aquitard layer~OSCL!;CE515.5 me/100 g
BE 617
1.34 3.17 17 65 18 1.49 Lower aquitard layer~DGSL!;CE529 me/100 g
BE 617
20.32 0.02 Borden aquifer mat.;CE50.52 me/100 g;SA~N2!50.8 m2/g
21 BE 614
@2.38#av 18 soils BE 4722.39 Correlation logKoc– logKow 1082.14 Correlation logKoc– logKow 962.78 Correlation logKoc– logKow 2172.28 Correlation logKoc– logKow(180) 882.50 Correlation logKoc– logKow(87) 882.26 Correlation logKoc– logKow(120) 882.44 Correlation logKoc– logKow(130) 881.81 Correlation logKoc– logKow(55) 882.36 Correlation logKoc– logKow 2072.35,2.57
Correlation logKoc– logS 96
2.54,2.89
Correlation logKoc– logS~mp! 96
2.38 Correlation logKoc– logS [email protected]# Correlation logKom– MCI 5912.52 Correlation logKoc– LSER 602
1,2-Dichloropropane
@20.36# @1.67# 3.3 69 26 1.6*@0.93#
Willamette soil; pH 6.8 20 BE 195
20.17 @1.42# 36 8 2.57 Agawam soil; 0.01 M CaCl2 20–22
BE 381
@1.94# Correlation logKom– MCI 591
1,2,3-Trichloropropane
0.15 1.98 1.49 Captina soil; silt loam; pH 4.97;0.01 M CaNO3
BE 606
20.29 1.89 0.66 Mc Laurin soil; sandy loam;pH 4.43; 0.01 M CaNO3
BE 606
1,3-Dichloropropene
1.36 ~cis!1.42 ~trans!
Soil; experimental~literature data! 217
1.91 Correlation logKoc– MCI [email protected]# Correlation logKom– MCI 591
Values in square parentheses have been calculated by the author.* log Kom in column 2 and % OM content in column 6.av average value.Idem refers to the sorbent reported just above; only the data~texture, OC, temperature, method! which were changed are specified.
J. Phys. Chem. Ref. Data, Vol. 30, No. 1, 2001

281281SORPTION OF ORGANIC COMPOUNDS
TABLE 4. Sorption coefficients for halogenated benzenes
log Kd
log Kf0
(1/n) log Koc
Sorbent composition~%!Other sorbent and solution data;
prediction procedureTemp.~°C! Meth. Ref.Sand Silt Clay OC
Chlorobenzene„MCBz…
@20.04# @1.92# 9 68 21 1.9*@1.1#
Woodburn soil; CE514 me/100 g 20 BE 55
@21.05# 92 5.9 2.1 0.09 Lincoln fine s soil; pH 6.4;CE53.5 me/100 g
20 MD 541
21.85 @0.68# 98 1 1 0.29 Borden soil; 0.01 N CaCl2 MD 6001.01 @1.91# 60.3 24.0 15.7 12.6 Mt. Lemmon soil; 0.01 N CaCl2 MD 60020.41 @2.42# 0.15 KB 1H soil~63–125mm!;
SA~N2!54.9 m2/g20 LE 207
0.08 @2.21# 0.73 KS 1 soil~,125 mm!;SA~N2!54.4 m2/g
20 LE 207
20.40 0.08 KB 1H soil~,125 mm!;SA~N2!53.2 m2/g
20 LE 207
20.22 0.06 Kaolin; SA~N2!512 m2/g 20 LE 20720.22 ,0.01 g-Al2O3; SA~N2!5120 m2/g 20 LE 2070.62 ,0.01 SiO2; SA~N2!5500 m2/g 20 LE 2070.67 2.50 1.49 Captina sil soil; pH 4.97;
0.01 M CaNO3
BE 606
20.01 2.17 0.66 Mc Laurin sl soil; pH 4.43;0.01 M CaNO3
BE 606
1.35 @2.10# 18 Muck ~,1 mm!; 0.01 N CaCl2 22 GP 51720.52 @1.89# 95.5 3.2 1.3 0.39 Eustis soil~,1 mm!; 0.01 N CaCl2 MD 51721.05 @1.84# 97.1 2.3 0.6 0.13 Tampa aquifer; pH 2;
0.01 N CaCl2
MD 521
2.64*av 65* –85*
Three municipal wastewater solids 22.5 BE 535
@1.1# 2.6 2.9 Offshore Grand Haven sediment;~solute complexation model!
BE 464,494
@1.7# 3.1 3.8 Benton Harbor sediment;~solute complexation model!
BE 464,494
@2.15# 58.03 Prediction by limiting vaporsorption on soil humic acid
23 LSC 363
2.19 C18 column; correlation logKoc-(log k81D0x)
RPLC 577
2.20 C18 column; correlation logKoc-~log k81hydrogen bonding index!
RPLC 577
2.44 Correlation logKoc– logKow 2072.50 Correlation logKoc– logKow 1082.18 Correlation logKoc– logS 5642.44 Correlation logKoc– MCI [email protected]# Correlation logKom– MCI 5912.26 Correlation logKoc– CRI 6012.01 Correlation logKoc– LSER 602
Bromobenzene
2.18 Soil; experimental~literature! 2172.65 Cyanopropyl column 20–25 RPLC 5792.65 Correlation logKoc– MCI 5782.18 Correlation logKoc– logS [email protected]# Correlation logKom– MCI 591
1,2-Dichorobenzene„-DCBz…
@0.55# @2.51# 9 68 21 1.9*@1.1#
Woodburn soil; CE514 me/100 g 20 BE 55
@0.46# @2.50# 3.3 69 26 1.6*@0.93#
Willamette soil; pH 6.8 20 BE 195
1.95 @2.73# 29*@16.8#
Peaty soil BE 472
1.27 3.10 1.49 Captina sil soil; pH 4.97;0.01 M CaNO3
BE 606
0.72 2.90 0.66 Mc Laurin sl soil; pH 4.43;0.01 M CaNO3
BE 606
J. Phys. Chem. Ref. Data, Vol. 30, No. 1, 2001
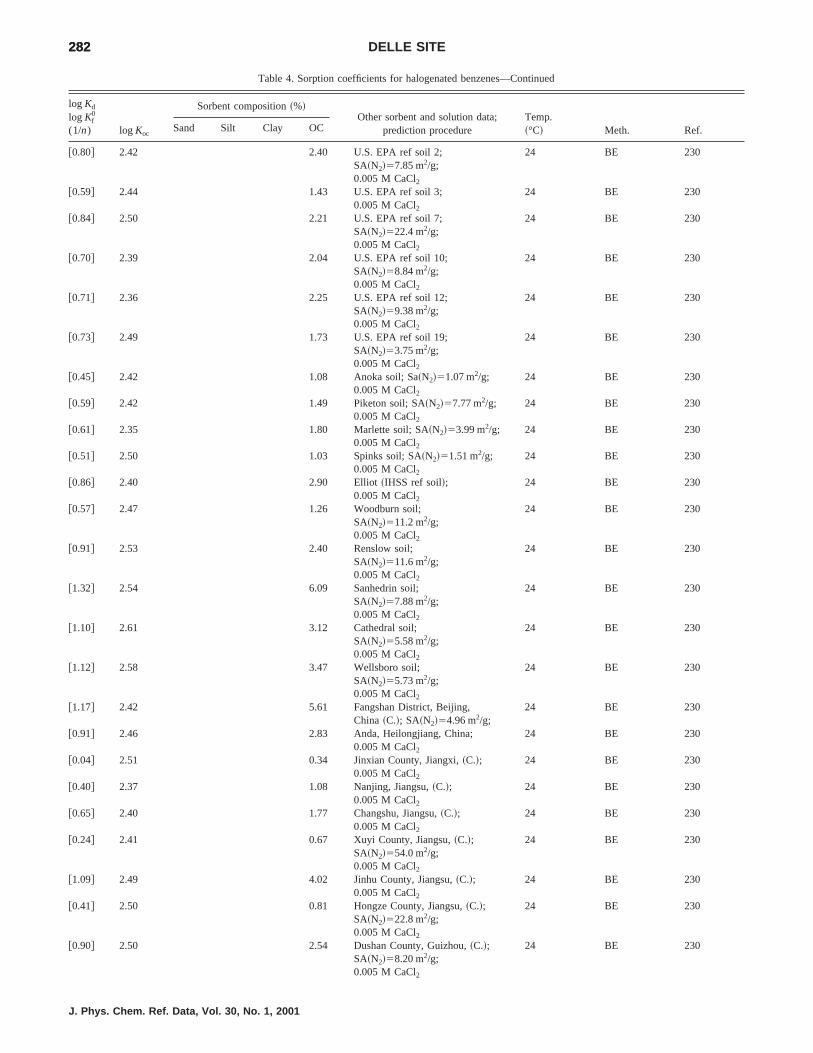
282282 DELLE SITE
Table 4. Sorption coefficients for halogenated benzenes—Continued
log Kd
log Kf0
(1/n) log Koc
Sorbent composition~%!Other sorbent and solution data;
prediction procedureTemp.~°C! Meth. Ref.Sand Silt Clay OC
@0.80# 2.42 2.40 U.S. EPA ref soil 2;SA~N2!57.85 m2/g;0.005 M CaCl2
24 BE 230
@0.59# 2.44 1.43 U.S. EPA ref soil 3;0.005 M CaCl2
24 BE 230
@0.84# 2.50 2.21 U.S. EPA ref soil 7;SA~N2!522.4 m2/g;0.005 M CaCl2
24 BE 230
@0.70# 2.39 2.04 U.S. EPA ref soil 10;SA~N2!58.84 m2/g;0.005 M CaCl2
24 BE 230
@0.71# 2.36 2.25 U.S. EPA ref soil 12;SA~N2!59.38 m2/g;0.005 M CaCl2
24 BE 230
@0.73# 2.49 1.73 U.S. EPA ref soil 19;SA~N2!53.75 m2/g;0.005 M CaCl2
24 BE 230
@0.45# 2.42 1.08 Anoka soil; Sa~N2!51.07 m2/g;0.005 M CaCl2
24 BE 230
@0.59# 2.42 1.49 Piketon soil; SA~N2!57.77 m2/g;0.005 M CaCl2
24 BE 230
@0.61# 2.35 1.80 Marlette soil; SA~N2!53.99 m2/g;0.005 M CaCl2
24 BE 230
@0.51# 2.50 1.03 Spinks soil; SA~N2!51.51 m2/g;0.005 M CaCl2
24 BE 230
@0.86# 2.40 2.90 Elliot~IHSS ref soil!;0.005 M CaCl2
24 BE 230
@0.57# 2.47 1.26 Woodburn soil;SA~N2!511.2 m2/g;0.005 M CaCl2
24 BE 230
@0.91# 2.53 2.40 Renslow soil;SA~N2!511.6 m2/g;0.005 M CaCl2
24 BE 230
@1.32# 2.54 6.09 Sanhedrin soil;SA~N2!57.88 m2/g;0.005 M CaCl2
24 BE 230
@1.10# 2.61 3.12 Cathedral soil;SA~N2!55.58 m2/g;0.005 M CaCl2
24 BE 230
@1.12# 2.58 3.47 Wellsboro soil;SA~N2!55.73 m2/g;0.005 M CaCl2
24 BE 230
@1.17# 2.42 5.61 Fangshan District, Beijing,China ~C.!; SA~N2!54.96 m2/g;
24 BE 230
@0.91# 2.46 2.83 Anda, Heilongjiang, China;0.005 M CaCl2
24 BE 230
@0.04# 2.51 0.34 Jinxian County, Jiangxi,~C.!;0.005 M CaCl2
24 BE 230
@0.40# 2.37 1.08 Nanjing, Jiangsu,~C.!;0.005 M CaCl2
24 BE 230
@0.65# 2.40 1.77 Changshu, Jiangsu,~C.!;0.005 M CaCl2
24 BE 230
@0.24# 2.41 0.67 Xuyi County, Jiangsu,~C.!;SA~N2!554.0 m2/g;0.005 M CaCl2
24 BE 230
@1.09# 2.49 4.02 Jinhu County, Jiangsu,~C.!;0.005 M CaCl2
24 BE 230
@0.41# 2.50 0.81 Hongze County, Jiangsu,~C.!;SA~N2!522.8 m2/g;0.005 M CaCl2
24 BE 230
@0.90# 2.50 2.54 Dushan County, Guizhou,~C.!;SA~N2!58.20 m2/g;0.005 M CaCl2
24 BE 230
J. Phys. Chem. Ref. Data, Vol. 30, No. 1, 2001
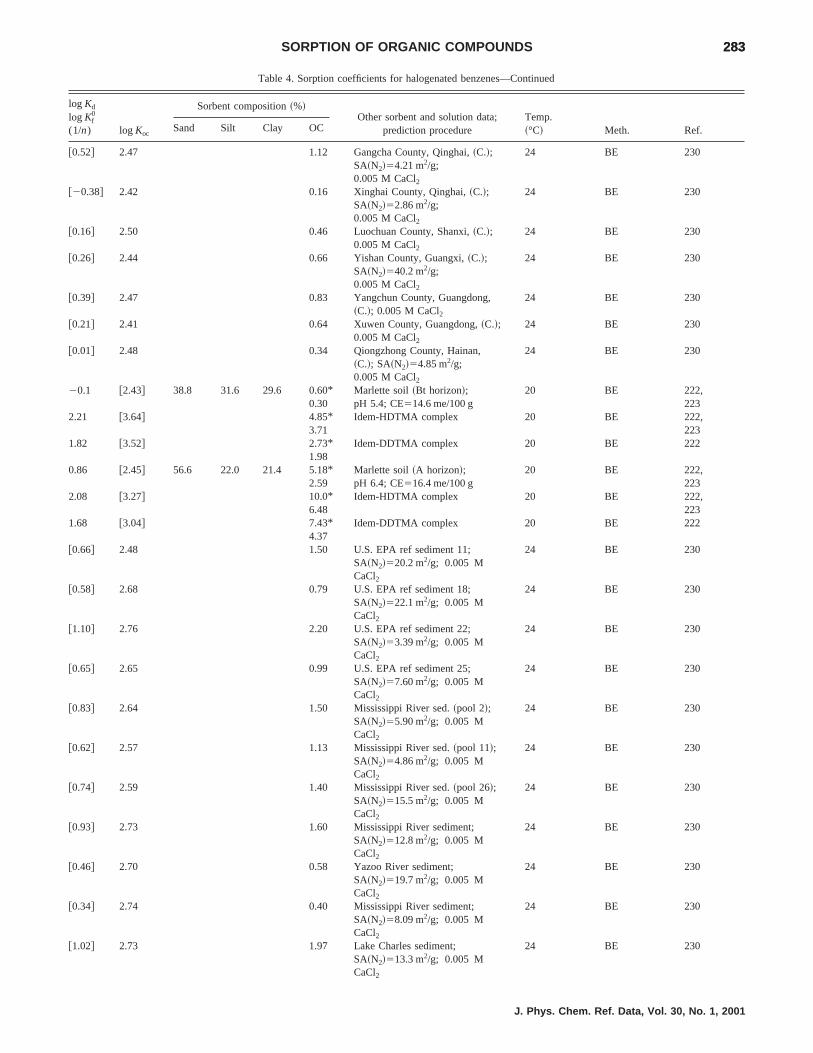
283283SORPTION OF ORGANIC COMPOUNDS
Table 4. Sorption coefficients for halogenated benzenes—Continued
log Kd
log Kf0
(1/n) log Koc
Sorbent composition~%!Other sorbent and solution data;
prediction procedureTemp.~°C! Meth. Ref.Sand Silt Clay OC
@0.52# 2.47 1.12 Gangcha County, Qinghai,~C.!;SA~N2!54.21 m2/g;0.005 M CaCl2
24 BE 230
@20.38# 2.42 0.16 Xinghai County, Qinghai,~C.!;SA~N2!52.86 m2/g;0.005 M CaCl2
24 BE 230
@0.16# 2.50 0.46 Luochuan County, Shanxi,~C.!;0.005 M CaCl2
24 BE 230
@0.26# 2.44 0.66 Yishan County, Guangxi,~C.!;SA~N2!540.2 m2/g;0.005 M CaCl2
24 BE 230
@0.39# 2.47 0.83 Yangchun County, Guangdong,~C.!; 0.005 M CaCl2
24 BE 230
@0.21# 2.41 0.64 Xuwen County, Guangdong,~C.!;0.005 M CaCl2
24 BE 230
@0.01# 2.48 0.34 Qiongzhong County, Hainan,~C.!; SA~N2!54.85 m2/g;0.005 M CaCl2
24 BE 230
20.1 @2.43# 38.8 31.6 29.6 0.60*0.30
Marlette soil~Bt horizon!;pH 5.4; CE514.6 me/100 g
20 BE 222,223
2.21 @3.64# 4.85*3.71
Idem-HDTMA complex 20 BE 222,223
1.82 @3.52# 2.73*1.98
Idem-DDTMA complex 20 BE 222
0.86 @2.45# 56.6 22.0 21.4 5.18*2.59
Marlette soil~A horizon!;pH 6.4; CE516.4 me/100 g
20 BE 222,223
2.08 @3.27# 10.0*6.48
Idem-HDTMA complex 20 BE 222,223
1.68 @3.04# 7.43*4.37
Idem-DDTMA complex 20 BE 222
@0.66# 2.48 1.50 U.S. EPA ref sediment 11;SA~N2!520.2 m2/g; 0.005 MCaCl2
24 BE 230
@0.58# 2.68 0.79 U.S. EPA ref sediment 18;SA~N2!522.1 m2/g; 0.005 MCaCl2
24 BE 230
@1.10# 2.76 2.20 U.S. EPA ref sediment 22;SA~N2!53.39 m2/g; 0.005 MCaCl2
24 BE 230
@0.65# 2.65 0.99 U.S. EPA ref sediment 25;SA~N2!57.60 m2/g; 0.005 MCaCl2
24 BE 230
@0.83# 2.64 1.50 Mississippi River sed.~pool 2!;SA~N2!55.90 m2/g; 0.005 MCaCl2
24 BE 230
@0.62# 2.57 1.13 Mississippi River sed.~pool 11!;SA~N2!54.86 m2/g; 0.005 MCaCl2
24 BE 230
@0.74# 2.59 1.40 Mississippi River sed.~pool 26!;SA~N2!515.5 m2/g; 0.005 MCaCl2
24 BE 230
@0.93# 2.73 1.60 Mississippi River sediment;SA~N2!512.8 m2/g; 0.005 MCaCl2
24 BE 230
@0.46# 2.70 0.58 Yazoo River sediment;SA~N2!519.7 m2/g; 0.005 MCaCl2
24 BE 230
@0.34# 2.74 0.40 Mississippi River sediment;SA~N2!58.09 m2/g; 0.005 MCaCl2
24 BE 230
@1.02# 2.73 1.97 Lake Charles sediment;SA~N2!513.3 m2/g; 0.005 MCaCl2
24 BE 230
J. Phys. Chem. Ref. Data, Vol. 30, No. 1, 2001

284284 DELLE SITE
Table 4. Sorption coefficients for halogenated benzenes—Continued
log Kd
log Kf0
(1/n) log Koc
Sorbent composition~%!Other sorbent and solution data;
prediction procedureTemp.~°C! Meth. Ref.Sand Silt Clay OC
@0.78# 2.71 1.17 Suisin Bay marine sediment;SA~N2!515.7 m2/g; 0.005 MCaCl2
24 BE 230
@0.90# 2.73 1.48 Suisin Bay marine sediment;SA~N2!521.6 m2/g; 0.005 MCaCl2
24 BE 230
@0.98# 2.73 1.78 Suisin Bay marine sediment;SA~N2!521.3 m2/g; 0.005 MCaCl2
24 BE 230
@1.42# 2.74 4.73 Tangwang River sed., China~C.!;SA~N2!512.8 m2/g; 0.005 MCaCl2
24 BE 230
@0.79# 2.74 1.12 Sonhuajiang River sed.~C.!;0.005 M CaCl2
24 BE 230
@0.92# 2.62 1.99 Tumen River sediment~C.!;SA~N2!54.93 m2/g; 0.005 MCaCl2
24 BE 230
@1.37# 2.75 4.12 Xuanwu Lake sediment~C.!;0.005 M CaCl2
24 BE 230
@0.83# 2.74 1.24 Guchen Lake sediment~C.!;0.005 M CaCl2
24 BE 230
@0.68# 2.66 1.04 Lake Hongze sediment~C.!;SA~N2!529.9 m2/g; 0.005 MCaCl2
24 BE 230
@1.27# 2.74 3.37 Zhujiang River sediment~C.!;0.005 M CaCl2
24 BE 230
@20.19# 2.77 0.11 Yellow River sediment~C.!;0.005 M CaCl2
24 BE 230
@20.28# 2.68 0.11 Yinghe River sediment~C.!;SA~N2!51.85 m2/g; 0.005 MCaCl2
24 BE 230
@1.12# 2.78 2.19 Ziya River sediment~C.!;SA~N2!55.83 m2/g; 0.005 MCaCl2
24 BE 230
@0.58# 2.73 0.70 Ganjiang River sediment~C.!;SA~N2!55.32 m2/g; 0.005 MCaCl2
24 BE 230
@1.09# 2.64 2.82 Zishui River sediment~C.!;SA~N2!58.97 m2/g; 0.005 MCaCl2
24 BE 230
@0.20# 2.74 0.29 Liuyanghe River sediment~C.!;0.005 M CaCl2
24 BE 230
@0.74# 2.65 1.22 Youshui River sediment~C.!;SA~N2!511.9 m2/g; 0.005 MCaCl2
24 BE 230
@0.27# 2.68 0.39 Niqu River sediment~C.!;SA~N2!54.84 m2/g; 0.005 MCaCl2
24 BE 230
@0.43# 2.73 0.50 Huaihe River sediment~C.!;SA~N2!517.6 m2/g; 0.005 MCaCl2
24 BE 230
@0.32# 2.67 0.45 Huaihe River sediment~C.!;SA~N2!58.21 m2/g; 0.005 MCaCl2
24 BE 230
@0.63# 2.77 0.73 Jinghe River sediment~C.!;SA~N2!512.1 m2/g; 0.005 MCaCl2
24 BE 230
@0.28# 2.70 0.38 Sangonghe River sediment~C.!;SA~N2!54.00 m2/g; 0.005 MCaCl2
24 BE 230
@0.37# 2.72 0.45 Yaluzangbu River sediment~C.!;SA~N2!54.94 m2/g; 0.005 MCaCl2
24 BE 230
J. Phys. Chem. Ref. Data, Vol. 30, No. 1, 2001

285285SORPTION OF ORGANIC COMPOUNDS
Table 4. Sorption coefficients for halogenated benzenes—Continued
log Kd
log Kf0
(1/n) log Koc
Sorbent composition~%!Other sorbent and solution data;
prediction procedureTemp.~°C! Meth. Ref.Sand Silt Clay OC
@1.02# 2.73 1.94 Lake Pumo sediment~C.!;SA~N2!53.87 m2/g; 0.005 MCaCl2
24 BE 230
@0.43# 2.69 0.54 Niyanghe River sediment~C.!;SA~N2!53.12 m2/g; 0.005 MCaCl2
24 BE 230
@3.21# 4.6 4.1 Lake Ontario sediment trapmaterial
FM 49
4.6 50 Niagara River organic matter FM 4920.08 .98 0.007 Rabis aquifer mat. 10 MD 16621.00 40.8 53.1 4.7 0.0096 Tinker aquifer; Fe514 g/kg;
SA~N2!59.2 m2/g;CE539.95 me/100 g
22.5 BE 213,609
20.74 74.8 18.2 0.027 Carswell aquifer; Fe59.0 g/kg;SA~N2!59.5 m2/g;CE513.91 me/100 g
22.5 BE 213,609
20.52 2.45 52.3 41.5 0.105 Barksdale aquifer; Fe510.0 g/kg;SA~N2!57.5 m2/g;CE564.36 me/100 g
22.5 BE 213,609
0.11 2.91 67.8 27.3 3.5 0.156 Blythsville aquifer; Fe57.0 g/kg;SA~N2!58.0 m2/g;CE532.98 me/100 g
22.5 BE 213,609
20.44 98.2 1.1 0.011 Traverse City aquifer;Fe53.0 g/kg;SA~N2!50.2 m2/g;CE528.11 me/100 g
22.5 BE 213
20.52 96.0 2.0 2.0 0.016 Borden aquifer; Fe515.0 g/kgSA~N2!50.3 m2/g;
22.5 BE 213,609
20.85 91.0 5.6 3.4 0.020 Lula aquifer; Fe529.0 g/kg;SA~N2!511.8 m2/g;CE59.83 me/100 g
22.5 BE 213,609
20.09 0.02 Borden aquifer mat.;CE50.52 me/100 g;SA~N2!50.8 m2/g
21 BE 614
@2.72# 58.03 Prediction by limiting vaporsorption on soil humic acid
23 LSC 363
2.39 C18 column; correlation logKoc-(log k81D0x)
RPLC 577
2.40 C18 column; correlation logKoc-(log k81hydrogen bonding index!
RPLC 577
3.00 Correlation logKoc– logKow 962.66 Correlation logKoc– MCI [email protected]# Correlation logKom– MCI 5912.79 Correlation logKoc– CRI 6012.44 Correlation logKoc– LSER 602
1,3-Dichlorobenzene„-DCBz…
1.70 @2.44# 18 Muck ~,1 mm! 22 GP 51720.03 @2.38# 95.5 3.2 1.3 0.39 Eustis soil~,1 mm!; 0.01 N
CaCl2
MD 517
1.90 @2.68# 29*@16.8#
Peaty soil BE 472
@2.47# 9 68 21 1.9*@1.1#
Woodburn soil; CE514 me/100 g 20 BE 55
20.42 @2.47# 97.1 2.3 0.6 0.13 Tampa aquifer; pH 2;0.01 N CaCl2
MD 521
@3.11# 4.5 4.1 Lake Ontario sediment trapmaterial
FM 49
4.1 50 Niagara River organic matter FM [email protected]# 58.03 Prediction by limiting vapor
sorption on soil humic acid23 LSC 363
2.43 Humic acid-silica column 20–23 RPLC 5872.58 Salicylic acid-silica column 20–23 RPLC 587
J. Phys. Chem. Ref. Data, Vol. 30, No. 1, 2001

286286 DELLE SITE
Table 4. Sorption coefficients for halogenated benzenes—Continued
log Kd
log Kf0
(1/n) log Koc
Sorbent composition~%!Other sorbent and solution data;
prediction procedureTemp.~°C! Meth. Ref.Sand Silt Clay OC
2.88 8-Hydroxyquinoline-silica column 20–23 RPLC 5872.60 C18 column; correlation logKoc-
(log k81D0x)RPLC 577
2.60 C18 column; correlation logKoc-(log k81hydrogen bonding index!
RPLC 577
3.0 Correlation logKoc– logKow(96) 492.65 Correlation logKoc– MCI [email protected]# Correlation logKom– MCI 5912.81 Correlation logKoc– CRI 6012.47 Correlation logKoc– LSER 602
1,4-Dichlorobenzene„-DCBz…
@0.48# @2.44# 9 68 21 1.9*@1.1#
Woodburn soil; CE514 me/100 g 20 BE 55
@20.14# 2.82 4 10 86 0.11 Apison soil; pH 4.5;CE576 me/100 g
BE 570
@20.29# 11 21 68 0.06 Fullerton soil; pH 4.4;CE564 me/100 g
BE 570
@0.53# 2.45 2 38 60 1.2 Dormont soil; pH 4.2;CE5129 me/100 g
BE 570
1.86 @2.64# 29**@16.8#
Peaty soil BE 472
0.04 @2.87# 0.15 KB 1H soil~63–125mm!;SA~N2!54.9 m2/g
20 LE 207
0.64 @2.78# 0.73 KS 1 soil~,125 mm!;SA~N2!54.4 m2/g
20 LE 207
0.04 0.08 KB 1H soil~,125 mm!;SA~N2!53.2 m2/g
20 LE 207
0.04 0.06 Kaolin; SA~N2!512 m2/g 20 LE 20720.05 ,0.01 g-Al2O3 ; SA~N2!5120 m2/g 20 LE 2070.78 ,0.01 SiO2 ; SA~N2!5500 m2/g 20 LE [email protected]# 92 5.9 2.1 0.09 Lincoln fine s soil; pH 6.4;
CE53.5 me/100 g20 MD 541
20.12° 0.03 Augusta subsurface soil~Spinks!; BE 54~0.76! median grain size50.13 mm;
SA~N2!51.2 m2/g20.01° @2.79# 0.16 Delta subsurface soil~Ottokee!; BE 54~0.89! median grain size50.20 mm;
SA~N2!51.6 m2/g0.30° @2.54# 0.58 Ann Arbor II subsurface soil BE 54~0.88! ~Brookston!; median grain size5
0.16 mm; SA~N2!54.2 m2/g1.26° 2.49 Wagner subsurface soil~Miami!; BE 54~0.77! median grain size50.53 mm;
SA~N2!51.3 m2/g1.23° 1.24 Ypsilanti subsurface soil~Wasepi!; BE 54~0.78! median grain size50.31 mm;
SA~N2!51.2 m2/g1.78°~0.69!
1.29 Ann Arbor I subsurface soil~Brookston!; median grain size50.21 mm; SA~N2!52.4 m2/g
BE 54
20.12 .98 0.007 Rabis aquifer mat. 10 MD [email protected]# 4.8 4.1 Lake Ontario sediment trap
materialFM 49
5.0 50 Niagara River organic matter FM 491.94 @2.95# 17*
@9.86#Charles River sediment 22 GP 155
2.92 50.2 Aldrich humic acid; pH 8.0;0.1 M NaHCO3
22 ED 206
2.91 50.2 Aldrich and Fluka humic acid FH [email protected]# 58.03 Prediction by limiting vapor
sorption~LSC! on soil humic acid23 LSC 363
J. Phys. Chem. Ref. Data, Vol. 30, No. 1, 2001
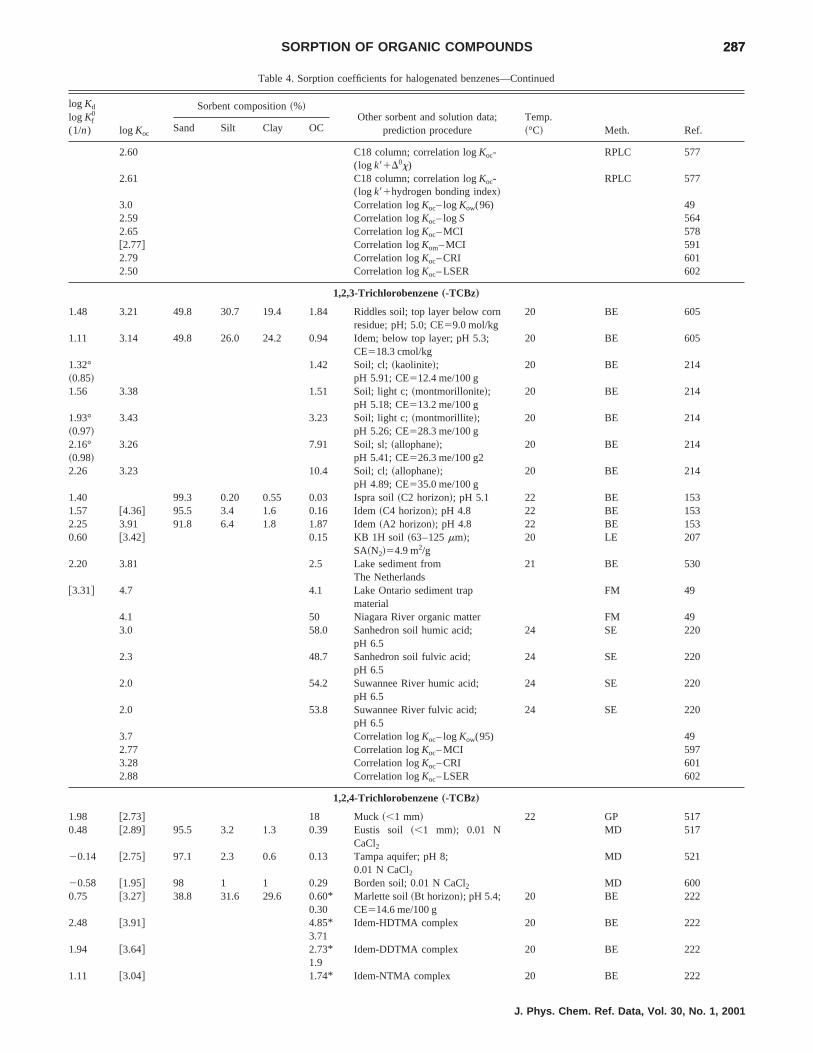
287287SORPTION OF ORGANIC COMPOUNDS
Table 4. Sorption coefficients for halogenated benzenes—Continued
log Kd
log Kf0
(1/n) log Koc
Sorbent composition~%!Other sorbent and solution data;
prediction procedureTemp.~°C! Meth. Ref.Sand Silt Clay OC
2.60 C18 column; correlation logKoc-(log k81D0x)
RPLC 577
2.61 C18 column; correlation logKoc-(log k81hydrogen bonding index!
RPLC 577
3.0 Correlation logKoc– logKow(96) 492.59 Correlation logKoc– logS 5642.65 Correlation logKoc– MCI [email protected]# Correlation logKom– MCI 5912.79 Correlation logKoc– CRI 6012.50 Correlation logKoc– LSER 602
1,2,3-Trichlorobenzene„-TCBz…
1.48 3.21 49.8 30.7 19.4 1.84 Riddles soil; top layer below cornresidue; pH; 5.0; CE59.0 mol/kg
20 BE 605
1.11 3.14 49.8 26.0 24.2 0.94 Idem; below top layer; pH 5.3;CE518.3 cmol/kg
20 BE 605
1.32° 1.42 Soil; cl;~kaolinite!; 20 BE 214~0.85! pH 5.91; CE512.4 me/100 g1.56 3.38 1.51 Soil; light c;~montmorillonite!;
pH 5.18; CE513.2 me/100 g20 BE 214
1.93° 3.43 3.23 Soil; light c;~montmorillite!; 20 BE 214~0.97! pH 5.26; CE528.3 me/100 g2.16° 3.26 7.91 Soil; sl;~allophane!; 20 BE 214~0.98! pH 5.41; CE526.3 me/100 g22.26 3.23 10.4 Soil; cl;~allophane!;
pH 4.89; CE535.0 me/100 g20 BE 214
1.40 99.3 0.20 0.55 0.03 Ispra soil~C2 horizon!; pH 5.1 22 BE 1531.57 @4.36# 95.5 3.4 1.6 0.16 Idem~C4 horizon!; pH 4.8 22 BE 1532.25 3.91 91.8 6.4 1.8 1.87 Idem~A2 horizon!; pH 4.8 22 BE 1530.60 @3.42# 0.15 KB 1H soil~63–125mm!;
SA~N2!54.9 m2/g20 LE 207
2.20 3.81 2.5 Lake sediment fromThe Netherlands
21 BE 530
@3.31# 4.7 4.1 Lake Ontario sediment trapmaterial
FM 49
4.1 50 Niagara River organic matter FM 493.0 58.0 Sanhedron soil humic acid;
pH 6.524 SE 220
2.3 48.7 Sanhedron soil fulvic acid;pH 6.5
24 SE 220
2.0 54.2 Suwannee River humic acid;pH 6.5
24 SE 220
2.0 53.8 Suwannee River fulvic acid;pH 6.5
24 SE 220
3.7 Correlation logKoc– logKow(95) 492.77 Correlation logKoc– MCI 5973.28 Correlation logKoc– CRI 6012.88 Correlation logKoc– LSER 602
1,2,4-Trichlorobenzene„-TCBz…
1.98 @2.73# 18 Muck ~,1 mm! 22 GP 5170.48 @2.89# 95.5 3.2 1.3 0.39 Eustis soil~,1 mm!; 0.01 N
CaCl2
MD 517
20.14 @2.75# 97.1 2.3 0.6 0.13 Tampa aquifer; pH 8;0.01 N CaCl2
MD 521
20.58 @1.95# 98 1 1 0.29 Borden soil; 0.01 N CaCl2 MD 6000.75 @3.27# 38.8 31.6 29.6 0.60* Marlette soil~Bt horizon!; pH 5.4; 20 BE 222
0.30 CE514.6 me/100 g2.48 @3.91# 4.85* Idem-HDTMA complex 20 BE 222
3.711.94 @3.64# 2.73*
1.9Idem-DDTMA complex 20 BE 222
1.11 @3.04# 1.74* Idem-NTMA complex 20 BE 222
J. Phys. Chem. Ref. Data, Vol. 30, No. 1, 2001

288288 DELLE SITE
Table 4. Sorption coefficients for halogenated benzenes—Continued
log Kd
log Kf0
(1/n) log Koc
Sorbent composition~%!Other sorbent and solution data;
prediction procedureTemp.~°C! Meth. Ref.Sand Silt Clay OC
1.181.61 @3.19# 56.6 22.0 21.4 5.18* Marlette soil~A horizon!; pH 6.4; 20 BE 222
2.59 CE516.4 me/100 g2.47 @3.66# 10.0* Idem-HDTMA complex 20 BE 222
6.482.04 @3.40# 7.43* Idem-DDTMA complex 20 BE 222
[email protected]# 3.32 4 10 86 0.11 Apison soil; pH 4.5;
CE576 me/100 gBE 570
@20.11# 11 21 68 0.06 Fullerton soil; pH 4.4;CE564 me/100 g
BE 570
@1.03# 2.95 2 38 60 1.2 Dormont soil; pH 4.2;CE5129 me/100 g
BE 570
@0.98# @2.94# 9 68 21 1.9* Woodburn soil; CE514 me/100 g 20 BE [email protected]#
2.38 @3.16# 29* Peaty soil BE [email protected]#
1.61 99.3 0.20 0.55 0.03 Ispra soil~C2 horizon!; pH 5.1 22 BE 1531.59 95.5 3.4 1.6 0.16 Idem~C4 horizon!; pH 4.8 22 BE 1532.35 4.02 91.8 6.4 1.8 1.87 Idem~A2 horizon!; pH 4.8 22 BE 1530.55 @3.37# 0.15 KB 1H soil~63 mm–125mm!;
SA~N2!54.9 m2/g20 LE 207
1.16 @3.30# 0.73 KS 1 soil~,125 mm!;SA~N2!54.4 m2/g
20 LE 207
0.40 0.08 KB 1H soil~,125 mm!;SA~N2!53.2 m2/g
20 LE 207
0.38 0.06 Kaolin; SA~N2!512 m2/g 20 LE 2070.18 ,0.01 g-Al2O3 ; SA~N2!5120 m2/g 20 LE 2070.88 ,0.01 SiO2 ; SA~N2!5500 m2/g 20 LE [email protected]# 92 5.9 2.1 0.09 Lincoln soil; fine sand; pH 6.4; 20 MD 541
CE53.5 me/100 g0.41° 0.03 Augusta subsurface soil~Spinks!; BE 54~0.84! median grain size50.13 nm;
SA~N2!51.2 m2/g0.69° 0.16 Delta subsurface soil~Ottokee!; BE 54~0.85! median grain size50.20 mm;
SA~N2!51.6 m2/g0.98° @3.22# 0.58 Ann Arbor II subsurface soil BE 54~0.89! ~Brookstan!; median grain
size50.16 mm;SA~N2!54.2 m2/g
1.65° 2.49 Wagner subsurface soil~Miami!; BE 54~0.77! median grain size50.53 mm;
SA~N2!51.3 m2/g1.72° 1.24 Ypsilanti subsurface soil~Wasepi!; BE 54~0.75! median grain size50.31 mm;
SA~N2!51.2 m2/g2.04° 1.29 Ann Arbor I subsurface soil BE 54~0.68! ~Brookston!; median grain
size50.21 mm;SA~N2!52.4 m2/g
2.22 2.65 37.8 Leaves 25 BE 6111.28 1.68 39.8 Thatch 25 BE 6112.42 @3.43# 17*
@9.86#Charles River sediment 24 GP 155
@3.31# 4.7 4.1 Lake Ontario sediment trapmaterial
FM 49
4.4 50 Niagara River organic matter FM 493.11 50.2 Aldrich humic acid; pH 8.0;
0.01 M NaHCO3
22 ED 206
3.32 50.2 Aldrich and Fluka humic acid FH 206
J. Phys. Chem. Ref. Data, Vol. 30, No. 1, 2001

289289SORPTION OF ORGANIC COMPOUNDS
Table 4. Sorption coefficients for halogenated benzenes—Continued
log Kd
log Kf0
(1/n) log Koc
Sorbent composition~%!Other sorbent and solution data;
prediction procedureTemp.~°C! Meth. Ref.Sand Silt Clay OC
@3.27# 58.03 Prediction by limiting vaporsorption by soil humic acid
23 LSC 363
2.71 C18 column; correlation logKoc–(log k81D0x)
RPLC 577
2.71 C18 column; correlation logKoc–~log k81hydrogen bonding index!
RPLC 577
3.6 Correlation logKoc– logKow(96) 492.83 Correlation logKoc– logS 5642.86 Correlation logKoc– MCI [email protected]# Correlation logKom– MCI 5913.32 Correlation logKoc– CRI 6012.94 Correlation logKoc– LSER 602
1,3,5-Trichlorobenzene„-TCBz…
2.48 @3.26# 29*@16.8#
Peaty soil BE 472
1.59 99.3 0.20 0.55 0.03 Ispra soil~C2 horizon!; pH 5.1 22 BE 1531.71 @4.51# 95.5 3.4 1.6 0.16 Idem~C4 horizon!; pH 4.8 22 BE 1532.46 4.13 91.8 6.4 1.8 1.87 Idem~A2 horizon!; pH 4.8 22 BE 1530.15 2.85 97.3 2.2 0.5 0.2 Forest soil; pH 5.6;
CE50.48 me/100 gMD 344
2.36 3.96 2.5 Lake sediment fromThe Netherlands
21 BE 530
5.1 4.1 Lake Ontario sediment trapmaterial
FM 49
4.2 50 Niagara River organic matter FM 493.8 Correlation logKoc– logKow(96) 492.85 Correlation logKoc– MCI 5782.75 Correlation logKoc– MCI 5973.35 Correlation logKoc– CRI 6012.96 Correlation logKoc– LSER 602
1,2,3,4-Tetrachlorobenzene„-TeCBz…
0.74 @3.15# 95.5 3.2 1.3 0.39 Eustis soil. 0.01 N CaCl2 MD 5221.67° 3.52 1.42 Soil; cl;~kaolinite!; 20 BE 214~0.89! pH 5.91; CE512.4 me/100 g2.09° 3.91 1.51 Soil; light c;~montmorillonite!; 20 BE 214~1.00! pH 5.18; CE513.0 me/100 g2.26° 3.75 3.23 Soil; light c;~montmorillite! 20 BE 214~0.87! pH 5.26; CE528.3 me/100 g2.50° 3.48 7.91 Soil; sl;~allophane!; 20 BE 214~0.88! pH 5.41; CE526.3 me/100 g2.53° 3.52 10.4 Soil; cl;~allophane!; 20 BE 214~1.00! pH 4.89; CE535.0 me/100 g1.56 99.3 0.20 0.55 0.03 Ispra soil~C2 horizon!; pH 5.1 22 BE 1531.73 @4.53# 95.5 3.4 1.6 0.16 Idem~C4 horizon!; pH 4.8 22 BE 1532.58 4.28 91.8 6.4 1.8 1.87 Idem~A2 horizon!; pH 4.8 22 BE [email protected]# @3.49# 2.64* Batcombe sil soil; pH 5.9; 20 BE 120
@1.53# 0.01 M CaCl21.02 @3.84# 0.15 KB 1H soil~63–125mm!;
SA~N2!54.9 m2/g20 LE 207
1.76 @3.19# 6.5*@3.77#
Iowa EPA-10 soil 22 GP 155
3.09 @4.10# 17* Charles River sediment; 24 GP [email protected]# mixed particle size ~,28–840
mm!3.01 @4.02# Idem 40 1552.84 @3.85# Idem 55 1553.18 @4.19# Idem; particle size596mm 23 1553.14 @4.15# Idem; particle size5232mm 28 1552.62 @3.92# 8.8*
@5.10#North River sediment 23 GP 155
J. Phys. Chem. Ref. Data, Vol. 30, No. 1, 2001
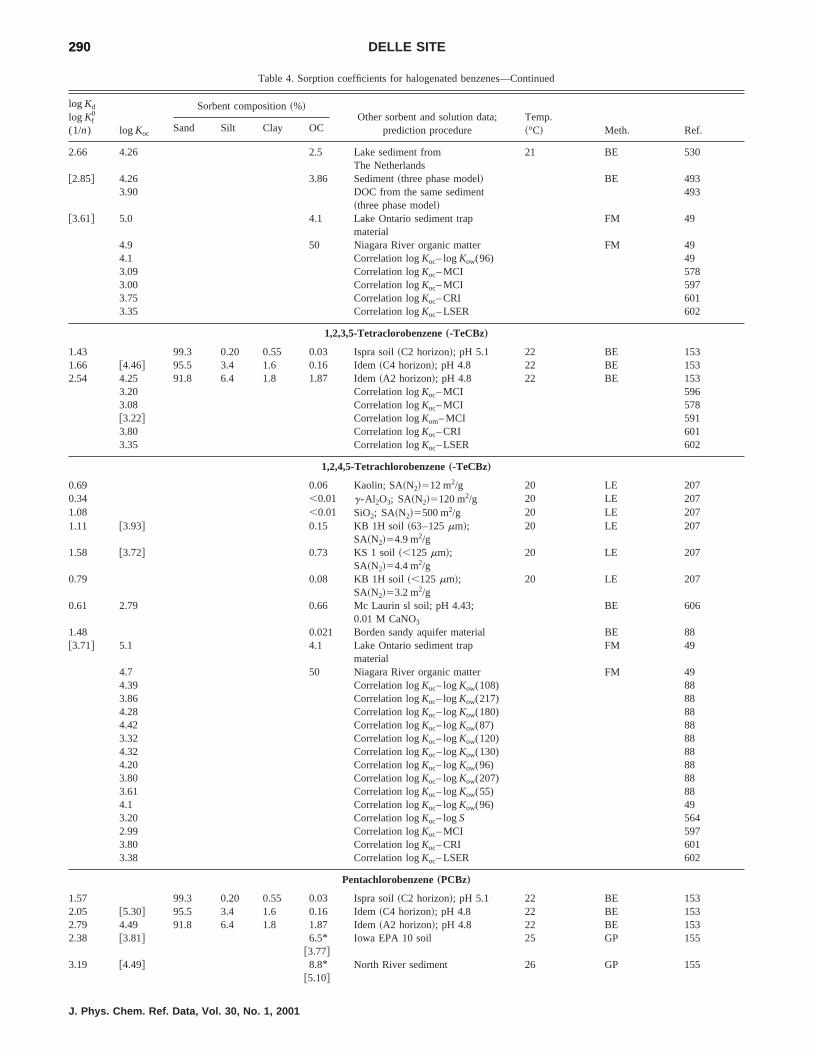
290290 DELLE SITE
Table 4. Sorption coefficients for halogenated benzenes—Continued
log Kd
log Kf0
(1/n) log Koc
Sorbent composition~%!Other sorbent and solution data;
prediction procedureTemp.~°C! Meth. Ref.Sand Silt Clay OC
2.66 4.26 2.5 Lake sediment fromThe Netherlands
21 BE 530
@2.85# 4.26 3.86 Sediment~three phase model! BE 4933.90 DOC from the same sediment
~three phase model!493
@3.61# 5.0 4.1 Lake Ontario sediment trapmaterial
FM 49
4.9 50 Niagara River organic matter FM 494.1 Correlation logKoc– logKow(96) 493.09 Correlation logKoc– MCI 5783.00 Correlation logKoc– MCI 5973.75 Correlation logKoc– CRI 6013.35 Correlation logKoc– LSER 602
1,2,3,5-Tetraclorobenzene„-TeCBz…
1.43 99.3 0.20 0.55 0.03 Ispra soil~C2 horizon!; pH 5.1 22 BE 1531.66 @4.46# 95.5 3.4 1.6 0.16 Idem~C4 horizon!; pH 4.8 22 BE 1532.54 4.25 91.8 6.4 1.8 1.87 Idem~A2 horizon!; pH 4.8 22 BE 153
3.20 Correlation logKoc– MCI 5963.08 Correlation logKoc– MCI [email protected]# Correlation logKom– MCI 5913.80 Correlation logKoc– CRI 6013.35 Correlation logKoc– LSER 602
1,2,4,5-Tetrachlorobenzene„-TeCBz…
0.69 0.06 Kaolin; SA~N2!512 m2/g 20 LE 2070.34 ,0.01 g-Al2O3; SA~N2!5120 m2/g 20 LE 2071.08 ,0.01 SiO2; SA~N2!5500 m2/g 20 LE 2071.11 @3.93# 0.15 KB 1H soil~63–125mm!;
SA~N2!54.9 m2/g20 LE 207
1.58 @3.72# 0.73 KS 1 soil~,125 mm!;SA~N2!54.4 m2/g
20 LE 207
0.79 0.08 KB 1H soil~,125 mm!; 20 LE 207SA~N2!53.2 m2/g
0.61 2.79 0.66 Mc Laurin sl soil; pH 4.43;0.01 M CaNO3
BE 606
1.48 0.021 Borden sandy aquifer material BE [email protected]# 5.1 4.1 Lake Ontario sediment trap
materialFM 49
4.7 50 Niagara River organic matter FM 494.39 Correlation logKoc– logKow(108) 883.86 Correlation logKoc– logKow(217) 884.28 Correlation logKoc– logKow(180) 884.42 Correlation logKoc– logKow(87) 883.32 Correlation logKoc– logKow(120) 884.32 Correlation logKoc– logKow(130) 884.20 Correlation logKoc– logKow(96) 883.80 Correlation logKoc– logKow(207) 883.61 Correlation logKoc– logKow(55) 884.1 Correlation logKoc– logKow(96) 493.20 Correlation logKoc– logS 5642.99 Correlation logKoc– MCI 5973.80 Correlation logKoc– CRI 6013.38 Correlation logKoc– LSER 602
Pentachlorobenzene„PCBz…
1.57 99.3 0.20 0.55 0.03 Ispra soil~C2 horizon!; pH 5.1 22 BE 1532.05 @5.30# 95.5 3.4 1.6 0.16 Idem~C4 horizon!; pH 4.8 22 BE 1532.79 4.49 91.8 6.4 1.8 1.87 Idem~A2 horizon!; pH 4.8 22 BE 1532.38 @3.81# 6.5*
@3.77#Iowa EPA 10 soil 25 GP 155
3.19 @4.49# 8.8*@5.10#
North River sediment 26 GP 155
J. Phys. Chem. Ref. Data, Vol. 30, No. 1, 2001

291291SORPTION OF ORGANIC COMPOUNDS
Table 4. Sorption coefficients for halogenated benzenes—Continued
log Kd
log Kf0
(1/n) log Koc
Sorbent composition~%!Other sorbent and solution data;
prediction procedureTemp.~°C! Meth. Ref.Sand Silt Clay OC
3.67 @4.38# 17*@9.86#
Charles River sediment 23 GP 155
3.08 4.68 2.5 Lake sediment fromThe Netherlands
21 BE 530
3.91 @5.42# 27.1 52.6 3.04 Ohio Riv. sed.~Ceredo, WV!~2.5 g/L!; pH 6.90;equilibr. time528 d
GP 156
3.85 @5.37# Idem ~3.5 g/L!; equilibr.time515 d
GP 156
3.34 @5.17# 55.4 37.1 1.48 Mississippi Riv. sed.~Mc Clure,IL ! ~7.5 g/L!; pH 7.75;equilibr. time528 d
GP 156
@3.91# 5.3 4.1 Lake Ontario sediment trapmaterial
FM 49
5.4 50 Niagara River organic matter FM 493.50 Correlation logKoc– MCI 5964.5 Correlation logKoc– logKow(96) 494.11 Correlation logKoc– logS 5643.31 Correlation logKoc– MCI [email protected]# Correlation logKom– MCI 5914.18 Correlation logKoc– CRI 6013.81 Correlation logKoc– LSER 602
Hexachlorobenzene„HCBz…
0.91° 2.24 Speyer soil 2.2~0.15–0.5 mm!; 22 BE 181~1.56! pH 5.80.58°~0.99!
2.70 12.9 64.3 19.6 0.76 Alfisol soil; pH 7.45 22 BE 181
@2.67# @4.49# 2.64* Batcombe sil soil; pH 5.9; 20 BE [email protected]# 0.01 M CaCl2
1.41 3.23 1.49 Captina sil soil; pH 4.97;0.01 M CaNO3
BE 606
2.55 4.73 0.66 Mc Laurin sl soil; pH 4.43;0.01 M CaNO3
BE 606
3.04 @6.00# 75.6 17.4 0.11 Loess soil~Turin, IA! ~10 g/L!;pH 8.34; equilibr. time518 d
GP 156
1.96 4.66 0.2 Fine s soil; soil-dextran/watersystem
BE,MD 429
2.70 3.08 42 Dextran; soil-dextran/watersystem
BE,MD 429
2.21 4.91 0.2 Fine a soil; soil-humic acid/water system
BE 429
3.38 4.98 2.5 Lake sediment fromThe Netherlands
21 BE 530
3.04 @5.87# 10.7 6.8 0.15 Missouri Riv. sed.~Onawa, IA!~32 g/L!; pH 8.32;equilibr. time518 d
GP 156
3.86 @5.55# 41.8 55.2 2.07 Missouri Riv. sed.~Stanton, ND!~5 g/L!; pH 7.79; equilibr.time520 d
GP 156
4.51 @6.02# 27.1 52.6 3.04 Ohio Riv. sed.~Ceredo, WV!~3 g/L!; pH 6.90; equilibr.time528 d
GP 156
4.45 @5.96# Idem ~2.5 g/L!; equilibr.time525 d
GP 156
3.42 @5.25# 55.4 37.1 1.48 Mississippi Riv. sed.~Mc Clure,IL !; pH 7.75; equilibr. time528 d
GP 156
3.54 @5.46# 13.9 18.6 1.21 Small stream sed.~Watkinsville,GA! ~13 g/L!; pH 6.35;equilibr. time520 d
GP 156
3.42 @5.23# 31.1 37.1 1.52 Oconee Riv. susp. sed.~Athens,GA! ~3.5 g/L!; pH 6.47;equilibr. time522 d
GP 156
J. Phys. Chem. Ref. Data, Vol. 30, No. 1, 2001

292292 DELLE SITE
Table 4. Sorption coefficients for halogenated benzenes—Continued
log Kd
log Kf0
(1/n) log Koc
Sorbent composition~%!Other sorbent and solution data;
prediction procedureTemp.~°C! Meth. Ref.Sand Silt Clay OC
@4.51# 5.9 4.1 Lake Ontario sediment trapmaterial
FM 49
5.5 50 Niagara River organic matter FM 495.98 48 Fluka humic acid; soil-humic
acid/water systemBE 429
5.65 Groundwater DOC ED 4294.77 Cyanopropyl column 20–25 RPLC 5793.59 Soil; experimental~literature! 2175.1 Correlation logKoc– logKow(96) 493.53 Correlation logKoc– MCI 5784.45 Correlation logKoc– logS [email protected]# Correlation logKom– MCI 5914.67 Correlation logKoc– CRI 6014.27 Correlation logKoc– LSER 602
Values in square parentheses have been calculated by the author.* log Kom in column 2 and % OM content in column 6.av average value.Idem refers to the sorbent reported just above; only the data~texture, OC, temperature, method! which were changed are specified.
J. Phys. Chem. Ref. Data, Vol. 30, No. 1, 2001

293293SORPTION OF ORGANIC COMPOUNDS
TABLE 5. Sorption coefficients for phenol and substituted phenols
log Kd
log Kf0
(1/n) log Koc
Sorbent composition~%!Other sorbent and solution data;
prediction procedureTemp.~°C! Meth. Ref.Sand Silt Clay OC
Phenol „pKaÄ9.8, Ref. 675!
22.0– 100 Kaolinite; pH 5.6; SA 10 m2/g; MD 46921.27 CE52.0 cmol/[email protected]# @0.77# 29.1 14.3 56.6 30.6* Whittlesey soil; SA5197.0 m2/g 20 BE 615
@17.7#@20.63# @0.99# 84.1 8.1 7.8 4.15* Ashurst soil; SA528.1 m2/g 20 BE 615
@2.41#@20.75# @0.97# 72.0 10.4 17.6 3.28* Kirton soil; SA541.2 m2/g 20 BE 615
@1.90#@0.77# @1.72# 2.51* Batcombe sil soil; pH 6.7; 20 BE 120
@1.46# 0.01 M CaCl20.094° 5.1* Brookston cl soil; pH 5.7; 20 BE 335~0.79! 2.68 CE522.22 me/100 g;
0.0025 M CaCl220.33 1.56 75 1.3 Eurosol-1; c; pH 5.1;
0.01 M CaCl2
BE 583
0.12 1.56 22.6 3.7 Eurosol-2; sil; pH 7.4;0.01 M CaCl2
BE 583
20.21 1.26 17.0 3.45 Eurosol-3; l; pH 5.2;0.01 M CaCl2
BE 583
20.50 1.31 20.3 1.55 Eurosol-4; si; pH 6.5;0.01 M CaCl2
BE 583
0.49 1.52 6.0 9.25 Eurosol-5; ls; pH 3.2;0.01 M CaCl2
BE 583
@21.22# 1.74 4 10 86 0.11 Apison soil; pH 4.5;CE570 me/100 g
BE 570
@20.37# 11 21 68 0.05 Fullerton soil; pH 4.4;CE564 me/100 g
BE 570
@21.08# 0.85 2 38 60 1.2 Dormont soil; pH 4.2;CE5129 me/100 g
BE 570
20.24° @1.95# 33 55 12 1.1* Captina soil; SA514 m2/g; pH 5.4; 25 BE 489,~0.96! @0.64# CE56 me/100 g; 0.01 M CaCl2;
phenol conc.5E-9 to E-2M532
0.08° 17 59 24 3.6* Palouse soil; SA590 m2/g; pH 5.4; 25 BE 489~0.76! @2.09# CE522 me/100 g; 0.01 M CaCl2
phenol conc.5E-5 to E-2M20.09°~1.00!
@1.59# Idem; phenol conc.5E-9 to E-6M
@2.47# 3.46 10.2 Lake Zoar surface sediment~,2 mm!; pH 6.21–6.35
FE 100
@2.11# 3.49 4.2 Lake surface sediment~.2 mm!; pH 6.21–6.35
FE 100
1.35 Cyanopropyl column; pH 3 20–25 RPLC 5791.42 Humic acid-silica column 20–23 RPLC 5871.00 Salicylic acid-silica column 20–23 RPLC 5871.24 8-Hydroxyquinoline-silica column 20–23 RPLC 5871.59 C18 column; correlation logKoc–
(log k81D0x)RPLC 577
1.67 C18 column; correlation logKoc–~log k81hydrogen bonding index!
RPLC 577
1.43 Soil; experimental~literature! 2172.17 Correlation logKoc– logKow 6180.86 Correlation logKoc– logS(180) 3350.95 Correlation logKoc– logS 5641.86 Correlation logKoc– MCI 5782.43 Correlation logKoc– MCI 5981.85 Correlation logKoc– CRI 6011.50 Correlation logKoc– LSER 602
2-Chlorophenol„-MCP; pK aÄ8.5, Ref. 675!
0.562° 5.1* Brookston soil; cl; pH 5.7; 20 BE 335
J. Phys. Chem. Ref. Data, Vol. 30, No. 1, 2001

294294 DELLE SITE
TABLE 5. Sorption coefficients for phenol and substituted phenols—Continued
log Kd
log Kf0
(1/n) log Koc
Sorbent composition~%!Other sorbent and solution data;
prediction procedureTemp.~°C! Meth. Ref.Sand Silt Clay OC
~0.80! 2.68 CE522.22 me/100 g;0.0025 M CaCl2
@2.70# 3.69 10.2 Lake Zoar surface sediment~,2 mm!; untreated; pH 6.21–6.35
FE 100
@2.50# 3.98 3.3 Idem; treated (H2O2);pH 6.21–6.35
FE 100
@2.22# 3.60 4.2 Lake Zoar surface sediment~.2 mm!; untreated; pH 6.21–6.35
FE 100
@2.21# 4.37 0.7 Idem; treated (H2O2);pH 6.21–6.35
FE 100
1.21 Correlation logKoc– logS(180) 3352.65 Correlation logKoc– MCI 5982.36 Correlation logKoc– CRI 601
3-Chlorophenol „-MCP; pK aÄ9.37, Ref. 676!
0.609° 5.1* Brookston soil; cl; pH 5.7; 20 BE 335~0.83! 2.68 CE522.22 me/100 g;
0.0025 M CaCl20.3° 1.2 1.7 Soil~Kootwijk!; humic s; 10 BE 111~0.8! pH 3.4; 0.01 M CaCl20.6° 1.5 2.2 Soil~Rolde!; humic s; 10 BE 111~0.8! pH 4.9; 0.01 M CaCl20.9° 3.7 3.2 Soil~Holten!; humic-rich s; 10 BE 111~0.8! pH 4.7; 0.01 M CaCl21.6° 29.8 Soil~Schipluiden!; peat; 10 BE 111~0.7! pH 4.6; 0.01 M CaCl220.1° 8.7 0.9 Soil~Maasdijk!; light l; 10 BE 111~0.6! pH 7.5; 0.01 M CaCl20.1° 18 1.7 Soil~Opijnen!; heavy l; 10 BE 111~0.7! pH 7.1; 0.01 M CaCl20.6° 2.7 Humus ‘‘soil’’ ~syntetic!; 10 BE 111~0.8! pH 3.7; 0.01 M CaCl20.5° 2.8 Humus ‘‘soil’’ ~syntetic!; 10 BE 111~0.8! pH 6.0; 0.01 M CaCl20.6° @2.1# 2.8 Humus ‘‘soil’’ ~syntetic!; 10 BE 111~1.0! pH 7.3; 0.01 M CaCl2
1.24 Correlation logKoc– logS(180) 3352.64 Correlation logKoc– MCI 5982.37 Correlation logKoc– CRI 601
4-Chlorophenol „-MCP; pK aÄ9.37, Ref. 677!
0.903° 5.1* Brookston soil; cl; pH 5.7; 20 BE 335~0.70! 2.68 CE522.22 me/100 g;
0.0025 M CaCl221.15 @1.73# 97.1 2.3 0.6 0.13 Tampa aquifer; pH 2;
0.01 N CaCl2
MD 521
0.49 2.38 75 1.3 Eurosol-1; c; pH 5.1;0.01 M CaCl2
BE 583
1.25 2.69 22.6 3.7 Eurosol-2; sil; pH 7.4;0.01 M CaCl2
BE 583
0.42 2.03 17.0 3.45 Eurosol-3; l; pH 5.2;0.01 M CaCl2
BE 583
0.41 2.22 20.3 1.55 Eurosol-4; si; pH 6.5;0.01 M CaCl2
BE 583
1.30 2.33 6.0 9.25 Eurosol-5; ls; pH 3.2;0.01 M CaCl2
BE 583
20.72 @1.69# 96.4 1.8 1.8 0.39 Eustis soil; pH 6.8;CE53.37 me/100 g; 0.01 N KCl
BE 460
1.23 Correlation logKoc– logS(180) 3352.35 Correlation logKoc– CRI 601
4-Bromophenol „MBP…
@1.57# @2.41# 2.51* Batcombe sil soil; pH 6.7; 20 BE 120
J. Phys. Chem. Ref. Data, Vol. 30, No. 1, 2001

295295SORPTION OF ORGANIC COMPOUNDS
TABLE 5. Sorption coefficients for phenol and substituted phenols—Continued
log Kd
log Kf0
(1/n) log Koc
Sorbent composition~%!Other sorbent and solution data;
prediction procedureTemp.~°C! Meth. Ref.Sand Silt Clay OC
@1.46# 0.01 M CaCl22.08 Correlation logKoc– MCI 5782.53 Correlation logKoc– MCI 5972.64 Correlation logKoc– MCI 5982.22 Correlation logKoc– LSER 602
2,3-Dichlorophenol „-DCP; pKaÄ7.61, Ref. 337!
1.18° 45.12 28.08 26.80 4.74* Brookston soil~aerobic!; pH 5.5; 20 BE 531~0.79! @2.75# CE522.74 me/100 g;
0.0025 M CaCl21.09°~0.83!
Idem ~anaerobic! 531
1.22°~0.78!
Idem ~autoclaved! 531
1.32u 2.35u 9.4 Lake sediment~,63 mm!;pH 6.5–8.5; SA~N2!53.8 m2/g;CaCO3 /CO2 buffer
20 BE 337
1.08u 2.66u 2.6 River sediment~,63 mm!;pH 6.5–8.5; SA~N2!54.8 m2/g;CaCO3 /CO2
20 BE 337
0.70u 2.77u 0.84 Aquifer material~,63 mm!;pH 6.5–8.5; SA~N2!56.4 m2/g;CaCO3 /CO2 buffer
20 BE 337
2.77 Correlation logKoc– MCI 5972.94 Correlation logKoc– logKow(108) 5973.08 Correlation logKoc– logKow(217) 5972.28 Correlation logKoc– logKow(120) 5972.83 Correlation logKoc– logKow(180) 5972.05 Correlation logKoc– logKow(55) 5972.86 Correlation logKoc– CRI 601
2,4-Dichlorophenol „-DCP; pKaÄ7.85, Ref. 337!
1.26° 45.12 28.08 26.80 4.74* Brookston soil~aerobic!; pH 5.5; 20 BE 531~0.73! @2.75# CE522.74 me/100 g;
0.0025 M CaCl21.17°~0.79!
Idem ~anaerobic! 531
1.29°~0.76!
Idem ~autoclaved! 531
0.82 2.70 75 1.3 Eurosol-1; c; pH 5.1;0.01 M CaCl2
BE 583
0.80 2.23 22.6 3.7 Eurosol-2; sil; pH 7.4;0.01 M CaCl2
BE 583
0.99 2.45 17.0 3.45 Eurosol-3; l; pH 5.2;0.01 M CaCl2
BE 583
0.54 2.35 20.3 1.55 Eurosol-4; si; pH 6.5;0.01 M CaCl2
BE 583
1.91 2.95 6.0 9.25 Eurosol-5; ls; pH 3.2;0.01 M CaCl2
BE 583
20.15 @2.25# 96.4 1.8 1.8 0.39 Eustis soil; CE53.37 me/100 gpH 6.1; 0.01 N KCl
BE 460
20.21 @2.20# Idem; pH 5.5; 0.015 N CaCl2 4601.26° 5.1* Brookston cl soil; pH 5.7; 20 BE 335~0.67! 2.68 CE522.22 me/100 g;
0.0025 M CaCl20.14 2.84 97.3 2.2 0.5 0.2 Forest soil; pH 5.6;
CE50.48 me/100 gMD 344
20.31 @2.39# Idem BE 3441.05 @2.71# 65.2 25.6 9.2 2.2 Agricultural soil; pH 7.4;
CE59.0 me/100 gBE 344
1.45 @2.88# 69.5 20.5 10.1 3.7 Forest soil; pH 4.2;CE52.9 me/100 g
BE 344
J. Phys. Chem. Ref. Data, Vol. 30, No. 1, 2001

296296 DELLE SITE
TABLE 5. Sorption coefficients for phenol and substituted phenols—Continued
log Kd
log Kf0
(1/n) log Koc
Sorbent composition~%!Other sorbent and solution data;
prediction procedureTemp.~°C! Meth. Ref.Sand Silt Clay OC
21.00 @1.89# 97.1 2.3 0.6 0.13 Tampa aquifer pH 2;0.01 N CaCl2
MD 521
@2.61# 3.60 10.2 Lake Zoar surface sediment~,2 mm!; untreated; pH 6.21–6.35
FE 100
@2.23# 3.71 3.3 Idem; treated (H2O2); [email protected]# 3.50 4.2 Lake Zoar surface sediment
~.2 mm!; untreated; pH 6.21–6.35FE 100
@1.82# 3.98 0.7 Idem; treated (H2O2) 1001.40u 2.42u 9.4 Lake sediment~,63 mm!;
pH 6.5–8.5; SA~N2!53.8 m2/g;CaCO3 /CO2 buffer
20 BE 337
1.23u 2.82u 2.6 River sediment~,63 mm!;pH 6.5–8.5; SA~N2!54.8 m2/g;CaCO3 /CO2 buffer
20 BE 337
0.78u 2.85u 0.84 Aquifer material~,63 mm!;pH 6.5–8.5; SA~N2!56.4 m2/g;CaCO3 /CO2 buffer
20 BE 337
2.47 C18 column; correlationlog Koc– (logk81D0x)
RPLC 577
2.53 C18 column; correlation logKoc–~log k81hydrogen bonding index!
RPLC 577
1.76 Correlation logKoc– logS(180) 3352.29 Correlation logKoc– MCl 5782.76 Correlation logKoc– MCl 5972.89 Correlation logKoc– CRI 601
3,4-Dichlorophenol „-DCP; pKaÄ8.62, Ref. 676!
1.1° @2.9# 1.2 1.7 Soil~Kootwijk!; humic s; 10 BE 111~0.9! pH 3.4; 0.01 M CaCl21.4° @3.1# 1.5 2.2 Soil~Rolde!; humic s; 10 BE 111~0.9! pH 4.9; 0.01 M CaCl21.3° 3.7 3.2 Soil~Holten!; humic-rich s; 10 BE 111~0.8! pH 4.7; 0.01 M CaCl21.6° 29.8 Soil~Schipluiden!; peat; 10 BE 111~0.7! pH 4.6; 0.01 M CaCl20.5° 8.7 0.9 Soil~Maasdijk!; light 1; 10 BE 111~0.8! pH 7.5; 0.01 M CaCl20.6° 18 1.7 Soil~Opijnen!; heavy 1; 10 BE 111~0.7! pH 7.1; 0.01 M CaCl21.4° @3.0# 2.7 Humus ‘‘soil’’ ~syntetic!; 10 BE 111~0.9! pH 3.7; 0.01 M CaCl21.5° @3.1# 2.8 Humus ‘‘soil’’ ~syntetic!; 10 BE 111~1.0! pH 6.0; 0.01 M CaCl21.2° @2.8# 2.8 Humus ‘‘soil’’ ~syntetic!; 10 BE 111~1.0! pH 7.3; 0.01 M CaCl2
2.86 Correlation logKoc– MCI 5982.88 Correlation logKoc– CRI 601
2,4,6-Trichlorophenol „-TCP; pK aÄ6.15, Ref. 337!
20.62 @2.27# 97.1 2.3 0.6 0.13 Tampa aquifer; pH 2;0.01 N CaCl2
MD 521
0.05 2.75 97.3 2.2 0.5 0.2 Forest soil; pH 5.6;CE50.48 me/100 g
MD 344
20.14 @2.56# 97.3 2.2 0.5 0.2 Idem BE 3440.30 1.96 65.2 25.6 9.2 2.2 Agricultural soil; pH 7.4;
CE59.0 me/100 gMD 344
0.38 @2.04# 65.2 25.6 9.2 2.2 Idem BE 3441.86 @3.29# 69.5 20.5 10.1 3.7 Forest soil; pH 4.2;
CE52.9 me/100 gBE 344
3.34°av 1.7, 2 soils; pH 6 BE 341~0.78! 5.2 BE 3412.79°av Idem; pH 7 341~0.78!
J. Phys. Chem. Ref. Data, Vol. 30, No. 1, 2001

297297SORPTION OF ORGANIC COMPOUNDS
TABLE 5. Sorption coefficients for phenol and substituted phenols—Continued
log Kd
log Kf0
(1/n) log Koc
Sorbent composition~%!Other sorbent and solution data;
prediction procedureTemp.~°C! Meth. Ref.Sand Silt Clay OC
2.23°av Idem; pH 7.7 341~0.78!3.56°u Idem; calculated value 341~0.78!
0.95u 3.03u 0.84 Aquifer material~,63 mm!;pH 6.5–8.5; SA~N2!56.4 m2/g;CaCO3 /CO2 buffer
20 BE 337
1.89u 2.92u 9.4 Lake sediment~,63 mm!;pH 6.5–8.5; SA~N2!53.8 m2/g;CaCO3 /CO2 buffer
20 BE 337
1.53u 3.12u 2.6 River sediment~,63 mm!;pH 6.5–8.5; SA~N2!54.8 m2/g;CaCO3 /CO2 buffer
20 BE 337
2.50 Correlation logKoc– MCl 5782.99 Correlation logKoc– MCl 5973.39 Correlation logKoc– CRI 601
2,4,5-Trichlorophenol „-TCP; pK aÄ6.94, Ref. 337!
1.66° 5.1* Brookston soil; cl; 20 BE 335~0.71! 2.68 pH 5.7; CE522.22 me/100 g;
0.0025 M CaCl21.5° @3.3# 1.2 1.7 Soil~Kootwijk!; humic s; 10 BE 111~0.9! pH 3.4; 0.01 M CaCl21.7° @3.4# 1.5 2.2 Soil~Rolde!; humic s; 10 BE 111~0.9! pH 4.9; 0.01 M CaCl21.7° 3.7 3.2 Soil~Holten!; humic-rich s; 10 BE 111~0.8! pH 4.7; 0.01 M CaCl22.5° 29.8 Soil~Schipluiden!; peat; 10 BE 111~0.8! pH 4.6; 0.01 M CaCl20.5° 8.7 0.9 Soil~Maasdijk!; light 1; 10 BE 111~0.8! pH 7.5; 0.01 M CaCl20.9° 18 1.7 Soil~Opijnen!; heavy 1; 10 BE 111~0.8! pH 7.1; 0.01 M CaCl21.7° @3.3# 2.7 Humus ‘‘soil’’ ~syntetic!; 10 BE 111~0.9! pH 3.7; 0.01 M CaCl21.6° @3.2# 2.8 Humus ‘‘soil’’ ~syntetic!; 10 BE 111~0.9! pH 6.0; 0.01 M CaCl21.2° @2.8# 2.8 Humus ‘‘soil’’ ~syntetic!; 10 BE 111~1.0! pH 7.3; 0.01 M CaCl20.27 @2.68# 96.4 1.8 1.8 0.39 Eustis soil; CE53.37 me/100 g;
pH 5.9; 0.01 N KClBE 460
20.85 @1.55# Idem; pH.10; 0.0155 N CaCl2 BE 4601.30u 3.38u 0.84 Aquifer material~,63 mm!;
pH 6.5–8.5; SA~N2!56.4 m2/g;CaCO3 /CO2 buffer
20 BE 337
2.22u 3.25u 9.4 Lake sediment~,63 mm!;pH 6.5–8.5; SA~N2!53.8 m2/g;CaCO3 /CO2 buffer
20 BE 337
1.87u 3.45u 2.6 River sediment~,63 mm!;pH 6.5–8.5; SA~N2!54.8 m2/g;CaCO3 /CO2 buffer
20 BE 337
2.01 Correlation logKoc– logS(180) 3352.99 Correlation logKoc– MCl 5973.37 Correlation logKoc– CRI 601
3,4,5-Trichlorophenol „-TCP; pK aÄ7.73, Ref. 337!
2.44u 3.47u 9.4 Lake sediment~,63 mm!;pH 6.5–8.5; SA~N2!53.8 m2/g;CaCO3 /CO2 buffer
20 BE 337
2.06u 3.64u 2.6 River sediment~,63 mm!;pH 6.5–8.5; SA~N2!54.8 m2/g;CaCO3 /CO2 buffer
20 BE 337
J. Phys. Chem. Ref. Data, Vol. 30, No. 1, 2001
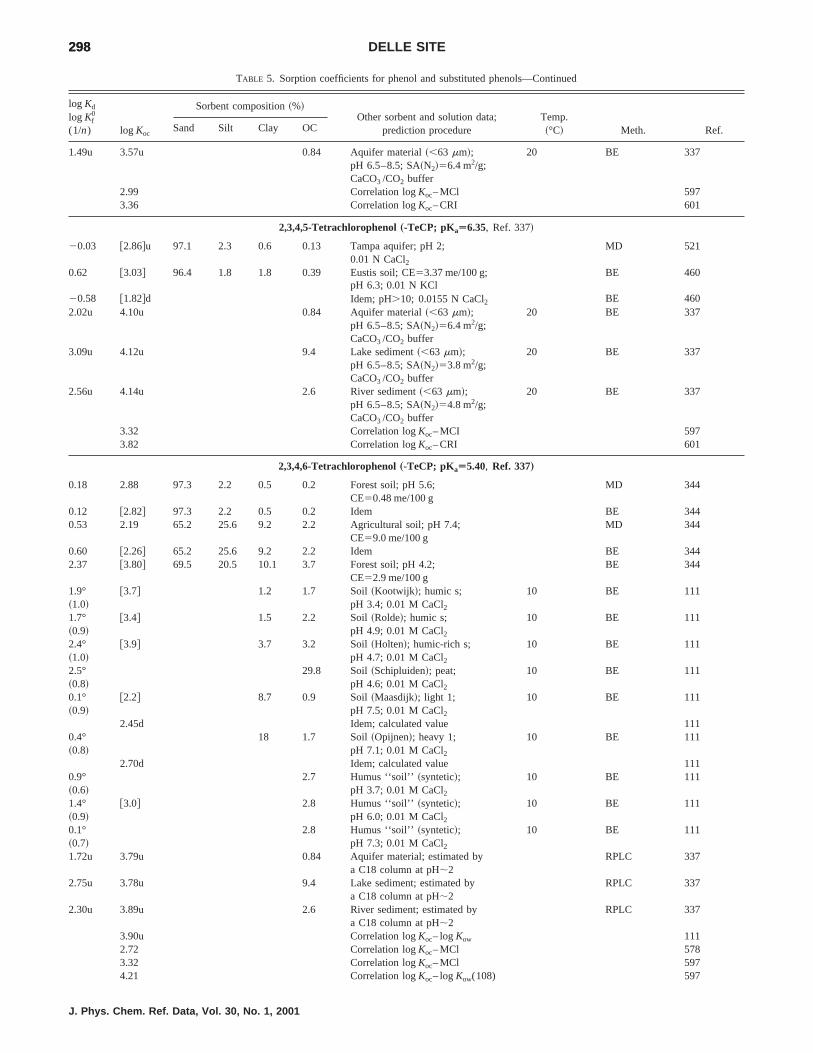
298298 DELLE SITE
TABLE 5. Sorption coefficients for phenol and substituted phenols—Continued
log Kd
log Kf0
(1/n) log Koc
Sorbent composition~%!Other sorbent and solution data;
prediction procedureTemp.~°C! Meth. Ref.Sand Silt Clay OC
1.49u 3.57u 0.84 Aquifer material~,63 mm!;pH 6.5–8.5; SA~N2!56.4 m2/g;CaCO3 /CO2 buffer
20 BE 337
2.99 Correlation logKoc– MCl 5973.36 Correlation logKoc– CRI 601
2,3,4,5-Tetrachlorophenol„-TeCP; pKaÄ6.35, Ref. 337!
20.03 @2.86#u 97.1 2.3 0.6 0.13 Tampa aquifer; pH 2;0.01 N CaCl2
MD 521
0.62 @3.03# 96.4 1.8 1.8 0.39 Eustis soil; CE53.37 me/100 g;pH 6.3; 0.01 N KCl
BE 460
20.58 @1.82#d Idem; pH.10; 0.0155 N CaCl2 BE 4602.02u 4.10u 0.84 Aquifer material~,63 mm!;
pH 6.5–8.5; SA~N2!56.4 m2/g;CaCO3 /CO2 buffer
20 BE 337
3.09u 4.12u 9.4 Lake sediment~,63 mm!;pH 6.5–8.5; SA~N2!53.8 m2/g;CaCO3 /CO2 buffer
20 BE 337
2.56u 4.14u 2.6 River sediment~,63 mm!;pH 6.5–8.5; SA~N2!54.8 m2/g;CaCO3 /CO2 buffer
20 BE 337
3.32 Correlation logKoc– MCI 5973.82 Correlation logKoc– CRI 601
2,3,4,6-Tetrachlorophenol„-TeCP; pKaÄ5.40, Ref. 337…
0.18 2.88 97.3 2.2 0.5 0.2 Forest soil; pH 5.6;CE50.48 me/100 g
MD 344
0.12 @2.82# 97.3 2.2 0.5 0.2 Idem BE 3440.53 2.19 65.2 25.6 9.2 2.2 Agricultural soil; pH 7.4;
CE59.0 me/100 gMD 344
0.60 @2.26# 65.2 25.6 9.2 2.2 Idem BE 3442.37 @3.80# 69.5 20.5 10.1 3.7 Forest soil; pH 4.2;
CE52.9 me/100 gBE 344
1.9° @3.7# 1.2 1.7 Soil~Kootwijk!; humic s; 10 BE 111~1.0! pH 3.4; 0.01 M CaCl21.7° @3.4# 1.5 2.2 Soil~Rolde!; humic s; 10 BE 111~0.9! pH 4.9; 0.01 M CaCl22.4° @3.9# 3.7 3.2 Soil~Holten!; humic-rich s; 10 BE 111~1.0! pH 4.7; 0.01 M CaCl22.5° 29.8 Soil~Schipluiden!; peat; 10 BE 111~0.8! pH 4.6; 0.01 M CaCl20.1° @2.2# 8.7 0.9 Soil~Maasdijk!; light 1; 10 BE 111~0.9! pH 7.5; 0.01 M CaCl2
2.45d Idem; calculated value 1110.4° 18 1.7 Soil~Opijnen!; heavy 1; 10 BE 111~0.8! pH 7.1; 0.01 M CaCl2
2.70d Idem; calculated value 1110.9° 2.7 Humus ‘‘soil’’ ~syntetic!; 10 BE 111~0.6! pH 3.7; 0.01 M CaCl21.4° @3.0# 2.8 Humus ‘‘soil’’ ~syntetic!; 10 BE 111~0.9! pH 6.0; 0.01 M CaCl20.1° 2.8 Humus ‘‘soil’’ ~syntetic!; 10 BE 111~0.7! pH 7.3; 0.01 M CaCl21.72u 3.79u 0.84 Aquifer material; estimated by
a C18 column at pH;2RPLC 337
2.75u 3.78u 9.4 Lake sediment; estimated bya C18 column at pH;2
RPLC 337
2.30u 3.89u 2.6 River sediment; estimated bya C18 column at pH;2
RPLC 337
3.90u Correlation logKoc– logKow 1112.72 Correlation logKoc– MCl 5783.32 Correlation logKoc– MCl 5974.21 Correlation logKoc– logKow(108) 597
J. Phys. Chem. Ref. Data, Vol. 30, No. 1, 2001

299299SORPTION OF ORGANIC COMPOUNDS
TABLE 5. Sorption coefficients for phenol and substituted phenols—Continued
log Kd
log Kf0
(1/n) log Koc
Sorbent composition~%!Other sorbent and solution data;
prediction procedureTemp.~°C! Meth. Ref.Sand Silt Clay OC
3.77 Correlation logKoc– logKow(217) 5972.94 Correlation logKow– logKow(120) 5974.11 Correlation logKoc– logKow(180) 5973.2 Correlation logKoc– logKow(55) 5973.83 Correlation logKoc– CRI 601
Pentachlorophenol„PCP; pKaÄ4.74, Ref. 676!
20.35 @2.06# 96.4 1.8 1.8 0.39 Eustis soil; CE53.37 me/100 g;pH.10; 0.0038 N CaCl2
BE 460
20.09 @2.32# Idem; 0.0155 N CaCl2 4601.94 @4.40# Idem; pH,2; Kd value extrapolated BE, 460
at f c50 ~methanol/water solutions! MD0.26 2.96 97.3 2.2 0.5 0.2 Forest soil; pH 5.6;
CE50.48 me/100 gMD 344
0.32 @3.02# Idem BE 3441.08 @2.74# 65.2 25.6 9.2 2.2 Agricultural soil; pH 7.4;
CE59.0 me/100 gBE 344
2.27 @3.70# 69.5 20.5 10.1 3.7 Forest soil; pH 4.2;CE52.9 me/100 g
BE 344
1.55 @3.96# 96.4 1.8 1.8 0.39 Eustis~1! soil; pH,3;m50.0015~CaCl2!
22–25 BE 339
1.55 @3.96# Idem; pH,3; m50.015 3391.59 @4.00# Idem; pH,3; m50.15 3391.66 @4.07# Idem; pH,3; m51.5 3390.10 @2.51# Idem; pH.7; m50.01 3390.31 @2.72# Idem; pH.7; m50.08 3390.45 @2.86# Idem; pH.7; m50.15 3390.88 @3.28# Idem; pH.7; m51.4 3391.21 @3.32# 91.6 4.2 4.2 0.78 Eustis~2! soil; pH 5.3;
m50.00315~CaCl2!22–25 BE 339
1.37 @3.48# Idem; pH 5.08;m50.015 3391.57 @3.68# Idem; pH 4.83;m50.145 3391.31 @2.78# 29.6 40.9 29.5 3.41 Webster~1! soil; pH 7.5;
m50.00315~CaCl2!22–25 BE 339
1.46 @2.92# Idem; pH 7.3;m50.015 3391.72 @3.19# Idem; pH 6.86;m50.145 3392.04 @3.51# Idem; pH 6.37,m51.49 33920.19 @2.46# 88.6 9.4 2.0 0.22 Lincoln soil; pH 6.84;
m50.00015~CaCl2!22–25 BE 339
0.16 @2.82# Idem; pH 6.69;m50.0132 3390.29 @2.95# Idem; pH 6.65;m50.015 3390.38 @3.04# Idem; pH 6.43;m50.1352 3390.80 @3.46# Idem; pH 5.65;m51.575 3391.57 3.88 99.9 0.1~si1c! 0.5 Sandy soil; pH 5.2;
DOC,0.1 mg/L;PCPequil.,0.4 nmol/mL
21 BE 106
1.59 3.89 Idem; DOC515 mg/L 1061.63 3.73 99.9 0.1~si1c! 0.8 Sandy soil; pH 5.4;
DOC,0.1 mg/L;PCPequil.,3 nmol/mL
21 BE 106
1.74 3.84 Idem; DOC515 mg/mL 1061.08 3.17 99.9 0.1~si1c! 0.8 Sandy soil; pH 6.1;
DOC,0.1 mg/L;PCPequil.,3 nmol/mL
21 BE 106
1.22 3.32 Idem; DOC515 mg/L 21 BE 1064.44u Calculated in the DOM poor
fraction; m50.02; pH 5.4106
2.48d Idem; pH 6.1 1061.9° @3.7# 1.2 1.7 Soil~Kootwijk!; humic s; 10 BE 111~0.9! pH 3.4; 0.01 M CaCl21.9° @3.6# 1.5 2.2 Soil~Rolde!; humic s; 10 BE 111~0.9! pH 4.9; 0.01 M CaCl22.6° @4.1# 3.7 3.2 Soil~Holten!; humic-rich s; 10 BE 111
J. Phys. Chem. Ref. Data, Vol. 30, No. 1, 2001
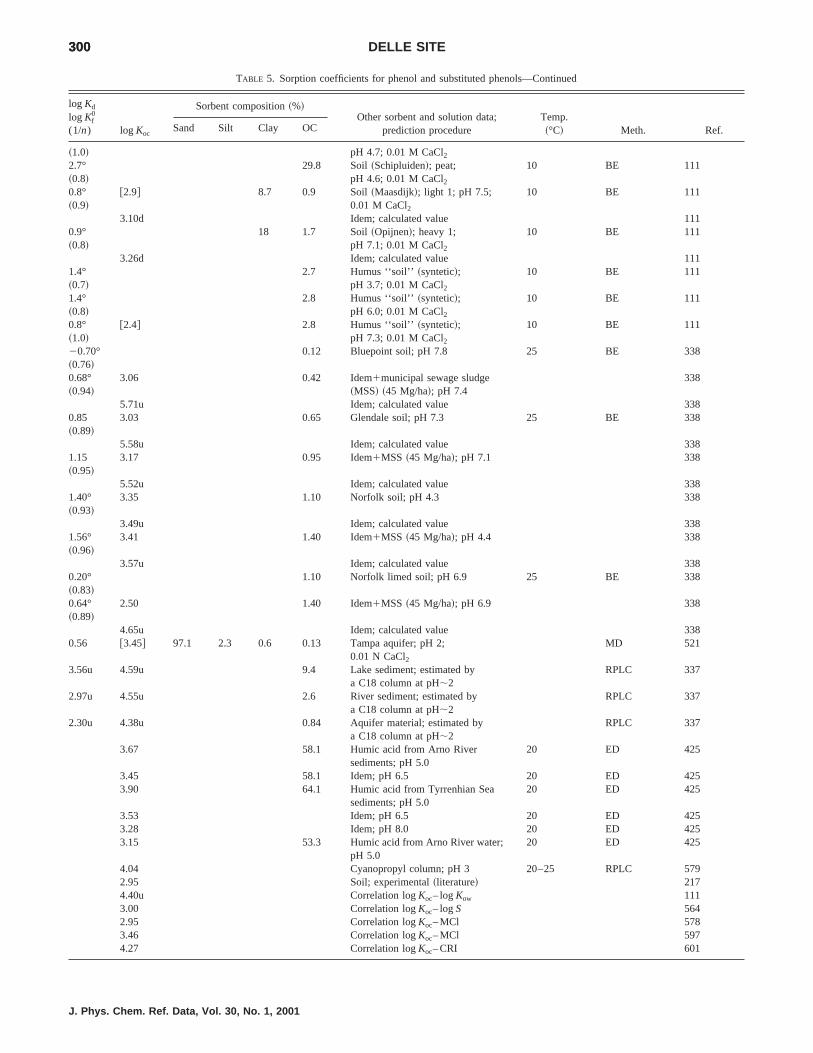
300300 DELLE SITE
TABLE 5. Sorption coefficients for phenol and substituted phenols—Continued
log Kd
log Kf0
(1/n) log Koc
Sorbent composition~%!Other sorbent and solution data;
prediction procedureTemp.~°C! Meth. Ref.Sand Silt Clay OC
~1.0! pH 4.7; 0.01 M CaCl22.7° 29.8 Soil~Schipluiden!; peat; 10 BE 111~0.8! pH 4.6; 0.01 M CaCl20.8° @2.9# 8.7 0.9 Soil~Maasdijk!; light 1; pH 7.5; 10 BE 111~0.9! 0.01 M CaCl2
3.10d Idem; calculated value 1110.9° 18 1.7 Soil~Opijnen!; heavy 1; 10 BE 111~0.8! pH 7.1; 0.01 M CaCl2
3.26d Idem; calculated value 1111.4° 2.7 Humus ‘‘soil’’ ~syntetic!; 10 BE 111~0.7! pH 3.7; 0.01 M CaCl21.4° 2.8 Humus ‘‘soil’’ ~syntetic!; 10 BE 111~0.8! pH 6.0; 0.01 M CaCl20.8° @2.4# 2.8 Humus ‘‘soil’’ ~syntetic!; 10 BE 111~1.0! pH 7.3; 0.01 M CaCl220.70° 0.12 Bluepoint soil; pH 7.8 25 BE 338~0.76!0.68° 3.06 0.42 Idem1municipal sewage sludge 338~0.94! ~MSS! ~45 Mg/ha!; pH 7.4
5.71u Idem; calculated value 3380.85 3.03 0.65 Glendale soil; pH 7.3 25 BE 338~0.89!
5.58u Idem; calculated value 3381.15 3.17 0.95 Idem1MSS ~45 Mg/ha!; pH 7.1 338~0.95!
5.52u Idem; calculated value 3381.40° 3.35 1.10 Norfolk soil; pH 4.3 338~0.93!
3.49u Idem; calculated value 3381.56° 3.41 1.40 Idem1MSS ~45 Mg/ha!; pH 4.4 338~0.96!
3.57u Idem; calculated value 3380.20° 1.10 Norfolk limed soil; pH 6.9 25 BE 338~0.83!0.64° 2.50 1.40 Idem1MSS ~45 Mg/ha!; pH 6.9 338~0.89!
4.65u Idem; calculated value 3380.56 @3.45# 97.1 2.3 0.6 0.13 Tampa aquifer; pH 2;
0.01 N CaCl2
MD 521
3.56u 4.59u 9.4 Lake sediment; estimated bya C18 column at pH;2
RPLC 337
2.97u 4.55u 2.6 River sediment; estimated bya C18 column at pH;2
RPLC 337
2.30u 4.38u 0.84 Aquifer material; estimated bya C18 column at pH;2
RPLC 337
3.67 58.1 Humic acid from Arno Riversediments; pH 5.0
20 ED 425
3.45 58.1 Idem; pH 6.5 20 ED 4253.90 64.1 Humic acid from Tyrrenhian Sea
sediments; pH 5.020 ED 425
3.53 Idem; pH 6.5 20 ED 4253.28 Idem; pH 8.0 20 ED 4253.15 53.3 Humic acid from Arno River water;
pH 5.020 ED 425
4.04 Cyanopropyl column; pH 3 20–25 RPLC 5792.95 Soil; experimental~literature! 2174.40u Correlation logKoc– logKow 1113.00 Correlation logKoc– logS 5642.95 Correlation logKoc– MCl 5783.46 Correlation logKoc– MCl 5974.27 Correlation logKoc– CRI 601
J. Phys. Chem. Ref. Data, Vol. 30, No. 1, 2001

301301SORPTION OF ORGANIC COMPOUNDS
TABLE 5. Sorption coefficients for phenol and substituted phenols—Continued
log Kd
log Kf0
(1/n) log Koc
Sorbent composition~%!Other sorbent and solution data;
prediction procedureTemp.~°C! Meth. Ref.Sand Silt Clay OC
2-nitrophenol „-NP; log pKaÄ7.21, Ref. 678!
0.54 2.42 75 1.3 Eurosol-1; c; pH 5.1;0.01 M CaCl2
BE 583
0.08 1.51 22.6 3.7 Eurosol-2; sil; pH 7.4;0.01 M CaCl2
BE 583
0.39 1.85 17.0 3.45 Eurosol-3; 1; pH 5.2;0.01 M CaCl2
BE 583
20.05 1.76 20.3 1.55 Eurosol-4; si; pH 6.5;0.01 M CaCl2
BE 583
1.30 2.33 6.0 9.25 Eurosol-5; 1s; pH 3.2;0.01 M CaCl2
BE 583
0.725° @2.30# 5.1* Brookston cl soil; pH 5.7; 20 BE 335~0.89! 2.68 CE522.22 me/100 g;
0.0025 M CaCl21.99 Correlation logKoc– logS(179) 335
3-nitrophenol „-NP…
0.728° 5.1* Brookston soil; cl; 20 BE 335~0.73! 2.68 pH 5.7; CE522.22 me/100 g;
0.0025 M CaCl21.44 Correlation logKoc– logS(179) 335
4-nitrophenol „-NP; pKaÄ7.15, Ref. 678!
0.769° 5.1* Brookston soil; cl; 20 BE 335~0.72! 2.684 pH 5.7; CE522.22 me/100 g;
0.0025 M CaCl20.19° 2.04 6 3 1.41 Gribskov soil; A hor.: pH 3.23; 20 BE 131~0.93! CE54.8 me/100 g; 0.01 M CaCl2
0.43° 2.00 4 7 2.58 Idem; B hor.; pH 3.59; 131~0.91! CE59.6 me/100 g; 0.01 M CaCl2
0.01° 1.75 3 5 1.82 Idem; C hor.; pH 4.07; 131~0.86! CE57.0 me/100 g; 0.01 M CaCl2
0.52° 1.81 5 4 5.11 Strodam soil; AB hor.; pH 3.88; 20 BE 131~0.91! CE513.0 me/100 g; 0.01 M CaCl2
20.40° 2.45 3 3 0.09 Idem; C hor.; pH 4.95; 131~0.99! CE51.6 me/100 g; 0.01 M CaCl2
20.80° 1 2 0.15 Tisvilde soil; C hor.; pH 4.21; 20 BE 131~0.73! CE51.3 me/100 g; 0.01 M CaCl2
0.31° 2.11 18 12 1.64 Roskilde soil; agric.; pH 5.40; 20 BE 131~0.91! CE514.0 me/100 g; 0.01 M CaCl2
20.49° 4 18 0.06 Esrum soil; subsurf.; pH 4.71; 20 BE 131~0.96! CE59.1 me/100 g; 0.01 M CaCl2
20.92° 7 3 0.05 Tirstrup soil; subsurf.; pH 6.14; 20 BE 131~0.79! CE51.4 me/100 g; 0.01 M CaCl2
20.17° 2.72 34 41 0.13 Bjodstrup soil; subsurf; pH 7.64; 20 BE 131~0.99! CE540.5 me/100 g; 0.01 M CaCl2
2.18 Cyanopropyl column; pH 3 20–25 RPLC 5792.16 C18 column; correlation logKoc–
(log k81D0x)RPLC 577
2.07 C18 column; correlation logKoc–~log k81hydrogen bonding index!
RPLC 577
1.37 Correlation logKoc– logS(180) 3352.49 Correlation logKoc– MCl 598
Values in square parentheses have heen calculated by the author.*% OM content.av average value.d: Totally dissociated compound calculated following the procedure in Sec. 4.2.u: Totally undissociated compound calculated following the procedure in Sec. 4.2.Idem refers to the sorbent reported just above; only the data~texture, OC, temperature, method! which were changed are specified.
J. Phys. Chem. Ref. Data, Vol. 30, No. 1, 2001

302302 DELLE SITE
TABLE 6. Sorption coefficients for polychlorobiphenyls~PCBs!
log Kd
log Kf0
(1/n) log Koc
Sorbent composition~%!Other sorbent and solution data;
prediction procedureTemp.~°C! Meth. Ref.Sand Silt Clay OC
Biphenyl „0…
20.48 @2.06# 98 1 1 0.29 Borden soil. 0.01 N CaCl2 MD 6001.19° 3.04 1.42 Soil; cl;~kaolinite!; 20 BE 214~1.00! pH 5.91; CE512.4 me/100 g1.50° 3.32 1.51 Soil; light c;~montmorillonite!; 20 BE 214~1.00! pH 5.18; CE513.2 me/100 g1.75° 3.26 3.23 Soil; light c;~montmorillite!; 20 BE 214~0.98! pH 5.26; CE528.3 me/100 g1.95° 3.04 7.91 Soil sl;~allophane!; 20 BE 214~1.00! pH 5.41; CE526.3 me/100 g2.09° 10.4 Soil; cl;~allophane!; 20 BE 214~0.78! pH 4.89; CE535 me/100 [email protected]# 3.52 4 10 86 0.11 Apison soil; pH 4.5;
CE576 me/100 gBE 570
@20.27# 11 21 68 0.05 Fullerton soil; pH 4.4;CE564 me/100 g
BE 570
@1.02# 2.94 2 38 60 1.2 Dormont soil; pH 4.2;CE5129 me/100 g
BE 570
3.57 @4.36# 16.44 VSC; vermiculite-HDTMA; BE 22520.5* CE580 cmol/kg
3.51 @4.27# 17.46 SWy-1; smectite~low charge!- BE 22521.8* HDTMA; CE587 cmol/kg
3.56 4.12 28 Syntetic ‘‘sludge’’ of autoclavedyeast obtained by culturing bakers’yeast in sucrose solution
25 BE 608
2.66 27 Municipal sludge from Oak Ridgewastewater treatment plant
25 BE 608
3.53 14 Oily biosludge 913 from ORNL~4% oil content!
25 BE 608
3.35 25 Oily biosludge 969 from ORNL~14% oil content!
25 BE 608
3.90 33 Oily biosludge 972 from ORNL~24% oil content!
25 BE 608
4.26 Oil extracted from waste 972 25 BE 60820.56 .98 0.025 Vejen aquifer mat. 10 MD 166
3.00 Aldrich humic acid~DOC59.4 mg/l!; pH 5.8–6.8
RP 414
3.27 Idem~zero intercept of theregression line of logKdoc
vs DOC concentration!
RP 414
3.57 DOC in Lake Erie water~9.6 mg/L! RP 4143.77 Idem ED 4145.58 DOC in Huron River wat.~7.8 mg/L! RP 4144.04 Idem ED 4143.67 50.2 Aldrich and Fluka humic acid FH 2063.15 Correlation logKoc– logS 5643.80 Correlation logKoc– MCl 5982.93 Correlation logKoc– CRI 601
2-„1…
@1.51# @3.47# 9 68 21 1.9* Woodburn soil; CE514 me/100 g 20 BE [email protected]#
0.06 @2.59# 98 1 1 0.29 Borden soil. 0.01 N CaCl2 MD [email protected]# Correlation logKom– MCI 5913.43 Correlation logKoc– CRI 601
4-„3…
3.83av 4.71av Great Lakes suspended matter~three phases distribution!
25 RS 409
4.02av Great Lakes DOC~same procedure! 25 RS 4093.92av 4.70av 16 Green Bay suspended matter
~same procedure!25 RS 410
4.61av Green Bay DOC~same procedure! 25 RS 410
J. Phys. Chem. Ref. Data, Vol. 30, No. 1, 2001

4,
4,
,
303303SORPTION OF ORGANIC COMPOUNDS
TABLE 6. Sorption coefficients for polychlorobiphenyls~PCBs!—Continued
log Kd
log Kf0
(1/n) log Koc
Sorbent composi-tion ~%!
Other sorbent and solution data;prediction procedure
Temp.~°C! Meth. Ref.Sand Silt Clay OC
3.52 Correlation logKoc– logS 5643.49 Correlation logKoc– CRI 601
2,28-„4…
@1.96# @3.92# 9 68 21 1.9*@1.1#
Woodburn soil; CE514 me/100 g 20 BE 55
@4.42# Correlation logKoc– CRI 5913.96 Correlation logKoc– MCI 601
2,48-„8…
@4.13# 9 68 21 1.9*@1.1#
Woodburn soil; CE514 me/100 g 20 BE 55
0.40° 16.2 3.1*@1.8#
Woodburn soil; sil 24 BE 178
~0.85!1.87° Illite clay 24 BE 178~1.19!5.8 Lake Superior suspended sol.~1980! FM 504.5 Idem~1983! 50
4.08°*~1.16!
Aldrich humic acid 24 BE 178
@4.41# Correlation logKom– MCI 5913.99 Correlation logKoc– CRI 6013.38 Correlation logKoc– LSER 602
4,48-„15…
4.30 Correlation logKoc– logS 5644.03 Correlation logKoc– CRI 601
2,28,3-„16…
6.0 Lake Superior suspended sol.~1980! FM 504.8 Idem~1983! 50
4.52 Correlation logKoc– CRI 601
2,28,4-„17…
6.5 Lake Superior suspended sol.~1980! FM 504.6 Idem~1983! 50
4.44 Correlation logKoc– MCI 5984.51 Correlation logKoc– CRI 601
2,28,5-„18…
7.2 Lake Superior suspended sol.~1980! FM 504.6 Idem~1983! [email protected]# 4.5 2.9 Offshore Grand Haven sediment; BE 46
~solute complexation model! [email protected]# 4.5 3.4 Nearshore Grand Haven sediment; BE 46
~solute complexation model! [email protected]# 5.0 3.8 Benton Harbor sediment; BE 464
~solute complexation model! 4944.57 50.2 Aldrich humic acid; pH 8.0;
0.1 M NaHCO3
22 ED 206
4.85 50.2 Aldrich and Fluka humic acid FH [email protected]# 5.4 4.1 Lake Ontario sediment trap
materialFM 49
5.5 50 Niagara River organic matter FM 495.2 Correlation logKoc– logKow(96) 494.23 Correlation logKoc– logS 5644.44 Correlation logKoc– MCI 5984.53 Correlation logKoc– CRI 601
J. Phys. Chem. Ref. Data, Vol. 30, No. 1, 2001
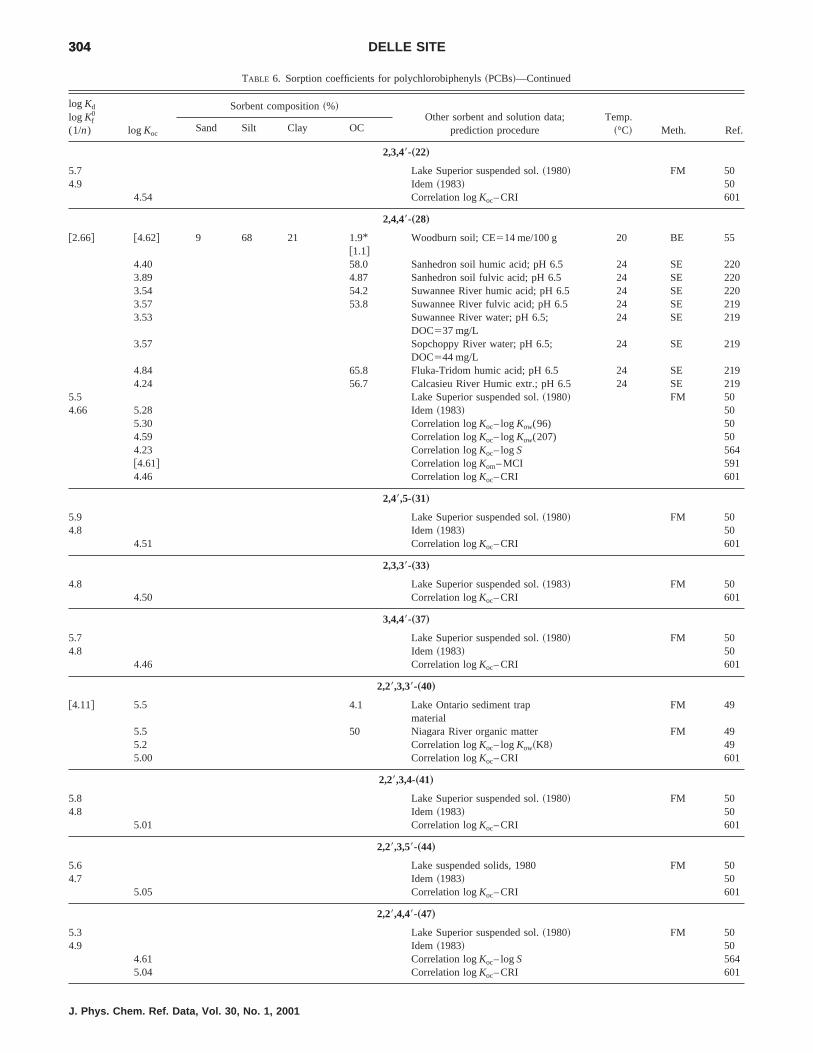
0009
9
304304 DELLE SITE
TABLE 6. Sorption coefficients for polychlorobiphenyls~PCBs!—Continued
log Kd
log Kf0
(1/n) log Koc
Sorbent composition~%!Other sorbent and solution data;
prediction procedureTemp.
~°C! Meth. Ref.Sand Silt Clay OC
2,3,48-„22…
5.7 Lake Superior suspended sol.~1980! FM 504.9 Idem~1983! 50
4.54 Correlation logKoc– CRI 601
2,4,48-„28…
@2.66# @4.62# 9 68 21 1.9*@1.1#
Woodburn soil; CE514 me/100 g 20 BE 55
4.40 58.0 Sanhedron soil humic acid; pH 6.5 24 SE 223.89 4.87 Sanhedron soil fulvic acid; pH 6.5 24 SE 223.54 54.2 Suwannee River humic acid; pH 6.5 24 SE 223.57 53.8 Suwannee River fulvic acid; pH 6.5 24 SE 213.53 Suwannee River water; pH 6.5;
DOC537 mg/L24 SE 219
3.57 Sopchoppy River water; pH 6.5;DOC544 mg/L
24 SE 219
4.84 65.8 Fluka-Tridom humic acid; pH 6.5 24 SE 2194.24 56.7 Calcasieu River Humic extr.; pH 6.5 24 SE 21
5.5 Lake Superior suspended sol.~1980! FM 504.66 5.28 Idem~1983! 50
5.30 Correlation logKoc– logKow(96) 504.59 Correlation logKoc– logKow(207) 504.23 Correlation logKoc– logS [email protected]# Correlation logKom– MCI 5914.46 Correlation logKoc– CRI 601
2,48,5-„31…
5.9 Lake Superior suspended sol.~1980! FM 504.8 Idem~1983! 50
4.51 Correlation logKoc– CRI 601
2,3,38-„33…
4.8 Lake Superior suspended sol.~1983! FM 504.50 Correlation logKoc– CRI 601
3,4,48-„37…
5.7 Lake Superior suspended sol.~1980! FM 504.8 Idem~1983! 50
4.46 Correlation logKoc– CRI 601
2,28,3,38-„40…
@4.11# 5.5 4.1 Lake Ontario sediment trapmaterial
FM 49
5.5 50 Niagara River organic matter FM 495.2 Correlation logKoc– logKow~K8! 495.00 Correlation logKoc– CRI 601
2,28,3,4-„41…
5.8 Lake Superior suspended sol.~1980! FM 504.8 Idem~1983! 50
5.01 Correlation logKoc– CRI 601
2,28,3,58-„44…
5.6 Lake suspended solids, 1980 FM 504.7 Idem~1983! 50
5.05 Correlation logKoc– CRI 601
2,28,4,48-„47…
5.3 Lake Superior suspended sol.~1980! FM 504.9 Idem~1983! 50
4.61 Correlation logKoc– logS 5645.04 Correlation logKoc– CRI 601
J. Phys. Chem. Ref. Data, Vol. 30, No. 1, 2001

88
1
305305SORPTION OF ORGANIC COMPOUNDS
TABLE 6. Sorption coefficients for polychlorobiphenyls~PCBs!—Continued
log Kd
log Kf0
(1/n) log Koc
Sorbent composition~%!Other sorbent and solution data;
prediction procedureTemp.
~°C! Meth. Ref.Sand Silt Clay OC
2,28,5,58-„52…
3.70 6.15 0.36 Composite Condie silt soil 22 BE 6192.28 99.3 0.20 0.55 0.03 Ispra soil~C2 horizon!; pH 5.1 22 BE 1532.52 @5.31# 95.5 3.4 1.6 0.16 Idem~C4 horizon!; pH 4.8 1533.68 5.41 91.8 6.4 1.8 1.87 Idem~A2 horizon!; pH 4.8 1531.60°~1.09!
Illite clay 24 BE 178
1.69 @3.43# 16.2 3.1*@1.8#
Woodburn soil; silt loam 24 BE 178
5.6 Lake Superior suspended sol.~1980! FM 504.87 5.35 Idem~1983! 50
5.90 7–13 River sediments BE [email protected]# 5.6 4.1 Lake Ontario sediment trap
materialFM 49
5.5 50 Niagara River organic matter FM [email protected]# 5.02 5 70 25 0.84 Brown’s lake sedim.; 6 months
incubation~m.i.!25 BE 218
@4.72# 6.04 55 32.5 12.5 4.76 Hamlet City lake sedim.; 6 m.i. 25 BE [email protected]# 4.80 0.0 93.8 6.3 0.50 WES reference soil; 6 m.i. 25 BE 21
5.00 Aldrich humic acid 25 RS 4094.93av 5.83av Great Lakes suspended matter
~three phases distribution!25 RS 409
3.88av Great Lakes DOC~same procedure! 25 RS 4094.96av 5.74av 16 Green Bay suspended matter
~same procedure!25 RS 410
3.66av Green Bay DOC~same procedure! 25 RS 4104.85 Aldrich humic acid; pH 6.4 GP 4164.76 Aldrich humic acid ED 4354.54 Aldrich humic acid (DOC59.4 mg/L);
pH 5.8–6.8RS 414
4.42 Idem ED 4144.40 Idem~zero intercept of the
regression line of logKdoc
vs DOC concentration!
RS 414
3.87 DOC in Huron River wat.~7.8 mg/L! RS 4144.36 Idem ED 4142.42 °*~0.26!
Aldrich humic acid 24 BE 178
4.94 Aldrich humic acid; pH 7.32(DOC50–7.5 mg/L)
6.6 RS 546
5.06 50.2 Aldrich and Fluka humic acid;predicted~Flory-Huggins Model!
FH 206
5.70 Correlation logKoc– logKow(96) 504.87 Correlation logKoc– logKow(207) 505.7 Correlation logKoc– logKow(96) 494.61 Correlation logKoc– logS 5644.65 Correlation logKoc– MCI [email protected]# Correlation logKom– MCI 5915.09 Correlation logKoc– CRI 6014.49 Correlation logKoc– LSER 602
2,28,6,68-„54…
3.10 @4.72# 55.0 45.0 ,1.0 2.4 Hickory Hill Pond sed.; pH 6.3 BE 6213.03 @4.89# 56.0 44.0 ,1.0 1.4 Doe Run Pond sed.; pH 6.1 BE 6212.81 @4.91# 0.8 USDA Pond sed.; pH 6.4 BE 6212.71 @5.11# 93.0 6.0 2.0 0.4 Oconee River sed.; pH 6.5 BE 62
5.01 Correlation logKoc– CRI 601
2,3,4,48-„60…
6.2 Lake Superior suspended sol.~1980! FM 505.0 Idem~1983! 50
5.03 Correlation logKoc– CRI 601
J. Phys. Chem. Ref. Data, Vol. 30, No. 1, 2001

1
828282
306306 DELLE SITE
TABLE 6. Sorption coefficients for polychlorobiphenyls~PCBs!—Continued
log Kd
log Kf0
(1/n) log Koc
Sorbent composition~%!Other sorbent and solution data;
prediction procedureTemp.
~°C! Meth. Ref.Sand Silt Clay OC
2,38,4,48-„66…
5.8 Lake Superior suspended sol.~1980! FM 504.9 Idem~1983! 50
4.90 Correlation logKoc– CRI 601
2,38,48,5-„70…
5.7 Lake Superior suspended sol.~1980! FM 505.1 Idem~1983! 503.07 @4.69# 55.0 45.0 ,1.0 2.4 Hickory Hill Pond sed.; pH 6.3 BE 6213.00 @4.85# 56.0 44.0 ,1.0 1.4 Doe Run Pond sed.; pH 6.1 BE 6212.76 @4.86# 0.8 USDA Pond sed.; pH 6.4 BE 6212.62 @5.02# 93.0 6.0 2.0 0.4 Oconee River sed.; pH 6.5 BE 62
5.07 Correlation logKoc– CRI 601
2,4,48,5-„74…
5.8 Lake Superior suspended sol.~1980! FM 504.9 Idem~1983! 50
5.00 Correlation logKoc– CRI 601
2,28,3,4,58-„87…
2.87 99.3 0.20 0.55 0.03 Ispra soil~C2 horizon!; pH 5.1 22 BE 1533.11 @5.91# 95.5 3.4 1.6 0.16 Idem~C4 horizon!; pH 4.8 1534.03 5.73 91.8 6.4 1.8 1.87 Idem~A2 horizon!; pH 4.8 153
4.76 Marine water DHS~5 mg C/L! 20 AG 4134.87 Idem~10 mg C/L! 4134.85 Idem~20 mg C/L! 4133.75 Idem~40 mg C/L! 413
5.6 Lake Superior suspended sol.~1980! FM 505.1 Idem~1983! 50
4.88 Correlation logKoc– MCI 5784.75 Correlation logKdoc– MCI
~doc5dissol. marine humic subst.!599
@5.09# Correlation logKom– MCI 5915.54 Correlation logKoc– CRI 6014.88 Correlation logKoc– LSER 602
2,28,3,48,5-„90…
4.66 Marine water DHS~5 mg C/L! 20 AG 4134.68 Idem~10 mg C/L! 4134.75 Idem~20 mg C/L! 4133.75 Idem~40 mg C/L! 4134.73 Correlation logKdoc– MCI
~doc5dissol. marine humic subst.!599
2,28,3,58,6-„95…
2.64 99.3 0.20 0.55 0.03 Ispra soil~C2 horizon!; pH 5.1 22 BE 1532.94 @5.74# 95.5 3.4 1.6 0.16 Idem~C4 horizon!; pH 4.8 1533.84 5.55 91.8 6.4 1.8 1.87 Idem~A2 horizon!; pH 4.8 1533.38 5.68 76.66 4.59 18.75 0.50 North Sea sediment No. 125 20 BE 13.87 5.70 36.70 36.15 27.15 1.47 North Sea sediment No. 106 20 BE 14.10 5.64 3.29 57.82 38.89 2.33 North Sea sediment No. 99 20 BE 1
4.60 Marine water DHS~5 mg C/L! 20 AG 4134.66 Idem~10 mg C/L! 4134.61 Idem~20 mg C/L! 4133.70 Idem~40 mg C/L! 4134.59 Correlation logKdoc– MCI
~doc5dissol. marine humic subst.!599
5.57 Correlation logKoc– CRI 601
2,28,38,4,5-„97…
3.40 99.3 0.20 0.55 0.03 Ispra soil~C2 horizon!; pH 5.1 22 BE 1533.52 @6.32# 95.5 3.4 1.6 0.16 Idem~C4 horizon!; pH 4.8 153
J. Phys. Chem. Ref. Data, Vol. 30, No. 1, 2001

828282
9
8282820000
9
307307SORPTION OF ORGANIC COMPOUNDS
TABLE 6. Sorption coefficients for polychlorobiphenyls~PCBs!—Continued
log Kd
log Kf0
(1/n) log Koc
Sorbent composition~%!Other sorbent and solution data;
prediction procedureTemp.
~°C! Meth. Ref.Sand Silt Clay OC
4.06 5.69 91.8 6.4 1.8 1.87 Idem~A2 horizon!; pH 4.8 1533.53 5.83 76.66 4.59 18.75 0.50 North Sea sediment No. 125 20 BE 14.05 5.89 36.70 36.15 27.15 1.47 North Sea sediment No. 106 20 BE 14.15 5.78 3.29 57.82 38.89 2.33 North Sea sediment No. 99 20 BE 15.4 Lake Superior suspended sol.~1980! FM 505.1 Idem~1983! 50
4.75 Correlation logKdoc– MCI~doc5dissol. marine humic subst.!
599
5.50 Correlation logKoc– CRI 601
2,28,4,48,5-„99…
5.7 Lake Superior suspended sol.~1980! FM 505.1 Idem~1983! 50
4.73 Correlation logKdoc– MCI~doc5dissol. marine humic subst.!
599
5.54 Correlation logKoc– CRI 601
2,28,4,5,58-„101…
3.97 6.41 0.36 Composite Condie si soil 22 BE 612.91 99.3 0.20 0.55 0.03 Ispra soil~C2 horizon!; pH 5.1 22 BE 1533.13 @5.93# 95.5 3.4 1.6 0.16 Idem~C4 horizon!; pH 4.8 1533.98 5.67 91.8 6.4 1.8 1.87 Idem~A2 horizon!; pH 4.8 1533.51 5.81 76.66 4.59 18.75 0.50 North Sea sediment No. 125 20 BE 14.00 5.83 36.70 36.15 27.15 1.47 North Sea sediment No. 106 20 BE 14.15 5.78 3.29 57.82 38.89 2.33 North Sea sediment No. 99 20 BE 1
4.87 58.0 Sanhedron soil humic acid; pH 6.5 24 SE 224.12 48.7 Sanhedron soil fulvic acid; pH 6.5 24 SE 224.07 54.2 Suwannee River humic acid; pH 6.5 24 SE 224.10 53.8 Suwannee River fulvic acid; pH 6.5 24 SE 224.09 Suwannee River water; pH 6.5;
DOC537 mg/L24 SE 219
4.01 Sopchoppy River water; pH 6.5;DOC544 mg/L
24 SE 219
5.41 69.4 Aldrich humic acid Na salt; pH 6.5 24 SE 2195.41 65.8 Fluka-Tridom humic acid; pH 6.5 24 SE 2194.81 56.7 Calcasieu River humic extr.; pH 6.5 24 SE 214.77 Marine water DHS~5 mg C/L! 20 AG 4134.86 Idem~10 mg C/L! 4134.80 Idem~20 mg C/L! 4133.86 Idem~40 mg C/L! 413
5.7 Lake Superior suspended sol.~1980! FM 505.09 5.65 Idem~1983! [email protected]# 5.6 4.1 Lake Ontario sediment trap
materialFM 49
5.5 50 Niagara River organic matter FM 495.45 C18 column RPLC 5734.63 Soil; experimental~literature! 2176.6 Correlation logKoc– logKow(96) 496.68 Correlation logKoc– logKow(96) 505.58 Correlation logKoc– logKow(207) 504.74 Correlation logKoc– logS 5644.87 Correlation logKoc– MCI 5784.73 Correlation logKdoc– MCI
~doc5dissol. marine humic subst.!599
@5.08# Correlation logKom– MCI 5915.58 Correlation logKoc– CRI 6014.91 Correlation logKoc– LSER 602
2,3,38,4,48-„105…
3.23 99.3 0.20 0.55 0.03 Ispra soil~C2 horizon!; pH 5.1 22 BE 1533.41 @6.20# 95.5 3.4 1.6 0.16 Idem~C4 horizon!; pH 4.8 1534.13 5.81 91.8 6.4 1.8 1.87 Idem~A2 horizon!; pH 4.8 153
J. Phys. Chem. Ref. Data, Vol. 30, No. 1, 2001

828282
828282
308308 DELLE SITE
TABLE 6. Sorption coefficients for polychlorobiphenyls~PCBs!—Continued
log Kd
log Kf0
(1/n) log Koc
Sorbent composition~%!Other sorbent and solution data;
prediction procedureTemp.
~°C! Meth. Ref.Sand Silt Clay OC
4.91 Correlation logKdoc– MCI~doc5dissol. marine humic subst.!
599
5.50 Correlation logKoc– CRI 601
2,3,38,48,6-„110…
2.86 99.3 0.20 0.55 0.03 Ispra soil~C2 horizon!; pH 5.1 22 BE 1533.10 @5.90# 95.5 3.4 1.6 0.16 Idem~C4 horizon!; pH 4.8 1534.00 5.71 91.8 6.4 1.8 1.87 Idem~A2 horizon!; pH 4.8 153
4.72 Marine water DHS~5 mg C/L! 20 AG 4134.80 Idem~10 mg C/L! 4134.77 Idem~20 mg C/L! 4133.79 Idem~40 mg C/L! 413
5.6 Lake Superior suspended sol.~1980! FM 505.1 Idem~1983! 50
4.75 Correlation logKdoc– MCI~doc5dissol. marine humic subst.!
599
5.50 Correlation logKoc– CRI 601
2,38,4,48,5-„118…
3.10 99.3 0.20 0.55 0.03 Ispra soil~C2 horizon!; pH 5.1 22 BE 1533.30 @6.10# 95.5 3.4 1.6 0.16 Idem~C4 horizon!; pH 4.8 1534.12 5.81 91.8 6.4 1.8 1.87 Idem~A2 horizon!; pH 4.8 1535.7 Lake Superior susp. solids~1980! FM 505.1 Idem~1983! 50
4.88 Correlation logKdoc– MCI~doc5dissol. marine humic subst.!
599
5.52 Correlation logKoc– CRI 601
2,28,3,38,4,48-„128…
3.97 6.28 76.66 4.59 18.75 0.50 North Sea sediment No. 125 20 BE 14.34 6.17 36.70 36.15 27.15 1.47 North Sea sediment No. 106 20 BE 14.38 6.01 3.29 57.82 38.89 2.33 North Sea sediment No. 99 20 BE 1
5.05 Correlation logKoc– MCI 5965.06 Correlation logKoc– MCI [email protected]# Correlation logKom– MCI 5915.26 Correlation logKdoc– MCI
~doc5dissol. marine humic subst.!599
5.93 Correlation logKoc– CRI 6015.25 Correlation logKoc– LSER 602
2,28,3,38,5,6-„134…
5.18 Marine water DHS~5 mg C/L! 20 AG 4135.16 Idem~10 mg C/L! 4135.15 Idem~20 mg C/L! 4134.41 Idem~40 mg C/L! 4135.10 Correlation logKdoc– MCI
~doc5dissol. marine humic subst.!599
2,28,3,38,6,68-„136…
3.71 6.01 76.66 4.59 18.75 0.50 North Sea sediment No. 125 20 BE 14.23 6.06 36.70 36.15 27.15 1.47 North Sea sediment No. 106 20 BE 14.26 5.90 3.29 57.82 38.89 2.33 North Sea sediment No. 99 20 BE 16.17 6.53 43.2 Lake suspended solids~0.7 mg/L! FM 4944.85 5.68 14.8 Idem~6.5 mg/L! FM 494
4.95 Marine water DHS~5 mg C/L! 20 AG 4135.05 Idem~10 mg C/L! 4134.95 Idem~20 mg C/L! 4134.27 Idem~40 mg C/L! 4134.94 Correlation logKdoc– MCI
~doc5dissol. marine humic subst.!599
6.02 Correlation logKoc– CRI 601
J. Phys. Chem. Ref. Data, Vol. 30, No. 1, 2001

828282
8
309309SORPTION OF ORGANIC COMPOUNDS
TABLE 6. Sorption coefficients for polychlorobiphenyls~PCBs!—Continued
log Kd
log Kf0
(1/n) log Koc
Sorbent composition~%!Other sorbent and solution data;
prediction procedureTemp.
~°C! Meth. Ref.Sand Silt Clay OC
2,28,3,4,48,5-„138…
3.38 99.3 0.20 0.55 0.03 Ispra soil~C2 horizon!; pH 5.1 22 BE 1533.53 @6.33# 95.5 3.4 1.6 0.16 Idem~C4 horizon!; pH 4.8 1534.26 5.93 91.8 6.4 1.8 1.87 Idem~A2 horizon!; pH 4.8 1533.92 6.22 76.66 4.59 18.75 0.50 North Sea sediment No. 125 20 BE 14.29 6.12 36.70 36.15 27.15 1.47 North Sea sediment No. 106 20 BE 14.35 5.99 3.29 57.82 38.89 2.33 North Sea sediment No. 99 20 BE 15.8 Lake Superior susp. solids~1980! FM 505.3 Idem~1983! 50
5.21 Marine water DHS~5 mg C/L! 20 AG 4135.22 Idem~10 mg C/L! 4135.17 Idem~20 mg C/L! 4134.60 Idem~40 mg C/L! 4135.24 Correlation logKdoc– MCI
~doc5dissol. marine humic subst.!599
5.94 Correlation logKoc– CRI 601
2,28,3,4,5,58-„141…
3.40 99.3 0.20 0.55 0.03 Ispra soil~C2 horizon!; pH 5.1 22 BE 1533.52 @6.32# 95.5 3.4 1.6 0.16 Idem~C4 horizon!; pH 4.8 1534.36 6.05 91.8 6.4 1.8 1.87 Idem~A2 horizon!; pH 4.8 1535.8 Lake Superior suspended sol.~1980! FM 505.1 Idem~1983!
5.24 Correlation logKdoc– MCI~doc5dissol. marine humic subst.!
599
6.02 Correlation logKoc– CRI 601
2,28,3,48,5,58-„146…
3.37 99.3 0.20 0.55 0.03 Ispra soil~C2 horizon!; pH 5.1 22 BE 1533.52 @6.32# 95.5 3.4 1.6 0.16 Idem~C4 horizon!; pH 4.8 1534.20 5.86 91.8 6.4 1.8 1.87 Idem~A2 horizon!; pH 4.8 1535.8 Lake Superior suspended sol.~1980! FM 505.40 5.88 Idem~1983! 50
5.18 Marine water DHS~5 mg C/L! 20 AG 4135.22 Idem~10 mg C/L! 4135.14 Idem~20 mg C/L! 4134.58 Idem~40 mg C/L! 4136.92 Correlation logKoc– logKow(96) 505.75 Correlation logKoc– logKow(207) 505.22 Correlation logKdoc– MCI
~doc5dissol. marine humic subst.!599
6.01 Correlation logKoc– CRI 601
2,28,3,48,5,68-„148…
3.05 99.3 0.20 0.55 0.03 Ispra soil~C2 horizon!; pH 5.1 22 BE 1533.32 @6.11# 95.5 3.4 1.6 0.16 Idem~C4 horizon!; pH 4.8 1534.03 5.71 91.8 6.4 1.8 1.87 Idem~A2 horizon!; pH 4.8 153
5.06 Correlation logKdoc– MCI~doc5dissol. marine humic subst.!
599
2,28,3,48,58,6-„149…
3.21 99.3 0.20 0.55 0.03 Ispra soil~C2 horizon!; pH 5.1 22 BE 1533.39 @6.18# 95.5 3.4 1.6 0.16 Idem~C4 horizon!; pH 4.8 1534.12 5.79 91.8 6.4 1.8 1.87 Idem~A2 horizon!; pH 4.8 153
5.08 Correlation logKdoc– MCI~dom5dissol. marine humic subst.!
599
2,28,3,5,58,6-„151…
3.16 99.3 0.20 0.55 0.03 Ispra soil~C2 horizon!; pH 5.1 22 BE 1533.35 @6.15# 95.5 3.4 1.6 0.16 Idem~C4 horizon!; pH 4.8 1534.11 5.79 91.8 6.4 1.8 1.87 Idem~A2 horizon!; pH 4.8 [email protected]# 4.85 0.0 93.8 6.3 0.50 WES reference soil; 6 m.i. 25 BE 21
J. Phys. Chem. Ref. Data, Vol. 30, No. 1, 2001
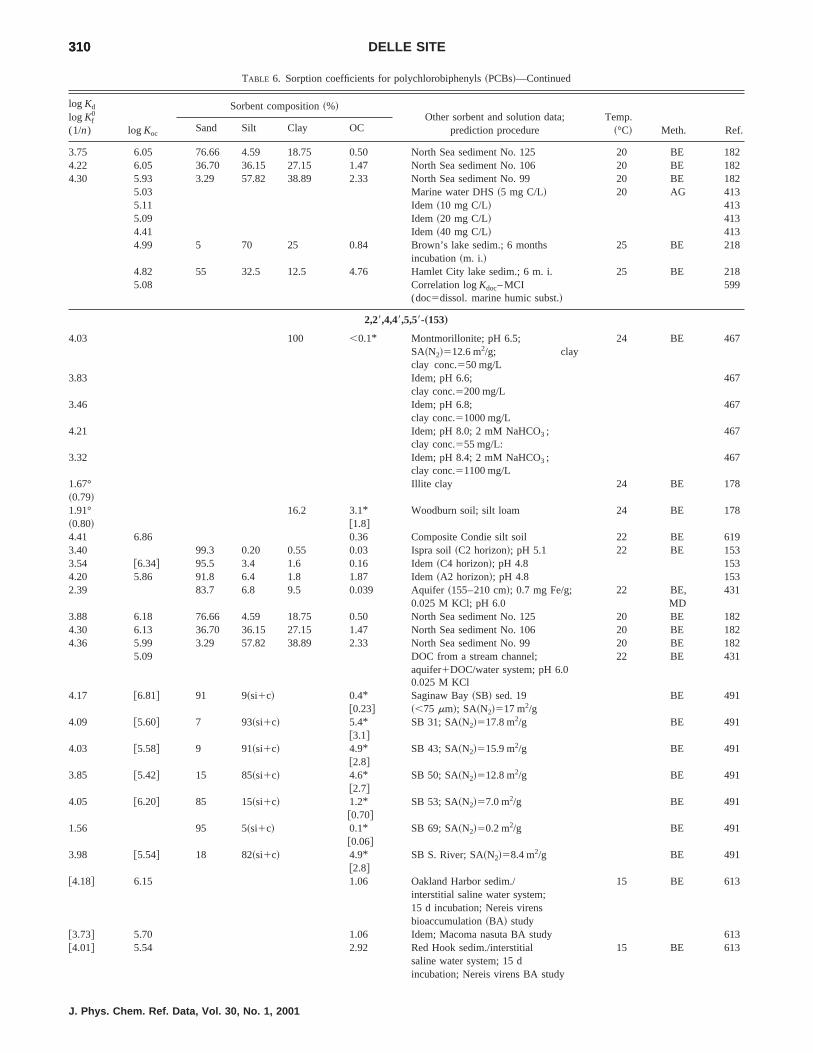
828282
8
828282
310310 DELLE SITE
TABLE 6. Sorption coefficients for polychlorobiphenyls~PCBs!—Continued
log Kd
log Kf0
(1/n) log Koc
Sorbent composition~%!Other sorbent and solution data;
prediction procedureTemp.
~°C! Meth. Ref.Sand Silt Clay OC
3.75 6.05 76.66 4.59 18.75 0.50 North Sea sediment No. 125 20 BE 14.22 6.05 36.70 36.15 27.15 1.47 North Sea sediment No. 106 20 BE 14.30 5.93 3.29 57.82 38.89 2.33 North Sea sediment No. 99 20 BE 1
5.03 Marine water DHS~5 mg C/L! 20 AG 4135.11 Idem~10 mg C/L! 4135.09 Idem~20 mg C/L! 4134.41 Idem~40 mg C/L! 4134.99 5 70 25 0.84 Brown’s lake sedim.; 6 months
incubation~m. i.!25 BE 218
4.82 55 32.5 12.5 4.76 Hamlet City lake sedim.; 6 m. i. 25 BE 215.08 Correlation logKdoc– MCI
(doc5dissol. marine humic subst.!599
2,28,4,48,5,58-„153…
4.03 100 ,0.1* Montmorillonite; pH 6.5;SA~N2!512.6 m2/g; clayclay conc.550 mg/L
24 BE 467
3.83 Idem; pH 6.6;clay conc.5200 mg/L
467
3.46 Idem; pH 6.8;clay conc.51000 mg/L
467
4.21 Idem; pH 8.0; 2 mM NaHCO3 ;clay conc.555 mg/L:
467
3.32 Idem; pH 8.4; 2 mM NaHCO3 ;clay conc.51100 mg/L
467
1.67°~0.79!
Illite clay 24 BE 178
1.91° 16.2 3.1* Woodburn soil; silt loam 24 BE 178~0.80! @1.8#4.41 6.86 0.36 Composite Condie silt soil 22 BE 6193.40 99.3 0.20 0.55 0.03 Ispra soil~C2 horizon!; pH 5.1 22 BE 1533.54 @6.34# 95.5 3.4 1.6 0.16 Idem~C4 horizon!; pH 4.8 1534.20 5.86 91.8 6.4 1.8 1.87 Idem~A2 horizon!; pH 4.8 1532.39 83.7 6.8 9.5 0.039 Aquifer~155–210 cm!; 0.7 mg Fe/g;
0.025 M KCl; pH 6.022 BE,
MD431
3.88 6.18 76.66 4.59 18.75 0.50 North Sea sediment No. 125 20 BE 14.30 6.13 36.70 36.15 27.15 1.47 North Sea sediment No. 106 20 BE 14.36 5.99 3.29 57.82 38.89 2.33 North Sea sediment No. 99 20 BE 1
5.09 DOC from a stream channel;aquifer1DOC/water system; pH 6.00.025 M KCl
22 BE 431
4.17 @6.81# 91 9~si1c! 0.4* Saginaw Bay~SB! sed. 19 BE [email protected]# ~,75 mm!; SA~N2!517 m2/g
4.09 @5.60# 7 93~si1c! 5.4*@3.1#
SB 31; SA~N2!517.8 m2/g BE 491
4.03 @5.58# 9 91~si1c! 4.9*@2.8#
SB 43; SA~N2!515.9 m2/g BE 491
3.85 @5.42# 15 85~si1c! 4.6*@2.7#
SB 50; SA~N2!512.8 m2/g BE 491
4.05 @6.20# 85 15~si1c! 1.2*@0.70#
SB 53; SA~N2!57.0 m2/g BE 491
1.56 95 5~si1c! 0.1*@0.06#
SB 69; SA~N2!50.2 m2/g BE 491
3.98 @5.54# 18 82~si1c! 4.9*@2.8#
SB S. River; SA~N2!58.4 m2/g BE 491
@4.18# 6.15 1.06 Oakland Harbor sedim./interstitial saline water system;15 d incubation; Nereis virensbioaccumulation~BA! study
15 BE 613
@3.73# 5.70 1.06 Idem; Macoma nasuta BA study [email protected]# 5.54 2.92 Red Hook sedim./interstitial
saline water system; 15 dincubation; Nereis virens BA study
15 BE 613
J. Phys. Chem. Ref. Data, Vol. 30, No. 1, 2001

3
4,
4,
,
8
311311SORPTION OF ORGANIC COMPOUNDS
TABLE 6. Sorption coefficients for polychlorobiphenyls~PCBs!—Continued
log Kd
log Kf0
(1/n) log Koc
Sorbent composition~%!Other sorbent and solution data;
prediction procedureTemp.
~°C! Meth. Ref.Sand Silt Clay OC
3.73 5.26 2.92 Idem; Macoma nasuta BA study 614.23 @5.82# 4.5* Saginaw Bay sediment 50; 24 BE 467
@2.61# pH 7.0; SA~N2!512.8 m2/g;sed. conc.555 mg/L
4.09 @5.67# Idem; pH 6.8;sed. conc.5220 mg/L
467
4.00 @5.58# Idem; pH 6.9;sed. conc.51100 mg/L
467
5.06 6.61 2.8 Saginaw Bay sediment 50;sediment-interstitial water
24 DF 466
6.60 7–13 River sediment BE [email protected]# 5.6 4.1 Lake Ontario sediment trap material FM 49
5.5 50 Niagara River organic matter FM 495.3 Lake Superior suspended sol.~1983! FM 505.74av 6.76av Great Lakes suspended matter
~three phases distribution!25 RS 409
4.42av Great Lakes DOC~same procedure! 25 RS [email protected]# 5.5 2.9 Offshore Grand Haven sediment; BE 46
~solute complexation model! [email protected]# 5.7 3.4 Nearshore Grand Haven sediment; BE 46
~solute complexation model! [email protected]# 6.1 3.8 Benton Harbor sediment; BE 464
~solute complexation model! 4945.26 Marine water DHS~5 mg C/L! 20 AG 4135.25 Idem~10 mg C/L! 4135.19 Idem~20 mg C/L! 4134.62 Idem~40 mg C/L! 4135.51 Aldrich humic acid; pH 7.32
(DOC50–11 mg/L)6.6 RS 546
7.31 °* Aldrich humic acid 24 BE 178~0.26!6.08 Soil; experimental~literature! 2177.3 Correlation logKoc– logKow(96) 496.43 Correlation logKoc– logKow 965.33 Correlation logKoc– logKow 2076.51 Correlation logKoc– logKow 1085.95 Correlation logKoc– logS 966.42 Correlation logKoc– logS~mp! 965.29 Correlation logKoc– logS 5645.22 Correlation logKdoc– MCI
~doc5dissol. marine humic subst.!599
@5.31# Correlation logKom– MCI 5916.02 Correlation logKoc– CRI 6015.32 Correlation logKoc– LSER 602
2,28,4,48,6,68-„155…
6.08av 2.78, Coarse si fractions of Doe Run 25 BE 103.27 and Hickory Hill sediments
5.95 Correlation logKoc– logKow 965.95 Correlation logKoc– logS 967.28 Correlation logKoc– logS~mp! 964.91 Correlation logKdoc– MCI
~doc5dissol. marine humic subst.!599
6.17 Correlation logKoc– CRI 601
2,28,3,38,4,48,5-„170…
5.63 Marine water DHS~5 mg C/L! 20 AG 4135.48 Idem~10 mg C/L! 4135.42 Idem~20 mg C/L! 4134.99 Idem~40 mg C/L! 4135.68 Correlation logKdoc– MCI
~doc5dissol. marine humic subst.!599
J. Phys. Chem. Ref. Data, Vol. 30, No. 1, 2001

828282
828282
828282
312312 DELLE SITE
TABLE 6. Sorption coefficients for polychlorobiphenyls~PCBs!—Continued
log Kd
log Kf0
(1/n) log Koc
Sorbent composition~%!Other sorbent and solution data;
prediction procedureTemp.
~°C! Meth. Ref.Sand Silt Clay OC
2,28,3,38,4,5,58-„172…
5.71 Marine water DHS~5 mg C/L! 20 AG 4135.44 Idem~10 mg C/L! 4135.38 Idem~20 mg C/L! 4134.97 Idem~40 mg C/L! 4135.66 Correlation logKdoc– MCI
~doc5dissol. marine humic subst.!599
2,28,3,38,4,5,68-„174…
3.58 99.3 0.20 0.55 0.03 Ispra soil~C2 horizon!; pH 5.1 22 BE 1533.71 @6.51# 95.5 3.4 1.6 0.16 Idem~C4 horizon!; pH 4.8 1534.18 5.82 91.8 6.4 1.8 1.87 Idem~A2 horizon!; pH 4.8 153
5.52 Correlation logKdoc– MCI~doc5dissol. marine humic subst.!
599
2,28,3,38,48,5,6-„177…
3.62 99.3 0.20 0.55 0.03 Ispra soil~C2 horizon!; pH 5.1 22 BE 1533.77 @6.57# 95.5 3.4 1.6 0.16 Idem~C4 horizon!; pH 4.8 1534.21 5.81 91.8 6.4 1.8 1.87 Idem~A2 horizon!; pH 4.8 153
5.54 Marine water DHS~5 mg C/L! 20 AG 4135.39 Idem~10 mg C/L! 4135.35 Idem~20 mg C/L! 4134.90 Idem~40 mg C/L! 4135.52 Correlation logKdoc– MCI
~doc5dissol. marine humic subst.!599
2,28,3,4,48,5,58-„180…
3.67 99.3 0.20 0.55 0.03 Ispra soil~C2 horizon!; pH 5.1 22 BE 1533.80 @6.60# 95.5 3.4 1.6 0.16 Idem~C4 horizon!; pH 4.8 1534.20 5.78 91.8 6.4 1.8 1.87 Idem~A2 horizon!; pH 4.8 1534.06 6.36 76.66 4.59 18.75 0.50 North Sea sediment No. 125 20 BE 14.40 6.23 36.70 36.15 27.15 1.47 North Sea sediment No. 106 20 BE 14.47 6.10 3.29 57.82 38.89 2.33 North Sea sediment No. 99 20 BE 1
5.73 Marine water dissolved humicsubstances~5 mg C/L!
20 AG 413
5.54 Idem~10 mg C/L! 4135.50 Idem~20 mg C/L! 4135.09 Idem~40 mg C/L! 4135.66 Correlation logKdoc– MCI
~doc5dissol. marine humic subst.!599
2,28,3,4,48,58,6-„183…
3.56 99.3 0.20 0.55 0.03 Ispra soil~C2 horizon!; pH 5.1 22 BE 1533.74 @6.54# 95.5 3.4 1.6 0.16 Idem~C4 horizon!; pH 4.8 1534.21 5.82 91.8 6.4 1.8 1.87 Idem~A2 horizon!; pH 4.8 1534.06 6.36 76.66 4.59 18.75 0.50 North Sea sediment No. 125 20 BE 14.41 6.25 36.70 36.15 27.15 1.47 North Sea sediment No. 106 20 BE 14.45 6.09 3.29 57.82 38.89 2.33 North Sea sediment No. 99 20 BE 1
5.53 Marine water DHS~5 mg C/L! 20 AG 4135.40 Idem~10 mg C/L! 4135.35 Idem~20 mg C/L! 4134.92 Idem~40 mg C/L! 4135.50 Correlation logKdoc– MCI
~doc5dissol. marine humic subst.!599
2,28,3,4,5,58,6-„185…
3.99 6.29 76.66 4.59 18.75 0.50 North Sea sediment No. 125 20 BE 14.24 6.08 36.70 36.15 27.15 1.47 North Sea sediment No. 106 20 BE 14.49 6.13 3.29 57.82 38.89 2.33 North Sea sediment No. 99 20 BE 1
5.33 Correlation logKoc– logKow 5785.52 Correlation logKdoc– MCI
~doc5dissol. marine humic subst.!599
J. Phys. Chem. Ref. Data, Vol. 30, No. 1, 2001

828282
828282
828282
828282
313313SORPTION OF ORGANIC COMPOUNDS
TABLE 6. Sorption coefficients for polychlorobiphenyls~PCBs!—Continued
log Kd
log Kf0
(1/n) log Koc
Sorbent composition~%!Other sorbent and solution data;
prediction procedureTemp.
~°C! Meth. Ref.Sand Silt Clay OC
@5.55# Correlation logKdom– MCI 5915.80 Correlation logKoc– LSER 602
2,28,3,48,5,58,6-„187…
5.51 Marine water DHS~5 mg C/L! 20 AG 4135.40 Idem~10 mg C/L! 4135.33 Idem~20 mg C/L! 4134.90 Idem~40 mg C/L! 4135.50 Correlation logKdoc– MCI
~doc5dissol. marine humic subst.!599
2,28,3,38,4,48,5,58-„194…
4.10 6.41 76.66 4.59 18.75 0.50 North Sea sediment No. 125 20 BE 14.37 6.20 36.70 36.15 27.15 1.47 North Sea sediment No. 106 20 BE 14.43 6.06 3.29 57.82 38.89 2.33 North Sea sediment No. 99 20 BE 1
5.94 Marine water DHS~5 mg C/L! 20 AG 4135.72 Idem~10 mg C/L! 4135.68 Idem~20 mg C/L! 4135.36 Idem~40 mg C/L! 4136.02 Correlation logKdoc– MCI
~doc5dissol. marine humic subst.!599
6.96 Correlation logKoc– CRI 601
2,28,3,38,4,48,5,6-„195…
4.11 6.42 76.66 4.59 18.75 0.50 North Sea sediment No. 125 20 BE 14.42 6.25 36.70 36.15 27.15 1.47 North Sea sediment No. 106 20 BE 14.51 6.13 3.29 57.82 38.89 2.33 North Sea sediment No. 99 20 BE 1
5.78 Marine water DHS~5 mg C/L! 20 AG 4135.59 Idem~10 mg C/L! 4135.55 Idem~20 mg C/L! 4135.22 Idem~40 mg C/L! 4135.87 Correlation logKdoc– MCI
~doc5dissol. marine humic subst.!599
2,28,3,38,4,5,58,6-„198…
4.13 6.44 76.66 4.59 18.75 0.50 North Sea sediment No. 125 20 BE 14.43 6.26 36.70 36.15 27.15 1.47 North Sea sediment No. 106 20 BE 14.52 6.15 3.29 57.82 38.89 2.33 North Sea sediment No. 99 20 BE 1
5.91 Marine water DHS~5 mg C/L! 20 AG 4135.63 Idem~10 mg C/L! 4135.56 Idem~20 mg C/L! 4135.23 Idem~40 mg C/L! 4135.86 Correlation logKdoc– MCI
~doc5dissol. marine humic subst.!599
2,28,3,38,4,5,6,68-„199…
4.14 6.44 76.66 4.59 18.75 0.50 North Sea sediment No. 125 20 BE 14.35 6.18 36.70 36.15 27.15 1.47 North Sea sediment No. 106 20 BE 14.39 6.02 3.29 57.82 38.89 2.33 North Sea sediment No. 99 20 BE 1
5.68 Marine water DHS~5 mg C/L! 20 AG 4135.50 Idem~10 mg C/L! 4135.46 Idem~20 mg C/L! 4135.10 Idem~40 mg C/L! 4135.70 Correlation logKdoc– MCI
~doc5dissol. marine humic subst.!599
2,28,3,38,4,58,6,68-„200…
5.91 Marine water DHS~5 mg C/L! 20 AG 4135.65 Idem~10 mg C/L! 4135.60 Idem~20 mg C/L! 4135.31 Idem~40 mg C/L! 4135.86 Correlation logKdoc– MCI
~doc5dissol. marine humic subst.!599
J. Phys. Chem. Ref. Data, Vol. 30, No. 1, 2001

828282
828282
828282
1
314314 DELLE SITE
TABLE 6. Sorption coefficients for polychlorobiphenyls~PCBs!—Continued
log Kd
log Kf0
(1/n) log Koc
Sorbent composition~%!Other sorbent and solution data;
prediction procedureTemp.
~°C! Meth. Ref.Sand Silt Clay OC
7.05 Correlation logKoc– CRI 601
2,28,3,38,5,58,6,68-„202…
4.05 6.36 76.66 4.59 18.75 0.50 North Sea sediment No. 125 20 BE 14.30 6.13 36.70 36.15 27.15 1.47 North Sea sediment No. 106 20 BE 14.38 6.01 3.29 57.82 38.89 2.33 North Sea sediment No. 99 20 BE 1
5.61 Marine water DHS~5 mg C/L! 20 AG 4135.46 Idem~10 mg C/L! 4135.41 Idem~20 mg C/L! 4134.99 Idem~40 mg C/L! 4135.70 Correlation logKdoc– MCI
~doc5dissol. marine humic subst.!599
7.04 Correlation logKoc– CRI 601
2,28,3,38,4,48,5,58,6-„206…
4.16 6.46 76.66 4.59 18.75 0.50 North Sea sediment No. 125 20 BE 14.44 6.27 36.70 36.15 27.15 1.47 North Sea sediment No. 106 20 BE 14.56 6.19 3.29 57.82 38.89 2.33 North Sea sediment No. 99 20 BE 1
6.15 Marine water DHS~5 mg C/L! 20 AG 4135.92 Idem~10 mg C/L! 4135.83 Idem~20 mg C/L! 4135.69 Idem~40 mg C/L! 4136.13 Correlation logKdoc– MCI
~doc5dissol. marine humic subst.!599
2,28,3,38,4,48,5,6,68-„207…
4.09 6.39 76.66 4.59 18.75 0.50 North Sea sediment No. 125 20 BE 14.34 6.17 36.70 36.15 27.15 1.47 North Sea sediment No. 106 20 BE 14.56 6.19 3.29 57.82 38.89 2.33 North Sea sediment No. 99 20 BE 1
5.98 Marine water DHS~5 mg C/L! 20 AG 4135.77 Idem~10 mg C/L! 4135.67 Idem~20 mg C/L! 4135.44 Idem~40 mg C/L! 4135.97 Correlation logKdoc– MCI
~doc5dissol. marine humic subst.!599
Decachloroblophenyl„209…
6.19 Marine water DHS~5 mg C/L! 20 AG 4135.99 Idem~10 mg C/L! 4135.83 Idem~20 mg C/L! 4135.61 Idem~40 mg C/L! 4136.17 Correlation logKdoc– MCI
~doc5dissol. marine humic subst.!599
Aroclor-1016
3.11 @4.73# 55.0 45.0 ,1.0 2.4 Hickory Hill Pond sed.; pH 6.3 BE 6213.11 @4.96# 56.0 44.0 ,1.0 1.4 Doe Run Pond sed.; pH 6.1 BE 6213.14 @5.23# 0.8 USDA Pond sed.; pH 6.4 BE 6212.79 @5.19# 93.0 6.0 2.0 0.4 Oconee River sed.; pH 6.5 BE 62
Aroclor-1242
2.73 @4.05# 11.9 60.9 27.2 4.73 Catlin soil; SA~CO2!526.5 m2/g; 25 BE 175,pH 7.1; CE518.1 me/100 g 215
2.67 @4.03# 4.37 Idem; 6 h low temp. ashed~LTA !; 175,SA~CO2!525.4 m2/g 215
2.49 @3.93# 3.64 Idem; 12 h LTA; 175,SA~CO2!524.5 m2/g 215
2.38 @4.11# 1.84 Idem; 336 h LTA; 175,SA~CO2!523.8 m2/g 215
2.24 @4.27# 100 0.93 Montmorillonite; pH 7.0; 25 BE 175,SA~CO2!520.1 m2/g;CE585.0 me/100 g
215
J. Phys. Chem. Ref. Data, Vol. 30, No. 1, 2001

,
3
1
5
315315SORPTION OF ORGANIC COMPOUNDS
TABLE 6. Sorption coefficients for polychlorobiphenyls~PCBs!—Continued
log Kd
log Kf0
(1/n) log Koc
Sorbent composition~%!Other sorbent and solution data;
prediction procedureTemp.
~°C! Meth. Ref.Sand Silt Clay OC
2.16 @5.05# 0.13 Idem; LTA; SA~CO2!520.2 m2/g 175,215
1.34 100 ,0.01 Ottawa silica sand; pH 5.2; 25 BE 175SA~CO2!50.4 m2/g 215
2.48 @3.68# 85.8 8.9 5.3 6.34 Ispra soil; A1 horizon; pH 4.3 22 BE 1532.64 @4.37# 91.8 6.4 1.8 1.87 Idem; A2 horizon; pH 4.8 1532.23 @4.53# 97.5 1.4 1.1 0.50 Idem; A3 horizon; pH 5.1 1531.71 @4.48# 99.5 0.25 0.25 0.17 Idem; C1 horizon; pH 5.1 1531.23 99.3 0.20 0.55 0.03 Idem; C2 horizon; pH 5.1 151.59 @4.51# 93.3 3.0 3.7 0.12 Idem; C3 horizon; pH 5.0 1531.73 @4.53# 95.5 3.4 1.6 0.16 Idem; C4 horizon; pH 4.8 153
4.17 0.7-3.8
Lake sediments 622
3.10 @4.72# 55.0 45.0 ,1.0 2.4 Hickory Hill Pond sed.; pH 6.3 BE 6213.04 @4.89# 56.0 44.0 ,1.0 1.4 Doe Run Pond sed.; ph 6.1 BE 6213.08 @5.18# 0.8 USDA Pond sed.; pH 6.4 BE 6212.73 @5.13# 93.0 6.0 2.0 0.4 Oconee River sed.; pH 6.5 BE 62
Aroclor-1254
4.15 Illite clay; SA~N2!519.9 m2/g BE 6244.00 Chlorite clay; SA~N2!52.1 m2/g BE 6244.04 Fithian illite BE 6234.06 5.59 3 Fithian illite~95%!1heat-killed
Thalassiosira pseudonana~5%!BE 623
4.12 5.36 5.8 Fithian illite~90%!1heat-killedThalassiosira pseudonana~10%!
BE 623
4.69 5.93 58 Thalassiosira pseudonana~100%! BE 6231.53°~0.91!
Illite clay BE 30
2.11° 16.2 3.1* Woodburn soil; silt loam BE 30~1.24! @1.8#4.23° 57 0.9 Glendale soil; field; pH 7.57; BE 474~1.45! SA~E!5177 m2/g;
CE535.2 me/100 g;0.005 M CaCl2
4.09° Idem; greenhouse 474~1.47!3.90° 13.7 0.7 Harvey soil; field; pH 7.42; BE 474~1.53! SA~E!564.9 m2/g;
CE514.0 me/100 g;0.005 M CaCl2
4.05°~1.55!
13.7 0.8 Idem; greenhouse 474
3.02° 14.5 0.9 Lea soil; field; pH 7.62; BE 474~1.22! SA~E!565.6 m2/g;
CE514.1 me/100 g;0.005 M CaCl2
3.08°~1.23!
14.5 0.7 Idem; greenhouse 474
3.21 @6.17# 0.11 Montmorillonite 22 BE 4653.22 Kaolinite 22 BE 4654.42 @6.16# 1.82 Blue clay 22 BE 4653.56 @5.89# 0.47 Idem; treated with H2O2 4654.38 @5.84# 3.45 Saginaw River 1 sedim. 22 BE 4653.06 @5.04# 1.05 Idem; treated with H2O2 4654.73 @6.31# 2.61 Saginaw River 2 sedim. 22 BE 4654.50 @6.09# Idem 12 4655.18 @6.88# 1.98 Idem; NaOH extr. 22 4654.55 @6.29# 1.84 Idem; benzene/MeOH extr. 4655.01 @6.19# 0.67 Idem; treated with H2O2 4654.89 @6.34# 3.51 Idem~,75 mm! 4654.05 0.07 Saginaw Bay sedim. 22 BE 4655.06 @6.10# 9.25 Huron River suspended solids 22 BE 46
J. Phys. Chem. Ref. Data, Vol. 30, No. 1, 2001

55
316316 DELLE SITE
TABLE 6. Sorption coefficients for polychlorobiphenyls~PCBs!—Continued
log Kd
log Kf0
(1/n) log Koc
Sorbent composition~%!Other sorbent and solution data;
prediction procedureTemp.
~°C! Meth. Ref.Sand Silt Clay OC
4.95 @5.97# 9.48 Saginaw River 1 suspended solids 22 BE 465.07 @6.15# 8.30 Saginaw River 2 suspended solids 22 BE 46
5.44 0.7-3.8
Lake sediments 622
6.0 2.0 Pond sediments 6255.97 6.22 56 Lake suspended solids~Rice! FM 4943.72 5.88 0.7 Pore water/sediment~Rice! FM 4943.85 5.61 1.7 Idem~Rice! FM 4943.40 4.82 3.8 Idem~Rice! FM 494
PCB congeners are identified by the chlorine substitution and B & Z number~Ref. 626!.Values in square parentheses have been calculated by the author.*% OM content.°*Freundlich log nonlinearKom with the respective value of (1/n) in below.av average value.Idem refers to the sorbent reported just above; only the data~texture, OC, temperature, method! which were changed are specified.
J. Phys. Chem. Ref. Data, Vol. 30, No. 1, 2001

317317SORPTION OF ORGANIC COMPOUNDS
TABLE 7. Sorption coefficients for polychlorodibenzo-p-dioxins~PCDDs!
log Kd
log Kf0
(1/n) log Koc
Sorbent composition~%!Other sorbent and solution data;
prediction procedureTemp.~°C! Meth. Ref.Sand Silt Clay OC
1,2,3,7-
5.39 Fulvic acid from a Manitoba soil~Brandon Caroll cl!;8.50 mg/L
20 SE 418
5.45 Idem 30 4185.59 Idem; 8.08 mg/L 40 4185.98 Humic acid from water from a
Manitoba peat bog~Piney peat!;1.95 mg/L
20 SE 418
5.97 Idem 30 4185.91 Idem 40 4186.55 Aldrich humic acid, Na salt;
0.68 mg/L20 SE 418
6.42 Idem 30 4186.33 Idem 40 418
2,3,7,8-
4.26 6.44 44 42 14 0.66 Soil n. 91, EPA site n. 04114B;pH 6.8; CE55.4 me/100 g; 2 disotherm
BE 109
4.48 6.66 Idem, prewashed five times;10 d isotherm
109
6.6 Idem;Koc extrapolated from thedata obtained with water-methanol mixtures
456
6.6 38 40 22 7.7 Soil n. 96, EPA site n. 06126B;pH 5.8; CE515.3 me/100 g;Koc
extrapolated from the data obtainedwith water–methanol mixtures
BE 456
>6.3 2.45 Lake Ontario sediment 10 BE 4987.59 Idem~solid concentration data! 4987.25 Idem~DOC data! 498
6.6 6.8 Particulate from Baltic Sea FM 6275 DOC from Baltic Sea~predicted! 6276.04 Correlation logKoc– logS 6286.7 Correlation logKoc– logS(195) 4567.0 Correlation logKoc– logS(108) 4566.90 Correlation logKoc– logKow 628
1,2,3,4,7-
4.85 Fulvic acid from a Manitoba soil~Brandon Caroll cl!;8.50 mg/L
20 SE 418
4.60 Idem 30 4184.50 Idem 40 4185.80 Humic acid from water from a
Manitoba peat bog~Piney peat!;1.95 mg/L
20 SE 418
5.67 Idem 30 4185.90 Idem 40 4186.38 Aldrich humic acid, Na salt;
0.68 mg/L20 SE 418
6.39 Idem 30 4186.46 Idem 40 418
1,2,3,4,7,8-
6.7 7.1 Particulate from Baltic Sea FM 6275 DOC from Baltic Sea~predicted! 6275.41 Fulvic acid from a Manitoba soil
~Brandon Caroll cl!3.95 mg/L
20 SE 418
5.31 Idem 30 418
J. Phys. Chem. Ref. Data, Vol. 30, No. 1, 2001

318318 DELLE SITE
TABLE 7. Sorption coefficients for polychlorodibenzo-p-dioxins~PCDDs!—Continued
log Kd
log Kf0
(1/n) log Koc
Sorbent composition~%!Other sorbent and solution data;
prediction procedureTemp.~°C! Meth. Ref.Sand Silt Clay OC
5.13 Idem 40 4186.02 Humic acid from water from a
Manitoba peat bog~Piney peat!1.95 mg/L
20 SE 418
6.15 Idem 30 4185.95 Idem 40 4186.32 Aldrich humic acid, Na salt
0.86 mg/L20 SE 418
6.27 Idem 30 4186.15 Idem 40 418
Idem refers to the sorbent reported just above; only the data~texture, OC, temperature, method! which were changed are specified.
J. Phys. Chem. Ref. Data, Vol. 30, No. 1, 2001
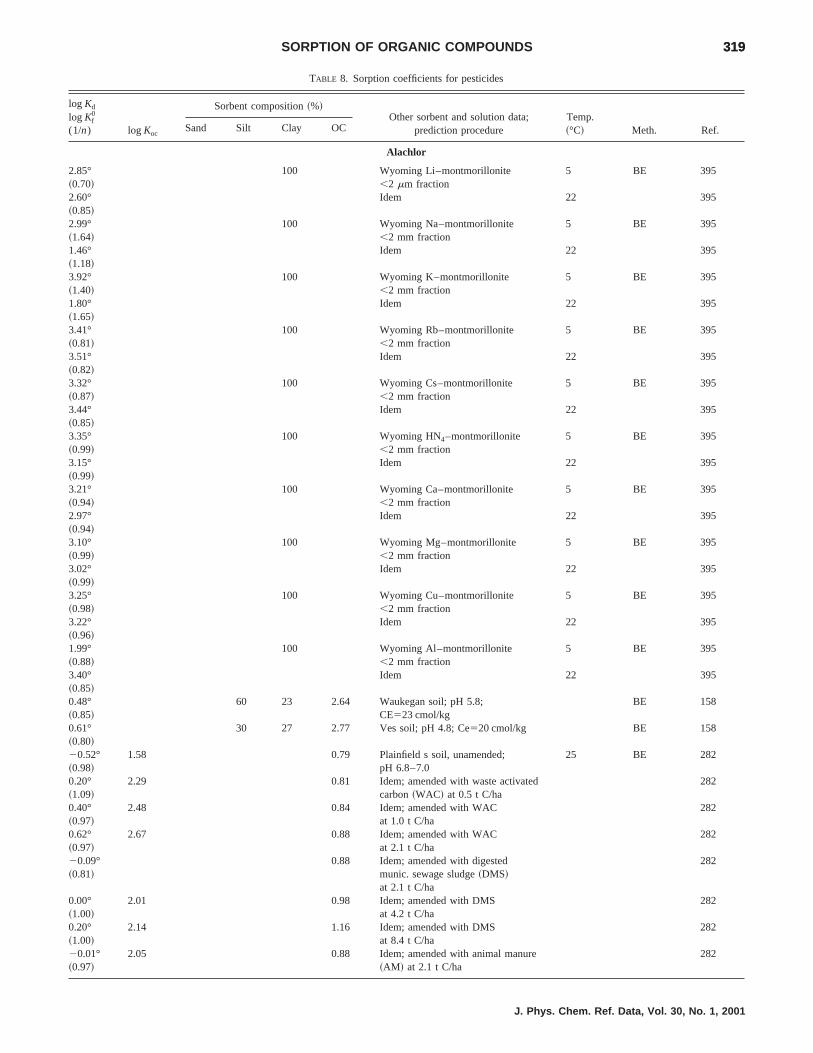
319319SORPTION OF ORGANIC COMPOUNDS
TABLE 8. Sorption coefficients for pesticides
log Kd
log Kf0
(1/n) log Koc
Sorbent composition~%!Other sorbent and solution data;
prediction procedureTemp.~°C! Meth. Ref.Sand Silt Clay OC
Alachlor
2.85° 100 Wyoming Li–montmorillonite 5 BE 395~0.70! ,2 mm fraction2.60°~0.85!
Idem 22 395
2.99° 100 Wyoming Na–montmorillonite 5 BE 395~1.64! ,2 mm fraction1.46°~1.18!
Idem 22 395
3.92° 100 Wyoming K–montmorillonite 5 BE 395~1.40! ,2 mm fraction1.80°~1.65!
Idem 22 395
3.41° 100 Wyoming Rb–montmorillonite 5 BE 395~0.81! ,2 mm fraction3.51°~0.82!
Idem 22 395
3.32° 100 Wyoming Cs–montmorillonite 5 BE 395~0.87! ,2 mm fraction3.44°~0.85!
Idem 22 395
3.35° 100 Wyoming HN4–montmorillonite 5 BE 395~0.99! ,2 mm fraction3.15°~0.99!
Idem 22 395
3.21° 100 Wyoming Ca–montmorillonite 5 BE 395~0.94! ,2 mm fraction2.97°~0.94!
Idem 22 395
3.10° 100 Wyoming Mg–montmorillonite 5 BE 395~0.99! ,2 mm fraction3.02°~0.99!
Idem 22 395
3.25° 100 Wyoming Cu–montmorillonite 5 BE 395~0.98! ,2 mm fraction3.22°~0.96!
Idem 22 395
1.99° 100 Wyoming Al–montmorillonite 5 BE 395~0.88! ,2 mm fraction3.40°~0.85!
Idem 22 395
0.48° 60 23 2.64 Waukegan soil; pH 5.8; BE 158~0.85! CE523 cmol/kg0.61°~0.80!
30 27 2.77 Ves soil; pH 4.8; Ce520 cmol/kg BE 158
20.52° 1.58 0.79 Plainfield s soil, unamended; 25 BE 282~0.98! pH 6.8–7.00.20° 2.29 0.81 Idem; amended with waste activated 282~1.09! carbon~WAC! at 0.5 t C/ha0.40° 2.48 0.84 Idem; amended with WAC 282~0.97! at 1.0 t C/ha0.62° 2.67 0.88 Idem; amended with WAC 282~0.97! at 2.1 t C/ha20.09° 0.88 Idem; amended with digested 282~0.81! munic. sewage sludge~DMS!
at 2.1 t C/ha0.00° 2.01 0.98 Idem; amended with DMS 282~1.00! at 4.2 t C/ha0.20° 2.14 1.16 Idem; amended with DMS 282~1.00! at 8.4 t C/ha20.01° 2.05 0.88 Idem; amended with animal manure 282~0.97! ~AM ! at 2.1 t C/ha
J. Phys. Chem. Ref. Data, Vol. 30, No. 1, 2001

320320 DELLE SITE
TABLE 8. Sorption coefficients for pesticides—Continued
log Kd
log Kf0
(1/n) log Koc
Sorbent composition~%!Other sorbent and solution data;
prediction procedureTemp.~°C! Meth. Ref.Sand Silt Clay OC
0.03° 2.04 0.98 Idem; amended with AM 282~1.00! at 4.2 t C/ha0.09° 2.03 1.16 Idem; amended with AM 282~0.95! at 8.4 t C/ha0.54 2.53 25 49 26 1.02 Dundee tilled soil~0–5 cm!;
pH 5.76; 0.01 M CaCl2
25 BE 159
0.73 2.51 20 51 29 1.67 Idem; no-tilled; pH 5.54 15920.23 @2.31# 80 15 5 0.5* Augusta soil; pH 5.7; 28 BE 280
@0.29# CE53.2 me/100 g; SA~E!53.3 m2/g20.28 @2.25# 89 9 2 0.5* Norfolk soil; pH 5.4; 28 BE 280
@0.29# CE52.3 me/100 g; SA~E!54.4 m2/g0.19 @2.34# 72 23 5 1.2* Goldsboro soil; pH 5.3; 28 BE 280
@0.70# CE53.3 me/100 g; SA~E!57.0 m2/g20.03 @2.06# 82 10 8 1.4* Appling soil; pH 6.8; 28 BE 280
@0.81# CE56.9 me/100 g;SA~E!512.8 m2/g
0.42 @2.26# 70 22 8 2.5* Lynchburg soil; pH 5.5; 28 BE [email protected]# CE56.6 me/100 g;
SA~E!513.6 m2 g0.01 @2.01# 76 16 8 1.7* Cecil soil; pH 5.4; 28 BE 280
@0.99# CE53.1 me/100 g;SA~E!516.3 m2/g
0.40 @2.41# 26 64 10 1.7* Rains soil; pH 6.0; 28 BE [email protected]# CE57.1 me/100 g;
SA~E!518.8 m2/g0.62 @2.22# 61 26 12 4.4* Portsmouth soil; pH 5.4; 28 BE 280
@2.55# CE510.6 me/100 g;SA~E!520.6 m2/g
1.13 @2.41# 52 36 13 8.7* Cape Fear soil; pH 5.1; 28 BE [email protected]# CE510.3 me/100 g;
SA~E!577.2 m2/g0.031° 22 66 12 1.45* Gigger soil, no-tilled; pH 5.37; BE 161~0.61! 0.05 M CaCl220.327° 22 66 12 0.81* Idem, tilled; pH 5.23 BE 161~0.66!20.85 @2.03# 97.1 2.3 0.6 0.13 Tampa aquifer; pH 8.
0.01 N CaCl2
BE 521
@2.43# 63.36 Humic acid from municipal sewagesludge; pH 4.0
20 BU 160
@2.44# 55.75 Humic acid from a control soil;pH 4.0
20 BU 160
@2.34# 53.56 Humic acid from a soil amendedwith sewage sludge; pH 4.0
20 BU 160
2.28 Soil; experimental~literature! 2172.32 Correlation logKoc– logS 564
Aldicarb
20.77° @1.52# 77 15 8 0.51 Sarpy soil; pH 7.3; 24 BE 122~0.93! CE55.7 me/100 g; 0.01 M CaCl2
20.70° @1.27# 83 9 8 1.07 Thurman soil; pH 6.83; 24 BE 122~0.95! CE56.1 me/100 g; 0.01 M CaCl2
20.21° 37 42 21 2.64 Clarion agricol. soil; pH 5.00; 24 BE 122~0.86! CE521 me/100 g; 0.01 M CaCl2
0.06° 21 55 24 3.80 Harps agricol. soil; pH 7.30; 24 BE 122~0.85! CE537.8 me/100 g; 0.01 M CaCl2
0.54° @1.28# 42 39 19 18.36 Peat; pH 6.98; CE577.3 me/100 g; 24 BE 122~0.89! 0.01 M CaCl2
@1.63# 3.53* Batcombe sil soil; pH 6.1; 20 BE [email protected]# 0.01 M CaCl2
20.82 1.11 53 37 10 1.17 Palmira soil; pH 4.9;CE58.2 cmol/kg
15 BE 629
21.15 0.78 53 37 10 1.17 Idem 25 BE 62921.22 0.71 53 37 10 1.17 Idem 35 BE 629
J. Phys. Chem. Ref. Data, Vol. 30, No. 1, 2001

321321SORPTION OF ORGANIC COMPOUNDS
TABLE 8. Sorption coefficients for pesticides—Continued
log Kd
log Kf0
(1/n) log Koc
Sorbent composition~%!Other sorbent and solution data;
prediction procedureTemp.~°C! Meth. Ref.Sand Silt Clay OC
1.51 Correlation logKoc– logS 564
Aldrin
@3.00# @4.69# 3.53* Batcombe sil soil; pH 6.1; 20 BE [email protected]# 0.01 M CaCl2
3.64 5.38 25 40 35 1.8 Taichung soil; pH 6.8 25 BE 4075.05 Aldrich humic acid 25 SE 4072.61 Soil; experimental~literature! 2174.68 Correlation logKoc– logS 5645.02 Correlation logKoc – MCI [email protected]# Correlation logKom – MCI 591
Ametryne ~pKaÄ3.93, Ref. 679!
T.A. 100 H–montmorillonite; pH 3.6 BE 2121.34 100 Na–montmorillonite; pH 7.9 BE 2121.77 100 Ca–montmorillonite; pH 7.9 BE 2121.38 100 Mg–montmorillonite; pH 8.2 BE 2120.49 @2.33# 74.4 19.5 6.1 2.5* Aguadilla soil; pH 7.4; BE 256
@1.45# CE510 me/100 g; 0.01 M CaCl2
0.44 @2.57# 27.6 35.6 36.8 1.3* Aguirre soil; pH 9.0; BE [email protected]# CE514.3 me/100 g; 0.01 M CaCl2
0.85 @2.58# 14.9 39.3 45.8 3.2* Alonso soil; pH 5.1; BE [email protected]# CE513.8 me/100 g; 0.01 M CaCl2
0.41 @2.08# 49.2 28.8 22.0 3.7* Altura soil; pH 8.0; BE [email protected]# CE527.6 me/100 g; 0.01 M CaCl2
0.51 @2.51# 68.1 4.4 27.5 1.7* Bayamon soil; pH 4.7; BE [email protected]# CE55.0 me/100 g; 0.01 M CaCl2
2.22 @2.91# 36.0 36.0 28.0 36.0* Cano Tiburones soil; pH 5.5; BE [email protected]# CE586.0 me/100 g; 0.01 M CaCl2
0.44 @2.40# 6.6 28.9 64.5 1.9* Catalina soil; pH 4.7; BE [email protected]# CE511.8 me/100 g; 0.01 M CaCl2
0.32 @2.23# 89.0 7.3 2.08 2.1* Catano soil; pH 7.9; BE [email protected]# CE56.9 me/100 g; 0.01 M CaCl2
0.60 @2.53# 58.8 23.4 17.8 2.0* Cayagua` soil; pH 5.2; BE [email protected]# CE57.3 me/100 g; 0.01 M CaCl2
1.12 @2.67# 13.3 34.8 51.9 4.9* Cialitos soil; pH 5.4; BE [email protected]# CE518.6 me/100 g; 0.01 M CaCl2
0.96 @2.63# 22.7 37.4 39.9 3.7* Coloso soil; pH 5.7; BE [email protected]# CE523.0 me/100 g; 0.01 M CaCl2
0.40 @2.13# 23.4 24.8 51.8 3.2* Coto soil: pH 7.7; BE [email protected]# CE514.0 me/100 g; 0.01 M CaCl2
0.57 @2.28# 39.1 29.7 32.2 3.4* Fe soil; pH 7.5; BE [email protected]# CE527.6 me/100 g; 0.01 M CaCl2
1.26 @2.98# 15.0 50.7 34.3 3.3* Fortuna soil; pH 5.4; BE [email protected]# CE523.3 me/100 g; 0.01 M CaCl2
0.52 @2.44# 15.5 32.5 52.0 2.1* Fraternidad soil; pH 6.3; BE [email protected]# CE536.0 me/100 g; 0.01 M CaCl2
0.91 @2.52# 11.1 23.8 65.1 4.2* Fraternidad~Lajas! soil; pH 5.9; BE [email protected]# CE558.0 me/100 g; 0.01 M CaCl2
0.61 @2.16# 6.4 19.6 74.0 4.8* Guanica soil; pH 8.1; BE [email protected]# CE552.1 me/100 g; 0.01 M CaCl2
0.67 @2.68# 10.1 50.9 39.0 1.7* Humata soil; pH 4.5; BE [email protected]# CE510.1 me/100 g; 0.01 M CaCl2
0.85 @2.57# 26.6 53.5 20.9 3.3* Josefa soil; pH 6.0; BE [email protected]# CE516.8 me/100 g; 0.01 M CaCl2
1.04 @2.84# 15.2 41.6 43.2 2.7* Juncos soil; pH 6.2; BE [email protected]# CE513.4 me/100 g; 0.01 M CaCl2
0.81 @2.46# 19.9 33.4 46.7 3.9* Mabı soil; pH 7.0; BE [email protected]# CE555.2 me/100 g; 0.01 M CaCl2
0.75 @2.29# 22.7 40.7 36.6 4.9* Mabı soil; pH 5.7; BE [email protected]# CE531.0 me/100 g; 0.01 M CaCl2
0.38 @2.23# 14.9 42.8 2.38 2.4* Mercedita soil; pH 8.1; BE 256
J. Phys. Chem. Ref. Data, Vol. 30, No. 1, 2001
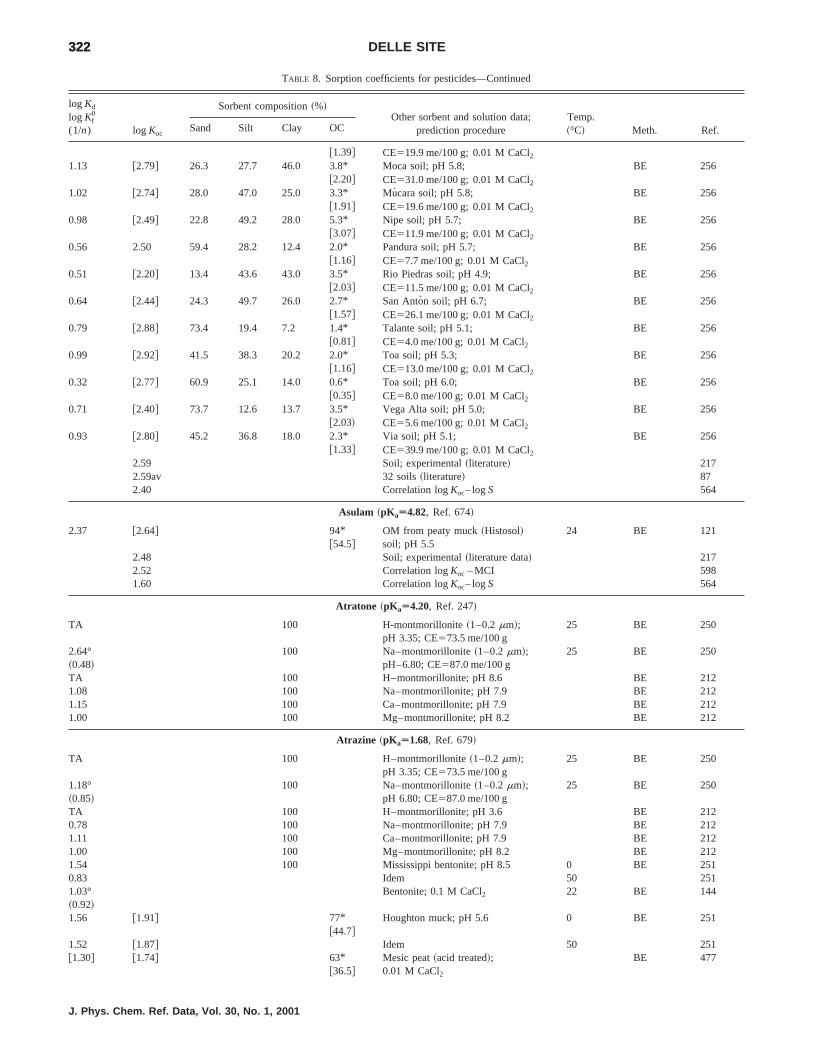
322322 DELLE SITE
TABLE 8. Sorption coefficients for pesticides—Continued
log Kd
log Kf0
(1/n) log Koc
Sorbent composition~%!Other sorbent and solution data;
prediction procedureTemp.~°C! Meth. Ref.Sand Silt Clay OC
@1.39# CE519.9 me/100 g; 0.01 M CaCl2
1.13 @2.79# 26.3 27.7 46.0 3.8* Moca soil; pH 5.8; BE [email protected]# CE531.0 me/100 g; 0.01 M CaCl2
1.02 @2.74# 28.0 47.0 25.0 3.3* Mucara soil; pH 5.8; BE [email protected]# CE519.6 me/100 g; 0.01 M CaCl2
0.98 @2.49# 22.8 49.2 28.0 5.3* Nipe soil; pH 5.7; BE [email protected]# CE511.9 me/100 g; 0.01 M CaCl2
0.56 2.50 59.4 28.2 12.4 2.0* Pandura soil; pH 5.7; BE [email protected]# CE57.7 me/100 g; 0.01 M CaCl2
0.51 @2.20# 13.4 43.6 43.0 3.5* Rio Piedras soil; pH 4.9; BE [email protected]# CE511.5 me/100 g; 0.01 M CaCl2
0.64 @2.44# 24.3 49.7 26.0 2.7* San Anton soil; pH 6.7; BE [email protected]# CE526.1 me/100 g; 0.01 M CaCl2
0.79 @2.88# 73.4 19.4 7.2 1.4* Talante soil; pH 5.1; BE [email protected]# CE54.0 me/100 g; 0.01 M CaCl2
0.99 @2.92# 41.5 38.3 20.2 2.0* Toa soil; pH 5.3; BE [email protected]# CE513.0 me/100 g; 0.01 M CaCl2
0.32 @2.77# 60.9 25.1 14.0 0.6* Toa soil; pH 6.0; BE [email protected]# CE58.0 me/100 g; 0.01 M CaCl2
0.71 @2.40# 73.7 12.6 13.7 3.5* Vega Alta soil; pH 5.0; BE [email protected]! CE55.6 me/100 g; 0.01 M CaCl2
0.93 @2.80# 45.2 36.8 18.0 2.3* Via soil; pH 5.1; BE [email protected]# CE539.9 me/100 g; 0.01 M CaCl2
2.59 Soil; experimental~literature! 2172.59av 32 soils~literature! 872.40 Correlation logKoc– logS 564
Asulam ~pKaÄ4.82, Ref. 674!
2.37 @2.64# 94* OM from peaty muck~Histosol! 24 BE [email protected]# soil; pH 5.5
2.48 Soil; experimental~literature data! 2172.52 Correlation logKoc – MCI 5981.60 Correlation logKoc– logS 564
Atratone ~pKaÄ4.20, Ref. 247!
TA 100 H-montmorillonite~1–0.2mm!;pH 3.35; CE573.5 me/100 g
25 BE 250
2.64° 100 Na–montmorillonite~1–0.2mm!; 25 BE 250~0.48! pH–6.80; CE587.0 me/100 gTA 100 H–montmorillonite; pH 8.6 BE 2121.08 100 Na–montmorillonite; pH 7.9 BE 2121.15 100 Ca–montmorillonite; pH 7.9 BE 2121.00 100 Mg–montmorillonite; pH 8.2 BE 212
Atrazine ~pKaÄ1.68, Ref. 679!
TA 100 H–montmorillonite~1–0.2mm!;pH 3.35; CE573.5 me/100 g
25 BE 250
1.18° 100 Na–montmorillonite~1–0.2mm!; 25 BE 250~0.85! pH 6.80; CE587.0 me/100 gTA 100 H–montmorillonite; pH 3.6 BE 2120.78 100 Na–montmorillonite; pH 7.9 BE 2121.11 100 Ca–montmorillonite; pH 7.9 BE 2121.00 100 Mg–montmorillonite; pH 8.2 BE 2121.54 100 Mississippi bentonite; pH 8.5 0 BE 2510.83 Idem 50 2511.03°~0.92!
Bentonite; 0.1 M CaCl2 22 BE 144
1.56 @1.91# 77*@44.7#
Houghton muck; pH 5.6 0 BE 251
1.52 @1.87# Idem 50 [email protected]# @1.74# 63* Mesic peat~acid treated!; BE 477
@36.5# 0.01 M CaCl2
J. Phys. Chem. Ref. Data, Vol. 30, No. 1, 2001

323323SORPTION OF ORGANIC COMPOUNDS
TABLE 8. Sorption coefficients for pesticides—Continued
log Kd
log Kf0
(1/n) log Koc
Sorbent composition~%!Other sorbent and solution data;
prediction procedureTemp.~°C! Meth. Ref.Sand Silt Clay OC
20.96 @1.93# 97.1 2.3 0.6 0.13 Tampa aquifer; pH 8;0.01 N CaCl2
BE 521
0.46° 1.95 57.8 19.6 22.6 5.6* Vetroz soil; pH 6.7 20 BE 630~0.92! @3.25#0.30° 1.98 38.4 49.4 12.2 3.6* Evouettes soil; pH 6.1 20 BE 630~0.93! @2.09#20.07° 1.83 87.0 10.2 2.8 2.2* Collombey soil; pH 7.8 20 BE 630~0.89! @1.28#0.45° 73 21 2.6 Plano soil; pH 6.1; 23 BE 480~0.80! CE517 cmol/kg; 0.01 M CaCl2
0.63°~0.81!
Idem; pH 4.5 480
0.46° 59 22 2.8 Waukegan soil; pH 6.1; 23 BE 480~0.85! CE521 cmol/kg; 0.01 M CaCl2
0.70° Idem; pH 4.0 480~0.83!0.44° 60 23 2.64 Waukegan soil; pH 5.8; BE 158~0.83! CE523 cmol/kg0.63°~0.83!
30 27 2.77 Ves soil; pH 4.8; Ce520 cmol/kg BE 158
0.41 @1.80# 2.9 68.7 28.4 7.1* Lanton soil; pH 6.4; BE [email protected]# CE532.8 me/100 g
0.72 @2.28# 59 22 2.8 Waukegan soil; pH 4.1;CE521 cmol/kg; 0.01 M CaCl2
23 BE 323
0.46 @2.02# Idem; pH 6.2 3230.56 @2.14# 73 21 2.6 Plano soil; pH 4.7;
CE517 cmol/kg; 0.01 M CaCl2
23 BE 323
0.54 @2.13# Idem; pH 5.8 3230.38 @1.97# Idem; pH 6.3 3230.23 @2.19# 62 15 1.1 Walla Walla soil; pH 5.0;
CE520 cmol/kg; 0.01 M CaCl2
23 BE 323
0.08 @2.04# Idem; pH 5.5 3230.04 @2.00# Idem; pH 6.0 3230.60° 33 3.8* Sharpsburg soil; pH 5.2; 30 BE 241~0.83! @2.2# Water:soil~w/s!50.4:1;
0.01 M CaCl20.58°~0.83!
Idem; w/s55:1 241
@2.37#0.27° 28 2.9* Monona soil; pH 5.8; 30 BE 241~0.86! @1.7# w/s50.4:1; 0.01 M CaCl20.29°~0.84!
Idem; w/s55:1 241
@2.18#0.13° 13 2.9* Keith soil; pH 6.3; w/s50.4:1; 30 BE 241~0.84! @1.7# 0.01 M CaCl20.20°~0.79!
Idem; w/s55:1 241
@2.08#0.12° 6 1.4* Valentine soil; pH 5.9; 30 BE 241~0.81! @0.81# w/s50.4:1; 0.01 M CaCl20.14°~0.74!
Idem; w/s55:1 241
@2.10#0.87 @3.76# 0.22* Holdrege 1 soil; pH 5.6; BE 632
@0.13# conventional till~C.T.!; 0–2.5 cmdepth~d.!
BE
0.88 @3.77# Idem; pH 5.2; C.T.; 2.5–5 cm d. 6320.88 @3.82# 0.20*
@0.12#Idem; pH 5.7; C.T.; 5–10 cm d. 632
0.83 @3.76# 0.19*@0.11#
Idem; pH 6.2; C.T.; 10–15 cm d. 632
J. Phys. Chem. Ref. Data, Vol. 30, No. 1, 2001

324324 DELLE SITE
TABLE 8. Sorption coefficients for pesticides—Continued
log Kd
log Kf0
(1/n) log Koc
Sorbent composition~%!Other sorbent and solution data;
prediction procedureTemp.~°C! Meth. Ref.Sand Silt Clay OC
0.81 @3.80# 0.18*@0.10#
Idem; pH 6.3; C.T.; 15–20 cm d. 632
0.81 0.14*@0.08#
Idem; pH 6.6; C.T.; 20–25 cm d. 632
0.78 0.12*@0.07#
Idem; pH 6.7; C.T.; 25–30 cm d. 632
0.76 0.09*@0.05#
Idem; pH 6.9; C.T.; 30–35 cm d. 632
0.74 0.08*@0.05#
Idem; pH 7.0; C.T.; 35–40 cm d. 632
0.89 @3.61# 0.33* Idem; no till ~N.T.!; pH 5.2; [email protected]# 0–2.5 cm d.
0.85 @3.67# 0.26*@0.15#
Idem; N.T.; pH 5.0; 2.5–5 cm d. 632
0.85 @3.83# 0.18*@0.10#
Idem; N.T.; pH 5.8; 5–10 cm d. 632
0.86 @3.85# 0.18*@0.10#
Idem; N.T.; pH 6.2; 10–15 cm d. 632
0.85 @3.83# 0.18*@0.10#
Idem; N.T.; pH 6.3; 15–20 cm d. 632
0.79 0.14*@0.08#
Idem; N.T.; pH 6.5; 20–25 cm d. 632
0.79 0.12*@0.07#
Idem; N.T.; pH 6.7; 25–30 cm d. 632
0.79 0.11*@0.06#
Idem; N.T.; pH 6.8; 30–35 cm d. 632
0.76 0.10*@0.06#
Idem; N.T.; pH 6.9; 35–40 cm d. 632
0.30 @2.08# 30.1 55.2 14.7 1.64 Valois soil; pH 5.9;0.005 M CaSO4
23–27 BE 527
0.50 @2.00# 12.2 52.3 35.5 3.13 Rhinebeck soil; pH 6.7;0.005 M CaSO4
23–27 BE 527
0.68° 2.57 3.31 21.9 75.0 1.30 Eurosol-1; c; pH 5.1; BE 583~0.98! 0.01 M CaCl20.94 2.83 Idem; EEC laboratory ringtest 620.29° 1.72 3.4 64.1 22.6 3.70 Eurosol-2; sil; pH 7.4; BE 583~0.88! 0.01 M CaCl20.39 1.83 Idem; EEC laboratory ringtest 620.28° 1.75 46.4 36.8 17.0 3.45 Eurosol-3; l; pH 5.2; BE 583~0.99! 0.01 M CaCl20.45 1.91 Idem; EEC laboratory ringtest 6220.30° 1.51 4.1 75.7 20.3 1.55 Eurosol-4; si; pH 6.5; BE 583~1.05! 0.01 M CaCl220.07 1.74 Idem; EEC laboratory ringtest 621.36 81.6 12.6 6.0 9.25 Eurosol-5; ls; pH 3.2; BE 583~0.87! 0.01 M CaCl21.64 2.67 Idem; EEC laboratory ringtest 6220.91 1.69 1.7 82.4 16.0 0.25 Eurosol-6; EEC laboratory
ringtest; pH 7.2; 0.01 M CaCl2
BE 62
0.00° 18 3.3* Lakeland sl soil; pH 6.2; 26 BE 633~0.85! @1.91# CE52.9 me/100 g; 0.01 M CaCl2
0.26° 43 1.9* Wehadkee sil soil pH 5.6; 26 BE 633~0.84! @1.10# CE510.2 me/100 g; 0.01 M CaCl2
0.60° 38 4.4* Chillum sl soil; pH 4.6; 26 BE 633~0.87! @2.55# CE57.6 me/100 g; 0.01 M CaCl2
0.57° 48 4.3* Hagerstown sicl soil; pH 5.5; 26 BE 633~0.87! @2.49# CE512.5 me/100 g; 0.01 M CaCl2
0.23 @1.95# 3.31* Battrum sc soil; pH 5.6; 25 BE [email protected]# Al52031 ppm; Fe56868 ppm
0.28 @2.06# 2.85* Swift Current 1 soil; pH 6.0 25 BE [email protected]# Al51794 ppm; Fe55361 ppm
1.25° @2.17# 45.5 15.9 6.6 12 Great House E.H.F. soil; pH 6.3; 22 BE 144~0.93! CE518 me/100 g; 0.1 M CaCl2
J. Phys. Chem. Ref. Data, Vol. 30, No. 1, 2001

325325SORPTION OF ORGANIC COMPOUNDS
TABLE 8. Sorption coefficients for pesticides—Continued
log Kd
log Kf0
(1/n) log Koc
Sorbent composition~%!Other sorbent and solution data;
prediction procedureTemp.~°C! Meth. Ref.Sand Silt Clay OC
0.35° 66.0 18.4 15.6 1.93 Weed Res. Orgn. soil; pH 7.1; 22 BE 144~0.85! CE511 me/100 g; 0.1 M CaCl2
2.16° @2.52# 76* OM from peat soil; 0.1 M CaCl2 22 BE 144~0.90! @44#2.14 @2.50# 76*
@44#OM from peat soil; 0.1 M BaCl2 BE 270
1.91* Peat humic acid; 0.1 M BaCl2 BE 2700.62° 17 56 27 0.24 Brandt soil; pH 5.74; 25 BE 403~0.86! 0.01 M CaCl2 ; no incubation~N.I.!0.37° Idem; pH 7.81; 403~0.86! 1NH3 ~1.4 mg N/g soil!; N.I.0.25° Idem; pH 8.92; 403~0.88! 1NH3 ~2.8 mg N/g soil!; N.I.0.45° Idem; pH 5.69; 0.01 M CaCl2 ; 403~0.85! 8 d incubation~8 d I.!0.35° Idem; pH 7.70; 403~0.85! 1NH3 ~1.4 mg N/g soil!; 8 d I.0.32° Idem; pH 8.17; 403~0.86! 1NH3 ~2.8 mg N/g soil!; 8 d I.0.66° 43 27 27 0.22 Ves soil; pH 5.61; 0.01 M CaCl2; 25 BE 403~0.84! N.I.0.52° Idem; pH 7.60; 403~0.85! 1NH3 ~1.4 mg N/g soil!; N.I.0.28° Idem; pH 8.88; 403~0.88! 1NH3 ~2.8 mg N/g soil!; N.I.0.53° Idem; pH 5.39; 0.01 M CaCl2 ; 403~0.81! 8 d I.0.41° Idem; pH 7.10; 403~0.83! 1NH3 ~1.4 mg N/g soil!; 8 d I.0.29° Idem; pH 7.97; 403~0.85! 1NH3 ~2.8 mg N/g soil!; 8 d I.20.57° 67.1 25.8 7.1 0.43 Hanford soil; pH 6.05; 25 BE 528~0.79! CE55.95 cmol/kg; 0.01 M CaCl2
20.82° 82.0 13.5 4.5 0.33 Tuiunga soil; pH 6.30; 25 BE 528~0.83! CE50.45 cmol/kg; 0.01 M CaCl2
1.11 @2.55# 25 45 30 6.3* Drummer soil; CE540 me/100 g; 0.5 BE [email protected]# pH 3.9
1.10 @2.54# Idem 20 2861.02 @2.46# Idem 40 2861.06 @2.49# Idem; pH 4.7 0.5 2861.03 @2.47# Idem 20 2860.93 @2.37# Idem 40 2861.03 @2.47# Idem; pH 5.3 0.5 2860.91 @2.35# Idem 20 2860.84 @2.28# Idem 40 2860.83 @2.27# Idem; pH 6.0 0.5 2860.81 @2.25# Idem 20 2860.73 @2.17# Idem 40 2860.78 @2.21# Idem; pH 8.0 0.5 2860.80 @2.24# Idem 20 2860.66 @2.10# Idem 40 286
2.63* Humic acid from Leonardite;pH 2.5
0.5 BE 286
2.80* Idem; pH 2.5 20 2862.92* Idem; pH 2.5 40 2861.64* Idem; pH 7.0 0.5 2861.79* Idem; pH 7.0 20 2861.90* Idem; pH 7.0 40 286
0.55° @2.56# 3 36 61 1.7* Sharkey soil; Ap horizon; BE 483~0.90! @0.99# pH 6.48; 0.01 N Ca(NO3)2
1.98av 6– 3– 3– 0.8– 5 soils. 0.01 N CaCl2 25 BE 45594 66 35 3.9
J. Phys. Chem. Ref. Data, Vol. 30, No. 1, 2001

326326 DELLE SITE
TABLE 8. Sorption coefficients for pesticides—Continued
log Kd
log Kf0
(1/n) log Koc
Sorbent composition~%!Other sorbent and solution data;
prediction procedureTemp.~°C! Meth. Ref.Sand Silt Clay OC
1.95av 5 soils; extrapolated from lofKd- f c
plots ~methanol-water!25 BE 455
1.95av 5 soils; extrapolated from logKd- f c
plots ~acetone–water!25 BE 455
20.82 @1.88# 93.8 3.0 3.2 0.2 Eustis soil; pH 5.7; 0.01 N CaCl2 25 BE 4520.48– 2.07– 39.4– 36.6– 20.3– 2.58– Clarion soil; 6 aggregate sizes 21–23 BE 6340.56 2.12 43.1 38.7 21.9 2.97 from 0 to 5 mm; 0.01 M CaCl2
0.53av 2.10av 2.72av0.55– 2.16– 2.2– 72.6– 23.0– 2.31– Edina soil; 6 aggregate sizes 21–23 BE 6340.61 2.25 4.3 74.6 23.8 2.47 from 0 to 5 mm; 0.01 M CaCl2
0.59av 2.21av 2.42av0.38av 2.33av 10.5av 0.81av 109 soil horizons from 24 soil
profiles; CEav515.3 me/100 g;pH 5.8
22 BE 227
0.34 @1.96# 32.8 13.7 2.37 CVa, Merrimacf sl soil ~0–15 cm!;0.01 M CaCl2
21 BE 481
0.12 @1.90# 42.7 8.7 1.65 CVb, Merrimacf sl soil ~5–30 cm!;0.01 M CaCl2
21 BE 481
0.24 @2.09# 21.5 15.9 1.43 W3, Merrimac sl soil~0–15 cm!;0.01 M CaCl2
21 BE 481
0.037° @2.33# 2 3 0.5 Zimmerman fine sand~0–15 cm!; BE 635~0.95! pH 5.8; 0.01 M CaCl220.01° @2.39# 4 3 0.4 Idem~35–50 cm!; pH 4.4; BE 635~0.93! 0.01 M CaCl220.43° @2.58# 1 1 0.1 Idem~175–190 cm!; pH 6.1; BE 635~1.02! 0.01 M CaCl220.68° @1.92# 77 18 5 0.44* Mohave soil; pH 6.5; 25 BE 127~1.00! @0.26# CE55.1 me/100 g; 0.01 M CaCl2
0.42° 16 68 16 2.58* Walla Walla soil; pH 6.8; 25 BE 127~0.85! @1.50# CE520 me/100 g; 0.01 M CaCl2
20.22 @1.78# 1.7* Simeon sl soil; BE [email protected]# ~0–60 cm depth!
20.34 @2.43# 0.3* Simeon ls soil; BE [email protected]# ~60–90 cm depth!
20.35 0.1* Simeon s soil; BE [email protected]# ~90–180 cm depth!
0.19° @2.06# 40 21 1.35 Rambouillet soil~0–20 cm!; pH 6.0; 25 BE 637~0.88! CE511.4 cmol/kg; 0.01 M CaCl2
20.19° 26 63 11 0.63 Taloka soil; pH 5.6; 22 BE 234~0.87! 0.01 M CaCl20.49° 38 50 12 2.41 Mountainburg soil; pH 5.5; 22 BE 234~0.87! 0.01 M CaCl20.78° 18.4 45.3 38.3 3.87 Webster soil; CE554.7 me/100 g; 23 BE 102~0.73! pH 7.3; 0.01 N CaCl2
20.05° 2.00 65.8 19.5 14.7 0.90 Cecil soil; CE56.8 me/100 g; 23 BE 102~1.04! pH 5.6; 0.01 N CaCl2
20.21° 93.8 3.0 3.2 0.56 Eustis soil; CE55.2 me/100 g; 23 BE 102~0.79! pH 5.6; 0.01 N CaCl2
0.32° @2.04# 66.0 18.4 15.6 1.93 Begbroke soil; pH 7.1; 22 BE 462~;0.9! 1:10 soil:water0.00 @1.71# Idem 22 BE 63820.10° @1.62# Begbroke soil; pH 7.1; 22 BE 462~;0.9! 4:1 soil:water0.09° 3.6 64.7 31.7 1.11 Agricultural soil; pH 8.2; 20 BE 347~0.84! 1.9% CaCO30.08° 29.2 19.5 51.3 1.50 Agricultural soil; pH 8.0; 20 BE 347~0.86! 26.4% CaCO320.02° 24.5 13.0 62.5 1.08 Agricultural soil; pH 8.0; 20 BE 347~0.82! 3.2% CaCO30.28 @2.24# 6 74 20 1.9* Putnam soil; pH 5.3; 20 BE 145
@1.1# CE512.3 me/100 g; 0.01 M CaCl2
0.65 @2.27# 4 66 30 4.2* Marshall soil; pH 5.4; 20 BE [email protected]# CE521.3 me/100 g; 0.01 M CaCl2
J. Phys. Chem. Ref. Data, Vol. 30, No. 1, 2001
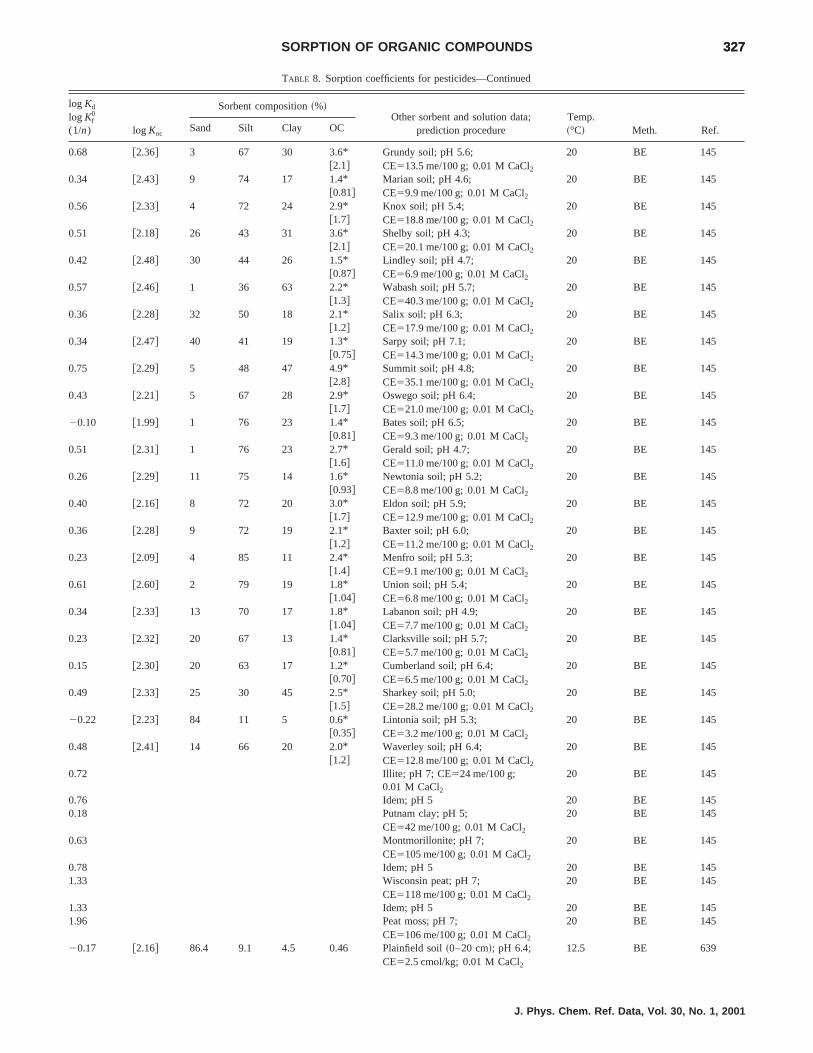
327327SORPTION OF ORGANIC COMPOUNDS
TABLE 8. Sorption coefficients for pesticides—Continued
log Kd
log Kf0
(1/n) log Koc
Sorbent composition~%!Other sorbent and solution data;
prediction procedureTemp.~°C! Meth. Ref.Sand Silt Clay OC
0.68 @2.36# 3 67 30 3.6* Grundy soil; pH 5.6; 20 BE [email protected]# CE513.5 me/100 g; 0.01 M CaCl2
0.34 @2.43# 9 74 17 1.4* Marian soil; pH 4.6; 20 BE [email protected]# CE59.9 me/100 g; 0.01 M CaCl2
0.56 @2.33# 4 72 24 2.9* Knox soil; pH 5.4; 20 BE [email protected]# CE518.8 me/100 g; 0.01 M CaCl2
0.51 @2.18# 26 43 31 3.6* Shelby soil; pH 4.3; 20 BE [email protected]# CE520.1 me/100 g; 0.01 M CaCl2
0.42 @2.48# 30 44 26 1.5* Lindley soil; pH 4.7; 20 BE [email protected]# CE56.9 me/100 g; 0.01 M CaCl2
0.57 @2.46# 1 36 63 2.2* Wabash soil; pH 5.7; 20 BE [email protected]# CE540.3 me/100 g; 0.01 M CaCl2
0.36 @2.28# 32 50 18 2.1* Salix soil; pH 6.3; 20 BE [email protected]# CE517.9 me/100 g; 0.01 M CaCl2
0.34 @2.47# 40 41 19 1.3* Sarpy soil; pH 7.1; 20 BE [email protected]# CE514.3 me/100 g; 0.01 M CaCl2
0.75 @2.29# 5 48 47 4.9* Summit soil; pH 4.8; 20 BE [email protected]# CE535.1 me/100 g; 0.01 M CaCl2
0.43 @2.21# 5 67 28 2.9* Oswego soil; pH 6.4; 20 BE [email protected]# CE521.0 me/100 g; 0.01 M CaCl2
20.10 @1.99# 1 76 23 1.4* Bates soil; pH 6.5; 20 BE [email protected]# CE59.3 me/100 g; 0.01 M CaCl2
0.51 @2.31# 1 76 23 2.7* Gerald soil; pH 4.7; 20 BE [email protected]# CE511.0 me/100 g; 0.01 M CaCl2
0.26 @2.29# 11 75 14 1.6* Newtonia soil; pH 5.2; 20 BE [email protected]# CE58.8 me/100 g; 0.01 M CaCl2
0.40 @2.16# 8 72 20 3.0* Eldon soil; pH 5.9; 20 BE [email protected]# CE512.9 me/100 g; 0.01 M CaCl2
0.36 @2.28# 9 72 19 2.1* Baxter soil; pH 6.0; 20 BE [email protected]# CE511.2 me/100 g; 0.01 M CaCl2
0.23 @2.09# 4 85 11 2.4* Menfro soil; pH 5.3; 20 BE [email protected]# CE59.1 me/100 g; 0.01 M CaCl2
0.61 @2.60# 2 79 19 1.8* Union soil; pH 5.4; 20 BE [email protected]# CE56.8 me/100 g; 0.01 M CaCl2
0.34 @2.33# 13 70 17 1.8* Labanon soil; pH 4.9; 20 BE [email protected]# CE57.7 me/100 g; 0.01 M CaCl2
0.23 @2.32# 20 67 13 1.4* Clarksville soil; pH 5.7; 20 BE [email protected]# CE55.7 me/100 g; 0.01 M CaCl2
0.15 @2.30# 20 63 17 1.2* Cumberland soil; pH 6.4; 20 BE [email protected]# CE56.5 me/100 g; 0.01 M CaCl2
0.49 @2.33# 25 30 45 2.5* Sharkey soil; pH 5.0; 20 BE [email protected]# CE528.2 me/100 g; 0.01 M CaCl2
20.22 @2.23# 84 11 5 0.6* Lintonia soil; pH 5.3; 20 BE [email protected]# CE53.2 me/100 g; 0.01 M CaCl2
0.48 @2.41# 14 66 20 2.0* Waverley soil; pH 6.4; 20 BE [email protected]# CE512.8 me/100 g; 0.01 M CaCl2
0.72 Illite; pH 7; CE524 me/100 g;0.01 M CaCl2
20 BE 145
0.76 Idem; pH 5 20 BE 1450.18 Putnam clay; pH 5;
CE542 me/100 g; 0.01 M CaCl2
20 BE 145
0.63 Montmorillonite; pH 7;CE5105 me/100 g; 0.01 M CaCl2
20 BE 145
0.78 Idem; pH 5 20 BE 1451.33 Wisconsin peat; pH 7;
CE5118 me/100 g; 0.01 M CaCl2
20 BE 145
1.33 Idem; pH 5 20 BE 1451.96 Peat moss; pH 7;
CE5106 me/100 g; 0.01 M CaCl2
20 BE 145
20.17 @2.16# 86.4 9.1 4.5 0.46 Plainfield soil~0–20 cm!; pH 6.4;CE52.5 cmol/kg; 0.01 M CaCl2
12.5 BE 639
J. Phys. Chem. Ref. Data, Vol. 30, No. 1, 2001

328328 DELLE SITE
TABLE 8. Sorption coefficients for pesticides—Continued
log Kd
log Kf0
(1/n) log Koc
Sorbent composition~%!Other sorbent and solution data;
prediction procedureTemp.~°C! Meth. Ref.Sand Silt Clay OC
20.42 @2.01# 95.0 3.2 1.8 0.37 Sparta soil~0–20 cm!; pH 5.5;CE52.0 cmol/kg; 0.01 M CaCl2
12.5 BE 639
21.10 94.7 3.2 2.2 0.07 Plainfield~50–80 cm!; pH 6.0;CE51.0 cmol/kg; 0.01 M CaCl2
12.5 BE 639
21.05 @1.78# 95.7 2.0 2.3 0.15 Sparta soil~50–80 cm!; pH 5.8;CE51.0 cmol/kg; 0.01 M CaCl2
12.5 BE 639
20.17° 66.4 15.5 18.1 0.77* Eutric Cambisol~Ah hor.!; pH 7.5; 20 BE 350~0.81! @0.45# CE59.4 me/100 g0.53 1.92 12.3 31.4 56.3 4.30 Brimstone soil~Ap hor.; ,2 mm!;
pH 6.120–24 BE 298
0.53 1.93 4.2 Idem~,250 mm! 2980.72 2.42 1.9 Idem; oxidized by H2O2 29820.24 2.17 95.7 2.7 1.6 0.39 Sparta agricolt soil~Ap horizon!;
pH 6.4; 0.01 M CaCl2
BE 292
20.22 2.03 96.2 2.2 1.6 0.56 Idem~A horizon!; pH 6.0 29220.46 2.01 96.2 2.3 1.5 0.34 Idem~AB horizon!; pH 5.4 29220.52 2.05 96.5 2.5 1.0 0.27 Idem~Bw1 horizon!; pH 5.5 29220.92 1.90 96.9 2.0 1.2 0.15 Idem~Bw2 horizon!; pH 5.3 29221.00– 99.0– 0.1– 0.2– 0.01– Idem~Bw3, BC, C horizons!; 29221.60 99.7 0.4 0.6 0.08 pH 5.6–5.8
2.00av 0.40– Idem~six surface samples!; 2920.86 pH 5.0–6.6
0.01 2.22 87.7 8.2 4.1 0.62 Plainfield forest soil~Ap horizon!;pH 6.4; 0.01 M CaCl2
BE 292
20.74 2.18 86.8 8.3 4.9 0.12 Idem~Bw1 horizon!; pH 5.6 29220.80 2.20 90.8 5.4 3.7 0.10 Idem~Bw2 horizon!; pH 5.4 29220.51– 88.9– 0.3– 0.5– 0.01– Idem~seven horizons, from 29221.15 99.2 5.4 5.8 0.07 Bw3 to C2!; pH 6.2–4.6
2.49av 0.40– Idem~five surface samples!; 2920.70 pH 6.0–6.6
20.05 2.14 91.7 4.4 3.9 0.65 Tarr agricolt. soil~Ap horizon!;pH 6.0; 0.01 M CaCl2
BE 292
20.33 1.96 89.7 5.3 5.0 0.51 Idem~A horizon!; pH 6.3 29220.43 1.94 91.4 4.6 4.0 0.42 Idem~AB horizon!; pH 6.1 29220.48 2.09 92.4 3.7 4.0 0.27 Idem~Bw1 horizon!; pH 5.7 29220.89– 97.7– 0.4– 0.7– 0.05– Idem~Bw2, BC, C horizons!; 2920.57 98.9 1.0 1.4 0.08 pH 5.7–5.60.67 2.41 89.8 5.7 4.5 1.83 Shawano forest soil~A horizon!;
pH 6.2; 0.01 M CaCl2
BE 292
20.39 2.12 90.3 5.2 4.6 0.31 Idem~Bw1 horizon!; pH 5.5 29220.55 2.10 91.7 4.6 3.7 0.22 Idem~Bw2 horizon!; pH 5.8 29220.70 2.26 97.0 2.9 0.1 0.11 Idem~Bw3 horizon!; pH 5.6 29220.74– 72.3– 1.0– 0.4– 0.03– Idem~E, Bw8, C1, C2 horizons!; 29221.05 98.6 24.6 3.1 0.07 pH 5.6–5.820.36 2.15 87.0 11.3 1.7 0.31 Rousseau forest soil~E horizon!;
pH 4.8; 0.01 M CaCl2
BE 292
20.57 1.86 82.0 6.4 11.6 0.37 Idem~Bt horizon!; pH 5.6 29221.22 1.60 93.7 3.6 2.7 0.15 Idem~Bs1 horizon!; pH 5.9 29221.22– 72.7– 2.1– 0.5– 0.04– Idem~Bs2, BC, C horizons!; 29220.89 97.4 26.4 0.9 0.08 pH 5.7–6.40.18 2.27 26 0.8 Agricultural soil; pH 7.4;
CE531 cmol/kg; 0.01 M CaCl2
20 BE 297
0.49 2.42 54 1.2 Idem; pH 7.8; CE524 cmol/kg 2970.20 2.59 11 0.4 Idem; pH 8.0; CE511 cmol/kg 2971.04 2.16 6 7.6 Idem; pH 4.4: CE527 cmol/kg 29720.70 2.05 88.0 4.0 8.0 0.18 Soil; s~Embarras River, ILL!
~172–183 cm!; pH 7.53;SA(N2)511.5 m2/g
25 BE 479
20.50 2.42 89.0 6.0 5.0 0.12 Idem; s~191–204 cm!; pH 7.10;SA(N2)511.6 m2/g
479
20.14 2.72 87.0 11.0 2.0 0.14 Idem; s~204–248 cm!; pH 7.20;SA(N2)510.3 m2/g
479
J. Phys. Chem. Ref. Data, Vol. 30, No. 1, 2001

329329SORPTION OF ORGANIC COMPOUNDS
TABLE 8. Sorption coefficients for pesticides—Continued
log Kd
log Kf0
(1/n) log Koc
Sorbent composition~%!Other sorbent and solution data;
prediction procedureTemp.~°C! Meth. Ref.Sand Silt Clay OC
0.41 2.91 31.0 52.0 17.0 0.32 Idem; till~350–364 cm!; pH 8.15;SA(N2)517.3 m2/g
479
0.23 3.23 88.0 6.0 6.0 0.10 Idem; s~78–117 cm!; pH 5.58;SA(N2)513.0 m2/g
479
0.45 2.93 33.0 56.0 11.0 0.33 Idem; till~409–427 cm!; pH 7.65;SA(N2)517.8 m2/g
479
20.05 2.95 85.0 8.0 7.0 0.10 Idem; s~102–156 cm!; pH 6.05;SA(N2)513.0 m2/g
479
20.46 2.59 88.0 4.0 8.0 0.09 Idem; s~156–208 cm!; pH 6.91;SA(N2)58.1 m2/g
479
20.69 2.35 93.0 6.0 1.0 0.09 Idem; alluvium~0–6 cm!; pH 7.61;SA(N2)52.0 m2/g
479
20.73 2.09 92.0 7.0 1.0 0.15 Idem; alluvium~0–6 cm!; pH 7.61;SA(N2)52.6 m2/g
479
0.85 2.33 3.27 Hickory Hill coarse si sediment;fraction ~20–50mm!
25 BE 129
0.66 2.62 27.4 72.1 1.1 Bear Creek 5290 sedim.; pH 5.7 25 BE 4781.32 2.73 21.5 77.2 3.9 Bear Creek 5356 sedim.; pH 4.4 25 BE 4780.53 2.42 37.6 59.7 1.3 Lake Chicot 5636 sedim.; pH 6.3 25 BE 4780.36 2.62 48.1 30.9 0.55 Lake Chicot 5643 sedim.; pH 7.3 25 BE 47820.22 1.63 14.2 85.3 1.4 Lake Chicot 5700 sedim.; pH 6.2 25 BE 4781.40 3.28 18.6 80.9 1.3 Wolf Lake 6262 sedim.; pH 4.5 25 BE 4780.64 2.81 54.4 25.6 0.69 Wolf Lake 6268 sedim.; pH 7.7 25 BE 4780.88 2.73 45.0 49.6 1.4 Wolf Lake 6272 sedim.; pH 5.7 25 BE 4780.83 2.92 47.8 51.8 0.81 McWilliams Pond 1 sedim.; pH 5.8 25 BE 4780.51 2.67 67.3 30.8 0.69 McWilliams Pond 2 sedim.; pH 6.8 25 BE 4780.96 2.50 42.6 57.2 2.9 Beaver Pond sedim.; pH 5.2 25 BE 4780.08 2.37 88.6 9.9 0.51 Lake Washington sedim.; pH 7.7 25 BE 478
4.13 Choptank River colloidal fraction;TOC598.6 mg/L; salinity51.24‰
20 BE 406
3.69 Idem; TOC5108.5 mg/L;salinity59.92‰
406
3.84 Idem; TOC5104.6 mg/L;salinity514.2‰
406
3.93 Idem; TOC565.5 mg/L;salinity51.50‰
406
3.90 Idem; TOC574.2 mg/L;salinity55.71‰
406
3.68 Idem; TOC559.3 mg/L;salinity517.0‰
406
3.23 Patuxent River colloidal fraction;TOC533.5 mg/L; salinity519.1‰
20 BE 406
3.27 Idem; TOC544.0 mg/L;salinity514.6‰
406
1.09° Ca-Wyoming smectite; pH 7.9; 20 BE 640~0.92! SA(N2)523 m2/g; 0.01 M CaCl23.39° Fe-Wyoming smectite; pH 2.9; 20 BE 640~0.78! SA(N2)536 m2/g; 0.01 M CaCl22.07° @2.36# 50.16 Soil humic acid; pH 2.9; 20 BE 640~0.92! 0.01 M CaCl22.29° @2.60# 49.83 Fluka humic acid; pH 4.6; 20 BE 640~0.86! 0.01 M CaCl2
2.91* Humic acid from Alberta blackChernozem soil~Ah hor.!; pH 6.5
25 HT 548
1.92 Cyanopropyl column 20–25 RPLC 5791.89 Idem; ring test RPLC 5812.28 Soil; experimental~literature! 2172.17av 56 soils~literature! 872.19av 217 literature data 5621.94,2.42
Correlation logKoc– logKow 96
3.28 Correlation logKoc– logKow(87) 5283.20 Correlation logKoc– logKow(217) 528
J. Phys. Chem. Ref. Data, Vol. 30, No. 1, 2001

330330 DELLE SITE
TABLE 8. Sorption coefficients for pesticides—Continued
log Kd
log Kf0
(1/n) log Koc
Sorbent composition~%!Other sorbent and solution data;
prediction procedureTemp.~°C! Meth. Ref.Sand Silt Clay OC
3.18 Correlation logKoc– logS(180) 5283.11 Correlation logKoc– logS 962.31 Correlation logKoc– logS(mp) 962.81 Correlation logKoc– logS 5642.34 Correlation logKoc– MCI 578
Benefin
@2.51# @4.14# 6 71 23 4.0* Plano soil (soil/solut.51 g/100 mL) 25 BE [email protected]# pH 6.3; CE520 me/100 g;
@2.36# @4.00# 6 71 23 4.0*@2.32#
Idem (soil/solut.52 g/100 mL) 25 BE 351
@2.31# @3.94# 6 71 23 4.0*@2.32#
Idem (soil/solut.54 g/100 mL) 25 BE 351
@2.53# @4.16# 6 71 23 4.0*@2.32#
Idem (soil/solut.52 g/100 mL) 5 BE 351
1.44 @2.87# 17 64 19 6.5* Adolph soil; pH 6.2; 22 BE [email protected]# CE522.5 me/100 g
0.82 @2.71# 9 78 13 2.2* Fayette soil; pH 6.5; 22 BE [email protected]# CE57.7 me/100 g
1.04 @2.98# 23 42 35 2.0* Kewaunee soil; pH 7.8; 22 BE [email protected]# CE519.2 me/100 g
1.30 @2.97# 12 61 27 3.7* Ontonagon soil; pH 6.6; 22 BE [email protected]# CE513.8 me/100 g
1.08 @3.01# 27 12 61 2.0* Peebles soil; pH 7.4; 22 BE [email protected]# CE523.4 me/100 g
0.62 @2.96# 89 6 5 0.8* Plainfield soil; pH 6.6; 22 BE [email protected]# CE53.7 me/100 g
1.06 @2.62# 17 66 17 4.8* Plano soil; pH 6.7; 22 BE [email protected]# CE517.4 me/100 g
1.46 @2.72# 23 62 15 9.5* Poigan soil; pH 7.0; 22 BE [email protected]# CE533.6 me/100 g;
1.48 @2.65# 59 30 11 11.7* Sebewa soil; pH 6.8; 22 BE [email protected]# CE528.4 me/100 g
1.18 @2.80# 17 73 10 4.1* Withee soil; pH 6.5; 22 BE [email protected]# CE510.9 me/100 g
1.80 @3.18# 2.9 68.7 28.4 7.1* Lanton soil; pH 6.4; BE [email protected]# CE532.8 me/100 g
4.03 Soil; experimental~literature! 217
Bromacil ~pKaÄ9.3, Ref. 312!
0.68° Silica gel~0.59–0.07 mm!~Grace 25 BE 99~0.8! Div. Chem., Baltimore, Md.!;
pH 4.61.03°~0.8!
Idem 0 BE 99
0.42° 100 Illite No. 35~0.83 mm!~Fithian, 25 BE 99~0.9! Ill. !; pH 7.00.48°~0.9!
Idem 0 99
20.14° 100 Montmorillonite No. 25~0.83 mm! 25 BE 99~1.3! ~J.C. Lane Track, Upton, Wyo.!
pH 6–720.03°~1.3!
Idem 0 99
0.18° 2.1* Keyport sil soil; pH 5.4; BE 641~0.85! @1.22# aver. particle size55.6mm21.10° 0.7* Cecil ls soil; pH 5.8; BE 641~0.58! @0.41# aver. particle size510.5mm1.29° 1.82 29.9 Hula-1 soil; peat; pH 6.3; 28 BE 312~0.93! SA(E)5132 m2/g;
CE595 cmol/kg0.70° 1.81 7.85 Hula-2 soil; peat; pH 6.9; 28 BE 312
J. Phys. Chem. Ref. Data, Vol. 30, No. 1, 2001
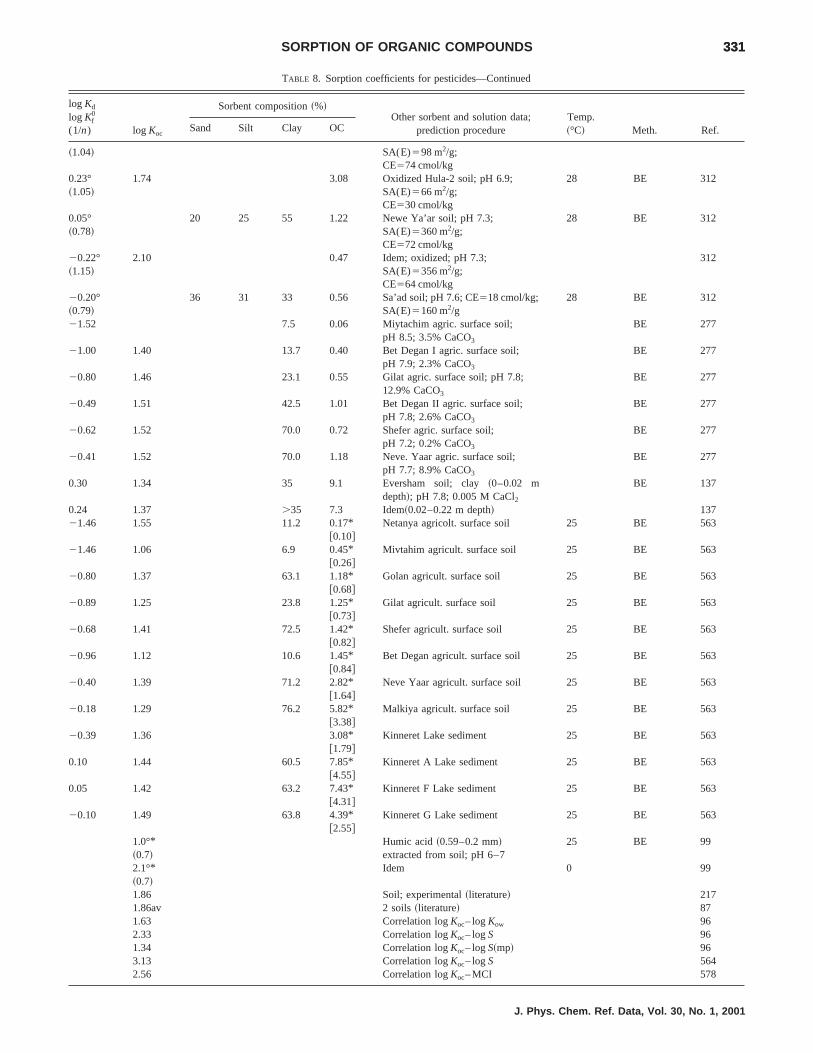
331331SORPTION OF ORGANIC COMPOUNDS
TABLE 8. Sorption coefficients for pesticides—Continued
log Kd
log Kf0
(1/n) log Koc
Sorbent composition~%!Other sorbent and solution data;
prediction procedureTemp.~°C! Meth. Ref.Sand Silt Clay OC
~1.04! SA(E)598 m2/g;CE574 cmol/kg
0.23° 1.74 3.08 Oxidized Hula-2 soil; pH 6.9; 28 BE 312~1.05! SA(E)566 m2/g;
CE530 cmol/kg0.05° 20 25 55 1.22 Newe Ya’ar soil; pH 7.3; 28 BE 312~0.78! SA(E)5360 m2/g;
CE572 cmol/kg20.22° 2.10 0.47 Idem; oxidized; pH 7.3; 312~1.15! SA(E)5356 m2/g;
CE564 cmol/kg20.20° 36 31 33 0.56 Sa’ad soil; pH 7.6; CE518 cmol/kg; 28 BE 312~0.79! SA(E)5160 m2/g21.52 7.5 0.06 Miytachim agric. surface soil;
pH 8.5; 3.5% CaCO3
BE 277
21.00 1.40 13.7 0.40 Bet Degan I agric. surface soil;pH 7.9; 2.3% CaCO3
BE 277
20.80 1.46 23.1 0.55 Gilat agric. surface soil; pH 7.8;12.9% CaCO3
BE 277
20.49 1.51 42.5 1.01 Bet Degan II agric. surface soil;pH 7.8; 2.6% CaCO3
BE 277
20.62 1.52 70.0 0.72 Shefer agric. surface soil;pH 7.2; 0.2% CaCO3
BE 277
20.41 1.52 70.0 1.18 Neve. Yaar agric. surface soil;pH 7.7; 8.9% CaCO3
BE 277
0.30 1.34 35 9.1 Eversham soil; clay~0–0.02 mdepth!; pH 7.8; 0.005 M CaCl2
BE 137
0.24 1.37 .35 7.3 Idem~0.02–0.22 m depth! 13721.46 1.55 11.2 0.17*
@0.10#Netanya agricolt. surface soil 25 BE 563
21.46 1.06 6.9 0.45*@0.26#
Mivtahim agricult. surface soil 25 BE 563
20.80 1.37 63.1 1.18*@0.68#
Golan agricult. surface soil 25 BE 563
20.89 1.25 23.8 1.25*@0.73#
Gilat agricult. surface soil 25 BE 563
20.68 1.41 72.5 1.42*@0.82#
Shefer agricult. surface soil 25 BE 563
20.96 1.12 10.6 1.45*@0.84#
Bet Degan agricult. surface soil 25 BE 563
20.40 1.39 71.2 2.82*@1.64#
Neve Yaar agricult. surface soil 25 BE 563
20.18 1.29 76.2 5.82*@3.38#
Malkiya agricult. surface soil 25 BE 563
20.39 1.36 3.08*@1.79#
Kinneret Lake sediment 25 BE 563
0.10 1.44 60.5 7.85*@4.55#
Kinneret A Lake sediment 25 BE 563
0.05 1.42 63.2 7.43*@4.31#
Kinneret F Lake sediment 25 BE 563
20.10 1.49 63.8 4.39*@2.55#
Kinneret G Lake sediment 25 BE 563
1.0°*~0.7!
Humic acid~0.59–0.2 mm!extracted from soil; pH 6–7
25 BE 99
2.1°*~0.7!
Idem 0 99
1.86 Soil; experimental~literature! 2171.86av 2 soils~literature! 871.63 Correlation logKoc– logKow 962.33 Correlation logKoc– logS 961.34 Correlation logKoc– logS~mp! 963.13 Correlation logKoc– logS 5642.56 Correlation logKoc– MCI 578
J. Phys. Chem. Ref. Data, Vol. 30, No. 1, 2001

332332 DELLE SITE
TABLE 8. Sorption coefficients for pesticides—Continued
log Kd
log Kf0
(1/n) log Koc
Sorbent composition~%!Other sorbent and solution data;
prediction procedureTemp.~°C! Meth. Ref.Sand Silt Clay OC
Butralin
2.70 100 Ca–montmorillonite; pH 6 24 BE 1213.48 @3.74# 94* OM from peaty muck~Histosol! 24 BE 121
@54.5# soil; pH 5.53.91 Soil; experimental~literature! 2173.64 Correlation logKoc– logS 564
Carbaryl
@2.11#av 1.4*- 5 soils od different composition; 25 BE 59072* pH 5.2–7.8
@0.33# @2.02# 3.53* Batcombe sil soil; pH 6.1; 20 BE [email protected]# 0.01 M CaCl2
@0.39# @1.97# 4.54* Warwick, Qld, soil; pH 6.3; BE [email protected]# 0.01 M CaCl2
@0.31# @1.94# 4.07* Rutherglen, Vic., soil; pH 4.8; BE [email protected]# 0.01 M CaCl2
@0.10# @2.07# 1.86* Wagga, N.S.W., soil; pH 5.1; BE [email protected]# 0.01 M CaCl2
@0.30# @2.09# 2.81* Turretfield, S.A., soil; pH 5.2; BE [email protected]# 0.01 M CaCl2
@0.15# @2.35# 1.09* Warracknabeal, Vic., soil; pH 8.0; BE [email protected]# 0.01 M CaCl2
@0.24# @1.97# 3.20* Warracknabeal, Vic., soil; pH 8.4; BE [email protected]# 0.01 M CaCl2
20.10 @1.88# 1.77* Cecil soil; pH 6.3; BE [email protected]# SA~W!515 m2/g
2.24° @2.60# 52 34 14 75.3* Soil; organic; pH 6.1 BE 264~0.97! @43.7#0.90° @2.69# 71 22 7 2.8* Big Creek sediment; pH 6.6 BE 264~0.96! @1.62#0.60° @2.44# 56 30 14 2.5* Beverly soil; pH 6.8 BE 264~0.98! @1.45#0.00° @2.39# 91.5 1.5 7 0.7* Plainfield soil; pH 7.0 BE 264~1.08! @0.41#
2.49av 38 48 14 0.68 Commerce soil; pH 6.7 BE 575~three 56 30 14 1.12 Tracy soil; pH 6.2 BE 575soils! 12 56 32 2.01 Catlin soil; pH 6.2 BE 5752.36 Soil; experimental~literature! 2172.30 Cyanopropyl column 20–25 RPLC 5792.57 C18 column RPLC 5732.42 Correlation logKoc– logKow 963.04 Correlation logKoc– logS 962.50 Correlation logKoc– logS~mp! 962.76 Correlation logKoc– logS 5642.23 Correlation logKoc– MCI 578
Carbofuran
20.60 @1.80# 0.4 Plainfield-Bloomfield s soil;CE51.7 me/100 g; 0.01 M CaCl2
25 BE 265
20.13 @1.79# 1.2 Gilford-Hoopeston-Ade sl soil; 25 BE 265CE57.5 me/100 g; 0.01 M CaCl2
0.15 @1.72# 2.7 Bryce-Swygert sic soil; 25 BE 265CE534.4 me/100 g; 0.01 M CaCl2
0.05 @1.56# 3.1 Drummer sicl soil; 25 BE 265CE524.8 me/100 g; 0.01 M CaCl2
0.14 @1.60# 3.5 Flanagan sil soil; 25 BE 265CE527.7 me/100 g; 0.01 M CaCl2
0.35 @1.47# 7.5 Bryce sicl soil; 25 BE 265CE555.5 me/100 g; 0.01 M CaCl2
0.94 @1.72# 16.8 Houghton soil; muck; 25 BE 265CE572.4 me/100 g; 0.01 M CaCl2
1.48° 15 63.5 21.5 79.5* Peat; pH 3.8; CE564.3 me/100 g 20 BE 266
J. Phys. Chem. Ref. Data, Vol. 30, No. 1, 2001

333333SORPTION OF ORGANIC COMPOUNDS
TABLE 8. Sorption coefficients for pesticides—Continued
log Kd
log Kf0
(1/n) log Koc
Sorbent composition~%!Other sorbent and solution data;
prediction procedureTemp.~°C! Meth. Ref.Sand Silt Clay OC
~0.85! 46.20.54° @1.50# 56.9 23.5 19.6 19.0* Soil; 1; pH 6.8; 20 BE 266~0.91! 11.04 CE533.3 me/100 g0.22° @1.60# 30.5 52.6 16.9 7.18* Soil; 1; pH 6.5; 20 BE 266~0.99! 4.18 CE516.7 me/100 g20.14° @1.54# 10.8 31.2 58.0 3.57* Soil ~Limagne!; pH 8.0; 20 BE 266~1.03! 2.08 CE531.8 me/100 g20.21° @1.57# 2.0 14.9 8.7 2.82* Soil ~Chalons!; pH 8.1; 20 BE 266~0.97! 1.64 CE57.9 me/100 g; 74.4% CaCO320.58° @1.36# 15.2 63.8 20.5 1.94* Soil ~Versailles!; pH 6.4; 20 BE 266~0.88! 1.13 CE510 me/100 g; 0.5% CaCO320.48° @1.34# 46.6 45.7 7.7 2.58* du Val pond sediment; pH 7.7; 20 BE 266~1.06! 1.50 CE55.6 me/100 g20.52° @1.21# 21.8 64.1 14.1 3.16* St-Quentin pond sediment; pH 7.1; 20 BE 266~0.90! 1.84 CE59.7 me/100 g20.80° 93.4 2.0 4.6 0.03* Fontainebleau sand; pH 5.0; 20 BE 266~0.59! 0.02 CE51.4 me/100 g
@1.38#av 1.4*- 5 soils od different composition; 25 BE 59072* pH 5.2–7.8
1.43° @1.79# 52 34 14 75.3* Soil; organic; pH 6.1 BE 264~1.08! @43.7#0.30° @2.09# 71 22 7 2.8* Big Creek sediment; pH 6.6 BE 264~0.98! @1.62#0.20° @2.04# 56 30 14 2.5* Beverly soil; pH 6.8 BE 264~1.07! @1.45#21.0° @1.39# 91.5 1.5 7 0.7* Plainfield soil; pH 7.0 BE 264~0.88! @0.41#
2.02av 38 48 14 0.68 Commerce soil; pH 6.7 BE 575~three 56 30 14 1.12 Tracy soil; pH 6.2 BE 575soils! 12 56 32 2.01 Catlin soil; pH 6.2 BE 5751.47av 5 soils~literature! 871.63av 52 literature data 5622.11 C18 column RPLC 5731.68 Correlation logKoc– logKow 962.46 Correlation logKoc– logS 961.51 Correlation logKoc– logS~mp! 962.20 Correlation logKoc– logS 564
Chlorbromuron
@0.93# @2.51# 4.54* Warwick, Qld, soil; pH 6.3; BE [email protected]# 0.01 M CaCl2
@0.96# @2.59# 4.07* Rutherglen, Vic., soil; pH 4.8; BE [email protected]# 0.01 M CaCl2
@0.60# @2.57# 1.86* Wagga, N.S.W., soil; pH 5.1; BE [email protected]# 0.01 M CaCl2
@0.65# @2.44# 2.81* Turretfield, S.A., soil; pH 5.2; BE [email protected]# 0.01 M CaCl2
@0.51# @2.71# 1.09* Warracknabeal, Vic., soil; pH 8.0; BE [email protected]# 0.01 M CaCl2
@0.77# @2.50# 3.20* Warracknabeal, Vic., soil; pH 8.4; BE [email protected]# 0.01 M CaCl2
@0.77# @2.19# 6.62* Balkuling soil; pH 5.6; BE [email protected]# 0.01 M CaCl2
@0.75# @2.66# 2.14* Kojonup soil; pH 5.5; BE [email protected]# 0.01 M CaCl2
@0.44# @2.53# 1.42* Warranine soil; pH 6.5; BE [email protected]# 0.01 M CaCl2
@0.71# @2.23# 5.17* Yalanbee soil; pH 6.4; BE [email protected]# 0.01 M CaCl2
@0.76# @2.54# 2.85* Avondale soil; pH 5.9; BE [email protected]# 0.01 M CaCl2
@0.74# @2.78# 1.58* Badgingarra soil; pH 6.3; BE [email protected]# 0.01 M CaCl2
J. Phys. Chem. Ref. Data, Vol. 30, No. 1, 2001

334334 DELLE SITE
TABLE 8. Sorption coefficients for pesticides—Continued
log Kd
log Kf0
(1/n) log Koc
Sorbent composition~%!Other sorbent and solution data;
prediction procedureTemp.~°C! Meth. Ref.Sand Silt Clay OC
@20.61# @2.35# 0.19* Badgingarra soil; pH 6.3; BE [email protected]# 0.01 M CaCl2
@0.82# @2.59# 2.92* Beverley soil; BE [email protected]# 0.01 M CaCl2
@1.02# @2.68# 3.78* Gabalong soil; pH 5.9; BE [email protected]# 0.01 M CaCl2
@0.38# @2.56# 1.13* Perth soil; pH 5.9; BE [email protected]# 0.01 M CaCl2
@0.75# @2.72# 1.86* Tammin soil; pH 5.9; BE [email protected]# 0.01 M CaCl2
@2.07°# 47.5 33.2 20.3 10.5* Melfort soil; pH 5.9 25 BE 260~0.45! @6.09#1.31° 53.3 27.5 19.2 6.46* Weyburn soil; pH 6.5 25 BE 260~0.83! @3.75#1.25° 5.3 25.3 69.5 4.15* Regina soil; pH 7.7 25 BE 260~0.71! @2.41#1.36° 69.3 12.3 18.5 4.07* Indian Head soil; pH 7.8 25 BE 260~0.68! @2.36#0.90° 81.6 10.4 8.0 1.77* Asquith soil; pH 7.5 25 BE 260~0.73! @1.03#0.26° 9.8 0.1* Soil; s, mesic; pH 7.0; BE 72~0.86! @0.06# SA~W!514.8 m2/g0.84° 15.0 1.0* Soil; s, mixed, mesic; pH 7.6; BE 72~0.70! @0.58# SA~W!518.1 m2/g0.90° 13.0 1.4* Soil; s, mixed, mesic; pH 7.3; BE 72~0.67! @0.81# SA~W!530.3 m2/g1.15° 6.8 1.5* Soil; s, mixed, mesic; pH 7.1; BE 72~0.59! @0.87# SA~W!515.2 m2/g1.28° 31.5 1.6* Soil; sc, mesic; pH 6.6; BE 72~0.80! @0.93# SA~W!572.4 m2/g1.45° 10.6 1.9* Soil; s, mesic; pH 4.2; BE 72~0.80! @1.10# SA~W!538.6 m2/g1.60° 18.3 1.2* Soil; s, mesic; pH 6.9; BE 72~0.63! @0.70# SA~W!555.8 m2/g2.11° 4.5 4.6* Soil; s, mesic; pH 3.7; BE 72~0.50! @2.67# SA~W!522.4 m2/g0.96° 30.1 43.4 26.5 1.89* Dundee sl soil~Tunica Co., MS!; 27 BE 274~0.60! @1.10# pH 6.2; 37% moisture content
~soil moisture tension50 bar!0.73° 46.5 40.7 12.8 0.90* Dundee sl soil~Washington Co., 27 BE 274~0.75! @0.52# MS!; pH 6.2; 34% moisture content
~soil moisture tension50 bar!0.91° 66.5 16.4 17.1 0.34* Dundee sl soil~Sharkey Co., 27 BE 274~0.71! @0.20# MS!; pH 6.2; 28% moisture content
~soil moisture tension50 bar!0.62° 12.4 75.7 11.9 1.98* Memphis sil soil~Yazoo Co., 27 BE 274~0.82! @1.15# MS!; pH 5.1; 46% moisture content
~soil moisture tension50 bar!0.63° 3.1 78.5 18.4 1.12* Memphis sil soil~Warren Co., 27 BE 274~0.81! @0.65# MS!; pH 4.4; 42% moisture content
~soil moisture tension50 bar!0.81° 6.6 77.8 15.6 2.53* Memphis sil soil~Craighead Co., 27 BE 274~0.48! @1.47# AR!; pH 5.8; 40% moisture content
~soil moisture tension50 bar!0.75° 4.7 29.8 65.5 2.11* Alligator C soil ~Leflore Co., MS!; 27 BE 274~0.40! @1.22# pH 6.2; 49% moisture content
~soil moisture tension50 bar!2.66 Soil; experimental~literature! 2173.00av 5 soils~literature! 872.71 Correlation logKoc– logS 564
J. Phys. Chem. Ref. Data, Vol. 30, No. 1, 2001

335335SORPTION OF ORGANIC COMPOUNDS
TABLE 8. Sorption coefficients for pesticides—Continued
log Kd
log Kf0
(1/n) log Koc
Sorbent composition~%!Other sorbent and solution data;
prediction procedureTemp.~°C! Meth. Ref.Sand Silt Clay OC
a-Chlordane
4.77 50.2 Aldrich humic acid; pH 8.0; 220.1 M NaHCO3
ED 206
4.38 50.2 Aldrich and Fluka humic acid FH [email protected]# 5.5 4.1 Lake Ontario sediment trap
materialFM 49
5.6 Correlation logKoc– logKow(96) 494.33 Correlation logKoc– logS 5644.94 Correlation logKoc– MCI 598
Chlorfenvinphos
@0.78# @2.47# 3.53* Batcombe sil soil; pH 6.1; 20 BE [email protected]# 0.01 M Cacl2
2.77 Correlation logKoc– MCI 5982.45 Correlation logKoc– logS 564
Chloroxuron
2.68° 45.5 15.9 6.6 12.0 Great House E.H.F. soil; pH 6.3;CE518 me/100 g
22 BE 259
2.52° 23 24.4 28.6 11.7 Toll Farm heavy peat; pH 7.4;CE541 me/100 g
22 BE 259
2.24° 34.0 33.4 32.6 3.69 Trawscoed E.H.F. soil; pH 6.2;CE512 me/100 g
22 BE 259
2.08° 66.0 18.4 15.6 1.93 Weed Res. soil; pH 7.1;CE511 me/100 g
22 BE 259
1.85° 36.0 40.4 23.6 1.76 Rosemaunde E.H.F. soil; pH 6.7;CE514 me/100 g
22 BE 259
3.51 Soil; experimental~literature! 2173.64av 5 soils~literature! 873.11 Correlation logKoc– MCI 5983.40 Correlation logKoc– logS 564
Chlorpropham „CIPC…
1.48° 100 H-montmorillonite~1–0.2mm!; 25 BE 250~1.09! pH 3.35; CE573.5 me/100 g1.43° 100 Na-montmorillonite~1–0.2mm!; 25 BE 250~0.93! pH56.80; CE587.0 me/100 g1.61 Bentonite; 0.1 M CaCl2 22 BE [email protected]# @2.67# 22.4 2.42* Beltsville sil soil; pH 4.3; 26 BE 38
@1.40# CE54.2 me/100 g; 0.01 M CaCl2
@0.84# @2.61# 23.9 2.90* Chester l soil; pH 4.9; 26 BE [email protected]# CE55.2 me/100 g; 0.01 M CaCl2
@0.63# @2.53# 35.7 2.18* Thurlow cl soil; pH 7.7; 26 BE [email protected]# CE521.6 me/100 g; 0.01 M CaCl2
@0.95# @2.35# 34.4 6.90* Barnes cl soil; pH 7.4; 26 BE [email protected]# CE533.8 me/100 g; 0.01 M CaCl2
@0.88# @2.59# 18.0 3.30* Crosby sil soil; pH 4.8; 26 BE [email protected]# CE511.5 me/100 g; 0.01 M CaCl2
@0.89# @2.50# 30.0 4.31* Hagerstown sicl soil; pH 5.5; 26 BE [email protected]# CE512.5 me/100 g; 0.01 M CaCl2
@0.95# @2.50# 52.5 4.85* Toledo sic soil; pH 5.5; 26 BE [email protected]# CE529.8 me/100 g; 0.01 M CaCl2
@0.99# @2.58# 22.1 4.40* Chillum sil soil; pH 4.6; 26 BE [email protected]# CE57.6 me/100 g; 0.01 M CaCl2
@1.11# @2.62# 23.2 5.27* Iredell sil ~topsoil!; pH 5.4; 26 BE [email protected]# CE517.0 me/100 g; 0.01 M CaCl2
@0.82# @2.47# 67.1 3.90* Sharkey c soil; pH 6.2; 26 BE [email protected]# CE540.2 me/100 g; 0.01 M CaCl2
@1.07# @2.40# 50.5 8.02* Berkley sic~topsoil!; pH 7.1; 26 BE [email protected]# CE533.7 me/100 g; 0.01 M CaCl2
@0.75# @2.32# 43.6 4.68* Benevola sic~topsoil!; pH 7.7; 26 BE [email protected]# CE519.5 me/100 g; 0.01 M CaCl2
J. Phys. Chem. Ref. Data, Vol. 30, No. 1, 2001

336336 DELLE SITE
TABLE 8. Sorption coefficients for pesticides—Continued
log Kd
log Kf0
(1/n) log Koc
Sorbent composition~%!Other sorbent and solution data;
prediction procedureTemp.~°C! Meth. Ref.Sand Silt Clay OC
2.12 @3.04# 45.5 15.9 6.6 12 Great House E.H.F. soil; pH 6.3;CE518 me/100 g; 0.1 M CaCl2
22 BE 144
1.32 @3.03# 66.0 18.4 15.6 1.93 Weed Res. Orgn. soil; pH 7.1;CE511 me/100 g; 0.1 M CaCl2
22 BE 144
2.82 @3.18# 76*@44#
OM from peat soil; 0.1 M CaCl2 22 BE 144
1.12 @2.51# 2.9 68.7 28.4 7.1* Lanton soil; pH 6.4; BE [email protected]# CE532.8 me/100 g
2.77 Soil; experimental~literature! 2172.54av 57 literature data 5622.67 Correlation logKoc– logKow 962.85,2.80
Correlation logKoc– logS 96
3.17,3.08
Correlation logKoc– logS~mp! 96
2.57 Correlation logKoc– logS 564
Chlorpyrifos
1.39° 77 15 8 0.51 Sarpy soil; pH 7.3; 24 BE 122~0.86! CE55.7 me/100 g; 0.01 M CaCl2
1.56° 83 9 8 1.07 Thurman soil; pH 6.83; 24 BE 122~0.77! CE56.1 me/100 g; 0.01 M CaCl2
2.17° @3.75# 37 42 21 2.64 Clarion agric. soil; pH 5.00; 24 BE 122~0.91! CE521.0 me/100 g; 0.01 M CaCl2
2.59° @4.01# 21 55 24 3.80 Harps agric. soil; pH 7.30; 24 BE 122~0.98! CE537.8 me/100 g; 0.01 M CaCl2
2.06 3.44 18.9 26.3 54.8 4.24 Tsukuba soil; pH 6.5;0.01 M CaCl2
25 BE 642
2.68°~1.23!
Idem 642
1.13 3.00 23.1 15.4 61.5 1.35 Kanuma soil; pH 5.7;0.01 M CaCl2
25 BE 642
1.16°~1.01!
Idem 642
3.27° @3.63# 52 34 14 75.3* Soil; organic; pH 6.1 BE 264~1.09! @43.7#2.14° @3.93# 71 22 7 2.8* Big Creek sediment; pH 6.6 BE 264~0.98! @1.62#2.07° @3.91# 56 30 14 2.5* Beverly soil; pH 6.8 BE 264~0.99! @1.45#1.26° @3.64# 91.5 1.5 7 0.7* Plainfield soil; pH 7.0 BE 264~0.98! @0.41#
3.78av 38 48 14 0.68 Commerce soil; pH 6.7 BE 575~three 56 30 14 1.12 Tracy soil; pH 6.2 BE 575soils! 12 56 32 2.01 Catlin soil; pH 6.2 BE 5754.13 Soil; experimental~literature! 2174.00 C18 column RPLC 5732.92,4.43,4.72
Correlation logKoc– logKow 96
3.96 Correlation logKoc– logS 964.87 Correlation logKoc– logS~mp! 963.93 Correlation logKoc– logS 564
Chlorthiamid
2.03 Soil; experimental~literature! 2171.99av 6 soils~literature! 872.00 Correlation logKoc– logS 564
Chlortoluron
@0.55# @2.13# 4.54* Warwick, Qld, soil; pH 6.3; BE [email protected]# 0.01 M CaCl2
J. Phys. Chem. Ref. Data, Vol. 30, No. 1, 2001
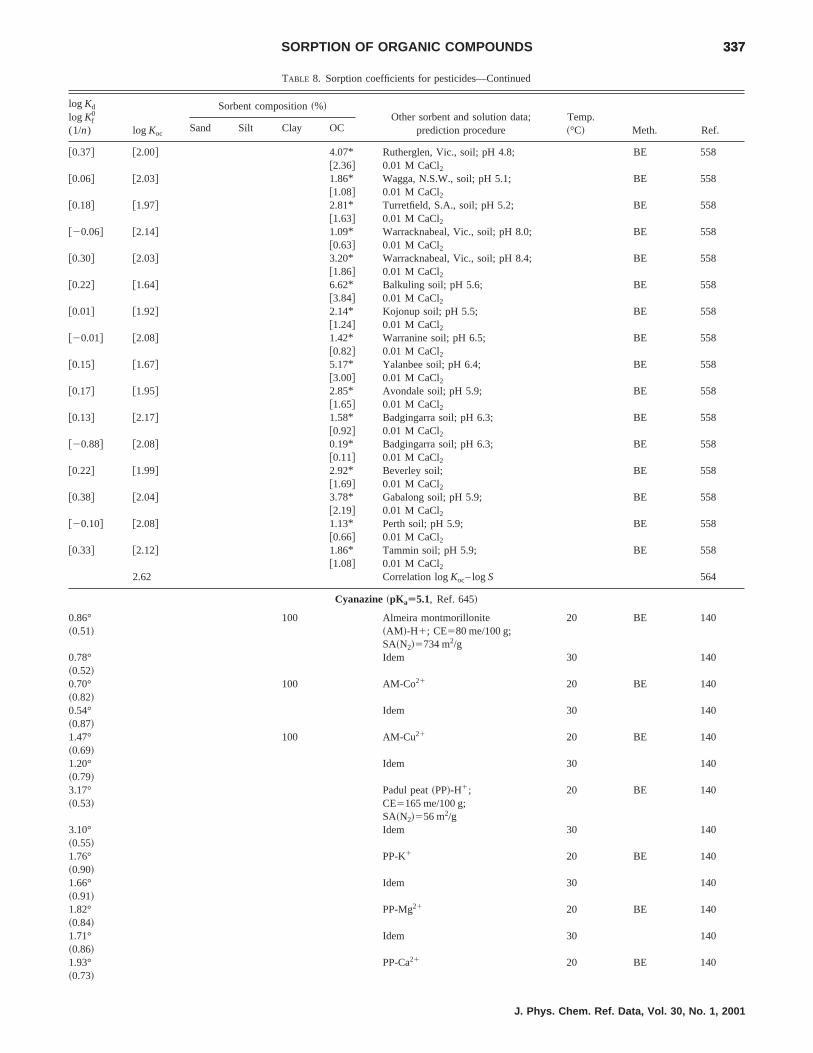
337337SORPTION OF ORGANIC COMPOUNDS
TABLE 8. Sorption coefficients for pesticides—Continued
log Kd
log Kf0
(1/n) log Koc
Sorbent composition~%!Other sorbent and solution data;
prediction procedureTemp.~°C! Meth. Ref.Sand Silt Clay OC
@0.37# @2.00# 4.07* Rutherglen, Vic., soil; pH 4.8; BE [email protected]# 0.01 M CaCl2
@0.06# @2.03# 1.86* Wagga, N.S.W., soil; pH 5.1; BE [email protected]# 0.01 M CaCl2
@0.18# @1.97# 2.81* Turretfield, S.A., soil; pH 5.2; BE [email protected]# 0.01 M CaCl2
@20.06# @2.14# 1.09* Warracknabeal, Vic., soil; pH 8.0; BE [email protected]# 0.01 M CaCl2
@0.30# @2.03# 3.20* Warracknabeal, Vic., soil; pH 8.4; BE [email protected]# 0.01 M CaCl2
@0.22# @1.64# 6.62* Balkuling soil; pH 5.6; BE [email protected]# 0.01 M CaCl2
@0.01# @1.92# 2.14* Kojonup soil; pH 5.5; BE [email protected]# 0.01 M CaCl2
@20.01# @2.08# 1.42* Warranine soil; pH 6.5; BE [email protected]# 0.01 M CaCl2
@0.15# @1.67# 5.17* Yalanbee soil; pH 6.4; BE [email protected]# 0.01 M CaCl2
@0.17# @1.95# 2.85* Avondale soil; pH 5.9; BE [email protected]# 0.01 M CaCl2
@0.13# @2.17# 1.58* Badgingarra soil; pH 6.3; BE [email protected]# 0.01 M CaCl2
@20.88# @2.08# 0.19* Badgingarra soil; pH 6.3; BE [email protected]# 0.01 M CaCl2
@0.22# @1.99# 2.92* Beverley soil; BE [email protected]# 0.01 M CaCl2
@0.38# @2.04# 3.78* Gabalong soil; pH 5.9; BE [email protected]# 0.01 M CaCl2
@20.10# @2.08# 1.13* Perth soil; pH 5.9; BE [email protected]# 0.01 M CaCl2
@0.33# @2.12# 1.86* Tammin soil; pH 5.9; BE [email protected]# 0.01 M CaCl2
2.62 Correlation logKoc– logS 564
Cyanazine ~pKaÄ5.1, Ref. 645!
0.86° 100 Almeira montmorillonite 20 BE 140~0.51! ~AM !-H1; CE580 me/100 g;
SA~N2!5734 m2/g0.78°~0.52!
Idem 30 140
0.70°~0.82!
100 AM-Co21 20 BE 140
0.54°~0.87!
Idem 30 140
1.47°~0.69!
100 AM-Cu21 20 BE 140
1.20°~0.79!
Idem 30 140
3.17° Padul peat~PP!-H1; 20 BE 140~0.53! CE5165 me/100 g;
SA~N2!556 m2/g3.10°~0.55!
Idem 30 140
1.76°~0.90!
PP-K1 20 BE 140
1.66°~0.91!
Idem 30 140
1.82°~0.84!
PP-Mg21 20 BE 140
1.71°~0.86!
Idem 30 140
1.93°~0.73!
PP-Ca21 20 BE 140
J. Phys. Chem. Ref. Data, Vol. 30, No. 1, 2001

338338 DELLE SITE
TABLE 8. Sorption coefficients for pesticides—Continued
log Kd
log Kf0
(1/n) log Koc
Sorbent composition~%!Other sorbent and solution data;
prediction procedureTemp.~°C! Meth. Ref.Sand Silt Clay OC
1.73°~0.79!
Idem 30 140
1.88°~0.80!
PP-Co21 20 BE 140
1.84°~0.78!
Idem 30 140
2.40°~0.85!
PP-Cu21 20 BE 140
2.31°~0.87!
Idem 30 140
20.20 @1.78# 20 3 1.8* Calcareous soil; pH 7.4; 19 BE [email protected]# 0.01 M CaCl2
0.34°~1.02!
@1.90# 30 27 2.77 Ves soil; pH 5.7; 0.01 M CaCl2 23 BE 643
0.08 @1.86# 30.1 55.2 14.7 1.64 Valois soil; pH 5.9;0.005 M CaSO4
23–27 BE 527
0.66° @2.57# 10.5 62.5 27 2.15* Monona soil; pH 6.7; 24 BE 644~0.96! @1.25# CE520.7 me/100 g0.53° 90.5 4.5 5 0.75* Valentine soil; pH 6.75; 24 BE 644~0.86! @0.44#0.19° @2.47# 29 55 16 0.53 Conv. tilled soil2ryegrass BE 645~0.91! ~0–2 cm!; pH 5.870.25° @2.43# 31 56 13 0.67 No-tilled soil2ryegrass BE 645~0.90! ~0–2 cm!; pH 5.740.25° @2.25# 29 58 13 1.01 Conv. tilled soil1ryegrass BE 645~0.90! ~0–2 cm!; pH 5.830.41° @2.23# 33 53 14 1.51 No-tilled soil1ryegrass BE 645~0.91! ~0–2 cm!; pH 5.581.13°~.0.95!
Ryegrass residue BE 645
0.78 2.26 3.27 Hickory Hill sediment; coarse sifraction ~20–50mm!
25 BE 130
21.10 @1.79# 97.1 2.3 0.6 0.13 Tampa aquifer; pH 80.01 N CaCl2
BE 521
2.30 Soil; experimental~literature! 2171.85 Correlation logKoc– logKow 962.71 Correlation logKoc– logS 961.75 Correlation logKoc– logS~mp! 962.42 Correlation logKoc– logS 5642.35 Correlation logKoc– MCI 578
2,4-D ~pKaÄ2.80, Ref. 679!
1.14 100 Illite No. 35~Fithian, Ill.!;SA550–300 m2/g
40 BE 146
1.14 Idem 25 1460.70 Idem 0 14620.4 100 Kaolinite~Merck, NFV!;
SA54–80 m2/g40 BE 146
20.31 Idem 25 14620.41 Idem 0 1460.88 100 Montmorillonite No. 25
~J.C. Lane Tract, Upton, Wyo.!;SA5400–900 m2/g
40 BE 146
0.95 Idem 25 1460.96 Idem 0 1461.54 100 Mississippi bentonite; pH 3.5 0 BE 2511.56 Idem 50 2510.23° 100 0.2 Montmorillonite~M! SWy-1; BE 334~0.62! CE576.4 me/100 g;
SA~N2!560 m2/g; 0.01 M CaCl20.30° 100 0.1 Santa Olalla vermiculite~V!; BE 334~0.73! CE5143.0 me/100 g;
SA~N2!53 m2/g; 0.01 M CaCl2
J. Phys. Chem. Ref. Data, Vol. 30, No. 1, 2001

339339SORPTION OF ORGANIC COMPOUNDS
TABLE 8. Sorption coefficients for pesticides—Continued
log Kd
log Kf0
(1/n) log Koc
Sorbent composition~%!Other sorbent and solution data;
prediction procedureTemp.~°C! Meth. Ref.Sand Silt Clay OC
1.77° @2.75# 10.3 Decylammonium-M ~78.9 me/100g!
BE 334
~0.91! SA~N2!510.0 m2/g; 0.01 M CaCl22.87° @3.62# 17.5 Decylammonium-V~145 me/100 g! BE 334~0.93! SA~N2!53.0 m2/g; 0.01 M CaCl20.95 @1.29# 77* Houghton muck; pH 5.6 0 BE 251
@44.7#0.91 @1.26# Idem 50 2510.28° @2.04# 12 61 27 3.0* Naff soil; pH 5.9; BE 348~0.90! @1.74# CE519 me/100 g; 0.1 N CaCl2
20.68° 39 30 31 0.8* Glendale soil; pH 7.7 BE 348~0.86! @0.46# CE531.1 me/100 g; 0.1 N CaCl2
20.17 @1.22# 2.9 68.7 28.4 7.1* Lanton soil; pH 6.4; BE [email protected]# CE532.8 me/100 g
0.11° @1.31# 47.5 33.2 20.3 10.5* Melfort soil; pH 5.9 25 BE 332~1.00! @6.09#0.53 @1.75# Idem LE 54020.11° @1.04# 45.5 41.0 13.5 12.4* Lacombe soil; pH 7.7 25 BE 332~0.98! @7.19#20.33° @1.10# 53.3 27.5 19.2 6.46* Weyburn Oxbow soil; pH 6.5 25 BE 332~1.01! @3.75#20.21 @1.21# Idem LE 54020.89° @0.73# 5.3 25.3 69.5 4.15* Regina soil; pH 7.7 25 BE 332~1.00! @2.41#20.51 @1.11# Idem LE 54020.51° @1.12# 69.3 12.3 18.5 4.07* Indian Head soil; pH 7.8 25 BE 332~0.97! @2.36#20.36 @1.27# Idem LE 54020.44° @1.16# 69.0 16.0 15.0 4.28* Weyburn soil; pH 7.8 25 BE 332~1.01! @2.48#21.05° 81.6 10.4 8.0 1.77* Asquith soil; pH 7.5 25 BE 332~0.79! @1.03#20.85 @1.13# Idem LE 5402.04°~1.64!
Peat, pH 3.4 25 BE 320
0.21° 2.09 3.31 21.9 75.0 1.30 Eurosol-1; c; pH 5.1; BE 583~0.96! 0.01 M CaCl20.34 2.23 Idem; EEC laboratory ringtest 6220.39° 1.04 3.4 64.1 22.6 3.70 Eurosol-2; sil; pH 7.4; BE 583~1.06! 0.01 M CaCl220.12 1.30 Idem; EEC laboratory ringtest 6220.06° 1.40 46.4 36.8 17.0 3.45 Eurosol-3; 1; pH 5.2; BE 583~0.99! 0.01 M CaCl20.20 1.66 Idem; EEC laboratory ringtest 6221.03 0.78 4.1 75.7 20.3 1.55 Eurosol-4; si; pH 6.5;
0.01 M CaCl2
BE 583
20.36 1.46 Idem; EEC laboratory ringtest 621.68 2.72 81.6 12.6 6.0 9.25 Eurosol-5; EEC laboratory
ringtest; pH 3.2; 0.01 M CaCl2
62
20.80 1.81 1.7 82.4 16.0 0.25 Eurosol-6; EEC laboratoryringtest; pH 7.2; 0.01 M CaCl2
62
0.45° 2.30 6 3 1.41 Gribskov soil; A hor.; pH 3.23; 11 BE 131~0.91! CE54.8 me/100 g; 0.01 M CaCl2
0.74° 2.32 4 7 2.58 Gribskov soil; B hor.; pH 3.59; 21 BE 131~0.91! CE59.6 me/100 g; 0.01 M CaCl2
0.43° 2.18 3 5 1.82 Gribskov soil; C hor.; pH 4.07; 21 BE 131~0.92! CE57.0 me/100 g; 0.01 M CaCl2
0.38° 1.70 5 4 5.11 Strodam soil; AB hor.; pH 3.88; 20 BE 131~0.97! CE513 me/100 g; 0.01 M CaCl2
20.80° 3 3 0.09 Strodam soil; C hor.; pH 4.95; 6 BE 131~0.93! CE51.6 me/100 g; 0.01 M CaCl2
20.85° 1 2 0.15 Tisvilde soil; C hor.; pH 4.21; 6 BE 131
J. Phys. Chem. Ref. Data, Vol. 30, No. 1, 2001

340340 DELLE SITE
TABLE 8. Sorption coefficients for pesticides—Continued
log Kd
log Kf0
(1/n) log Koc
Sorbent composition~%!Other sorbent and solution data;
prediction procedureTemp.~°C! Meth. Ref.Sand Silt Clay OC
~0.65! CE51.3 me/100 g; 0.01 M CaCl2
0.39° 2.18 18 12 1.64 Roskilde soil; agric.; pH 5.40; 6 BE 131~0.93! CE514 me/100 g; 0.01 M CaCl2
20.64° 4 18 0.06 Esrum soil; subsurf.; pH 4.71; 20 BE 131~1.03! CE59.1 me/100 g; 0.01 M CaCl2
20.57° 7 3 0.05 Tirstrup soil; subsurf.; pH 6.14; 20 BE 131~0.91! CE51.4 me/100 g; 0.01 M CaCl2
20.89° 34 41 0.13 Bjodstrup soil; subsurf.; pH 7.64; 20 BE 131~0.84! CE540.5 me/100 g; 0.01 M CaCl2
@20.38# @1.46# 74.4 19.5 6.1 2.5* Aguadilla soil; CE510 me/100 g; BE [email protected]# pH 7.4; 0.01 M CaCl2
@0.31# @2.43# 27.6 35.6 36.8 1.3* Aguirre soil; CE514.3 me/100 g; BE [email protected]# pH 9.0; 0.01 M CaCl2
@0.05# @1.69# 16.6 13.0 70.4 3.9* Aguirre soil; CE559.0 me/100 g; BE [email protected]# pH 8.4; 0.01 M CaCl2
@0.17# @1.91# 14.9 39.3 45.8 3.2* Alonso soil; CE513.8 me/100 g; BE [email protected]# pH 5.1; 0.01 M CaCl2
@20.28# @1.39# 49.2 28.8 22.0 3.7* Altura soil; CE527.6 me/100 g; BE [email protected]# pH 8.0; 0.01 M CaCl2
@20.06# @1.95# 68.1 4.4 27.0 1.7* Bayamon; CE55.0 me/100 g; BE [email protected]# pH 4.7; 0.01 M CaCl2
@0.34# @2.09# 56.4 8.0 35.9 3.1* Cabo Rojo soil; CE59.0 me/100 g; BE [email protected]# pH 4.3; 0.01 M CaCl2
@0.69# @1.37# 36.0 36.0 28.0 36.0* Cano Tiburones soil; pH 5.5; BE [email protected]# CE586.0 me/100 g; 0.01 M CaCl2
@0.87# @2.09# 6.6 28.9 64.5 1.9* Catalina soil; CE511.8 me/100 g; BE [email protected]# pH 4.7; 0.01 M CaCl2
@20.12# @1.88# 47.2 17.4 35.4 1.7* Cartagena soil; CE536.1 me/100 g; BE [email protected]# pH 7.7; 0.01 M CaCl2
@20.38# @1.53# 89.0 7.3 3.7 2.1* Catano soil; CE56.9 me/100 g; BE [email protected]# pH 7.9; 0.01 M CaCl2
@0.45# @2.29# 43.4 25.2 31.4 2.5* Cintrona soil; CE525.0 me/100 g; BE [email protected]# pH 8.3; 0.01 M CaCl2
@0.09# @2.03# 58.8 23.4 17.8 2.0* Cayagua´ soil; CE57.3 me/100 g; BE [email protected]# pH 5.2, 0.01 M CaCl2
@0.47# @2.14# 22.7 37.4 39.9 3.7* Coloso soil; CE523.0 me/100 g; BE [email protected]# pH 5.7; 0.01 M CaCl2
@0.25# @1.85# 26.0 18.6 55.4 4.3* Corozal soil; CE517.0 me/100 g; BE [email protected]# pH 4.6; 0.01 M CaCl2
@0.17# @1.91# 23.4 24.8 51.8 3.2* Coto soil; CE514.0 me/100 g; BE [email protected]# pH 7.7; 0.01 M CaCl2
@20.06# @2.22# 48.0 20.6 31.4 0.9* Estacion soil; CE510.0 me/100 g; BE [email protected]# pH 5.9; 0.01 M CaCl2
@20.20# @1.51# 39.1 29.7 32.2 3.4* Fe soil; CE527.6 me/100 g; BE [email protected]# pH 7.5; 0.01 M CaCl2
@20.20# @1.52# 15.0 50.7 34.3 3.3* Fortuna soil; CE523.3 me/100 g; BE [email protected]# pH 5.4; 0.01 M CaCl2
@20.12# @1.79# 15.5 32.5 52.0 2.1* Fraternidad soil; pH 6.3; BE [email protected]# CE536.6 me/100 g; 0.01 M CaCl2
@0.31# @1.92# 11.1 23.8 65.1 4.2* Fraternidad soil~Lajas!; pH 5.9; BE [email protected]# CE558.0 me/100 g; 0.01 M CaCl2
@0.00# @1.55# 6.4 19.6 74.0 4.8* Guanica soil; CE552.1 me/100 g; BE [email protected]# pH 8.1; 0.01 M CaCl2
@0.05# @2.24# 84.4 8.4 7.2 1.1* Humacao soil; CE54.0 me/100 g; BE [email protected]# pH 6.3; 0.01 M CaCl2
@20.28# @1.73# 10.1 50.9 39.0 1.7* Humata soil; CE510.1 me/100 g; BE [email protected]# pH 4.5; 0.01 M CaCl2
@20.20# @1.52# 26.6 53.5 20.9 3.3* Josefa soil; CE516.8 me/100 g; BE [email protected]# pH 6.0; 0.01 M CaCl2
@20.28# @1.53# 15.2 41.6 43.2 2.7* Juncos soil; CE513.4 me/100 g; BE [email protected]# pH 6.2; 0.01 M CaCl2
@20.12# @1.52# 19.9 33.4 46.7 3.9* Mabı soil; CE555.2 me/100 g; BE [email protected]# pH 7.0; 0.01 M CaCl2
J. Phys. Chem. Ref. Data, Vol. 30, No. 1, 2001

341341SORPTION OF ORGANIC COMPOUNDS
TABLE 8. Sorption coefficients for pesticides—Continued
log Kd
log Kf0
(1/n) log Koc
Sorbent composition~%!Other sorbent and solution data;
prediction procedureTemp.~°C! Meth. Ref.Sand Silt Clay OC
@0.00# @1.54# 22.7 40.7 36.6 4.9** Mabı soil; CE531.0 me/100 g; BE [email protected]# pH 5.7; 0.01 M CaCl2
@0.13# @2.03# 76.0 13.4 10.6 2.2* Machete soil; CE58.0 me/100 g; BE [email protected]# pH 6.5; 0.01 M CaCl2
@0.09# @1.95# 14.9 42.8 42.3 2.4* Mercedita soil; CE519.9 me/100 g; BE [email protected]# pH 8.1; 0.01 M CaCl2
@20.06# @1.60# 26.3 27.7 46.0 3.8* Moca soil; CE531.0 me/100 g; BE [email protected]# pH 5.8; 0.01 M CaCl2
@0.50# @2.01# 22.0 49.2 28.0 5.3* Nipe soil; CE511.9 me/100 g; BE [email protected]# pH 5.7; 0.01 M CaCl2
@20.38# @1.56# 59.4 28.2 12.4 2.0* Pandura soil; CE57.7 me/100 g; BE [email protected]# pH 5.7; 0.01 M CaCl2
@0.37# @2.06# 13.4 43.6 43.0 3.5* Rıo Piedras soil; pH 4.9; BE [email protected]# CE511.5 me/100 g; 0.01 M CaCl2
@0.13# @1.78# 39.0 24.6 36.4 3.9* Sabana Seca soil; pH 7.4; BE [email protected]# CE523.0 me/100 g; 0.01 M CaCl2
@0.59# @2.14# 47.0 24.4 28.6 4.9* San Anton soil; pH 7.4; BE [email protected]# CE528.0 me/100 g; 0.01 M CaCl2
@20.28# @1.64# 57.0 18.6 24.4 2.1* Santa Isabel soil; pH 7.4; BE [email protected]# CE528.0 me/100 g; 0.01 M CaCl2
@0.28# @1.50# 46.0 20.0 34.0 10.4* Soller soil; CE553.0 me/100 g; BE [email protected]# pH 6.9; 0.01 M CaCl2
@0.21# @2.30# 73.4 19.4 7.2 1.4* Talante soil; CE54.0 me/100 g; BE [email protected]# pH 5.1; 0.01 M CaCl2
@0.17# @1.70# 35.0 24.6 40.4 5.1* Toa soil; CE536.0 me/100 g; BE [email protected]# pH 8.0; 0.01 M CaCl2
@20.12# @1.81# 41.5 38.3 20.2 2.0* Toa soil; CE513.0 me/100 g; BE [email protected]# pH 5.3; 0.01 M CaCl2
@20.28# @2.18# 60.9 25.1 14.0 0.6* Toa soil; CE58.0 me/100 g; BE [email protected]# pH 6.0; 0.01 M CaCl2
@20.28# @1.41# 73.7 12.6 13.7 3.5* Vega Alta soil; pH 5.0 BE [email protected]# CE55.6 me/100 g; 0.01 M CaCl2
@0.17# @2.05# 45.2 36.8 18.0 2.3* Vıa soil; CE539.9 me/100 g; BE [email protected]# pH 5.1; 0.01 M CaCl2
@0.40# @2.29# 62.4 19.6 18.0 2.2* Vivı soil; CE514.0 me/100 g; BE [email protected]# pH 4.8; 0.01 M CaCl2
@0.89# @2.48# 15.0 23.4 61.6 4.5* Voladura soil; pH 4.3; BE [email protected]# CE517.7 me/100 g; 0.01 M CaCl2
20.51° @1.77# 71.33 18.87 9.80 0.91* Lubbeek II surf. soil; pH 6.71; 25 BE 333~0.91! @0.53# CE54.5 me/100 g;
SA~E!526 m2/g; 0.025 M CaCl221.05° 89.02 5.15 5.83 0.12* Lubbeek II subsoil; pH 6.46; 25 BE 333~0.88! @0.07# CE52.37 me/100 g;
SA~E!522 m2/g; 0.025 M CaCl221.30° 91.32 2.12 6.56 0.04* Lubbeek, II subsoil; pH 6.43; 25 BE 333~0.88! @0.02# CE52.3 me/100 g;
SA~E!527 m2/g; 0.025 M CaCl220.11° @1.83# 14.96 69.92 15.12 1.98* Lubbeek I surf. soil; pH 6.62; 25 BE 333~0.92! @1.15# CE59.52 me/100 g;
SA~E!533.5 m2/g; 0.025 M CaCl220.37° @1.82# 32.60 55.18 12.22 1.12* Lubbeek III surf. soil; pH 6.91; 25 BE 333~0.91! @0.65# CE57.02 me/100 g;
SA~E!538 m2/g; 0.025 M CaCl20.26° @2.23# 83.95 10.27 5.78 1.85* Stookrooie surf. soil; pH 5.64; 25 BE 333~0.93! @1.07# CE52.9 me/100 g;
SA~E!517.5 m2/g; 0.025 M CaCl20.31° @1.80# 3.05 62.89 34.06 5.59* Fleron surf. soil; pH 3.75; 25 BE 333~0.94! @3.24# CE512.29 me/100 g;
SA~E!552 m2/g; 0.025 M CaCl20.26° @1.77# 23.84 59.84 6.32 5.45* Bullingen surf. soil; pH 3.55; 25 BE 333~0.91! @3.16# CE58.23 me/100 g;
SA~E!513 m2/g; 0.025 M CaCl21.38° 6.58 59.66 33.76 6.70* Spa surf. soil; pH 3.25; 25 BE 333
J. Phys. Chem. Ref. Data, Vol. 30, No. 1, 2001
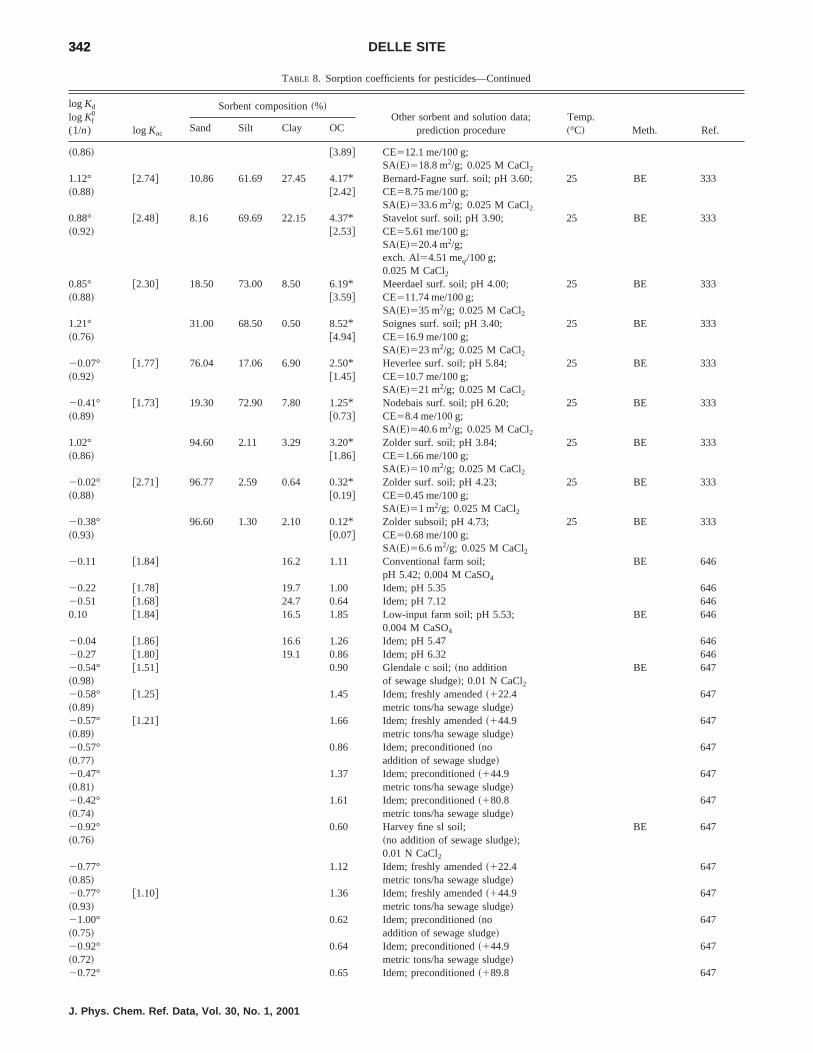
342342 DELLE SITE
TABLE 8. Sorption coefficients for pesticides—Continued
log Kd
log Kf0
(1/n) log Koc
Sorbent composition~%!Other sorbent and solution data;
prediction procedureTemp.~°C! Meth. Ref.Sand Silt Clay OC
~0.86! @3.89# CE512.1 me/100 g;SA~E!518.8 m2/g; 0.025 M CaCl2
1.12° @2.74# 10.86 61.69 27.45 4.17* Bernard-Fagne surf. soil; pH 3.60; 25 BE 333~0.88! @2.42# CE58.75 me/100 g;
SA~E!533.6 m2/g; 0.025 M CaCl20.88° @2.48# 8.16 69.69 22.15 4.37* Stavelot surf. soil; pH 3.90; 25 BE 333~0.92! @2.53# CE55.61 me/100 g;
SA~E!520.4 m2/g;exch. Al54.51 meq/100 g;0.025 M CaCl2
0.85° @2.30# 18.50 73.00 8.50 6.19* Meerdael surf. soil; pH 4.00; 25 BE 333~0.88! @3.59# CE511.74 me/100 g;
SA~E!535 m2/g; 0.025 M CaCl21.21° 31.00 68.50 0.50 8.52* Soignes surf. soil; pH 3.40; 25 BE 333~0.76! @4.94# CE516.9 me/100 g;
SA~E!523 m2/g; 0.025 M CaCl220.07° @1.77# 76.04 17.06 6.90 2.50* Heverlee surf. soil; pH 5.84; 25 BE 333~0.92! @1.45# CE510.7 me/100 g;
SA~E!521 m2/g; 0.025 M CaCl220.41° @1.73# 19.30 72.90 7.80 1.25* Nodebais surf. soil; pH 6.20; 25 BE 333~0.89! @0.73# CE58.4 me/100 g;
SA~E!540.6 m2/g; 0.025 M CaCl21.02° 94.60 2.11 3.29 3.20* Zolder surf. soil; pH 3.84; 25 BE 333~0.86! @1.86# CE51.66 me/100 g;
SA~E!510 m2/g; 0.025 M CaCl220.02° @2.71# 96.77 2.59 0.64 0.32* Zolder surf. soil; pH 4.23; 25 BE 333~0.88! @0.19# CE50.45 me/100 g;
SA~E!51 m2/g; 0.025 M CaCl220.38° 96.60 1.30 2.10 0.12* Zolder subsoil; pH 4.73; 25 BE 333~0.93! @0.07# CE50.68 me/100 g;
SA~E!56.6 m2/g; 0.025 M CaCl220.11 @1.84# 16.2 1.11 Conventional farm soil;
pH 5.42; 0.004 M CaSO4
BE 646
20.22 @1.78# 19.7 1.00 Idem; pH 5.35 64620.51 @1.68# 24.7 0.64 Idem; pH 7.12 6460.10 @1.84# 16.5 1.85 Low-input farm soil; pH 5.53;
0.004 M CaSO4
BE 646
20.04 @1.86# 16.6 1.26 Idem; pH 5.47 64620.27 @1.80# 19.1 0.86 Idem; pH 6.32 64620.54° @1.51# 0.90 Glendale c soil;~no addition BE 647~0.98! of sewage sludge!; 0.01 N CaCl220.58° @1.25# 1.45 Idem; freshly amended~122.4 647~0.89! metric tons/ha sewage sludge!20.57° @1.21# 1.66 Idem; freshly amended~144.9 647~0.89! metric tons/ha sewage sludge!20.57° 0.86 Idem; preconditioned~no 647~0.77! addition of sewage sludge!20.47° 1.37 Idem; preconditioned~144.9 647~0.81! metric tons/ha sewage sludge!20.42° 1.61 Idem; preconditioned~180.8 647~0.74! metric tons/ha sewage sludge!20.92° 0.60 Harvey fine sl soil; BE 647~0.76! ~no addition of sewage sludge!;
0.01 N CaCl220.77° 1.12 Idem; freshly amended~122.4 647~0.85! metric tons/ha sewage sludge!20.77° @1.10# 1.36 Idem; freshly amended~144.9 647~0.93! metric tons/ha sewage sludge!21.00° 0.62 Idem; preconditioned~no 647~0.75! addition of sewage sludge!20.92° 0.64 Idem; preconditioned~144.9 647~0.72! metric tons/ha sewage sludge!20.72° 0.65 Idem; preconditioned~189.8 647
J. Phys. Chem. Ref. Data, Vol. 30, No. 1, 2001

343343SORPTION OF ORGANIC COMPOUNDS
TABLE 8. Sorption coefficients for pesticides—Continued
log Kd
log Kf0
(1/n) log Koc
Sorbent composition~%!Other sorbent and solution data;
prediction procedureTemp.~°C! Meth. Ref.Sand Silt Clay OC
~0.58! metric tons/ha sewage sludge!20.80° @1.38# 0.66 Lea sl soil;~no addition BE 647~0.88! of sewage sludge!; 0.01 N CaCl220.85° @1.06# 1.23 Idem; freshly amended~122.4 647~0.91! metric tons/ha sewage sludge!20.80° @1.01# 1.57 Idem; freshly amended~144.9 647~0.99! metric tons/ha sewage sludge!20.72° 0.74 Idem; preconditioned~no 647~0.76! addition of sewage sludge!20.22° 1.31 Idem; preconditioned~144.9 647~0.60! metric tons/ha sewage sludge!20.26° 1.57 Idem; preconditioned~189.8 647~0.57! metric tons/ha sewage sludge!
1.76av 38 48 14 0.68 Commerce soil; pH 6.7 BE 575~three 56 30 14 1.12 Tracy soil; pH 6.2 BE 575soils! 12 56 32 2.01 Catlin soil; pH 6.2 BE 575
0.46° 2.11 2.24 Speyer soil 2.2~0.15–0.5 mm!; 22 BE 181~0.91! pH 5.80.04° 12.9 64.3 19.6 0.76 Alfisol soil; pH 7.5 22 BE 181~0.69!0.63° 81.5 10.0 7.2 3.56 Spodosol soil; pH 3.9 22 BE 181~0.70!20.22° Cellulose 22 BE 181~0.92!0.34° Alumina 22 BE 181~1.04!20.66 @1.87# 98.38 1.61 0.74 0.51* Lakeland soil; CE50.89 me/100 g; BE 648
@0.30# 0.01 N CaSO40.98° 2.29 89.2 8.2 2.6 4.85 Podzol soil; pH 2.8; BE 163~0.89! CE515.1 me/100 g;20.66° 1.23 69.7 14.4 15.9 1.25 Alfisol soil; pH 6.7; BE 163~1.06! CE512.3 me/100 g;20.82° 1.00 5.5 58.8 35.7 1.58 Lake Constance sedim.; pH 7.1; BE 163~0.94! CE513.4 me/100 g;
3.38°* 56.4 Humic acid from Black 5 BE 125~0.75! Chernozemic soil; pH 3.3–3.63.21°* Idem 25 125~0.79!3.16° 38* Fulvic acid-montmorillonite 5 BE 649~0.76! complex; pH 3.53.06° Idem 25 649~0.83!1.30 Soil; experimental~literature! 2171.29av 9 soils~literature! 872.59 Cyanopropyl column; pH 3 20–25 RPLC 5791.36 C18 column RPLC 5732.00 Correlation logKoc– logS 5641.48 Correlation logKoc– MCI 578
2,4-D amine
0.66° 18.4 45.3 38.3 3.87 Webster soil; pH 7.3; CE554.7 23 BE 102~0.70! me/100 g; 0.01 N CaCl2
20.19° 65.8 19.5 14.7 0.90 Cecil soil; pH 5.6; CE56.8 23 BE 102~0.83! me/100 g; 0.01 N CaCl2
20.12° 93.8 3.0 3.2 0.56 Eustis soil; pH 5.6; CE55.2 BE 102~0.73! me/100 g; 0.01 N CaCl2
2.04av 3 soils~literature data! 87
p,p8-DDT
3.11 5.11 18 0.99 Montcalm soil; sandy loam;CE55 me/100 g
25 BE 184
4.14 5.55 46 3.86 Sims soil; clay; CE530 me/100 g; 25 BE 184
J. Phys. Chem. Ref. Data, Vol. 30, No. 1, 2001

344344 DELLE SITE
TABLE 8. Sorption coefficients for pesticides—Continued
log Kd
log Kf0
(1/n) log Koc
Sorbent composition~%!Other sorbent and solution data;
prediction procedureTemp.~°C! Meth. Ref.Sand Silt Clay OC
5.03 5.36 46.5 Houghton soil; muck;CE5214 me/100 g;
25 BE 184
5.18av 38 48 14 0.68 Commerce soil; pH 6.7 BE 575~three 56 30 14 1.12 Tracy soil; pH 6.2 BE 575soils! 12 56 32 2.01 Catlin soil; pH 6.2 BE 575
3.94 5.68 25 40 35 1.8 Taichung soil; pH 6.8 25 BE 4074.89 Sewage effluent; pH 7.6 BE 6505.32 Idem~after filtration! BE 6504.31 5.95 2–4 Boonton Reservoir sed.; pH 8.3 BE 421
5.61 54.3 Boonton sed. humic acid; pH 8.3; 25 ED 421,0.01 M NaCl 402
3.66 6.24 6.9 0.45* Mivtahim agricult. surface soil 25 BE [email protected]#
3.81 5.95 23.8 1.25* Gilat agricult. surface soil 25 BE [email protected]#
3.91 5.69 71.2 2.82* Neve Yaar agricult. surface soil 25 BE [email protected]#
3.98 5.45 76.2 5.82* Malkiya agricult. surface soil 25 BE [email protected]#
4.54 5.88 60.5 7.85* Kinneret A Lake sediment 25 BE [email protected]#
4.18 5.77 63.8 4.39* Kinneret G Lake sediment 25 BE [email protected]#
4.68 6.25 2.7 Narragansett Bay~NB! sed.;sea water
25 BE 173
4.82 6.39 Idem 5 1734.08 6.30 0.6 Idem after treatment with H2O2 25 1735.39 5.63 57 Humic acid from NB sed.; sea water 25 BE 1735.30 5.54 Idem 5 1735.48 5.72 Idem; distilled water 25 1734.48 Montmorillonite clay; sea water 25 BE 1734.63 Idem 5 1734.60 Idem; distilled water 25 1733.78 Kaolinite clay; sea water 25 BE 173
5.07– 45.8 Pakim Pond humic acid; pH 6.0–9.2;
25 ED 402
5.35 m50.01– 0.08; 7 values5.61– 54.9 Aldrich humic acid; pH 8.3; 25 ED 4025.74 m50.001– 0.08; 3 values5.61 Boonton Reservoir sediment
humic acid; pH 8.3;m50.0125 ED 402
4.84 Pakim Pond water DOC; pH 8.3;m50.001
25 ED 402
4.83 Boonton water DOC; pH 8.3;m50.001
25 ED 402
5.06 58.0 Sanhedron soil humic acid; pH 6.5 24 SE 2204.58 48.7 Sanhedron soil fulvic acid; pH 6.5 24 SE 2204.39 54.2 Suwannee River humic acid; pH 6.5 24 SE 2204.40 53.8 Suwannee River fulvic acid; pH 6.5 24 SE 2205.53 Aldrich humic acid 25 SE 4075.56 69.4 Aldrich humic acid Na salt; pH 6.5 24 SE 2195.56 65.8 Fluka-Tridom humic acid; pH 6.5 24 SE 2194.93 56.7 Calcasieu River Humic extr.; pH 6.5 24 SE 2194.39 Suwannee River water; pH 6.5;
DOC537 mg/L24 SE 219
4.39 Sopchoppy River water; pH 6.5;DOC544 mg/L
24 SE 219
5.11 Aldrich humic acid(DOC59.4 mg/L);pH 5.8–6.8
RS 414
5.45 Idem ED 414
J. Phys. Chem. Ref. Data, Vol. 30, No. 1, 2001

345345SORPTION OF ORGANIC COMPOUNDS
TABLE 8. Sorption coefficients for pesticides—Continued
log Kd
log Kf0
(1/n) log Koc
Sorbent composition~%!Other sorbent and solution data;
prediction procedureTemp.~°C! Meth. Ref.Sand Silt Clay OC
5.44 Idem~log Kdoc is the zero interceptof the regression line of logKdoc
vs DOC concentration!
RS 414
4.46 DOC in Lake Erie water~9.6 mg/L! RS 4144.76 Idem ED 4144.23 DOC in Huron River wat.~7.8 mg/
L!RS 414
5.67 Idem ED 4145.40 Aldrich humic acid 25 RS 409
5.57av 6.36av Lake suspended matter~three phases distribution!
25 RS 409
4.26av Lake dissolved organic matter~same procedure!
25 RS 409
5.46av 6.24av 16 Green Bay suspended matter~same procedure!
25 RS 410
3.97av Green Bay DOC~same procedure! 25 RS 4105.70 Aldrich humic acid; pH 7.32
(DOC50 – 1.7 mg/L)6.6 RS 546
4.55 Peat humic acid ED 4233.98 Bermeo soil humic acid ED 4233.09 Bermeo soil fulvic acid ED 4235.63 Cyanopropyl column 20–25 RPLC [email protected]# 58.03 Prediction by limiting vapor
sorption on soil humic acid23 LSC 363
5.59 50.2 Aldrich and Fluka humic acid FH 2064.64 C18 column RPLC 5735.38 Soil; experimental~literature! 2175.39av 2 soils~literature! 875.63av 31 literature data 5625.80 Correlation logKoc– logKow 964.95 Correlation logKoc– logKow 2075.98 Correlation logKoc– logKow 1085.16 Correlation logKoc– logS 5645.62 Correlation logKoc– logS 966.81 Correlation logKoc– logS(mp) 965.34 Correlation logKoc– MCI [email protected]# Correlation logKom– MCI 591
Diallate
3.03°*~0.67!
Peat moss; pH 4.0 25 BE 475
1.56° Silica gel~24–32 mesh/cm!; 25 BE 475~0.67! pH 8.22.72° Wheat straw; pH 6.2 25 BE 475~0.68!
3.28 Soil; experimental~literature! 2173.00 Correlation logKoc– logS 5642.77 Correlation logKoc– MCI 578
Diazinon
@0.67# @2.36# 3.53* Batcombe sil soil; pH 6.1; 20 BE [email protected]# 0.01 M CaCl2
1.14 2.51 18.9 26.3 54.8 4.24 Tsukuba soil; pH 6.5;0.01 M CaCl2
25 BE 642
1.07° Idem 642~0.95!0.38 2.24 23.1 15.4 61.5 1.35 Kanuma soil; pH 5.7;
0.01 M CaCl2
25 BE 642
0.42°~1.04!
Idem 642
2.51° @2.87# 52 34 14 75.3* Soil; organic; pH 6.1 BE 264~1.00! @43.7#0.85° @2.64# 71 22 7 2.8* Big Creek sediment; pH 6.6 BE 264
J. Phys. Chem. Ref. Data, Vol. 30, No. 1, 2001

346346 DELLE SITE
TABLE 8. Sorption coefficients for pesticides—Continued
log Kd
log Kf0
(1/n) log Koc
Sorbent composition~%!Other sorbent and solution data;
prediction procedureTemp.~°C! Meth. Ref.Sand Silt Clay OC
~1.07! @1.62#0.78° @2.62# 56 30 14 2.5* Beverly soil; pH 6.8 BE 264~0.99! @1.45#0.30° @2.69# 91.5 1.5 7 0.7* Plainfield soil; pH 7.0 BE 264~1.08! @0.41#0.56° 35.5 5.3 59.2 0.6* Soil; pH 6.3 20 BE 651~0.81! @0.35#1.63° 76.2 12.8 11.0 8.7* Soil; pH 5.1 20 BE 651~0.85! @5.05#0.94° @2.51# 73.9 11.9 14.2 4.7* Soil; pH 5.1 20 BE 651~0.88! @2.73#0.28° @2.61# 66.4 15.6 18.1 0.8* Soil; pH 7.5 20 BE 651~0.97! @0.46#1.00° @3.35# 66.4 15.5 18.1 0.77* Eutric Cambisol~Ah hor.!; pH 7.5; 20 BE 350~0.91! @0.45# CE59.4 me/100 g;1.30° @3.63# 4.4 53.0 42.6 0.82* Marismas 1 soil; pH 7.7 20 BE 652~0.95! @0.48#0.68° @2.88# 4.2 27.1 68.7 1.10* Idem 2; pH 7.8 652~0.98! @0.64#0.85° @2.90# 11.2 26.7 62.1 1.55* Idem 3; pH 7.6 652~0.88! @0.90#0.73° @3.21# 25.7 32.5 41.8 0.57* Idem 4; pH 7.7 652~0.94! @0.33#0.80 @2.70# 26.3 21.9 51.8 2.16* Idem 5; pH 7.8 652~0.88! @1.25#0.20° @2.70# 53.1 11.0 35.9 0.55* Idem 6; pH 7.9 652~1.03! @0.32#20.15° @2.41# 70.9 5.3 23.8 0.47* Idem 7; pH 7.9 652~1.09! @0.27#0.44° @2.71# 73.0 3.0 24.0 0.93* Idem 8; pH 7.7 652~0.97! @0.54#0.16° @2.65# 53.1 5.9 41.0 0.57* Idem 9; pH 7.4 652~1.09! @0.33#0.20° 65.4 5.6 29.0 0.15* Idem 10; pH 4.6 652~1.25! @0.09#0.62° @2.74# 78.2 6.6 15.2 1.30* Idem 11; pH 5.8 652~0.91! @0.75#0.41° @3.31# 75.8 5.7 18.5 0.22* Idem 12; pH 4.6 652~1.10! @0.13#0.25° @2.64# 74.9 8.5 16.6 0.72* Idem 13; pH 7.9 652~0.93! @0.42#0.62° @2.56# 33.1 14.3 52.6 2.01* Idem 14; pH 7.4 652~0.93! @1.17#0.71° @2.53# 13.5 23.9 62.6 2.60* Idem 15; pH 7.4 652~0.94! @1.51#0.82° 59.6 12.2 28.2 1.89* Idem 16; pH 7.9 652~0.79! @1.10#0.71° @2.77# 66.6 6.9 26.5 1.52* Idem 17; pH 7.2 652~0.90! @0.88#0.39° @2.91# 65.9 7.5 26.6 0.52* Idem 18; pH 7.9 652~1.01! @0.30#0.24° @2.64# 88.8 2.7 8.5 0.69* Idem 19; pH 5.2 652~1.06! @0.40#20.03° 66.4 15.5 18.1 0.77* Idem 20; pH 7.5 652~1.18! @0.45#1.36° @2.59# 64.3 21.1 14.6 10.2* Salamanca soil 21; pH 4.7 20 BE 652~0.93! @0.93#1.41° 67.4 18.7 13.9 8.90* Idem 22; pH 5.0 652~0.85! @5.16#1.30° 75.4 13.0 11.6 5.95* Idem 23; pH 5.3 652~0.79! @3.45#0.97° 73.9 11.9 14.2 4.66* Idem 24; pH 5.1 652~0.85! @2.70#
J. Phys. Chem. Ref. Data, Vol. 30, No. 1, 2001

347347SORPTION OF ORGANIC COMPOUNDS
TABLE 8. Sorption coefficients for pesticides—Continued
log Kd
log Kf0
(1/n) log Koc
Sorbent composition~%!Other sorbent and solution data;
prediction procedureTemp.~°C! Meth. Ref.Sand Silt Clay OC
0.99° @2.70# 54.2 34.0 11.8 3.44* Idem 25; pH 5.6 652~0.95! @2.00#
5.38 Soil; experimental~literature! 2172.76 Correlation logKoc– logS 5643.13 Correlation logKoc– MCI 598
Dicamba ~pKaÄ1.95, Ref. 680!
2.82 100 Ca–montmorillonite; pH 6 24 BE 121NA 94* OM from peaty muck~Histosol! 24 BE 121
@54.5# soil; pH 5.522.0 @20.46# 59 22 2.8 Waukegan soil; pH 4.1;
CE521 cmol/kg; 0.01 M CaCl2
23 BE 323
20.66 @0.93# 73 21 2.6 Plano soil; pH 4.7;CE517 cmol/kg; 0.01 M CaCl2
23 BE 323
20.89 @0.70# Idem; pH 5.8 32321.05 @0.54# Idem; pH 6.3 32322.0 @20.04# 62 15 1.1 Walla Walla soil; pH 5.0;
CE520 cmol/kg; 0.01 M CaCl2
23 BE 323
22.0 @20.04# Idem; pH 5.5 32322.0 @20.04# Idem; pH 6.0 3230.93°~0.99!
Peat; pH 3.5 25 BE 320
20.96° 47.5 33.2 20.3 10.5* Melfort soil; pH 5.9 25 BE 320~0.72! @6.09#21.08° 25 22 9.0 Elkton soil~Ap horizon!; pH 6.1; 25 BE 322~0.74! CE55.6 me/100 g
20.40 Soil; experimental~literature! 2170.34av 5 soils~literature! 871.63 Correlation logKoc– logS 5641.46 Correlation logKoc– MCI 598
Dicrotophos
21.15° 88 8 4 1.1* Georgia soil; pH 6.7; 25 BE 653~0.77! @0.64# CE52.0 me/100 g20.40° @1.73# 60 28 12 1.3* Hanford soil; pH 6.4; 25 BE 653~0.96! @0.75# CE57.1 me/100 g20.04° @1.60# 24 52 24 4.0* Catlin soil; pH 5.7; 25 BE 653~0.95! @2.3# CE513.0 me/100 g0.55° @2.27# 22 34 44 3.3* Soil; clay loam; pH 5.9; 25 BE 653~0.98! @1.9# CE523.5 me/100 g
Dieldrin
2.07° 77 15 8 3.9* Bondhead soil~2.00E-4 g/mL!; 20 BE 486~0.79! @2.26# pH 6.92.13°~0.78!
Idem ~2.00E-3 g/mL! 486
1.59 @3.99# 0.4 Plainfield-Bloomfield s soil;CE51.7 me/100 g; 0.01 M CaCl2
25 BE 265
2.17 @4.09# 1.2 Gilford-Hoopeston-Ade sl soil;CE57.5 me/100 g; 0.01 M CaCl2
25 BE 265
2.42 @3.99# 2.7 Bryce-Swygert sic soil;CE534.4 me/100 g; 0.01 M CaCl2
25 BE 265
2.30 @3.81# 3.1 Drummer sicl soil;CE524.8 me/100 g;0.001 M CaCl2
25 BE 265
2.42 @3.87# 3.5 Flanagan sil soil;CE527.7 me/100 g; 0.01 M CaCl2
25 BE 265
2.47 @3.60# 7.5 Bryce sic soil;CE555.5 me/100 g; 0.01 M CaCl2
25 BE 265
3.18 @3.95# 16.8 Houghton soil; muck;CE572.4 me/100 g; 0.01 M CaCl2
25 BE 265
2.29° 4.15 1.42 Soil; cl;~kaolinite!; 20 BE 214
J. Phys. Chem. Ref. Data, Vol. 30, No. 1, 2001

348348 DELLE SITE
TABLE 8. Sorption coefficients for pesticides—Continued
log Kd
log Kf0
(1/n) log Koc
Sorbent composition~%!Other sorbent and solution data;
prediction procedureTemp.~°C! Meth. Ref.Sand Silt Clay OC
~0.954! pH 5.91; CE512.4 meq/100 g4.40*av 65-* Eight sludges from two water 22.5 BE 535
85* treatment [email protected]# @4.11# 3.53* Batcombe sil soil; pH 6.1; 20 BE 120
@2.05# 0.01 M CaCl23.63° @3.99# 52 34 14 75.3* Soil; organic; pH 6.1 BE 264~1.08! @43.7#2.65° @4.44# 71 22 7 2.8* Big Creek sediment; pH 6.6 BE 264~0.91! @1.62#2.53° @4.37# 56 30 14 2.5* Beverly soil; pH 6.8 BE 264~0.89! @1.45#2.03° @4.41# 91.5 1.5 7 0.7* Plainfield soil; pH 7.0 BE 264~0.88! @0.41#2.99 4.73 25 40 35 1.8 Taichung soil; pH 6.8 25 BE 407
4.89 Aldrich humic acid 25 SE 4074.55 Correlation logKoc– logS 5644.03 Correlation logKoc– MCI 598
Dimethoate
@0.73# @0.96# 3.53* Batcombe silt loam; pH 6.1; 20 BE [email protected]# 0.01 M CaCl2
20.10 1.26 18.9 26.3 54.8 4.24 Tsukuba soil; pH 6.5;0.01 M CaCl2
25 BE 642
20.31°~0.85!
Idem 25 BE 642
20.30 1.56 23.1 15.4 61.5 1.35 Kanuma soil; pH 5.7;0.01 M CaCl2
25 BE 642
20.37°~0.95!
Idem 25 BE 642
1.23 Correlation logKoc– logS 5641.39 Correlation logKoc– MCI 598
Dinoseb
2.09 Soil; experimental~literature! 2173.82 Cyanopropyl column; pH 3 20–25 RPLC 5792.71 Correlation logKoc– logS 5642.74 Correlation logKoc– MCI 578
Diphenamid
0.41 @1.80# 2.9 68.7 28.4 7.1* Lanton soil; pH 6.4; BE [email protected]# CE532.8 me/100 g
2.32 Correlation logKoc– logS 564
Dipropetryn
21.15° 100 Quartz sand; pH 5.6; 26 BE 299~0.97! CE50.4 me/100 g; 0.01 N CaCl2
0.12° @2.58# 93 4 3 0.6* Cobb soil; pH 7.3; 26 BE 299~0.88! @0.35# CE53.8 me/100 g; 0.01 N CaCl2
1.51° 93 4 3 2.1* Cobb soil12% muck; pH 5.3; 26 BE 299~0.73! @1.22# CE59.0 me/100 g; 0.01 N CaCl2
0.79° 58 23 19 1.3* Teller soil; pH 5.7; 26 BE 299~0.86! @0.75# CE58.6 me/100 g; 0.01 N CaCl2
0.95° 16 42 42 1.8* Port soil; pH 6.3; 26 BE 299~0.81! @1.04# CE517.9 me/100 g; 0.01 N CaCl2
1.27° @3.06# 27 45 29 2.8* Brewer soil; pH 5.8; 26 BE 299~0.89! @1.62# CE513.5 me/100 g; 0.01 N CaCl2
3.07 Soil; experimental~literature! 2173.07av 5 soils~literature! 873.10 Correlation logKoc– MCI 5982.98 Correlation logKoc– logS 564
J. Phys. Chem. Ref. Data, Vol. 30, No. 1, 2001

349349SORPTION OF ORGANIC COMPOUNDS
TABLE 8. Sorption coefficients for pesticides—Continued
log Kd
log Kf0
(1/n) log Koc
Sorbent composition~%!Other sorbent and solution data;
prediction procedureTemp.~°C! Meth. Ref.Sand Silt Clay OC
Disulfoton
1.33° @2.90# 18 2.7 Broadbalk FYM plot soil; pH 7.8; 20 BE 262~1.00! CE519.8 me/100 g; 0.01 M CaCl2
0.76° @2.81# 18 0.9 Broadbalk nil plot soil; pH 8.1; 20 BE 262~1.01! CE510.4 me/100 g; 0.01 M CaCl2
1.30° @3.05# 7 1.8 Woburn plot 2 soil; pH 6.5; 20 BE 262~1.00! CE510.7 me/100 g; 0.01 M CaCl2
1.31° 6 1.3 Wobum plot 4 soil; pH 6.8; 20 BE 262~0.85! CE510.6 me/100 g; 0.01 M CaCl2
1.17° @3.13# 6 1.1 Wobum plot 34 soil; pH 6.8; 20 BE 262~0.93! CE510.2 me/100 g; 0.01 M CaCl2
1.17° 26 1.4 Stretham soil; pH 7.5; 20 BE 262~0.81! CE513.0 me/100 g; 0.01 M CaCl2
1.69° 11 7.6 Isleham 1 soil; pH 7.5; 20 BE 262~0.87! CE544.8 me/100 g; 0.01 M CaCl2
1.74° @3.30# 2 2.8 Isleham 2 soil; pH 6.3; 20 BE 262~0.88! CE518.2 me/100 g; 0.01 M CaCl2
1.77° @2.82# 16 8.8 Bottisham soil; pH 7.7; 20 BE 262~0.97! Ce548.2 me/100 g; 0.01 M CaCl2
0.72° @2.88# 8 0.7 Worlington soil; pH 8.1; 20 BE 262~1.09! CE56.3 me/100 g; 0.01 M CaCl2
1.98° 25 12.0 Spinney soil; pH 7.2; 20 BE 262~0.80! CE566.4 me/100 g; 0.01 M CaCl2
1.31° 36 1.7 Wicken soil; pH 8.0; 20 BE 262~0.80! CE521.9 me/100 g; 0.01 M CaCl2
2.00° @2.83# 62 15.0 Prickwillow soil; pH 5.1; 20 BE 262~1.00! CE583.4 me/100 g; 0.01 M CaCl2
1.32° 10 1.7 Moulton soil; pH 8.1; 20 BE 262~0.81! CE510.6 me/100 g; 0.01 M CaCl2
1.20° @2.95# 21 1.8 Oakington soil; pH 7.2; 20 BE 262~0.92! CE514.0 me/100 g; 0.01 M CaCl2
1.85° @2.81# 36 11.0 Peacock soil; pH 7.6; 20 BE 262~0.94! CE574.0 me/100 g; 0.01 M CaCl2
2.13° @2.64# 31.0 Adventures peat soil; pH 6.9; 20 BE 262~0.95! CE5118.8 me/100 g; 0.01 M CaCl2
1.78° 75 1.3 Eurosol-1; c; pH 5.1; BE 583~1.18! 0.01 M CaCl21.71° 22.6 3.7 Eurosol-2; sil; pH 7.4; BE 583~1.42! 0.01 M CaCl21.65° 17.0 3.45 Eurosol-3; 1; pH 5.2; BE 583~1.27! 0.01 M CaCl21.56° 20.3 1.55 Eurosol-4; si; pH 6.5; BE 583~1.34! 0.01 M CaCl23.11° 6.0 9.25 Eurosol-5; ls; pH 3.2; BE 583~2.06! 0.01 M CaCl2
3.25 Soil; experimental~literature! 2173.20av 20 soils~literature! 872.87 Correlation logKoc– logS 5642.91 Correlation logKoc– MCI 598
Diuron
1.36° 100 Na–montmorillonite~1–0.2mm!; 25 BE 250~0.93! pH 6.80; CE587.0 me/100 g1.85° 100 H–montmorillonite~1–0.2mm!; 25 BE 250~1.05! pH 3.35; CE573.5 me/100 g1.64° 100 H–montmorillonite; pH 3.6 BE 212~0.80!1.38° 100 Na–montmorillonite; pH 7.9 BE 212~0.80!1.38° 100 Ca–montmorillonite; pH 7.9 BE 212~0.80!1.36° 100 Mg–montmorillonite; pH 8.2 BE 212
~0.80!J. Phys. Chem. Ref. Data, Vol. 30, No. 1, 2001
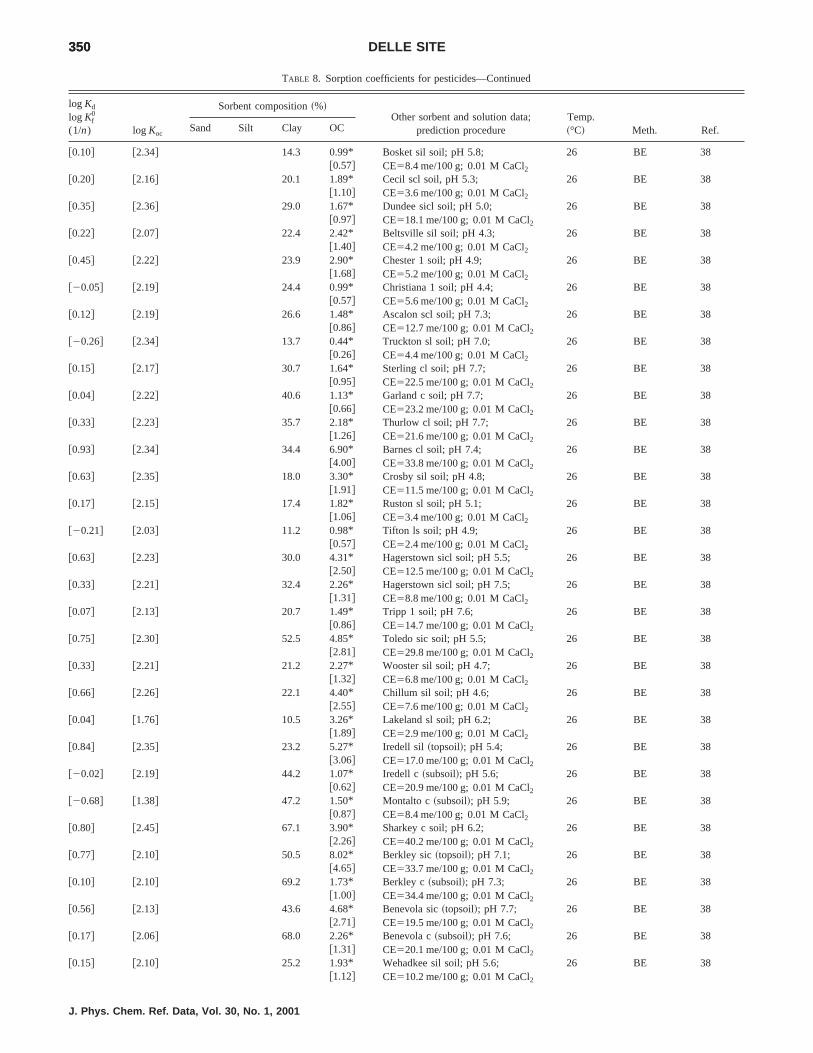
350350 DELLE SITE
TABLE 8. Sorption coefficients for pesticides—Continued
log Kd
log Kf0
(1/n) log Koc
Sorbent composition~%!Other sorbent and solution data;
prediction procedureTemp.~°C! Meth. Ref.Sand Silt Clay OC
@0.10# @2.34# 14.3 0.99* Bosket sil soil; pH 5.8; 26 BE [email protected]# CE58.4 me/100 g; 0.01 M CaCl2
@0.20# @2.16# 20.1 1.89* Cecil scl soil, pH 5.3; 26 BE [email protected]# CE53.6 me/100 g; 0.01 M CaCl2
@0.35# @2.36# 29.0 1.67* Dundee sicl soil; pH 5.0; 26 BE [email protected]# CE518.1 me/100 g; 0.01 M CaCl2
@0.22# @2.07# 22.4 2.42* Beltsville sil soil; pH 4.3; 26 BE [email protected]# CE54.2 me/100 g; 0.01 M CaCl2
@0.45# @2.22# 23.9 2.90* Chester 1 soil; pH 4.9; 26 BE [email protected]# CE55.2 me/100 g; 0.01 M CaCl2
@20.05# @2.19# 24.4 0.99* Christiana 1 soil; pH 4.4; 26 BE [email protected]# CE55.6 me/100 g; 0.01 M CaCl2
@0.12# @2.19# 26.6 1.48* Ascalon scl soil; pH 7.3; 26 BE [email protected]# CE512.7 me/100 g; 0.01 M CaCl2
@20.26# @2.34# 13.7 0.44* Truckton sl soil; pH 7.0; 26 BE [email protected]# CE54.4 me/100 g; 0.01 M CaCl2
@0.15# @2.17# 30.7 1.64* Sterling cl soil; pH 7.7; 26 BE [email protected]# CE522.5 me/100 g; 0.01 M CaCl2
@0.04# @2.22# 40.6 1.13* Garland c soil; pH 7.7; 26 BE [email protected]# CE523.2 me/100 g; 0.01 M CaCl2
@0.33# @2.23# 35.7 2.18* Thurlow cl soil; pH 7.7; 26 BE [email protected]# CE521.6 me/100 g; 0.01 M CaCl2
@0.93# @2.34# 34.4 6.90* Barnes cl soil; pH 7.4; 26 BE [email protected]# CE533.8 me/100 g; 0.01 M CaCl2
@0.63# @2.35# 18.0 3.30* Crosby sil soil; pH 4.8; 26 BE [email protected]# CE511.5 me/100 g; 0.01 M CaCl2
@0.17# @2.15# 17.4 1.82* Ruston sl soil; pH 5.1; 26 BE [email protected]# CE53.4 me/100 g; 0.01 M CaCl2
@20.21# @2.03# 11.2 0.98* Tifton ls soil; pH 4.9; 26 BE [email protected]# CE52.4 me/100 g; 0.01 M CaCl2
@0.63# @2.23# 30.0 4.31* Hagerstown sicl soil; pH 5.5; 26 BE [email protected]# CE512.5 me/100 g; 0.01 M CaCl2
@0.33# @2.21# 32.4 2.26* Hagerstown sicl soil; pH 7.5; 26 BE [email protected]# CE58.8 me/100 g; 0.01 M CaCl2
@0.07# @2.13# 20.7 1.49* Tripp 1 soil; pH 7.6; 26 BE [email protected]# CE514.7 me/100 g; 0.01 M CaCl2
@0.75# @2.30# 52.5 4.85* Toledo sic soil; pH 5.5; 26 BE [email protected]# CE529.8 me/100 g; 0.01 M CaCl2
@0.33# @2.21# 21.2 2.27* Wooster sil soil; pH 4.7; 26 BE [email protected]# CE56.8 me/100 g; 0.01 M CaCl2
@0.66# @2.26# 22.1 4.40* Chillum sil soil; pH 4.6; 26 BE [email protected]# CE57.6 me/100 g; 0.01 M CaCl2
@0.04# @1.76# 10.5 3.26* Lakeland sl soil; pH 6.2; 26 BE [email protected]# CE52.9 me/100 g; 0.01 M CaCl2
@0.84# @2.35# 23.2 5.27* Iredell sil ~topsoil!; pH 5.4; 26 BE [email protected]# CE517.0 me/100 g; 0.01 M CaCl2
@20.02# @2.19# 44.2 1.07* Iredell c ~subsoil!; pH 5.6; 26 BE [email protected]# CE520.9 me/100 g; 0.01 M CaCl2
@20.68# @1.38# 47.2 1.50* Montalto c ~subsoil!; pH 5.9; 26 BE [email protected]# CE58.4 me/100 g; 0.01 M CaCl2
@0.80# @2.45# 67.1 3.90* Sharkey c soil; pH 6.2; 26 BE [email protected]# CE540.2 me/100 g; 0.01 M CaCl2
@0.77# @2.10# 50.5 8.02* Berkley sic~topsoil!; pH 7.1; 26 BE [email protected]# CE533.7 me/100 g; 0.01 M CaCl2
@0.10# @2.10# 69.2 1.73* Berkley c ~subsoil!; pH 7.3; 26 BE [email protected]# CE534.4 me/100 g; 0.01 M CaCl2
@0.56# @2.13# 43.6 4.68* Benevola sic~topsoil!; pH 7.7; 26 BE [email protected]# CE519.5 me/100 g; 0.01 M CaCl2
@0.17# @2.06# 68.0 2.26* Benevola c~subsoil!; pH 7.6; 26 BE [email protected]# CE520.1 me/100 g; 0.01 M CaCl2
@0.15# @2.10# 25.2 1.93* Wehadkee sil soil; pH 5.6; 26 BE [email protected]# CE510.2 me/100 g; 0.01 M CaCl2
J. Phys. Chem. Ref. Data, Vol. 30, No. 1, 2001

351351SORPTION OF ORGANIC COMPOUNDS
TABLE 8. Sorption coefficients for pesticides—Continued
log Kd
log Kf0
(1/n) log Koc
Sorbent composition~%!Other sorbent and solution data;
prediction procedureTemp.~°C! Meth. Ref.Sand Silt Clay OC
@0.64# @2.22# 4.54* Warwick, Qld, soil; pH 6.3; BE [email protected]# 0.01 M CaCl2
@0.58# @2.21# 4.07* Rutherglen, Vic., soil; pH 4.8; BE [email protected]# 0.01 M CaCl2
@0.34# @2.31# 1.86* Wagga, N.S.W., soil; pH 5.1; BE [email protected]# 0.01 M CaCl2
@0.43# @2.22# 2.81* Turretfield, S.A., soil; pH 5.2; BE [email protected]# 0.01 M CaCl2
@0.29# @2.49# 1.09* Warracknabeal, Vic., soil; pH 8.0; BE [email protected]# 0.01 M CaCl2
@0.48# @2.21# 3.20* Warracknabeal, Vic., soil; pH 8.4; BE [email protected]# 0.01 M CaCl2
@0.42# @1.84# 6.62* Balkuling soil; pH 5.6; BE [email protected]# 0.01 M CaCl2
@0.39# @2.30# 2.14* Kojonup soil; pH 5.5; BE [email protected]# 0.01 M CaCl2
@0.22# @2.31# 1.42* Warranine soil; pH 6.5; BE [email protected]# 0.01 M CaCl2
@0.46# @1.98# 5.17* Yalanbee soil; pH 6.4; BE [email protected]# 0.01 M CaCl2
@0.40# @2.18# 2.85* Avondale soil; pH 5.9; BE [email protected]# 0.01 M CaCl2
@0.47# @2.51# 1.58* Badgingarra soil; pH 6.3; BE [email protected]# 0.01 M CaCl2
@20.68# @2.28# 0.19* Badgingarra soil; pH 6.3; BE [email protected]# 0.01 M CaCl2
@0.51# @2.28# 2.92* Beverley soil; BE [email protected]# 0.01 M CaCl2
@0.70# @2.36# 3.78* Gabalong soil; pH 5.9; BE [email protected]# 0.01 M CaCl2
@0.14# @2.32# 1.13* Perth soil; pH 5.9; BE [email protected]# 0.01 M CaCl2
@0.44# @2.41# 1.86* Tammin soil; pH 5.9; BE [email protected]# 0.01 M CaCl2
1.92° @3.14# 47.5 33.2 20.3 10.5* Melfort soil; pH 5.9 25 BE 260~0.95! @6.09#1.43° 53.3 27.5 19.2 6.46* Weybum soil; pH 6.5 25 BE 260~0.55! @3.75#1.13° 5.3 25.3 69.5 4.15* Regina soil; pH 7.7 25 BE 260~0.70! @2.41#1.12° 69.3 12.3 18.5 4.07* Indian Head soil; pH 7.8 25 BE 260~0.78! @2.36#0.84° 81.6 10.4 8.0 1.77* Asquith soil; pH 7.5 25 BE 260~0.63! @1.03#0.45° 15.9 0.31 Greenhouse soil; SA~N2!56 m2/g; 10 BE 245~0.78! pH 8.1; CE53.8 me/100 cm3;
0.02 M CaCl20.35°~0.76!
Idem 25 245
20.85°~1.93!
Idem 40 245
0.61° Idem; 25 245~0.66! 0.02 M CaCl210.06 M NH4Cl0.86° 15.9 0.85 Greenhouse soil; SA~N2!512 m2/g; 10 BE 245~0.63! pH 7.8; CE513.1 me/100 cm3;
0.02 M CaCl20.71°~0.81!
Idem 25 245
0.55°~0.84!
Idem 40 245
0.93° Idem; 25 245~0.71! 0.02 M CaCl210.06 M NH4Cl0.82° 15.9 0.67 Greenhouse soil; SA~N2!510 m2/g; 10 BE 245
J. Phys. Chem. Ref. Data, Vol. 30, No. 1, 2001

352352 DELLE SITE
TABLE 8. Sorption coefficients for pesticides—Continued
log Kd
log Kf0
(1/n) log Koc
Sorbent composition~%!Other sorbent and solution data;
prediction procedureTemp.~°C! Meth. Ref.Sand Silt Clay OC
~0.77! pH 7.9; CE59.4 me/100 cm3;0.02 M CaCl2
0.63°~0.77!
Idem 25 245
0.42°~0.68!
Idem 25 245
0.91° Idem~0.67! 0.02 M CaCl210.06 M NH4Cl0.70° 15.9 0.45 Greenhouse soil; SA~N2!58 m2/g; 10 BE 245~0.61! pH 8.1; CE56.3 me/100 cm3;
0.02 M CaCl20.49°~0.69!
Idem 25 245
0.34°~0.68!
Idem 40 245
0.83° Idem; 25 245~0.52! 0.02 M CaCl210.06 M NH4Cl0.43 @2.15# 66.0 18.4 15.6 1.93 Begbroke soil; pH 7.1;
0.1 M CaCl2
22 BE 638
2.43° 7 10 10 36.5 Sunway farm light peat;pH 5.2; CE560 me/100 g
22 BE 259
1.88° 45.5 15.9 6.6 12.0 Great House E.H.F. soil;pH 6.3; CE518 me/100 g
22 BE 259
1.72° 23 24.4 28.6 11.7 Toll Farm heavy peat; pH 7.4;CE541 me/100 g
22 BE 259
1.20° 34.0 33.4 32.6 3.69 Trawscoed E.H.F. soil; pH 6.2;CE512 me/100 g
22 BE 259
1.13° 66.0 18.4 15.6 1.93 Weed Res. soil; pH 7.1;CE511 me/100 g
22 BE 259
1.01° 36.0 40.4 23.6 1.76 Rosemaunde E.H.F. soil;pH 6.7; CE514 me/100 g
22 BE 259
1.40° 44.0 33.4 22.6 3.45 Liscombe E.H.F. soil; pH 6.2;CE513 me/100 g
22 BE 259
1.08° 40.0 26.4 33.6 3.09 Bridget’s E.H.F. soil; pH 8.0;CE524 me/100 g
22 BE 259
1.18° 40.0 20.4 39.6 2.08 Boxworth E.H.F. soil; pH 7.9;CE522 me/100 g
22 BE 259
1.15° 42.0 23.4 34.6 1.54 Terrington E.H.F. soil; pH 8.0;CE515 me/100 g
22 BE 259
1.00° 71.0 13.4 15.6 1.50 Kirton E.H.F. soil; pH 7.6;CE513 me/100 g
22 BE 259
0.67 @2.51# 74.4 19.5 6.1 2.5* Aguadilla soil; pH 7.4; BE [email protected]# CE510 me/100 g; 0.01 M CaCl2
0.52 @2.65# 27.6 35.6 36.8 1.3* Aguirre soil; pH 9.0; BE [email protected]# CE514.3 me/100 g; 0.01 M CaCl2
0.67 @2.40# 14.9 39.3 45.8 3.2* Alonso soil; pH 5.1; BE [email protected]# CE513.8 me/100 g; 0.01 M CaCl2
0.73 @2.40# 49.2 28.8 22.0 3.7* Altura soil; pH 8.0; BE [email protected]# CE527.6 me/100 g; 0.01 M CaCl2
0.36 @2.36# 68.1 4.4 27.5 1.7* Bayamon soil; pH 4.7; BE [email protected]# CE55.0 me/100 g; 0.01 M CaCl2
2.56 @3.24# 36.0 36.0 28.0 36.0* Cano Tiburones soil; pH 5.5; BE [email protected]# CE586.0 me/100 g; 0.01 M CaCl2
0.27 @2.23# 6.6 28.9 64.5 1.9* Catalina soil; pH 4.7; BE [email protected]# CE511.8 me/100 g; 0.01 M CaCl2
0.59 @2.50# 89.0 7.3 2.08 2.1* Catano soil; pH 7.9; BE [email protected]# CE56.9 me/100 g; 0.01 M CaCl2
0.47 @2.41# 58.8 23.4 17.8 2.0* Cayagua` soil; pH 5.2; BE [email protected]# CE57.3 me/100 g; 0.01 M CaCl2
1.09 @2.64# 13.3 34.8 51.9 4.9* Cialitos soil; pH 5.4; BE [email protected]# CE518.6 me/100 g; 0.01 M CaCl2
1.09 @2.75# 22.7 37.4 39.9 3.7* Coloso soil; pH 5.7; BE 256
J. Phys. Chem. Ref. Data, Vol. 30, No. 1, 2001

353353SORPTION OF ORGANIC COMPOUNDS
TABLE 8. Sorption coefficients for pesticides—Continued
log Kd
log Kf0
(1/n) log Koc
Sorbent composition~%!Other sorbent and solution data;
prediction procedureTemp.~°C! Meth. Ref.Sand Silt Clay OC
@2.15# CE523.0 me/100 g; 0.01 M CaCl2
0.97 @2.70# 23.4 24.8 51.8 3.2* Coto soil; pH 7.7; BE [email protected]# CE514.0 me/100 g; 0.01 M CaCl2
0.77 @2.47# 39.1 29.7 32.2 3.4* Fe soil; pH 7.5; BE [email protected]# CE527.6 me/100 g; 0.01 M CaCl2
1.13 @2.85# 15.0 50.7 34.3 3.3* Fortuna soil; pH 5.4; BE [email protected]# CE523.3 me/100 g; 0.01 M CaCl2
0.84 @2.76# 15.5 32.5 52.0 2.1* Fraternidad soil; pH 6.3; BE [email protected]# CE536.0 me/100 g; 0.01 M CaCl2
1.20 @2.81# 11.1 23.8 65.1 4.2* Fraternidad~Lajas! soil; pH 5.9; BE [email protected]# CE558.0 me/100 g; 0.01 M CaCl2
0.97 @2.53# 6.4 19.6 74.0 4.8* Guanica soil; pH 8.1; BE [email protected]# CE552.1 me/100 g; 0.01 M CaCl2
0.33 @2.33# 10.1 50.9 39.0 1.7* Humata soil; pH 4.5; BE [email protected]# CE510.1 me/100 g; 0.01 M CaCl2
1.08 @2.80# 26.6 53.5 20.9 3.3* Josefa soil; pH 6.0; BE [email protected]# CE516.8 me/100 g; 0.01 M CaCl2
1.00 @2.81# 15.2 41.6 43.2 2.7* Juncos soil; pH 6.2; BE [email protected]# CE513.4 me/100 g; 0.01 M CaCl2
1.16 @2.81# 19.9 33.4 46.7 3.9* Mabı soil; pH 7.0; BE [email protected]# CE555.2 me/100 g; 0.01 M CaCl2
1.01 @2.56# 22.7 40.7 36.6 4.9* Mabı soil; pH 5.7; BE [email protected]# CE531.0 me/100 g; 0.01 M CaCl2
0.74 @2.59# 14.9 42.8 2.38 2.4* Mercedita soil; pH 8.1; BE [email protected]# CE519.9 me/100 g; 0.01 M CaCl2
1.08 @2.74# 26.3 27.7 46.0 3.8* Moca soil; pH 5.8; BE [email protected]# CE531.0 me/100 g; 0.01 M CaCl2
0.81 @2.53# 28.0 47.0 25.0 3.3* Mucara soil; pH 5.8; BE [email protected]# CE519.6 me/100 g; 0.01 M CaCl2
1.18 @2.69# 22.8 49.2 28.0 5.3* Nipe soil; pH 5.7; BE [email protected]# CE511.9 me/100 g; 0.01 M CaCl2
0.67 @2.61# 59.4 28.2 12.4 2.0* Pandura soil; pH 5.7; BE [email protected]# CE57.7 me/100 g; 0.01 M CaCl2
0.56 @2.25# 13.4 43.6 43.0 3.5* Rio Piedras soil; pH 4.9; BE [email protected]# CE511.5 me/100 g; 0.01 M CaCl2
1.20 @3.00# 24.3 49.7 26.0 2.7* San Anton soil; pH 6.7; BE [email protected]# CE526.1 me/100 g; 0.01 M CaCl2
0.37 @2.46# 73.4 19.4 7.2 1.4* Talante soil; pH 5.1; BE [email protected]# CE54.0 me/100 g; 0.01 M CaCl2
0.55 @2.49# 41.5 38.3 20.2 2.0* Toa soil; pH 5.3; BE [email protected]# CE513.0 me/100 g; 0.01 M CaCl2
0.10 @2.56# 60.9 25.1 14.0 0.6* Toa soil; pH 6.0; BE [email protected]# CE58.0 me/100 g; 0.01 M CaCl2
0.80 @2.49# 73.7 12.6 13.7 3.5* Vega Alta soil; pH 5.0 BE [email protected]# CE55.6 me/100 g; 0.01 M CaCl2
0.71 @2.59# 45.2 36.8 18.0 2.3* Via soil; pH 5.1; BE [email protected]# CE539.9 me/100 g; 0.01 M CaCl2
@0.65# @2.66# 10 33.6 56.4 0.97 Gerif soil; CE555.4 me/100 g;pH 8.7; SA~W!5150.7 m2/g;
25 BE 271
@0.24# @2.64# 22.3 26.1 41.6 0.40 Gash soil; CE545.6 me/100 g;pH 8.6; SA~W!5105.0 m2/g
25 BE 271
@0.18# @2.72# 40.5 22.4 37.1 0.29 Gurier soil; CE526.0 me/100 g;pH 9.3; SA~W!5104.1 m2/g;
25 BE 271
@0.32# @2.66# 40.8 18.6 40.6 0.46 Kassala soil; CE530.4 me/100 g;pH 9.2; SA~W!566.1 m2/g
25 BE 271
1.02 @2.98# 16.2 1.11 Conventional farm soil;pH 5.42; 0.004 M CaSO4
25 BE 647
0.88 @2.88# 19.7 1.00 Idem; pH 5.35 6460.48 @2.67# 24.7 0.64 Idem; pH 7.12 6461.45 @3.18# 16.5 1.85 Low-input farm soil; pH 5.53;
0.004 M CaSO4
BE 646
1.26 @3.16# 16.6 1.26 Idem; pH 5.47 646
J. Phys. Chem. Ref. Data, Vol. 30, No. 1, 2001

354354 DELLE SITE
TABLE 8. Sorption coefficients for pesticides—Continued
log Kd
log Kf0
(1/n) log Koc
Sorbent composition~%!Other sorbent and solution data;
prediction procedureTemp.~°C! Meth. Ref.Sand Silt Clay OC
1.01 @3.08# 19.1 0.86 Idem; pH 6.32 6461.16° 10.5 62.5 27 2.15* Monona soil; pH 6.7; 24 BE 644~0.77! @1.25# CE520.7 me/100 g0.81° 90.5 4.5 5 0.75* Valentine soil; pH 6.75; 24 BE 644~0.74! @0.44#
2.63av 6– 3– 3– 0.8– 5 soils; 0.01 N CaCl2 25 BE 45594 66 35 3.9
2.62av 5 soils; extrapolated from logKd– f c
plots ~methanol–water!25 BE 455
2.55av 5 soils; extrapolated from logKd– f c
plots ~acetone–water!25 BE 455
1.39° 55 20 25 3.34 Webster soil; pH 7.3; BE 192~0.75! CE522 me/100 g0.16°~0.82!
93.8 3.0 3.2 0.2 Eustis soil; ph 5.7; 0.01 N CaCl2 25 BE 452
0.84° @2.56# 1 48 51 1.9 Mockingbird Can. L. sed.; pH 6.7; 25 BE 257~0.92! CE539 me/100 g; 0.01 M CaCl2
0.99° 19 27 54 1.8 San Joaquin Marsh sed.; pH 6.7; 25 BE 257~0.80! CE544 me/100 g; 0.01 M CaCl2
1.04° @3.08# 4 30 66 0.91 Baldwin Lake sed.; pH 7.6; 25 BE 257~0.89! CE524 me/100 g; 0.01 M CaCl2
1.36° 4 53 43 2.3 Jenks Lake sed; pH 5.4; 25 BE 257~0.76! CE533 me/100 g; 0.01 M CaCl2
1.36° 8 38 55 3.6 Hill Slough~Delta! sed.; pH 6.2; 25 BE 257~0.79! CE539 me/100 g; 0.01 M CaCl2
1.67° 20 29 51 6.2 Big Bear Lake sed.; pH 7.3; 25 BE 257~0.71! CE557 me/100 g; 0.01 M CaCl2
1.75° 11 36 53 9.3 Clear Lake sed.; pH 6.0; 25 BE 257~0.82! CE553 me/100 g; 0.01 M CaCl2
1.99° @2.71# 23 52 25 19 Castle Lake sed.; pH 5.0; 25 BE 257~0.90! CE548 me/100 g; 0.01 M CaCl2
0.60° 2.1* Keyport soil; silt loam; pH 5.4; BE 641~1.25! @1.22# aver. particle size55.6mm0.38° @2.77# 0.7* Cecil soil; loamy sand; pH 5.8; BE 641~0.95! @0.41# aver. particle size510.5
@2.21#av 1.09* – 4 soils; silt loam; pH 6.1–7.5. 20 BE 1204.25* 0.01 M CaCl2
2.59av 38 48 14 0.68 Commerce soil; pH 6.7 BE 575~three 56 30 14 1.12 Tracy soil; pH 6.2 BE 575soils! 12 56 32 2.01 Catlin soil; pH 6.2 BE 575
0.825 2.95 0.74 Eustis soil~,250 mm!; Kd BE 457extrapolated from logKd– f c plots~methanol-water!. 0.01 M CaCl2
MD
2.48 C18 column RPLC 5732.60 Soil; experimental~literature! 2172.58av 84 soils~literature! 872.47av 156 literature data 5621.58, Correlation logKoc– logKow 962.423.06 Correlation logKoc– logS 962.41 Correlation logKoc– logS(mp) 962.75 Correlation logKoc– logS 564
Endrin
3.53° @3.89# 52 34 14 75.3* Soil; organic; pH 6.1 BE 264~1.08! @43.7#2.41° @4.20# 71 22 7 2.8* Big Creek sediment; pH 6.6 BE 264~0.99! @1.62#2.05° @3.89# 56 30 14 2.5* Beverly soil; pH 6.8 BE 264~1.12! @1.45#1.76° @4.15# 91.5 1.5 7 0.7* Plainfield soil; pH 7.0 BE 264~1.03! @0.41#
4.41– DOC in porewater of Lake RS 547
J. Phys. Chem. Ref. Data, Vol. 30, No. 1, 2001

355355SORPTION OF ORGANIC COMPOUNDS
TABLE 8. Sorption coefficients for pesticides—Continued
log Kd
log Kf0
(1/n) log Koc
Sorbent composition~%!Other sorbent and solution data;
prediction procedureTemp.~°C! Meth. Ref.Sand Silt Clay OC
5.14 Michigan~LM ! sediment afterfiltration
4.44– DOC in porewater of LM sediment RS 5474.70 after centrifugation3.25– DOC in elutriate of LM sediment RS 5474.91 after filtration4.46– DOC in elutriate of LM sediment RS 5474.55 after centrifugation4.53 Correlation logKoc– logS 564
EPTC
20.24 @1.68# 7.0 2.1* Dobrokoz soil; SA~N2!53.7 m2/g; BE [email protected]# SA~Me!538.2 m2/g; 0.01 M CaCl2
20.10 @1.96# 10.3 1.5* Janoshaza soil; SA~N2!55.8 m2/g; BE [email protected]# SA~Me!540.6 m2/g; 0.01 M CaCl2
0.20 @2.06# 14.0 2.4* Nagybaracska soil; BE [email protected]# SA~N2!59.6 m2/g;
SA~Me!554.4 m2/g; 0.01 M CaCl20.18 @2.13# 16.0 1.9* Simonfa soil; SA~N2!510.1 m2/g; BE 71
@1.10# SA~Me!555.8 m2/g; 0.01 M CaCl20.08 @2.11# 26.5 1.6* Aszod soil; SA~N2!514.0 m2/g; BE 71
@0.93# SA~Me!583.9 m2/g; 0.01 M CaCl20.54 @2.04# 48.0 5.5* Vizesfas soil; SA~N2!518.3 m2/g; BE 71
@3.19# SA~Me!5175 m2/g; 0.01 M CaCl220.14° @2.22# 67.1 25.8 7.1 0.43 Hanford soil; pH 6.05; 25 BE 528~0.98! CE55.95 cmol/kg; 0.01 M CaCl2
20.10° 82.0 13.5 4.5 0.33 Tujunga soil; pH 6.30; 25 BE 528~0.83! CE50.45 cmol/kg; 0.01 M CaCl2
2.25 @2.60# 76* OM from peat soil; 0.01 M BaCl2 BE 270@44#
1.58* Peat humic acid; 0.01 M BaCl2 BE 2702.38 Soil; experimental~literature! 2172.23 Correlation logKoc– logS 5642.59 Correlation logKom– logS(563) 5282.52 Correlation logKoc– logKow(87) 5282.80 Correlation logKoc– logKow(217) 528
Fenamiphos
1.34° 75 1.3 Eurosol-1; c; pH 5.1; BE 583~0.80! 0.01 M CaCl20.82° 22.6 3.7 Eurosol-2; sil; pH 7.4; BE 583~0.81! 0.01 M CaCl20.88° 17.0 3.45 Eurosol-3; 1; pH 5.2; BE 583~0.86! 0.01 M CaCl20.51° 2.32 20.3 1.55 Eurosol-4; si; pH 6.5; BE 583~0.93! 0.01 M CaCl21.94° 6.0 9.25 Eurosol-5; 1s; pH 3.2; BE 583~0.87! 0.01 M CaCl2
@2.52# 3.53* Batcombe si; pH 6.1 20 BE [email protected]# 0.01 M CaCl2
2.08 Correlation logKoc– logS 564
Fenitrothion
1.85°~1.16!
100 Na-montmorillonite~,2 mm! 20 BE 246
1.81°~1.95!
100 Ca-montmorillonite~,2 mm! 20 BE 246
2.87°~1.77!
100 Fe-montmorillonite~,2 mm! 20 BE 246
1.40 2.77 18.9 26.3 54.8 4.24 Tsukuba soil; pH 6.5;0.01 M CaCl2
25 BE 642
J. Phys. Chem. Ref. Data, Vol. 30, No. 1, 2001

356356 DELLE SITE
TABLE 8. Sorption coefficients for pesticides—Continued
log Kd
log Kf0
(1/n) log Koc
Sorbent composition~%!Other sorbent and solution data;
prediction procedureTemp.~°C! Meth. Ref.Sand Silt Clay OC
1.49°~1.07!
Idem 25 BE 642
0.54 2.40 23.1 15.4 61.5 1.35 Kanuma soil; pH 5.7;0.01 M CaCl2
25 BE 642
0.53°~0.99!
Idem 25 BE 642
2.83 Correlation logKoc– logS 564
Fensulfothion
1.56° 75 1.3 Eurosol-1; c; pH 5.1; BE 583~0.85! 0.01 M CaCl20.83° 2.27 22.6 3.7 Eurosol-2; sil; pH 7.4; BE 583~0.93! 0.01 M CaCl20.65° 2.11 17.0 3.45 Eurosol-3; 1; pH 5.2; BE 583~0.93! 0.01 M CaCl20.45° 2.26 20.3 1.55 Eurosol-4; si; pH 6.5; BE 583~0.89! 0.01 M CaCl21.81° 2.85 6.0 9.25 Eurosol-5; 1s; pH 3.2; BE 583~1.01! 0.01 M CaCl20.15° 2.54 91.5 1.5 7 0.7* Plainfield soil; pH 6.9 20 BE 261~0.97! @0.41#0.58° 2.46 71 22 7 2.3* Big Creek sediment; pH 6.5 20 BE 261~1.08! @1.33#0.83° 77 15 8 3.9* Bondhead soil; pH 6.9 20 BE 261~0.82! @2.26#1.71° 2.38 52 34 14 36.7* Muck soil; pH 6.3 20 BE 261~0.87! @21.3#
Fenthion
2.46° 4.35 75 1.3 Eurosol-1; c; pH 5.1; BE 583~1.12! 0.01 M CaCl22.12° 22.6 3.7 Eurosol-2; sil; pH 7.4; BE 583~1.15! 0.01 M CaCl22.00° 3.46 17.0 3.45 Eurosol-3; 1; pH 5.2; BE 583~1.01! 0.01 M CaCl21.34° 3.15 20.3 1.55 Eurosol-4; si; pH 6.5; BE 583~0.91! 0.01 M CaCl22.61° 6.0 9.25 Eurosol-5; 1s; pH 3.2; BE 583~0.82! 0.01 M CaCl2
2.68 Correlation logKoc– logS 564
Fenuron
1.15° 100 Na–montmorillonite~1–0.2mm!; 25 BE 250~1.00! pH 6.80; CE587.0 me/100 g2.06° 100 H–montmorillonite~1–0.2mm!; 25 BE 250~0.82! pH 3.35; CE573.5 me/100 g0.88 100 Montmorillonite-H~Al ! ~,0.2 mm;!
pH 3.53.5 BE 244
1.89 100 Bentonite–H~Al ! ~,0.2 mm!;pH 3.5; CE50.72 me/g
3.5 BE 244
0.83 100 Bentonite–Na~,0.2 mm!; pH 6.7;CE50.83 me/g; SA~E!5758 m2/g;Salt conc.50.1 N
3.5 BE 244
0.94 100 Bentonite-Ca~,0.2 mm!; pH 6.7;CE50.88 me/g; Salt conc.50.1 N
3.5 BE 244
1.07 100 Bentonite-Mg~,0.2 mm!; pH 6.7;CE50.84 me/g; Salt conc.50.1 N
3.5 BE 244
0.73av 100 Bentonite-Na~,0.2 mm!; pH 6.7;CE50.83 me/g; SA~E!5758 m2/g;Salt conc.50.005–1 N
26.5 BE 244
1.21 100 Idem; Salt conc.53 N 26.5 BE 244
J. Phys. Chem. Ref. Data, Vol. 30, No. 1, 2001

357357SORPTION OF ORGANIC COMPOUNDS
TABLE 8. Sorption coefficients for pesticides—Continued
log Kd
log Kf0
(1/n) log Koc
Sorbent composition~%!Other sorbent and solution data;
prediction procedureTemp.~°C! Meth. Ref.Sand Silt Clay OC
0.89av 100 Bentonite-Ca~,0.2 mm!; pH 6.7CE50.88 ne/g;Salt conc.50.005–1 N
26.5 BE 244
1.49 100 Idem; Salt conc.53 N 26.5 BE 2440.94 100 Bentonite-Mg~,0.2 mm!; pH 6.7
CE50.84 me/g;Salt conc.50.005-1 N
26.5 BE 244
@1.12#av 1.09*- 4 soils; sil; pH 6.1–7.5. 20 BE 1204.25* 0.01 M CaCl2
@0.08# @1.62# 4.54* Warwick, Qld, soil; pH 6.3; BE [email protected]# 0.01 M CaCl2
@20.39# @1.24# 4.07* Rutherglen, Vic., soil; pH 4.8; BE [email protected]# 0.01 M CaCl2
@20.62# @1.35# 1.86* Wagga, N.S.W., soil; pH 5.1; BE [email protected]# 0.01 M CaCl2
@20.47# @1.32# 2.81* Turretfield, S.A., soil; pH 5.2; BE [email protected]# 0.01 M CaCl2
@21.06# @1.14# 1.09* Warracknabeal, Vic., soil; pH 8.0; BE [email protected]# 0.01 M CaCl2
@20.23# @1.50# 3.20* Warracknabeal, Vic., soil; pH 8.4; BE [email protected]# 0.01 M CaCl2
@20.07# @1.35# 6.62* Balkuling soil; pH 5.6; BE [email protected]# 0.01 M CaCl2
@20.56# @1.35# 2.14* Kojonup soil; pH 5.5; BE [email protected]# 0.01 M CaCl2
@20.43# @1.66# 1.42* Warranine soil; pH 6.5; BE [email protected]# 0.01 M CaCl2
@20.33# @1.19# 5.17* Yalanbee soil; pH 6.4; BE [email protected]# 0.01 M CaCl2
@20.26# @1.52# 2.85* Avondale soil; pH 5.9; BE [email protected]# 0.01 M CaCl2
@20.52# @1.52# 1.58* Badgingarra soil; pH 6.3; BE [email protected]# 0.01 M CaCl2
@21.54# @1.42# 0.19* Badgingarra soil; pH 6.3; BE [email protected]# 0.01 M CaCl2
@20.53# @1.24# 2.92* Beverley soil; BE [email protected]# 0.01 M CaCl2
@20.16# @1.50# 3.78* Gabalong soil; pH 5.9; BE [email protected]# 0.01 M CaCl2
@20.54# @1.64# 1.13* Perth soil; pH 5.9; BE [email protected]# 0.01 M CaCl2
@20.73# @1.24# 1.86* Tammin soil; pH 5.9; BE [email protected]# 0.01 M CaCl2
0.91° 47.5 33.2 20.3 10.5* Melfort soil; pH 5.9 25 BE 260~0.68! @6.09#0.04° @1.47# 53.3 27.5 19.2 6.46* Weyburn soil; pH 6.5 25 BE 260~0.92! @3.75#20.10° @1.54# 5.3 25.3 69.5 4.15* Regina soil; pH 7.7 25 BE 260~0.93! @2.41#0.20° 69.3 12.3 18.5 4.07* Indian Head soil; pH 7.8 25 BE 260~0.85! @2.36#20.52° @1.52# 81.6 10.4 8.0 1.77* Asquith soil; pH 7.5 25 BE 260~0.97! @1.03#1.08° @1.52# 7 10 10 36.5 Sunway farm light peat;
pH 5.2; CE560 me/100 g22 BE 259
0.67° @1.59# 45.5 15.9 6.6 12.0 Great House E.H.F. soil;pH 6.3; CE518 me/100 g
22 BE 259
0.46° @1.39# 23 24.4 28.6 11.7 Toll Farm heavy peat; pH 7.4;CE541 me/100 g
22 BE 259
20.14° @1.30# 34.0 33.4 32.6 3.69 Trawscoed E.H.F. soil;pH 6.2; CE512 me/100 g
22 BE 259
20.36° @1.36# 66.0 18.4 15.6 1.93 Weed Res. soil; pH 7.1;CE511 me/100 g
22 BE 259
J. Phys. Chem. Ref. Data, Vol. 30, No. 1, 2001

358358 DELLE SITE
TABLE 8. Sorption coefficients for pesticides—Continued
log Kd
log Kf0
(1/n) log Koc
Sorbent composition~%!Other sorbent and solution data;
prediction procedureTemp.~°C! Meth. Ref.Sand Silt Clay OC
20.47° @1.29# 36.0 40.4 23.6 1.76 Rosemaunde E.H.F. soil;pH 6.7; CE514 me/100 g
22 BE 259
1.43 Soil; experimental~literature! 2171.63av 10 soils~literature! 870.61 Correlation logKoc– logKow 961.80,1.86
Correlation logKoc– logS 96
0.72,0.84
Correlation logKoc– logS(mp) 96
1.67 Correlation logKoc– logS 564
Fluometuron
20.77 @1.62# 5.0 0.70* Eufala 1 fine s soil; 23 BE [email protected]# pH 6.4; 0.01 N CaCl2
20.88 @1.52# 0.70*@0.41#
Idem; 0.5 N CaCl2 300
20.52 @1.32# 17.5 2.50* Norge 1 soil; pH 6.1; 23 BE [email protected]# 0.01 N CaCl2
20.56 @1.29# 2.50*@1.45#
Idem; pH 5.9; 0.5 N CaCl2 300
20.51° @1.50# 46 38 16 1.7* Norge soil; pH 6.6; BE 507~0.93! @0.99# 9.2 meq /100 g; 0.01 N CaCl2
0.34 @1.72# 2.9 68.7 28.4 7.1* Lanton soil; pH 6.4; BE [email protected]# CE532.8 me/100 g
@1.82#av 1.09*- 4 soils; sil; pH 6.1–7.5; 20 BE 1204.25* 0.01 M CaCl2
0.19av @2.43#av 23.4 67.5 9.1 1.1* Taloka soil~10–20 cm!; pH 5.2; 20 BE 285~two @0.64# CE511 me/100 g; 0.01 N CaCl2
soils! 22.0 62.2 15.8 0.90* Roxana soil~10–20 cm!; pH 6.8; 20 BE [email protected]# CE519 me/100 g; 0.01 M CaCl2
20.15av @2.30#av 24.2 62.0 13.8 0.70* Taloka soil~40–50 cm!; pH 5.5; 20 BE 285~two @0.41# CE513 me/100 g; 0.01 M CaCl2
soils! 30.7 54.7 14.6 0.50* Roxana soil~40–50 cm!; pH 7.1; 20 BE [email protected]# CE519 me/100 g; 0.01 M CaCl2
20.4° @1.61# 46.0 37.6 16.4 1.7* Norge soil; Ca-saturated; pH 6.6; 23 BE 476~0.98! @0.99# CE59.2 me/100 g0.18°~0.74!
55.4 28.3 16.3 1.6* Calcic Luvisol; pH 5.5 25 BE 654
0.66°~0.74!
65.4 21.0 13.6 10.2 Humic Cambisol; pH 5.0 25 BE 654
0.35 @2.28# 6 79 15 2.0* Lexington soil~0–4 cm!; no- BE [email protected]# tillage, no cover crop; pH 5.1;
CE58.8 cmol/kg; 0.01 M CaCl2
0.22 @2.46# 1.0* Idem ~4–8 cm!; pH 5.5; [email protected]# CE57.3 cmol/kg
0.14 @2.42# 6 78 16 0.9*@0.52#
Idem ~8–15 cm!; pH 6.5 655
0.23 @2.36# 7 80 13 1.3* Lexington soil~0–4 cm!; convent. BE [email protected]# tillage, no cover crop; pH 5.5;
CE57.7 cmol/kg; 0.01 M CaCl2
0.33 @2.46# 6 80 14 Idem~4–8 cm!; pH 5.7;CE57.5 cmol/kg
655
0.14 @2.33# 7 78 15 1.1*@0.64#
Idem ~8–15 cm!; pH 6.3 655
0.47 @2.31# 7 78 15 2.5* Lexington soil~0–4 cm!; no- BE [email protected]# tillage, vetch cover crop; pH 4.7;
CE59.6 cmol/kg; 0.01 M CaCl2
0.02 @2.21# 1.1* Idem ~4–8 cm!; pH 4.9; [email protected]# CE57.2 cmol/kg
0.11 @2.39# 0.9*@0.52#
Idem ~8–15 cm!; pH 5.7 655
0.33 @2.39# 6 80 14 1.5* Lexington soil~0–4 cm!; convent. BE 655
J. Phys. Chem. Ref. Data, Vol. 30, No. 1, 2001
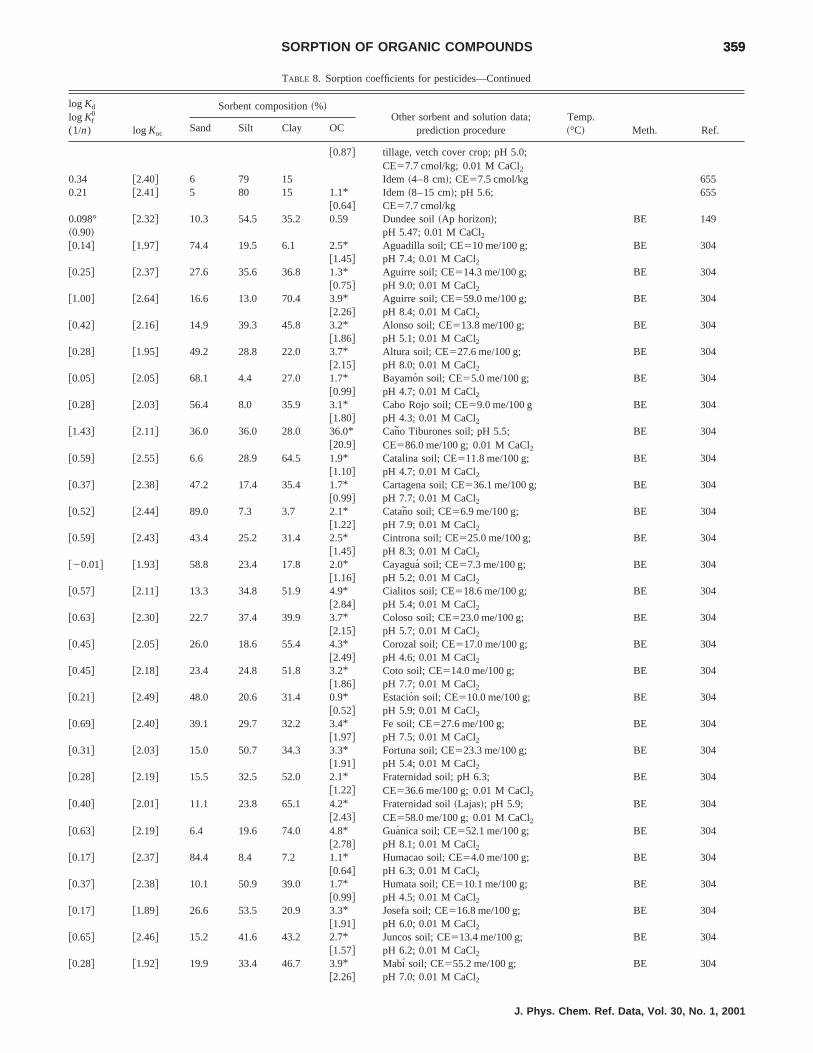
359359SORPTION OF ORGANIC COMPOUNDS
TABLE 8. Sorption coefficients for pesticides—Continued
log Kd
log Kf0
(1/n) log Koc
Sorbent composition~%!Other sorbent and solution data;
prediction procedureTemp.~°C! Meth. Ref.Sand Silt Clay OC
@0.87# tillage, vetch cover crop; pH 5.0;CE57.7 cmol/kg; 0.01 M CaCl2
0.34 @2.40# 6 79 15 Idem~4–8 cm!; CE57.5 cmol/kg 6550.21 @2.41# 5 80 15 1.1* Idem ~8–15 cm!; pH 5.6; 655
@0.64# CE57.7 cmol/kg0.098° @2.32# 10.3 54.5 35.2 0.59 Dundee soil~Ap horizon!; BE 149~0.90! pH 5.47; 0.01 M CaCl2
@0.14# @1.97# 74.4 19.5 6.1 2.5* Aguadilla soil; CE510 me/100 g; BE [email protected]# pH 7.4; 0.01 M CaCl2
@0.25# @2.37# 27.6 35.6 36.8 1.3* Aguirre soil; CE514.3 me/100 g; BE [email protected]# pH 9.0; 0.01 M CaCl2
@1.00# @2.64# 16.6 13.0 70.4 3.9* Aguirre soil; CE559.0 me/100 g; BE [email protected]# pH 8.4; 0.01 M CaCl2
@0.42# @2.16# 14.9 39.3 45.8 3.2* Alonso soil; CE513.8 me/100 g; BE [email protected]# pH 5.1; 0.01 M CaCl2
@0.28# @1.95# 49.2 28.8 22.0 3.7* Altura soil; CE527.6 me/100 g; BE [email protected]# pH 8.0; 0.01 M CaCl2
@0.05# @2.05# 68.1 4.4 27.0 1.7* Bayamon soil; CE55.0 me/100 g; BE [email protected]# pH 4.7; 0.01 M CaCl2
@0.28# @2.03# 56.4 8.0 35.9 3.1* Cabo Rojo soil; CE59.0 me/100 g BE [email protected]# pH 4.3; 0.01 M CaCl2
@1.43# @2.11# 36.0 36.0 28.0 36.0* Cano Tiburones soil; pH 5.5; BE [email protected]# CE586.0 me/100 g; 0.01 M CaCl2
@0.59# @2.55# 6.6 28.9 64.5 1.9* Catalina soil; CE511.8 me/100 g; BE [email protected]# pH 4.7; 0.01 M CaCl2
@0.37# @2.38# 47.2 17.4 35.4 1.7* Cartagena soil; CE536.1 me/100 g; BE [email protected]# pH 7.7; 0.01 M CaCl2
@0.52# @2.44# 89.0 7.3 3.7 2.1* Catano soil; CE56.9 me/100 g; BE [email protected]# pH 7.9; 0.01 M CaCl2
@0.59# @2.43# 43.4 25.2 31.4 2.5* Cintrona soil; CE525.0 me/100 g; BE [email protected]# pH 8.3; 0.01 M CaCl2
@20.01# @1.93# 58.8 23.4 17.8 2.0* Cayagua´ soil; CE57.3 me/100 g; BE [email protected]# pH 5.2; 0.01 M CaCl2
@0.57# @2.11# 13.3 34.8 51.9 4.9* Cialitos soil; CE518.6 me/100 g; BE [email protected]# pH 5.4; 0.01 M CaCl2
@0.63# @2.30# 22.7 37.4 39.9 3.7* Coloso soil; CE523.0 me/100 g; BE [email protected]# pH 5.7; 0.01 M CaCl2
@0.45# @2.05# 26.0 18.6 55.4 4.3* Corozal soil; CE517.0 me/100 g; BE [email protected]# pH 4.6; 0.01 M CaCl2
@0.45# @2.18# 23.4 24.8 51.8 3.2* Coto soil; CE514.0 me/100 g; BE [email protected]# pH 7.7; 0.01 M CaCl2
@0.21# @2.49# 48.0 20.6 31.4 0.9* Estacion soil; CE510.0 me/100 g; BE [email protected]# pH 5.9; 0.01 M CaCl2
@0.69# @2.40# 39.1 29.7 32.2 3.4* Fe soil; CE527.6 me/100 g; BE [email protected]# pH 7.5; 0.01 M CaCl2
@0.31# @2.03# 15.0 50.7 34.3 3.3* Fortuna soil; CE523.3 me/100 g; BE [email protected]# pH 5.4; 0.01 M CaCl2
@0.28# @2.19# 15.5 32.5 52.0 2.1* Fraternidad soil; pH 6.3; BE [email protected]# CE536.6 me/100 g; 0.01 M CaCl2
@0.40# @2.01# 11.1 23.8 65.1 4.2* Fraternidad soil~Lajas!; pH 5.9; BE [email protected]# CE558.0 me/100 g; 0.01 M CaCl2
@0.63# @2.19# 6.4 19.6 74.0 4.8* Guanica soil; CE552.1 me/100 g; BE [email protected]# pH 8.1; 0.01 M CaCl2
@0.17# @2.37# 84.4 8.4 7.2 1.1* Humacao soil; CE54.0 me/100 g; BE [email protected]# pH 6.3; 0.01 M CaCl2
@0.37# @2.38# 10.1 50.9 39.0 1.7* Humata soil; CE510.1 me/100 g; BE [email protected]# pH 4.5; 0.01 M CaCl2
@0.17# @1.89# 26.6 53.5 20.9 3.3* Josefa soil; CE516.8 me/100 g; BE [email protected]# pH 6.0; 0.01 M CaCl2
@0.65# @2.46# 15.2 41.6 43.2 2.7* Juncos soil; CE513.4 me/100 g; BE [email protected]# pH 6.2; 0.01 M CaCl2
@0.28# @1.92# 19.9 33.4 46.7 3.9* Mabı soil; CE555.2 me/100 g; BE [email protected]# pH 7.0; 0.01 M CaCl2
J. Phys. Chem. Ref. Data, Vol. 30, No. 1, 2001

360360 DELLE SITE
TABLE 8. Sorption coefficients for pesticides—Continued
log Kd
log Kf0
(1/n) log Koc
Sorbent composition~%!Other sorbent and solution data;
prediction procedureTemp.~°C! Meth. Ref.Sand Silt Clay OC
@0.73# @2.28# 22.7 40.7 36.6 4.9* Mabı soil; CE531.0 me/100 g; BE [email protected]# pH 5.7; 0.01 M CaCl2
@0.42# @2.32# 76.0 13.4 10.6 2.2* Machete soil; CE58.0 me/100 g; BE [email protected]# pH 6.5; 0.01 M CaCl2
@0.05# @1.90# 14.9 42.8 42.3 2.4* Mercedita soil; CE519.9 me/100 g; BE [email protected]# pH 8.1; 0.01 M CaCl2
@0.61# @2.27# 26.3 27.7 46.0 3.8* Moca soil; CE531.0 me/100 g; BE [email protected]# pH 5.8; 0.01 M CaCl2
@20.06# @1.66# 28.0 47.0 25.0 3.3* Mucara soil; CE519.6 me/100 g; BE [email protected]# pH 5.8; 0.01 M CaCl2
@0.52# @2.03# 22.0 49.2 28.0 5.3* Nipe soil; CE511.9 me/100 g; BE [email protected]# pH 5.7; 0.01 M CaCl2
@0.37# @2.31# 59.4 28.2 12.4 2.0* Pandura soil; CE57.7 me/100 g; BE [email protected]# pH 5.7; 0.01 M CaCl2
@20.06# @1.63# 13.4 43.6 43.0 3.5* Rıo Piedras soil; pH 4.9; BE [email protected]# CE511.5 me/100 g; 0.01 M CaCl2
@0.45# @2.10# 39.0 24.6 36.4 3.9* Sabana Seca soil; pH 7.4; BE [email protected]# CE523.0 me/100 g; 0.01 M CaCl2
@0.57# @2.11# 47.0 24.4 28.6 4.9* San Anton soil; pH 7.4; BE [email protected]# CE528.0 me/100 g; 0.01 M CaCl2
@0.61# @3.53# 57.0 18.6 24.4 2.1* Santa Isabel soil; pH 7.4; BE [email protected]# CE528.0 me/100 g; 0.01 M CaCl2
@0.84# @2.06# 46.0 20.0 34.0 10.4* Soller soil; CE553.0 me/100 g; BE [email protected]# pH 6.9; 0.01 M CaCl2
@0.13# @2.23# 73.4 19.4 7.2 1.4* Talante soil; CE54.0 me/100 g; BE [email protected]# pH 5.1; 0.01 M CaCl2
@0.82# @2.35# 35.0 24.6 40.4 5.1* Toa soil; CE536.0 me/100 g; BE [email protected]# pH 8.0; 0.01 M CaCl2
@0.28# @2.21# 41.5 38.3 20.2 2.0* Toa soil; CE513.0 me/100 g; BE [email protected]# pH 5.3; 0.01 M CaCl2
@20.69# @1.77# 60.9 25.1 14.0 0.6* Toa soil; CE58.0 me/100 g; BE [email protected]# pH 6.0; 0.01 M CaCl2
@0.65# @2.34# 73.7 12.6 13.7 3.5* Vega Alta soil; pH 5.0 BE [email protected]# CE55.6 me/100 g; 0.01 M CaCl2
@0.05# @1.92# 45.2 36.8 18.0 2.3* Vıa soil; CE539.9 me/100 g; BE [email protected]# pH 5.1; 0.01 M CaCl2
@0.40# @2.29# 62.4 19.6 18.0 2.2* Vivı soil; CE514.0 me/100 g; BE [email protected]# pH 4.8; 0.01 M CaCl2
@0.77# @2.35# 15.0 23.4 61.6 4.5* Voladura soil; pH 4.3; BE [email protected]# CE517.7 me/100 g; 0.01 M CaCl2
0.40 @2.28# 4 48 47 2.3* Sharkey soil; pH 6.4; BE [email protected]# 0.01 M CaCl2
20.20 @1.92# 11 74 15 1.3* Dundee soil; pH 5.9; BE [email protected]# 0.01 M CaCl2
20.16 @1.87# 2 80 18 1.6* Loring soil; pH 5.2; BE [email protected]# 0.01 M CaCl2
20.22 2.16 38 50 12 0.72* Beulah soil~0–7.5 cm!; pH 6.8; BE [email protected]# CE59.9 me/100 g; 0.01 M CaCl2
20.28 2.25 35 52 13 0.50* Idem ~7.5–15 cm!; pH 6.9; [email protected]# CE510.3 me/100 g
20.31 2.34 34 51 15 0.38* Idem ~15–30 cm!; pH 7.0; [email protected]# CE514.9 me/100 g
20.33 2.33 30 55 15 0.38* Idem ~30–45 cm!; pH 7.1; [email protected]# CE516.0 me/100 g
20.35 2.37 35 52 13 0.33* Idem ~45–60 cm!; pH 7.2; [email protected]# CE516.6 me/100 g
20.45 2.34 43 46 11 0.28* Idem ~60–90 cm!; pH 7.3; [email protected]# CE516.8 me/100 g
20.26 2.48 39 47 14 0.31* Idem ~90–120 cm!; pH 7.5; [email protected]# CE516.4 me/100 g
2.67 @2.93# 94* OM from peaty muck~Histosol! 24 BE [email protected]# soil; pH 5.5
2.24 Soil; experimental~literature! 217
J. Phys. Chem. Ref. Data, Vol. 30, No. 1, 2001

361361SORPTION OF ORGANIC COMPOUNDS
TABLE 8. Sorption coefficients for pesticides—Continued
log Kd
log Kf0
(1/n) log Koc
Sorbent composition~%!Other sorbent and solution data;
prediction procedureTemp.~°C! Meth. Ref.Sand Silt Clay OC
0.95 Correlation logKoc– logKow 962.87 Correlation logKoc– logS 962.02 Correlation logKoc– logS(mp) 962.57 Cor relation logKoc– logS 564
Heptachlor
3.16 4.90 25 40 35 1.8 Taichung soil; pH 6.8 25 BE 4074.48 Aldrich humic acid 25 SE 4074.48 Correlation logKoc– logS 564
a-Hexachlorocyclohexane
1.45° 79.6 4.8 15.6 0.75* Alluvial soil; pH 6.20; 26 BE 185~1.60! @0.44# CE518.6 me/100 g1.72° 69.6 6.8 23.6 2.88* Lateritic soil; pH 6.30; 26 BE 185~1.26! @1.67# CE542.8 me/100 g1.85° @3.34# 45.6 7.8 45.6 5.52* Pokkali soil; pH 5.2; 26 BE 185~0.94! @3.20# CE519.2 me/100 g2.70° 63.6 6.8 29.6 24.6* Kari soil; pH 3.3; 26 BE 185~1.16! @14.3# CE528.9 me/100 g
4.1 4.1 Lake Ontario sediment trapmaterial
FM 49
3.42 Correlation logKoc– logKow 963.5 Correlation logKoc– logKow(96) 493.90 Correlation logKoc– logS 963.66 Correlation logKoc– logS~mp! 963.53 Correlation logKoc– MCI 598
b-Hexachlorocyclohexane
2.66° @3.55# 22* Ca-Staten peaty muck 20 BE 390~0.95! @12.8#2.64° @3.53# Idem 390~0.99!1.80° 6* Ca-Venado clay 20 BE 390~0.86! @3.5# ~50% Montmorillonite!1.78° Idem 390~0.88!0.60° Ca-bentonite~Montmorillonite! 20 BE 390~0.86!0.65° Idem 390~0.88!0.33° Silica gel; pH 4.4 20 BE 390~0.97!0.21° Idem 390~0.99!0.71° 79.6 4.8 15.6 0.75* Alluvial soil; pH 6.20; 26 BE 185~0.82! @0.44# CE518.6 me/100 g1.60° 69.6 6.8 23.6 2.88* Lateritic soil; pH 6.30; 26 BE 185~1.20! @1.67# CE542.8 me/100 g1.90° 45.6 7.8 45.6 5.52* Pokkali soil; pH 5.2; 26 BE 185~0.80! @3.20# CE519.2 me/100 g2.20° 63.6 6.8 29.6 24.6* Kari soil; pH 3.3; 26 BE 185~0.80! @14.3# CE528.9 me/100 g
3.41 Correlation logKoc– logKow 963.23 Correlation logKoc– logKow 2073.60 Correlation logKoc– logKow 1084.50 Correlation logKoc– logS 963.17 Correlation logKoc– logS~mp! 963.53 Correlation logKoc– MCI 598
g-Hexachlorocyclohexane„Lindane…
0.47° Ca-Bentonite~Montmorillonite! 20 BE 390~0.89!0.43° Idem 30 390
J. Phys. Chem. Ref. Data, Vol. 30, No. 1, 2001
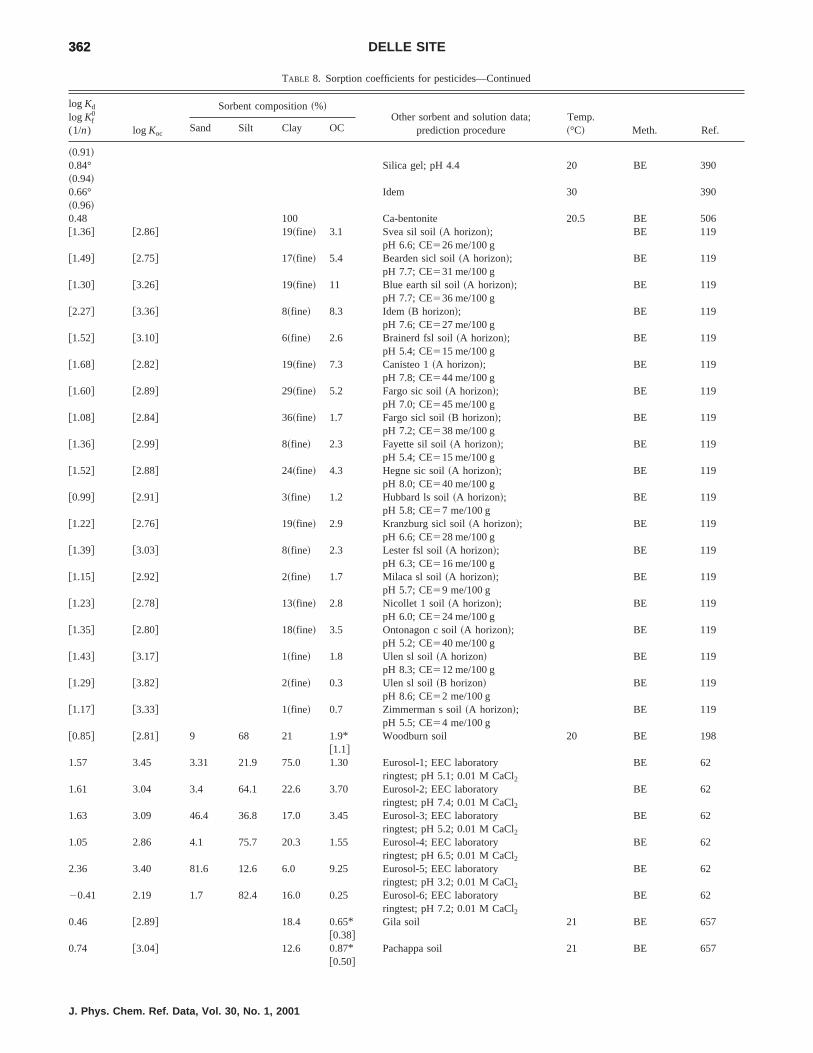
362362 DELLE SITE
TABLE 8. Sorption coefficients for pesticides—Continued
log Kd
log Kf0
(1/n) log Koc
Sorbent composition~%!Other sorbent and solution data;
prediction procedureTemp.~°C! Meth. Ref.Sand Silt Clay OC
~0.91!0.84° Silica gel; pH 4.4 20 BE 390~0.94!0.66° Idem 30 390~0.96!0.48 100 Ca-bentonite 20.5 BE [email protected]# @2.86# 19~fine! 3.1 Svea sil soil~A horizon!;
pH 6.6; CE526 me/100 gBE 119
@1.49# @2.75# 17~fine! 5.4 Bearden sicl soil~A horizon!;pH 7.7; CE531 me/100 g
BE 119
@1.30# @3.26# 19~fine! 11 Blue earth sil soil~A horizon!;pH 7.7; CE536 me/100 g
BE 119
@2.27# @3.36# 8~fine! 8.3 Idem~B horizon!;pH 7.6; CE527 me/100 g
BE 119
@1.52# @3.10# 6~fine! 2.6 Brainerd fsl soil~A horizon!;pH 5.4; CE515 me/100 g
BE 119
@1.68# @2.82# 19~fine! 7.3 Canisteo 1~A horizon!;pH 7.8; CE544 me/100 g
BE 119
@1.60# @2.89# 29~fine! 5.2 Fargo sic soil~A horizon!;pH 7.0; CE545 me/100 g
BE 119
@1.08# @2.84# 36~fine! 1.7 Fargo sicl soil~B horizon!;pH 7.2; CE538 me/100 g
BE 119
@1.36# @2.99# 8~fine! 2.3 Fayette sil soil~A horizon!;pH 5.4; CE515 me/100 g
BE 119
@1.52# @2.88# 24~fine! 4.3 Hegne sic soil~A horizon!;pH 8.0; CE540 me/100 g
BE 119
@0.99# @2.91# 3~fine! 1.2 Hubbard ls soil~A horizon!;pH 5.8; CE57 me/100 g
BE 119
@1.22# @2.76# 19~fine! 2.9 Kranzburg sicl soil~A horizon!;pH 6.6; CE528 me/100 g
BE 119
@1.39# @3.03# 8~fine! 2.3 Lester fsl soil~A horizon!;pH 6.3; CE516 me/100 g
BE 119
@1.15# @2.92# 2~fine! 1.7 Milaca sl soil~A horizon!;pH 5.7; CE59 me/100 g
BE 119
@1.23# @2.78# 13~fine! 2.8 Nicollet 1 soil~A horizon!;pH 6.0; CE524 me/100 g
BE 119
@1.35# @2.80# 18~fine! 3.5 Ontonagon c soil~A horizon!;pH 5.2; CE540 me/100 g
BE 119
@1.43# @3.17# 1~fine! 1.8 Ulen sl soil~A horizon!pH 8.3; CE512 me/100 g
BE 119
@1.29# @3.82# 2~fine! 0.3 Ulen sl soil~B horizon!pH 8.6; CE52 me/100 g
BE 119
@1.17# @3.33# 1~fine! 0.7 Zimmerman s soil~A horizon!;pH 5.5; CE54 me/100 g
BE 119
@0.85# @2.81# 9 68 21 1.9*@1.1#
Woodburn soil 20 BE 198
1.57 3.45 3.31 21.9 75.0 1.30 Eurosol-1; EEC laboratoryringtest; pH 5.1; 0.01 M CaCl2
BE 62
1.61 3.04 3.4 64.1 22.6 3.70 Eurosol-2; EEC laboratoryringtest; pH 7.4; 0.01 M CaCl2
BE 62
1.63 3.09 46.4 36.8 17.0 3.45 Eurosol-3; EEC laboratoryringtest; pH 5.2; 0.01 M CaCl2
BE 62
1.05 2.86 4.1 75.7 20.3 1.55 Eurosol-4; EEC laboratoryringtest; pH 6.5; 0.01 M CaCl2
BE 62
2.36 3.40 81.6 12.6 6.0 9.25 Eurosol-5; EEC laboratoryringtest; pH 3.2; 0.01 M CaCl2
BE 62
20.41 2.19 1.7 82.4 16.0 0.25 Eurosol-6; EEC laboratoryringtest; pH 7.2; 0.01 M CaCl2
BE 62
0.46 @2.89# 18.4 0.65*@0.38#
Gila soil 21 BE 657
0.74 @3.04# 12.6 0.87*@0.50#
Pachappa soil 21 BE 657
J. Phys. Chem. Ref. Data, Vol. 30, No. 1, 2001

363363SORPTION OF ORGANIC COMPOUNDS
TABLE 8. Sorption coefficients for pesticides—Continued
log Kd
log Kf0
(1/n) log Koc
Sorbent composition~%!Other sorbent and solution data;
prediction procedureTemp.~°C! Meth. Ref.Sand Silt Clay OC
1.02 @3.06# 10.7 1.60*@0.93#
Kentwood soil 21 BE 657
0.56 @3.12# 0.28 Pachappa sl soil; pH 7.4;0.005 M CaCl2
20 BE 529
0.36 @2.91# 0.28 Idem 30 BE 5291.31 @3.00# 51.10 41.42 7.48 3.56*
@2.06#Honeywood soil 20.5 BE 506
1.24 @3.01# 78.21 14.15 7.64 2.90*@1.68#
Fox soil 20.5 BE 506
1.36 @3.09# 62.02 20.45 17.53 3.19*@1.85#
Brookston soil 20.5 BE 506
2.57 @2.98# 66*@38.3#
Muck 20.5 BE 506
1.30 2.60 18.9 26.3 54.8 4.24 Tsukuba soil; pH 6.5;0.01 M CaCl2
25 BE 642
0.98°~0.86!
Idem 642
0.04 1.93 23.1 15.4 61.5 1.35 Kanuma soil; pH 5.7;0.01 M CaCl2
25 BE 642
0.36° Idem 642~1.20!0.99° 1.42 Soil; cl;~kaolinite!; 20 BE 214~0.79! pH 5.91; CE512.4 me/100 g1.30° 3.11 1.51 Soil; light c;~montmorillonite!; 20 BE 214~0.91! pH 5.18; CE513.2 me/100 g1.57° 3.23 Soil; light c;~montomorillite! 20 BE 214~0.81! pH 5.26; CE528.3 me/100 g1.88° 2.98 7.91 Soil; sl;~allophane!; 20 BE 214~1.00! pH 5.41; CE526.3 me/100 g1.90° 2.88 10.4 Soil; cl;~allophane!; pH 4.89; 20 BE 214~0.94! CE535.0 me/100 g2.58° @3.47# 22* Ca-Staten peaty muck 10 BE 390~0.96! @12.8#2.52° @3.41# Idem 20 390~0.97!2.43° @3.32# Idem 30 390~0.98!2.29° @3.19# Idem 40 390~0.98!2.29° @3.19# Idem 40 390~0.98!1.73° 6* Ca-Venado clay 10 BE 390~0.87! @3.5# ~50% Montmorillonite!1.66° Idem 20 390~0.84!1.62°! Idem 30 390~0.85!1.56° Idem 40 390~0.85!21.28° 0.10 Portage soil; CE57.0 me/100 g; BE 91~0.86! 0.01 N Ca11; pH 820.44 @2.56#20.32° 0.13 Michaywe soil; CE57.0 me/100 g; BE 91~0.86! 0.01 N Ca11; pH 80.54 @3.42#20.03° 0.12 Delta soil; CE55.0 me/100 g; BE 91~0.95! 0.01 N Ca11; pH 80.24 @3.16#20.34° 1.14 Ann Arbor soil; CE56.9 me/100 g; BE 91~0.74! 0.01 N Ca11; pH 81.18 @3.12#2.95° @3.31# 52 34 14 75.3* Soil; organic; pH 6.1 BE 264~0.98! @43.7#
J. Phys. Chem. Ref. Data, Vol. 30, No. 1, 2001

364364 DELLE SITE
TABLE 8. Sorption coefficients for pesticides—Continued
log Kd
log Kf0
(1/n) log Koc
Sorbent composition~%!Other sorbent and solution data;
prediction procedureTemp.~°C! Meth. Ref.Sand Silt Clay OC
1.20° @3.04# 56 30 14 2.5* Beverly soil; pH 6.8 BE 264~0.97! @1.45#0.90° @3.29# 91.5 1.5 7 0.7* Plainfield soil; pH 7.0 BE 264~0.99! @0.41#0.95° @3.31# 79.6 4.8 15.6 0.75** Alluvial soil; pH 6.20; 26 BE 185~0.90! @0.44# CE518.6 me/100 g1.40° 69.6 6.8 23.6 2.88* Lateritic soil; pH 6.30; 26 BE 185~0.80! @1.67# CE542.8 me/100 g1.50° 45.6 7.8 45.6 5.52* Pokkali soil; pH 5.2; 26 BE 185~0.80! @3.20# CE519.2 me/100 g2.65° @3.50# 63.6 6.8 29.6 24.6* Kari soil; pH 8.3; 26 BE 185~1.10! @14.3# CE528.9 me/100 g
2.87 av 38 48 14 0.68 Commerce soil; pH 6.7 BE 575~three 56 30 14 1.12 Tracy soil; pH 6.2 BE 575soils! 12 56 32 2.01 Catlin soil; pH 6.2 BE 575
0.89°~0.8!
12.9 64.3 19.6 0.76 Alfisol; pH 7.5 22 BE 181
1.23°~1.1!
Cellulose 22 BE 181
2.47° @3.21# 14.4 27.5 26.8 31.1* Lake sediment; pH 5.3 23 BE 463~0.92! @18.0# ~0.1mg lindane/mg sedim.!2.48°~0.89!
@3.22# Idem ~0.2 mg/mg! 463
2.52°~0.92!
@3.26# Idem ~0.5 mg/mg! 463
2.52°~0.86!
Idem ~1.0 mg/mg! 463
2.53°~0.75!
Idem ~2.0 mg/mg! 463
2.64°~0.76!
Idem ~5.0 mg/mg! 463
1.92 3.27 2-4 Boonton Reservoir sed.; pH 8.3 BE 4213.04 54.3 Boonton sed. humic acid ED 421
1.38° @3.17# 71 22 7 2.8* Big Creek sediment; pH 6.6 BE 264~0.96! @1.62#
3.41* av 65–85* Eight sludges from two watertreatment plants
22.5 BE 535
2.7 58.03 Sanhedron soil humic acid;pH 6.5
24 BE 220
1.8 48.71 Sanhedron soil fulvic acid;pH 6.5
24 BE 220
1.5 54.22 Suwannee River humic acid;pH 6.5
24 BE 220
1.5 53.78 Suwannee River fulvic acid;pH 6.5
24 BE 220
2.86 Peat humic acid ED 4232.15 Bermeo soil humic acid ED 4234.3 4.1 Lake Ontario sediment trap
materialFM 49
1.90 @2.30# 40.0 Chitin in seawater~2.5 g/L!;salinity 36.52‰
22 BE 492
1.83 @2.23# Idem ~4 g/L! 4921.79 @2.19# Idem ~6.25 g/L! 4921.78 @2.17# Idem ~7.5 g/L! 4921.74 @2.14# Idem ~10 g/L! 4921.68 @2.08# Idem ~12.5 g/L! 492
4.02 Cyanopropyl column 20–25 RPLC 5792.89* 58.03 Prediction by limiting vapor
sorption on soil humic acid23 LSC 363
2.96 Soil; experimental~literature! 2173.03 av 3 soils~literature! 872.98 av 94 literature data 5623.33 Correlation logKoc– logKow 96
J. Phys. Chem. Ref. Data, Vol. 30, No. 1, 2001
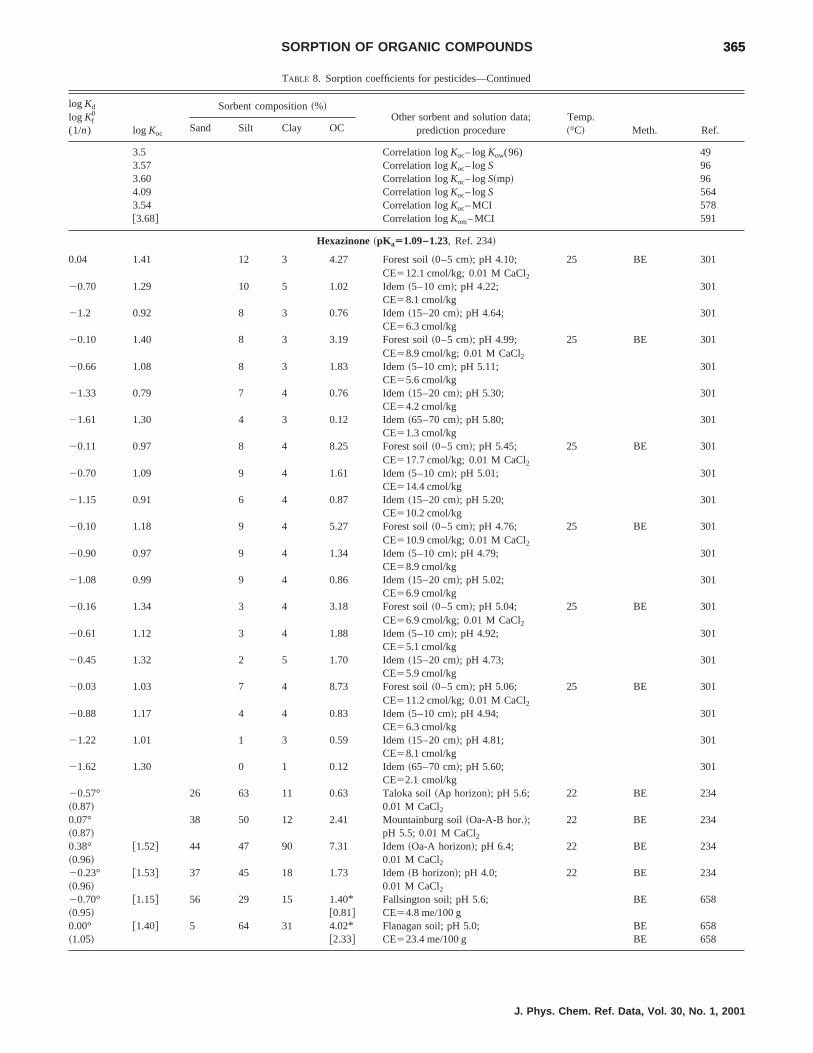
365365SORPTION OF ORGANIC COMPOUNDS
TABLE 8. Sorption coefficients for pesticides—Continued
log Kd
log Kf0
(1/n) log Koc
Sorbent composition~%!Other sorbent and solution data;
prediction procedureTemp.~°C! Meth. Ref.Sand Silt Clay OC
3.5 Correlation logKoc– logKow(96) 493.57 Correlation logKoc– logS 963.60 Correlation logKoc– logS~mp! 964.09 Correlation logKoc– logS 5643.54 Correlation logKoc– MCI [email protected]# Correlation logKom– MCI 591
Hexazinone~pKaÄ1.09–1.23, Ref. 234!
0.04 1.41 12 3 4.27 Forest soil~0–5 cm!; pH 4.10;CE512.1 cmol/kg; 0.01 M CaCl2
25 BE 301
20.70 1.29 10 5 1.02 Idem~5–10 cm!; pH 4.22;CE58.1 cmol/kg
301
21.2 0.92 8 3 0.76 Idem~15–20 cm!; pH 4.64;CE56.3 cmol/kg
301
20.10 1.40 8 3 3.19 Forest soil~0–5 cm!; pH 4.99;CE58.9 cmol/kg; 0.01 M CaCl2
25 BE 301
20.66 1.08 8 3 1.83 Idem~5–10 cm!; pH 5.11;CE55.6 cmol/kg
301
21.33 0.79 7 4 0.76 Idem~15–20 cm!; pH 5.30;CE54.2 cmol/kg
301
21.61 1.30 4 3 0.12 Idem~65–70 cm!; pH 5.80;CE51.3 cmol/kg
301
20.11 0.97 8 4 8.25 Forest soil~0–5 cm!; pH 5.45;CE517.7 cmol/kg; 0.01 M CaCl2
25 BE 301
20.70 1.09 9 4 1.61 Idem~5–10 cm!; pH 5.01;CE514.4 cmol/kg
301
21.15 0.91 6 4 0.87 Idem~15–20 cm!; pH 5.20;CE510.2 cmol/kg
301
20.10 1.18 9 4 5.27 Forest soil~0–5 cm!; pH 4.76;CE510.9 cmol/kg; 0.01 M CaCl2
25 BE 301
20.90 0.97 9 4 1.34 Idem~5–10 cm!; pH 4.79;CE58.9 cmol/kg
301
21.08 0.99 9 4 0.86 Idem~15–20 cm!; pH 5.02;CE56.9 cmol/kg
301
20.16 1.34 3 4 3.18 Forest soil~0–5 cm!; pH 5.04;CE56.9 cmol/kg; 0.01 M CaCl2
25 BE 301
20.61 1.12 3 4 1.88 Idem~5–10 cm!; pH 4.92;CE55.1 cmol/kg
301
20.45 1.32 2 5 1.70 Idem~15–20 cm!; pH 4.73;CE55.9 cmol/kg
301
20.03 1.03 7 4 8.73 Forest soil~0–5 cm!; pH 5.06;CE511.2 cmol/kg; 0.01 M CaCl2
25 BE 301
20.88 1.17 4 4 0.83 Idem~5–10 cm!; pH 4.94;CE56.3 cmol/kg
301
21.22 1.01 1 3 0.59 Idem~15–20 cm!; pH 4.81;CE58.1 cmol/kg
301
21.62 1.30 0 1 0.12 Idem~65–70 cm!; pH 5.60;CE52.1 cmol/kg
301
20.57° 26 63 11 0.63 Taloka soil~Ap horizon!; pH 5.6; 22 BE 234~0.87! 0.01 M CaCl20.07° 38 50 12 2.41 Mountainburg soil~Oa-A-B hor.!; 22 BE 234~0.87! pH 5.5; 0.01 M CaCl20.38° @1.52# 44 47 90 7.31 Idem~Oa-A horizon!; pH 6.4; 22 BE 234~0.96! 0.01 M CaCl220.23° @1.53# 37 45 18 1.73 Idem~B horizon!; pH 4.0; 22 BE 234~0.96! 0.01 M CaCl220.70° @1.15# 56 29 15 1.40* Fallsington soil; pH 5.6; BE 658~0.95! @0.81# CE54.8 me/100 g0.00° @1.40# 5 64 31 4.02* Flanagan soil; pH 5.0; BE 658~1.05! @2.33# CE523.4 me/100 g BE 658
J. Phys. Chem. Ref. Data, Vol. 30, No. 1, 2001

366366 DELLE SITE
TABLE 8. Sorption coefficients for pesticides—Continued
log Kd
log Kf0
(1/n) log Koc
Sorbent composition~%!Other sorbent and solution data;
prediction procedureTemp.~°C! Meth. Ref.Sand Silt Clay OC
Ipazine ~pKaÄ1.85, Ref. 247!
1.42 2.91 3.27 Hickory Hill sediment; coarse sifraction ~20–50mm!
25 BE 130
1.68 @3.39# 66.0 18.4 15.6 1.93 Begbroke soil; pH 7.1; 0.1 M CaCl2 22 BE 6383.22 Soil; experimental~literature! 2173.55 Correlation logKoc– logKow 963.09 Correlation logKoc– logS 963.10 Correlation logKoc– logS~mp! 962.76 Correlation logKoc– logS 5642.74 Correlation logKoc– MCI 598
Isocil ~pKaÄ9.1, Ref. 679!
0.31 Silica gel~0.59–0.07 mm!~GraceDiv. Chem., Baltimore, Md.!;pH 5.2
25 BE 99
0.58 Idem 0 990.31 Idem; pH 3.5 25 990.97°~0.8!
Idem 0 99
0.3° 100 Illite No. 35~0.83 mm!~Fithian, 25 BE 99~0.9! Ill. !; pH 7.40.79°~0.8!
Idem 0 99
0.1° 100 Montmorillonite No. 25~0.83 mm! 25 BE 99~1.2! ~J. C. Lane Track, Upton, Wyo.!
pH 6.799
0.49°~1.1!
Idem 0 99
21.07° 100 Kaolinite~0.24–1.68 mm! 25 BE 99~1.2! ~Merck, NFV!; pH 6–723.6°~1.1!
Idem 0 99
2.05°* Humic acid~0.59–0.2 mm! 25 BE 99~0.7! extracted from soil; pH 6–72.19°*~0.7!
Idem 0 99
2.11 Soil; experimental~literature! 2171.81 Correlation logKoc– logS 5642.23 Correlation logKoc– MCI 578
Leptophos
3.66 @3.93# 94* OM from peaty much~Histosol! 24 BE [email protected]# soil; pH 5.5
3.97 Soil; experimental~literature! 2173.43 Correlation logKoc– logS 564
Linuron
1.45°~0.78!
Bentonite; 0.01 M CaCl2 22 BE 144
@2.43# av 1.09*- 4 soils; silt loam; pH 6.1–7.5. 20 BE 1204.25* 0.01 M CaCl2
@0.78# @2.36# 4.54* Warwick, Qld, soil; pH 6.3; BE [email protected]# 0.01 M CaCl2
@0.74# @2.37# 4.07* Rutherglen, Vic., soil; pH 4.8; BE [email protected]# 0.01 M CaCl2
@0.43# @2.40# 1.86* Wagga, N.S.W., soil; pH 5.1; BE [email protected]# 0.01 M CaCl2
@0.47# @2.26# 2.81* Turretfield, S. A., soil; pH 5.2; BE [email protected]# 0.01 M CaCl2
@0.29# @2.49# 1.09* Warracknabeal, Vic., soil; pH 8.0; BE [email protected]# 0.01 M CaCl2
@0.65# @2.38# 3.20* Warracknabeal, Vic., soil; pH 8.4; BE 558
J. Phys. Chem. Ref. Data, Vol. 30, No. 1, 2001
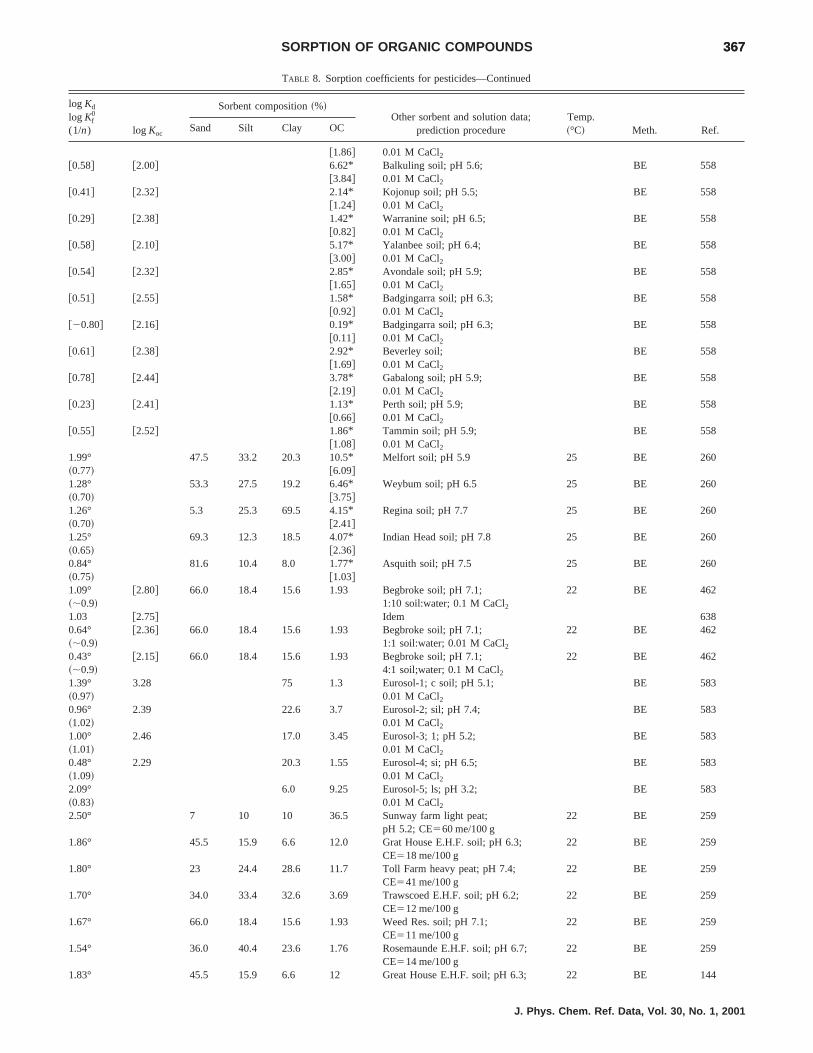
367367SORPTION OF ORGANIC COMPOUNDS
TABLE 8. Sorption coefficients for pesticides—Continued
log Kd
log Kf0
(1/n) log Koc
Sorbent composition~%!Other sorbent and solution data;
prediction procedureTemp.~°C! Meth. Ref.Sand Silt Clay OC
@1.86# 0.01 M [email protected]# @2.00# 6.62* Balkuling soil; pH 5.6; BE 558
@3.84# 0.01 M [email protected]# @2.32# 2.14* Kojonup soil; pH 5.5; BE 558
@1.24# 0.01 M [email protected]# @2.38# 1.42* Warranine soil; pH 6.5; BE 558
@0.82# 0.01 M [email protected]# @2.10# 5.17* Yalanbee soil; pH 6.4; BE 558
@3.00# 0.01 M [email protected]# @2.32# 2.85* Avondale soil; pH 5.9; BE 558
@1.65# 0.01 M [email protected]# @2.55# 1.58* Badgingarra soil; pH 6.3; BE 558
@0.92# 0.01 M [email protected]# @2.16# 0.19* Badgingarra soil; pH 6.3; BE 558
@0.11# 0.01 M [email protected]# @2.38# 2.92* Beverley soil; BE 558
@1.69# 0.01 M [email protected]# @2.44# 3.78* Gabalong soil; pH 5.9; BE 558
@2.19# 0.01 M [email protected]# @2.41# 1.13* Perth soil; pH 5.9; BE 558
@0.66# 0.01 M [email protected]# @2.52# 1.86* Tammin soil; pH 5.9; BE 558
@1.08# 0.01 M CaCl21.99° 47.5 33.2 20.3 10.5* Melfort soil; pH 5.9 25 BE 260~0.77! @6.09#1.28° 53.3 27.5 19.2 6.46* Weybum soil; pH 6.5 25 BE 260~0.70! @3.75#1.26° 5.3 25.3 69.5 4.15* Regina soil; pH 7.7 25 BE 260~0.70! @2.41#1.25° 69.3 12.3 18.5 4.07* Indian Head soil; pH 7.8 25 BE 260~0.65! @2.36#0.84° 81.6 10.4 8.0 1.77* Asquith soil; pH 7.5 25 BE 260~0.75! @1.03#1.09° @2.80# 66.0 18.4 15.6 1.93 Begbroke soil; pH 7.1; 22 BE 462~;0.9! 1:10 soil:water; 0.1 M CaCl2
1.03 @2.75# Idem 6380.64° @2.36# 66.0 18.4 15.6 1.93 Begbroke soil; pH 7.1; 22 BE 462~;0.9! 1:1 soil:water; 0.01 M CaCl2
0.43° @2.15# 66.0 18.4 15.6 1.93 Begbroke soil; pH 7.1; 22 BE 462~;0.9! 4:1 soil;water; 0.1 M CaCl2
1.39° 3.28 75 1.3 Eurosol-1; c soil; pH 5.1; BE 583~0.97! 0.01 M CaCl20.96° 2.39 22.6 3.7 Eurosol-2; sil; pH 7.4; BE 583~1.02! 0.01 M CaCl21.00° 2.46 17.0 3.45 Eurosol-3; 1; pH 5.2; BE 583~1.01! 0.01 M CaCl20.48° 2.29 20.3 1.55 Eurosol-4; si; pH 6.5; BE 583~1.09! 0.01 M CaCl22.09° 6.0 9.25 Eurosol-5; ls; pH 3.2; BE 583~0.83! 0.01 M CaCl22.50° 7 10 10 36.5 Sunway farm light peat;
pH 5.2; CE560 me/100 g22 BE 259
1.86° 45.5 15.9 6.6 12.0 Grat House E.H.F. soil; pH 6.3;CE518 me/100 g
22 BE 259
1.80° 23 24.4 28.6 11.7 Toll Farm heavy peat; pH 7.4;CE541 me/100 g
22 BE 259
1.70° 34.0 33.4 32.6 3.69 Trawscoed E.H.F. soil; pH 6.2;CE512 me/100 g
22 BE 259
1.67° 66.0 18.4 15.6 1.93 Weed Res. soil; pH 7.1;CE511 me/100 g
22 BE 259
1.54° 36.0 40.4 23.6 1.76 Rosemaunde E.H.F. soil; pH 6.7;CE514 me/100 g
22 BE 259
1.83° 45.5 15.9 6.6 12 Great House E.H.F. soil; pH 6.3; 22 BE 144
J. Phys. Chem. Ref. Data, Vol. 30, No. 1, 2001

368368 DELLE SITE
TABLE 8. Sorption coefficients for pesticides—Continued
log Kd
log Kf0
(1/n) log Koc
Sorbent composition~%!Other sorbent and solution data;
prediction procedureTemp.~°C! Meth. Ref.Sand Silt Clay OC
~0.75! CE518 me/100 g; 0.1 M CaCl2
1.66° 66.0 18.4 15.6 1.93 Weed Res. Orgn. soil; pH 7.1; 22 BE 144~0.75! CE511 me/100 g; 0.1 M CaCl2
0.36° 9.8 0.1* Soil; s, mesic; pH 7.0; BE 72~0.84! @0.06# SA~W!514.8 m2/g0.68° 15.0 1.0* Soil; s, mixed, mesic; pH 7.6; BE 72~0.85! @0.58# SA~W!518.1 m2/g0.69° 13.0 1.4* Soil; s, mixed, mesic; pH 7.3; BE 72~0.79! @0.81# SA~W!530.3 m2/g0.98° 6.8 1.5* Soil; s, mixed, mesic; pH 7.1; BE 72~0.73! @0.87# SA~W!515.2 m2/g0.90° @2.93# 31.5 1.6* Soil; s, clay, mesic; pH 6.6; BE 72~0.94! @0.93# SA~W!572.4 m2/g1.26° 10.6 1.9* Soil; s, mesic; pH 4.2; BE 72~0.82! @1.10# SA~W!538.6 m2/g1.11° 18.3 1.2* Soil, s, mesic; pH 6.9; BE 72~0.77! @0.70# SA~W!555.8 m2/g1.36° @2.94# 4.5 4.6* Soil, s, mesic; pH 3.7; BE 72~0.89! @2.67# SA~W!522.4 m2/g0.73° 1.5 1.3 1.2* Bassendean soil; pH 5.0; BE 143~0.85! @0.70# CE52.4 cmol/kg;
SA~N2!50.4 m2/g; 0.005 M CaCl20.56° 8.3 15.3 1.7* Gascoyne soil; CE524.8 cmol/kg; BE 143~0.76! @0.99# pH 6.9; SA~N2!522.5 m2/g;
0.005 M CaCl20.42 2.5 13.6 0.6* Cobiac soil; CE53.5 cmol/kg; BE 143~0.70! @0.35# pH 5.1; SA~N2!513.4 m2/g;
0.005 M CaCl21.43° 14.2 63.7 4.6* Wellesley soil; CE543.0 cmol/kg; BE 143~0.81! @2.67# pH 5.9; SA~N2!573.1 m2/g;
0.005 M [email protected]# @3.38# 1 0.5 Lakewood soil~A horizon!;
pH 8.6; CE51.8 me/100 gBE 242
@0.86# @3.78# 5 0.12 Idem~B horizon!; pH 4.5CE51.4 me/100 g
BE 242
@1.05# @2.75# 20 2.0 Sassafras soil~A horizon!;pH 5.2; CE57.7 me/100 g
BE 242
@1.04# @3.34# 30 0.5 Idem~B horizon!; pH 5.1;CE57.1 me/100 g
BE 242
@1.16# @2.75# 17 2.6 Collington soil~A horizon!;pH 4.9; CE512.8 me/100 g
BE 242
@0.68# @2.90# 19 0.6 Idem~B horizon!; pH 5.7;CE511.0 me/100 g
BE 242
@0.83# @2.75# 11 1.2 Colts Neck soil~A horizon!;pH 4.2; CE57.7 me/100 g
BE 242
@0.55# @2.65# 15 0.8 Idem~B horizon!; pH 4.6;CE58.4 me/100 g
BE 242
@1.07# @2.84# 21 1.7 Annandale soil~A horizon!;pH 5.9; CE511.3 me/100 g
BE 242
@0.80# @2.68# 24 1.3 Idem~B horizon!; pH 6.8;CE512.0 me/100 g
BE 242
@1.14# @2.94# 31 1.6 Bermudian soil~A horizon!;pH 6.0; CE513.2 me/100 g
BE 242
@0.89# @2.99# 35 0.8 Idem~B horizon!; pH 6.0;CE512.6 me/100 g
BE 242
@0.94# @2.66# 20 1.9 Whippany soil~A horizon!;pH 5.6; CE59.4 me/100 g
BE 242
@0.54# @2.77# 21 0.6 Idem~B horizon!; pH 6.2;CE516.9 me/100 g
BE 242
@1.13# @2.67# 24 2.9 Dutchess soil~A horizon!;pH 5.4; CE512.7 me/100 g
BE 242
@1.13# @3.01# 22 1.3 Idem~B horizon!; pH 5.8;CE55.8 me/100 g
BE 242
J. Phys. Chem. Ref. Data, Vol. 30, No. 1, 2001
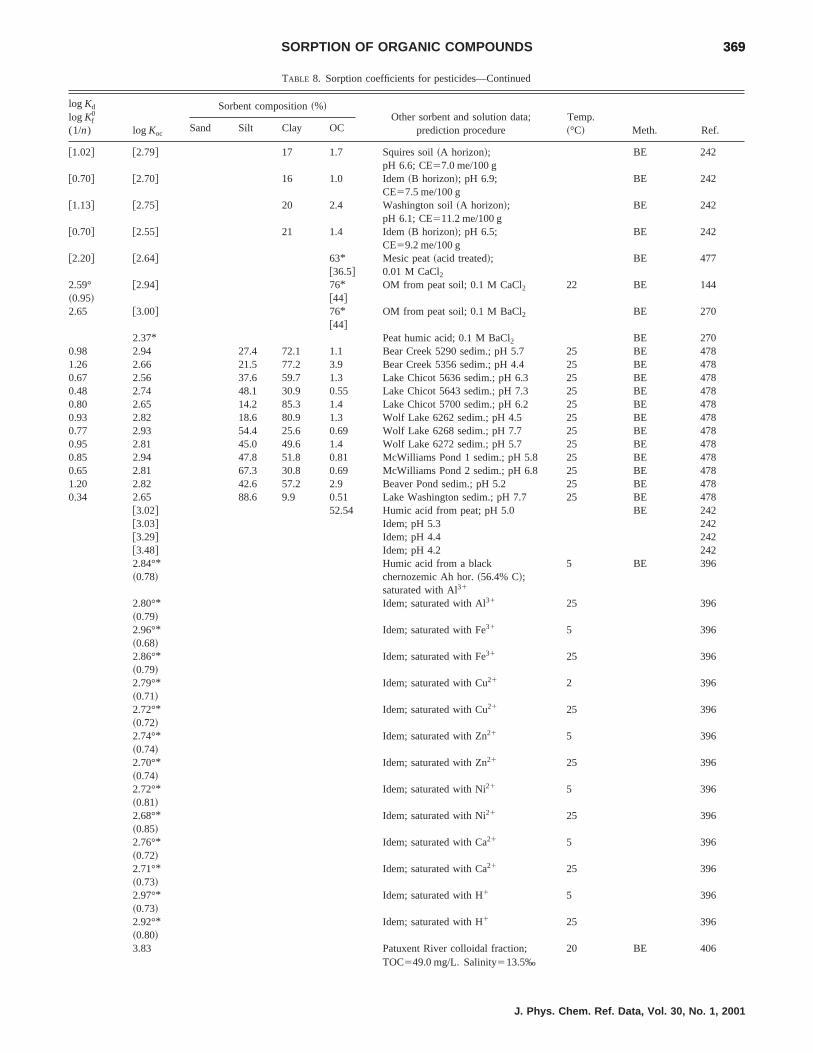
369369SORPTION OF ORGANIC COMPOUNDS
TABLE 8. Sorption coefficients for pesticides—Continued
log Kd
log Kf0
(1/n) log Koc
Sorbent composition~%!Other sorbent and solution data;
prediction procedureTemp.~°C! Meth. Ref.Sand Silt Clay OC
@1.02# @2.79# 17 1.7 Squires soil~A horizon!;pH 6.6; CE57.0 me/100 g
BE 242
@0.70# @2.70# 16 1.0 Idem~B horizon!; pH 6.9;CE57.5 me/100 g
BE 242
@1.13# @2.75# 20 2.4 Washington soil~A horizon!;pH 6.1; CE511.2 me/100 g
BE 242
@0.70# @2.55# 21 1.4 Idem~B horizon!; pH 6.5;CE59.2 me/100 g
BE 242
@2.20# @2.64# 63* Mesic peat~acid treated!; BE [email protected]# 0.01 M CaCl2
2.59° @2.94# 76* OM from peat soil; 0.1 M CaCl2 22 BE 144~0.95! @44#2.65 @3.00# 76* OM from peat soil; 0.1 M BaCl2 BE 270
@44#2.37* Peat humic acid; 0.1 M BaCl2 BE 270
0.98 2.94 27.4 72.1 1.1 Bear Creek 5290 sedim.; pH 5.7 25 BE 4781.26 2.66 21.5 77.2 3.9 Bear Creek 5356 sedim.; pH 4.4 25 BE 4780.67 2.56 37.6 59.7 1.3 Lake Chicot 5636 sedim.; pH 6.3 25 BE 4780.48 2.74 48.1 30.9 0.55 Lake Chicot 5643 sedim.; pH 7.3 25 BE 4780.80 2.65 14.2 85.3 1.4 Lake Chicot 5700 sedim.; pH 6.2 25 BE 4780.93 2.82 18.6 80.9 1.3 Wolf Lake 6262 sedim.; pH 4.5 25 BE 4780.77 2.93 54.4 25.6 0.69 Wolf Lake 6268 sedim.; pH 7.7 25 BE 4780.95 2.81 45.0 49.6 1.4 Wolf Lake 6272 sedim.; pH 5.7 25 BE 4780.85 2.94 47.8 51.8 0.81 McWilliams Pond 1 sedim.; pH 5.8 25 BE 4780.65 2.81 67.3 30.8 0.69 McWilliams Pond 2 sedim.; pH 6.8 25 BE 4781.20 2.82 42.6 57.2 2.9 Beaver Pond sedim.; pH 5.2 25 BE 4780.34 2.65 88.6 9.9 0.51 Lake Washington sedim.; pH 7.7 25 BE 478
@3.02# 52.54 Humic acid from peat; pH 5.0 BE [email protected]# Idem; pH 5.3 [email protected]# Idem; pH 4.4 [email protected]# Idem; pH 4.2 2422.84°* Humic acid from a black 5 BE 396~0.78! chernozemic Ah hor.~56.4% C!;
saturated with Al31
2.80°* Idem; saturated with Al31 25 396~0.79!2.96°* Idem; saturated with Fe31 5 396~0.68!2.86°* Idem; saturated with Fe31 25 396~0.79!2.79°* Idem; saturated with Cu21 2 396~0.71!2.72°* Idem; saturated with Cu21 25 396~0.72!2.74°* Idem; saturated with Zn21 5 396~0.74!2.70°* Idem; saturated with Zn21 25 396~0.74!2.72°* Idem; saturated with Ni21 5 396~0.81!2.68°* Idem; saturated with Ni21 25 396~0.85!2.76°* Idem; saturated with Ca21 5 396~0.72!2.71°* Idem; saturated with Ca21 25 396~0.73!2.97°* Idem; saturated with H1 5 396~0.73!2.92°* Idem; saturated with H1 25 396~0.80!3.83 Patuxent River colloidal fraction;
TOC549.0 mg/L. Salinity513.5‰20 BE 406
J. Phys. Chem. Ref. Data, Vol. 30, No. 1, 2001

370370 DELLE SITE
TABLE 8. Sorption coefficients for pesticides—Continued
log Kd
log Kf0
(1/n) log Koc
Sorbent composition~%!Other sorbent and solution data;
prediction procedureTemp.~°C! Meth. Ref.Sand Silt Clay OC
3.79 Idem; TOC552.5 mg/L;salinity514.5/mL
406
2.67 Cyanopropyl column; ring test RPLC 5812.91 Soil; experimental~literature! 2172.94av 33 soils~literature! 871.80 Correlation logKoc– logKow 962.93 Correlation logKoc– logS 962.80 Correlation logKoc– logS~mp! 962.61 Correlation logKoc– logS 564
Malathion
@0.63# @2.93# 1 0.5 Lakewood soil~A horizon!;pH 4.6; CE51.8 me/100 g
BE 242
@0.39# @3.31# 5 0.12 Idem~B horizon!; pH 4.8CE51.4 me/100 g
BE 242
@1.41# @3.11# 20 2.0 Sassafras soil~A horizon!;pH 5.2; CE57.7 me/100 g
BE 242
@0.62# @2.92# 30 0.5 Idem~B horizon!; pH 5.3;CE57.1 me/100 g
BE 242
@1.67# @3.25# 17 2.6 Collington soil~A horizon!;pH 5.7; CE512.8 me/100 g
BE 242
@1.00# @3.22# 19 0.6 Idem~B horizon!; pH 5.7;CE511.0 me/100 g
BE 242
@0.90# @2.82# 11 1.2 Colts Neck soil~A horizon!;pH 5.7; CE57.7 me/100 g
BE 242
@0.53# @2.63# 15 0.8 Idem~B horizon!; pH 4.7;CE58.4 me/100 g
BE 242
@1.74# @3.51# 21 1.7 Annandale soil~A horizon!;pH 6.2; CE511.3 me/100 g
BE 242
@1.24# @3.12# 24 1.3 Idem~B horizon!; pH 6.5;CE512.0 me/100 g
BE 242
@1.73# @3.53# 31 1.6 Bermudian soil~A horizon!;pH 6.4; CE513.2 me/100 g
BE 242
@1.19# @3.29# 35 0.8 Idem~B horizon!; pH 5.2;CE512.6 me/100 g
BE 242
@1.18# @2.90# 20 1.9 Whippany soil~A horizon!;pH 5.7; CE59.4 me/100 g
BE 242
@0.46# @2.68# 21 0.6 Idem~B horizon!; pH 5.7;CE516.9 me/100 g
BE 242
@1.76# @3.29# 24 2.9 Dutchess soil~A horizon!;pH 5.8; CE512.7 me/100 g
BE 242
@1.17# @3.06# 22 1.3 Idem~B horizon!; pH 5.6;CE55.8 me/100 g
BE 242
@1.70# @3.47# 17 1.7 Squires soil~A horizon!;pH 6.5; CE57.0 me/100 g
BE 242
@0.80# @2.81# 16 1.0 Idem~B horizon!; pH 6.7;CE57.5 me/100 g
BE 242
@1.41# @3.03# 20 2.4 Washington soil~A horizon!;pH 6.1; CE511.2 me/100 g
BE 242
@0.77# @2.62# 21 1.4 Idem~B horizon!; pH 5.8;CE59.2 me/100 g
BE 242
@2.82#av 52.54 4 humic acid samples from peat;pH 5.1–5.3
BE 242
3.26av 20 soils~literature! 872.50 Correlation logKoc– logKow 962.83 Correlation logKoc– logS 963.29 Correlation logKoc– logS ~mp! 962.45 Correlation logKoc– logS 564
Methazole
2.71 100 Ca–montmorillonite; pH 6 24 BE 1213.16 @3.42# 94* OM from peaty muck~Histosol! 24 BE 121
@54.5# soil; pH 6.5
J. Phys. Chem. Ref. Data, Vol. 30, No. 1, 2001

371371SORPTION OF ORGANIC COMPOUNDS
TABLE 8. Sorption coefficients for pesticides—Continued
log Kd
log Kf0
(1/n) log Koc
Sorbent composition~%!Other sorbent and solution data;
prediction procedureTemp.~°C! Meth. Ref.Sand Silt Clay OC
3.42 Soil; experimental~literature! 2173.54 Correlation logKoc– logS 564
Methiocarb
1.23° 75 1.3 Eurosol-1; c; pH 5.1; BE 583~0.83! 0.01 M CaCl21.02° 2.45 22.6 3.7 Eurosol-2; sil; pH 7.4; BE 583~0.89! 0.01 M CaCl20.92° 2.38 17.0 3.45 Eurosol-3; 1; pH 5.2; BE 583~0.91! 0.01 M CaCl20.58° 2.38 20.3 1.55 Eurosol-4; si; pH 6.5; BE 583~0.92! 0.01 M CaCl21.76° 6.0 9.25 Eurosol-5; ls; pH 3.2; BE 583~0.79! 0.01 M CaCl2
@2.32#av 1.09* 2 Batcombe sil soils; 20 BE 1202.51* pH 7.5; 6.7. 0.01 M CaCl2
Methoxychlor
1.72 4.61 0.13 Hickory Hill sedim.; s~.50 mm! 25 BE 1083.42 4.90 3.27 Idem; coarse si~50–20mm! 1083.26 4.96 1.98 Idem; medium si~20–5mm! 1083.15 5.00 1.34 Idem; fine si~5–2 mm! 1083.04 4.96 1.20 Idem; c~.2 mm! 1080.92 3.99 0.09 Doe Run sedim.; s 25 BE 1083.34 4.90 2.78 Idem; coarse si 1083.23 4.86 2.34 Idem; medium si 1083.36 4.90 2.89 Idem; fine si 1083.38 4.86 3.29 Idem; c 1081.98 4.23 0.57 Oconee River sedim.; s 25 BE 1083.40 4.93 2.92 Idem; coarse si 1083.30 5.00 1.99 Idem; medium si 1083.32 4.97 2.26 Idem; fine si 108
4.99 Cyanopropyl column 20–25 RPLC 5794.90 Soil; experimental~literature! 2174.69 Correlation logKoc– logKow 965.54 Correlation logKoc– logS~mp! 965.03 Correlation logKoc– logS 5644.63 Correlation logKoc– MCI 598
Methyl parathion
1.82° 100 Na–montmorillonite~,2 mm! 20 BE 246~1.03!1.75° 100 Ca–montmorillonite~,2 mm! 20 BE 246~1.66!2.17° 100 Fe–montmorillonite~,2 mm! 20 BE 246~1.46!1.13° 18.4 45.3 38.3 3.87 Webster soil; pH 7.3; CE554.7 23 BE 102~0.75! me/100 g; 0.01 N CaCl2
0.60° 65.8 19.5 14.7 0.90 Cecil soil; pH 5.6; CE56.8 23 BE 102~0.85! me/100 g; 0.01 N CaCl2
0.43° 93.8 3.0 3.2 0.56 Eustis soil; pH 5.6; CE55.2 23 BE 102~0.86! me/100 g; 0.01 N CaCl2
1.24 @2.87# 37.7 4.03* Mollic-Solonetz soil 20 BE [email protected]#
0.96 @3.12# 46.4 1.19* Idem [email protected]#
1.08 @2.59# 9.5 5.30* Humic Cambisol 20 BE [email protected]#
1.21 @2.59# 15.9 7.13* Idem [email protected]#
0.56 @2.91# 62.0 0.77* Pellic Vertisol 20 BE [email protected]#
0.51 @3.18# 48.5 0.36* Chromic Luvisol 20 BE 659
J. Phys. Chem. Ref. Data, Vol. 30, No. 1, 2001

372372 DELLE SITE
TABLE 8. Sorption coefficients for pesticides—Continued
log Kd
log Kf0
(1/n) log Koc
Sorbent composition~%!Other sorbent and solution data;
prediction procedureTemp.~°C! Meth. Ref.Sand Silt Clay OC
@0.21#0.74 @2.59# 10.7 2.40* Humic Cambisol 20 BE 659
@1.40#1.44 @2.67# 13.6 10.2* Idem 659
@5.93#3.99 Soil; experimental~literature! 2173.71av 7 soils~literature! 872.93 Correlation logKoc– logKow 963.02 Correlation logKoc– logS 963.47 Correlation logKoc– logS~mp! 962.67 Correlation logKoc– logS 564
Metobromuron
@0.54# @2.12# 4.54* Warwick, Qld, soil; pH 6.3; BE [email protected]# 0.01 M CaCl2
@0.30# @1.93# 4.07* Rutherglen, Vic., soil; pH 4.8; BE [email protected]# 0.01 M CaCl2
@20.01# @1.96# 1.86* Wagga, N.S.W., soil; pH 5.1; BE [email protected]# 0.01 M CaCl2
@0.02# @1.81# 2.81* Turretfield, S. A., soil; pH 5.2; BE [email protected]# 0.01 M CaCl2
@20.18# @2.02# 1.09* Warracknabeal, Vic., soil; BE [email protected]# pH 8.0; 0.01 M CaCl2
@0.27# @2.00# 3.20* Warracknabeal, Vic., soil; BE [email protected]# pH 8.4; 0.01 M CaCl2
@0.25# @1.67# 6.62* Balkuling soil; pH 5.6; BE [email protected]# 0.01 M CaCl2
@0.10# @2.01# 2.14* Kojonup soil; pH 5.5; BE [email protected]# 0.01 M CaCl2
@20.02# @2.07# 1.42* Warranine soil; pH 6.5; BE [email protected]# 0.01 M CaCl2
@0.24# @1.76# 5.17* Yalanbee soil; pH 6.4; BE [email protected]# 0.01 M CaCl2
@0.15# @1.93# 2.85* Avondale soil; pH 5.9; BE [email protected]# 0.01 M CaCl2
@0.08# @2.12# 1.58* Badgingarra soil; pH 6.3; BE [email protected]# 0.01 M CaCl2
@20.81# @2.15# 0.19* Badgingarra soil; pH 6.3; BE [email protected]# 0.01 M CaCl2
@0.22# @1.99# 2.92* Beverley soil; BE [email protected]# 0.01 M CaCl2
@0.47# @2.02# 3.78* Gabalong soil; pH 5.9; BE [email protected]# 0.01 M CaCl2
@20.08# @2.10# 1.13* Perth soil; pH 5.9; BE [email protected]# 0.01 M CaCl2
@0.12# @2.09# 1.86* Tammin soil; pH 5.9; BE [email protected]# 0.01 M CaCl2
1.79° 47.5 33.2 20.3 10.5* Melfort soil; pH 5.9 25 BE 260~0.49! @6.09#1.05° 53.3 27.5 19.2 6.46* Weybum soil; pH 6.5 25 BE 260~0.64! @3.75#0.63° 5.3 25.3 69.5 4.15* Regina soil; pH 7.7 25 BE 260~0.83! @2.41#0.97° 69.3 12.3 18.5 4.07* Indian Head soil; pH 7.8 25 BE 260~0.68! @2.36#0.32° @2.31# 81.6 10.4 8.0 1.77* Asquith soil; pH 7.5 25 BE 260~0.89! @1.03#0.40° 9.8 0.1* Soil; s, mesic; pH 7.0; BE 72~0.58! @0.06# SA~W!514.8 m2/g0.32° 15.0 1.0* Soil; s, mixed, mesic; pH 7.6; BE 72~0.78! @0.58# SA~W!518.1 m2/g0.34° 13.0 1.4* Soil; s, mixed, mesic; pH 7.3; BE 72~0.82! @0.81# SA~W!530.3 m2/g
J. Phys. Chem. Ref. Data, Vol. 30, No. 1, 2001
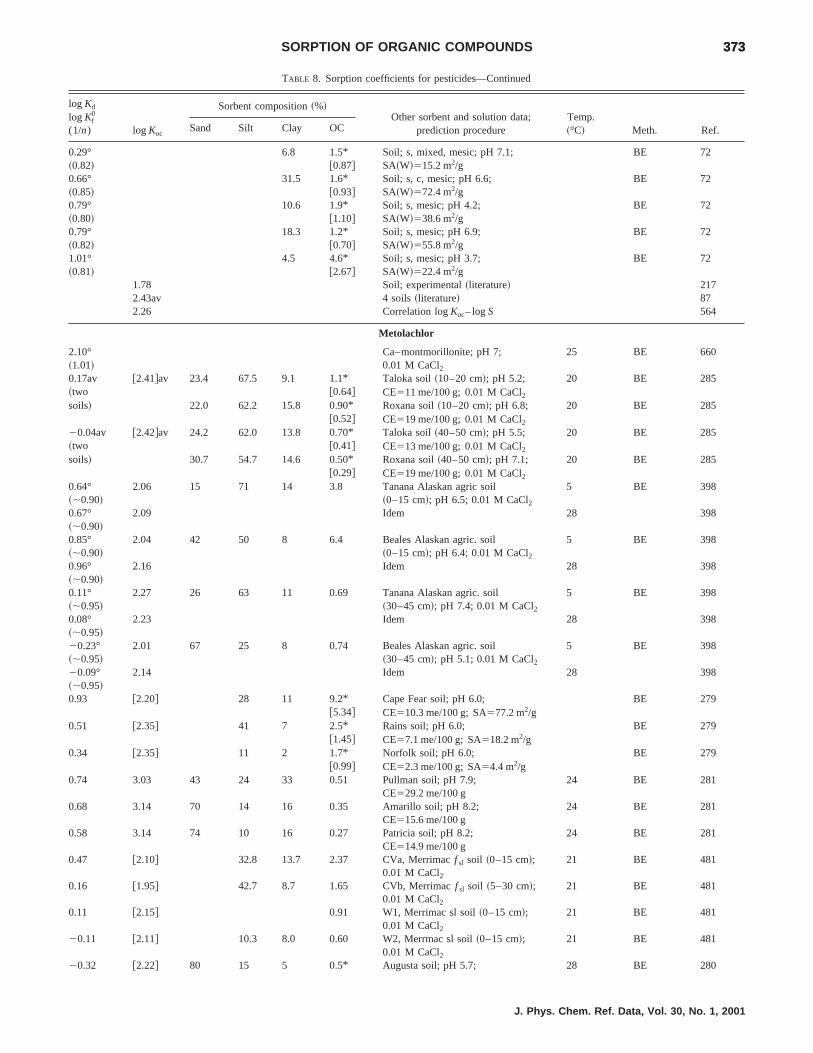
373373SORPTION OF ORGANIC COMPOUNDS
TABLE 8. Sorption coefficients for pesticides—Continued
log Kd
log Kf0
(1/n) log Koc
Sorbent composition~%!Other sorbent and solution data;
prediction procedureTemp.~°C! Meth. Ref.Sand Silt Clay OC
0.29° 6.8 1.5* Soil; s, mixed, mesic; pH 7.1; BE 72~0.82! @0.87# SA~W!515.2 m2/g0.66° 31.5 1.6* Soil; s, c, mesic; pH 6.6; BE 72~0.85! @0.93# SA~W!572.4 m2/g0.79° 10.6 1.9* Soil; s, mesic; pH 4.2; BE 72~0.80! @1.10# SA~W!538.6 m2/g0.79° 18.3 1.2* Soil; s, mesic; pH 6.9; BE 72~0.82! @0.70# SA~W!555.8 m2/g1.01° 4.5 4.6* Soil; s, mesic; pH 3.7; BE 72~0.81! @2.67# SA~W!522.4 m2/g
1.78 Soil; experimental~literature! 2172.43av 4 soils~literature! 872.26 Correlation logKoc– logS 564
Metolachlor
2.10° Ca–montmorillonite; pH 7; 25 BE 660~1.01! 0.01 M CaCl20.17av @2.41#av 23.4 67.5 9.1 1.1* Taloka soil~10–20 cm!; pH 5.2; 20 BE 285~two @0.64# CE511 me/100 g; 0.01 M CaCl2
soils! 22.0 62.2 15.8 0.90* Roxana soil~10–20 cm!; pH 6.8; 20 BE [email protected]# CE519 me/100 g; 0.01 M CaCl2
20.04av @2.42#av 24.2 62.0 13.8 0.70* Taloka soil~40–50 cm!; pH 5.5; 20 BE 285~two @0.41# CE513 me/100 g; 0.01 M CaCl2
soils! 30.7 54.7 14.6 0.50* Roxana soil~40–50 cm!; pH 7.1; 20 BE [email protected]# CE519 me/100 g; 0.01 M CaCl2
0.64° 2.06 15 71 14 3.8 Tanana Alaskan agric soil 5 BE 398~;0.90! ~0–15 cm!; pH 6.5; 0.01 M CaCl20.67° 2.09 Idem 28 398~;0.90!0.85° 2.04 42 50 8 6.4 Beales Alaskan agric. soil 5 BE 398~;0.90! ~0–15 cm!; pH 6.4; 0.01 M CaCl20.96° 2.16 Idem 28 398~;0.90!0.11° 2.27 26 63 11 0.69 Tanana Alaskan agric. soil 5 BE 398~;0.95! ~30–45 cm!; pH 7.4; 0.01 M CaCl20.08° 2.23 Idem 28 398~;0.95!20.23° 2.01 67 25 8 0.74 Beales Alaskan agric. soil 5 BE 398~;0.95! ~30–45 cm!; pH 5.1; 0.01 M CaCl220.09° 2.14 Idem 28 398~;0.95!0.93 @2.20# 28 11 9.2* Cape Fear soil; pH 6.0; BE 279
@5.34# CE510.3 me/100 g; SA577.2 m2/g0.51 @2.35# 41 7 2.5* Rains soil; pH 6.0; BE 279
@1.45# CE57.1 me/100 g; SA518.2 m2/g0.34 @2.35# 11 2 1.7* Norfolk soil; pH 6.0; BE 279
@0.99# CE52.3 me/100 g; SA54.4 m2/g0.74 3.03 43 24 33 0.51 Pullman soil; pH 7.9;
CE529.2 me/100 g24 BE 281
0.68 3.14 70 14 16 0.35 Amarillo soil; pH 8.2;CE515.6 me/100 g
24 BE 281
0.58 3.14 74 10 16 0.27 Patricia soil; pH 8.2;CE514.9 me/100 g
24 BE 281
0.47 @2.10# 32.8 13.7 2.37 CVa, Merrimacf sl soil ~0–15 cm!;0.01 M CaCl2
21 BE 481
0.16 @1.95# 42.7 8.7 1.65 CVb, Merrimacf sl soil ~5–30 cm!;0.01 M CaCl2
21 BE 481
0.11 @2.15# 0.91 W1, Merrimac sl soil~0–15 cm!;0.01 M CaCl2
21 BE 481
20.11 @2.11# 10.3 8.0 0.60 W2, Merrmac sl soil~0–15 cm!;0.01 M CaCl2
21 BE 481
20.32 @2.22# 80 15 5 0.5* Augusta soil; pH 5.7; 28 BE 280
J. Phys. Chem. Ref. Data, Vol. 30, No. 1, 2001
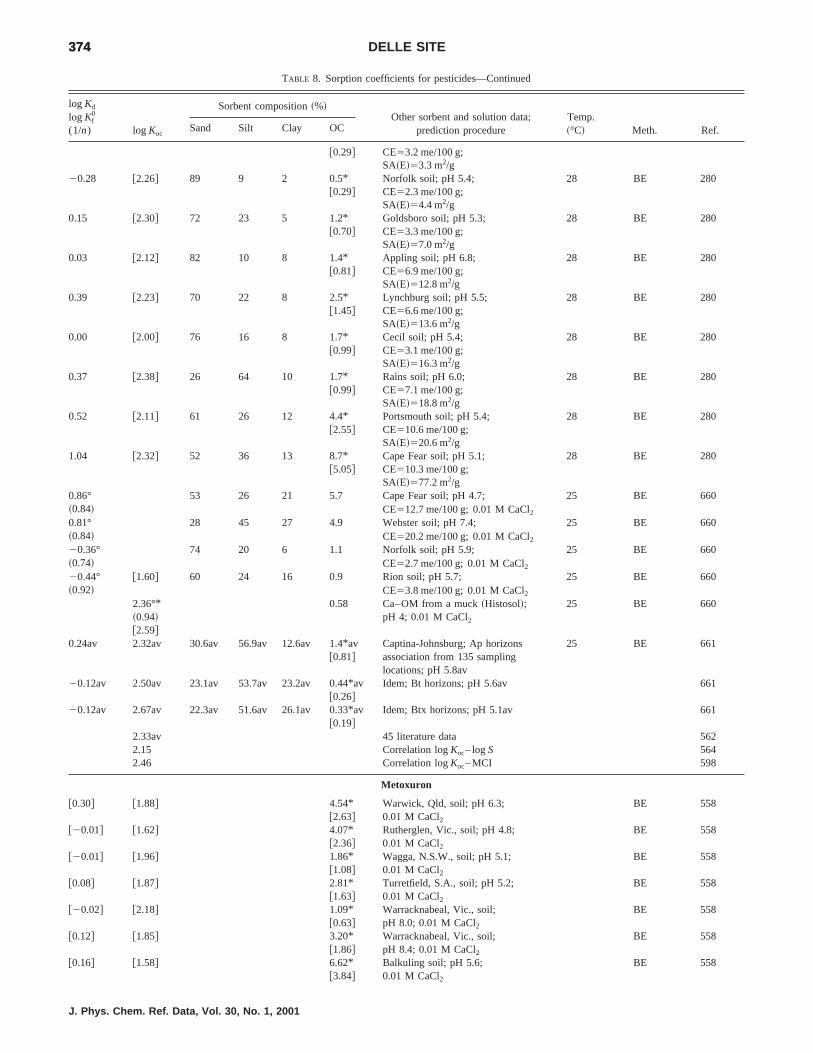
374374 DELLE SITE
TABLE 8. Sorption coefficients for pesticides—Continued
log Kd
log Kf0
(1/n) log Koc
Sorbent composition~%!Other sorbent and solution data;
prediction procedureTemp.~°C! Meth. Ref.Sand Silt Clay OC
@0.29# CE53.2 me/100 g;SA~E!53.3 m2/g
20.28 @2.26# 89 9 2 0.5* Norfolk soil; pH 5.4; 28 BE [email protected]# CE52.3 me/100 g;
SA~E!54.4 m2/g0.15 @2.30# 72 23 5 1.2* Goldsboro soil; pH 5.3; 28 BE 280
@0.70# CE53.3 me/100 g;SA~E!57.0 m2/g
0.03 @2.12# 82 10 8 1.4* Appling soil; pH 6.8; 28 BE [email protected]# CE56.9 me/100 g;
SA~E!512.8 m2/g0.39 @2.23# 70 22 8 2.5* Lynchburg soil; pH 5.5; 28 BE 280
@1.45# CE56.6 me/100 g;SA~E!513.6 m2/g
0.00 @2.00# 76 16 8 1.7* Cecil soil; pH 5.4; 28 BE [email protected]# CE53.1 me/100 g;
SA~E!516.3 m2/g0.37 @2.38# 26 64 10 1.7* Rains soil; pH 6.0; 28 BE 280
@0.99# CE57.1 me/100 g;SA~E!518.8 m2/g
0.52 @2.11# 61 26 12 4.4* Portsmouth soil; pH 5.4; 28 BE [email protected]# CE510.6 me/100 g;
SA~E!520.6 m2/g1.04 @2.32# 52 36 13 8.7* Cape Fear soil; pH 5.1; 28 BE 280
@5.05# CE510.3 me/100 g;SA~E!577.2 m2/g
0.86° 53 26 21 5.7 Cape Fear soil; pH 4.7; 25 BE 660~0.84! CE512.7 me/100 g; 0.01 M CaCl2
0.81° 28 45 27 4.9 Webster soil; pH 7.4; 25 BE 660~0.84! CE520.2 me/100 g; 0.01 M CaCl2
20.36° 74 20 6 1.1 Norfolk soil; pH 5.9; 25 BE 660~0.74! CE52.7 me/100 g; 0.01 M CaCl2
20.44° @1.60# 60 24 16 0.9 Rion soil; pH 5.7; 25 BE 660~0.92! CE53.8 me/100 g; 0.01 M CaCl2
2.36°* 0.58 Ca–OM from a muck~Histosol!; 25 BE 660~0.94! pH 4; 0.01 M [email protected]#
0.24av 2.32av 30.6av 56.9av 12.6av 1.4*av Captina-Johnsburg; Ap horizons 25 BE [email protected]# association from 135 sampling
locations; pH 5.8av20.12av 2.50av 23.1av 53.7av 23.2av 0.44*av Idem; Bt horizons; pH 5.6av 661
@0.26#20.12av 2.67av 22.3av 51.6av 26.1av 0.33*av Idem; Btx horizons; pH 5.1av 661
@0.19#2.33av 45 literature data 5622.15 Correlation logKoc– logS 5642.46 Correlation logKoc– MCI 598
Metoxuron
@0.30# @1.88# 4.54* Warwick, Qld, soil; pH 6.3; BE [email protected]# 0.01 M CaCl2
@20.01# @1.62# 4.07* Rutherglen, Vic., soil; pH 4.8; BE [email protected]# 0.01 M CaCl2
@20.01# @1.96# 1.86* Wagga, N.S.W., soil; pH 5.1; BE [email protected]# 0.01 M CaCl2
@0.08# @1.87# 2.81* Turretfield, S.A., soil; pH 5.2; BE [email protected]# 0.01 M CaCl2
@20.02# @2.18# 1.09* Warracknabeal, Vic., soil; BE [email protected]# pH 8.0; 0.01 M CaCl2
@0.12# @1.85# 3.20* Warracknabeal, Vic., soil; BE [email protected]# pH 8.4; 0.01 M CaCl2
@0.16# @1.58# 6.62* Balkuling soil; pH 5.6; BE [email protected]# 0.01 M CaCl2
J. Phys. Chem. Ref. Data, Vol. 30, No. 1, 2001
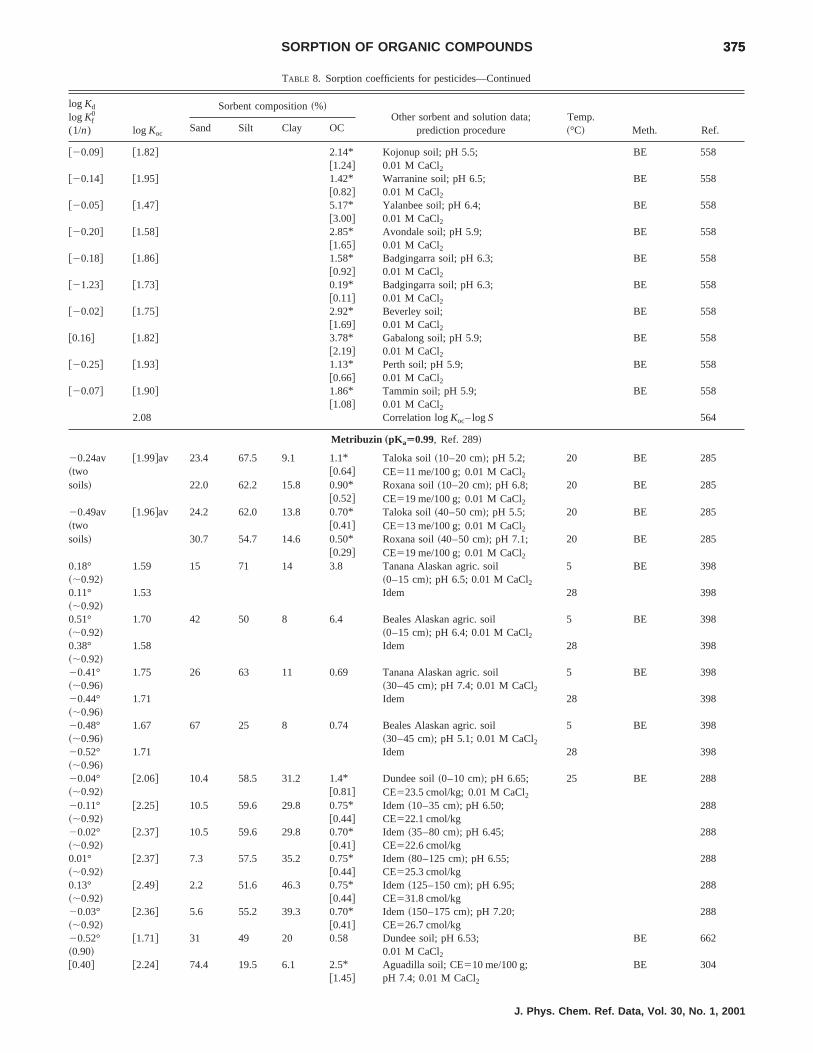
375375SORPTION OF ORGANIC COMPOUNDS
TABLE 8. Sorption coefficients for pesticides—Continued
log Kd
log Kf0
(1/n) log Koc
Sorbent composition~%!Other sorbent and solution data;
prediction procedureTemp.~°C! Meth. Ref.Sand Silt Clay OC
@20.09# @1.82# 2.14* Kojonup soil; pH 5.5; BE [email protected]# 0.01 M CaCl2
@20.14# @1.95# 1.42* Warranine soil; pH 6.5; BE [email protected]# 0.01 M CaCl2
@20.05# @1.47# 5.17* Yalanbee soil; pH 6.4; BE [email protected]# 0.01 M CaCl2
@20.20# @1.58# 2.85* Avondale soil; pH 5.9; BE [email protected]# 0.01 M CaCl2
@20.18# @1.86# 1.58* Badgingarra soil; pH 6.3; BE [email protected]# 0.01 M CaCl2
@21.23# @1.73# 0.19* Badgingarra soil; pH 6.3; BE [email protected]# 0.01 M CaCl2
@20.02# @1.75# 2.92* Beverley soil; BE [email protected]# 0.01 M CaCl2
@0.16# @1.82# 3.78* Gabalong soil; pH 5.9; BE [email protected]# 0.01 M CaCl2
@20.25# @1.93# 1.13* Perth soil; pH 5.9; BE [email protected]# 0.01 M CaCl2
@20.07# @1.90# 1.86* Tammin soil; pH 5.9; BE [email protected]# 0.01 M CaCl2
2.08 Correlation logKoc– logS 564
Metribuzin „pKaÄ0.99, Ref. 289!
20.24av @1.99#av 23.4 67.5 9.1 1.1* Taloka soil~10–20 cm!; pH 5.2; 20 BE 285~two @0.64# CE511 me/100 g; 0.01 M CaCl2
soils! 22.0 62.2 15.8 0.90* Roxana soil~10–20 cm!; pH 6.8; 20 BE [email protected]# CE519 me/100 g; 0.01 M CaCl2
20.49av @1.96#av 24.2 62.0 13.8 0.70* Taloka soil~40–50 cm!; pH 5.5; 20 BE 285~two @0.41# CE513 me/100 g; 0.01 M CaCl2
soils! 30.7 54.7 14.6 0.50* Roxana soil~40–50 cm!; pH 7.1; 20 BE [email protected]# CE519 me/100 g; 0.01 M CaCl2
0.18° 1.59 15 71 14 3.8 Tanana Alaskan agric. soil 5 BE 398~;0.92! ~0–15 cm!; pH 6.5; 0.01 M CaCl20.11° 1.53 Idem 28 398~;0.92!0.51° 1.70 42 50 8 6.4 Beales Alaskan agric. soil 5 BE 398~;0.92! ~0–15 cm!; pH 6.4; 0.01 M CaCl20.38°~;0.92!
1.58 Idem 28 398
20.41° 1.75 26 63 11 0.69 Tanana Alaskan agric. soil 5 BE 398~;0.96! ~30–45 cm!; pH 7.4; 0.01 M CaCl220.44°~;0.96!
1.71 Idem 28 398
20.48° 1.67 67 25 8 0.74 Beales Alaskan agric. soil 5 BE 398~;0.96! ~30–45 cm!; pH 5.1; 0.01 M CaCl220.52°~;0.96!
1.71 Idem 28 398
20.04° @2.06# 10.4 58.5 31.2 1.4* Dundee soil~0–10 cm!; pH 6.65; 25 BE 288~;0.92! @0.81# CE523.5 cmol/kg; 0.01 M CaCl2
20.11° @2.25# 10.5 59.6 29.8 0.75* Idem ~10–35 cm!; pH 6.50; 288~;0.92! @0.44# CE522.1 cmol/kg20.02° @2.37# 10.5 59.6 29.8 0.70* Idem ~35–80 cm!; pH 6.45; 288~;0.92! @0.41# CE522.6 cmol/kg0.01° @2.37# 7.3 57.5 35.2 0.75* Idem ~80–125 cm!; pH 6.55; 288~;0.92! @0.44# CE525.3 cmol/kg0.13° @2.49# 2.2 51.6 46.3 0.75* Idem ~125–150 cm!; pH 6.95; 288~;0.92! @0.44# CE531.8 cmol/kg20.03° @2.36# 5.6 55.2 39.3 0.70* Idem ~150–175 cm!; pH 7.20; 288~;0.92! @0.41# CE526.7 cmol/kg20.52° @1.71# 31 49 20 0.58 Dundee soil; pH 6.53; BE 662~0.90! 0.01 M [email protected]# @2.24# 74.4 19.5 6.1 2.5* Aguadilla soil; CE510 me/100 g; BE 304
@1.45# pH 7.4; 0.01 M CaCl2
J. Phys. Chem. Ref. Data, Vol. 30, No. 1, 2001
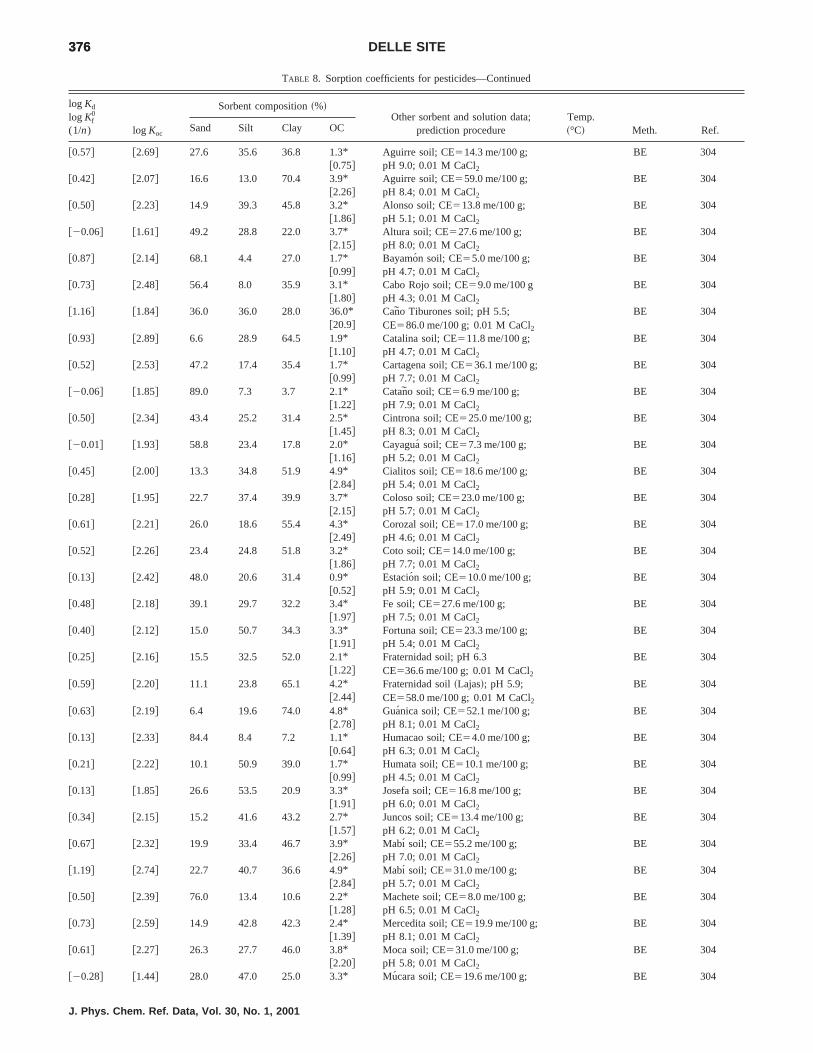
376376 DELLE SITE
TABLE 8. Sorption coefficients for pesticides—Continued
log Kd
log Kf0
(1/n) log Koc
Sorbent composition~%!Other sorbent and solution data;
prediction procedureTemp.~°C! Meth. Ref.Sand Silt Clay OC
@0.57# @2.69# 27.6 35.6 36.8 1.3* Aguirre soil; CE514.3 me/100 g; BE [email protected]# pH 9.0; 0.01 M CaCl2
@0.42# @2.07# 16.6 13.0 70.4 3.9* Aguirre soil; CE559.0 me/100 g; BE [email protected]# pH 8.4; 0.01 M CaCl2
@0.50# @2.23# 14.9 39.3 45.8 3.2* Alonso soil; CE513.8 me/100 g; BE [email protected]# pH 5.1; 0.01 M CaCl2
@20.06# @1.61# 49.2 28.8 22.0 3.7* Altura soil; CE527.6 me/100 g; BE [email protected]# pH 8.0; 0.01 M CaCl2
@0.87# @2.14# 68.1 4.4 27.0 1.7* Bayamon soil; CE55.0 me/100 g; BE [email protected]# pH 4.7; 0.01 M CaCl2
@0.73# @2.48# 56.4 8.0 35.9 3.1* Cabo Rojo soil; CE59.0 me/100 g BE [email protected]# pH 4.3; 0.01 M CaCl2
@1.16# @1.84# 36.0 36.0 28.0 36.0* Cano Tiburones soil; pH 5.5; BE [email protected]# CE586.0 me/100 g; 0.01 M CaCl2
@0.93# @2.89# 6.6 28.9 64.5 1.9* Catalina soil; CE511.8 me/100 g; BE [email protected]# pH 4.7; 0.01 M CaCl2
@0.52# @2.53# 47.2 17.4 35.4 1.7* Cartagena soil; CE536.1 me/100 g; BE [email protected]# pH 7.7; 0.01 M CaCl2
@20.06# @1.85# 89.0 7.3 3.7 2.1* Catano soil; CE56.9 me/100 g; BE [email protected]# pH 7.9; 0.01 M CaCl2
@0.50# @2.34# 43.4 25.2 31.4 2.5* Cintrona soil; CE525.0 me/100 g; BE [email protected]# pH 8.3; 0.01 M CaCl2
@20.01# @1.93# 58.8 23.4 17.8 2.0* Cayagua´ soil; CE57.3 me/100 g; BE [email protected]# pH 5.2; 0.01 M CaCl2
@0.45# @2.00# 13.3 34.8 51.9 4.9* Cialitos soil; CE518.6 me/100 g; BE [email protected]# pH 5.4; 0.01 M CaCl2
@0.28# @1.95# 22.7 37.4 39.9 3.7* Coloso soil; CE523.0 me/100 g; BE [email protected]# pH 5.7; 0.01 M CaCl2
@0.61# @2.21# 26.0 18.6 55.4 4.3* Corozal soil; CE517.0 me/100 g; BE [email protected]# pH 4.6; 0.01 M CaCl2
@0.52# @2.26# 23.4 24.8 51.8 3.2* Coto soil; CE514.0 me/100 g; BE [email protected]# pH 7.7; 0.01 M CaCl2
@0.13# @2.42# 48.0 20.6 31.4 0.9* Estacion soil; CE510.0 me/100 g; BE [email protected]# pH 5.9; 0.01 M CaCl2
@0.48# @2.18# 39.1 29.7 32.2 3.4* Fe soil; CE527.6 me/100 g; BE [email protected]# pH 7.5; 0.01 M CaCl2
@0.40# @2.12# 15.0 50.7 34.3 3.3* Fortuna soil; CE523.3 me/100 g; BE [email protected]# pH 5.4; 0.01 M CaCl2
@0.25# @2.16# 15.5 32.5 52.0 2.1* Fraternidad soil; pH 6.3 BE [email protected]# CE536.6 me/100 g; 0.01 M CaCl2
@0.59# @2.20# 11.1 23.8 65.1 4.2* Fraternidad soil~Lajas!; pH 5.9; BE [email protected]# CE558.0 me/100 g; 0.01 M CaCl2
@0.63# @2.19# 6.4 19.6 74.0 4.8* Guanica soil; CE552.1 me/100 g; BE [email protected]# pH 8.1; 0.01 M CaCl2
@0.13# @2.33# 84.4 8.4 7.2 1.1* Humacao soil; CE54.0 me/100 g; BE [email protected]# pH 6.3; 0.01 M CaCl2
@0.21# @2.22# 10.1 50.9 39.0 1.7* Humata soil; CE510.1 me/100 g; BE [email protected]# pH 4.5; 0.01 M CaCl2
@0.13# @1.85# 26.6 53.5 20.9 3.3* Josefa soil; CE516.8 me/100 g; BE [email protected]# pH 6.0; 0.01 M CaCl2
@0.34# @2.15# 15.2 41.6 43.2 2.7* Juncos soil; CE513.4 me/100 g; BE [email protected]# pH 6.2; 0.01 M CaCl2
@0.67# @2.32# 19.9 33.4 46.7 3.9* Mabı soil; CE555.2 me/100 g; BE [email protected]# pH 7.0; 0.01 M CaCl2
@1.19# @2.74# 22.7 40.7 36.6 4.9* Mabı soil; CE531.0 me/100 g; BE [email protected]# pH 5.7; 0.01 M CaCl2
@0.50# @2.39# 76.0 13.4 10.6 2.2* Machete soil; CE58.0 me/100 g; BE [email protected]# pH 6.5; 0.01 M CaCl2
@0.73# @2.59# 14.9 42.8 42.3 2.4* Mercedita soil; CE519.9 me/100 g; BE [email protected]# pH 8.1; 0.01 M CaCl2
@0.61# @2.27# 26.3 27.7 46.0 3.8* Moca soil; CE531.0 me/100 g; BE [email protected]# pH 5.8; 0.01 M CaCl2
@20.28# @1.44# 28.0 47.0 25.0 3.3* Mucara soil; CE519.6 me/100 g; BE 304
J. Phys. Chem. Ref. Data, Vol. 30, No. 1, 2001
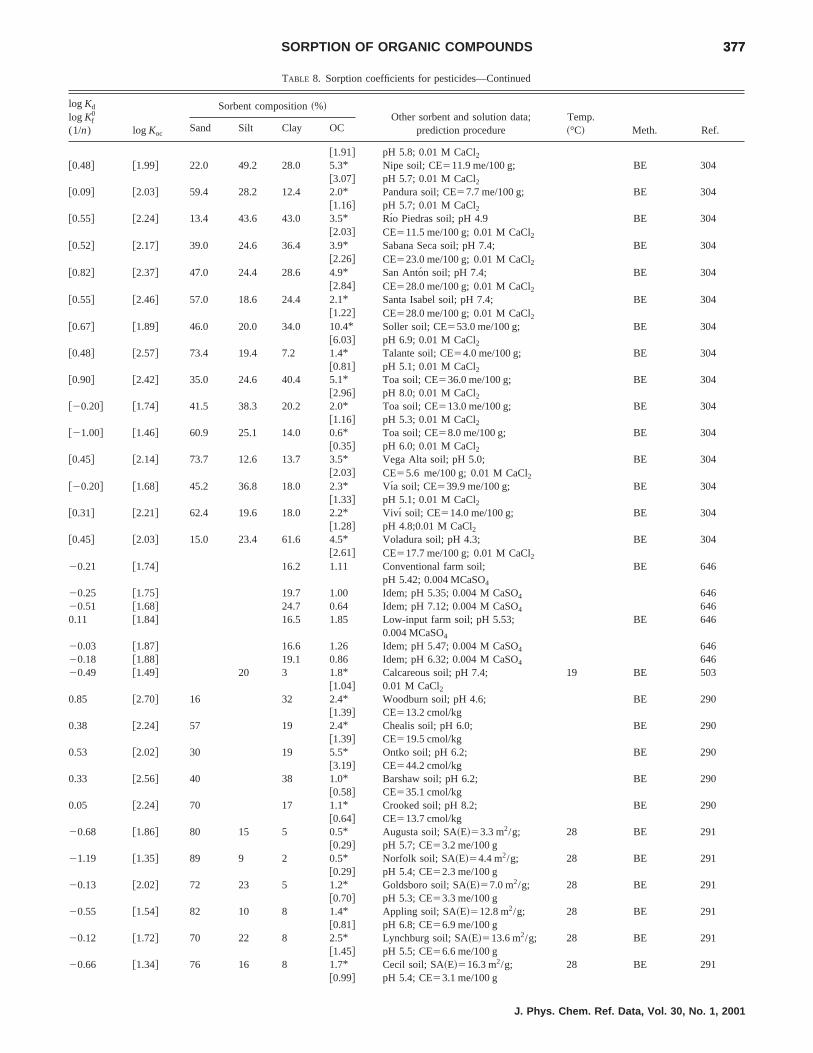
377377SORPTION OF ORGANIC COMPOUNDS
TABLE 8. Sorption coefficients for pesticides—Continued
log Kd
log Kf0
(1/n) log Koc
Sorbent composition~%!Other sorbent and solution data;
prediction procedureTemp.~°C! Meth. Ref.Sand Silt Clay OC
@1.91# pH 5.8; 0.01 M [email protected]# @1.99# 22.0 49.2 28.0 5.3* Nipe soil; CE511.9 me/100 g; BE 304
@3.07# pH 5.7; 0.01 M [email protected]# @2.03# 59.4 28.2 12.4 2.0* Pandura soil; CE57.7 me/100 g; BE 304
@1.16# pH 5.7; 0.01 M [email protected]# @2.24# 13.4 43.6 43.0 3.5* Rıo Piedras soil; pH 4.9 BE 304
@2.03# CE511.5 me/100 g; 0.01 M CaCl2
@0.52# @2.17# 39.0 24.6 36.4 3.9* Sabana Seca soil; pH 7.4; BE [email protected]# CE523.0 me/100 g; 0.01 M CaCl2
@0.82# @2.37# 47.0 24.4 28.6 4.9* San Anton soil; pH 7.4; BE [email protected]# CE528.0 me/100 g; 0.01 M CaCl2
@0.55# @2.46# 57.0 18.6 24.4 2.1* Santa Isabel soil; pH 7.4; BE [email protected]# CE528.0 me/100 g; 0.01 M CaCl2
@0.67# @1.89# 46.0 20.0 34.0 10.4* Soller soil; CE553.0 me/100 g; BE [email protected]# pH 6.9; 0.01 M CaCl2
@0.48# @2.57# 73.4 19.4 7.2 1.4* Talante soil; CE54.0 me/100 g; BE [email protected]# pH 5.1; 0.01 M CaCl2
@0.90# @2.42# 35.0 24.6 40.4 5.1* Toa soil; CE536.0 me/100 g; BE [email protected]# pH 8.0; 0.01 M CaCl2
@20.20# @1.74# 41.5 38.3 20.2 2.0* Toa soil; CE513.0 me/100 g; BE [email protected]# pH 5.3; 0.01 M CaCl2
@21.00# @1.46# 60.9 25.1 14.0 0.6* Toa soil; CE58.0 me/100 g; BE [email protected]# pH 6.0; 0.01 M CaCl2
@0.45# @2.14# 73.7 12.6 13.7 3.5* Vega Alta soil; pH 5.0; BE [email protected]# CE55.6 me/100 g; 0.01 M CaCl2
@20.20# @1.68# 45.2 36.8 18.0 2.3* Vıa soil; CE539.9 me/100 g; BE [email protected]# pH 5.1; 0.01 M CaCl2
@0.31# @2.21# 62.4 19.6 18.0 2.2* Vivı soil; CE514.0 me/100 g; BE [email protected]# pH 4.8;0.01 M CaCl2
@0.45# @2.03# 15.0 23.4 61.6 4.5* Voladura soil; pH 4.3; BE [email protected]# CE517.7 me/100 g; 0.01 M CaCl2
20.21 @1.74# 16.2 1.11 Conventional farm soil;pH 5.42; 0.004 MCaSO4
BE 646
20.25 @1.75# 19.7 1.00 Idem; pH 5.35; 0.004 M CaSO4 64620.51 @1.68# 24.7 0.64 Idem; pH 7.12; 0.004 M CaSO4 6460.11 @1.84# 16.5 1.85 Low-input farm soil; pH 5.53;
0.004 MCaSO4
BE 646
20.03 @1.87# 16.6 1.26 Idem; pH 5.47; 0.004 M CaSO4 64620.18 @1.88# 19.1 0.86 Idem; pH 6.32; 0.004 M CaSO4 64620.49 @1.49# 20 3 1.8* Calcareous soil; pH 7.4; 19 BE 503
@1.04# 0.01 M CaCl20.85 @2.70# 16 32 2.4* Woodburn soil; pH 4.6; BE 290
@1.39# CE513.2 cmol/kg0.38 @2.24# 57 19 2.4* Chealis soil; pH 6.0; BE 290
@1.39# CE519.5 cmol/kg0.53 @2.02# 30 19 5.5* Ontko soil; pH 6.2; BE 290
@3.19# CE544.2 cmol/kg0.33 @2.56# 40 38 1.0* Barshaw soil; pH 6.2; BE 290
@0.58# CE535.1 cmol/kg0.05 @2.24# 70 17 1.1* Crooked soil; pH 8.2; BE 290
@0.64# CE513.7 cmol/kg20.68 @1.86# 80 15 5 0.5* Augusta soil; SA~E!53.3 m2/g; 28 BE 291
@0.29# pH 5.7; CE53.2 me/100 g21.19 @1.35# 89 9 2 0.5* Norfolk soil; SA~E!54.4 m2/g; 28 BE 291
@0.29# pH 5.4; CE52.3 me/100 g20.13 @2.02# 72 23 5 1.2* Goldsboro soil; SA~E!57.0 m2/g; 28 BE 291
@0.70# pH 5.3; CE53.3 me/100 g20.55 @1.54# 82 10 8 1.4* Appling soil; SA~E!512.8 m2/g; 28 BE 291
@0.81# pH 6.8; CE56.9 me/100 g20.12 @1.72# 70 22 8 2.5* Lynchburg soil; SA~E!513.6 m2/g; 28 BE 291
@1.45# pH 5.5; CE56.6 me/100 g20.66 @1.34# 76 16 8 1.7* Cecil soil; SA~E!516.3 m2/g; 28 BE 291
@0.99# pH 5.4; CE53.1 me/100 g
J. Phys. Chem. Ref. Data, Vol. 30, No. 1, 2001
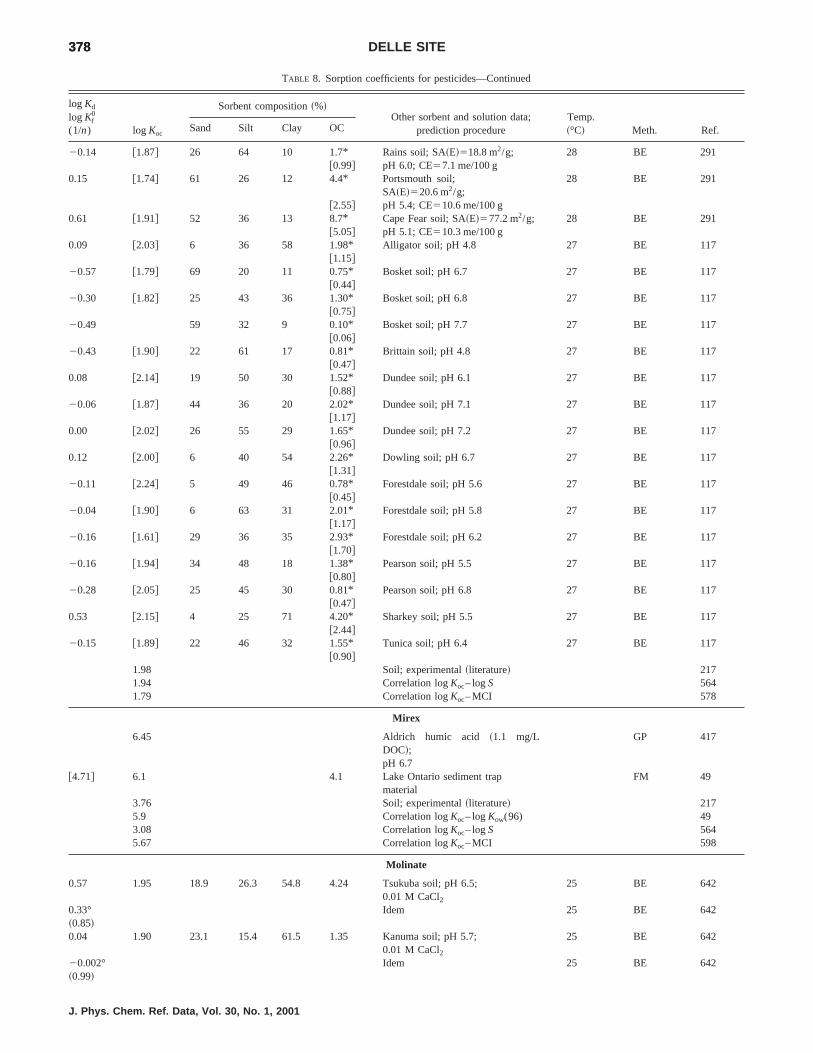
378378 DELLE SITE
TABLE 8. Sorption coefficients for pesticides—Continued
log Kd
log Kf0
(1/n) log Koc
Sorbent composition~%!Other sorbent and solution data;
prediction procedureTemp.~°C! Meth. Ref.Sand Silt Clay OC
20.14 @1.87# 26 64 10 1.7* Rains soil; SA~E!518.8 m2/g; 28 BE [email protected]# pH 6.0; CE57.1 me/100 g
0.15 @1.74# 61 26 12 4.4* Portsmouth soil;SA~E!520.6 m2/g;
28 BE 291
@2.55# pH 5.4; CE510.6 me/100 g0.61 @1.91# 52 36 13 8.7* Cape Fear soil; SA~E!577.2 m2/g; 28 BE 291
@5.05# pH 5.1; CE510.3 me/100 g0.09 @2.03# 6 36 58 1.98* Alligator soil; pH 4.8 27 BE 117
@1.15#20.57 @1.79# 69 20 11 0.75* Bosket soil; pH 6.7 27 BE 117
@0.44#20.30 @1.82# 25 43 36 1.30* Bosket soil; pH 6.8 27 BE 117
@0.75#20.49 59 32 9 0.10* Bosket soil; pH 7.7 27 BE 117
@0.06#20.43 @1.90# 22 61 17 0.81* Brittain soil; pH 4.8 27 BE 117
@0.47#0.08 @2.14# 19 50 30 1.52* Dundee soil; pH 6.1 27 BE 117
@0.88#20.06 @1.87# 44 36 20 2.02* Dundee soil; pH 7.1 27 BE 117
@1.17#0.00 @2.02# 26 55 29 1.65* Dundee soil; pH 7.2 27 BE 117
@0.96#0.12 @2.00# 6 40 54 2.26* Dowling soil; pH 6.7 27 BE 117
@1.31#20.11 @2.24# 5 49 46 0.78* Forestdale soil; pH 5.6 27 BE 117
@0.45#20.04 @1.90# 6 63 31 2.01* Forestdale soil; pH 5.8 27 BE 117
@1.17#20.16 @1.61# 29 36 35 2.93* Forestdale soil; pH 6.2 27 BE 117
@1.70#20.16 @1.94# 34 48 18 1.38* Pearson soil; pH 5.5 27 BE 117
@0.80#20.28 @2.05# 25 45 30 0.81* Pearson soil; pH 6.8 27 BE 117
@0.47#0.53 @2.15# 4 25 71 4.20* Sharkey soil; pH 5.5 27 BE 117
@2.44#20.15 @1.89# 22 46 32 1.55* Tunica soil; pH 6.4 27 BE 117
@0.90#1.98 Soil; experimental~literature! 2171.94 Correlation logKoc– logS 5641.79 Correlation logKoc– MCI 578
Mirex
6.45 Aldrich humic acid ~1.1 mg/LDOC!;pH 6.7
GP 417
@4.71# 6.1 4.1 Lake Ontario sediment trapmaterial
FM 49
3.76 Soil; experimental~literature! 2175.9 Correlation logKoc– logKow(96) 493.08 Correlation logKoc– logS 5645.67 Correlation logKoc– MCI 598
Molinate
0.57 1.95 18.9 26.3 54.8 4.24 Tsukuba soil; pH 6.5;0.01 M CaCl2
25 BE 642
0.33° Idem 25 BE 642~0.85!0.04 1.90 23.1 15.4 61.5 1.35 Kanuma soil; pH 5.7;
0.01 M CaCl2
25 BE 642
20.002° Idem 25 BE 642~0.99!
J. Phys. Chem. Ref. Data, Vol. 30, No. 1, 2001

379379SORPTION OF ORGANIC COMPOUNDS
TABLE 8. Sorption coefficients for pesticides—Continued
log Kd
log Kf0
(1/n) log Koc
Sorbent composition~%!Other sorbent and solution data;
prediction procedureTemp.~°C! Meth. Ref.Sand Silt Clay OC
2.04 Correlation logKoc– logS 5642.46 Correlation logKoc– MCI 598
Monolinuron
@0.39# @1.97# 4.54* Warwick, Qld, soil; pH 6.3; BE [email protected]# 0.01 M CaCl2
@0.10# @1.73# 4.07* Rutherglen, Vic., soil; pH 4.8; BE [email protected]# 0.01 M CaCl2
@20.19# @1.78# 1.86* Wagga, N.S.W., soil; pH 5.1; BE [email protected]# 0.01 M CaCl2
@20.12# @1.67# 2.81* Turretfield, S.A., soil; pH 5.2; BE [email protected]# 0.01 M CaCl2
@20.23# @1.97# 1.09* Warracknabeal, Vic., soil; BE [email protected]# pH 8.0; 0.01 M CaCl2
@0.03# @1.76# 3.20* Warracknabeal, Vic., soil; BE [email protected]# pH 8.4; 0.01 M CaCl2
@0.00# @1.42# 6.62* Balkuling soil; pH 5.6; BE [email protected]# 0.01 M CaCl2
@20.18# @1.73# 2.14* Kojonup soil; pH 5.5; BE [email protected]# 0.01 M CaCl2
@20.16# @1.93# 1.42* Warranine soil; pH 6.5; BE [email protected]# 0.01 M CaCl2
@20.02# @1.50# 5.17* Yalanbee soil; pH 6.4; BE [email protected]# 0.01 M CaCl2
@20.06# @1.72# 2.85* Avondale soil; pH 5.9; BE [email protected]# 0.01 M CaCl2
@20.06# @1.98# 1.58* Badgingarra soil; pH 6.3; BE [email protected]# 0.01 M CaCl2
@21.34# @1.87# 0.19* Badgingarra soil; pH 6.3; BE [email protected]# 0.01 M CaCl2
@0.03# @1.80# 2.92* Beverley soil; BE [email protected]# 0.01 M CaCl2
@0.16# @1.82# 3.78* Gabalong soil; pH 5.9; BE [email protected]# 0.01 M CaCl2
@20.26# @1.92# 1.13* Perth soil; pH 5.9; BE [email protected]# 0.01 M CaCl2
@0.03# @2.00# 1.86* Tammin soil; pH 5.9; BE [email protected]# 0.01 M CaCl2
1.51° 47.5 33.2 20.3 10.5* Melfort soil; pH 5.9 25 BE 260~0.69! @6.09#0.74° 53.3 27.5 19.2 6.46* Weybum soil; pH 6.5 25 BE 260~0.80! @3.75#0.56° 5.3 25.3 69.5 4.15* Regina soil; pH 7.7 25 BE 260~0.80! @2.41#0.76° 69.3 12.3 18.5 4.07* Indian Head soil; pH 7.8 25 BE 260~0.69! @2.36#0.08° 81.6 10.4 8.0 1.77* Asquith soil; pH 7.5 25 BE 260~0.84! @1.03#0.55° 75 1.3 Eurosol-1; c; pH 5.1; BE 583~0.79! 0.01 M CaCl20.07° 22.6 3.7 Eurosol-2; sil; pH 7.4; BE 583~1.37! 0.01 M CaCl20.25° 1.71 17.0 3.45 Eurosol-3; l; pH 5.2; BE 583~1.09! 0.01 M CaCl220.06° 20.3 1.55 Eurosol-4; si; pH 6.5; BE 583~0.82! 0.01 M CaCl21.41° 6.0 9.25 Eurosol-5; ls; pH 3.2; BE 583~0.83! 0.01 M CaCl21.91° 7 10 10 36.5 Sunway farm light peat;
pH 5.2; CE560 me/100 g22 BE 259
1.40° 45.5 15.9 6.6 12.0 Grat House E.H.F. soil; pH 6.3;CE518 me/100 g
22 BE 259
J. Phys. Chem. Ref. Data, Vol. 30, No. 1, 2001

380380 DELLE SITE
TABLE 8. Sorption coefficients for pesticides—Continued
log Kd
log Kf0
(1/n) log Koc
Sorbent composition~%!Other sorbent and solution data;
prediction procedureTemp.~°C! Meth. Ref.Sand Silt Clay OC
1.32° 23 24.4 28.6 11.7 Toll Farm heavy peat; pH 7.4;CE541 me/100 g
22 BE 259
1.04° 34.0 33.4 32.6 3.69 Trawscoed E.H.F. soil; pH 6.2;CE512 me/100 g
22 BE 259
0.98° 66.0 18.4 15.6 1.93 Weed Res. soil; pH 7.1;CE511 me/100 g
22 BE 259
0.91° 36.0 40.4 23.6 1.76 Rosemaunde E.H.F. soil; pH 6.7;CE514 me/100 g
22 BE 259
0.39° 9.8 0.1* Soil; s, mesic; pH 7.0; BE 72~0.50! @0.06# SA~W!514.8 m2/g0.52° 15.0 1.0* Soil; s, mixed mesic; pH 7.6; BE 72~0.86! @0.58# SA~W!518.1 m2/g0.51° 13.0 1.4* Soil; s, mixed, mesic; pH 7.3; BE 72~0.60! @0.81# SA~W!530.3 m2/g0.69° 6.8 1.5* Soil; s, mixed, mesic; pH 7.1; BE 72~0.81! @0.87# SA~W!515.2 m2/g0.53° @2.56# 31.5 1.6* Soil; s, c, mesic; pH 6.6; BE 72~0.91! @0.93# SA~W!572.4 m2/g0.62° 10.6 1.9* Soil; s, mesic; pH 4.2; BE 72~0.82! @1.10# SA~W!538.6 m2/g0.80° 18.3 1.2* Soil; s, mesic; pH 6.9; BE 72~0.87! @0.70# SA~W!555.8 m2/g1.10° @2.68# 4.5 4.6* Soil; s, mesic; pH 3.7; BE 72~0.90! @2.67# SA~W!522.4 m2/g
2.30 Soil; experimental~literature! 2172.45av 10 soils~literature! 871.21 Correlation logKoc– logKow 962.36 Correlation logKoc– logS 962.08 Correlation logKoc– logS~mp! 962.11 Correlation logKoc– logS 564
Monuron
1.38° 100 Na–montmorillonite~1–0.2mm!; 25 BE 250~0.48! pH 6.80; CE587.0 me/100 g2.00° 100 H–montmorillonite~1–0.2mm!; 25 BE 250~0.98! pH 3.35; CE573.5 me/100 g1.51° 100 H–montmorillonite; pH 3.6 BE 212~0.80!1.38° 100 Na–montmorillonite; pH 7.9 BE 212~0.80!1.38° 100 Ca–montmorillonite; pH 7.9 BE 212~0.80!1.36° 100 Mg–montmorillonite; pH 8.2 BE 212~0.80!0.88 100 Montmorillonite-H~Al ! ~,0.2 mm!;
pH 3.53.5 BE 244
1.46 100 Bentonite–H~Al ! ~,0.2 mm!;pH 3.5; CE50.72 me/g
3.5 BE 244
1.36 100 Bentonite–Al~H! ~,0.2 mm! 3.5 BE 2441.00 100 Bentonite–Na~,0.2 mm!; pH 6.7;
CE50.83 me/g; SA~E!5758 m2/gSalt conc.50.1 N
3.5 BE 244
1.11 100 Bentonite–Ca~,0.2 mm!; pH 6.7;CE50.88 me/g; Salt conc.50.1 N
3.5 BE 244
1.31 100 Bentonite–Mg~,0.2 mm!; pH 6.7;CE50.84 me/g; Salt conc.50.1 N
3.5 BE 244
1.01av 100 Bentonite–Na~,0.2 mm!; pH 6.7;CE50.83 me/g;Salt conc.50.005– 1 N
26.5 BE 244
1.45 100 Idem; Salt conc.53 N 26.5 BE 2441.12av 100 Bentonite–Ca~,0.2 mm!; pH 6.7;
CE50.88 me/g;Salt conc.50.005– 1 N
26.5 BE 244
J. Phys. Chem. Ref. Data, Vol. 30, No. 1, 2001

381381SORPTION OF ORGANIC COMPOUNDS
TABLE 8. Sorption coefficients for pesticides—Continued
log Kd
log Kf0
(1/n) log Koc
Sorbent composition~%!Other sorbent and solution data;
prediction procedureTemp.~°C! Meth. Ref.Sand Silt Clay OC
1.65 100 Idem; Salt conc.53 N 26.5 BE 2441.17 100 Bentonite–Mg~,0.2 mm!; pH 6.7;
CE50.84 me/g;Salt conc.50.1 N
26.5 BE 244
1.21° Bentonite; 0.1 MCaCl2 22 BE 144~0.80!1.65 100 Mississippi bentonite; pH 8.5 0 BE 2510.64 Idem 50 2511.61 @1.96# 77* Houghton muck; pH 5.6 0 BE 251
@44.7#1.66 @2.01# Idem 50 251
@1.70#av 1.09-* 4 soils; slit loam; pH 6.1–7.5 20 BE 1204.25* 0.01 M CaCl2
@0.42# @2.00# 4.54* Warwick, Qld, soil; pH 6.3; BE [email protected]# 0.01 M CaCl2
@0.01# @1.64# 4.07* Rutherglen, Vic., soil; pH 4.8; BE [email protected]# 0.01 M CaCl2
@20.20# @1.77# 1.86* Wagga, N.S.W., soil; pH 5.1; BE [email protected]# 0.01 M CaCl2
@20.13# @1.66# 2.81* Turretfield, S.A., soil; pH 5.2; BE [email protected]# 0.01 M CaCl2
@20.35# @1.85# 1.09* Warracknabeal, Vic., soil; pH 8.0; BE [email protected]# 0.01 M CaCl2
@0.05# @1.78# 3.20* Warracknabeal, Vic., soil; pH 8.4; BE [email protected]# 0.01 M CaCl2
@20.03# @1.39# 6.62* Balkuling soil; pH 5.6; BE [email protected]# 0.01 M CaCl2
@20.24# @1.67# 2.14* Kojonup soil; pH 5.5; BE [email protected]# 0.01 M CaCl2
@20.19# @1.90# 1.42* Warranine soil; pH 6.5; BE [email protected]# 0.01 M CaCl2
@20.08# @1.44# 5.17* Yalanbee soil; pH 6.4; BE [email protected]# 0.01 M CaCl2
@20.20# @1.58# 2.85* Avondale soil; pH 5.9; BE [email protected]# 0.01 M CaCl2
@20.18# @1.86# 1.58* Badgingarra soil; pH 6.3; BE [email protected]# 0.01 M CaCl2
@21.11# @1.85# 0.19* Badgingarra soil; pH 6.3; BE [email protected]# 0.01 M CaCl2
@0.00# @1.77# 2.92* Beverly soil; BE [email protected]# 0.01 M CaCl2
@0.07# @1.73# 3.78* Gabalong soil; pH 5.9; BE [email protected]# 0.01 M CaCl2
@20.29# @1.89# 1.13* Perth soil; pH 5.9; BE [email protected]# 0.01 M CaCl2
@20.15# @1.82# 1.86* Tammin soil; pH 5.9; BE [email protected]# 0.01 M CaCl2
1.52° 47.5 33.2 20.3 10.5* Melfort soil; pH 5.9 25 BE 260~0.67! @6.09#0.76° 53.3 27.5 19.2 6.46* Weybum soil; pH 6.5 25 BE 260~0.80! @3.75#0.51° 5.3 25.3 69.5 4.15* Regina soil; pH 7.7 25 BE 260~0.84! @2.41#0.71° 69.3 12.3 18.5 4.07* Indian Head soil; pH 7.8 25 BE 260~0.72! @2.36#0.00° @1.97# 81.6 10.4 8.0 1.77* Asquith soil; pH 7.5 25 BE 260~1.04! @1.03#0.69° 2.58 75 1.3 Eurosol-1; c; pH 5.1; BE 583~0.90! 0.01 M CaCl20.33° 22.6 3.7 Eurosol-2; sil; pH 7.4; BE 583~0.86! 0.01 M CaCl20.39° 17.0 3.45 Eurosol-3; l; pH 5.2; BE 583~0.81! 0.01 M CaCl2
J. Phys. Chem. Ref. Data, Vol. 30, No. 1, 2001

382382 DELLE SITE
TABLE 8. Sorption coefficients for pesticides—Continued
log Kd
log Kf0
(1/n) log Koc
Sorbent composition~%!Other sorbent and solution data;
prediction procedureTemp.~°C! Meth. Ref.Sand Silt Clay OC
20.04° 20.3 1.55 Eurosol-4; si; pH 6.5; BE 583~0.80! 0.01 M CaCl21.34° 6.0 9.25 Eurosol-5; ls; pH 3.2; BE 583~0.85! 0.01 M [email protected]# @1.75# 63* Mesic peat~acid treated!; BE 477
@36.5# 0.01 M CaCl21.88° 7 10 10 36.5 Sunway farm light peat;
pH 5.2; CE560 me/100 g22 BE 259
1.42° 45.5 15.9 6.6 12.0 Great House E.H.F. soil;pH 6.3; CE518 me/100 g
22 BE 259
1.34° 23 24.4 28.6 11.7 Toll Farm heavy peat; pH 7.4;CE541 me/100 g
22 BE 259
0.86° 34.0 33.4 32.6 3.69 Trawscoed E.H.F. soil; pH 6.2;CE512 me/100g
22 BE 259
0.74° 66.6 18.4 15.6 1.93 Weed Res. soil; pH 7.1;pH 6.7; CE511 me/100 g
22 BE 259
0.68° 36.0 40.4 23.6 1.76 Rosemaunde E.H.F. soil;pH 6.7; CE514 me/100 g
22 BE 259
1.37° 45.5 15.9 6.6 12 Great House E.H.F. soil; pH 6.3; 22 BE 144~0.83! CE518 me/100 g; 0.1 M CaCl2
0.78° 66.0 18.4 15.6 1.93 Weed Res. Orgn. soil; pH 7.1; 22 BE 144~0.74! CE511 me/100 g; 0.1 M CaCl2
1.96 @2.32# 76*@44#
OM from peat soil; 0.1 M CaCl2 22 BE 144
0.04° 18 3.3* Lakeland sl soil; pH 6.2; 26 BE 633~0.70! @1.91# CE52.9 me/100 g; 0.01 M CaCl2
0.28° 43 1.1.9* Wehadkee sil soil; pH 5.6; 26 BE 633~0.71! @1.10# CE510.2 me/100 g; 0.01 M CaCl2
0.52° 38 4.4* Chillum sil soil; pH 4.6; 26 BE 633~0.84! @2.55# CE57.6 me/100 g; 0.01 M CaCl2
0.60° 48 4.3* Hagerstown sicl soil; pH 5.5; 26 BE 633~0.76! @2.49# CE512.5 me/100 g; 0.01 M CaCl2
0.42° 2.1* Keyport sil soil; pH 5.4; BE 641~0.68! @1.22# average particle size55.6mm20.40° 0.7* Cecil ls soil; pH 5.8; BE 641~1.2! @0.41# average particle size510.5mm
2.00 Cyanopropyl column; ring test RPLC 5812.00 Soil; experimental~literature! 2172.26av 18 soils~literature! 871.07,1.73
Correlation logKoc– logKow 96
2.58 Correlation logKoc– log S 961.52 Correlation logKoc– logS~mp! 962.34 Correlation logKoc– logS 564
Napropamide
0.30av 2.56av 0.55av Tujunga agricul. 1s soil;36 samples; 0.01 N CaCl2
20 BE 276
0.28av 2.52av 0.57av Idem; 36 soil columns;8 me/L CaSO4 irrigation solut.
MD 276
20.57 7.5 0.06 Mivtachim agric. surface soil;pH 8.5; 3.5% CaCO3
BE 277
0.15 2.54 13.7 0.40 Bet Degan I agric. surface soil;pH 7.9; 2.3% CaCO3
BE 277
0.28 2.54 23.1 0.55 Gilat agric. surface soil; pH 7.8;12.9% CaCO3
BE 277
0.47 2.47 42.5 1.01 Bet Degan II agric. surface soil;pH 7.8; 2.6% CaCO3
BE 277
0.37 2.51 70.0 0.72 Shefer agric. surface soil;pH 7.2; 0.2% CaCO3
BE 277
0.47 2.40 70.0 1.18 Neve Yaar agric. surface soil;pH 7.7; 8.9%CaCO3
BE 277
J. Phys. Chem. Ref. Data, Vol. 30, No. 1, 2001

383383SORPTION OF ORGANIC COMPOUNDS
TABLE 8. Sorption coefficients for pesticides—Continued
log Kd
log Kf0
(1/n) log Koc
Sorbent composition~%!Other sorbent and solution data;
prediction procedureTemp.~°C! Meth. Ref.Sand Silt Clay OC
0.07 @2.62# 0.28 Pachappa s1 soil; pH 7.4;0.005 M CaCl2
20 BE 529
0.03 @2.59# Idem 30 5291.41° @3.32# 93 4 3 2.1* Cobb s12% muck; pH 5.3; BE 278~1.04! @1.22# CE59.0 me/100 g;0.94° @2.92# 96 3 1 1.8* Cobb s11% muck; pH 5.6; BE 278~1.0! @1.04# CE57.8 me/100 g0.95° 26 28 46 1.6* Port soil; pH 6.4; BE 278~0.83! @0.93# CE514.6 me/100 g;0.55° 60 20 20 1.2* Teller soil; pH 6.6; BE 278~0.84! @0.70# CE57.3 me/100 g;0.30° 87 4 9 0.6* Cobb soil; pH 6.0; BE 278~0.84! @0.35# CE53.0 me/100 g1.36 2.40 35 9.1 Eversham c soil;~0–0.02 m depth!;
pH 7.8. 0.005 M CaCl2
BE 137
1.25 2.38 .35 7.3 Idem~0.02–0.22 m depth! [email protected]# 2.66 14.2 4.5 0.25 Tujunga soil; pH 6.7 BE [email protected]# 2.88 33.4 50.4 7.10 Bermeo soil; pH 5.3 BE 42320.05 2.95 11.2 0.17*
@0.10#Netanya agricult. surface soil 25 BE 641
20.33 2.26 6.9 0.45*@0.26#
Mivtahim agricult. surface soil 25 BE 563
0.50 2.67 63.1 1.18*@0.68#
Golan agricult. surface soil 25 25 BE 563
0.27 2.40 23.8 1.25*@0.73#
Gilat agricult. surface soil 25 BE 563
0.46 2.54 72.5 1.42*@0.82#
Shefer agricult. surface soil 25 BE 563
0.35 2.42 10.6 1.45*@0.84#
Bet Degan agricult. surface soil 25 BE 563
0.64 2.43 71.2 2.82*@1.64#
Neve Yaar agricult. surface soil 25 BE 563
0.89 2.36 76.2 5.82*@3.38#
Malkiya agricult. surface soil 25 BE 563
0.88 2.63 3.08*@1.79#
Kinneret Lake sediment 25 BE 563
1.49 2.83 60.5 7.85*@4.55#
Kinneret A Lake sediment 25 BE 563
1.44 2.81 63.2 7.43*@4.31#
Kinneret F Lake sediment 25 BE 563
1.33 2.92 63.8 4.39*@2.55#
Kinneret G Lake sediment 25 BE 563
3.21 Peat humic acid ED 4232.98av Soil humic acid ED 4231.69av Soil fulvic acid ED 4232.83 Soil; experimental~literature! 2172.94av 33 soils~literature! 872.62av 36 literature data 5622.61 Correlation logKoc– logS 564
Neburon
2.82° 7 10 10 36.5 Sunway farm light peat;pH 5.2; CE560 me/100 g
22 BE 259
2.51° 45.5 15.9 6.6 12.0 Grat House E.H.F. soil; pH 6.3;CE518 me/100 g
22 BE 259
2.38° 23 24.4 28.6 11.7 Toll Farm heavy peat; pH 7.4;CE541 me/100 g
22 BE 259
2.14° 34.0 33.4 32.6 3.69 Trawscoed E.H.F. soil; pH 6.2;CE512 me/100 g
22 BE 259
1.86° 66.0 18.4 15.6 1.93 Weed Res. soil; pH 7.1;CE511 me/100 g
22 BE 259
1.76° 36.0 40.4 23.6 1.76 Rosemaunde E.H.F. soil; pH 6.7;CE514 me/100 g
22 BE 259
J. Phys. Chem. Ref. Data, Vol. 30, No. 1, 2001

384384 DELLE SITE
TABLE 8. Sorption coefficients for pesticides—Continued
log Kd
log Kf0
(1/n) log Koc
Sorbent composition~%!Other sorbent and solution data;
prediction procedureTemp.~°C! Meth. Ref.Sand Silt Clay OC
3.36 Soil; experimental~literature! 2173.49av 5 soils~literature! 873.26 Correlation logKoc– logS 5642.95 Correlation logKoc– MCI 598
Nitralin
1.70 @3.33# 6 71 23 4.0* Plano soil (soil/solut.51 g/100 mL) 25 BE [email protected]# pH 6.3; CE520 me/100 g
1.58 @3.22# 6 71 23 4.0*@2.32#
Idem (soil/solut.52 g/100 mL) 25 BE 351
1.63 @3.27# 6 71 23 4.0*@2.32#
Idem (soil/solut.54 g/100 mL) 25 BE 351
2.33 @3.97# 6 71 23 4.0*@2.32#
Idem (soil/solut.52 g/100 mL) 5 BE 351
2.98 Soil; experimental~literature! 2173.76 Correlation logKoc– logS 564
Nitrapyrin
@2.24#av 1.35* , 2 Cottenham sl soils; 20 BE 1205.92* ph 7.2; 6.8, 0.01 M CaCl2
2.66av 38 48 14 0.68 Commerce soil; pH 6.7 BE 575~three 56 30 14 1.12 Tracy soil; pH 6.2 BE 575soils! 12 56 32 2.01 Catlin soil; pH 6.2 BE 5752.62 Soil; experimental~literature! 2172.87 C18 column RPLC 5732.76 Correlation logKoc– logS 564
Oxadiazon
3.24 @3.51# 94*@54.5#
OM from peaty muck~Histosol!soil; pH 5.5
24 BE 121
3.51 Soil; experimental~literature! 2173.72 Correlation logKoc– logS 564
Oxamyl
21.30 1.90 7.5 0.11*@0.06#
Mivtahim agricult. surface soil 25 BE 563
20.64 1.53 63.1 1.18*@0.68#
Golan agricult. surface soil 25 BE 563
20.82 1.44 23.1 0.95*@0.55#
Gilat agricult. surface soil 25 BE 563
20.58 1.56 70.0 1.23*@0.71#
Shefer agricult. surface soil 25 BE 563
21.10 1.31 13.7 0.68*@0.39#
Bet Degan agricult. surface soil 25 BE 563
20.51 1.42 70.0 2.03*@1.18#
Neve Yaar agricult. surface soil 25 BE 563
20.62 0.85 76.2 5.82*@3.38#
Malkiya agricult. surface soil 25 BE 563
20.39 0.95 60.5 7.85*@4.55#
Kinneret A sediment 25 BE 563
20.39 0.98 63.2 7.43*@4.31#
Kinneret F sediment 25 BE 563
20.29 1.30 63.8 4.39*@2.55#
Kinneret G sediment 25 BE 563
@0.71#av 1.35* , 2 Cottenham sl soils; 20 BE 1205.92* pH 7.2; 6.8; 0.01 M CaCl2
0.60 Correlation logKoc– logS 564
Paraoxon
1.73°~1.16!
100 Na–montmorillonite~,2 mm! 20 BE 246
1.63°~1.45!
100 Ca–montmorillonite~,2 mm! 20 BE 246
J. Phys. Chem. Ref. Data, Vol. 30, No. 1, 2001

385385SORPTION OF ORGANIC COMPOUNDS
TABLE 8. Sorption coefficients for pesticides—Continued
log Kd
log Kf0
(1/n) log Koc
Sorbent composition~%!Other sorbent and solution data;
prediction procedureTemp.~°C! Meth. Ref.Sand Silt Clay OC
1.91°~1.38!
100 Fe–montmorillonite~, 2mm! 20 BE 246
Paraquat
4.86 Li–montmorillonite~,0.15mm! BE 6503.85° 45.2 Acid light peat; pH 5.3 22 BE 3063.70° 33.1 Alkaline light peat; pH 7.2 22 BE 3063.70° 44.0 Lightpeat; pH 6.8 22 BE 3063.97° 53.3 Fine sphagnum peat; pH 3.3 22 BE 3063.49° 44.0 Top 2.5 cm below turf layer; pH 5.7 22 BE 3063.52° 27.2 2.5–5 cm below turf layer; pH 4.4 22 BE 3063.57° Grass 22 BE 306
4.62°* Humic acid from peat soil ED 3063.42°* Lignin 22 BE 3061.81°* Whatman cellulose powder 22 BE 306
3.00° 67 18 15 2.5*@1.45#
Begbroke soil; pH 7.3;CE511.8 me/100 g
22 BE 306
4.78* Fuller’s earth~Ca–montmorillonite!CE584–88 me/100 g
22 BE 306
4.19 Soil; experimental~literature! 2170.30 Correlation logKoc– logS 564
Parathion
2.10*~1.04!
100 Na–montmorillonite~,2 mm! 20 BE 246
2.36°~1.51!
100 Ca–montmorollonite~,2 mm! 20 BE 246
2.89°~1.19!
100 Fe–montmorillonite~,2 mm! 20 BE 246
1.94°~1.04!
100 Ca–illite~,2 mm! ~3.33E-3 g/mL! 20 BE 486
1.90°~0.98!
Idem ~3.33E-2 g/mL! 486
1.89°~0.97!
Idem ~1.00E-1 g/mL! 486
1.55°~0.90!
@3.19# 3.9°@2.26#
Bondhead sl soil~6.67E-3 g/mL! 20 BE 486
1.52°~0.88!
@3.15# Idem ~1.67E-2 g/mL! 486
1.53°~0.83!
Idem ~3.33E-2 g/mL! 486
1.51°~0.84!
Idem ~6.67E-2 g/mL! 486
1.49°~0.82!
Idem ~1.67E-1 g/mL! 486
1.43°~0.82!
Idem ~3.33E-1 g/mL! 486
1.56°~0.89!
@3.17# Idem ~variable sorbent conc.! 486
1.46°~0.98!
@3.11# 77 15 8 3.9*@2.26#
Bondhead soil; pH 6.9 BE 536
@1.33# @3.02# 3.53* Batcombe sil soil; pH 6.1; 20 BE [email protected]# 0.01 M CaCl2
@0.65# @2.93# 23 42 0.9* Panoche soil; CE515.4 me/100 g; BE [email protected]# pH 7.5; SA5100 m2/g
@1.47# @3.23# 61 27 3.0* Palouse soil; CE510.0 me/100 g; BE [email protected]# pH 5.9; SA542 m2/g
@1.15# @3.11# 9 68 21 1.9*@1.1#
Woodburn soil 20 BE 198
0.66° 77 15 8 0.51 Sarpy soil; pH 7.3; 24 BE 122~0.83! CE55.7 me/100 g; 0.01 M CaCl2
0.95° 83 9 8 1.07 Thurman soil; pH 6.83; 24 BE 122~0.83! CE56.1 me/100 g; 0.01 M CaCl2
J. Phys. Chem. Ref. Data, Vol. 30, No. 1, 2001

386386 DELLE SITE
TABLE 8. Sorption coefficients for pesticides—Continued
log Kd
log Kf0
(1/n) log Koc
Sorbent composition~%!Other sorbent and solution data;
prediction procedureTemp.~°C! Meth. Ref.Sand Silt Clay OC
1.47° @3.05# 37 42 21 2.64 Clarion agric. soil; pH 5.00; 24 BE 122~0.88! CE521.0 me/100 g; 0.01 M CaCl2
1.50° 21 55 24 3.80 Harps agric. soil; pH 7.30; 24 BE 122~0.80! CE537.8 me/100 g; 0.01 M CaCl2
2.31° 42 39 19 18.36 Peat; pH 6.98; 24 BE 122~0.81! CE577.3 me/100 g; 0.01 M CaCl2
2.69°~0.95!
@3.05# 52 34 14 75.3*@43.7#
Soil; organic; pH 6.1 BE 264
1.30°~0.99!
@3.09# 71 22 7 2.8*@1.62#
Big Creek sediment; pH 6.6 BE 264
1.19°~1.01!
@3.03# 56 30 14 2.5*@1.45#
Beverly soil; pH 6.8 BE 264
0.78°~0.98!
@3.17# 91.5 1.5 7 0.7*@0.41#
Plainfield soil; pH 7.0 BE 264
1.59 @3.22# 63 3.72*@2.16#
Meron soil; pH 6.6 BE 267
1.88 @2.89# 64 4.88*@2.83#
Golan soil; pH 7.1 BE 267
2.21 @3.89# 72 4.55*@2.64#
Bet Guvrin soil; pH 7.1 BE 267
2.94 @3.18# 95*@55.1#
Peat soil BE 267
1.08 @3.20# 33 1.3* Hoban sicl soil; pH 7.7; BE [email protected]# CE522 me/100 g
1.12 72 Harlingen c soil; pH 8.2 BE 2681.00 Idem LE 2680.64 @2.44# 44 0.4* Nacogdoches c soil; BE 268
@0.23# pH 5.0; CE514 me/100 g0.35 @2.99# Idem LE 2680.37 17 Norwood sil soil; pH 8.2 LE 2680.71 @2.39# 8 0.5* Amarillo fine sl soil; LE 268
@0.29# pH 7.7; CE58 me/100 g0.78 @2.13# 6 1.0*
@0.58#Katy sil soil; pH 5.1 LE 268
0.88° @3.24# 79.6 4.8 15.6 0.75* Alluvial soil; pH 6.20; BE 129~1.04! @0.44# CE518.6 me/100 g;1.09° @3.12# 75.9 3.4 20.7 1.62* Lateritic soil; pH 6.25; BE 129~1.05! @0.94# CE526.6 me/100 g0.50°~1.33!
Idem; oxidized with H2O2 129
1.58° @3.36# 69.6 6.8 23.6 2.88* Lateritic soil; pH 6.30; BE 129~1.11! @1.67# CE542.8 me/100 g1.03°~1.33!
Idem; oxidized with H2O2 129
2.10° @3.60# 45.6 7.8 45.6 5.52* Pokkali soil; pH 5.2; BE 129~1.05! @3.20# CE519.2 me/100 g2.33° @3.65# 53.6 12.8 33.6 8.21* Kari soil; pH 3.5; BE 129~1.03! @4.76# CE521.2 me/100 g;2.66° @3.51# 63.6 6.8 29.6 24.6* Kari soil; pH 3.3; BE 129~1.02! @14.3# CE528.9 me/100 g;@0.80# @3.56# 6 0.3* Mivtahim s regosol; pH 8; 10 BE 139
@0.17# CE54 me/100 g; SA539 m2/[email protected]# @3.51# Idem 30 [email protected]# @3.31# Idem 50 [email protected]# @3.20# 56 1.9* Har-Bargan calcareous reddish- 10 BE 139
@1.1# brown alluv. grumsol; pH 7.7;CE563 me/100 g; SA5410 m2/g
@1.01# @2.97# Idem 30 [email protected]# @2.92# Idem 50 [email protected]# @3.41# 14 0.7* Netanya scl; pH 6.3; 10 BE 139
@0.41# CE58 me/100 g; SA590 m2/[email protected]# @3.25# Idem 30 [email protected]# @3.11# Idem 50 139
J. Phys. Chem. Ref. Data, Vol. 30, No. 1, 2001

387387SORPTION OF ORGANIC COMPOUNDS
TABLE 8. Sorption coefficients for pesticides—Continued
log Kd
log Kf0
(1/n) log Koc
Sorbent composition~%!Other sorbent and solution data;
prediction procedureTemp.~°C! Meth. Ref.Sand Silt Clay OC
20.11 2.89 11.2 0.17*@0.10#
Netanya agricult. surface soil 25 BE 563
0.14 2.72 6.9 0.45*@0.26#
Mivtahim agricult. surface soil 25 BE 563
0.56 2.73 63.1 1.18*@0.68#
Golan agricult. surface soil 25 BE 563
0.73 2.87 23.8 1.25*@0.73#
Gilat agricult. surface soil 25 BE 563
0.70 2.78 72.5 1.42*@0.82#
Shefer agricult. surface soil 25 BE 563
0.72 2.79 10.6 1.45*@0.84#
Bet Degan agricult. surface soil 25 BE 563
1.09 2.88 71.2 2.82*@1.64#
Neve Yaar agricult. surface soil 25 BE 563
1.45 2.92 76.2 5.82*@3.38#
Malkiya agricult. surface soil 25 BE 563
1.48 3.22 3.08*@1.79#
Kinneret Lake sediment 25 BE 563
1.80 3.15 60.5 7.85*@4.55#
Kinneret A Lake sediment 25 BE 563
1.81 3.18 63.2 7.43*@4.31#
Kinneret F Lake sediment 25 BE 563
1.60 3.20 63.8 4.39*@2.55#
Kinneret G Lake sediment 25 BE 563
2.95*av 94 soils~literature! [email protected]#av3.68 Soil; experimental~literature! 2173.17av 89 literature data 5623.42 Correlation logKoc– logKow 963.23 Correlation logKoc– logKow 2073.60 Correlation logKoc– logKow 1083.25 Correlation logKoc– logS 963.95 Correlation logKoc– logS~mp! 962.88 Correlation logKoc– logS 564
Permethrin
@2.60# @4.80# 1.09* Warracknabeal, Vic., soil; pH 8.0; BE [email protected]# 0.01 M CaCl2
@2.64# @4.37# 3.20* Warracknabeal, Vic., soil; pH 8.4; BE [email protected]# 0.01 M CaCl2
@1.83# @3.92# 1.42* Warranine soil; pH 6.5; BE [email protected]# 0.01 M CaCl2
@2.34# @4.38# 1.58* Badgingarra soil; pH 6.3; BE [email protected]# 0.01 M CaCl2
@1.85# @4.81# 0.19* Badgingarra soil; pH 6.3; BE [email protected]# 0.01 M CaCl2
@2.60# @4.26# 3.78* Gabalong soil; pH 5.9; BE [email protected]# 0.01 M CaCl2
2.59 @3.19# 18 34 48 43*@24.9#
Sediment~Lake St. George, Can.! 21 BE 126
5.25 Correlation logKoc– MCI 5984.03 Correlation logKoc– logS 564
Phorate
0.34° @2.63# 77 15 8 0.51 Sarpy soil; pH 7.3; 24 BE 122~0.94! CE55.7 me/100 g; 0.01 M CaCl2
0.69° @2.66# 83 9 8 1.07 Thurman soil; pH 6.83; 24 BE 122~0.91! CE56.1 me/100 g; 0.01 M CaCl2
0.93° @2.51# 37 42 21 2.64 Clarion agricultural soil; pH 5.00; 24 BE 122~0.92! CE521.0 me/100 g; 0.01 M CaCl2
1.14° @2.56# 21 55 24 3.80 Harps agricultural soil; pH 7.30; 24 BE 122~0.88! CE537.8 me/100 g; 0.01 M CaCl2
1.88° @2.62# 42 39 19 18.36 Peat; pH 6.98; 24 BE 122
J. Phys. Chem. Ref. Data, Vol. 30, No. 1, 2001

388388 DELLE SITE
TABLE 8. Sorption coefficients for pesticides—Continued
log Kd
log Kf0
(1/n) log Koc
Sorbent composition~%!Other sorbent and solution data;
prediction procedureTemp.~°C! Meth. Ref.Sand Silt Clay OC
~1.01! CE577.3 me/100 g; 0.01 M CaCl2
@2.82# 3.53* Batcombe sil soil; pH 6.1; 20 BE [email protected]# 0.01 M CaCl2
3.51 Soil; experimental~literature! 2172.71 Correlation logKoc– logS 564
Picloram „pKaÄ3.6, Ref. 674!
1.57° 100 H-montmorillonite~1–0.2mm!; 25 BE 250~0.78! pH53.35; CE573.5 me/100 g;1.34° 45 44 11 6.80* Aiken soil; pH 6.0; BE 319~0.82! @3.94# pH ~corrected, HNO3! 3.63;
CE58.4 me/100 g;1.25°~0.83!
Idem; pH ~corrected, HNO3!3.80 319
1.06°~0.76!
Idem; pH ~corrected, HNO3!4.22 319
0.74°~0.92!
@2.14# Idem; pH ~corrected, HNO3!4.83 319
20.22°~0.89!
@1.18# Idem; pH 6.03 319
20.55°~1.08!
@0.85# Idem; pH~corrected, NaOH!9.06 319
20.27°~0.97!
@1.14# Idem; pH~corrected, NaOH!10.4 319
NA 23 42 0.9* Panoche soil~,1 mm!; pH 7.5; 25 BE [email protected]# CE515.4 me/100 g; SA5100 m2/g
20.46°~0.86!
Idem; pH~corrected, HCl!4.2 15 315
20.68°~0.92!
@1.61# Idem; pH~corrected, HCl!4.2 25 315
20.84°~0.98!
@1.45# Idem; pH~corrected, HCl!4.2 35 315
1.11°~0.90!
@3.39# Idem; pH~corrected, HCl!1.2 10 315
0.55° @2.84# Idem; pH ~corrected, HCl!1.2 20 315~0.89!0.18°~0.97!
@2.46# Idem; pH~corrected, HCl!1.2 30 315
20.55° @1.85# 32 8 0.7* Ephrata soil~,1 mm!; pH 7.2; 15 BE 315~1.00! @0.41# CE58.2 me/100 g; SA528 m2/g20.76°~0.99!
@1.63# Idem 25 315
21.04°~0.99!
@1.36# Idem 35 315
0.30° @2.06# 61 27 3.0* Palouse soil~,1 mm!; pH 5.9; 15 BE 315~0.90! @1.74# CE519 me/100 g; SA542 m2/g0.24°~1.09!
@2.00# Idem 25 315
0.14°~1.09!
@1.90# Idem 35 315
20.74° @1.27# 46 38 16 1.7* Norge soil; pH 6.6; BE 508~0.97! @0.99# CE59.2 me/100 g; 0.01 N CaCl2
@0.81# @3.75# 21 45 34 0.2*@0.12#
Soil 4; pH 2 25 BE 314
@20.81# @2.12# Idem; pH 9 [email protected]# @3.86# 48 36 16 0.3*
@0.17#Soil 3; pH 2 25 BE 314
@20.59# @2.17# Idem; pH 9 [email protected]# @2.28# 87 10 3 0.4*
@0.23#Soil 7; pH 2 25 BE 314
@20.85# @1.79# Idem; pH 9 [email protected]# @2.82# 42 46 12 1.0*
@0.58#Soil D1; pH 2 25 BE 314
J. Phys. Chem. Ref. Data, Vol. 30, No. 1, 2001

389389SORPTION OF ORGANIC COMPOUNDS
TABLE 8. Sorption coefficients for pesticides—Continued
log Kd
log Kf0
(1/n) log Koc
Sorbent composition~%!Other sorbent and solution data;
prediction procedureTemp.~°C! Meth. Ref.Sand Silt Clay OC
@1.13# @2.93# 13 39 48 2.7*@1.57#
Soil N1; pH 2 25 BE 314
@21.32# @0.49# Idem; pH 9 [email protected]# @3.13# 58 35 7 4.1*
@2.38#Soil B2; pH 2 25 BE 314
@20.30# @1.32# Idem; pH 9 [email protected]# @3.02# 26 52 22 10.7*
@6.21#Soil B1; pH 2 25 BE 314
@20.01# @1.20# Idem; pH 9 [email protected]# @3.02# 39 38 23 32.2*
@18.7#Soil Q1; pH 2 25 BE 314
@0.29# @1.02# Idem; pH 9 [email protected]# @1.03# 68 26 6 44.3*
@25.7#Soil Q3; pH 9 25 BE 314
21.12° @0.74# 1.4 Wyoming Borollic Haplargids soil BE 321~0.94! ~A horizon!; pH 6.0–7.820.59°~1.02!
@1.16# 1.8 Idem~Bt horizon! 321
24.0°~1.02!
@1.92# 0.85 Idem~2Btk1 horizon! 321
20.74° @1.26# 46 38 16 1.7* Norge soil; pH 6.6; BE 507~0.97! @0.99# CE59.2 meq/100 g; 0.01 N CaCl2
20.01° 18 4.2* Fiddletown sil soil; pH 5.60; 20 BE 316~0.85! @2.44# CE520 me/100 g20.26° 27 3.6* Palouse sil soil; pH 5.68; 20 BE 316~0.82! @2.09# CE519 me/100 g;20.51° 83 2.4* Molokai c soil; pH 6.97; 20 BE 316~0.83! @1.39# CE514 me/100 g20.39° 33 2.4* Linne cl soil; pH 7.40; 20 BE 316~0.74! @1.39# CE541 me/100 g20.93° 9 1.6* Kentwood sl soil; pH 6.40; 20 BE 316~0.84! @0.93# CE512 me/100 g20.15° 8 0.94* Ephrata sl soil; pH 7.14; 20 BE 316~0.60! @0.55# CE58 me/100 g;20.12 @1.02# 13.5 12.4*
@7.19#Lacombe l soil; pH 7.9 25 BE 317
20.31 @0.91# 20.3 10.5*@6.09#
Melfort l soil; pH 6.5 25 BE 317
20.31 @0.91# Idem LE 54020.51 @0.92# 19.2 6.5*
@3.77#Weyburn Oxbow 1 soil; pH 7.9 25 BE 317
20.62 @0.81# Idem LE 54020.64 @0.93# 57.3 4.7*
@2.73#Indian Head c soil; pH 8.1 25 BE 317
21.00 @0.63# Idem LE 54020.62 @0.99# 15.0 4.3* Weyburn light l soil; 25 BE 317
@2.49# pH 8.2N.A. 69.5 4.2* Regina heavy c soil; 25 BE 317
@2.44# pH 8.021.00 @0.62# Idem LE 54020.62 @1.01# 18.5 4.1*
@2.38#Indian Head cl soil; pH 8.1 25 BE 317
21.05 @0.94# 8.0 1.8*@1.04#
Asquith sl soil; pH 6.9 25 BE 317
21.52 @0.46# Idem LE 54020.72° @1.28# 14.5 52.5 33.0 1.7* Amsterdam soil; pH 7.8 20 BE 664~0.88! @0.99#20.22° 24 6.6* Minam loam soil~0–23 cm!; 25 BE 313~0.83! pH 7.0; Al50.3 me/100 g;
CE528.3 me/100 g20.52° 26 3.8* Idem ~23–33 cm!; pH 7.3; 313~0.76! Al50.3 me/100 g;
CE524.4 me/100 g
J. Phys. Chem. Ref. Data, Vol. 30, No. 1, 2001

390390 DELLE SITE
TABLE 8. Sorption coefficients for pesticides—Continued
log Kd
log Kf0
(1/n) log Koc
Sorbent composition~%!Other sorbent and solution data;
prediction procedureTemp.~°C! Meth. Ref.Sand Silt Clay OC
20.52° 17 7.7* Woodcock l soil~0–10 cm!; 25 BE 313~0.85! Al59.9 me/100 g;
CE512.9 me/100 g;20.22° @1.38# 13 4.3* Idem ~36–51 cm!; pH 5.8; 313~0.99! @2.49# Al526.8 me/100 g;
CE53.6 me/100 g20.40° @1.63# 8 1.6* Idem ~69–111 cm!; pH 5.6; 313~1.02! @0.93# Al534.6 me/100 g;
CE53.2 me/100 g0.66° 36 7.4* Kinney clay loam soil~23–38 cm!; 25 BE 313~0.84! pH; 5.2; Al558.0 me/100 g;
CE56.5 me/100 g0.36° @2.20# 42 2.5* Idem ~23–46 cm!; pH 5.2; 313~0.93! @1.45# Al553.2 me/100 g;
CE58.9 me/100 g0.20° @2.54# 31 0.8* Idem ~46–69 cm!; pH 5.0; 313~1.00! @0.46# Al541.6 me/100 g;
CE516.1 me/100 g21.10 1.05 34 46 20 0.74 Commerce soil; pH 7.3 BE 13520.19 1.34 12 28 60 2.92 Fargo soil; pH 6.1 BE 13520.92 1.05 18 62 20 1.03 Walla-Walla soil; pH 6.3 BE 13520.77 1.10 78 14 8 1.36 Kawkawlin soil; pH 6.8 BE 13521.10 1.26 82 10 8 0.45 Norfolk soil; pH 5.9 BE 13520.41 1.31 14 54 32 1.89 Catlin soil; pH 6.1 BE 13520.92 1.00 38 42 20 1.17 Holdredge soil; pH 5.4 BE 13520.74° @1.27# 46 38 16 1.7* Norge soil; pH 6.6; BE 485~0.94! @0.99# CE59.2 me/100 g. 0.01 N CaCl2
3.52°* 56.4 Humic acid from Black 5 BE 125~0.75! Chernozemic soil; pH 3.3–3.63.43°*~0.79!
Idem 25 BE 125
1.23 Soil; experimental~literature! 2171.49av 59 literature data 5621.41av 26 soils~literature! 872.20 Correlation logKoc– logS 5641.47 Correlation logKoc– MCI 578
Profluralin
2.74 100 Ca–montmorillonite; pH 6 24 BE 1213.26 @3.52# 94* OM from peaty muck 24 BE 121
@54.5# soil; pH 6.53.93 Soil; experimental~literature! 2174.19 Correlation logKoc– logS 564
Prometone„pKaÄ4.28, Ref. 247!
TA 100 H–montmorillonite~1–0.2mm!;pH 3.35; CE573.5 me/100 g
25 BE 250
2.18° 100 Na–montmorillonite~1–0.2mm!; 25 BE 250~0.64! pH 6.80; CEC587.0 meq/100 g0.35 @1.74# 2.9 68.7 28.4 7.1* Lanton soil; pH 6.4; BE 631
@4.12# CE532.8 me/100 g0.00° 18 3.3* Lakeland sl soil; pH 6.2; 26 BE 633~0.79! @1.91# CE52.9 me/100 g; 0.01 M CaCl2
0.59° 43 1.9* Wehadkee sil soil; ph 5.6; 26 BE 633~0.77! @1.10# CE510.2 me/100 g; 0.01 M CaCl2
0.73° 38 4.4* Chillum sil soil; pH 4.6; 26 BE 633~0.84! @2.55# CE57.6 me/100 g; 0.01 M CaCl2
0.63° 48 4.3* Hagertown sicl soil; pH 5.5; 26 BE 633~0.84! @2.49# CE512.5 me/100 g; 0.01 M CaCl2
0.45 @2.41# 6 74 20 1.9* Putnam soil; pH 5.3; 20 BE [email protected]# CE512.3 me/100 g; 0.01 M CaCl2
0.94 @2.56# 4 66 30 4.2* Marshall soil; pH 5.4; 20 BE [email protected]# CE521.3 me/100 g; 0.01 M CaCl2
J. Phys. Chem. Ref. Data, Vol. 30, No. 1, 2001

391391SORPTION OF ORGANIC COMPOUNDS
TABLE 8. Sorption coefficients for pesticides—Continued
log Kd
log Kf0
(1/n) log Koc
Sorbent composition~%!Other sorbent and solution data;
prediction procedureTemp.~°C! Meth. Ref.Sand Silt Clay OC
0.80 @2.48# 3 67 30 3.6* Grundy soil; pH 5.6; 20 BE [email protected]# CE513.5 me/100 g; 0.01 M CaCl2
1.17 @3.26# 9 74 17 1.4* Marian soil; pH 4.6; 20 BE [email protected]# CE59.9 me/100 g; 0.01 M CaCl2
0.81 @2.58# 4 72 24 2.9* Knox soil; pH 5.4; 20 BE [email protected]# CE518.8 me/100 g; 0.01 M CaCl2
1.35 @3.03# 26 43 31 3.6* Shelby soil; pH 4.3; 20 BE [email protected]# CE520.1 me/100 g; 0.01 M CaCl2
0.67 @2.73# 30 44 26 1.5* Lindley soil; pH 4.7; 20 BE [email protected]# CE56.9 me/100 g; 0.01 M CaCl2
1.23 @3.12# 1 36 63 2.2* Wabash soil; pH 5.7; 20 BE [email protected]# CE540.3 me/100 g; 0.01 M CaCl2
0.66 @2.58# 32 50 18 2.1* Salix soil; pH 6.3; 20 BE [email protected]# CE517.9 me/100 g 0.01 M CaCl2
0.18 @2.30# 40 41 19 1.3* Sarpy soil; pH 7.1; 20 BE [email protected]# CE514.3 me/100 g 0.01 M CaCl2
1.06 @2.61# 5 48 47 4.9* Summit soil; pH 4.8; 20 BE [email protected]# CE535.1 me/100 g; 0.01 M CaCl2
0.53 @2.31# 5 67 28 2.9* Oswego soil; pH 6.4; 20 BE [email protected]# CE521.0 me/100 g; 0.01 M CaCl2
20.22 @1.87# 1 76 23 1.4* Bates soil; pH 6.5; 20 BE [email protected]# CE59.3 me/100 g; 0.01 M CaCl2
0.78 @2.58# 1 76 23 2.7* Gerald soil; pH 4.7; 20 BE [email protected]# CE511.0 me/100 g; 0.01 M CaCl2
0.38 @2.41# 11 75 14 1.6* Newtonia soil; pH 5.2; 20 BE [email protected]# CE58.8 me/100 g; 0.01 M CaCl2
0.11 @1.87# 8 72 20 3.0* Eldon soil; pH 5.9; 20 BE [email protected]# CE512.9 me/100 g; 0.01 M CaCl2
0.23 @2.14# 9 72 19 2.1* Baxter soil; pH 6.0; 20 BE [email protected]# CE511.2 me/100 g; 0.01 M CaCl2
0.08 @1.93# 4 85 11 2.4* Menfro soil; pH 5.3; 20 BE [email protected]# CE59.1 me/100 g; 0.01 M CaCl2
0.79 @2.77# 2 79 19 1.8* Union soil; pH 5.4; 20 BE [email protected]# CE56.8 me/100 g; 0.01 M CaCl2
0.89 @2.88# 13 70 17 1.8* Lebanon soil; pH 4.9; 20 BE [email protected]# CE57.7 me/100 g; 0.01 M CaCl2
0.34 @2.43# 20 67 13 1.4* Clarksville soil; pH 5.7; 20 BE [email protected]# CE55.7 me/100 g; 0.01 M CaCl2
20.30 @1.85# 20 63 17 1.2* Cumberland soil; pH 6.4; 20 BE [email protected]# CE56.5 me/100 g; 0.01 M CaCl2
1.74 @3.58# 25 30 45 2.5* Sharkey soil; pH 5.0; 20 BE [email protected]# CE528.2 me/100 g; 0.01 M CaCl2
20.15 @2.30# 84 11 5 0.6* Lintonia soil; pH 5.3; 20 BE [email protected]# CE53.2 me/100 g; 0.01 M CaCl2
0.58 @2.51# 14 66 20 2.0* Waverley soil; pH 6.4; 20 BE [email protected]# CE512.8 me/100 g; 0.01 M CaCl2
20.44° 67.1 25.8 7.1 0.43 Hanford soil; pH 6.05; 25 BE 528~0.87! CE55.95 cmol/kg; 0.01 M CaCl2
0.66° @1.82# 82.0 13.5 4.5 0.33 Tuiunga soil; pH 6.30; 25 BE 528~0.96! CE50.45 cmol/kg; 0.01 M CaCl2
2.54 Soil; experimental~literature! 2172.72av 29 soils~literature! 872.42 Correlation logKom– logS(563) 5282.30 Correlation logKoc– logKow(87) 5282.69 Correlation logKoc– logKow(217) 5282.04 Correlation logKoc– logS 5642.20 Correlation logKoc– MCI 598
Prometryne ~pKaÄ4.05, Ref. 247!
T.A. 100 H–montmorillonite; pH 3.6 BE 2121.45 100 Na–montmorillonite; pH 7.9 BE 2121.26 100 Ca–montmorillonite; pH 7.9 BE 212
J. Phys. Chem. Ref. Data, Vol. 30, No. 1, 2001
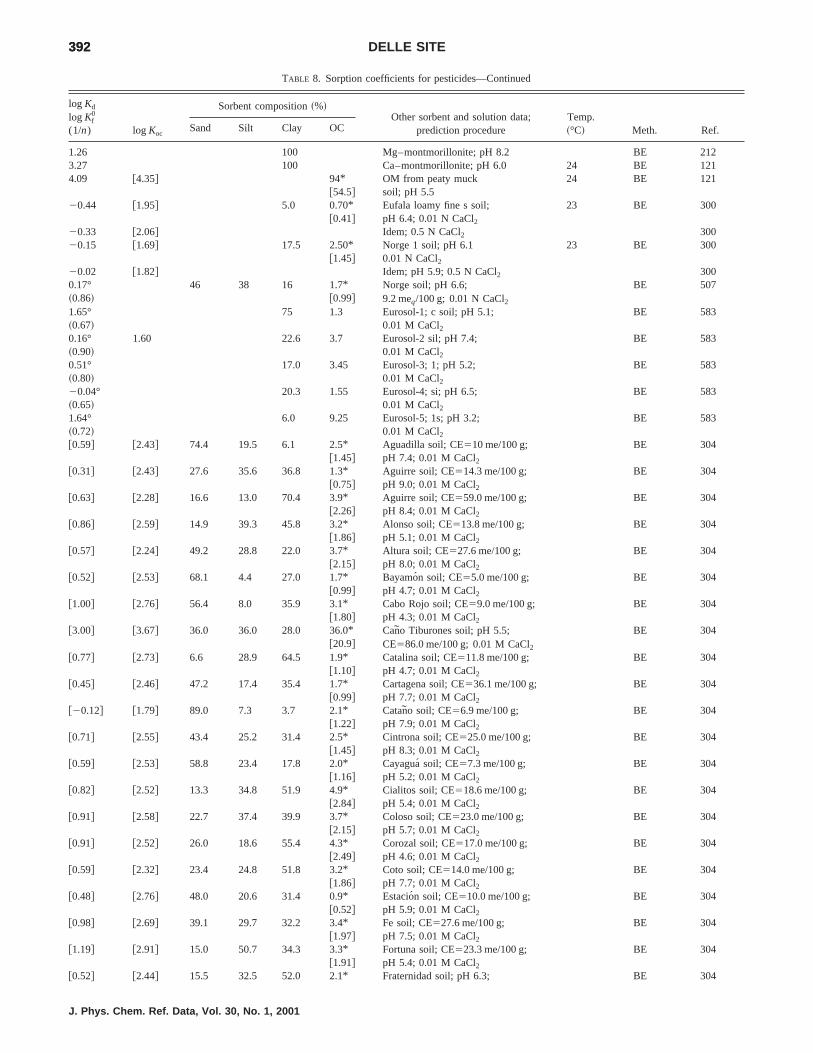
392392 DELLE SITE
TABLE 8. Sorption coefficients for pesticides—Continued
log Kd
log Kf0
(1/n) log Koc
Sorbent composition~%!Other sorbent and solution data;
prediction procedureTemp.~°C! Meth. Ref.Sand Silt Clay OC
1.26 100 Mg–montmorillonite; pH 8.2 BE 2123.27 100 Ca–montmorillonite; pH 6.0 24 BE 1214.09 @4.35# 94* OM from peaty muck 24 BE 121
@54.5# soil; pH 5.520.44 @1.95# 5.0 0.70* Eufala loamy fine s soil; 23 BE 300
@0.41# pH 6.4; 0.01 N CaCl2
20.33 @2.06# Idem; 0.5 N CaCl2 30020.15 @1.69# 17.5 2.50* Norge 1 soil; pH 6.1 23 BE 300
@1.45# 0.01 N CaCl220.02 @1.82# Idem; pH 5.9; 0.5 N CaCl2 3000.17° 46 38 16 1.7* Norge soil; pH 6.6; BE 507~0.86! @0.99# 9.2 meq/100 g; 0.01 N CaCl2
1.65° 75 1.3 Eurosol-1; c soil; pH 5.1; BE 583~0.67! 0.01 M CaCl20.16° 1.60 22.6 3.7 Eurosol-2 sil; pH 7.4; BE 583~0.90! 0.01 M CaCl20.51° 17.0 3.45 Eurosol-3; 1; pH 5.2; BE 583~0.80! 0.01 M CaCl220.04° 20.3 1.55 Eurosol-4; si; pH 6.5; BE 583~0.65! 0.01 M CaCl21.64° 6.0 9.25 Eurosol-5; 1s; pH 3.2; BE 583~0.72! 0.01 M [email protected]# @2.43# 74.4 19.5 6.1 2.5* Aguadilla soil; CE510 me/100 g; BE 304
@1.45# pH 7.4; 0.01 M [email protected]# @2.43# 27.6 35.6 36.8 1.3* Aguirre soil; CE514.3 me/100 g; BE 304
@0.75# pH 9.0; 0.01 M [email protected]# @2.28# 16.6 13.0 70.4 3.9* Aguirre soil; CE559.0 me/100 g; BE 304
@2.26# pH 8.4; 0.01 M [email protected]# @2.59# 14.9 39.3 45.8 3.2* Alonso soil; CE513.8 me/100 g; BE 304
@1.86# pH 5.1; 0.01 M [email protected]# @2.24# 49.2 28.8 22.0 3.7* Altura soil; CE527.6 me/100 g; BE 304
@2.15# pH 8.0; 0.01 M [email protected]# @2.53# 68.1 4.4 27.0 1.7* Bayamon soil; CE55.0 me/100 g; BE 304
@0.99# pH 4.7; 0.01 M [email protected]# @2.76# 56.4 8.0 35.9 3.1* Cabo Rojo soil; CE59.0 me/100 g; BE 304
@1.80# pH 4.3; 0.01 M [email protected]# @3.67# 36.0 36.0 28.0 36.0* Cano Tiburones soil; pH 5.5; BE 304
@20.9# CE586.0 me/100 g; 0.01 M CaCl2
@0.77# @2.73# 6.6 28.9 64.5 1.9* Catalina soil; CE511.8 me/100 g; BE [email protected]# pH 4.7; 0.01 M CaCl2
@0.45# @2.46# 47.2 17.4 35.4 1.7* Cartagena soil; CE536.1 me/100 g; BE [email protected]# pH 7.7; 0.01 M CaCl2
@20.12# @1.79# 89.0 7.3 3.7 2.1* Catano soil; CE56.9 me/100 g; BE [email protected]# pH 7.9; 0.01 M CaCl2
@0.71# @2.55# 43.4 25.2 31.4 2.5* Cintrona soil; CE525.0 me/100 g; BE [email protected]# pH 8.3; 0.01 M CaCl2
@0.59# @2.53# 58.8 23.4 17.8 2.0* Cayagua´ soil; CE57.3 me/100 g; BE [email protected]# pH 5.2; 0.01 M CaCl2
@0.82# @2.52# 13.3 34.8 51.9 4.9* Cialitos soil; CE518.6 me/100 g; BE [email protected]# pH 5.4; 0.01 M CaCl2
@0.91# @2.58# 22.7 37.4 39.9 3.7* Coloso soil; CE523.0 me/100 g; BE [email protected]# pH 5.7; 0.01 M CaCl2
@0.91# @2.52# 26.0 18.6 55.4 4.3* Corozal soil; CE517.0 me/100 g; BE [email protected]# pH 4.6; 0.01 M CaCl2
@0.59# @2.32# 23.4 24.8 51.8 3.2* Coto soil; CE514.0 me/100 g; BE [email protected]# pH 7.7; 0.01 M CaCl2
@0.48# @2.76# 48.0 20.6 31.4 0.9* Estacion soil; CE510.0 me/100 g; BE [email protected]# pH 5.9; 0.01 M CaCl2
@0.98# @2.69# 39.1 29.7 32.2 3.4* Fe soil; CE527.6 me/100 g; BE [email protected]# pH 7.5; 0.01 M CaCl2
@1.19# @2.91# 15.0 50.7 34.3 3.3* Fortuna soil; CE523.3 me/100 g; BE [email protected]# pH 5.4; 0.01 M CaCl2
@0.52# @2.44# 15.5 32.5 52.0 2.1* Fraternidad soil; pH 6.3; BE 304
J. Phys. Chem. Ref. Data, Vol. 30, No. 1, 2001

393393SORPTION OF ORGANIC COMPOUNDS
TABLE 8. Sorption coefficients for pesticides—Continued
log Kd
log Kf0
(1/n) log Koc
Sorbent composition~%!Other sorbent and solution data;
prediction procedureTemp.~°C! Meth. Ref.Sand Silt Clay OC
@1.22# CE536.6 me/100 g; 0.01 M CaCl2
@0.73# @2.34# 11.1 23.8 65.1 4.2* Fraternidad soil~Lajas!; pH 5.9; BE [email protected]# CE558.0 me/100 g; 0.01 M CaCl2
@0.71# @2.27# 6.4 19.6 74.0 4.8* Guanica soil; CE552.1 me/100 g; BE [email protected]# pH 8.1; 0.01 M CaCl2
@0.59# @2.79# 84.4 8.4 7.2 1.1* Humacao soil; CE54.0 me/100 g; BE [email protected]# pH 6.3; 0.01 M CaCl2
@0.97# @2.97# 10.1 50.9 39.0 1.7* Humata soil; CE510.1 me/100 g; BE [email protected]# pH 4.5; 0.01 M CaCl2
@0.95# @2.67# 26.6 53.5 20.9 3.3* Josefa soil; CE516.8 me/100 g; BE [email protected]# pH 6.0; 0.01 M CaCl2
@0.61# @2.42# 15.2 41.6 43.2 2.7* Juncos soil; CE513.4 me/100 g; BE [email protected]# pH 6.2; 0.01 M CaCl2
@0.31# @1.96# 19.9 33.4 46.7 3.9* Mabı soil; CE555.2 me/100 g; BE [email protected]# pH 7.0; 0.01 M CaCl2
@0.81# @2.35# 22.7 40.7 36.6 4.9* Mabı soil; CE531.0 me/100 g; BE [email protected]# pH 5.7; 0.01 M CaCl2
@0.67# @2.57# 76.0 13.4 10.6 2.2* Machete soil; CE58.0 me/100 g; BE [email protected]# pH 6.5; 0.01 M CaCl2
@0.59# @2.45# 14.9 42.8 42.3 2.4* Mercedita soil; CE519.9 me/100 g; BE [email protected]# pH 8.1; 0.01 M CaCl2
@1.02# @2.67# 26.3 27.7 46.0 3.8* Moca soil; CE531.0 me/100 g; BE [email protected]# pH 5.8; 0.01 M CaCl2
@0.93# @2.65# 28.0 47.0 25.0 3.3* Mucara soil; CE519.6 me/100 g; BE [email protected]# pH 5.8; 0.01 M CaCl2
@1.09# @2.60# 22.0 49.2 28.0 5.3* Nipe soil; CE511.9 me/100 g; BE [email protected]# pH 5.7; 0.01 M CaCl2
@20.12# @1.81# 59.4 28.2 12.4 2.0* Pandura soil; CE57.7 me/100 g; BE [email protected]# pH 5.7; 0.01 M CaCl2
@0.91# @2.61# 13.4 43.6 43.0 3.5* Rıo Piedras soil; pH 4.9; BE [email protected]# CE511.5 me/100 g; 0.01 M CaCl2
@0.48# @2.12# 39.0 24.6 36.4 3.9* Sabana Seca soil; pH 7.4; BE [email protected]# CE523.0 me/100 g; 0.01 M CaCl2
@0.42# @1.97# 47.0 24.4 28.6 4.9* San Anton soil; pH 7.4; BE [email protected]# CE528.0 me/100 g; 0.01 M CaCl2
@0.95# @2.86# 57.0 18.6 24.4 2.1* Santa Isabel soil; pH 7.4; BE [email protected]# CE528.0 me/100 g; 0.01 M CaCl2
@2.51# @3.73# 46.0 20.0 34.0 10.4* Soller soil; CE553.0 me/100 g; BE [email protected]# pH 6.9; 0.01 M CaCl2
@0.45# @2.54# 73.4 19.4 7.2 1.4* Talante soil; CE54.0 me/100 g; BE [email protected]# pH 5.1; 0.01 M CaCl2
@1.12# @2.65# 35.0 24.6 40.4 5.1* Toa soil; CE536.0 me/100 g; BE [email protected]# pH 8.0; 0.01 M CaCl2
@0.73# @2.67# 41.5 38.3 20.2 2.0* Toa soil; CE513.0 me/100 g; BE [email protected]# pH 5.3; 0.01 M CaCl2
@0.13# @2.59# 60.9 25.1 14.0 0.6* Toa soil; CE58.0 me/100 g; BE [email protected]# pH 6.0; 0.01 M CaCl2
@0.61# @2.30# 73.7 12.6 13.7 3.5* Vega Alta soil; pH 5.0; BE [email protected]# CE55.6 me/100 g; 0.01 M CaCl2
@0.67# @2.55# 45.2 36.8 18.0 2.3* Vıa soil; CE539.9 me/100 g; BE [email protected]# pH 5.1; 0.01 M CaCl2
@0.75# @2.64# 62.4 19.6 18.0 2.2* Vivı soil; CE514.0 me/100 g; BE [email protected]# pH 4.8; 0.01 M CaCl2
@1.19# @2.78# 15.0 23.4 61.6 4.5* Voladura soil; pH 4.3; BE [email protected]# CE517.7 me/100 g; 0.01 M CaCl2
@0.45# @1.84# 2.9 68.7 28.4 7.1* Lanton soil; pH 6.4; BE [email protected]# CE532.8 me/100 g;
21.15° 100 Quartz s; pH 5.6; CE50.4 me/100 g; 26 BE 299~20.54! 0.01 N CaCl220.18° 93 4 3 0.6* Cobb soil; pH 7.3; 26 BE 299~0.77! @0.35# CE53.8 me/100 g; 0.01 N CaCl2
1.46° 93 4 3 2.1* Cobb soil12% muck; pH 5.3; 26 BE 299
J. Phys. Chem. Ref. Data, Vol. 30, No. 1, 2001

394394 DELLE SITE
TABLE 8. Sorption coefficients for pesticides—Continued
log Kd
log Kf0
(1/n) log Koc
Sorbent composition~%!Other sorbent and solution data;
prediction procedureTemp.~°C! Meth. Ref.Sand Silt Clay OC
~0.79! @1.22# CE59.0 me/100 g; 0.01 N CaCl2
0.54° 58 23 19 1.3* Teller soil; pH 5.7; 26 BE 299~0.80! @0.75# CE58.6 me/100 g; 0.01 N CaCl2
0.69° 16 42 42 1.8* Port soil; pH 6.3; 26 BE 299~0.76! @1.04# CE517.9 me/100 g; 0.01 N CaCl2
1.0° 27 45 29 2.8* Brewer soil; pH 5.8; 26 BE 299~0.83! @1.62# CE513.5 me/100 g; 0.01 N CaCl2
0.28° 18 3.3* Lakeland sl soil; pH 6.2; 26 BE 633~0.88! @1.91# CE52.9 me/100 g; 0.01 M CaCl2
0.79° 43 1.9* Wehadkee sil soil; pH 5.6; 26 BE 633~0.84! @1.10# CE510.2 me/100 g; 0.01 M CaCl2
1.11° 38 4.4* Chillum sil soil; pH 4.6; 26 BE 633~0.86! @2.55# CE57.6 me/100 g; 0.01 M CaCl2
1.01° 48 4.3* Hagerstown sicl soil; pH 5.5; 26 BE 633~0.84! @2.49# CE512.5 me/100 g; 0.01 M CaCl2
0.04 @2.03# 1.77*@1.03#
Cecil soil; pH 6.3 BE 665
0.58 @2.54# 6 74 20 1.9* Putnam soil; pH 5.3; 20 BE [email protected]# CE512.3 me/100 g; 0.01 M CaCl2
1.09 @2.71# 4 66 30 4.2* Marshall soil; pH 5.4; 20 BE [email protected]# CE521.3 me/100 g; 0.01 M CaCl2
0.96 @2.64# 3 67 30 3.6* Grundy soil; pH 5.6; 20 BE [email protected]# CE513.5 me/100 g; 0.01 M CaCl2
1.15 @3.24# 9 74 17 1.4* Marian soil; pH 4.6; 20 BE [email protected]# CE59.9 me/100 g; 0.01 M CaCl2
0.92 @2.70# 4 72 24 2.9* Knox soil; pH 5.4; 20 BE [email protected]# CE518.8 me/100 g; 0.01 M CaCl2
1.34 @3.02# 26 43 31 3.6* Shelby soil; pH 4.3; 20 BE [email protected]# CE520.1 me/100 g; 0.01 M CaCl2
0.90 @2.96# 30 44 26 1.5* Lindley soil; pH 4.7; 20 BE [email protected]# CE56.9 me/100 g; 0.01 M CaCl2
1.24 @3.13# 1 36 63 2.2* Wabash soil; pH 5.7; 20 BE [email protected]# CE540.3 me/100 g; 0.01 M CaCl2
0.81 @2.72# 32 50 18 2.1* Salix soil; pH 6.3; 20 BE [email protected]# CE517.9 me/100 g; 0.01 M CaCl2
0.46 @2.59# 40 41 19 1.3* Sarpy soil; pH 7.1; 20 BE [email protected]# CE514.3 me/100 g; 0.01 M CaCl2
1.25 @2.79# 5 48 47 4.9* Summit soil; pH 4.8; 20 BE [email protected]# CE535.1 me/100 g; 0.01 M CaCl2
0.70 @2.47# 5 67 28 2.9* Oswego soil; pH 6.4; 20 BE [email protected]# CE521.0 me/100 g; 0.01 M CaCl2
0.20 @2.30# 1 76 23 1.4* Bates soil; pH 6.5; 20 BE [email protected]# CE59.3 me/100 g; 0.01 M CaCl2
0.97 @2.78# 1 76 23 2.7* Gerald soil; pH 4.7; 20 BE [email protected]# CE511.0 me/100 g; 0.01 M CaCl2
0.54 @2.58# 11 75 14 1.6* Newtonia soil; pH 5.2; 20 BE [email protected]# CE58.8 me/100 g; 0.01 M CaCl2
0.56 @2.32# 8 72 20 3.0* Eldon soil; pH 5.9; 20 BE [email protected]# CE512.9 me/100 g; 0.01 M CaCl2
0.63 @2.55# 9 72 19 2.1* Baxter soil; pH 6.0; 20 BE [email protected]# CE511.2 me/100 g; 0.01 M CaCl2
0.52 @2.37# 4 85 11 2.4* Menfro soil; pH 5.3; 20 BE [email protected]# CE59.1 me/100 g; 0.01 M CaCl2
0.93 @2.92# 2 79 19 1.8* Union soil; pH 5.4; 20 BE [email protected]# CE56.8 me/100 g; 0.01 M CaCl2
0.95 @2.94# 13 70 17 1.8* Lebanon soil; pH 4.9; 20 BE [email protected]# CE57.7 me/100 g; 0.01 M CaCl2
0.71 @2.80# 20 67 13 1.4* Clarksville soil; pH 5.7; 20 BE [email protected]# CE55.7 me/100 g; 0.01 M CaCl2
0.15 @2.30# 20 63 17 1.2* Cumberland soil; pH 6.4; 20 BE [email protected]# CE56.5 me/100 g; 0.01 M CaCl2
1.64 @3.48# 25 30 45 2.5* Sharkey soil; pH 5.0; 20 BE 145
J. Phys. Chem. Ref. Data, Vol. 30, No. 1, 2001

395395SORPTION OF ORGANIC COMPOUNDS
TABLE 8. Sorption coefficients for pesticides—Continued
log Kd
log Kf0
(1/n) log Koc
Sorbent composition~%!Other sorbent and solution data;
prediction procedureTemp.~°C! Meth. Ref.Sand Silt Clay OC
@1.5# CE528.2 me/100 g; 0.01 M CaCl2
20.05 @2.41# 84 11 5 0.6* Lintonia soil; pH 5.3; 20 BE [email protected]# CE53.2 me/100 g; 0.01 M CaCl2
0.76 @2.70# 14 66 20 2.0* Waverley soil; pH 6.4; 20 BE [email protected]# CE512.8 me/100 g; 0.01 M CaCl2
2.93 @4.20# 28 11 9.2* Cape Fear soil; CE510.3 me/100 g; BE [email protected]# pH 6; SA577.2 m2/g
2.14 @3.99# 41 7 2.5* Rains soil; CE57.1 me/100 g; BE [email protected]# pH 6; SA518.2 m2/g
1.94 @3.95# 11 2 1.7* Norfolk soil; CE52.3 me/100 g; BE [email protected]# pH 6; SA54.4 m2/g
@2.30# 63* Mesic peat~acid treated!; BE [email protected]# 0.01 M CaCl2
2.30 Peat humic acid ED 4232.91 Soil; experimental~literature! 2172.79av 38 soils~literature! 872.72 Correlation logKoc– logS 564
Propazine ~pKaÄ1.85, Ref. 247!
TA 100 H–montmorillonite~1–0.2mm!;pH 3.35; CE573.5 me/100 g;
25 BE 250
1.26° 100 Na–montmorillonite~1–0.2mm!; 25 BE 250~1.12! pH 6.80; CE587.0 me/100 g0.67° 2.16 57.8 19.6 22.6 5.6* Vetroz soil; pH 6.7; 20 BE 630~0.98! @3.25#0.36° 38.4 49.4 12.2 3.6* Evouettes soil; pH 6.1 20 BE 630~1.15! @2.09#0.70 2.59 75 1.3 Eurosol-1; c soil; pH 5.1;
0.01 M CaCl2
BE 583
0.49 1.93 22.6 3.7 Eurosol-2; sil; pH 7.4;0.01 M CaCl2
BE 583
0.61 2.08 17.0 3.45 Eurosol-3; l; pH 5.2;0.01 M CaCl2
BE 583
0.14 1.95 20.3 1.55 Eurosol-4; si; pH 6.5;0.01 M CaCl2
BE 583
1.66 2.70 6.0 9.25 Eurosol-5; ls; pH 3.2;0.01 M CaCl2
BE 583
20.10° @1.62# 18 3.3* Lakeland sl soil; pH 6.2; 26 BE 633~0.91! @1.91# CE52.9 me/100 g; 0.01 M CaCl2
0.20° @2.16# 43 1.9* Wehadkee sil soil; pH 5.6; 26 BE 633~0.99! @1.10# CE510.2 me/100 g; 0.01 M CaCl2
0.66° @2.26# 38 4.4* Chillum sil soil; pH 4.6; 26 BE 633~0.96! @2.55# CE57.6 me/100 g; 0.01 M CaCl2
0.57° @2.17# 48 4.3* Hagerstown sicl soil; pH 5.5; 26 BE 633~0.94! @2.49# CE512.5 me/100 g; 0.01 M CaCl2
0.04 @2.00# 6 74 20 1.9* Putnam soil; pH 5.3; 20 BE [email protected]# CE512.3 me/100 g; 0.01 M CaCl2
0.48 @2.10# 4 66 30 4.2* Marshall soil; pH 5.4; 20 BE [email protected]# CE521.3 me/100 g; 0.01 M CaCl2
0.45 @2.12# 3 67 30 3.6* Grundy soil; pH 5.6; 20 BE [email protected]# CE513.5 me/100 g; 0.01 M CaCl2
0.32 @2.41# 9 74 17 1.4* Marian soil; pH 4.6; 20 BE [email protected]# CE59.9 me/100 g; 0.01 M CaCl2
0.43 @2.21# 4 72 24 2.9* Knox soil; pH 5.4; 20 BE [email protected]# CE518.8 me/100 g; 0.01 M CaCl2
0.45 @2.12# 26 43 31 3.6* Shelby soil; pH 4.3; 20 BE [email protected]# CE520.1 me/100 g; 0.01 M CaCl2
0.34 @2.40# 30 44 26 1.5* Lindley soil; pH 4.7; 20 BE [email protected]# CE56.9 me/100 g; 0.01 M CaCl2
0.49 @2.38# 1 36 63 2.2* Wabash soil; pH 5.7; 20 BE [email protected]# CE540.3 me/100 g; 0.01 M CaCl2
0.28 @2.19# 32 50 18 2.1* Salix soil; pH 6.3; 20 BE 145
J. Phys. Chem. Ref. Data, Vol. 30, No. 1, 2001

396396 DELLE SITE
TABLE 8. Sorption coefficients for pesticides—Continued
log Kd
log Kf0
(1/n) log Koc
Sorbent composition~%!Other sorbent and solution data;
prediction procedureTemp.~°C! Meth. Ref.Sand Silt Clay OC
@1.2# CE517.9 me/100 g; 0.01 M CaCl2
0.08 @2.20# 40 41 19 1.3* Sarpy soil; pH 7.1; 20 BE [email protected]# CE514.3 me/100 g; 0.01 M CaCl2
0.53 @2.08# 5 48 47 4.9* Summit soil; pH 4.8; 20 BE [email protected]# CE535.1 me/100 g; 0.01 M CaCl2
0.28 @1.92# 5 67 28 2.9* Oswego soil; pH 6.4; 20 BE [email protected]# CE521.0 me/100 g; 0.01 M CaCl2
20.15 @1.93# 1 76 23 1.4* Bates soil; pH 6.5; 20 BE [email protected]# CE59.3 me/100 g; 0.01 M CaCl2
0.26 @2.06# 1 76 23 2.7* Gerald soil; pH 4.7; 20 BE [email protected]# CE511.0 me/100 g; 0.01 M CaCl2
0.15 @2.18# 11 75 14 1.6* Newtonia soil; pH 5.2; 20 BE [email protected]# CE58.8 me/100 g; 0.01 M CaCl2
0.26 @2.01# 8 72 20 3.0* Eldon soil; pH 5.9; 20 BE [email protected]# CE512.9 me/100 g; 0.01 M CaCl2
0.28 @2.19# 9 72 19 2.1* Baxter soil; pH 6.0; 20 BE [email protected]# CE511.2 me/100 g; 0.01 M CaCl2
0.26 @2.11# 4 85 11 2.4* Menfro soil; pH 5.3; 20 BE [email protected]# CE59.1 me/100 g; 0.01 M CaCl2
0.38 @2.36# 2 79 19 1.8* Union soil; pH 5.4; 20 BE [email protected]# CE56.8 me/100 g; 0.01 M CaCl2
0.30 @2.28# 13 70 17 1.8* Lebanon soil; pH 4.9; 20 BE [email protected]# CE57.7 me/100 g; 0.01 M CaCl2
0.32 @2.41# 20 67 13 1.4* Clarksville soil; pH 5.7; 20 BE [email protected]# CE55.7 me/100 g; 0.01 M CaCl2
20.15 @2.00# 20 63 17 1.2* Cumberland soil; pH 6.4; 20 BE [email protected]# CE56.5 me/100 g; 0.01 M CaCl2
0.48 @2.32# 25 30 45 2.5* Sharkey soil; pH 5.0; 20 BE [email protected]# CE528.2 me/100 g; 0.01 M CaCl2
21.00 @1.46# 84 11 5 0.6* Lintonia soil; pH 5.3; 20 BE [email protected]# CE53.2 me/100 g; 0.01 M CaCl2
0.30 @2.24# 14 66 20 2.0* Waverley soil; pH 6.4; 20 BE [email protected]# CE512.8 me/100 g; 0.01 M CaCl2
1.08 2.56 3.27 Hickory Hill sediment; coarse siltfraction ~20–50mm!
25 BE 130
2.20 Soil; experimental~literature! 2172.19av 36 soils~literature! 872.55 Correlation logKoc– logKow 963.47 Correlation logKoc– logS 962.49 Correlation logKoc– logS(mp) 963.11 Correlation logKoc– logS 564
Simazine ~pKaÄ1.65, Ref. 679!
2.82 100 Mississippi bentonite; pH 8.5 0 BE 2511.45 Idem 50 2511.23° Ca-Wyoming smectite; pH 7.9; 20 BE 640~0.95! SA(N2)523 m2/g; 0.01 M CaCl23.60° Fe-Wyoming smectite; pH 2.9; 20 BE 640~0.88! SA(N2)536 m2/g; 0.01 M CaCl20.93° Illite; pH 7; CE524 me/100 g;
0.01 M CaCl2
20 BE 145
1.05 Idem; pH 5 1450.43 Putnam clay; pH 7;
CE542 me/100 g; 0.01 M CaCl2
20 BE 145
0.78 Idem; pH 5 1451.09 Montmorillonite; pH 7;
CE5105 me/100 g; 0.01 M CaCl2
20 BE 145
1.09 Idem; pH 5 1451.59 @1.94# 77*
@44.7#Houghton muck; pH 5.6 0 BE 251
1.58 @1.93# Idem 50 [email protected]# @2.83# 29.0 1.67* Dundee sicl soil; pH 5.0; 26 BE 38
J. Phys. Chem. Ref. Data, Vol. 30, No. 1, 2001

397397SORPTION OF ORGANIC COMPOUNDS
TABLE 8. Sorption coefficients for pesticides—Continued
log Kd
log Kf0
(1/n) log Koc
Sorbent composition~%!Other sorbent and solution data;
prediction procedureTemp.~°C! Meth. Ref.Sand Silt Clay OC
@0.97# CE518.1 me/100 g; 0.01 M CaCl2
@0.56# @1.96# 34.4 6.90* Barnes cl soil; pH 7.4; 26 BE [email protected]# CE533.8 me/100 g; 0.01 M CaCl2
@0.54# @2.06# 23.2 5.27* Iredell sil ~topsoil!; pH 5.4; 26 BE [email protected]# CE517.0 me/100 g; 0.01 M CaCl2
@0.77# @2.41# 67.1 3.90* Sharkey c soil; pH 6.2; 26 BE [email protected]# CE540.2 me/100 g; 0.01 M CaCl2
20.26 @2.63# 97.1 2.3 0.6 0.13 Tampa aquifer; pH 8;0.01 N CaCl2
BE 521
0.46° 57.8 19.6 22.6 5.6* Vetroz soil; pH 6.7 20 BE 630~0.84! @3.25#0.25° 38.4 49.4 12.2 3.6* Evouettes soil; pH 6.1 20 BE 630~0.78! @2.09#20.19° 87.0 10.2 2.8 2.2* Collombey soil; pH 7.8 20 BE 630~0.83! @1.28#0.29 @2.08# 30.1 55.2 14.7 1.64 Valois soil; pH 5.9;
0.005 M CaSO4
23–27 BE 527
1.18 3.07 75 1.3 Eurosol-1; c; pH 5.1;0.01 M CaCl2
BE 583
0.21 1.64 22.6 3.7 Eurosol-2; sil; pH 7.4;0.01 M CaCl2
BE 583
0.22 1.68 17.0 3.45 Eurosol-3; l; pH 5.2;0.01 M CaCl2
BE 583
20.20 1.61 20.3 1.55 Eurosol-4; si; pH 6.5;0.01 M CaCl2
BE 583
1.45 2.48 6.0 9.25 Eurosol-5; ls; pH 3.2;0.01 M CaCl2
BE 583
0.40 @1.79# 2.9 68.7 28.4 7.1* Lanton soil; pH 6.4; BE [email protected]# CE532.8 me/100 g;
20.05° 18 3.3* Lakeland sl soil; pH 6.2; 26 BE 633~0.75! @1.91# CE52.9 me/100 g; 0.01 M CaCl2
0.43° 43 1.9* Wehadkee sil soil; pH 5.6; 26 BE 633~0.76! @1.10# CE510.2 me/100 g; 0.01 M CaCl2
0.52° 38 4.4* Chillum sil soil; pH 4.6; 26 BE 633~0.84! @2.55# CE57.6 me/100 g; 0.01 M CaCl2
0.52° 48 4.3* Hagerstown sicl soil; 26 BE 633~0.78! @2.49# pH 5.5; CE512.5 me/100 g;
0.01 M CaCl220.82 1.88 61 25 14 0.20 Hanford sl soil; 20 BE, 422
CE56.25 me/100 g [email protected]# @1.68# 3.53* Batcombe sil soil; pH 6.1; 20 BE 120
@2.05# 0.01 M CaCl20.02° @2.18# 1.5 1.3 1.2* Bassendean soil; CE52.4 cmol/kg; BE 143~0.90! @0.70# pH 5.0; SA(N2)50.4 m2/g;
0.005 M CaCl220.05° @1.95# 8.3 15.3 1.7* Gascoyne soil; CE524.8 cmol/kg; BE 143~0.97! @0.99# pH 6.9; SA(N2)522.5 m2/g;
0.005 M CaCl220.28 @2.18# 2.5 13.6 0.6* Cobiac soil; CE53.5 cmol/kg; BE 143
@0.35# pH 5.1; SA(N2)513.4 m2/g;0.005 M CaCl2
0.93° 14.2 63.7 4.6* Wellesley soil; CE543.0 cmol/kg; BE 143~0.70! @2.67# pH 5.9; SA(N2)573.1 m2/g;
0.005 M CaCl20.34 @2.30# 6 74 20 1.9* Putnam soil; pH 5.3; 20 BE 145
@1.1# CE512.3 me/100 g; 0.01 M CaCl2
0.86 @2.48# 4 66 30 4.2* Marshall soil; pH 5.4; 20 BE [email protected]# CE521.3 me/100 g; 0.01 M CaCl2
0.81 @2.49# 3 67 30 3.6* Grundy soil; pH 5.6; 20 BE [email protected]# CE513.5 me/100 g; 0.01 M CaCl2
0.54 @2.64# 9 74 17 1.4* Marian soil; pH 4.6 20 BE [email protected]# CE59.9 me/100 g; 0.01 M CaCl2
0.71 @2.48# 4 72 24 2.9* Knox soil; pH 5.4 20 BE 145
J. Phys. Chem. Ref. Data, Vol. 30, No. 1, 2001

398398 DELLE SITE
TABLE 8. Sorption coefficients for pesticides—Continued
log Kd
log Kf0
(1/n) log Koc
Sorbent composition~%!Other sorbent and solution data;
prediction procedureTemp.~°C! Meth. Ref.Sand Silt Clay OC
@1.7# CE518.8 me/100 g; 0.01 M CaCl2
0.71 @2.39# 26 43 31 3.6* Shelby soil; pH 4.3; 20 BE [email protected]# CE520.1 me/100 g; 0.01 M CaCl2
0.42 @2.48# 30 44 26 1.5* Lindley soil; pH 4.7; 20 BE [email protected]# CE56.9 me/100 g; 0.01 M CaCl2
0.78 @2.67# 1 36 63 2.2* Wabash soil; pH 5.7; 20 BE [email protected]# CE540.3 me/100 g; 0.01 M CaCl2
0.54 @2.46# 32 50 18 2.1* Salix soil; pH 6.3; 20 BE [email protected]# CE517.9 me/100 g; 0.01 M CaCl2
0.30 @2.43# 40 41 19 1.3* Sarpy soil; pH 7.1; 20 BE [email protected]# CE514.3 me/100 g; 0.01 M CaCl2
0.90 @2.44# 5 48 47 4.9* Summit soil; pH 4.8; 20 BE [email protected]# CE535.1 me/100 g; 0.01 M CaCl2
0.59 @2.37# 5 67 28 2.9* Oswego soil; pH 6.4; 20 BE [email protected]# CE521.0 me/100 g; 0.01 M CaCl2
0.00 @2.09# 1 76 23 1.4* Bates soil; pH 6.5; 20 BE [email protected]# CE59.3 me/100 g; 0.01 M CaCl2
0.62 @2.43# 1 76 23 2.7* Gerald soil; pH 4.7; 20 BE [email protected]# CE511.0 me/100 g; 0.01 M CaCl2
0.48 @2.51# 11 75 14 1.6* Newtonia soil; pH 5.2; 20 BE [email protected]# CE58.8 me/100 g; 0.01 M CaCl2
0.46 @2.22# 8 72 20 3.0* Eldon soil; pH 5.9; 20 BE [email protected]# CE512.9 me/100 g; 0.01 M CaCl2
0.36 @2.28# 9 72 19 2.1* Baxter soil; pH 6.0; 20 BE [email protected]# CE511.2 me/100 g; 0.01 M CaCl2
0.40 @2.26# 4 85 11 2.4* Menfro soil; pH 5.3; 20 BE [email protected]# CE59.1 me/100 g; 0.01 M CaCl2
0.58 @2.56# 2 79 19 1.8* Union soil; pH 5.4; 20 BE [email protected]# CE56.8 me/100 g; 0.01 M CaCl2
0.45 @2.43# 13 70 17 1.8* Lebanon soil; pH 4.9; 20 BE [email protected]# CE57.7 me/100 g; 0.01 M CaCl2
0.15 @2.24# 20 67 13 1.4* Clarksville soil; pH 5.7; 20 BE [email protected]# CE55.7 me/100 g; 0.01 M CaCl2
0.08 @2.23# 20 63 17 1.2* Cumberland soil; pH 6.4; 20 BE [email protected]# CE56.5 me/100 g; 0.01 M CaCl2
0.85 @2.68# 25 30 45 2.5* Sharkey soil; pH 5.0; 20 BE [email protected]# CE528.2 me/100 g; 0.01 M CaCl2
0.00 @2.46# 84 11 5 0.6* Lintonia soil; pH 5.3; 20 BE [email protected]# CE53.2 me/100 g; 0.01 M CaCl2
0.49 @2.43# 14 66 20 2.0* Waverley soil; pH 6.4; 20 BE [email protected]# CE512.8 me/100 g; 0.01 M CaCl2
1.33 Wisconsin peat; pH 7;CE5118 me/100 g; 0.01 M CaCl2
20 BE 145
1.36 Idem; pH 5 20 BE 1451.92 Peal moss; pH 7;
CE5106 me/100 g; 0.01 M CaCl2
20 BE 145
0.85 2.33 3.27 Hickory Hill sediment; coarse sifraction ~20–50mm!
25 BE 130
1.84° @2.41# 50.16 Soil humic acid; pH 2.9; 20 BE 640~0.91! 0.01 M CaCl22.11° @2.41# 49.83 Fluka humic acid; pH 4.6; 20 BE 640~0.91! 0.01 M CaCl2
2.13 Soil; experimental~literature! 2172.14av 147 soils~literature! 871.77 Correlation logKoc– logKow 963.66 Correlation logKoc– logS 962.53 Correlation logKoc– logS~mp! 963.34 Correlation logKoc– logS 564
Simetone~pKaÄ4.15, Ref. 247!
TA 100 H–montmorillonite~1–0.2mm!;pH 3.35; CE573.5 me/100 g
25 BE 250
J. Phys. Chem. Ref. Data, Vol. 30, No. 1, 2001
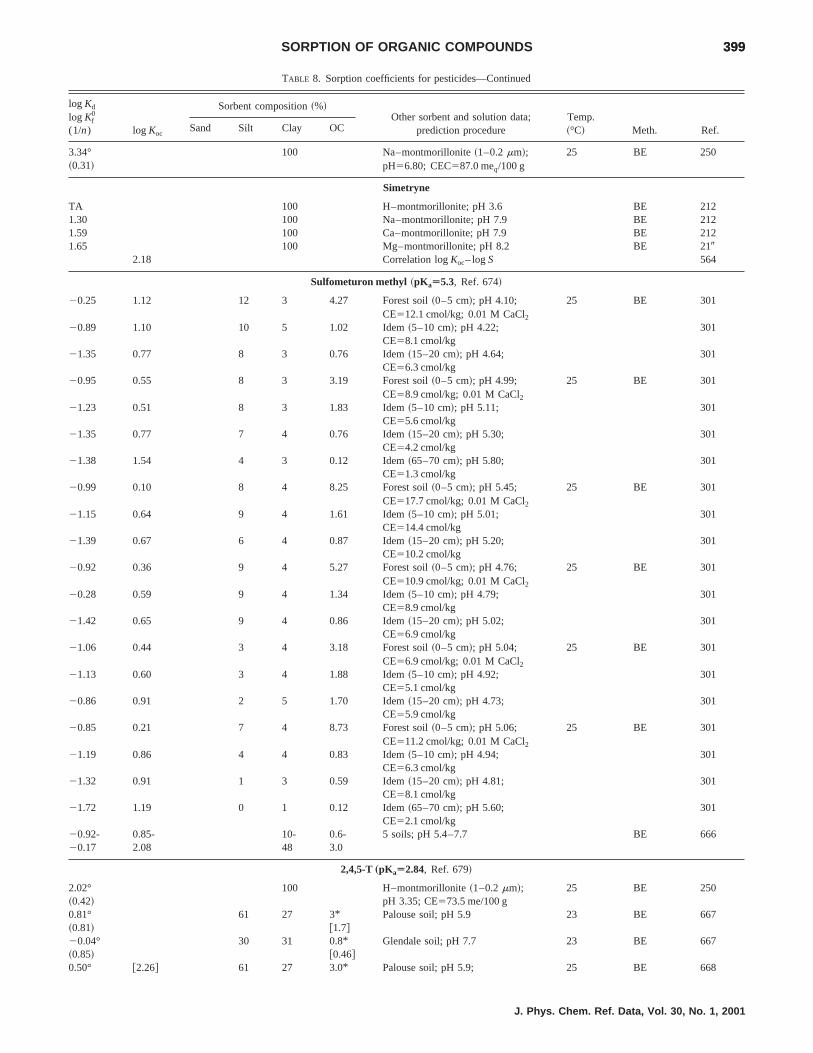
399399SORPTION OF ORGANIC COMPOUNDS
TABLE 8. Sorption coefficients for pesticides—Continued
log Kd
log Kf0
(1/n) log Koc
Sorbent composition~%!Other sorbent and solution data;
prediction procedureTemp.~°C! Meth. Ref.Sand Silt Clay OC
3.34° 100 Na–montmorillonite~1–0.2mm!; 25 BE 250~0.31! pH56.80; CEC587.0 meq/100 g
Simetryne
TA 100 H–montmorillonite; pH 3.6 BE 2121.30 100 Na–montmorillonite; pH 7.9 BE 2121.59 100 Ca–montmorillonite; pH 7.9 BE 2121.65 100 Mg–montmorillonite; pH 8.2 BE 219
2.18 Correlation logKoc– logS 564
Sulfometuron methyl ~pKaÄ5.3, Ref. 674!
20.25 1.12 12 3 4.27 Forest soil~0–5 cm!; pH 4.10;CE512.1 cmol/kg; 0.01 M CaCl2
25 BE 301
20.89 1.10 10 5 1.02 Idem~5–10 cm!; pH 4.22;CE58.1 cmol/kg
301
21.35 0.77 8 3 0.76 Idem~15–20 cm!; pH 4.64;CE56.3 cmol/kg
301
20.95 0.55 8 3 3.19 Forest soil~0–5 cm!; pH 4.99;CE58.9 cmol/kg; 0.01 M CaCl2
25 BE 301
21.23 0.51 8 3 1.83 Idem~5–10 cm!; pH 5.11;CE55.6 cmol/kg
301
21.35 0.77 7 4 0.76 Idem~15–20 cm!; pH 5.30;CE54.2 cmol/kg
301
21.38 1.54 4 3 0.12 Idem~65–70 cm!; pH 5.80;CE51.3 cmol/kg
301
20.99 0.10 8 4 8.25 Forest soil~0–5 cm!; pH 5.45;CE517.7 cmol/kg; 0.01 M CaCl2
25 BE 301
21.15 0.64 9 4 1.61 Idem~5–10 cm!; pH 5.01;CE514.4 cmol/kg
301
21.39 0.67 6 4 0.87 Idem~15–20 cm!; pH 5.20;CE510.2 cmol/kg
301
20.92 0.36 9 4 5.27 Forest soil~0–5 cm!; pH 4.76;CE510.9 cmol/kg; 0.01 M CaCl2
25 BE 301
20.28 0.59 9 4 1.34 Idem~5–10 cm!; pH 4.79;CE58.9 cmol/kg
301
21.42 0.65 9 4 0.86 Idem~15–20 cm!; pH 5.02;CE56.9 cmol/kg
301
21.06 0.44 3 4 3.18 Forest soil~0–5 cm!; pH 5.04;CE56.9 cmol/kg; 0.01 M CaCl2
25 BE 301
21.13 0.60 3 4 1.88 Idem~5–10 cm!; pH 4.92;CE55.1 cmol/kg
301
20.86 0.91 2 5 1.70 Idem~15–20 cm!; pH 4.73;CE55.9 cmol/kg
301
20.85 0.21 7 4 8.73 Forest soil~0–5 cm!; pH 5.06;CE511.2 cmol/kg; 0.01 M CaCl2
25 BE 301
21.19 0.86 4 4 0.83 Idem~5–10 cm!; pH 4.94;CE56.3 cmol/kg
301
21.32 0.91 1 3 0.59 Idem~15–20 cm!; pH 4.81;CE58.1 cmol/kg
301
21.72 1.19 0 1 0.12 Idem~65–70 cm!; pH 5.60;CE52.1 cmol/kg
301
20.92- 0.85- 10- 0.6- 5 soils; pH 5.4–7.7 BE 66620.17 2.08 48 3.0
2,4,5-T„pKaÄ2.84, Ref. 679!
2.02° 100 H–montmorillonite~1–0.2mm!; 25 BE 250~0.42! pH 3.35; CE573.5 me/100 g0.81° 61 27 3* Palouse soil; pH 5.9 23 BE 667~0.81! @1.7#20.04° 30 31 0.8* Glendale soil; pH 7.7 23 BE 667~0.85! @0.46#0.50° @2.26# 61 27 3.0* Palouse soil; pH 5.9; 25 BE 668
J. Phys. Chem. Ref. Data, Vol. 30, No. 1, 2001

400400 DELLE SITE
TABLE 8. Sorption coefficients for pesticides—Continued
log Kd
log Kf0
(1/n) log Koc
Sorbent composition~%!Other sorbent and solution data;
prediction procedureTemp.~°C! Meth. Ref.Sand Silt Clay OC
~0.90! @1.74# soil:solut.51:10.85° @2.60# Idem; pH 5.80; 0.01 N CaCl2 668~0.91! soil:solut.51:11.08° @2.84# Idem; pH 5.15; 0.1 N CaCl2 668~0.89! soil:solut51:10.77° Idem; pH 5.85; 0.01 N CaSO4 668~0.84! soil:solut51:10.91° Idem; pH 5.85; 0.01 N CaSO4 ; 668~0.84! soil:solut.51:3.30.92° Idem; pH 5.85; 0.01 N CaSO4; 668~0.80! soil:solut.51:100.93° Idem; pH 5.85; 0.01 N CaSO4 ; 668~0.86! solut.51:330.86° @2.62# Idem; pH 5.85; 0.01 N CaSO4 ; 5 668~0.92! soil:solut.51:10.79° @2.55# Idem; pH 5.85; 0.01 N CaSO4 ; 15 668~0.91! soil:solut.51:10.72° @2.48# Idem; pH 5.85; 0.01 N CaSO4 ; 35 668~0.90! soil:solut.51:10.79° 55 20 25 3.34 Webster soil; pH 7.3; BE 192~0.78! CE522 me/100 g20.31° @1.97# 0.53 Glendale soil; pH 8.5 BE 669~0.94!0.48° 2.43 Palouse soil; pH 6.5 BE 669~0.86!20.51° 0.80 Ephrata soil; pH 7.5 BE 669~1.50!0.38° @1.82# 3.66 Ordnance soil; pH 6.6 BE 669~0.95!20.37° 31.4 0.47 Glendale cl soil; pH 7.9. BE 484~0.85! 0.01 N CaSO40.04° 0.90 Glendale c soil;~no addition BE 647~0.87! of sewage sludge!; 0.01 N CaCl20.03° @1.87# 1.45 Idem; freshly amended~122.4 647~0.93! metric tons/ha sewage sludge!0.03° @1.81# 1.66 Idem; freshly amended~144.9 647~0.94! metric tons/ha sewage sludge!0.06° 0.86 Idem; preconditioned~no 647~0.87! addition of sewage sludge!0.12° @1.98# 1.37 Idem; preconditioned~144.9 647~0.90! metric tons/ha sewage sludge!0.15° @1.94# 1.61 Idem; preconditioned~180.8 647~0.91! metric tons/ha sewage sludge!20.37° @1.86# 0.60 Harvey fine sl soil;~no addition BE 647~0.90! of sewage sludge!; 0.01 N CaCl220.36° @1.59# 1.12 Idem; freshly amended~122.4 647~0.96! metric tons/ha sewage sludge!20.26° @1.61# 1.36 Idem; freshly amended~144.9 647~0.98! metric tons/ha sewage sludge!20.43° @1.78# 0.62 Idem; preconditioned~no 647~0.91! addition of sewage sludge!20.39° @1.83# 0.64 Idem; preconditioned~144.9 647~0.90! metric tons/ha sewage sludge!20.28° @1.91# 0.65 Idem; preconditioned~189.8 647~0.92! metric tons/ha sewage sludge!20.15° 0.66 Lea sl soil;~no addition BE 647~0.89! of sewage sludge!; 0.01 N CaCl220.21° @1.70# 1.23 Idem; freshly amended~122.4 647~0.93! metric tons/ha sewage sludge!20.17° @1.64# 1.57 Idem; freshly amended~144.9 647~0.95! metric tons/ha sewage sludge!20.18° 0.74 Idem; preconditioned~no 647~0.86! addition of sewage sludge!
J. Phys. Chem. Ref. Data, Vol. 30, No. 1, 2001

401401SORPTION OF ORGANIC COMPOUNDS
TABLE 8. Sorption coefficients for pesticides—Continued
log Kd
log Kf0
(1/n) log Koc
Sorbent composition~%!Other sorbent and solution data;
prediction procedureTemp.~°C! Meth. Ref.Sand Silt Clay OC
20.04° @1.85# 1.31 Idem; preconditioned~144.9 647~0.91! metric tons/ha sewage sludge!0.06° @1.86# 1.57 Idem; preconditioned~189.8 647~0.95! metric tons/ha sewage sludge!2 0.21° 38.8 29.8 31.4 0.8* Glendale soil; pH 7.7; BE 509~0.79! @0.46# CE531.1 me/100 g; 0.01 N CaCl2
1.32° 2.63 89.2 8.2 2.6 4.85 Podzol soil; pH 2.8; BE 163~0.97! CE515.1 me/100 g20.13° 69.7 14.4 15.9 1.25 Alfisol soil; pH 6.7; BE 163~1.14! CE512.3 me/100 g0.14° 5.5 58.8 35.7 1.58 Lake Constance sedim.; pH 7.1; BE 163~0.84! CE513.4 me/100 g
1.72 Soil; experimental~literature! 2171.90av 4 soils~literature! 872.34 Correlation logKoc– logS 5641.70 Correlation logKoc– MCI 578
Tebuthiuron ~pKaÄ1.2, Ref. 287!
0.56 1.92 12 3 4.27 Forest soil~0–5 cm!; pH 4.10;CE512.1 cmol/kg; 0.01 M CaCl2
25 BE 301
20.26 1.74 10 5 1.02 Idem~5–10 cm!; pH 4.22;CE58.1 cmol/kg
301
20.81 1.31 8 3 0.76 Idem~15–20 cm!; pH 4.64;CE56.3 cmol/kg
301
0.20 1.69 8 3 3.19 Forest soil~0–5 cm!; pH 4.99;CE58.9 cmol/kg; 0.01 M CaCl2
25 BE 301
20.24 1.50 8 3 1.83 Idem~5–10 cm!; pH 5.11;CE55.6 cmol/kg
301
21.02 1.10 7 4 0.76 Idem~15–20 cm!; pH 5.30;CE54.2 cmol/kg
301
21.56 1.36 4 3 0.12 Idem~65–70 cm!; pH 5.80;CE51.3 cmol/kg
301
0.31 1.39 8 4 8.25 Forest soil~0–5 cm!; pH 5.45;CE517.7 cmol/kg; 0.01 M CaCl2
25 BE 301
20.28 1.51 9 4 1.61 Idem~5–10 cm!; pH 5.01;CE514.4 cmol/kg
301
20.64 1.42 6 4 0.87 Idem~15–20 cm!; pH 5.20;CE510.2 cmol/kg
301
0.26 1.54 9 4 5.27 Forest soil~0–5 cm!; pH 4.76;CE510.9 cmol/kg; 0.01 M CaCl2
25 BE 301
20.55 1.32 9 4 1.34 Idem~5–10 cm!; pH 4.79;CE58.9 cmol/kg
301
20.75 1.31 9 4 0.86 Idem~15–20 cm!; pH 5.02;CE56.9 cmol/kg
301
0.15 1.64 3 4 3.18 Forest soil~0–5 cm!; pH 5.04;CE56.9 cmol/kg; 0.01 M CaCl2
25 BE 301
20.07 1.65 3 4 1.88 Idem~5–10 cm!; pH 4.92;CE55.1 cmol/kg
301
0.05 1.82 2 5 1.70 Idem~15–20 cm!; pH 4.73;CE55.9 cmol/kg
301
0.39 1.45 7 4 8.73 Forest soil~0–5 cm!; pH 5.06;CE511.2 cmol/kg; 0.01 M CaCl2
25 BE 301
20.42 1.63 4 4 0.83 Idem~5–10 cm!; pH 4.94;CE56.3 cmol/kg
301
20.92 1.31 1 3 0.59 Idem~15–20 cm!; pH 4.81;CE58.1 cmol/kg
301
21.41 1.51 0 1 0.12 Idem~65–70 cm!; pH 5.60;CE52.1 cmol/kg
301
21.02 1.59 0.17- 4 soils~0–20 cm! BE 6700.40 2.78
2.79 Soil; experimental~literature! 2171.79 Correlation logKoc– logS 564
J. Phys. Chem. Ref. Data, Vol. 30, No. 1, 2001

402402 DELLE SITE
TABLE 8. Sorption coefficients for pesticides—Continued
log Kd
log Kf0
(1/n) log Koc
Sorbent composition~%!Other sorbent and solution data;
prediction procedureTemp.~°C! Meth. Ref.Sand Silt Clay OC
Terbacil ~pKaÈ9, Ref. 679!
0.39° 1.80 18.4 45.3 38.3 3.87 Webster soil; pH 7.3; 23 BE 102~0.88! CE554.7 me/100 g; 0.01 N CaCl2
20.42° 1.63 65.8 19.5 14.7 0.90 Cecil soil; pH 5.6; 23 BE 102~0.99! CE56.8 me/100 g; 0.01 N CaCl2
20.92° 1.33 93.8 3.0 3.2 0.56 Eustis soil; pH 5.6; 23 BE 102~0.88! CE55.2 me/100 g; 0.01 N CaCl2
0.23° 2.1* Keyport sil soil; pH 5.4; BE 641~0.50! @1.2# average particle size55.6mm20.82° @1.56# 0.7* Cecil ls soil; pH 5.8; BE 641~0.96! @0.41# aver. particle size510.5
1.71 Soil; experimental~literature! 2171.61av 4 soils~literature! 871.50 Correlation logKoc– logKow 962.32 Correlation logKoc– logS 961.05 Correlation logKoc– logS~mp! 962.08 Correlation logKoc– logS 564
Terbufos
0.49° @2.78# 77 15 8 0.51 Sarpy soil; pH 7.3; 24 BE 122~0.95! CE55.7 me/100 g; 0.01 M CaCl2
1.03° @3.00# 83 9 8 1.07 Thurman soil; pH 6.83; 24 BE 122~0.94! CE56.1 me/100 g; 0.01 M CaCl2
0.90° @2.48# 37 42 21 2.64 Clarion agricultural soil; pH 5.00; 24 BE 122~0.96! CE521.0 me/100 g; 0.01 M CaCl2
1.31° @2.73# 21 55 24 3.80 Harps agricultural soil; pH 7.30; 24 BE 122~0.97! CE537.8 me/100 g; 0.01 M CaCl2
1.70° @2.44# 42 39 19 18.36 Peat; pH 6.98; 24 BE 122~0.97! CE577.34 me/100 g0.94° 15.2 63.8 20.5 1.94* Soil ~Versailles!; pH 6.4; BE 671~0.83! @1.13# CE510 me/100 [email protected]# @3.03# Idem ~linear isotherm! 6711.08° 2.0 14.9 8.7 2.82* Soil ~Chalons/Mame!; pH 8.1; BE 671~0.87! @1.64# CE57.9 me/100 [email protected]# @3.00# Idem ~linear isotherm! 6711.21° 30.3 52.6 16.9 7.18* Soil, l; pH 6.5; BE 671~0.85! @4.16# CE516.7 me/100 g
@2.75# Idem ~linear isotherm! 6713.04 Correlation logKoc– logS 564
Terbutryn
2.73 4.62 75 1.3 Eurosol-1; c soil; pH 5.1;0.01 M CaCl2
BE 583
2.08 3.51 22.6 3.7 Eurosol-2; sil; pH 7.4;0.01 M CaCl2
BE 583
1.99 3.45 17.0 3.45 Eurosol-3; I; pH 5.2;0.01 M CaCl2
BE 583
1.63 3.44 20.3 1.55 Eurosol-4; si; pH 6.5;0.01 M CaCl2
BE 583
2.91 3.94 6.0 9.25 Eurosol-5; ls; pH 3.2;0.01 M CaCl2
BE 583
2.85 Soil; experimental~literature! 2172.87 Correlation logKoc– logS 564
Tetrachlorvinphos
1.30 @3.05# 5.2 3.6 3.1* Surface soil~Naaldwijk!; BE [email protected]# pH 6.9; 0.007 M CaCl2
1.29 @2.98# 18.8 9.2 3.6* Surface soil~Honselersdijk II!; BE [email protected]# pH 7.0; 0.007 M CaCl2
2.06 @3.32# 37.0 19.8 9.7* Surface soil~Aalsmeer!; BE [email protected]# pH 7.1; 0.007 M CaCl2
3.07 Correlation logKoc– logS 564
J. Phys. Chem. Ref. Data, Vol. 30, No. 1, 2001

403403SORPTION OF ORGANIC COMPOUNDS
TABLE 8. Sorption coefficients for pesticides—Continued
log Kd
log Kf0
(1/n) log Koc
Sorbent composition~%!Other sorbent and solution data;
prediction procedureTemp.~°C! Meth. Ref.Sand Silt Clay OC
Triallate
1.20° 100 Georgia kaolinite No. 4; 25 BE 475~0.97! pH 7.11.00° 100 Wyoming montmorillonite 25 BE 475~0.99! No. 25; pH 9.92.85° Peat moss; pH 3.8 25 BE 475~0.94!1.66° Silica gel~24–32 mesh/cm!; 25 BE 475~0.97! pH 7.02.56° Wheat straw; pH 6.0 25 BE 475~1.04!20.28 @1.68# 16.2 1.11 Conventional farm soil;
pH 5.42; 0.004 M CaSO4
BE 646
20.28 @1.72# 19.7 1.00 Idem; pH 5.35 64620.54 @1.66# 24.7 0.64 Idem; pH 7.12 64620.08 @1.65# 16.5 1.85 Low-input farm soil; pH 5.53;
0.004 M CaSO4
BE 646
20.14 @1.76# 16.6 1.26 Idem; pH 5.47 64620.29 @1.77# 19.1 0.86 Idem; pH 6.32 6461.51 @3.65# 48.2 42.1 9.7 1.24* San Joaquin soil; pH 7.2 25 BE 672
@0.72#1.91 @3.44# 5.8 69.0 25.2 5.1* Flanagan soil; pH 5.5 25 BE 672
@2.96#1.08° @3.45# 67.1 25.8 7.1 0.43 Hanford soil; pH 6.05; 25 BE 528~0.94! CE55.95 cmol/kg; 0.01 M CaCl2
0.97° 82.0 13.5 4.5 0.33 Tuiunga soil; pH 6.30; 25 BE 528~0.77! CE50.45 cmol/kg; 0.01 M CaCl2
@2.38# @3.52# 45.5 41.0 13.5 12.4* Lacombe soil; pH 7.7; BE [email protected]# 0.1 M CaCl2
@2.12# @3.55# 53.5 27.5 19.2 6.5* Weyburn soil; pH 6.5; BE [email protected]# 0.1 M CaCl2
@2.06# @3.67# 5.3 25.3 69.5 4.2* Regina soil; pH 7.8; BE [email protected]# 0.1 M CaCl2
@1.58# @3.56# 81.6 10.4 8 1.8* Asquith soil; pH 7.5; BE [email protected]# 0.1 M CaCl2
3.35 Soil; experimental~literature! 2173.70 Correlation logKom– logS(563) 5283.94 Correlation logKoc– logKow(87) 5283.55 Correlation logKoc– logKow(217) 5283.30 Correlation logKoc– logS 5643.22 Correlation logKoc– MCI 598
Triazophos
1.26 @3.01# 5.2 3.6 3.1* Surface soil~Naaldwijk!; BE [email protected]# pH 6.9; 0.007 M CaCl2
1.08 @2.76# 18.8 9.2 3.6* Surface soil~Honselersdijk II!; BE [email protected]# pH 7.0; 0.007 M CaCl2
1.68 @2.93# 37.0 19.8 9.7* Surface soil~Aalsmeer!; BE [email protected]# pH 7.1; 0.007 M CaCl2
2.76 Correlation logKoc– logS 564
Trietazine ~pKaÄ1.88, Ref. 231!
TA 100 H–montmorillonite~1–0.2mm!;pH 3.35; CE573.5 me/100 g
25 BE 250
1.76 100 Na–montmorillonite~1–0.2mm!;pH 6.8; CE587.0 me/100 g
25 BE 250
1.25 2.74 3.27 Hickory Hill sediment; coarsesi fraction ~20–50mm!
25 BE 130
20.31 @2.58# 97.1 2.3 0.6 0.13 Tampa aquifer; pH 8;0.01 N CaCl2
MD 521
2.78 Soil; experimental~literature! 2172.96 Correlation logKoc– logKow 96
J. Phys. Chem. Ref. Data, Vol. 30, No. 1, 2001

404404 DELLE SITE
TABLE 8. Sorption coefficients for pesticides—Continued
log Kd
log Kf0
(1/n) log Koc
Sorbent composition~%!Other sorbent and solution data;
prediction procedureTemp.~°C! Meth. Ref.Sand Silt Clay OC
3.25 Correlation logKoc– logS 962.36 Correlation logKoc– logS~mp! 962.92 Correlation logKoc– logS 5642.60 Correlation logKoc – MCI 578
Trifluralin
1.81° 100 Georgia kaolinite No. 4; 25 BE 475~0.96! pH 6.71.54 100 Wyoming montmorillonite
No. 25; pH 9.525 BE 475
4.13° Peat moss; pH 3.6 25 BE 475~1.41!1.72° Silica gel~24–32 mesh/cm!; 25 BE 475~0.88! pH 6.72.92° Wheat straw; pH 5.8 25 BE 475~1.04!2.48 @4.12# 6 71 23 4.0* Plano soil (soil/solut.51 g/100 mL) 25 BE 351
@2.32# pH 6.3; CE520 me/100 g2.39 @4.03# Idem (soil/solut.52 g/100 mL) 25 3512.27 @3.90# Idem (soil/solut.54 g/100 mL) 25 3512.76 @4.40# Idem (soil/solut.52 g/100 mL) 5 3511.53 @2.95# 17 64 19 6.5* Adolph soil; pH 6.2; 22 BE 345
@3.77# CE522.5 me/100 g0.92 @2.81# 9 78 13 2.2* Fayette soil; pH 6.5; 22 BE 345
@1.28# CE57.7 me/100 g1.04 @2.98# 23 42 35 2.0* Kewaunee soil; pH 7.8; 22 BE 345
@1.16# CE519.2 me/100 g1.26 @2.93# 12 61 27 3.7* Ontonagon soil; pH 6.6; 22 BE 345
@2.15# CE513.8 me/100 g1.13 @3.07# 27 12 61 2.0* Peebles soil; pH 7.4; 22 BE 345
@1.16# CE523.4 me/100 g0.57 @2.91# 89 6 5 0.8* Plainfield soil; pH 6.6; 22 BE 345
@0.46# CE53.7 me/100 g1.06 @2.62# 17 66 17 4.8* Plano soil; pH 6.7; 22 BE 345
@2.78# CE517.4 me/100 g1.46 @2.72# 23 62 15 9.5* Poigan soil; pH 7.0; 22 BE 345
@5.51# CE533.6 me/100 g1.58 @2.75# 59 30 11 11.7* Sebewa soil; pH 6.8; 22 BE 345
@6.79# CE528.4 me/100 g1.39 @3.02# 17 73 10 4.1* Withee soil; pH 6.5; 22 BE 345
@2.38# CE510.9 me/100 g1.44 @2.83# 2.9 68.7 28.4 7.1* Lanton soil; pH 6.4; BE 631
@4.12# CE532.8 me/100 g1.75 3.13 18.9 26.3 54.8 4.24 Tsukuba soil; pH 6.5;
0.01 M CaCl2
25 BE 642
3.36° Idem 642~1.64!0.72 2.60 23.1 15.4 61.5 1.35 Kanuma soil; pH 5.7;
0.01 M CaCl2
25 BE 642
0.56° Idem 642~0.94!2.61 4.71 26 0.8 Agricultural soil; pH 7.4;
CE531 cmol/kg; 0.01 M CaCl2
20 BE 297
2.79 4.71 54 1.2 Idem; pH 7.8; CE524 cmol/kg 2972.04 4.44 11 0.4 Idem; pH 8.0; CE511 cmol/kg 2973.48 4.59 6 7.6 Idem; pH 4.4; CE527 cmol/kg 297
3.64av 38 48 14 0.68 Commerce soil; pH 6.7 BE 575~three 56 30 14 1.12 Tracy soil; pH 6.2 BE 575soils! 12 56 32 2.01 Catlin soil; pH 6.2 BE 575
3.00 4.49 3.27 Hickory Hill sediment; coarse sifraction ~20–50mm!
25 BE 130
J. Phys. Chem. Ref. Data, Vol. 30, No. 1, 2001

405405SORPTION OF ORGANIC COMPOUNDS
TABLE 8. Sorption coefficients for pesticides—Continued
log Kd
log Kf0
(1/n) log Koc
Sorbent composition~%!Other sorbent and solution data;
prediction procedureTemp.~°C! Meth. Ref.Sand Silt Clay OC
2.08 @4.22# 31.2 68.6 0.72 Missouri Riv. sed.~Big Ben Lake,SD!~18 g/L!; pH 7.83;equilibr. time510 d
GP 156
1.36 @4.32# 75.6 17.4 0.11 Loess soil~Turin, IA! ~10 g/L!;pH 8.34; equilibr. time510 d
GP 156
2.98 @4.50# 27.1 52.6 3.04 Ohio Riv. sed.~Ceredo, WV!~2.5 g/L!; pH 6.90;equilibr. time521 d
GP 156
1.59 4.18 6.9 0.45* Mivtahim agricult. surface soil 25 BE [email protected]#
1.77 3.91 23.8 1.25* Gilat agricult. surface soil 25 BE [email protected]#
2.14 3.93 71.2 2.82* Neve Yaar agricult. surface soil 25 BE [email protected]#
2.63 4.10 76.2 5.82* Malkiya agricult. surface soil 25 BE [email protected]#
3.13 4.47 60.5 7.85* Kinneret A Lake sediment 25 BE [email protected]#
2.84 4.44 63.8 4.39* Kinneret G Lake sediment 25 BE [email protected]#
3.95av 22 literature data 5625.13 Cyanopropyl column 20–25 RPLC 5793.98 C18 column RPLC 5734.14 Soil; experimental~literature! 2173.76 Correlation logKoc– logS 564
NA Not adsorbed.TA Totally adsorbed.Values in square parentheses have been calculated by the author.* log Kom in column 2 and % OM content in column 6.°* log nonlinearKom with the respective value of (1/n) in below, when available.av average value.Idem refers to the sorbent reported just above; only the data~texture, OC, temperature, method! which were changed are specified.
J. Phys. Chem. Ref. Data, Vol. 30, No. 1, 2001

33
406406 DELLE SITE
TABLE 9. Sorption coefficients for miscellaneous compounds
log Kd
log Kf0
(1/n) log Koc
Sorbent composition~%!Other sorbent and solution data;
prediction procedureTemp.~°C! Meth. Ref.Sand Silt Clay OC
Acetophenone
@0.20# 2.26 4 10 86 0.11 Apison soil; pH 4.5;CE576 me/100 g
BE 570
@0.16# 11 21 68 0.06 Fullerton soil; pH 4.4;CE564 me/100 g
BE 570
@1.26# 2.02 2 38 60 1.2 Dormont soil; pH 4.2;CE5129 me/100 g
BE 570
20.85 2.15 11.2 0.17*@0.10#
Netanya agricult. surface soil 25 BE 563
21.30 1.29 6.9 0.45*@0.26#
Mivtahim agricult. surface soil 25 BE 563
20.43 1.74 63.1 1.18*@0.68#
Golan agricult. surface soil 25 BE 563
20.82 1.31 23.8 1.25*@0.73#
Gilat agricult. surface soil 25 BE 563
20.52 1.56 72.5 1.42*@0.82#
Shefer agricult. surface soil 25 BE 563
20.66 1.42 10.6 1.45*@0.84#
Bet Degan agricult. surface soil 25 BE 563
20.41 1.38 71.2 2.82*@1.64#
Neve Yaar agricult. surface soil 25 BE 563
20.28 1.19 76.2 5.82*@3.38#
Malkiya agricult. surface soil 25 BE 563
20.37 1.38 3.08*@1.79#
Kinneret Lake sediment 25 BE 563
0.04 1.38 60.5 7.85*@4.55#
Kinneret A Lake sediment 25 BE 563
0.04 1.41 63.2 7.43*@4.31#
Kinneret F Lake sediment 25 BE 563
0.02 1.61 63.8 4.39*@2.55#
Kinneret G Lake sediment 25 BE 563
20.05 1.63 3.0 41.8 55.2 2.07 River sediment; pH 7.79;CE523.7 me/100 g
25 BE 210
20.25 1.38 33.6 35.4 31.0 2.28 River sediment; pH 7.44;CE519 me/100 g
25 BE 210
20.17 1.98 0.2 31.2 68.6 0.72 River sediment; pH 7.83;CE533 me/100 g
25 BE 210
21.15 1.68 82.4 10.7 6.8 0.15 River sediment; pH 8.32;CE53.7 me/100 g
25 BE 210
21.05 1.91 7.1 75.6 17.4 0.11 Loess; pH 8.34;CE512.4 me/100 g
25 BE 210
20.92 1.40 2.1 34.4 63.6 0.48 Soil; pH 4.45; CE518.9 me/100 g 25 BE 21020.57 1.45 15.6 48.7 35.7 0.95 River sediment; pH 7.79;
CE511.3 me/100 g25 BE 210
20.52 1.66 34.6 25.8 39.5 0.66 River sediment; pH 7.76;CE515.4 me/100 g
25 BE 210
20.54 1.34 0.0 71.4 28.6 1.30 Soil, pH 5.50; CE58.5 me/100 g 25 BE 21020.07 1.65 50.2 42.7 7.1 1.88 River sediment; pH 7.60;
CE58.33 me/100 g25 BE 210
20.28 1.49 26.2 52.7 21.2 1.67 River sediment; pH 7.55;CE58.53 me/100 g
25 BE 210
20.17 1.46 17.3 13.6 69.1 2.38 River sediment; pH 6.70;CE531.2 me/100 g
25 BE 210
20.18 1.65 1.6 55.4 42.9 1.48 River sediment; pH 7.75;CE520.9 me/100 g
25 BE 210
20.36 1.56 67.6 13.9 18.6 1.21 Stream sediment; pH 6.35;CE53.72 me/100 g
25 BE 210
0.03 @1.71# 48 35 2.08 Sangamon sediment 25 BE 6720.05 @1.45# 12 69 3.16 Crane Island sediment 25 BE 67
1.73 Cyanopropyl column 20–25 RPLC 5791.79 C18 column; correlation logKoc–
(log k81D0x)RPLC 577
J. Phys. Chem. Ref. Data, Vol. 30, No. 1, 2001
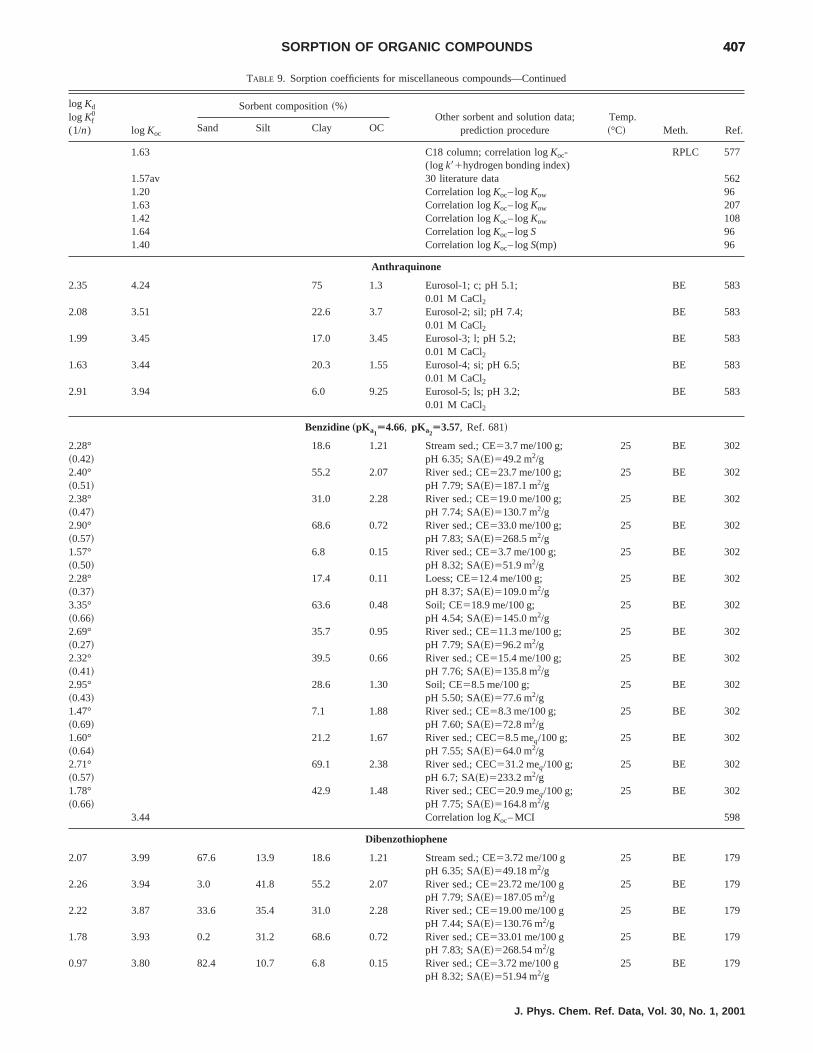
407407SORPTION OF ORGANIC COMPOUNDS
TABLE 9. Sorption coefficients for miscellaneous compounds—Continued
log Kd
log Kf0
(1/n) log Koc
Sorbent composition~%!Other sorbent and solution data;
prediction procedureTemp.~°C! Meth. Ref.Sand Silt Clay OC
1.63 C18 column; correlation logKoc-(log k81hydrogen bonding index)
RPLC 577
1.57av 30 literature data 5621.20 Correlation logKoc– logKow 961.63 Correlation logKoc– logKow 2071.42 Correlation logKoc– logKow 1081.64 Correlation logKoc– logS 961.40 Correlation logKoc– logS(mp) 96
Anthraquinone
2.35 4.24 75 1.3 Eurosol-1; c; pH 5.1;0.01 M CaCl2
BE 583
2.08 3.51 22.6 3.7 Eurosol-2; sil; pH 7.4;0.01 M CaCl2
BE 583
1.99 3.45 17.0 3.45 Eurosol-3; l; pH 5.2;0.01 M CaCl2
BE 583
1.63 3.44 20.3 1.55 Eurosol-4; si; pH 6.5;0.01 M CaCl2
BE 583
2.91 3.94 6.0 9.25 Eurosol-5; ls; pH 3.2;0.01 M CaCl2
BE 583
Benzidine„pKa1Ä4.66, pKa2
Ä3.57, Ref. 681!
2.28° 18.6 1.21 Stream sed.; CE53.7 me/100 g; 25 BE 302~0.42! pH 6.35; SA~E!549.2 m2/g2.40° 55.2 2.07 River sed.; CE523.7 me/100 g; 25 BE 302~0.51! pH 7.79; SA~E!5187.1 m2/g2.38° 31.0 2.28 River sed.; CE519.0 me/100 g; 25 BE 302~0.47! pH 7.74; SA~E!5130.7 m2/g2.90° 68.6 0.72 River sed.; CE533.0 me/100 g; 25 BE 302~0.57! pH 7.83; SA~E!5268.5 m2/g1.57° 6.8 0.15 River sed.; CE53.7 me/100 g; 25 BE 302~0.50! pH 8.32; SA~E!551.9 m2/g2.28° 17.4 0.11 Loess; CE512.4 me/100 g; 25 BE 302~0.37! pH 8.37; SA~E!5109.0 m2/g3.35° 63.6 0.48 Soil; CE518.9 me/100 g; 25 BE 302~0.66! pH 4.54; SA~E!5145.0 m2/g2.69° 35.7 0.95 River sed.; CE511.3 me/100 g; 25 BE 302~0.27! pH 7.79; SA~E!596.2 m2/g2.32° 39.5 0.66 River sed.; CE515.4 me/100 g; 25 BE 302~0.41! pH 7.76; SA~E!5135.8 m2/g2.95° 28.6 1.30 Soil; CE58.5 me/100 g; 25 BE 302~0.43! pH 5.50; SA~E!577.6 m2/g1.47° 7.1 1.88 River sed.; CE58.3 me/100 g; 25 BE 302~0.69! pH 7.60; SA~E!572.8 m2/g1.60° 21.2 1.67 River sed.; CEC58.5 meq/100 g; 25 BE 302~0.64! pH 7.55; SA~E!564.0 m2/g2.71° 69.1 2.38 River sed.; CEC531.2 meq/100 g; 25 BE 302~0.57! pH 6.7; SA~E!5233.2 m2/g1.78° 42.9 1.48 River sed.; CEC520.9 meq/100 g; 25 BE 302~0.66! pH 7.75; SA~E!5164.8 m2/g
3.44 Correlation logKoc– MCI 598
Dibenzothiophene
2.07 3.99 67.6 13.9 18.6 1.21 Stream sed.; CE53.72 me/100 gpH 6.35; SA~E!549.18 m2/g
25 BE 179
2.26 3.94 3.0 41.8 55.2 2.07 River sed.; CE523.72 me/100 gpH 7.79; SA~E!5187.05 m2/g
25 BE 179
2.22 3.87 33.6 35.4 31.0 2.28 River sed.; CE519.00 me/100 gpH 7.44; SA~E!5130.76 m2/g
25 BE 179
1.78 3.93 0.2 31.2 68.6 0.72 River sed.; CE533.01 me/100 gpH 7.83; SA~E!5268.54 m2/g
25 BE 179
0.97 3.80 82.4 10.7 6.8 0.15 River sed.; CE53.72 me/100 gpH 8.32; SA~E!551.94 m2/g
25 BE 179
J. Phys. Chem. Ref. Data, Vol. 30, No. 1, 2001

8
408408 DELLE SITE
TABLE 9. Sorption coefficients for miscellaneous compounds—Continued
log Kd
log Kf0
(1/n) log Koc
Sorbent composition~%!Other sorbent and solution data;
prediction procedureTemp.~°C! Meth. Ref.Sand Silt Clay OC
0.76 3.72 7.1 75.6 17.4 0.11 Loess; CE512.4 me/100 gpH 8.34; SA~E!5108.96 m2/g
25 BE 179
1.70 4.01 2.1 34.4 63.6 0.48 Soil; CE518.86 me/100 gpH 4.54; SA~E!5145.04 m2/g
25 BE 179
2.26 4.28 15.6 48.7 35.7 0.95 River sed.; CE511.30 me/100 gpH 7.79; SA~E!596.20 m2/g
25 BE 179
1.81 3.99 34.6 25.8 39.5 0.66 River sed.; CE515.43 me/100 gpH 7.76; SA~E!5135.76 m2/g
25 BE 179
2.01 3.89 0.0 71.4 28.6 1.30 Soil; CE58.50 me/100 gpH 5.50; SA~E!577.58 m2/g
25 BE 179
2.44 4.17 50.2 42.7 7.1 1.88 River sed.; CE58.33 me/100 gpH 7.60; SA~E!572.83 m2/g
25 BE 179
2.25 4.02 26.2 52.7 21.2 1.67 River sed.; CE58.53 me/100 gpH 7.55; SA~E!564.04 m2/g
25 BE 179
2.59 4.21 17.3 13.6 69.1 2.38 River sed.; CE531.15 me/100 gpH 6.70; SA~E!5233.19 m2/g
25 BE 179
2.13 3.96 1.6 55.4 42.9 1.48 River sed.; CE520.86 me/100 gpH 7.75; SA~E!5164.83 m2/g
25 BE 179
1.06° 0.25 Kaolinite coated with Pohokee 25 BE 228~0.85! peat humic acid. 0.1 M NaClO40.48°~0.91!
0.02 Idem 228
1.69° @4.24# 0.28 Hematite coated with Pohokee 25 BE 22~0.97! peat humic acid. 0.1 M NaClO41.26°~0.79!
0.47 Idem 228
20.41°~0.65!
0.02 Idem 228
4.05 Sediments~experimental! 2113.99 Correlation logKoc– logKow 964.17 Correlation logKoc– logKow(108) 2283.87 Correlation logKoc– logS 964.20 Correlation logKoc– logS(mp) 964.18 Correlation logKoc– logS(mp)(52) 2284.00 Correlation logKoc– MCI 5974.06 Correlation logKoc– MCI 578
Dimethylphthalate
21.82 0.88 97.3 2.2 0.5 0.2 Forest soil; ph 5.6;CE50.48 me/100 g
LE 344
20.03 1.63 65.2 25.6 9.2 2.2 Agricultural soil; pH 7.4;CE59.0 me/100 g
LE 344
0.41 1.84 69.5 20.5 10.1 3.7 Forest soil; pH 4.2;CE52.9 me/100 g
LE 344
1.64 Correlation logKoc– logS 564
a-Naphthol „pKaÄ9.34, Ref. 681!
0.87 @2.58# 1.94 Hagerstown soil; silt loam;0.01 N CaCl2
23 BE 454
1.20° 55.2 2.07 River sed.; CE523.7 me/100 g; 25 BE 97~0.44! pH 7.79; SA~E!5187.1 m2/g0.91° 31.0 2.28 River sed.; CE519.0 me/100 g; 25 BE 97~0.55! pH 7.74; SA~E!5130.7 m2/g1.48° 68.6 0.72 River sed.; CE533.0 me/100 g; 25 BE 97~0.31! pH 7.83; SA~E!5268.5 m2/g0.42° 6.8 0.15 River sed.; CE53.7 me/100 g; 25 BE 97~0.61! pH 8.32; SA~E!551.9 m2/g1.24° 17.4 0.11 Loess sed.; CE512.4 me/100 g; 25 BE 97~0.22! pH 8.34; SA~E!5109.0 m2/g1.00° 52.6 3.04 River sed.; CE512 me/100 g; 25 BE 97~.36! pH 6.900.45° 63.6 0.48 Soil; CE518.9 me/100 g; 25 BE 97
J. Phys. Chem. Ref. Data, Vol. 30, No. 1, 2001

409409SORPTION OF ORGANIC COMPOUNDS
TABLE 9. Sorption coefficients for miscellaneous compounds—Continued
log Kd
log Kf0
(1/n) log Koc
Sorbent composition~%!Other sorbent and solution data;
prediction procedureTemp.~°C! Meth. Ref.Sand Silt Clay OC
~0.56! pH 4.54; SA~E!5145.0 m2/g1.41° 35.7 0.95 River sed.; CE511.3 me/100 g; 25 BE 97~0.32! pH 7.79; SA~E!596.2 m2/g1.14° 39.5 0.66 River sed.; CE515.4 me/100 g; 25 BE 97~0.28! pH 7.76; SA~E!5135.8 m2/g1.33° 28.6 1.30 Soil; CE58.5 me/100 g; 25 BE 97~0.31! pH 5.50; SA~E!577.6 m2/g0.92° 7.1 1.88 River sed.; CE58.3 me/100 g; 25 BE 97~0.50! pH 7.60; SA~E!572.8 m2/g0.94° 21.2 1.67 River sed.; CE58.5 me/100 g; 25 BE 97~0.64! pH 7.55; SA~E!564.0 m2/g1.15° 69.1 2.38 River sed.; CE531.2 me/100 g; 25 BE 97~0.39! pH 6.7; SA~E!5233.2 m2/g1.01° 42.9 1.48 River sed.; CE520.9 me/100 g; 25 BE 97~0.44! pH 7.75; SA~E!5164.8 m2/g0.91° 22.5 0.90 Soil; CE53 me/100 g; 25 BE 97~0.55! pH 6.401.00° 18.6 1.21 Stream sed.; CE53.7 me/100 g; 25 BE 97~0.36! pH 6.35; SA~E!549.2 m2/g
5.57 4 10 86 0.11 Apison soil; pH 4.5;CE576 me/100 g
BE 570
.5.78 11 21 68 0.06 Fullerton soil; pH 4.4;CE564 me/100 g
BE 570
3.11 2 38 60 1.2 Dormont soil; pH 4.2;CE5129 me/100 g
BE 570
2.46 2.64 65.8 Lignin~organisolv!; pH 6.5;0.03 M CaCl2
25 BE 346
2.15 2.40 57.1 Lignin~alkali!; pH 6.5;0.03 M CaCl2
25 BE 346
1.93 2.19 56.0 Collagen; pH 6.5; 0.03 M CaCl2 25 BE 3461.64 1.92 52.8 Collagen/~annic acid51/5!; pH 6.5;
0.03 M CaCl2
25 BE 346
1.08 1.43 44.6 Chitin; pH 6.5; 0.03 M CaCl2 25 BE 3460.04 0.39 44.4 Cellulose; pH 6.5; 0.03 M CaCl2 25 BE 346
3.31 Humic acid-silica column 20–23 RPLC 5872.91 Salicylic acid-silica column 20–23 RPLC 5872.61 8-Hydroxyquinoline-silica column 20–23 RPLC 5872.89 Correlation logKoc– MCI 5783.41 Correlation logKoc– MCI 5972.72 Correlation logKoc– LSER 602
Values in square parentheses have been calculated by the author.*% OM in column 6.Idem refers to the sorbent reported just above; only the data~texture, OC, temperature, method! which were changed are specified.
J. Phys. Chem. Ref. Data, Vol. 30, No. 1, 2001

1 the
410410 DELLE SITE
TABLE 10. Comparison of sorption data on soils obtained by batch equilibration and miscible displacement technique
Compound
BE MD
NKoc
(aver6SD) NKoc
(aver6SD)Deviation
factora
Benzene 11 38617 6 31618 1.23Toluene 4 100665 7 90680 1.11Nitrobenzene 6 2176187 3 7463 2.93Naphthalene 13 293067250 6 90661150 3.23TCE 4 70631 6 71646 21.01TeCE 6 2496143 6 1966113 1.27Chlorobenzene 3 1826120 5 118698 1.541,2,4-Trichlorobenzene 8 260063210 5 11506970 2.26
aDeviation factor is calculated as the ratio of the averageKoc values obtained by BE to average values obtained by MD. When this ratio is less thannegative reciprocal is reported.
-ai
eifbrith
mre
athtth
leheBb
bt
int
1.ns ie
n,f
enng
y
er-dur-re-
b-
T,
nyate
, ands
rp-ted.il,er-be
o farandn
la-nor
ev-
il/dce,
ghy
well below the solubility limit~,0.5 S!, where sorption iso-therm could be considered linear.562 Sorption data were derived from graphical isotherms, when only those were avable.
Sorption data (Koc) obtained with different methods werexamined at first with the aim to detect any significant dference among them. Tables 1–9 show that batch equilition ~BE! is the method most frequently used, especially wpesticides. Miscible displacement~MD! was often experi-mented in support to studies of migration of organic copounds through soil columns. Finally, only few data weobtained by head space~HS! and gas purge~GP!; anyway,average values obtained using HS for toluene and TCEGP for TCE are higher than those obtained with BE forsame compounds. However, due of the scarcity of data,only significant comparison seems to be that betweenaverage of the data obtained by BE and those obtainedMD. Table 10 shows this comparison, using soil sampwith OC>0.1 and excluding any other sorbent. Although tvalues of deviation factors indicate a general tendency ofto give sorption coefficients greater than those obtainedMD, the variability of the data is such to raise some douon the certainty of this result.
The possibility of measurement errors and errors duethe solids effect using the BE method were then takenconsideration.
The first point was discussed at the end of Sec. 1where it was specified that the measurement errors careduced if the percent solute removed from the solution ibetween 20% and 80%. Some indicative values of sorbconcentration necessary to stay in this range were givethat section as a function ofKd . Sorbent concentrationsused in the literature, were then collected when possible,the systems listed in Tables 1–9 havingKd values rangingfrom less than 0.1 to about 105 ~data not reported!. The resultof this investigation was that almost 30% of those sorbconcentrations was out of the previous recommended rabut most of the corresponding values ofKd were in the rangeof variability of all other results, so making difficult anattempt to quantify the error involved.
The second cause of error in measuringKd is connected to
J. Phys. Chem. Ref. Data, Vol. 30, No. 1, 2001
l-
-a-
-
ndehee
bys
Eys
too
1,benntin
or
te,
the solids effect due, for instance, to the possibility of intference of nonsettling particles released by the sorbenting BE measurements. This possibility seems stronglyduced when the sorbent concentration is<1 g/dm3, asdemonstrated with chlorobenzenes and PCBs.495 By examin-ing the literature listed in Tables 1–9, it is possible to oserve that such values of concentration~data not reported!were used with compounds havingKds greater than 100, likeasulam, butralin, dicamba, fluometuron, leptophos, DDPCBs etc. For compounds having smallerKds, the data avail-able for the systems listed in Tables 1–9 do not allow aconclusion and other studies would be necessary to estimthe entity of this effect in each specific case. Howeverreduced solids effect is expected for these compou~Sec. 8!.
At the end of this first series of examinations of the sotion data, the effect of type of sorbent has been investigaPreliminary results indicated without any doubt that sosediment, and possibly dissolved organic matter give diffent values of sorption coefficients and, therefore, have totreated separately. Other variables, like those discussed s~effect of the experimental method, measurement errorsolids effect!, do not allow to discard any of the sorptiocoefficients listed in Tables 1–9.
13.2. Effect of Sorbent Properties on SorptionCoefficients
Table 11 shows the correlation coefficients betweenKd
and four sorbent properties, OC, pH, CE, and clay. Corretions betweenKd and SA were not taken into consideratiodue to lack of SA data obtained with a single method. Ftwo cases, concerning TeCM and 1,2-DCBz, for which seral values of SA~N2! were available,Kd did not appear tocorrelate with SA.
The data of Table 11 indicate that OC content in sosediment~>0.1%! is the property most highly correlatewith adsorption. CE and pH are the next in importanwhile clay content does not correlate withKd , except for fewcases. However, correlation coefficients with CE, althousignificant for many compounds, do not allow an
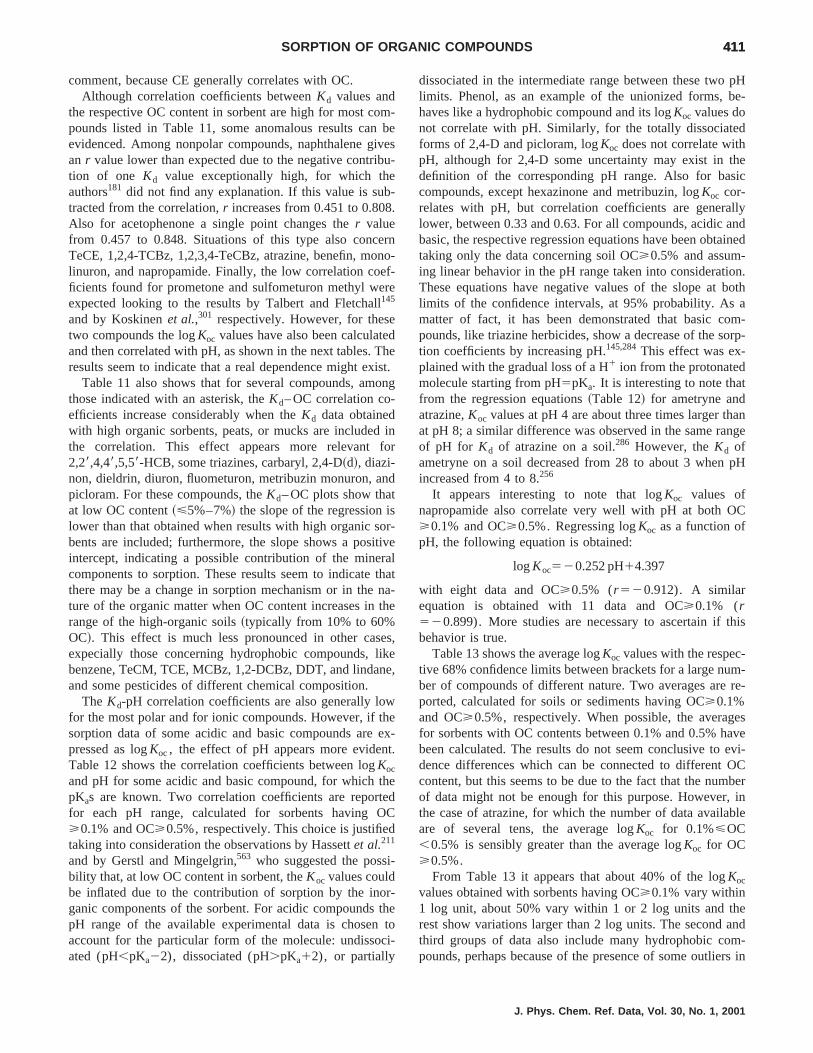
om
ivbu
-.
rnoeferleedThison
fo
nd
isoitirathnth
elike
wheet.
thteOd
i-
rt
ci
pHbe-
d
heic
llyandained
on.botha
om-orp-
t
annge
pH
C
this
-m-re-
esaveevi-OCberin
ble
eandm-rs in
411411SORPTION OF ORGANIC COMPOUNDS
comment, because CE generally correlates with OC.Although correlation coefficients betweenKd values and
the respective OC content in sorbent are high for most cpounds listed in Table 11, some anomalous results canevidenced. Among nonpolar compounds, naphthalene gan r value lower than expected due to the negative contrition of one Kd value exceptionally high, for which theauthors181 did not find any explanation. If this value is subtracted from the correlation,r increases from 0.451 to 0.808Also for acetophenone a single point changes ther valuefrom 0.457 to 0.848. Situations of this type also conceTeCE, 1,2,4-TCBz, 1,2,3,4-TeCBz, atrazine, benefin, molinuron, and napropamide. Finally, the low correlation coficients found for prometone and sulfometuron methyl wexpected looking to the results by Talbert and Fletchal145
and by Koskinenet al.,301 respectively. However, for thestwo compounds the logKoc values have also been calculatand then correlated with pH, as shown in the next tables.results seem to indicate that a real dependence might ex
Table 11 also shows that for several compounds, amthose indicated with an asterisk, theKd– OC correlation co-efficients increase considerably when theKd data obtainedwith high organic sorbents, peats, or mucks are includedthe correlation. This effect appears more relevant2,28,4,48,5,58-HCB, some triazines, carbaryl, 2,4-D~d!, diazi-non, dieldrin, diuron, fluometuron, metribuzin monuron, apicloram. For these compounds, theKd– OC plots show thatat low OC content~<5%–7%! the slope of the regressionlower than that obtained when results with high organic sbents are included; furthermore, the slope shows a posintercept, indicating a possible contribution of the minecomponents to sorption. These results seem to indicatethere may be a change in sorption mechanism or in theture of the organic matter when OC content increases inrange of the high-organic soils~typically from 10% to 60%OC!. This effect is much less pronounced in other casexpecially those concerning hydrophobic compounds,benzene, TeCM, TCE, MCBz, 1,2-DCBz, DDT, and lindanand some pesticides of different chemical composition.
The Kd-pH correlation coefficients are also generally lofor the most polar and for ionic compounds. However, if tsorption data of some acidic and basic compounds arepressed as logKoc, the effect of pH appears more evidenTable 12 shows the correlation coefficients between logKoc
and pH for some acidic and basic compound, for whichpKas are known. Two correlation coefficients are reporfor each pH range, calculated for sorbents having>0.1% and OC>0.5%, respectively. This choice is justifietaking into consideration the observations by Hassettet al.211
and by Gerstl and Mingelgrin,563 who suggested the possbility that, at low OC content in sorbent, theKoc values couldbe inflated due to the contribution of sorption by the inoganic components of the sorbent. For acidic compoundspH range of the available experimental data is chosenaccount for the particular form of the molecule: undissoated (pH,pKa22), dissociated (pH.pKa12), or partially
-bees-
n-
-e
et.g
inr
r-velata-e
s,e,
x-
edC
-heto-
dissociated in the intermediate range between these twolimits. Phenol, as an example of the unionized forms,haves like a hydrophobic compound and its logKoc values donot correlate with pH. Similarly, for the totally dissociateforms of 2,4-D and picloram, logKoc does not correlate withpH, although for 2,4-D some uncertainty may exist in tdefinition of the corresponding pH range. Also for bascompounds, except hexazinone and metribuzin, logKoc cor-relates with pH, but correlation coefficients are generalower, between 0.33 and 0.63. For all compounds, acidicbasic, the respective regression equations have been obttaking only the data concerning soil OC>0.5% and assum-ing linear behavior in the pH range taken into consideratiThese equations have negative values of the slope atlimits of the confidence intervals, at 95% probability. Asmatter of fact, it has been demonstrated that basic cpounds, like triazine herbicides, show a decrease of the stion coefficients by increasing pH.145,284This effect was ex-plained with the gradual loss of a H1 ion from the protonatedmolecule starting from pH5pKa. It is interesting to note thafrom the regression equations~Table 12! for ametryne andatrazine,Koc values at pH 4 are about three times larger that pH 8; a similar difference was observed in the same raof pH for Kd of atrazine on a soil.286 However, theKd ofametryne on a soil decreased from 28 to about 3 whenincreased from 4 to 8.256
It appears interesting to note that logKoc values ofnapropamide also correlate very well with pH at both O>0.1% and OC>0.5%. Regressing logKoc as a function ofpH, the following equation is obtained:
logKoc520.252 pH14.397
with eight data and OC>0.5% (r 520.912). A similarequation is obtained with 11 data and OC>0.1% (r520.899). More studies are necessary to ascertain ifbehavior is true.
Table 13 shows the average logKoc values with the respective 68% confidence limits between brackets for a large nuber of compounds of different nature. Two averages areported, calculated for soils or sediments having OC>0.1%and OC>0.5%, respectively. When possible, the averagfor sorbents with OC contents between 0.1% and 0.5% hbeen calculated. The results do not seem conclusive todence differences which can be connected to differentcontent, but this seems to be due to the fact that the numof data might not be enough for this purpose. However,the case of atrazine, for which the number of data availaare of several tens, the average logKoc for 0.1%<OC,0.5% is sensibly greater than the average logKoc for OC>0.5%.
From Table 13 it appears that about 40% of the logKoc
values obtained with sorbents having OC>0.1% vary within1 log unit, about 50% vary within 1 or 2 log units and threst show variations larger than 2 log units. The secondthird groups of data also include many hydrophobic copounds, perhaps because of the presence of some outlie
J. Phys. Chem. Ref. Data, Vol. 30, No. 1, 2001

412412 DELLE SITE
TABLE 11. Correlation coefficients~r! between averageKd values and four soil or sediment properties
Compound
Soil orsedim.~So,Se!
OC~numberof data!
pH ~numberof data!
CE ~numberof data!
Clay ~numberof data!
Benzene So 0.865~18!0.923~23!*
20.013 ~10! 0.011 ~9! 0.347 ~15!
Toluene So 0.905~14!0.791~16!*
20.551 ~8! 20.375 ~5! 0.134 ~10!
Ethylbenzene So 0.906~10! 20.17 ~6! 0.047 ~7! 0.278 ~9!Naphthalene So 0.451~25!
0.808~24!20.027 ~12!
Pyrene Se 0.894~28! 20.430 ~14! 0.376~12! 0.323 ~14!TeCM So 0.954~34!
0.952~37!*Se 0.951~33!
TCE So 0.824~19! 0.268 ~18!0.907~23!* 0.538 ~17!
TeCE So 0.744~16!0.984~15!
0.149 ~13!
MCBz So 0.941~9!0.968~10!*
1,2-DCBz So 0.843~36!0.962~37!*
Se 0.984~36!1,2,4-TCBz So 0.649~15!
0.867~14!1,2,3,4-TeCBz So 0.705~11!
0.931~10!20.542 ~8!
Phenol ~u! ~pH 3.2–7.4! So 0.972~12!0.538~13!*
20.293 ~10! 20.081 ~10!
2,4-DCP ~pH 2.0–7.4! So 0.934~12! 20.410 ~12!2,3,4,6-TeCP ~pH 2.0–7.5! So 0.698~11! 20.460 ~11!PCP (pH 2.0–10) So 0.589~26! 20.322 ~26! 0.023 ~16!
~pH 3.4–6.9! So 0.810~14! 20.426 ~14! 0.421 ~8!~d! ~pH 7.0–10.0! So 0.747~9! 20.343 ~9!
2,28,4,48,5,58-~153! Se 0.311~18!0.855~19!*
Aroclor-1242 So 0.772~12!Alachlor So 0.926~21! 20.467 ~13! 0.672 ~7! 0.456 ~12!Ametrine So 0.412~33!
0.982~34!*20.143 ~34! 0.634~34! 20.013 ~34!
0.971~130!* 0.197 ~33!Atrazine So 0.656~128! 20.182~122! 0.469~46! 0.194 ~108!
0.971~130!* 0.690 ~104!Se 0.512~13! 20.806 ~12! 0.525 ~12!
0.798~12!Benefin So 0.082~12! 20.358 ~12! 0.208~12! 0.033 ~12!
0.903~10!Bromacil So 0.825~18! 20.788 ~11! 0.108 ~15!
0.972~19!* 0.762 ~13!Carbaryl So 0.251~11! 0.031 ~11!
0.998~12!* 20.083 ~12!Carbofuran So 0.859~12! 20.230 ~6! 0.811~10! 20.224 ~7!
0.989~15!* 20.504 ~8! 0.823~12!Chlorbromuron So 0.647~17! 20.222 ~16!Chlorpropham So 0.933~15! 0.074 ~15! 0.137~14! 0.001 ~14!
0.995~16!* 20.045~15! 20.467 ~15!Chlortoluron So 0.666~17! 20.072 ~16!Cyanazine So 0.686~10! 20.396 ~9! 0.826 ~9!2,4-D ~pH 2.8–9.0! So 0.554~94! 20.391 ~92! 20.123~67! 20.104 ~92!
0.381~95!* 20.392 ~93! 20.029~68! 20.103 ~93!~pH 2.8–5.0! So 0.827~21! 20.484 ~21! 0.247~20! 20.203 ~21!~d! ~pH 5.1–9.0! So 0.164~71! 20.160 ~71! 0.087~46! 0.229 ~70!
0.498~72!* 20.298 ~72! 0.341~47! 0.198 ~71!p,p8-DDT So 0.835~7! 0.600 ~7!
0.998~8!*Diazinon So 0.367~28! 20.268 ~28! 0.027 ~27!
J. Phys. Chem. Ref. Data, Vol. 30, No. 1, 2001
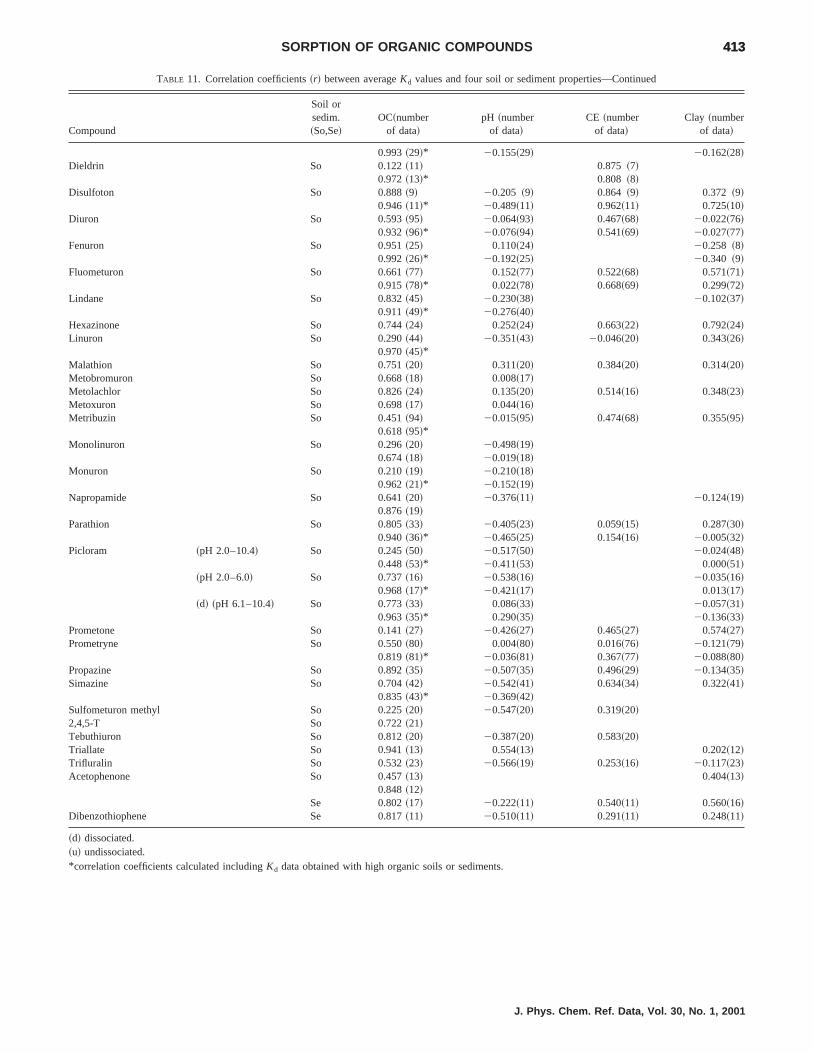
413413SORPTION OF ORGANIC COMPOUNDS
TABLE 11. Correlation coefficients~r! between averageKd values and four soil or sediment properties—Continued
Compound
Soil orsedim.~So,Se!
OC~numberof data!
pH ~numberof data!
CE ~numberof data!
Clay ~numberof data!
0.993~29!* 20.155~29! 20.162~28!Dieldrin So 0.122~11! 0.875 ~7!
0.972~13!* 0.808 ~8!Disulfoton So 0.888~9! 20.205 ~9! 0.864 ~9! 0.372 ~9!
0.946~11!* 20.489~11! 0.962~11! 0.725~10!Diuron So 0.593~95! 20.064~93! 0.467~68! 20.022~76!
0.932~96!* 20.076~94! 0.541~69! 20.027~77!Fenuron So 0.951~25! 0.110~24! 20.258 ~8!
0.992~26!* 20.192~25! 20.340 ~9!Fluometuron So 0.661~77! 0.152~77! 0.522~68! 0.571~71!
0.915~78!* 0.022~78! 0.668~69! 0.299~72!Lindane So 0.832~45! 20.230~38! 20.102~37!
0.911~49!* 20.276~40!Hexazinone So 0.744~24! 0.252~24! 0.663~22! 0.792~24!Linuron So 0.290~44! 20.351~43! 20.046~20! 0.343~26!
0.970~45!*Malathion So 0.751~20! 0.311~20! 0.384~20! 0.314~20!Metobromuron So 0.668~18! 0.008~17!Metolachlor So 0.826~24! 0.135~20! 0.514~16! 0.348~23!Metoxuron So 0.698~17! 0.044~16!Metribuzin So 0.451~94! 20.015~95! 0.474~68! 0.355~95!
0.618~95!*Monolinuron So 0.296~20! 20.498~19!
0.674~18! 20.019~18!Monuron So 0.210~19! 20.210~18!
0.962~21!* 20.152~19!Napropamide So 0.641~20! 20.376~11! 20.124~19!
0.876~19!Parathion So 0.805~33! 20.405~23! 0.059~15! 0.287~30!
0.940~36!* 20.465~25! 0.154~16! 20.005~32!Picloram ~pH 2.0–10.4! So 0.245~50! 20.517~50! 20.024~48!
0.448~53!* 20.411~53! 0.000~51!~pH 2.0–6.0! So 0.737~16! 20.538~16! 20.035~16!
0.968~17!* 20.421~17! 0.013~17!~d! ~pH 6.1–10.4! So 0.773~33! 0.086~33! 20.057~31!
0.963~35!* 0.290~35! 20.136~33!Prometone So 0.141~27! 20.426~27! 0.465~27! 0.574~27!Prometryne So 0.550~80! 0.004~80! 0.016~76! 20.121~79!
0.819~81!* 20.036~81! 0.367~77! 20.088~80!Propazine So 0.892~35! 20.507~35! 0.496~29! 20.134~35!Simazine So 0.704~42! 20.542~41! 0.634~34! 0.322~41!
0.835~43!* 20.369~42!Sulfometuron methyl So 0.225~20! 20.547~20! 0.319~20!2,4,5-T So 0.722~21!Tebuthiuron So 0.812~20! 20.387~20! 0.583~20!Triallate So 0.941~13! 0.554~13! 0.202~12!Trifluralin So 0.532~23! 20.566~19! 0.253~16! 20.117~23!Acetophenone So 0.457~13! 0.404~13!
0.848~12!Se 0.802~17! 20.222~11! 0.540~11! 0.560~16!
Dibenzothiophene Se 0.817~11! 20.510~11! 0.291~11! 0.248~11!
~d! dissociated.~u! undissociated.*correlation coefficients calculated includingKd data obtained with high organic soils or sediments.
J. Phys. Chem. Ref. Data, Vol. 30, No. 1, 2001

414414 DELLE SITE
TABLE 12. Correlation coefficients~r! between logKoc values and pH for some acidic and basic compounds
Compound pKa pH range
Soil OCcontent
~%!
Numberof datapoints r
AcidicBromacil 9.3 6.3–7.9 >0.1 11 20.695
6.3–7.8 >0.5 9 20.904log Koc520.295 pH13.737
Phenol 9.8 3.2–7.4~u! >0.1 10 0.2183.2–7.4 >0.5 9 0.302
2,3,4,6-TeCP 5.22 3.4–7.5 >0.1 10 20.9453.4–7.5 >0.5 8 20.957
log Koc520.443 pH15.575
PCP 4.74 3.4–6.9 >0.1 14 20.7473.4–6.9 >0.5 11 20.644
log Koc520.284 pH14.921
2,4-D 2.80 2.8–5.0 >0.1 21 20.4142.8–5.0 >0.5 20 20.4642.8–5.5 >0.5 35 20.533
log Koc520.260 pH13.187~pH 2.8–5.0!
5.1–9.0~d! >0.1 72 20.3105.1–9.0 >0.5 71 20.3105.5–9.0 >0.5 56 20.157
Picloram 3.4 2.0–6.0 >0.1 17 20.8282.0–6.0 >0.5 12 20.881
log Koc520.371 pH13.692
6.1–10.4~d! >0.1 35 0.1346.1–10.4 >0.5 31 20.205
Sulfometuron methyl 5.2 4.1–5.8 >0.1 20 20.0174.1–5.5 >0.5 18 20.708
log Koc520.581 pH13.497
BasicAmetryne 4.0 4.5–9.0 >0.1 34 20.533
4.5–9.0 >0.5 33 20.538log Koc520.111 pH13.198
Atrazine 1.68 3.2–8.2 >0.1 122 20.1573.2–8.15 >0.5 77 20.476
log Koc520.114 pH12.846
Hexazinone 1.09 4.0–6.4 >0.1 24 20.0654.0–6.4 >0.5 22 20.156
Metribuzin 0.99 4.3–9.0 >0.1 95 0.1084.3–9.0 >0.5 83 0.065
Prometone 4.28 4.3–7.1 >0.1 27 20.6274.3–7.1 >0.5 25 20.618
log Koc520.391 pH14.682
Prometryne 4.05 4.3–9.0 >0.1 81 20.3254.3–9.0 >0.5 78 20.328
log Koc520.138 pH13.453
Propazine 1.85 3.2–7.4 >0.1 35 20.4523.2–7.4 >0.5 34 20.556
log Koc520.133 pH12.909
Simazine 1.65 3.2–8.0 >0.1 42 20.3823.2–7.4 >0.5 39 20.497
log Koc520.188 pH13.354
Tebuthiuron 1.2 4.1–5.8 >0.1 20 20.5354.1–5.45 >0.5 18 20.584
log Koc520.366 pH13.303
~d! dissociated.~u! undissociated.
J. Phys. Chem. Ref. Data, Vol. 30, No. 1, 2001

415415SORPTION OF ORGANIC COMPOUNDS
TABLE 13. Average logKoc data as a function of sorbent type and organic carbon content
Compound
Soil orsedim.
~So, Se!OC~%!
Numberof datapoints Range
Averagelog Koc
Benzene So >0.1 23 1.90 1.64~1.24–2.04!a
So >0.5 16 0.73 1.58~1.37–1.79!So 0.1<OC,0.5 7 1.90 1.78~1.11–2.45!
Toluene So >0.1 17 1.65 1.89~1.49–2.29!So >0.5 8 0.57 2.00~1.78–2.22!So 0.1<OC,0.5 9 1.65 1.79~1.29–2.29!
m-Xylene So >0.1 5 1.23 2.06~1.58–2.54!So >0.5 3 0.26 2.33~2.20–2.46!
p-Xylene So >0.1 8 0.85 2.27~1.99–2.55!So >0.5 5 0.85 2.31~2.00–2.62!So 0.1<OC,0.5 3 0.49 2.21~1.94–2.48!
Ethylbenzene So >0.1 10 1.24 2.04~1.66–2.42!So >0.5 5 0.30 2.18~2.05–2.31!So 0.1<OC,0.5 5 1.19 1.90~1.40–2.40!
Nitrobenzene >0.1 9 1.28 2.09~1.75–2.43!So >0.5 6 0.82 2.16~1.84–2.48!So 0.1<OC,0.5 3 0.71 1.95~1.55–2.35!
Naphthalene So >0.1 25 3.20 2.91~2.31–3.51!So >0.5 16 1.95 3.02~2.52–3.52!So 0.1<OC,0.5 9 2.64 2.71~1.98–3.44!
Se >0.5 7 0.83 3.06~2.77–3.35!
Phenanthrene So >0.1 6 0.66 4.03~3.72–4.34!So >0.5 4 0.66 4.08~3.72–4.44!
Se >0.5 5 0.28 4.34~4.21–4.48!
Fluoranthene So >0.5 5 0.66 4.65~4.37–4.93!
Se >0.5 9 0.93 4.86~4.48–5.24!
Pyrene So >0.1 5 0.63 4.66~4.39–4.93!So >0.5 3 0.03 4.78~4.76–4.80!
Se >0.1 28 1.05 4.88~4.65–5.11!Se >0.5 26 1.05 4.90~4.68–5.12!
Benzo~a!pyrene Se >0.5 4 1.47 6.23~5.61–6.85!
TeCM So >0.1 37 0.51 1.80~1.71–1.89!So >0.5 33 0.51 1.80~1.70–1.90!So 0.1<OC,0.5 4 0.10 1.78~1.74–1.82!
Se >0.1 36 0.26 2.01~1.96–2.06!Se >0.5 28 0.26 2.00~1.95–2.05!Se 0.1<OC,0.5 8 0.12 2.02~1.98–2.06!
1,2-ED So >0.5 9 1.11 1.64~1.20–2.08!
1,1,1-TCA So >0.1 6 1.16 2.16~1.75–2.57!
1,1,2-TCA So >0.1 4 0.25 1.88~1.77–1.99!
TCE So >0.1 23 2.05 1.92~1.53–2.31!So >0.5 16 1.10 2.00~1.73–2.27!So 0.1<OC,0.5 7 1.79 1.75~1.20–2.30!
TeCE So >0.1 16 1.91 2.32~1.91–2.73!So >0.5 7 1.17 2.45~2.09–2.81!So 0.1<OC,0.5 9 1.36 2.22~1.78–2.66!
MCBz So >0.1 11 1.82 1.97~1.49–2.36!So >0.5 6 0.59 2.14~1.49–2.36!So 0.1<OC,0.5 5 1.74 1.77~1.12–2.42!
1,2-DCBz So >0.1 40 0.75 2.50~2.35–2.65!So >0.5 34 0.75 2.50~2.35–2.65!So 0.1<OC,0.5 6 0.09 2.47~2.43–2.51!
Se >0.1 36 0.30 2.70~2.64–2.76!Se >0.5 28 0.30 2.69~2.62–2.76!
J. Phys. Chem. Ref. Data, Vol. 30, No. 1, 2001

416416 DELLE SITE
TABLE 13. Average logKoc data as a function of sorbent type and organic carbon content—Continued
Compound
Soil orsedim.
~So, Se!OC~%!
Numberof datapoints Range
Averagelog Koc
Se 0.1<OC,0.5 8 0.10 2.71~2.67–2.75!
1,3-DCBz So >0.1 5 0.30 2.49~2.38–2.60!So >0.5 3 0.24 2.53~2.40–2.66!
1,4-DCBz So >0.1 9 0.43 2.66~2.50–2.82!So >0.5 5 0.34 2.57~2.43–2.71!So 0.1<OC,0.5 4 0.27 2.77~2.65–2.89!
1,2,3-TCBz So >0.1 9 1.22 3.48~3.08–3.88!So >0.5 7 0.77 3.37~3.11–3.63!
1,2,4-TCBz So >0.1 15 2.23 3.15~2.62–3.68!So >0.5 8 1.29 3.19~2.81–3.57!So 0.1<OC,0.5 7 2.23 3.10~2.42–3.78!
1,3,5-TCBz So >0.1 4 1.66 3.69~2.92–4.46!
1,2,3,4-TeCBz So >0.1 11 1.38 3.70~3.27–4.13!So >0.5 8 1.09 3.64~3.31–3.97!So 0.1<OC,0.5 3 1.38 3.84~3.15–4.53!
Se >0.5 4 0.34 4.14~3.98–4.30!
1,2,4,5-TeCBz So >0.1 3 1.14 3.48~2.87–4.09!
PCBz Se >0.5 6 1.04 4.91~4.46–5.36!
HCBz So >0.1 5 3.30 4.23~2.93–5.53!So >0.5 4 2.03 3.79~2.81–4.77!
Se >0.1 8 1.04 5.53~5.16–5.90!Se >0.5 7 1.04 5.48~5.11–5.85!
Phenol ~u! ~pH 3.2–7.4! So >0.1 13 1.18 1.37~0.99–1.75!So >0.5 12 1.18 1.34~0.97–1.71!
4MCP ~u! ~pH 2.0–7.4! So >0.1 7 1.00 2.15~1.79–2.51!So >05 5 0.66 2.33~1.09–2.57!
2,4-DCP ~pH 2.0–7.4! So >0.1 12 1.06 2.49~2.16–2.82!
~u! ~pH <5.8! So >0.1 9 1.06 2.57~2.21–2.93!So >0.5 5 0.50 2.77~2.57–2.97!So 0.1<OC,0.5 4 0.95 2.33~1.93–2.73!
3,4-DCP ~u! ~pH <6.0! So >0.5 4 0.20 3.03~2.93–3.13!
2,4,6-TCP ~pH .4.2! So >0.1 5 1.33 2.52~1.97–3.07!
~u! ~pH <4.2! So >0.1 3 1.02 2.86~2.33–3.39!
2,4,5-TCP ~pH 3.4–6.0! So >0.1 6 0.72 3.11~2.81–3.41!~u! ~pH <4.9! So >0.5 4 0.10 3.35~3.30–3.40!
2,3,4,6-TeCP ~pH 3.4–7.5! So >0.1 10 1.71 3.02~2.35–3.69!So >0.5 8 1.71 3.06~2.31–3.81!
~u! ~pH <3.4! So >0.5 2 0.09 3.75~3.69–3.81!
~d! ~pH >7.4! So >0.5 4 0.26 2.28~2.16–2.40!
PCP ~pH 2.0–.10! So >0.1 26 2.08 3.28~2.69–3.77!So >0.5 17 1.70 3.28~2.79–3.77!So 0.1<OC,0.5 9 2.08 3.15~2.52–3.78!
~pH 3.4–6.9! So >0.1 14 1.60 3.38~2.93–3.83!So >0.5 11 1.60 3.51~3.09–3.93!So 0.1<OC,0.5 3 0.17 2.92~2.83–3.01!
~u! ~pH <3! So >0.1 10 2.26 4.48~3.60–5.36!So >0.5 6 2.09 4.54~3.63–5.45!So 0.1<OC,0.5 4 2.26 4.38~3.41–5.35!
~d! ~pH >7.1! So >0.1 12 0.94 2.82~2.50–3.14!So >0.5 9 0.86 2.89~2.59–3.19!So 0.1<OC,0.5 3 0.74 2.63~1.89–3.37!
4-NP ~u! ~pH <5.4! So >0.1 6 0.70 2.03~1.78–2.28!
J. Phys. Chem. Ref. Data, Vol. 30, No. 1, 2001

417417SORPTION OF ORGANIC COMPOUNDS
TABLE 13. Average logKoc data as a function of sorbent type and organic carbon content—Continued
Compound
Soil orsedim.
~So, Se!OC~%!
Numberof datapoints Range
Averagelog Koc
So >0.5 5 0.36 1.94~1.79–2.09!
Biphenyl So >0.1 7 1.46 3.03~2.56–3.50!So >0.5 5 0.38 3.12~2.96–3.28!
2,28,5-~18! Se >0.5 4 0.90 4.85~4.41–5.29!
2,28,5,58-~52! So >0.1 5 2.72 5.02~4.01–6.03!So >0.5 3 1.98 4.55~3.59–5.56!
Se >0.5 5 1.02 5.58~5.17–5.99!
2,28,6,68-~54! Se >0.1 4 0.39 4.91~4.75–5.07!Se >0.5 3 0.19 4.84~4.74–4.94!
2,38,48,5-~70! Se >0.1 4 0.33 4.86~4.72–5.00!Se >0.5 3 0.17 4.80~4.70–4.90!
2,28,4,5,58-~101! Se >0.5 5 0.23 5.73~5.63–5.83!
2,28,3,38,6,68-~136! Se >0.5 5 0.85 6.04~5.73–6.35!
2,28,3,5,58,6-~151! Se >0.5 5 1.23 5.75~4.96–6.18!
2,28,4,48,5,58-~153! Se >0.1 19 1.55 5.86~5.45–6.27!Se >0.5 18 1.34 5.81~5.46–6.16!
Aroclor-1016 Se >0.1 4 0.50 5.03~4.80–5.26!Se >0.5 3 0.50 4.97~4.72–5.22!
Aroclor-1242 So >0.1 12 1.37 4.30~3.94–4.66!So >0.5 8 0.85 4.12~3.85–4.39!So 0.1<OC,0.5 4 0.57 4.64~4.37–4.91!
Se >0.1 5 1.01 4.82~4.41–5.23!Se >0.5 4 1.01 4.74~4.31–5.17!
Aroclor-1254 Se >0.5 8 0.90 6.02~5.73–6.31!
Alachlor So >0.1 21 1.09 2.22~1.97–2.47!So >0.5 18 1.09 2.22~1.96–2.48!So 0.1<OC,0.5 3 0.28 2.20~2.05–2.35!
Aldicarb So >0.5 5 0.85 1.30~0.97–1.63!Ametryne ~pH 4.5–9.0! So >0.5 33 0.90 2.52~2.27–2.77!
~pH 4.5–5.4! So >0.5 12 0.78 2.63~2.39–2.87!
~pH 5.5–6.0! So >0.5 9 0.62 2.60~2.41–2.79!
~pH >6.1! So >0.5 12 0.76 2.35~2.13–2.57!
Atrazine ~pH 3.2–8.2! So >0.1 130 2.34 2.31~1.80–2.82!So >0.5 84 1.32 2.17~1.92–2.42!So 0.1<OC,0.5 46 2.25 2.56~1.84–3.28!
~pH 3.2–5.0! So >0.5 14 0.53 2.34~2.18–2.50!
~pH 5.1–5.9! So >0.5 22 1.08 2.24~2.00–2.48!
~pH >6.0! So >0.5 41 1.05 2.06~1.83–2.29!
~pH 4.4–7.7! Se >0.5 13 1.65 2.59~2.21–2.97!
Benefin So >0.5 12 1.38 2.96~2.59–3.33!
Bromacil ~pH 6.3–7.9! So >0.1 19 1.04 1.48~1.23–1.73!So >0.5 15 0.70 1.46~1.26–1.66!So 0.1<OC,0.5 4 1.04 1.53~1.10–1.96!
~u! ~pH <7.3! So >0.1 5 0.58 1.80~1.59–2.01!So >0.5 4 0.30 1.72~1.58–1.86!
Se >0.5 4 0.13 1.43~1.38–1.48!
Carbaryl So >0.5 12 0.81 2.20~1.92–2.48!
Carbofuran So >0.1 15 0.68 1.63~1.45–1.81!So >0.5 13 0.68 1.64~1.46–1.82!
Se >0.5 3 0.88 1.55~1.07–2.03!
J. Phys. Chem. Ref. Data, Vol. 30, No. 1, 2001

418418 DELLE SITE
TABLE 13. Average logKoc data as a function of sorbent type and organic carbon content—Continued
Compound
Soil orsedim.
~So, Se!OC~%!
Numberof datapoints Range
Averagelog Koc
Chlorbromuron So >0.1 17 0.59 2.54~2.38–2.70!So >0.5 16 0.59 2.55~2.39–2.71!
Chlorpropham So >0.5 16 0.86 2.62~2.37–2.87!
Chlorpyrifos So >0.1 7 1.01 3.63~3.30–3.96!So >0.5 6 1.01 3.62~3.25–3.99!
Chlortoluron So >0.1 17 0.53 2.00~1.85–2.15!So >0.5 16 0.53 2.00~1.85–2.15!
Cyanazine ~pH 5.6–8.0! So >0.1 9 0.79 2.14~1.83–2.45!So >0.5 8 0.79 2.19~1.89–2.49!
2,4-D ~pH 2.8–9.0! So >0.1 95 2.01 1.79~1.36–2.22!So >0.5 91 2.01 1.77~1.35–2.19!
~pH 2.8–5.0! So >0.1 23 1.33 2.16~1.80–2.52!So >0.5 20 1.33 2.13~1.78–2.48!
~d! ~pH .5! So >0.1 72 1.70 1.68~1.30–2.06!So >0.5 71 1.70 1.68~1.29–2.07!
p,p8-DDT So >0.1 8 1.13 5.63~5.28–5.68!So >0.5 7 0.84 5.54~5.27–5.81!
Se >0.5 6 0.59 6.08~5.84–6.32!
Diazinon So >0.1 29 1.39 2.74~2.44–3.14!So >0.5 17 0.66 2.64~2.46–2.82!So 0.1<OC,0.5 12 1.22 2.90~2.52–3.28!
Dieldrin So >0.1 13 1.13 4.08~3.79–4.37!So >0.5 11 1.13 4.06~3.76–4.36!
Disulfoton So >0.5 11 0.66 2.92~2.74–3.10!
Diuron So >0.1 96 1.86 2.44~2.12–2.76!So >0.5 89 1.86 2.43~2.10–2.76!So 0.1<OC,0.5 7 0.49 2.57~2.38–2.76!
Se >0.5 3 0.52 2.78~2.51–3.05!
EPTC So >0.1 7 0.54 2.03~1.86–2.20!So >0.5 6 0.45 2.00~1.83–2.17!
Fensulfothion So >0.1 6 0.74 2.40~2.14–2.66!So >0.5 5 0.74 2.37~2.09–2.65!
Fenuron So >0.1 26 0.52 1.42~1.27–1.57!So >0.5 25 0.52 1.41~1.26–1.56!
Fluometuron So >0.1 78 2.24 2.17~1.84–2.50!So >0.5 68 2.24 2.18~1.85–2.51!So 0.1<OC,0.5 10 0.96 2.12~1.77–2.47!
Lindane So >0.1 49 1.89 3.02~2.70–3.34!So >0.5 40 1.57 3.00~2.72–3.28!So 0.1<OC,0.5 9 1.63 3.08~2.60–3.56!
Se >0.5 4 1.13 3.49~2.95–4.03!
Hexazinone So >0.1 24 0.74 1.18~0.97–1.39!So >0.5 22 0.74 1.16~0.95–1.37!
Linuron So >0.1 45 1.78 2.65~2.29–3.01!So >0.5 43 1.38 2.64~2.33–2.95!
Se >0.5 12 0.38 2.78~2.65–2.91!
Malathion So >0.1 20 0.91 3.08~2.80–3.36!So >0.5 19 0.91 3.06~2.77–3.35!
Methylparathion So >0.1 8 0.59 2.82~2.58–3.06!So >0.5 6 0.53 2.74~2.52–2.96!
Metobromuron So >0.1 18 0.64 2.00~1.85–2.15!So >0.5 17 0.64 2.00~1.85–2.15!
J. Phys. Chem. Ref. Data, Vol. 30, No. 1, 2001
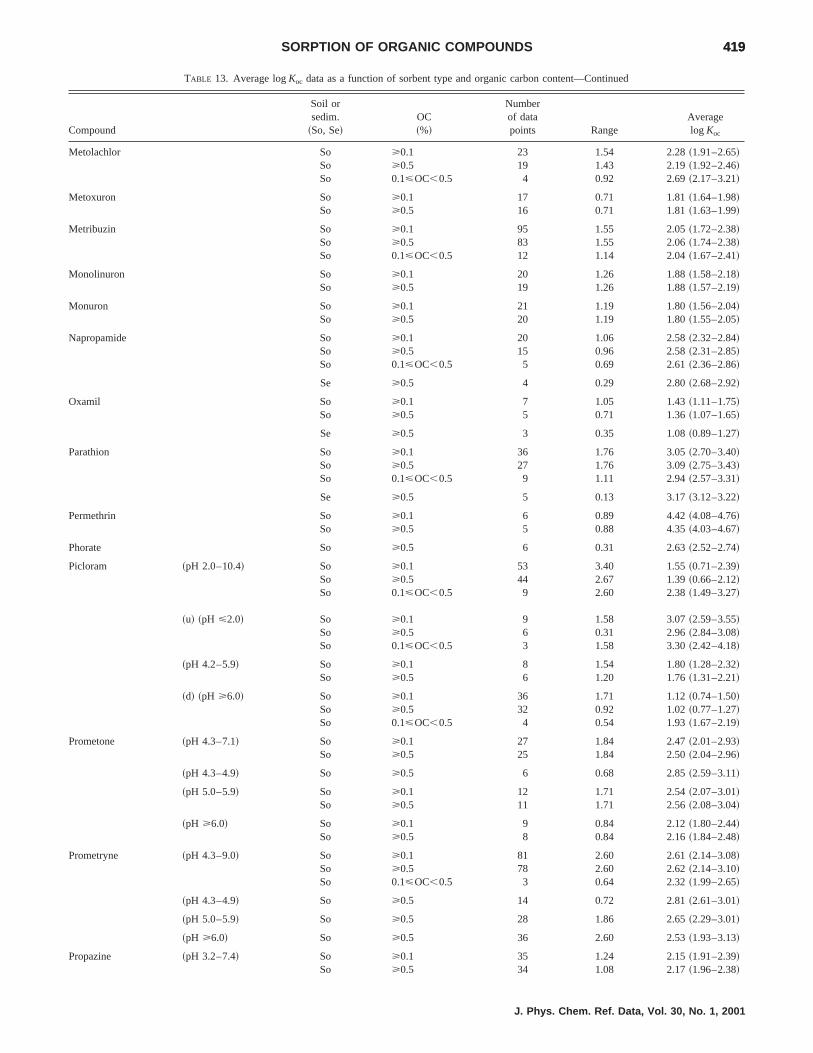
419419SORPTION OF ORGANIC COMPOUNDS
TABLE 13. Average logKoc data as a function of sorbent type and organic carbon content—Continued
Compound
Soil orsedim.
~So, Se!OC~%!
Numberof datapoints Range
Averagelog Koc
Metolachlor So >0.1 23 1.54 2.28~1.91–2.65!So >0.5 19 1.43 2.19~1.92–2.46!So 0.1<OC,0.5 4 0.92 2.69~2.17–3.21!
Metoxuron So >0.1 17 0.71 1.81~1.64–1.98!So >0.5 16 0.71 1.81~1.63–1.99!
Metribuzin So >0.1 95 1.55 2.05~1.72–2.38!So >0.5 83 1.55 2.06~1.74–2.38!So 0.1<OC,0.5 12 1.14 2.04~1.67–2.41!
Monolinuron So >0.1 20 1.26 1.88~1.58–2.18!So >0.5 19 1.26 1.88~1.57–2.19!
Monuron So >0.1 21 1.19 1.80~1.56–2.04!So >0.5 20 1.19 1.80~1.55–2.05!
Napropamide So >0.1 20 1.06 2.58~2.32–2.84!So >0.5 15 0.96 2.58~2.31–2.85!So 0.1<OC,0.5 5 0.69 2.61~2.36–2.86!
Se >0.5 4 0.29 2.80~2.68–2.92!
Oxamil So >0.1 7 1.05 1.43~1.11–1.75!So >0.5 5 0.71 1.36~1.07–1.65!
Se >0.5 3 0.35 1.08~0.89–1.27!
Parathion So >0.1 36 1.76 3.05~2.70–3.40!So >0.5 27 1.76 3.09~2.75–3.43!So 0.1<OC,0.5 9 1.11 2.94~2.57–3.31!
Se >0.5 5 0.13 3.17~3.12–3.22!
Permethrin So >0.1 6 0.89 4.42~4.08–4.76!So >0.5 5 0.88 4.35~4.03–4.67!
Phorate So >0.5 6 0.31 2.63~2.52–2.74!
Picloram ~pH 2.0–10.4! So >0.1 53 3.40 1.55~0.71–2.39!So >0.5 44 2.67 1.39~0.66–2.12!So 0.1<OC,0.5 9 2.60 2.38~1.49–3.27!
~u! ~pH <2.0! So >0.1 9 1.58 3.07~2.59–3.55!So >0.5 6 0.31 2.96~2.84–3.08!So 0.1<OC,0.5 3 1.58 3.30~2.42–4.18!
~pH 4.2–5.9! So >0.1 8 1.54 1.80~1.28–2.32!So >0.5 6 1.20 1.76~1.31–2.21!
~d! ~pH >6.0! So >0.1 36 1.71 1.12~0.74–1.50!So >0.5 32 0.92 1.02~0.77–1.27!So 0.1<OC,0.5 4 0.54 1.93~1.67–2.19!
Prometone ~pH 4.3–7.1! So >0.1 27 1.84 2.47~2.01–2.93!So >0.5 25 1.84 2.50~2.04–2.96!
~pH 4.3–4.9! So >0.5 6 0.68 2.85~2.59–3.11!
~pH 5.0–5.9! So >0.1 12 1.71 2.54~2.07–3.01!So >0.5 11 1.71 2.56~2.08–3.04!
~pH >6.0! So >0.1 9 0.84 2.12~1.80–2.44!So >0.5 8 0.84 2.16~1.84–2.48!
Prometryne ~pH 4.3–9.0! So >0.1 81 2.60 2.61~2.14–3.08!So >0.5 78 2.60 2.62~2.14–3.10!So 0.1<OC,0.5 3 0.64 2.32~1.99–2.65!
~pH 4.3–4.9! So >0.5 14 0.72 2.81~2.61–3.01!
~pH 5.0–5.9! So >0.5 28 1.86 2.65~2.29–3.01!
~pH >6.0! So >0.5 36 2.60 2.53~1.93–3.13!
Propazine ~pH 3.2–7.4! So >0.1 35 1.24 2.15~1.91–2.39!So >0.5 34 1.08 2.17~1.96–2.38!
J. Phys. Chem. Ref. Data, Vol. 30, No. 1, 2001

420420 DELLE SITE
TABLE 13. Average logKoc data as a function of sorbent type and organic carbon content—Continued
Compound
Soil orsedim.
~So, Se!OC~%!
Numberof datapoints Range
Averagelog Koc
~pH 3.2–5.0! So >0.5 9 0.64 2.29~2.09–2.49!
~pH 5.1–5.9! So >0.5 14 0.59 2.21~2.02–2.38!
~pH >6.0! So >0.5 11 0.62 2.03~1.85–2.21!
Simazine ~pH 3.2–8.0! So >0.1 43 1.46 2.29~1.96–2.62!So >0.5 39 1.46 2.29~1.96–2.62!So 0.1<OC,0.5 4 0.75 2.29~1.96–2.62!
~pH 3.2–5.0! So >0.5 10 0.65 2.50~2.32–2.68!
~pH 5.1–5.9! So >0.5 15 1.39 2.34~2.01–2.67!
~pH >6.0! So >0.5 14 0.85 2.10~1.78–2.42!
Sulfometuron m. ~pH 4.1–5.8! So >0.1 20 1.44 0.73~0.38–1.08!So >0.5 18 1.02 0.65~0.37–0.93!
2,4,5-T So >0.5 21 1.25 1.99~1.63–2.35!
Tebuthiuron ~pH 4.1–5.8! So >0.1 20 0.82 1.51~1.31–1.71!So >0.5 18 0.82 1.51~1.30–1.70!
Terbacil So >0.5 4 0.47 1.58~1.38–1.78!
Terbufos So >0.5 8 0.59 2.78~2.55–3.01!
Terbutryn So >0.5 5 1.18 3.79~3.28–4.30!
Triallate So >0.1 13 2.02 2.70~1.74–3.66!So >0.5 12 2.02 2.64~1.67–3.61!
Trifluralin So >0.1 23 2.11 3.53~2.76–4.39!So >0.5 20 2.11 3.45~2.68–4.22!So 0.1<OC,0.5 4 1.53 3.96~3.25–4.67!
Se >0.5 5 0.28 4.42~4.30–4.54!
Acetophenone So >0.1 13 1.07 1.61~1.25–1.97!So >0.5 8 0.83 1.50~1.23–1.77!So 0.1<OC,0.5 5 0.97 1.80~1.36–2.24!
Se >0.1 17 0.60 1.56~1.40–1.72!Se >0.5 16 0.60 1.55~1.39–1.71!
Anthraquinone So >0.5 5 0.80 3.72~3.36–4.08!
Dibenzothiophene So >0.1 3 0.29 3.87~3.72–4.02!
Se >0.1 11 0.48 4.02~3.87–4.17!Se >0.5 10 0.41 4.04~3.90–4.18!
a68% confidence limits between brackets.~u! undissociated.~d! dissociated.
J. Phys. Chem. Ref. Data, Vol. 30, No. 1, 2001
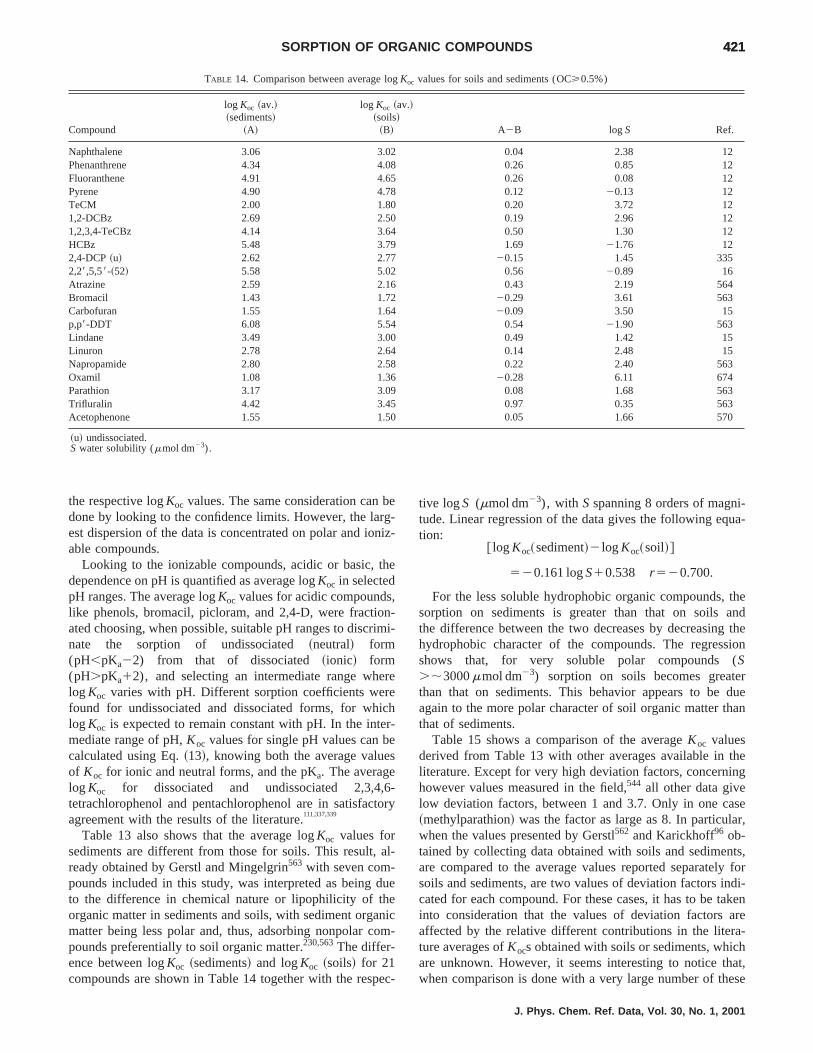
421421SORPTION OF ORGANIC COMPOUNDS
TABLE 14. Comparison between average logKoc values for soils and sediments (OC>0.5%)
Compound
log Koc ~av.!~sediments!
~A!
log Koc ~av.!~soils!
~B! A2B log S Ref.
Naphthalene 3.06 3.02 0.04 2.38 12Phenanthrene 4.34 4.08 0.26 0.85 12Fluoranthene 4.91 4.65 0.26 0.08 12Pyrene 4.90 4.78 0.12 20.13 12TeCM 2.00 1.80 0.20 3.72 121,2-DCBz 2.69 2.50 0.19 2.96 121,2,3,4-TeCBz 4.14 3.64 0.50 1.30 12HCBz 5.48 3.79 1.69 21.76 122,4-DCP~u! 2.62 2.77 20.15 1.45 3352,28,5,58-~52! 5.58 5.02 0.56 20.89 16Atrazine 2.59 2.16 0.43 2.19 564Bromacil 1.43 1.72 20.29 3.61 563Carbofuran 1.55 1.64 20.09 3.50 15p,p8-DDT 6.08 5.54 0.54 21.90 563Lindane 3.49 3.00 0.49 1.42 15Linuron 2.78 2.64 0.14 2.48 15Napropamide 2.80 2.58 0.22 2.40 563Oxamil 1.08 1.36 20.28 6.11 674Parathion 3.17 3.09 0.08 1.68 563Trifluralin 4.42 3.45 0.97 0.35 563Acetophenone 1.55 1.50 0.05 1.66 570
~u! undissociated.S water solubility (mmol dm23).
brgn
th
,nim
ereicres
,6to
a
duen
om
e
-ua-
theand
theion
(erdue
han
theng
ser,
nts,y fordi-
akenarea-hat,
ese
the respective logKoc values. The same consideration candone by looking to the confidence limits. However, the laest dispersion of the data is concentrated on polar and ioable compounds.
Looking to the ionizable compounds, acidic or basic,dependence on pH is quantified as average logKoc in selectedpH ranges. The average logKoc values for acidic compoundslike phenols, bromacil, picloram, and 2,4-D, were fractioated choosing, when possible, suitable pH ranges to discrnate the sorption of undissociated~neutral! form(pH,pKa22) from that of dissociated~ionic! form(pH.pKa12), and selecting an intermediate range whlogKoc varies with pH. Different sorption coefficients werfound for undissociated and dissociated forms, for whlogKoc is expected to remain constant with pH. In the intemediate range of pH,Koc values for single pH values can bcalculated using Eq.~13!, knowing both the average valueof Koc for ionic and neutral forms, and the pKa. The averagelogKoc for dissociated and undissociated 2,3,4tetrachlorophenol and pentachlorophenol are in satisfacagreement with the results of the literature.111,337,339
Table 13 also shows that the average logKoc values forsediments are different from those for soils. This result,ready obtained by Gerstl and Mingelgrin563 with seven com-pounds included in this study, was interpreted as beingto the difference in chemical nature or lipophilicity of thorganic matter in sediments and soils, with sediment orgamatter being less polar and, thus, adsorbing nonpolar cpounds preferentially to soil organic matter.230,563The differ-ence between logKoc ~sediments! and logKoc ~soils! for 21compounds are shown in Table 14 together with the resp
e-iz-
e
-i-
e
h-
-ry
l-
e
ic-
c-
tive logS (mmol dm23), with Sspanning 8 orders of magnitude. Linear regression of the data gives the following eqtion:
@ logKoc~sediment!2 logKoc~soil!#
520.161 logS10.538 r 520.700.
For the less soluble hydrophobic organic compounds,sorption on sediments is greater than that on soilsthe difference between the two decreases by decreasinghydrophobic character of the compounds. The regressshows that, for very soluble polar compoundsS.;3000mmol dm23) sorption on soils becomes greatthan that on sediments. This behavior appears to beagain to the more polar character of soil organic matter tthat of sediments.
Table 15 shows a comparison of the averageKoc valuesderived from Table 13 with other averages available inliterature. Except for very high deviation factors, concernihowever values measured in the field,544 all other data givelow deviation factors, between 1 and 3.7. Only in one ca~methylparathion! was the factor as large as 8. In particulawhen the values presented by Gerstl562 and Karickhoff96 ob-tained by collecting data obtained with soils and sedimeare compared to the average values reported separatelsoils and sediments, are two values of deviation factors incated for each compound. For these cases, it has to be tinto consideration that the values of deviation factorsaffected by the relative different contributions in the literture averages ofKocs obtained with soils or sediments, whicare unknown. However, it seems interesting to notice thwhen comparison is done with a very large number of th
J. Phys. Chem. Ref. Data, Vol. 30, No. 1, 2001
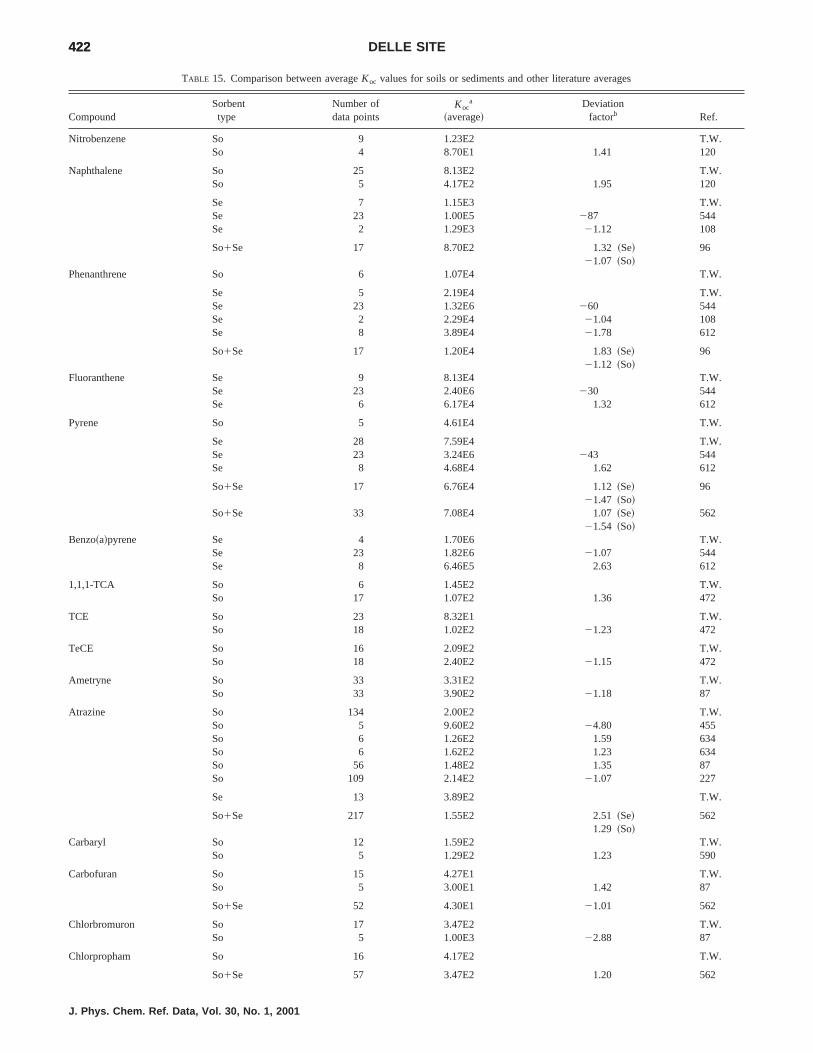
422422 DELLE SITE
TABLE 15. Comparison between averageKoc values for soils or sediments and other literature averages
CompoundSorbenttype
Number ofdata points
Koca
~average!Deviation
factorb Ref.
Nitrobenzene So 9 1.23E2 T.W.So 4 8.70E1 1.41 120
Naphthalene So 25 8.13E2 T.W.So 5 4.17E2 1.95 120
Se 7 1.15E3 T.W.Se 23 1.00E5 287 544Se 2 1.29E3 21.12 108
So1Se 17 8.70E2 1.32~Se! 9621.07 ~So!
Phenanthrene So 6 1.07E4 T.W.
Se 5 2.19E4 T.W.Se 23 1.32E6 260 544Se 2 2.29E4 21.04 108Se 8 3.89E4 21.78 612
So1Se 17 1.20E4 1.83~Se! 9621.12 ~So!
Fluoranthene Se 9 8.13E4 T.W.Se 23 2.40E6 230 544Se 6 6.17E4 1.32 612
Pyrene So 5 4.61E4 T.W.
Se 28 7.59E4 T.W.Se 23 3.24E6 243 544Se 8 4.68E4 1.62 612
So1Se 17 6.76E4 1.12~Se! 9621.47 ~So!
So1Se 33 7.08E4 1.07~Se! 56221.54 ~So!
Benzo~a!pyrene Se 4 1.70E6 T.W.Se 23 1.82E6 21.07 544Se 8 6.46E5 2.63 612
1,1,1-TCA So 6 1.45E2 T.W.So 17 1.07E2 1.36 472
TCE So 23 8.32E1 T.W.So 18 1.02E2 21.23 472
TeCE So 16 2.09E2 T.W.So 18 2.40E2 21.15 472
Ametryne So 33 3.31E2 T.W.So 33 3.90E2 21.18 87
Atrazine So 134 2.00E2 T.W.So 5 9.60E2 24.80 455So 6 1.26E2 1.59 634So 6 1.62E2 1.23 634So 56 1.48E2 1.35 87So 109 2.14E2 21.07 227
Se 13 3.89E2 T.W.
So1Se 217 1.55E2 2.51~Se! 5621.29 ~So!
Carbaryl So 12 1.59E2 T.W.So 5 1.29E2 1.23 590
Carbofuran So 15 4.27E1 T.W.So 5 3.00E1 1.42 87
So1Se 52 4.30E1 21.01 562
Chlorbromuron So 17 3.47E2 T.W.So 5 1.00E3 22.88 87
Chlorpropham So 16 4.17E2 T.W.
So1Se 57 3.47E2 1.20 562
J. Phys. Chem. Ref. Data, Vol. 30, No. 1, 2001
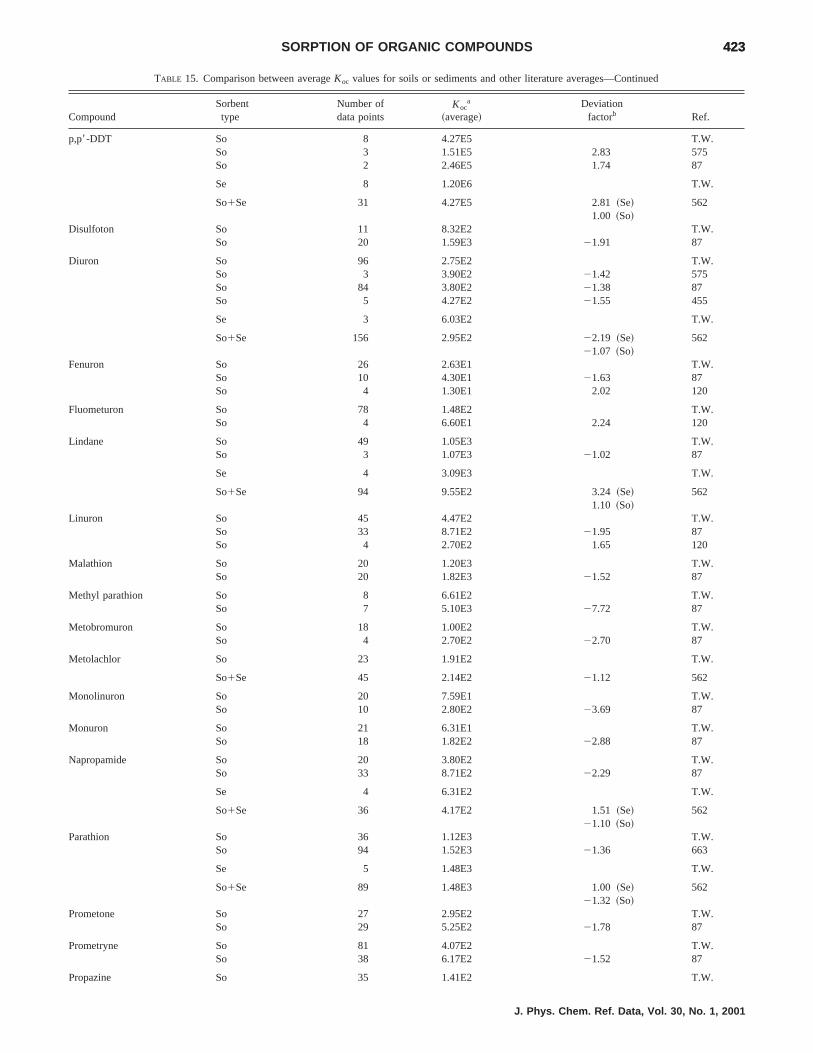
423423SORPTION OF ORGANIC COMPOUNDS
TABLE 15. Comparison between averageKoc values for soils or sediments and other literature averages—Continued
CompoundSorbenttype
Number ofdata points
Koca
~average!Deviation
factorb Ref.
p,p8-DDT So 8 4.27E5 T.W.So 3 1.51E5 2.83 575So 2 2.46E5 1.74 87
Se 8 1.20E6 T.W.
So1Se 31 4.27E5 2.81~Se! 5621.00 ~So!
Disulfoton So 11 8.32E2 T.W.So 20 1.59E3 21.91 87
Diuron So 96 2.75E2 T.W.So 3 3.90E2 21.42 575So 84 3.80E2 21.38 87So 5 4.27E2 21.55 455
Se 3 6.03E2 T.W.
So1Se 156 2.95E2 22.19 ~Se! 56221.07 ~So!
Fenuron So 26 2.63E1 T.W.So 10 4.30E1 21.63 87So 4 1.30E1 2.02 120
Fluometuron So 78 1.48E2 T.W.So 4 6.60E1 2.24 120
Lindane So 49 1.05E3 T.W.So 3 1.07E3 21.02 87
Se 4 3.09E3 T.W.
So1Se 94 9.55E2 3.24~Se! 5621.10 ~So!
Linuron So 45 4.47E2 T.W.So 33 8.71E2 21.95 87So 4 2.70E2 1.65 120
Malathion So 20 1.20E3 T.W.So 20 1.82E3 21.52 87
Methyl parathion So 8 6.61E2 T.W.So 7 5.10E3 27.72 87
Metobromuron So 18 1.00E2 T.W.So 4 2.70E2 22.70 87
Metolachlor So 23 1.91E2 T.W.
So1Se 45 2.14E2 21.12 562
Monolinuron So 20 7.59E1 T.W.So 10 2.80E2 23.69 87
Monuron So 21 6.31E1 T.W.So 18 1.82E2 22.88 87
Napropamide So 20 3.80E2 T.W.So 33 8.71E2 22.29 87
Se 4 6.31E2 T.W.
So1Se 36 4.17E2 1.51~Se! 56221.10 ~So!
Parathion So 36 1.12E3 T.W.So 94 1.52E3 21.36 663
Se 5 1.48E3 T.W.
So1Se 89 1.48E3 1.00~Se! 56221.32 ~So!
Prometone So 27 2.95E2 T.W.So 29 5.25E2 21.78 87
Prometryne So 81 4.07E2 T.W.So 38 6.17E2 21.52 87
Propazine So 35 1.41E2 T.W.
J. Phys. Chem. Ref. Data, Vol. 30, No. 1, 2001

424424 DELLE SITE
TABLE 15. Comparison between averageKoc values for soils or sediments and other literature averages—Continued
CompoundSorbenttype
Number ofdata points
Koca
~average!Deviation
factorb Ref.
So 36 1.55E2 21.10 87
Simazine So 43 1.95E2 T.W.So 147 1.38E2 1.41 87
Terbacil So 4 3.80E1 T.W.So 4 4.10E1 21.08 87
Trifluralin So 24 3.39E3 T.W.
Se 5 2.63E4 T.W.
So1Se 22 8.90E3 2.95~Se! 56222.63~So!
Acetophenone So 14 4.07E1 T.W.
Se 17 3.63E1 T.W.
So1Se 30 3.70E1 21.02~Se! 5621.10~So!
aAverageKoc values are taken as the antilog of the average logKoc values~Tables 1–9 and Table 13!.bDeviation factor is calculated as the ratio of the averageKoc values for soils~So! or sediments~Se! derived from Table 13 to averageKoc values derived fromother pools of data~Tables 1–9!. When this ratio is less than 1 the negative reciprocal is reported.
T.W. This work.
J. Phys. Chem. Ref. Data, Vol. 30, No. 1, 2001
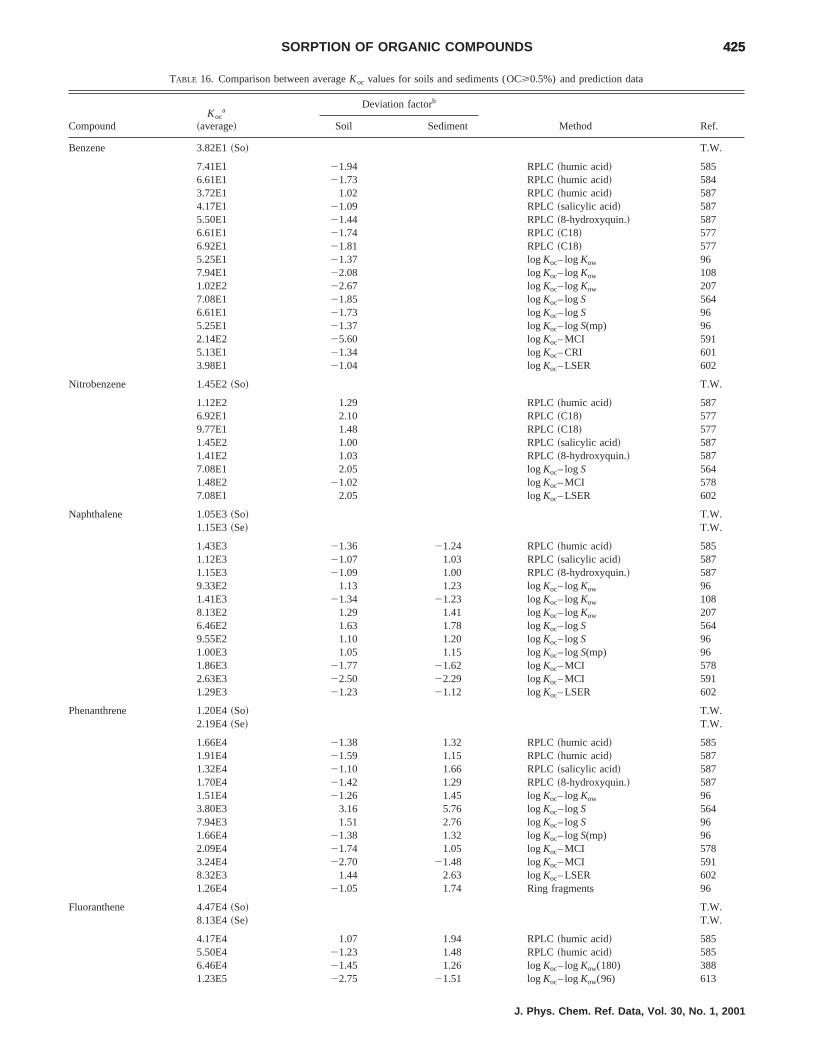
425425SORPTION OF ORGANIC COMPOUNDS
TABLE 16. Comparison between averageKoc values for soils and sediments (OC>0.5%) and prediction data
CompoundKoc
a
~average!
Deviation factorb
Method Ref.Soil Sediment
Benzene 3.82E1~So! T.W.
7.41E1 21.94 RPLC~humic acid! 5856.61E1 21.73 RPLC~humic acid! 5843.72E1 1.02 RPLC~humic acid! 5874.17E1 21.09 RPLC~salicylic acid! 5875.50E1 21.44 RPLC~8-hydroxyquin.! 5876.61E1 21.74 RPLC~C18! 5776.92E1 21.81 RPLC~C18! 5775.25E1 21.37 logKoc– logKow 967.94E1 22.08 logKoc– logKow 1081.02E2 22.67 logKoc– logKow 2077.08E1 21.85 logKoc– logS 5646.61E1 21.73 logKoc– logS 965.25E1 21.37 logKoc– logS(mp) 962.14E2 25.60 logKoc– MCI 5915.13E1 21.34 logKoc– CRI 6013.98E1 21.04 logKoc– LSER 602
Nitrobenzene 1.45E2~So! T.W.
1.12E2 1.29 RPLC~humic acid! 5876.92E1 2.10 RPLC~C18! 5779.77E1 1.48 RPLC~C18! 5771.45E2 1.00 RPLC~salicylic acid! 5871.41E2 1.03 RPLC~8-hydroxyquin.! 5877.08E1 2.05 logKoc– logS 5641.48E2 21.02 logKoc– MCI 5787.08E1 2.05 logKoc– LSER 602
Naphthalene 1.05E3~So! T.W.1.15E3~Se! T.W.
1.43E3 21.36 21.24 RPLC~humic acid! 5851.12E3 21.07 1.03 RPLC~salicylic acid! 5871.15E3 21.09 1.00 RPLC~8-hydroxyquin.! 5879.33E2 1.13 1.23 logKoc– logKow 961.41E3 21.34 21.23 logKoc– logKow 1088.13E2 1.29 1.41 logKoc– logKow 2076.46E2 1.63 1.78 logKoc– logS 5649.55E2 1.10 1.20 logKoc– logS 961.00E3 1.05 1.15 logKoc– logS(mp) 961.86E3 21.77 21.62 logKoc– MCI 5782.63E3 22.50 22.29 logKoc– MCI 5911.29E3 21.23 21.12 logKoc– LSER 602
Phenanthrene 1.20E4~So! T.W.2.19E4~Se! T.W.
1.66E4 21.38 1.32 RPLC~humic acid! 5851.91E4 21.59 1.15 RPLC~humic acid! 5871.32E4 21.10 1.66 RPLC~salicylic acid! 5871.70E4 21.42 1.29 RPLC~8-hydroxyquin.! 5871.51E4 21.26 1.45 logKoc– logKow 963.80E3 3.16 5.76 logKoc– logS 5647.94E3 1.51 2.76 logKoc– logS 961.66E4 21.38 1.32 logKoc– logS(mp) 962.09E4 21.74 1.05 logKoc– MCI 5783.24E4 22.70 21.48 logKoc– MCI 5918.32E3 1.44 2.63 logKoc– LSER 6021.26E4 21.05 1.74 Ring fragments 96
Fluoranthene 4.47E4~So! T.W.8.13E4~Se! T.W.
4.17E4 1.07 1.94 RPLC~humic acid! 5855.50E4 21.23 1.48 RPLC~humic acid! 5856.46E4 21.45 1.26 logKoc– logKow(180) 3881.23E5 22.75 21.51 logKoc– logKow(96) 613
J. Phys. Chem. Ref. Data, Vol. 30, No. 1, 2001

426426 DELLE SITE
TABLE 16. Comparison between averageKoc values for soils and sediments (OC>0.5%) and prediction data—Continued
CompoundKoc
a
~average!
Deviation factorb
Method Ref.Soil Sediment
5.37E4 21.20 1.51 logKoc– logS(180) 3887.08E4 21.58 1.15 logKoc– MCI 598
Pyrene 6.03E4~So! T.W.7.94E4~Se! T.W.
5.89E4 1.02 1.35 RPLC~humic acid! 5856.61E4 21.10 1.20 RPLC~humic acid! 5856.31E4 21.05 1.26 RPLC~humic acid! 5876.46E4 21.07 1.23 RPLC~salicylic acid! 5875.25E4 1.15 1.51 RPLC~8-hydroxyquin.! 5876.17E4 21.02 1.29 logKoc– logKow 969.33E4 21.55 21.18 logKoc– logKow 1081.66E4 3.63 4.78 logKoc– logKow 2071.29E4 4.67 6.16 logKoc– logS 5643.24E4 1.86 2.45 logKoc– logS 964.37E4 1.38 1.82 logKoc– logS(mp) 966.92E4 21.15 1.15 logKoc– MCI 5781.12E5 21.86 21.41 logKoc– MCI 5913.16E4 1.91 2.51 logKoc– LSER 602
1,1,1-TCA (OC>0.1) 1.45E2~So! T.W.
1.29E2 1.12 RPLC~cyanopropyl! 5791.20E2 1.21 logKoc– logKow 961.05E2 1.38 logKoc– logS 961.10E2 1.32 logKoc– logS(mp) 965.01E1 2.89 logKoc– MCI 5786.17E1 2.35 logKoc– MCI 5911.20E2 1.21 logKoc– LSER 602
TCE 1.00E2~So! T.W.
1.29E2 21.29 RPLC~cyanopropyl! 5791.38E2 21.38 logKoc– logKow(207) 1931.23E2 21.23 logKoc– logKow(108) 1934.57E1 2.19 logKoc– logS(180) 1936.92E1 1.45 logKoc– MCI 5785.01E1 2.00 logKoc– MCI 597
TeCE 2.82E2~So! T.W.
2.46E2 1.15 logKoc– logKow 1081.38E2 2.04 logKoc– logKow 966.03E2 22.14 logKoc– logKow 2171.91E2 1.48 logKoc– logKow(180) 883.16E2 21.12 logKoc– logKow(87) 881.82E2 1.55 logKoc– logKow(120) 882.75E2 1.03 logKoc– logKow(130) 886.46E2 22.29 logKoc– logKow(55) 882.29E2 1.23 logKoc– logKow 2072.40E2 1.18 logKoc– logS 5642.24E2 1.26 logKoc– logS 963.72E2 21.32 logKoc– logS 963.47E2 21.23 logKoc– logS(mp) 967.76E2 22.75 logKoc– logS(mp) 961.38E2 2.04 logKoc– MCI 5913.31E2 21.17 logKoc– LSER 602
Phenol~u! 2.91E1~So! T.W.
2.24E1 21.02 RPLC~cyanopropyl! 5792.63E1 21.20 RPLC~humic acid! 5871.00E1 2.19 RPLC~salycilic acid! 5871.74E1 1.26 RPLC~8-hydroxyqin.! 5873.89E1 21.78 RPLC~C18! 5774.68E1 22.14 RPLC~C18! 5771.48E2 26.76 logKoc– logKow 6187.24E0 3.02 logKoc– logS(180) 335
J. Phys. Chem. Ref. Data, Vol. 30, No. 1, 2001

427427SORPTION OF ORGANIC COMPOUNDS
TABLE 16. Comparison between averageKoc values for soils and sediments (OC>0.5%) and prediction data—Continued
CompoundKoc
a
~average!
Deviation factorb
Method Ref.Soil Sediment
8.91E0 2.46 logKoc– logS 5647.24E1 23.31 logKoc– MCI 5782.69E2 212.3 logKoc– MCI 5987.08E1 23.23 logKoc– CRI 6013.16E1 21.44 logKoc– LSER 602
4-MCP ~u! 2.14E2 ~So! T.W.
1.70E1 12.6 logKoc– logS(180) 3352.24E2 21.05 logKoc– CRI 601
2,4-DCP~u! 5.89E2 ~So! T.W.
2.95E2 2.00 RPLC~C18! 5773.39E2 1.74 RPLC~C18! 5775.75E1 10.2 logKoc– logS(180) 3351.95E2 3.02 logKoc– MCI 5785.75E2 1.02 logKoc– MCI 5977.76E2 21.32 logKoc– CRI 601
3,4-DCP~u! 1.07E3 ~So! T.W.
7.24E2 1.48 logKoc– MCI 5987.59E2 1.41 logKoc– CRI 601
2,4,6-TCP~u! 7.24E2 ~So! T.W.
3.16E2 2.29 logKoc– MCI 5789.77E2 21.35 logKoc– MCI 5972.46E3 23.40 logKoc– CRI 601
2,4,5-TCP~u! 2.24E3 ~So! T.W.
1.02E2 22.0 logKoc– logS(180) 3359.77E2 2.29 logKoc– MCI 5972.34E3 21.04 logKoc– CRI 601
2,3,4,6-TeCP~u! 5.62E3 ~So! T.W.
7.94E3 21.41 logKoc– logKow 1115.25E2 10.7 logKoc– MCI 5782.09E3 2.69 logKoc– MCI 5971.62E4 22.88 logKoc– logKow(108) 5975.89E3 21.05 logKoc– logKow(217) 5978.72E2 6.44 logKoc– logKow(120) 5971.29E4 22.30 logKoc– logKow(180) 5971.59E3 3.53 logKoc– logKow(55) 5976.76E3 21.20 logKoc– CRI 601
PCP~u! 3.47E4 ~So! T.W.
1.10E4 3.15 RPLC~cyanopropyl! 5792.51E4 1.38 logKoc– logKow 1111.00E3 34.7 logKoc– logS 5648.91E2 38.9 logKoc– MCI 5782.88E3 12.0 logKoc– MCI 597
1.86E4 1.87 logKoc– CRI 601
4-NP ~u! 8.71E1 ~So! T.W.
1.51E2 21.73 RPLC~cyanopropyl! 5791.45E2 21.66 RPLC~C18! 5771.18E2 21.35 RPLC~C18! 5772.34E1 3.72 logKoc– logS(180) 3353.09E2 23.35 logKoc– MCI 598
Atrazine 1.45E2~So! T.W.3.89E2~Se! T.W.
8.71E1 1.66 4.47 logKoc– logKow 962.63E2 21.81 1.48 logKoc– logKow 961.91E3 213.2 24.91 logKoc– logKow(87) 5281.59E3 211.0 24.09 logKoc– logKow(217) 5281.51E3 210.4 23.83 logKoc– logS(180) 528
J. Phys. Chem. Ref. Data, Vol. 30, No. 1, 2001

428428 DELLE SITE
TABLE 16. Comparison between averageKoc values for soils and sediments (OC>0.5%) and prediction data—Continued
CompoundKoc
a
~average!
Deviation factorb
Method Ref.Soil Sediment
6.46E2 24.46 21.66 logKoc– logS 5641.29E3 28.90 23.32 logKoc– logS 962.04E2 21.41 1.91 logKoc– logS(mp) 962.19E2 21.51 1.78 logKoc– MCI 578
Bromacil 2.88E1~So! T.W.2.69E1~Se! T.W.
4.27E1 21.48 21.59 logKoc– logKow 961.35E3 246.9 250.2 logKoc– logS 5642.14E2 27.43 27.96 logKoc– logS 962.19E1 1.32 1.23 logKoc– logS(mp) 963.63E2 212.6 213.5 logKoc– MCI 578
Carbaryl 1.59E2~So! T.W.
2.00E2 21.26 RPLC~cyanopropyl! 5793.72E2 22.34 RPLC~C18! 5732.63E2 21.65 logKoc– logKow 965.75E2 23.62 logKoc– logS 5641.10E3 26.92 logKoc– logS 963.16E2 21.99 logKoc– logS(mp) 961.70E2 21.07 logKoc– MCI 578
Carbofuran 4.37E1~So! T.W.
1.29E2 22.95 RPLC~C18! 5734.79E1 21.10 logKoc– logKow 961.59E2 23.64 logKoc– logS 5642.88E1 1.52 logKoc– logS 963.24E1 1.35 logKoc– logS(mp) 96
Chlorpropham 4.17E2~So! T.W.
4.68E2 21.12 logKoc– logKow 963.72E2 1.12 logKoc– logS 5647.08E2 21.70 logKoc– logS 966.31E2 21.51 logKoc– logS 961.48E3 23.55 logKoc– logS(mp) 961.20E3 22.88 logKoc– logS(mp) 96
p,p8-DDT 3.47E5~So! T.W.1.20E6~Se! T.W.
6.31E5 21.82 1.90 logKoc– logKow 968.91E4 3.89 13.5 logKoc– logKow 2079.55E5 22.75 1.26 logKoc– logKow 1081.45E5 2.39 8.28 logKoc– logS 5644.17E5 21.20 2.88 logKoc– logS 966.46E6 218.6 25.38 logKoc– logS(mp) 962.19E5 1.58 5.48 logKoc– MCI 5783.72E5 21.07 3.23 logKoc– MCI 591
Diuron 2.69E2~So! T.W.
3.02E2 21.12 RPLC~C18! 5733.80E1 7.08 logKoc– logKow 962.63E2 1.02 logKoc– logKow 965.62E2 22.09 logKoc– logS 5641.15E3 24.28 logKoc– logS 962.57E2 1.05 logKoc– logS(mp) 96
Fenuron 2.57E1~So! T.W.
4.07E0 6.31 logKoc– logKow 964.68E1 21.82 logKoc– logS 5646.31E1 22.46 logKoc– logS 967.24E1 22.82 logKoc– logS 965.25E0 4.90 logKoc– logS(mp) 966.92E0 3.71 logKoc– logS(mp) 96
Lindane 1.00E3~So! T.W.
J. Phys. Chem. Ref. Data, Vol. 30, No. 1, 2001

429429SORPTION OF ORGANIC COMPOUNDS
TABLE 16. Comparison between averageKoc values for soils and sediments (OC>0.5%) and prediction data—Continued
CompoundKoc
a
~average!
Deviation factorb
Method Ref.Soil Sediment
3.09E3~Se! T.W.
2.14E3 22.14 1.44 logKoc– logKow 963.16E3 23.16 21.02 logKoc– logKow(96) 491.23E4 212.3 23.98 logKoc– logS 5643.72E3 23.72 21.20 logKoc– logS 963.98E3 23.98 21.29 logKoc– logS(mp) 963.47E3 23.47 21.12 logKoc– MCI 5784.79E3 24.79 21.55 logKoc– MCI 591
Linuron 4.37E2~So! T.W.6.03E2~Se! T.W.
4.68E2 21.07 1.29 RPLC~cyanopropyl! 5816.31E1 6.93 9.56 logKoc– logKow 964.07E2 1.07 1.48 logKoc– logS 5648.51E2 21.95 21.41 logKoc– logS 966.31E2 21.44 21.05 logKoc– logS(mp) 96
Malathion 1.15E3~So! T.W.
3.16E2 3.64 logKoc– logKow 962.82E2 4.08 logKoc– logS 5646.76E2 1.70 logKoc– logS 961.95E3 21.70 logKoc– logS(mp) 96
Metolachlor 1.55E2~So! T.W.
1.41E2 1.10 logKoc– logS 5642.88E2 21.86 logKoc– MCI 598
Napropamide 3.80E2~So! T.W.6.31E2~Se! T.W.4.07E2 21.07 1.55 logKoc– logS 564
Parathion 1.23E3~So! T.W.1.48E3~Se! T.W.
2.63E3 22.14 21.78 logKoc– logKow 961.70E3 21.38 21.15 logKoc– logKow 2073.98E3 23.24 22.69 logKoc– logKow 1087.59E2 1.62 1.95 logKoc– logS 5641.78E3 21.45 21.20 logKoc– logS 968.91E3 27.24 26.02 logKoc– logS(mp) 96
Prometone 3.16E2~So! T.W.
2.00E2 1.58 logKoc– logKow(87) 5284.90E2 21.55 logKoc– logKow(217) 5282.63E2 1.20 logKoc– logS(180) 5281.10E2 2.87 logKoc– logS 5641.59E2 1.99 logKoc– MCI 598
Prometryne 4.17E2~So! T.W.
5.25E2 21.26 logKoc– logS 564
Propazine 1.48E2~So! T.W.
3.55E2 22.40 logKoc– logKow 961.29E3 28.72 logKoc– logS 5642.95E3 219.9 logKoc– logS 963.09E2 22.09 logKoc– logS(mp) 96
Simazine 1.95E2~So! T.W.
5.89E1 3.31 logKoc– logKow 962.19E3 211.2 logKoc– logS 5644.57E3 223.4 logKoc– logS 963.39E2 21.74 logKoc– logS(mp) 96
Terbacil 3.80E1~So! T.W.
3.16E1 1.20 logKoc– logKow 961.20E2 23.16 logKoc– logS 564
J. Phys. Chem. Ref. Data, Vol. 30, No. 1, 2001

m
430430 DELLE SITE
TABLE 16. Comparison between averageKoc values for soils and sediments (OC>0.5%) and prediction data—Continued
CompoundKoc
a
~average!
Deviation factorb
Method Ref.Soil Sediment
2.09E2 25.50 logKoc– logS 961.12E1 3.39 logKoc– logS(mp) 96
Trifluralin 2.82E3~So! T.W.2.63E4~Se! T.W.
1.35E5 247.9 25.13 RPLC~cyanopropyl! 5799.55E3 23.39 2.75 RPLC~C18! 5735.75E3 22.04 4.57 logKoc– logS 564
Acetophenone 3.16E1~So! T.W.3.55E1~Se!
1.59E1 1.99 2.23 logKoc– logKow 964.27E1 21.35 21.20 logKoc– logKow 2072.63E1 1.20 1.35 logKoc– logKow 1084.37E1 21.38 1.23 logKoc– logS 962.51E1 1.26 1.41 logKoc– logS(mp) 96
aAverageKoc values are taken as the antilog of the average logKoc values~Tables 1–9 and Table 13!.bDeviation factor is calculated as the ratio of the averageKoc values for soils~So! or sediments~Se! derived from Table 13 to predicted values derived froTables 1–9. When this ratio is less than 1 the negative reciprocal is reported.
T.W. This work.
J. Phys. Chem. Ref. Data, Vol. 30, No. 1, 2001

edth
h-es
iouec
e
ict
hinge
ein-cb
idre
nnr5ac
nd
ay
atthserenrequm
le
o-
o-
-
431431SORPTION OF ORGANIC COMPOUNDS
literature data, a maximum factor of about 3 is obtainwhich is indicative of a satisfactory accuracy at least fornonionizable compounds listed in Table 15.
13.3. Comments on Prediction Methods
Finally, to evaluate the reliability of the prediction metods the estimatedKoc data were compared with the averagderived in Table 13 for soils and sediments. The resultsTable 16 show that for hydrophobic compounds deviatfactors are mostly within a value of 2 in the absolute valwhile for polar and ionizable compounds factors often reavalues higher than 1 order of magnitude. In particular:
~i! RPLC with C18 and other types of stationary phasgives estimates~47 values! of Koc with deviation fac-tors equal to or lower than 5 with both hydrophoband polar compounds. One exception seems to bevalue of248 found for trifluralin with cyanopropyl asstationary phase;
~ii ! About one half of the 61 data concerningKoc–Kow
relationships give deviation factors within 2, whicregard especially nonpolar compounds. The remaing data give factors within 13.5, with only 3 beingreater than 10. This second group of data concphenols, triazines, and other pesticides;
~iii ! Koc–S relationships~87 data! give the worst resultswith factors .5 and .10 for 28% and 14% of thedata, respectively. The greatest values are conctrated on phenols, triazines, and bromacil. Introducthe correction for the melting point, generally an improvement is obtained: in 22 cases only five give fators lower than expected. However, as pointed outGerstl,562 the crystal energy term was derived for rigmolecules and therefore it may not give the samesult for all compounds;
~iv! Finally, 26 of the total 54 data concerning predictioof Koc based on correlations with parameters conected to molecular structure give deviation factowithin 2, while 20 data give factors between 2 andand the rest between 5 and about 40, with only 6 d.10. These concern especially phenols and broma
In conclusion, predictions of sorption coefficients for nopolar compounds are generally satisfactory with all methowhile Koc predicted for polar or ionizable compounds mshow large differences from average experimentalKoc val-ues. For these compounds, predictions may be complicdue to the great uncertainty of the log–log plots usingexperimental values ofKoc to calibrate the systems. Thiuncertainty may depend on possible contribution of sevsorption mechanisms for compounds belonging to differclasses. Therefore, for these compounds, a specific cortion equation for each class may be better than a single etion for the total data base, as suggested by soauthors.120,561,562
,e
inn,h
s
he
-
rn
n-g
-y
-
-s,tail.
-s,
ede
altla-a-e
14. Acknowledgment
The author wishes to thank Dr. L. Monte for valuabcomments.
15. NomenclatureAG adsorption to glass container wallsBDHA benzyldimethylhexadecylammonium ionBE batch equilibrationBU batch equilibration and ultrafiltrationCE cation exchange capacity@m equivalent~100
g!21 or cmol kg21#CRI characteristic root indexDDPA dodecyldimethyl~2-phenoxyethyl!ammonium
ionDDTMA dodecyltrimethylammonium ionDF diffusionDHS dissolved humic substancesDOC dissolved organic carbonDOM dissolved organic matterDTMA decyltrimethylammonium ion~Ref. 93!DTMA dodecyltrimethylammonium ion~Ref. 93!DTMDA decyltrimethyldiammonium ionED equilibrium dialysisFE flow equilibrationFH Flory–Huggins modelFM field measurementf c volume fraction of cosolventf oc fraction of sorbent organic carbonf om fraction of sorbent organic matterFQ fluorescence quenchingDG Gibbs energy~J mol21!GP gas purgeH Henry’s Law constantDH enthalpy~J mol21!DH f enthalpy of fusion~J mol21!HDTMA hexadecyltrimethylammonium ionHS head spaceHT humic acid titrationHTMA hexadecyltrimethylammonium ion~Ref. 93!k8 chromatographic capacity factorKa acid dissociation constantKd linear sorption coefficient~cm3 g21 or dm3
kg21!Kdoc dissolved organic carbon–water partition c
efficient ~cm3 g21!Kdom dissolved organic matter–water partition c
efficient ~cm3 g21!K f Frendlich sorption coefficient
(mg121/n cm3/n g21)Koc organic carbon-normalized partition coeffi
cient ~cm3 g21 of organic carbon!Kow octanol/water partition coefficientKsg solid–gas sorption coefficient~cm3 g21!LE leaching equilibrationLSER linear solvation energy relationship
J. Phys. Chem. Ref. Data, Vol. 30, No. 1, 2001

a
id
o
lu
rp
ide
F
25
emon,
ety
als
o-
v.
on.
iron.
c,
ter
l.
ue,
s
eds
roc.
.
432432 DELLE SITE
LSC limiting sorption capacitym ionic strengthMCI molecular connectivity indexMD miscible displacementmp melting point~K or °C!1/n Freundlich exponentNTMA nonyltrimethylammonium ionOC soil or sediment organic carbon~%!OM soil or sediment organic matter~%!R gas constant~8.314510 J mol21 K21!RPLC reversed-phase high pressure liquid chrom
tographyRS reversed-phase separation by C18 columnRt retardation factorr t chromatographic retention timeDS entropy~J mol21 K21!DSf entropy of fusion~J mol21 K21!S water solubility~g m23 or mol m23!SA surface area~m2 g21!; method not specifiedSA~CO2! surface area measured by carbon diox
sorptionSA~E! surface area measured by ethylene glycol m
noethyl ether~EGME! sorptionSA~M! surface area measured by methylene b
sorptionS~mp! water solubility for subcooled liquidsSA~N2! surface area measured by nitrogen~BET!
sorptionSA~W! surface area measured by water vapor so
tionSE solubility enhancementSoil texture:c claycl clay loaml loamls loamy sands sandsc sandy clayscl sandy clay loamsl sandy loamsi siltsic silty claysicl silty clay loamsil silt loamT temperature~K!Tm melting point~K!TOC total organic carbonTTMA tetradecyltrimethylammonium ion
16. References
1Environmental Protection Agency, Guidelines for Registering Pesticin United States, Federal Register 40~123!, 26802–26928~1975!.
2OECD Chemical Testing Program-Expert Group Physical Chemistry.nal Report, Berlin~December 1979!.
3M. F. Kovacs, Jr., Residue Review85, 4 ~1983!.4P. J. Mc Call, R. L. Swann, and D. A. Laskowski, inFate of Chemicals
J. Phys. Chem. Ref. Data, Vol. 30, No. 1, 2001
-
e
-
e
-
s
i-
in the Environment, edited by R. L. Swann and A. Eschenroeder, N. 2~ACS, Washington, D.C., 1983!.
5Environmental Protection Agency, Exposure Analysis Modeling Syst~EXAMS!: User Manual and System Documentation, EPA PublicatiEPA-600-3-82-023~1981!.
6K. Yoshida, T. Shigeoka, and F. Yamauchi, Ecotoxicol. Environ. Saf7, 179 ~1983!.
7D. Mackay, Environ. Sci. Technol.13, 1218~1979!.8D. Mackay and S. Paterson, Environ. Sci. Technol.15, 1006~1981!.9D. Mackay and S. Paterson, Environ. Sci. Technol.16, 654A ~1982!.
10P. Y. Lu and R. Metcalf, Environ. Health Perspect.10, 269 ~1975!.11W. J. Lyman, W. F. Reehl, and D. H. Rosenblatt, editors,Handbook of
Chemical Property Estimation Methods~McGraw-Hill, New York,1982!.
12D. Mackay and W. Y. Shiu, J. Phys. Chem. Ref. Data10, 1175~1981!.13D. Mackay, W. Y. Shiu, and K. C. Ma,Illustrated Handbook of Physical-
Chemical Properties and Environmental Fate of Organic Chemic~Lewis, Boca Raton, 1992!.
14R.-M. Dannenfelser, M. Paric, M. White, and S. H. Yalkowsky, Chemsphere23, 141 ~1991!.
15L. R. Suntio, W. Y. Shiu, D. Mackay, J. N. Seiber, and D. Glotfelty, ReEnviron. Contam. Toxicol.103, 1 ~1988!.
16W. Y. Shiu and D. Mackay, J. Phys. Chem. Ref. Data15, 911 ~1986!.17A. Delle Site, J. Phys Chem. Ref. Data26, 157 ~1997!.18C. A. Edwards, Soils Fertilizers27, 451 ~1964!.19T. J. Sheets, J. Agric. Food Chem.12, 30 ~1964!.20D. F. Goerlitz, D. E. Troutman, E. M. Godsy, and B. J. Franks, Envir
Sci. Technol.19, 955 ~1985!.21J. F. Mc Carthy and J. M. Zachara, Environ. Sci. Technol.23, 496
~1989!.22R. P. Schwarzenbach, W. Giger, E. Hoehn, and J. K. Schneider, Env
Sci Technol.17, 472 ~1983!.23L. B. Barber, II, E. M. Thurman, M. P. Schroeder, and D. R. Le Blan
Environ. Sci. Technol.22, 205 ~1988!.24D. Mackay, D. L. Freyberg, P. V. Roberts, and J. A. Cherry, Wa
Resour. Res.22, 2017~1986!.25G. W. Page, Environ. Sci. Technol.15, 1475~1981!.26S. M. Lambert, P. E. Porter, and H. Schieferstein, Weeds13, 185~1965!.27R. P. Upchurch and W. C. Pierce, Weeds6, 24 ~1958!.28W. J. Weber, P. M. Mc Ginley, and L. E. Katz, Water Res.25, 499
~1991!.29W. A. Jury, D. Russo, G. Streile, and H. Elabd, Water Resour. Res.26,
13 ~1990!.30R. Haque, D. W. Schmedding, and V. H. Freed, Environ. Sci. Techno8,
139 ~1974!.31W. F. Spencer and M. M. Cliath, Environ. Sci. Technol.3, 670 ~1969!.32W. F. Spencer, T. D. Shoup, M. M. Cliath, W. J. Farmer, and R. Haq
J. Agric. Food Chem.27, 273 ~1979!.33A. E. Smith, Weed Res.10, 331 ~1970!.34R. G. Thomas, inHandbook of Chemical Property Estimation Method,
edited by W. J. Lyman, W. F. Reehl, and D. H. Rosenblatt~McGraw-Hill, New York, 1982!, Chap. 15.
35G. W. Bailey and J. L. White, J. Agric. Food Chem.12, 324 ~1964!.36C. R. Harris, J. Econ. Entomol.59, 1221~1966!.37P. J. Doherty and G. F. Warren, Weed Res.9, 20 ~1969!.38C. I. Harris and T. J. Sheets, Weeds13, 215 ~1965!.39R. P. Upchurch and D. D. Mason, Weeds10, 9 ~1962!.40R. P. Upchurch, Weeds6, 161 ~1958!.41R. P. Upchurch, F. L. Selman, D. D. Mason, and E. J. Kamprath, We
14, 42 ~1966!.42J. B. Weber and C. J. Peter, Weed Sci.30, 14 ~1982!.43E. M. Watkin and G. R. Sagar, Weed Res.11, 1 ~1971!.44E. M. Watkin and G. R. Sagar, Weed Res.11, 247 ~1971!.45R. G. Burns and L. J. Audus, Weed Res.10, 49 ~1970!.46L. A. Gaston, M. A. Locke, and R. M. Zablotowicz, J. Environ. Qual.25,
120 ~1996!.47J. G. Konrad, G. Chesters, and D. E. Armstrong, Soil Sci. Soc. Am. P
33, 259 ~1969!.48F. J. Stevenson, J. Environ. Qual.1, 333 ~1972!.49B. G. Oliver and M. N. Charlton, Environ. Sci. Technol.18, 903 ~1984!.50J. E. Baker, P. D. Capel, and S. J. Elsenreich, Environ. Sci. Technol20,
1136 ~1986!.
m
no
D
-n
-
51
rts
2
r.
t
Soc.
78-
s
Sci.
l.
ci.
ol.
t,
h
J.,
il Sci.
433433SORPTION OF ORGANIC COMPOUNDS
51H. B. Pionke and G. Chesters, J. Environ. Qual.2, 29 ~1973!.52S. W. Karickhoff, J. Hydraul. Eng.110, 707 ~1984!.53J. A. Smith, P. J. Witkowski, and C. T. Chiou, Rev. Environ. Conta
Toxicol. 103, 127 ~1988!.54W. J. Weber, P. M. Mc Ginley, and L. E. Katz, Environ. Sci. Technol.26,
1955 ~1992!.55C. T. Chiou, P. E. Porter, and D. W. Schmedding, Environ. Sci. Tech
17, 227 ~1983!.56OECD-Guidelines for Testing of Chemicals, TG-106, revised version
~OECD, Paris, 1983!.57B. Von Oepen, W. Ko¨rdel, and W. Klein, Chemosphere18, 1495~1989!.58P. G. J. De Maagd, T. L. Sinnige, S. M. Schrap. A. Opperhuizen, and
T. H. M. Sijm, Environ. Toxicol. Chem.17, 1899~1998!.59C. A. Black, editor, Methods of Soil Analysis, No. 9 in the Series
Agronomy ~ASA, Madison, WI, 1965!.60A. Klute, editor,Methods of Soil Analysis, Agron. Monogr. 9~ASA and
SSSA, Madison, WI, 1986!.61A. L. Page, R. H. Miller, and D. R. Keeny, editors,Methods of Soil
Analysis, Argon. Monogr. 9~ASA and SSSA, Madison, WI, 1988!.62G. Kuhnt and H. Muntau, editors,EURO-SOILS: Identification, Collec
tion, Treatment, Characterization~JRC Ispra, European CommissioSpecial Pub. No. 1.94.60, 1994!.
63B. Gawlik, N. Sotiriou, G. Kuhnt, W. Karcher, A. Kettrup, and H. Muntau, Fresenius Environ. Bull.5, 610 ~1996!.
64European Directive 79/831/EEC, Annex V. Official Journal No L2~19th September 1984!, and No L133~30th May 1988!.
65W. P. Ball, C. H. Buehler, T. C. Harmon, D. Mackay, and P. V. RobeJ. Contam. Hydrol.5, 253 ~1990!.
66S. Brunauer, P. H. Emmett, and E. Teller, J. Am. Chem. Soc.60, 309~1938!.
67G. L. Gaines, Jr. and P. Cannon, J. Phys. Chem.62, 997 ~1960!.68J. Thomas, Jr. and R. R. Frost, Illinois Acad. Sci. Trans.64, 248 ~1971!.69D. L. Carter, M. D. Heilman, and C. L. Gonzales, Soil Sci.100, 356
~1965!.70C. A. Bower and F. B. Gschwend, Soil Sci. Soc. Am. Proc.16, 342
~1952!.71Z. Ekler, Pestic. Sci.22, 145 ~1988!.72J. Kozak and J. B. Weber, Weed Sci.31, 368 ~1983!.73K. S. La Fleur, Soil Sci.121, 212 ~1976!.74L. E. Allison, in Methods of Soil Analysis, edited by A. Black, No 9 in the
Series of Agronomy, Part 2~ASA, Madison, WI, 1965!, pp. 1367–1378.75D. W. Nelson and L. E. Sommers, inMethods of Soil Analysis, edited by
A. L. Page, R. H. Miller, and D. R. Keeny, Agron. Monogr. 9, Part~ASA and SSSA, Madison, WI, 1988!, pp. 539–577.
76R. M. Gershey, M. D. Mackinnon, P. J. Williams, and R. M. Moore, MaChem.7, 289 ~1979!.
77J. I. Hedges and J. H. Stern, Limnol. Oceanogr.29, 657 ~1984!.78S. A. Waksman and L. J. Hutchings, Soil Sci.40, 347 ~1953!.79C. H. Giles, D. Smith, and A. Huitson, J. Colloid Interface Sci.47, 755
~1974!.80C. H. Giles, D. Smith, and A. Huitson, J. Colloid Interface Sci.47, 766
~1974!.81T. C. Voice and W. J. Weber, Jr., Water Res.17, 1433~1983!.82I. Langmuir, J. Am. Chem. Soc.40, 1361~1918!.83J. W. Gibbs, I. Trans. Conn. Acad.3, 108 ~1876!.84J. W. Gibbs, I. Trans. Conn. Acad.3, 343 ~1876!.85H. Freundlich,Colloid and Capillary Chemistry~Methuen & Co. Ltd.,
London, 1926!, pp. 110–114.86D. J. O’Connor and J. P. Connolly, Water Res.14, 1517~1980!.87P. S. C. Rao and J. M. Davidson, inEnvironmental Impact of Nonpoin
Source Pollution, edited by M. R. Overcash and J. M. Davidson~AnnArbor Sci., Inc., Ann Arbor, MI, 1980!, pp. 23–67.
88W. P. Ball and P. V. Roberts, Environ. Sci. Technol.25, 1223~1991!.89S. W. Karickhoff and D. S. Brown, J. Environ. Qual.7, 246 ~1979!.90B. A. G. Knight and T. E. Tomlinson, J. Soil Sci.18, 233 ~1967!.91C. T. Miller and W. J. Weber, J. Contam. Hydrol1, 243 ~1986!.92J. A. Smith and P. R. Jaffe´, Environ. Sci. Technol.25, 2054~1991!.93J. A. Smith, P. R. Jaffe´, and C. T. Chiou, Environ. Sci. Technol.24, 1167
~1990!.94Z. Wang, D. S. Gamble, and C. H. Langford, Environ. Sci. Technol.26,
560 ~1992!.95R. W. Walters and R. G. Luthy, Environ. Sci. Technol.18, 395 ~1984!.
.
l.
.
,
96S. W. Karickhoff, Chemosphere10, 833 ~1981!.97J. J. Hassett, W. L. Banwart, S. G. Wood, and J. C. Means, Soil Sci.
Am. J. 45, 38 ~1981!.98J. Farrell and M. Reinhard, Environ. Sci. Technol.28, 53 ~1994!.99R. Haque and W. R. Coshow, Environ. Sci. Technol.5, 139 ~1971!.
100P. J. Isaacson and C. R. Frink, Environ. Sci. Technol.18, 43 ~1984!.101J. L. Young and G. Spycher, Soil Sci. Soc. Am. J.43, 324 ~1979!.102P. S. C. Rao and J. M. Davidson, Water Res.13, 375 ~1979!.103R. D. Wauchope and W. C. Koskinen, Weed Sci.31, 504 ~1983!.104J. M. Davidson, L. T. Ou, and P. S. C. Rao, EPA Rep. EPA-600/9-
016, 1978, pp. 233–244.105W. J. Lyman, inHandbook of Chemical Property Estimation Method,
edited by W. J. Lyman, W. F. Reehl, and D. N. Rosenblatt~McGraw-Hill, New York, 1982!, Chap. 4, pp. 4.1–4.33.
106P. Lafrance, L. Marineau, L. Perreault, and J. P. Villeneuve, Environ.Technol.28, 2314~1994!.
107D. R. Burris, C. P. Antworth, and T. B. Stauffer, Environ. ToxicoChem.10, 433 ~1991!.
108S. W. Karickhoff, D. S. Brown, and T. A. Scott, Water Res.13, 241~1979!.
109R. W. Walters, S. A. Ostazeski, and A. Guiseppi-Elie, Environ. STechnol.23, 480 ~1989!.
110W. P. Ball and P. V. Roberts, Environ. Sci. Technol.25, 1237~1991!.111P. Lagas, Chemosphere17, 205 ~1988!.112P. V. Roberts, M. N. Goltz, and D. Mackay, Water Resour. Res.22, 2047
~1986!.113D. F. Young and W. P. Ball, Environ. Progress13, 9 ~1994!.114K. S. La Fleur, Soil Sci.127, 94 ~1979!.115P. L. Mc Carty, M. Reinhard, and B. E. Rittmann, Environ. Sci. Techn
15, 40 ~1981!.116S. M. Lambert, J. Agric. Food Chem.15, 572 ~1967!.117K. E. Savage, Weed Sci.24, 525 ~1976!.118K. E. Savage and R. D. Wauchope, Weed Sci.22, 106 ~1974!.119R. S. Adams and P. Li, Soil Sci. Soc. Am. Proc.35, 78 ~1971!.120G. G. Briggs, J. Agric. Food Chem.29, 1050~1981!.121R. D. Carringer, J. B. Weber, and T. J. Monaco, J. Agric. Food Chem.23,
568 ~1975!.122A. Felsot and P. A. Dahm, J. Agric. Food Chem.27, 557 ~1979!.123J. W. Hamaker and J. M. Thompson, inOrganic Chemicals in the Soil
Environment, edited by C. M. Goring and J. W. Hamaker~Marcel Dek-ker, New York, 1972!, Vol. 1, pp. 49–143.
124M. Hermann, in EURO-SOILS: Identification, Collection, TreatmenCharacterization, edited by G. Kuhnt and H. Muntau~European Com-mission, JRC Ispra, 1994!, Spec. Publ. No. 1.94.60.
125S. U. Khan, Can. J. Soil Sci.53, 429 ~1973!.126M. S. Sharom and K. R. Solomon, J. Agric. Food Chem.29, 1122~1981!.127R. A. Swanson and G. R. Dutt, Soil Sci. Soc. Am. Proc.37, 872 ~1973!.128P. D. Vowles and R. F. C. Mantoura, Chemosphere16, 109 ~1987!.129P. A. Wahid and N. Sethunathan, J. Agric. Food Chem.26, 101 ~1978!.130D. S. Brown and E. W. Flagg, J. Environ. Qual.10, 382 ~1981!.131H. Lo”kke, Ecotoxicol. Environ. Safety8, 395 ~1984!.132R. T. Podoll. K. C. Irwin, and H. J. Parish, Chemosphere18, 2399
~1989!.133S. M. Schrap and A. Opperhuizen, inOrganic Micropollutants in the
Aquatic Environment, edited by G. Angeletti and A. Biorseth, Proc. 5tEuropean Symp., 20–22 October 1987~Kluwer, Dordrecht, 1988!.
134J. T. Coates and A. W. Elzerman, J. Contam. Hydrol1, 191 ~1986!.135P. J. Mc Call and G. L. Agin, Environ. Toxicol. Chem.4, 37 ~1985!.136B. G. Oliver, Chemosphere14, 1087~1985!.137R. E. White, J. S. Dyson, Z. Gerstl, and B. Yaron, Soil Sci. Soc. Am.
50, 277 ~1986!.138B. Yaron, A. R. Swoboda, and G. W. Thomas, J. Agric. Food Chem.15,
671 ~1967!.139B. Yaron and S. Saltzman, Soil Sci. Soc. Am. Proc.36, 583 ~1972!.140G. Dios Cancela, E. Romero Taboada, and F. Sanchez-Rasero, So
150, 836 ~1990!.141N. Senesi and C. Testini, Soil Sci.130, 314 ~1980!.142D. R. Narine and R. D. Gui, Soil Sci.133, 356 ~1982!.143R. S. Kookana, L. A. G. Aylmore, and R. G. Gerritse, Soil Sci.154, 214
~1992!.144R. J. Hance, Weed Res.7, 29 ~1967!.145R. E. Talbert and O. H. Fletchall, Weeds13, 46 ~1965!.
J. Phys. Chem. Ref. Data, Vol. 30, No. 1, 2001
c
try
fet
ino
in
.
no
him
A
Sc
l.
no
ol.
ils,
Soil
ept.
l.
.
. C.ia,
es,
d
i.
re
-
434434 DELLE SITE
146R. Haque, F. T. Lindstrom, V. H. Freed, and R. Sexton, Environ. STechnol.2, 207 ~1968!.
147J. A. Leenheer and J. L. Ahlrichs, Soil Sci. Soc. Am. Proc.35, 700~1971!.
148M. Th. van Genuchten and P. J. Wierenga, Soil Sci. Soc. Am. J.40, 473~1976!.
149L. A. Gaston and M. A. Locke, J. Environ. Qual.24, 29 ~1995!.150J. C. Huang and C. S. Liao, J. Saint. Eng. Dev. ASCE96, 1057~1970!.151S. W. Karickhoff, inContaminants and Sediments: Analysis, Chemis
and Biology, edited by R. A. Baker~Ann Arbor Science, Ann Arbor, MI,1980!, Vol. 2, pp. 193–205.
152B. R. Larsen, M. Loekke, and L. Rasmussen, Oikos44, 423 ~1985!.153A. B. Paya-Perez, M. Riaz, and B. R. Larsen, Ecotoxicol. Environ. Sa
21, 1 ~1991!.154J. J. Pignatello, inReactions and Movement of Organic Chemicals
Soils, edited by B. L. Sawhney and K. Brown, SSSA Special Publ. N22 ~Soil Science Society of America, Madison, VI, 1989!, pp. 45–80.
155S. Wu and P. M. Gschwend, Environ. Sci. Technol.20, 717 ~1986!.156S. W. Karickhoff and K. R. Morris, Environ. Toxicol. Chem.4, 469
~1985!.157W. P. Ball and P. V. Roberts, inOrganic Substances and Sediments
Water: Vol. 2, Processes and Analytical, edited by R. A. Baker~Lewis,Chelsea, MI, 1991!, Chap. 13, pp. 273–310.
158S. A. Clay and W. C. Koskinen, Weed Sci.38, 74 ~1990!.159M. A. Locke, J. Environ. Qual.21, 558 ~1992!.160N. Senesi, G. Brunetti, P. La Cava, and T. M. Miano, Soil Sci.157, 176
~1994!.161S. K. Xue and H. M. Selim, J. Environ. Qual.24, 896 ~1995!.162R. Calvet, inInteraction between Herbicides in the Soil, edited by R. J.
Hance~Academic, London, 1980!, pp. 1–30.163B. Von Oepen, W. Ko¨rdel, and W. Klein, Chemosphere22, 285 ~1991!.164W. C. Koskinen, Weed Sci.32, 273 ~1984!.165D. M. Mackay, W. P. Ball, and M. G. Durant, J. Contam. Hydrol.1, 119
~1986!.166M. L. Brusseau, T. Larsen, and T. H. Christensen, Water Resour. Res27,
1137 ~1991!.167W. F. Bradley, J. Am. Chem. Soc.67, 975 ~1945!.168R. W. Hoffmann and G. W. Brindley, Geochim. Cosmochim. Acta20, 15
~1960!.169G. W. Brindley, R. Bender, and S. Ray, Geochim. Cosmochim. Acta27,
1129 ~1963!.170R. D. Rogers, J. C. Mc Farlane, and A. J. Cross, Environ. Sci. Tech
14, 457 ~1980!.171Y. Li and G. Gupta, Chemosphere28, 627 ~1994!.172G. W. Bailey and J. L. White, Residue Rev.32, 29 ~1970!.173R. H. Pierce, C. E. Olney, and G. T. Felbeck, Jr., Geochim. Cosmoc
Acta 38, 1061~1974!.174A. C. Mills and J. W. Biggar, J. Agric. Food Chem.17, 604 ~1969!.175R. A. Griffin and S. F. J. Chou, Water Sci. Technol.13, 1153~1981!.176S. M. Lambert, J. Agric. Food Chem.16, 340 ~1968!.177S. U. Khan and M. Schnitzer, Geochim. Cosmochim Acta36, 745
~1972!.178R. Haque and D. Schmedding, J. Environ. Sci. Health,B11, 129 ~1976!.179J. J. Hassett, J. C. Means, W. L. Banwart, S. G. Wood, S. Ali, and
Khan, J. Environ. Qual.9, 184 ~1980!.180J. C. Means, S. G. Wood, J. J. Hassett, and W. L. Banwart, Environ.
Technol.14, 1524~1980!.181G. Rippen, M. Ilgenstein, W. Klo¨pffer, and H. J. Poremski, Ecotoxico
Environ. Safety6, 236 ~1982!.182R. Lara and W. Ernst, Environ. Technol.11, 83 ~1990!.183R. Lara and W. Ernst, Environ. Technol.11, 93 ~1990!.184Y. Shin, J. J. Chodan, and A. R. Walcott, J. Agric. Food Chem.18, 1129
~1970!.185P. A. Wahid and N. Sethunathan, J. Agric. Food Chem.27, 1050~1979!.186P. A. Wahid and N. Sethunathan, J. Agric. Food Chem.28, 623 ~1980!.187R. L. Wershaw, P. J. Burcar, and M. C. Goldberg, Environ. Sci. Tech
15, 271 ~1969!.188T. H. Gauthier, W. R. Seitz, and C. L. Grant, Environ. Sci. Technol.21,
243 ~1987!.189Y. Hiraizumi, M. Takahashi, and H. Nishimura, Environ. Sci. Techn
13, 580 ~1979!.190W. W. Choi and K. Y. Chen, Environ. Sci. Technol.10, 782 ~1976!.
J. Phys. Chem. Ref. Data, Vol. 30, No. 1, 2001
i.
,
y
.
l.
.
.
i.
l.
191E. M. Richardson and E. Epstein, Soil Sci. Soc. Am. Proc.35, 884~1971!.
192P. Nkedi-Kizza, P. S. C. Rao, and J. W. Johnson, J. Environ. Qual.12,195 ~1983!.
193D. R. Garbarini and L. W. Lion, Environ. Sci. Technol.19, 1122~1985!.194D. R. Garbarini and L. W. Lion, Environ. Sci. Technol.20, 1263~1986!.195C. T. Chiou, L. J. Peters, and V. H. Freed, Science206, 831 ~1979!.196C. T. Chiou, L. J. Peters, and V. H. Freed, Science213, 683 ~1981!.197C. T. Chiou, inReactions and Movements of Organic Chemicals in So,
edited by B. L. Sawhney and K. Brown~Soil Science Society of AmericaInc., and American Society of Agronomy, Inc., Madison, WI, 1989!,Chap. 1, pp. 1–29.
198C. T. Chiou, T. D. Shoup, and P. E. Porter, Org. Geochem.8, 9 ~1985!.199A. S. Abdul and T. L. Gibson, Hazard. Waste Hazard. Mater.3, 125
~1986!.200P. J. Flory, J. Chem. Phys.10, 51 ~1942!.201M. L. Huggins, Ann. N. Y. Acad. Sci.43, 1 ~1942!.202F. C. Spurlock and J. W. Biggar, Environ. Sci. Technol.28, 989 ~1994!.203P. J. Flory, Discuss. Faraday Soc.49, 7 ~1970!.204F. C. Spurlock and J. W. Biggar, Environ. Sci. Technol.28, 996 ~1994!.205F. C. Spurlock and J. W. Biggar, Environ. Sci. Technol.28, 1003~1994!.206Y. P. Chin and W. J. Weber, Jr., Environ. Sci. Technol.23, 978 ~1989!.207R. P. Schwarzenbach and J. Westall, Environ. Sci. Technol.15, 1360
~1981!.208T. Larsen, P. Kjeldsen, and T. H. Christensen, Chemosphere24, 979
~1992!.209S. M. Schrap and A. Opperhuizen, Chemosphere18, 1883~1989!.210A. Khan, J. J. Hassett, W. L. Banwart, J. C. Means, and S. G. Wood,
Sci. 128, 297 ~1979!.211J. J. Hassett, J. C. Means, W. L. Banwart, and S. G. Wood, EPA R
600/3-80-041~1980!.212R. J. Hance, Can. J. Soil Sci.49, 357 ~1969!.213T. B. Stauffer, W. G. Mac Intyre, and D. C. Wickman, Environ. Toxico
Chem.8, 845 ~1989!.214H. Kishi, N. Kogure, and Y. Hashimoto, Chemosphere21, 867 ~1990!.215M. C. Lee, R. A. Griffin, M. L. Miller, and E. S. K. Chian, J. Environ
Sci. HealthA14, 415 ~1979!.216U. Mingelgrin and Z. Gerstl, J. Environ. Qual.12, 1 ~1983!.217E. E. Kenaga and C. A. I. Goring, inAquatic Toxicology, Proc. 3rd Ann.
Symp., Publ. No. STP 707, edited by J. C. Eaton, P. R. Parrish, and AHendricks ~American Society for Testing and Materials, PhiladelphPA, 1980!, pp. 78–115.
218J. M. Brannon, J. C. Pennington, V. A. Mc Farland, and C. HayChemosphere31, 3465~1995!.
219C. T. Chiou, D. E. Kile, T. I. Brinton, R. L. Malcolm, J. A. Leenheer, anP. Mc Carthy, Environ. Sci. Technol.21, 1231~1987!.
220C. T. Chiou, R. L. Malcolm, T. I. Brinton, and D. E. Kile, Environ. ScTechnol.20, 502 ~1986!.
221R. J. Hance, Weed Res.5, 108 ~1965!.222J. F. Lee, J. R. Crum, and S. A. Boyd, Environ. Sci. Technol.23, 1365
~1989!.223S. A. Boyd, J. F. Lee, and M. M. Mortland, Nature~London! 333, 345
~1988!.224S. A. Boyd, M. M. Mortland, and C. T. Chiou, Soil Sci. Soc. Am. J.52,
652 ~1988!.225W. F. Jaynes and S. A. Boyd, Soil Sci. Soc. Am. J.55, 43 ~1991!.226P. Grathwohl, Environ. Sci. Technol.24, 1687~1990!.227A. B. Paya-Pe´rez, A. Cortes, M. N. Sala, and B. Larsen, Chemosphe
25, 887 ~1992!.228E. M. Murphy, J. M. Zachara, and S. C. Smith, Environ. Sci. Technol.24,
1507 ~1990!.229D. W. Rutherford, C. T. Chiou, and D. E. Kile, Environ. Sci. Technol.26,
336 ~1992!.230D. E. Kile, C. T. Chiou, H. Zhou, H. Li, and O. Xu, Environ. Sci. Tech
nol. 29, 1401~1995!.231M. J. Frissel and G. H. Bolt, Soil Sci.94, 284 ~1962!.232R. J. Hance, Weed Res.17, 197 ~1977!.233T. M. Ward and R. P. Upchurch, J. Agric. Food Chem.13, 334 ~1965!.234D. C. Bouchard and T. L. Lavy, J. Environ. Qual.14, 181 ~1985!.235Z. Gerstl and B. Yaron, J. Agric. Food Chem.26, 569 ~1977!.236B. Yaron and S. Saltzman, Residue Rev.69, 1 ~1979!.

em
oc
ro
m
lth
te
m.
e
i-
od
ns,
es.
ci.
er.
i-
.
. Sci.
ci.
Sci.
435435SORPTION OF ORGANIC COMPOUNDS
237B. T. Bowman, R. S. Adams, Jr., and S. W. Fenton, J. Agric. Food Ch18, 723 ~1970!.
238W. F. Spencer and M. M. Cliath, Soil Sci. Soc. Am. Proc.34, 574~1970!.239W. F. Spencer, M. M. Cliath, and W. J. Farmer, Soil Sci. Soc. Am. Pr
33, 509 ~1969!.240I. J. Graham-Brice, J. Sci. Food Agric.20, 489 ~1969!.241T. H. Dao and T. L. Lavy, Weed Sci.26, 303 ~1978!.242G. Mac Namara and S. J. Toth, Soil Sci.109, 234 ~1970!.243W. J. Farmer and J. L. Ahlrichs, Soil Sci. Soc. Am. Proc.33, 254~1969!.244R. Van Bladel and A. Moreale, Soil Sci. Soc. Am. Proc.38, 244 ~1974!.245E. Gonza´lez-Pradas, M. Villafranca-Sa´nchez, V. Pe´rez-Cano, M. Socı´as-
Viciana, and A. Valverde-Garcı´a, Sci. Total Environ.123Õ124, 551~1992!.
246B. T. Bowman and W. W. Sans, Soil Sci. Soc. Am. J.41, 514 ~1977!.247J. B. Weber, Am. Mineral,51, 1657~1966!.248J. B. Weber, Soil Sci. Soc. Am. Proc.34, 401 ~1970!.249J. B. Weber, P. W. Perry, and R. P. Upchurch, Soil Sci. Soc. Am. P
29, 678 ~1965!.250G. W. Bailey, J. L. White, and T. Rothberg, Soil Sci. Soc. Am. Proc.32,
222 ~1968!.251C. I. Harris and G. F. Warren, Weeds12, 120 ~1964!.252B. A. G. Knight and P. J. Denny, Weed Res.10, 40 ~1970!.253J. B. Weber and S. B. Weed, Soil Sci. Soc. Am. Proc.32, 485 ~1968!.254M. H. B. Hayes, M. E. M. Pick, and B. A. Toms, Residue Rev.57, 1
~1975!.255Q. H. Yuen and H. W. Hilton, J. Agric. Food Chem.10, 386 ~1962!.256L. C. Liu, H. Cibes-Viade, and F. K. S. Koo, Weed Sci.18, 470 ~1970!.257D. E. Peck, D. L. Corwin, and W. J. Farmer, J. Environ. Qual.9, 101
~1980!.258T. C. Mueller, T. B. Moorman, and C. E. Snipes, J. Agric. Food Che
40, 2517~1992!.259R. J. Hance, Weed Res.5, 98 ~1965!.260R. Grover, Can. J. Soil Sci.55, 127 ~1975!.261J. R. W. Miles, B. T. Bowman, and E. R. Harris, J. Environ. Sci. Hea
B16, 309 ~1981!.262I. J. Graham-Brice, J. Sci. Food Agric.18, 72 ~1967!.263K. Kawamoto and K. Urano, Chemosphere19, 1223~1989!.264M. S. Sharom, J. R. W. Miles, C. R. Harris, and F. L. Mc Ewen, Wa
Res.14, 1095~1980!.265A. Felsot and J. Wilson, Bull. Environ. Contam. Technol.24, 778~1980!.266P. Jamet and M. A. Piedaller, Phytiatrie-Phytopharmacie24, 279 ~1975!.267S. Saltzman, L. Kliger, and B. Yaron, J. Agric. Food Chem.20, 1224
~1972!.268A. R. Swoboda and G. W. Thomas, J. Agric. Food Chem.16, 923~1968!.269J. W. Biggar, U. Mingelgrin, and M. W. Cheung, J. Agric. Food Che
26, 1306~1978!.270R. J. Hance, Weed Res.9, 108 ~1969!.271M. A. Mustafa and Y. Gamar, Soil Sci. Soc. Am. Proc.36, 561 ~1972!.272C. W. Coggins and A. S. Crafts, Weeds7, 349 ~1959!.273H. R. Sherburne and V. H. Freed, J. Agric. Food Chem.2, 937 ~1954!.274K. E. Savage, Weed Sci.21, 416 ~1973!.275H. W. Hilton and Q. H. Yuen, J. Agric. Food Chem.11, 230 ~1963!.276H. Elabd, W. A. Jury, and M. M. Cliath, Environ. Sci. Technol.20, 256
~1986!.277Z. Gerstl and B. Yaron, J. Environ. Qual.47, 474 ~1983!.278C. H. Wu, N. Buehring, and J. M. Davidson, Weed Sci.23, 454 ~1975!.279J. Kozak, J. B. Weber, and T. J. Sheets, Soil Sci.136, 94 ~1983!.280C. J. Peter and J. B. Weber, Weed Sci.33, 874 ~1985!.281T. Obrigawitch, F. M. Hons, J. R. Abernathy, and J. R. Gipson, We
Sci. 29, 332 ~1981!.282L. Guo, T. J. Bicki, A. S. Felsot, and T. D. Hinesly, J. Environ. Qual.22,
186 ~1993!.283N. Senesi, Sci. Total Environ.123Õ124, 63 ~1992!.284J. B. Weber, S. B. Weed, and T. M. Ward, Weed Sci.17, 417 ~1969!.285D. C. Bouchard, T. L. Lavy, and D. B. Marx, Weed Sci.30, 629 ~1982!.286M. D. Mc Glamery and F. W. Slife, Weeds14, 237 ~1966!.287J. B. Weber, Weed Sci.28, 478 ~1980!.288S. S. Harper, Weed Sci.36, 84 ~1988!.289J. S. Ladlie, W. F. Meggitt, and D. Penner, Weed Sci.24, 477 ~1976!.290D. C. Peek and A. P. Appleby, Weed Sci.37, 419 ~1989!.291C. J. Peter and J. B. Weber, Weed Sci.33, 868 ~1985!.
.
.
c.
.
r
d
292C. A. Seybold, K. Sweeney, and B. Lowery, J. Environ. Qual.23, 1291~1994!.
293Z. Wang, B. C. Pant, and C. H. Langford, Anal. Chim. Acta232, 43~1990!.
294Z. Wang, D. S. Gamble, and C. H. Langford, Anal. Chim. Acta244, 135~1991!.
295M. I. Haniff, R. H. Zienius, C. H. Langford, and D. S. Gamble, J. Envron. Sci. HealthB20, 215 ~1985!.
296P. M. Huang, R. Grover, and R. B. Mc Kercher, Soil Sci.138, 20 ~1984!.297O. Francioso, E. Bak, N. Rossi, and P. Sequi, Sci. Total Environ.123Õ
124, 503 ~1992!.298A. J. Beck and K. C. Jones, Chemosphere32, 2345~1996!.299D. S. Murray, P. W. Santelmann, and J. M. Davidson, J. Agric. Fo
Chem.23, 578 ~1975!.300J. R. Abernathy and J. M. Davidson, Weed Sci.19, 517 ~1971!.301W. C. Koskinen, D. M. Stone, and A. R. Harris, Chemosphere32, 1681
~1996!.302D. Zierath, J. J. Hassett, W. L. Banwart, S. G. Wood, and J. C. Mea
Soil Sci.129, 277 ~1980!.303W. L. Banwart, J. J. Hassett, S. G. Wood, and J. C. Means, Soil Sci.133,
42 ~1982!.304L. C. Liu and H. R. Cibes-Viade, J. Agric. Univ. P.R.57, 286 ~1973!.305B. V. Tucker, D. E. Pack, and J. N. Ospenson, J. Agric. Food Chem.15,
1005 ~1967!.306M. Damanakis, D. S. H. Drennan, J. D. Fryer, and K. Holly, Weed R
10, 264 ~1970!.307J. A. Best, J. B. Weber, and S. B. Weed, Soil Sci.114, 444 ~1972!.308Y. Gamar and M. A. Mustafa, Soil Sci.119, 290 ~1975!.309I. G. Burns and M. H. B. Hayes, Residue Rev.52, 117 ~1974!.310S. U. Khan, Can. J. Soil Sci.53, 199 ~1973!.311B. J. Brownawell, H. Chen, J. M. Collier, and J. C. Westall, Environ. S
Technol.24, 1234~1990!.312Y. Angemar, M. Rebhun, and M. Horowitz, J. Environ. Qual.13, 321
~1984!.313J. D. Gaynor and V. V. Volk, Weed Sci.24, 549 ~1976!.314J. W. Hamaker, C. A. I. Goring, and C. R. Youngson, Adv. Chem. S
60, 23 ~1966!.315J. W. Biggar and M. W. Cheung, Soil Sci. Soc. Am. Proc.37, 863~1973!.316W. J. Farmer and Y. Aochi, Soil Sci. Soc. Am. Proc.38, 418 ~1974!.317R. Grover, Weed Sci.19, 417 ~1971!.318D. C. Nearpass, Soil Sci.121, 272 ~1976!.319J. S. Arnold and W. J. Farmer, Weed Sci.27, 257 ~1979!.320R. Grover and A. E. Smith, Can. J. Soil Sci.54, 179 ~1974!.321A. J. Krzyszowska, R. D. Allen, and G. F. Vance, J. Environ. Qual.23,
1051 ~1994!.322M. R. Murray and J. K. Hall, J. Environ. Qual.18, 51 ~1989!.323S. A. Clay, W. C. Koskinen, R. R. Allmaras, and B. H. Dowdy, J. Env
ron. Sci. HealthB23, 559 ~1988!.324H. Zhao, W. F. Jaynes, and G. F. Vance, Chemosphere33, 2089~1996!.325J. R. Abernathy and L. M. Wax, Weed Sci.21, 224 ~1973!.326P. J. Shea, Weed Sci.34, 474 ~1986!.327O. K. Borggaard and J. C. Streibig, Weed Sci.36, 530 ~1988!.328K. Thirunarayanan, R. L. Zimdahl, and D. E. Smika, Weed Sci.33, 558
~1985!.329W. Mersie and C. L. Foy, Weed Sci.33, 564 ~1985!.330K. N. Reddy, M. A. Locke, S. C. Wagner, R. M. Zablotowicz, L. A
Gaston, and R. J. Smeda, J. Agric. Food Chem.43, 2752~1995!.331K. N. Reddy, R. M. Zablotowicz, and M. A. Locke, J. Environ. Qual.24,
760 ~1995!.332R. Grover, Weed Res.13, 51 ~1973!.333A. Moreale and R. Van Bladel, J. Environ. Qual.9, 627 ~1980!.334M. C. Hermosin and J. Cornejo, Chemosphere24, 1493~1992!.335S. A. Boyd, Soil Sci.134, 337 ~1982!.336J. Artiola-Fortuny and W. H. Fuller, Soil Sci.133, 18 ~1982!.337K. Schellenberg, C. Leuenberger, and R. P. Schwarzenbach, Environ
Technol.18, 652 ~1984!.338C. A. Bellin, G. A. O’Connor, and Y. Jin, J. Environ. Qual.19, 603
~1990!.339L. S. Lee, P. S. C. Rao, P. Nkedi-Kizza, and J. J. Delfino, Environ. S
Technol.24, 654 ~1990!.340J. C. Westall, C. Leuenberger, and R. P. Schwarzenbach, Environ.
Technol.19, 193 ~1985!.
J. Phys. Chem. Ref. Data, Vol. 30, No. 1, 2001

o
Sc
,
Am
Am
m
no
he
e
ci.
T
ron
no
ch
te
ic
di-
reat
mo-
C.uin,
on.
nt,
. G.
y,
J.
is,l-
436436 DELLE SITE
341K. Yoshida, T. Shigeoka, and Yamauchi, Chemosphere16, 2531~1987!.342C. T. Jafvert, Environ. Toxicol. Chem.9, 1259~1990!.343M. G. Stapleton, D. L. Sparks, and S. K. Dentel, Environ. Sci. Techn
28, 2330~1994!.344H. M. Seip, J. Alstad, G. E. Carlberg, K. Martinsen, and P. Skaane,
Total Environ.50, 87 ~1986!.345G. L. Jacques and R. G. Harvey, Weed Sci.27, 450 ~1979!.346B. Xing, W. B. Mc Gill, and M. J. Dudas, Chemosphere28, 145 ~1994!.347S. Dousset, C. Mouvet, and M. Schiavon, Chemosphere28, 467 ~1994!.348J. Amonette and G. A. O’Connor, Soil Sci. Soc. Am. J.44, 540 ~1980!.349L. W. Smith and D. E. Bayer, Soil Sci.103, 328 ~1967!.350E. Iglesias-Jime´nez, M. J. Sa´nchez-Martı´n, and M. Sa´nchez-Camazano
Chemosphere32, 1771~1996!.351R. G. Harvey, Weed Sci.22, 120 ~1974!.352W. Ehlers, J. Letey, W. F. Spencer, and W. J. Farmer, Soil Sci. Soc.
Proc.33, 501 ~1969!.353W. Ehlers, J. Letey, W. F. Spencer, and W. J. Farmer, Soil Sci. Soc.
Proc.33, 505 ~1969!.354F. Call, J. Sci. Food Agric8, 630 ~1957!.355H. L. Hollist and C. L. Foy, Weed Sci.19, 11 ~1971!.356W. F. Spencer and M. M. Cliath, J. Agric. Food Chem.22, 987 ~1974!.357P. Wade, J. Sci. Food Agric.5, 184 ~1954!.358S. Brunauer, L. S. Deming, W. E. Deming, and E. Teller, J. Am. Che
Soc.62, 1723~1940!.359J. J. Jurinak and D. H. Volman, Soil Sci.86, 6 ~1958!.360F. Call, J. Sci. Food Agric.8, 137 ~1957!.361F. Call, J. Sci. Food Agric.8, 143 ~1957!.362C. T. Chiou and T. D. Shoup, Environ. Sci. Technol.19, 1196~1985!.363C. T. Chiou, D. E. Kile, and R. L. Malcolm, Environ. Sci. Technol.22,
298 ~1988!.364M. S. Peterson, L. W. Lion, and C. A. Shoemaker, Environ. Sci. Tech
22, 571 ~1988!.365S. R. Thomas and L. W. Lion, Chemosphere25, 1707~1992!.366R. D. Rhue, P. S. C. Rao, and R. E. Smith, Chemosphere17, 727~1988!.367P. S. C. Rao, R. A. Ogwada, and R. D. Rhue, Chemosphere18, 2177
~1989!.368R. D. Rhue, K. D. Pennell, P. S. C. Rao, and W. H. Reve, Chemosp
18, 1971~1989!.369S. M. Steinberg, J. S. Schmeltzer, and D. K. Kreamer, Chemospher33,
961 ~1996!.370J. A. Smith, C. T. Chiou, J. A. Kammer, and D. E. Kile, Environ. S
Technol.24, 676 ~1990!.371S. K. Ong and L. W. Lion, J. Environ. Qual.20, 180 ~1991!.372L. W. Petersen, P. Moldrup, Y. H. El-Farhan, O. H. Jacobsen,
Yamaguchi, and D. E. Rolston, J. Environ. Qual.24, 752 ~1995!.373K. Goss, Environ. Sci. Technol.26, 2287~1992!.374K. Goss, Environ. Sci. Technol.28, 640 ~1994!.375K. D. Pennell, R. D. Rhue, P. S. C. Rao, and C. T. Johnston, Envi
Sci. Technol.26, 756 ~1992!.376S. M. Steinberg and D. K. Kreamer, Environ. Sci. Technol.27, 883
~1993!.377C. Thibaud, C. Erkey, and A. Akgerman, Environ. Sci. Technol.27, 2373
~1993!.378S. Batterman, A. Kulshrestha, and H. T. Cheng, Environ. Sci. Tech
29, 171 ~1995!.379C. Y. Chen and S. C. Wu, Chemosphere31, 4225~1995!.380S. M. Steinberg, J. J. Pignatello, and B. L. Sahwney, Environ. Sci. Te
nol. 21, 1201~1987!.381J. J. Pignatello, Environ. Toxicol. Chem.9, 1107~1990!.382J. J. Pignatello, Environ. Toxicol. Chem.9, 1117~1990!.383S. M. Steinberg, Chemosphere24, 1301~1992!.384C. A. Shoemaker, T. B. Culver, L. W. Lion, and M. G. Peterson, Wa
Resour. Res.26, 745 ~1990!.385J. P. Hassett and W. L. Banwart, inReactions and Movements of Organ
Chemicals in Soils, edited by B. L. Sawhney and K. Brown~Soil ScienceSociety of America, Inc. and America Society of Agronomy, Inc., Mason, WI, 1989!, Chap. 1, pp. 31–44.
386Th. E. M. ten Hulscher and G. Cornelissen, Chemosphere32, 609~1996!.387J. J. Kipling, Adsorption from Solution of Non-Electrolytes~Academic,
London, 1965!.388Y. He, A. Yediler, T. Sun, and A. Kettrup, Chemosphere30, 141~1995!.
J. Phys. Chem. Ref. Data, Vol. 30, No. 1, 2001
l.
i.
.
.
.
l.
re
.
.
l.
-
r
389R. P. Schwarzenbach, P. M. Gschwend, and D. M. Imboden,Environ-mental Organic Chemistry~Wiley, New York, 1993!.
390A. C. Mills and J. W. Biggar, Soil Sci. Soc. Am. Proc.33, 210 ~1969!.391Z. Gerstl and U. Mingelgrin, Clays Clay Miner.27, 285 ~1979!.392R. D. Wauchope, K. E. Savage, and W. C. Koskinen, Weed Sci.31, 744
~1983!.393M. A. T. Jota and J. P. Hassett, Environ. Toxicol. Chem.10, 483~1991!.394F. Luers and Th. E. M. ten Hulscher, Chemosphere33, 643 ~1996!.395M. Bosetto, P. Arfaioli, and P. Fusi, Soil Sci.155, 105 ~1993!.396S. U. Khan and R. Mazurkewich, Soil Sci.118, 339 ~1974!.397F. C. Spurlock, J. Environ. Qual.24, 42 ~1995!.398J. S. Graham and J. S. Conn. Weed Sci.40, 155 ~1992!.399R. D. Wijayaratne and J. C. Means, Mar. Environ. Res.11, 77 ~1984!.400J. F. Mc Carthy and B. D. Jimenez, Environ. Sci. Technol.19, 1072
~1985!.401S. Johnsen, Sci. Total Environ.67, 269 ~1987!.402C. W. Carter and I. H. Suffet, Environ. Sci. Technol.16, 735 ~1982!.403Z. Liu, S. A. Clay, D. E. Clay, and S. S. Harper, J. Agric. Food Chem.43,
815 ~1995!.404Y. A. Madhun, J. L. Young, and V. H. Freed, J. Environ. Qual.15, 64
~1986!.405R. D. Wijayaratne and J. C. Means, Environ. Sci. Technol.18, 121
~1984!.406J. C. Means and R. D. Wijayaratne, Science215, 968 ~1982!.407J. Y. Ding and S. C. Wu, Chemosphere30, 2259~1995!.408P. M. Gschwend and S. C. Wu, Environ. Sci. Technol.19, 90 ~1985!.409B. J. Eadie, N. R. Morehead, and P. F. Landrum, Chemosphere20, 161
~1990!.410B. J. Eadie, N. R. Morehead, J. V. Klump, and P. F. Landrum, J. G
Lakes Res.18, 91 ~1992!.411J. M. Brannon, J. C. Pennington, W. M. Davis, and C. Hayes, Che
sphere30, 419 ~1995!.412D. M. Di Toro, C. S. Zarba, D. J. Hansen, W. J. Berry, R. C. Swartz,
E. Cowan, S. P. Pavlou, H. E. Hallen, N. A. Thomas, and P. R. PaqEnviron. Toxicol. Chem.10, 1541~1991!.
413R. Lara and W. Ernst, Chemosphere19, 1655~1989!.414P. F. Landrum, S. R. Nihart, B. J. Eadie, and W. A. Gardner, Envir
Sci. Technol.18, 187 ~1984!.415T. D. Gauthier, E. C. Shane, W. F. Guerin, W. R. Seitz, and L. Gra
Environ. Sci. Technol.20, 1162~1986!.416J. P. Hassett and E. Milicic, Environ. Sci. Technol.19, 638 ~1985!.417C. Yin and J. P. Hassett, Environ. Sci. Technol.20, 1213~1986!.418G. R. B. Webster, D. H. Muldrew, J. J. Graham, L. P. Sarna, and D. C
Muir, Chemosphere15, 1379~1986!.419Y. P. Chin and P. M. Gschwend, Environ. Sci. Technol.26, 1621~1992!.420C. S. Ragle, R. R. Engebretson, and R. Von Wandruszka, Soil Sci.162,
106 ~1997!.421G. Caron, I. H. Suffet, and T. Belton, Chemosphere14, 993 ~1985!.422F. C. Spurlock and J. W. Biggar, Environ. Sci. Technol.24, 736 ~1990!.423D. Y. Lee and W. J. Farmer, J. Environ. Qual.18, 468 ~1989!.424B. Whitehouse, Estuarine Coastal Shelf Sci.20, 393 ~1985!.425F. De Paolis and J. Kukkonen, Chemosphere34, 1693~1997!.426J. P. Hassett and M. A. Anderson, Water Res.16, 681 ~1982!.427T. M. Ballard, Soil Sci. Soc. Am. Proc.35, 145 ~1971!.428A. S. Abdul, T. L. Gibson, and D. N. Rai, Environ. Sci. Technol.24, 328
~1990!.429C. G. Enfield, G. Bengtsson, and R. Lindquist, Environ. Sci. Technol.23,
1278 ~1989!.430B. R. Magee, L. W. Lion, and A. T. Lemley, Environ. Sci. Technol.25,
323 ~1991!.431F. M. Dunnivant, P. M. Jardine, D. L. Taylor, and J. F. Mc Carth
Environ. Sci. Technol.26, 360 ~1992!.432A. T. Kan and M. B. Tomson, Environ. Toxicol. Chem.9, 253 ~1990!.433P. Nkedi-Kizza, J. W. Biggar, H. M. Selim, M. T. van Genuchten, P.
Wierenga, J. M. Davidson, and D. R. Nielsen, Water Resour. Res.20,1123 ~1984!.
434J. F. Mc Carthy and M. C. Black, inAquatic Toxicology and HazardAssessment, edited by W. J. Adams, G. A. Chapman, and W. G. LandASTM STP 971~American Society for Testing and Materials, Philadephia, 1988!, Vol. 10, pp. 233–246.
435M. C. Black and J. F. Mc Carthy, Environ. Toxicol. Chem.7, 593~1988!.

m.
r
m
, J
.
y,
no
nJ.es
no
mo
ky
on
nd
M.
n
.
oil
oc.
m.
Sci.
m.
ci.
r-
nol.
nol.
on.
n.
437437SORPTION OF ORGANIC COMPOUNDS
436J. F. Mc Carthy and B. D. Jimenez, Environ. Toxicol. Chem.4, 511~1985!.
437J. F. Mc Carthy, B. D. Jimenez, and T. Barbee, Aquat. Toxicol.7, 15~1985!.
438J. F. Mc Carthy, Adv. Chem. Ser.219, 263 ~1989!.439J. Kukkonen and A. Oikari, Sci. Total Environ.62, 399 ~1987!.440J. Kukkonen and A. Oikari, Sci. Total Environ.79, 197 ~1989!.441J. Kukkonen, J. F. Mc Carthy, and A. Oikari, Arch. Environ. Conta
Toxicol. 19, 551 ~1990!.442J. Kukkonen and A. Oikari, Water Res.25, 455 ~1991!.443J. Kukkonen, J. F. Mc Carthy, and A. Oikari, inOrganic Substances and
Sediments in Water, Vol. 1, Humics and Soils, edited by R. A. Bake~Lewis, Chelsea, MI, 1991!, pp. 111–127.
444K. B. Woodburn, P. S. C. Rao, M. Fukui, and P. Nkedi-Kizza, J. ContaHydrol. 1, 227 ~1986!.
445P. S. C. Rao, A. G. Hornsby, D. P. Kilcrease, and P. Nkedi-KizzaEnviron. Qual.14, 376 ~1985!.
446G. L. Amidon, S. H. Yalkowsky, and S. Leung, J. Pharm. Sci.63, 1858~1974!.
447S. H. Yalkowsky, G. L. Amidon, G. Zografi, and G. L. Flinn, J. PharmSci. 64, 48 ~1975!.
448S. H. Yalkowsky, S. C. Valvani, and G. L. Amidon, J. Pharm. Sci.65,1488 ~1976!.
449J. T. Rubino and S. H. Yalkowsky, Pharm. Res.4, 220 ~1987!.450J. T. Rubino and S. H. Yalkowsky, Pharm. Res.4, 231 ~1987!.451K. R. Morris, R. Abramowitz, R. Pinal, P. Davis, and S. H. Yalkowsk
Chemosphere17, 285 ~1988!.452P. Nkedi-Kizza, P. S. C. Rao, and A. G. Hornsby, Environ. Sci. Tech
21, 1107~1987!.453P. S. C. Rao and L. S. Lee, inHealth and Environmental Research o
Complex Organic Mixtures, edited by R. H. Gray, E. K. Chess, P.Mellinger, R. G. Riley, and D. L. Springer, 24th Hanford Life SciencSymposium~Pacific Northwest Laboratory, Richland, WA, 1988!, pp.457–471.
454K. J. Fu and R. G. Luthy, J. Environ. Eng. ASCE112, 346 ~1986!.455P. Nkedi-Kizza, P. S. C. Rao, and A. G. Hornsby, Environ. Sci. Tech
19, 975 ~1985!.456R. W. Walters and A. Guiseppi-Elie, Environ Sci. Technol.22, 819
~1988!.457A. L. Wood, D. C. Bouchard, M. L. Brusseau, and P. S. C. Rao, Che
sphere21, 575 ~1990!.458R. Pinal, P. S. C. Rao, L. S. Lee, P. V. Cline, and S. H. Yalkows
Environ. Sci. Technol.24, 639 ~1990!.459P. S. C. Rao, L. S. Lee, and P. Pinal, Environ. Sci. Technol.24, 647
~1990!.460L. S. Lee, P. S. C. Rao, and M. L. Brusseau, Environ. Sci. Technol.25,
722 ~1991!.461W. J. M. Hegeman, C. H. van der Weijden, and J. P. G. Loch, Envir
Sci. Technol.29, 363 ~1995!.462R. Grover and R. J. Hance, Soil Sci.109, 136 ~1970!.463E. G. Lotse, D. A. Graetz, G. Chesters, G. B. Lee, and L. W. Newla
Environ. Sci. Technol.2, 353 ~1968!.464T. C. Voice, C. P. Rice, and W. J. Weber, Jr., Environ. Sci. Technol.17,
513 ~1983!.465W. J. Weber, Jr., T. C. Voice, M. Pirbazari, G. E. Hunt, and D.
Ulanoff, Water Res.17, 1443~1983!.466D. M. Di Toro, J. S. Jeris, and D. Clarcia, Environ. Sci. Technol.19,
1169 ~1985!.467L. M. Horzempa and D. M. Di Toro, J. Environ. Qual.12, 373 ~1983!.468M. R. Servos and D. C. G. Muir, Environ. Sci. Technol.23, 1302~1989!.469J. A. Celorie, S. L. Woods, T. S. Vinson, and J. D. Istok, J. Enviro
Qual.18, 307 ~1989!.470D. M. Di Toro, J. D. Mahony, P. R. Kirchgraber, A. L. O’Byrne, L. R
Pasquale, and D. C. Piccirilli, Environ. Sci. Technol.20, 55 ~1986!.471D. M. Di Toro and L. M. Horzempa, J. Great Lakes Res.8, 336 ~1982!.472P. Friesel, G. Milde, and B. Steiner, Fresenius Z. Anal. Chem.319, 160
~1984!.473J. J. Pignatello, Environ. Toxicol. Chem.10, 1399~1991!.474B. C. Fairbanks and G. A. O’Connor, J. Environ. Qual.13, 297 ~1984!.475R. Grover, Weed Sci.22, 405 ~1974!.476A. G. Hornsby and J. M. Davidson, Soil Sci. Soc. Am. Proc.37, 823
~1973!.
.
.
l.
l.
-
,
.
,
.
477J. R. Moyer, R. B. Mc Kercher, and R. J. Hance, Can. J. Soil Sci.52, 439~1972!.
478R. D. Wauchope and R. S. Myers, J. Environ. Qual.14, 132 ~1985!.479W. R. Roy and I. G. Krapac, J. Environ. Qual.23, 549 ~1994!.480S. A. Clay and W. C. Koskinen, Weed Sci.38, 262 ~1990!.481J. J. Pignatello and L. Q. Huang, J. Environ. Qual.20, 222 ~1991!.482E. Barriuso, W. C. Koskinen, and B. Sorenson, Sci. Total Environ.123Õ
124, 333 ~1992!.483L. Ma, L. M. Southwick, G. H. Willis, and H. M. Selim, Weed Sci.41,
627 ~1993!.484G. A. O’Connor, P. J. Wierenga, H. H. Cheng, and K. G. Doxtader, S
Sci. 130, 157 ~1980!.485T. M. van Genuchten, J. M. Davidson, and P. J. Wierenga, Soil. Sci. S
Am. Proc.38, 29 ~1974!.486B. T. Bowman and W. W. Sans, J. Environ. Qual.14, 265 ~1985!.487B. T. Bowman and W. W. Sans, J. Environ. Qual.14, 270 ~1985!.488P. S. C. Rao, J. M. Davidson, and D. P. Kilcrease,Agron. Abstracts
~American Society of Agronomy, Madison, WI, 1978!, p. 34.489H. D. Scott, D. C. Wolf, and T. L. Lavy, J. Environ. Qual.11, 107
~1982!.490D. M. Di Toro and L. M. Horzempa, Environ. Sci. Technol.16, 594
~1982!.491L. M. Horzempa and D. M. Di Toro, Water Res.17, 851 ~1983!.492J. M. Santana-Casiano and M. Gonza´lez-Davila, Environ. Sci. Technol.
26, 90 ~1992!.493A. A. Koelmans and L. Lijklema, Chemosphere25, 313 ~1992!.494T. C. Voice and W. J. Weber, Jr., Environ. Sci. Technol.19, 789~1985!.495S. M. Schrap, M. Haller, and A. Opperhuizen, Environ. Toxicol. Che
14, 219 ~1995!.496D. M. Di Toro, Chemosphere14, 1503~1985!.497D. Mackay and B. Powers, Chemosphere16, 745 ~1987!.498K. B. Lodge and P. M. Cook, Chemosphere19, 439 ~1989!.499S. M. Schrap and A. Opperhuizen, Chemosphere24, 1259~1992!.500R. L. Curl and G. A. Keolelan, Environ. Sci. Technol.18, 916 ~1984!.501P. J. Witkowski, P. R. Jaffe, and R. A. Ferrara, J. Contam. Hydrol.2, 249
~1987!.502P. S. C. Rao, J. M. Davidson, R. E. Jessup, and H. M. Selim, Soil
Soc. Am. J.43, 22 ~1979!.503J. J. T. I. Boesten and J. T. van der Pas, Soil Sci.146, 221 ~1988!.504J. J. Pignatello, C. R. Frink, P. A. Marin, and E. X. Droste, J. Conta
Hydrol. 5, 195 ~1990!.505J. Farrell and M. Reinhard, Environ. Sci. Technol.28, 63 ~1994!.506B. D. Kay and D. E. Elrick, Soil. Sci.104, 314 ~1967!.507J. M. Davidson and J. R. Mc Dougal, J. Environ. Qual.2, 428 ~1973!.508J. M. Davidson and R. K. Chang, Soil Sci. Soc. Am. Proc.36, 257
~1972!.509M. Th. van Genuchten, P. J. Wierenga, and G. A. O’Connor, Soil S
Soc. Am. J.41, 278 ~1977!.510K. H. Coats and B. D. Smith, J. Soc. Pet. Eng.4, 73 ~1964!.511C. T. Miller and W. J. Weber, Water Res.22, 465 ~1988!.512C. T. Miller and W. J. Weber, Ground Water22, 584 ~1984!.513M. L. Brusseau and P. S. C. Rao, CRC Crit. Rev. Environ. Control19, 33
~1989!.514H. M. Selim, J. M. Davidson, and R. S. Mansell, inProceedings Summe
Computer Simulation Conference~Simulation Councils, Inc., Washington, D. C., July 12–14, 1976!, pp. 444–448.
515L. Ma and H. M. Selim, Water Resour. Res.30, 447 ~1994!.516M. L. Brusseau and P. S. C. Rao, Chemosphere18, 1691~1989!.517M. L. Brusseau, R. E. Jessup, and P. S. C. Rao, Environ. Sci. Tech
24, 727 ~1990!.518M. L. Brusseau, R. E. Jessup, and P. S. C. Rao, Environ. Sci. Tech
25, 134 ~1991!.519M. L. Brusseau, Environ. Sci. Technol.25, 1747~1991!.520L. S. Lee, P. S. C. Rao, M. L. Brusseau, and R. A. Ogwada, Envir
Toxicol. Chem.7, 779 ~1988!.521M. L. Brusseau and P. S. C. Rao, Environ. Sci. Technol.25, 1501~1991!.522M. L. Brusseau, Environ. Toxicol. Chem.12, 1835~1993!.523J. T. Angley, M. L. Brusseau, W. L. Miller, and J. J. Delfino, Enviro
Sci. Technol.26, 1404~1992!.524T. Larsen, T. H. Christensen, and M. L. Brusseau, Chemosphere24, 141
~1992!.
J. Phys. Chem. Ref. Data, Vol. 30, No. 1, 2001

En
ua
, J
nd
em
on
A.
Sc
st.
Aal
m
ol
J.
ci.
a,
,
here
En-
ol.
g.
r-
toder
A.
438438 DELLE SITE
525P. Nkedi-Kizza, M. L. Brusseau, P. S. C. Rao, and A. G. Hornsby,viron. Sci. Technol.23, 814 ~1989!.
526M. L. Brusseau, A. L. Wood, and P. S. C. Rao, Environ. Sci. Technol.25,903 ~1991!.
527A. P. Gamerdinger, A. T. Lemley, and R. J. Wagenet, J. Environ. Q20, 815 ~1991!.
528G. Singh, W. F. Spencer, M. M. Cliath, and M. Th. van GenuchtenEnviron. Qual.19, 520 ~1990!.
529J. A. Johnson and W. J. Farmer, Soil Sci.155, 92 ~1993!.530S. M. Schrap, P. J. De Vries, and A. Opperhuizen, Chemosphere28, 931
~1994!.531S. A. Boyd and R. King, Soil Sci.137, 115 ~1984!.532H. D. Scott, D. C. Wolf, and T. L. Lavy, J. Environ. Qual.12, 91 ~1983!.533R. E. Green and V. K. Yamane, Soil Sci. Soc. Am. Proc.34, 353~1970!.534J. J. T. I. Boesten, Pestic. Sci.30, 31 ~1990!.535R. A. Dobbs, L. Wang, and R. Govind, Environ. Sci. Technol.23, 1092
~1989!.536B. T. Bowman, Can. J. Soil Sci.59, 435 ~1979!.537Z. Ou, A. Yediler, Y. He, A. Kettrup, and T. Sun, Chemosphere30, 313
~1995!.538R. E. Green and J. C. Corey, Soil Sci. Soc. Am. Proc.35, 561 ~1971!.539B. H. Ketelle and G. E. Boyd, J. Am. Chem. Soc.69, 2800~1947!.540R. Grover, Weed Sci.25, 159 ~1977!.541J. T. Wilson, C. G. Enfield, W. J. Dunlop, R. L. Crosby, D. A. Foster, a
L. B. Baskin, J. Environ. Qual.10, 501 ~1981!.542I. Hashimoto, K. B. Deshpande, and H. C. Thomas, Ind. Eng. Ch
Fundam.3, 213 ~1964!.543D. Mackay, W. Y. Shiu, and R. P. Sutherland, Environ. Sci. Technol.13,
333 ~1979!.544S. L. Kayal and D. W. Connell, Aust. J. Mar. Freshwater Res.41, 443
~1990!.545D. A. Backhus and P. M. Gschwend, Environ. Sci. Technol.24, 1214
~1990!.546P. F. Landrum, M. D. Reinhold, S. R. Nihart, and B. J. Eadie, Envir
Toxicol. Chem.4, 459 ~1985!.547G. A. Harkey, P. F. Landrum, and S. J. Klaine, Chemosphere28, 583
~1994!.548D. S. Gamble and S. U. Khan, Can. J. Chem.66, 2605~1988!.549R. Collander, Acta Chem. Scand.5, 774 ~1951!.550J. C. Mc Gowan, J. Appl. Chem.4, 41 ~1954!.551J. C. Mc Gowan, Nature~London! 200, 1317~1963!.552R. J. Hance, J. Agric. Food Chem.17, 667 ~1969!.553D. A. Dzombak and R. G. Luthy, Soil Sci.137, 292 ~1984!.554W. J. Lyman, inEnvironmental Exposure from Chemicals, Vol. 1, edited
by W. Brock Neely and G. E. Blau~CRC, Boca Raton, FL, 1986!, pp.13–47.
555B. M. Gawlik, N. Sotiriou, E. A. Feicht, S. Schulte-Hostede, andKettrup, Chemosphere34, 2525~1997!.
556A. Leo, C. Hansch, and D. Elkins, Chem. Rev.71, 525 ~1971!.557J. C. Means, S. G. Wood, J. J. Hassett, and W. L. Banwart, Environ.
Technol.16, 93 ~1982!.558G. G. Briggs, Austr. J. Soil Res.19, 61 ~1981!.559K. A. Lord, C. G. Helene, M. M. De Andrea, and E. F. Ruegg, Arq. In
Biol., Sao Paulo45, 47 ~1978!.560Y. P. Chin, W. J. Weber, Jr., and T. C. Voice, Water Res.20, 1443
~1986!.561A. Sabljic, H. Gusten, H. Verhaar, and J. Hermens, Chemosphere31,
4489 ~1995!.562Z. Gerstl, J. Contam. Hydrol.6, 357 ~1990!.563Z. Gerstl and U. Mingelgrin, J. Environ. Sci. HealthB19, 297 ~1984!.564E. E. Kenaga, Ecotoxicol. Environ. Safety4, 26 ~1980!.565J. C. Means, J. J. Hassett, S. G. Wood, W. L. Banwart, S. Ali, and
Khan, inPolynuclear Aromatic Hydrocarbons: Chemistry and BiologicEffects, edited by A. Bo”rseth and A. J. Dennis~Battelle, Columbus, OH,1980!, pp. 395–404.
566S. H. Yalkowsky, Ind. Eng. Chem. Fundam.18, 108 ~1979!.567S. H. Yalkowsky, R. J. Orr, and S. C. Valvani, Ind. Eng. Chem. Funda
18, 351 ~1979!.568D. Mackay and W. Y. Shiu, J. Chem. Eng. Data22, 399 ~1977!.569C. T. Chiou, D. W. Schmedding, and M. Manes, Environ Sci. Techn
16, 4 ~1982!.570G. R. Southworth and J. L. Keller, Water Air Soil Pollut.28, 239~1986!.
J. Phys. Chem. Ref. Data, Vol. 30, No. 1, 2001
-
l.
.
.
.
i.
.
.
.
571R. A. Rapaport and S. J. Eisenreich, Environ. Sci. Technol.18, 163~1984!.
572C. Hovarth and W. J. Melander, J. Chromat. Sci.15, 393 ~1977!.573R. L. Swann, D. A. Laskowski, P. J. Mc Call, K. Vander Kuy, and H.
Dishburger, Residue Rev.85, 17 ~1983!.574K. B. Woodburn, L. S. Lee, P. S. C. Rao, and J. J. Delfino, Environ. S
Technol.23, 407 ~1989!.575P. J. Mc Call, R. L. Swann, D. A. Laskowski, S. M. Unger, S. A. Vron
and H. J. Dishburger, Bull. Environ. Contam. Toxicol.24, 190 ~1980!.576J. W. Hamaker, inDynamics of Pesticides in the Environment, edited by
R. Haque and V. H. Freed~Plenum, New York, 1975!, pp. 21–30.577H. Hong, L. Wang, and S. Han, Chemosphere32, 343 ~1996!.578D. A. Bahnick and W. J. Doucette, Chemosphere17, 1703~1988!.579J. Hodson and N. A. Williams, Chemosphere17, 67 ~1988!.580W. Kordel, J. Stutte, and G. Kotthoff, Chemosphere27, 2341~1993!.581W. Kordel, G. Kotthoff, and J. Mu¨ller, Chemosphere30, 1373~1995!.582M. Muller and W. Kordel, Chemosphere32, 2493~1996!.583B. M. Gawlik, E. A. Feicht, W. Karcher, A. Kettrup, and H. Muntau
Chemosphere36, 2903~1998!.584G. Szabo´, Chemosphere21, 729 ~1990!.585G. Szabo´, Chemosphere21, 777 ~1990!.586G. Szabo´, G. Farkas, and R. A. Bulman, Chemosphere24, 403 ~1992!.587G. Szabo´, and J. Guczi, Chemosphere30, 1717~1995!.588L. Pussemier, G. Szabo´, and R. A. Bulman, Chemosphere21, 1199
~1990!.589J. H. Hildebrand and R. L. Scott,Solubility of Non-Electrolytes~Rein-
hold, New York, 1950!.590L. Pussemier, R. De Borger, P. Cloos, and R. van Bladel, Chemosp
18, 1871~1989!.591A. Sabljic, J. Agric. Food Chem.32, 243 ~1984!.592N. Nirmalakhandan and R. E. Speece, Environ. Sci. Technol.22, 606
~1988!.593M. Randic, J. Am. Chem. Soc.97, 6609~1975!.594L. B. Kier and L. H. Hall,Molecular Connectivity in Chemistry and Drug
Research~Academic, New York, 1976!.595L. B. Kier and L. H. Hall,Molecular Connectivity in Structure-Activity
Analysis ~Research Studies Press Ltd., Letchworth, Hertfordshire,gland, 1986!.
596R. Koch, Toxicol. Environ. Chem.6, 87 ~1983!.597A. Sabljic, Environ. Sci. Technol.21, 358 ~1987!.598W. Meylan, P. H. Howard, and R. S. Boethling, Environ. Sci. Techn
26, 1560~1992!.599A. Sabljic, R. Lara, and W. Ernst, Chemosphere19, 1665~1989!.600Q. Hu, X. Wang, and M. L. Brusseau, Environ. Toxicol. Chem.14, 1133
~1995!.601M. T. Sacan and I. A. Balcioglu, Chemosphere32, 1993~1996!.602J. H. Park and H. J. Lee, Chemosphere26, 1905~1993!.603M. J. Kamlet, J. L. M. Abboud, M. H. Abraham, and R. W. Taft, J. Or
Chem.48, 2877~1983!.604M. J. Kamlet and R. W. Taft, Acta Chem. Scand.B39, 611 ~1985!.605S. A. Boyd, J. Xiang Can, and J. F. Lee, J. Environ. Qual.19, 734~1990!.606B. T. Walton, M. S. Hendricks, T. A. Anderson, W. H. Griest, R. Me
riweather, J. J. Beauchamp, and C. W. Francis, J. Environ. Qual.21, 552~1992!.
607R. A. Kango and J. G. Quinn, Chemosphere19, 1269~1989!.608G. R. Southworth and J. L. Keller, Environ. Toxicol. Chem.3, 575
~1984!.609W. G. MacIntyre and T. B. Stauffer, Chemosphere17, 2161~1988!.610C. W. Carter and I. H. Suffet, inFate of Chemicals in the Environmen,
ACS Symposium Series 225, edited by R. L. Swann and A. Eschenr~American Chemical Society, Washington, D.C., 1983!, pp. 215–230.
611D. W. Lickfeldt and B. E. Branham, J. Environ. Qual.24, 980 ~1995!.612S. B. Socha and R. Carpenter, Geochim. Cosmochim. Acta51, 1273
~1987!.613J. M. Brannon, C. B. Price, F. J. Reilly, Jr., J. C. Pennington, and V.
Mc Farland, Bull. Environ. Contam. Toxicol.51, 873 ~1993!.614G. P. Curtis, P. V. Roberts, and M. Reinhard, Water Resour. Res.22,
2059 ~1986!.615F. T. Phillips, J. Sci. Food Agric.15, 444 ~1964!.616J. J. Deitsch and J. A. Smith, Environ. Sci. Technol.29, 1069~1995!.617W. P. Ball, C. Liu, G. Xia, and D. F. Young, Water Resour. Res.33,
2741 ~1997!.
i-
an
k
ua
on
c
.
n.
J
du,
ns,
l.
.
ci.
m.
oc.
kin,ng-
gr.
s
.R./4-
DC
7
439439SORPTION OF ORGANIC COMPOUNDS
618P. H. Howard,Handbook of Fate and Exposure Data for Organic Chemcals ~Lewis, Chelsea, MI, 1989!.
619M. R. Anderson and J. F. Pankow, Water Resour. Res.22, 1051~1986!.620B. G. Oliver, inQSAR in Environmental Toxicology, Vol. 2, Proceedings
of 2nd International Workshop, 1986, edited by K. L. E. Kaiser~Riedel,Dordrecht, Netherlands, 1987!, pp. 251–260.
621W. C. Steen, D. F. Paris, and G. L. Baughman, Water Res.12, 655~1978!.
622B. J. Eadie, C. P. Rice, and W. A. Frez, inPhysical Behavior of PCBs inthe Great Lakes, edited by D. Mackay, S. Paterson, S. J. Eisenreich,M. S. Simmons~Ann Arbor Science, Ann Arbor, MI, 1983!, pp. 213–228.
623G. M. Nau-Ritter, C. F. Wurster, and R. G. Rowland, Water Res.16,1615 ~1982!.
624G. M. Nau-Ritter and C. F. Wurster, Water Res.17, 383 ~1983!.625M. T. Halter and H. E. Johnson, inAquatic Toxicology and Hazard
Evaluation, ASTM STP-634, edited by F. L. Mayer and J. L. Hamelin~American Society for Testing and Materials, Philadelphia, 1977!, pp.178–195.
626K. Ballschmiter and M. Zell, Fresenius Z. Anal. Chem.302, 20 ~1980!.627D. Broman, C. Na¨f, C. Rolff, and Y. Zebu¨hr, Environ. Sci. Technol.25,
1850 ~1991!.628T. Mill, in Dioxins in the Environment, edited by M. A. Kamrin and P.
W. Rogers~Hemisphere, Washington, D.C., 1985!, pp. 173–193.629A. T. Lemley, R. J. Wagenet, and W. Z. Zhong, J. Environ. Qual.17, 408
~1988!.630N. Burkhard and J. A. Guth, Pestic. Sci.12, 45 ~1981!.631H. D. Scott and R. E. Phillips, Soil Sci. Soc. Am. Proc.36, 714 ~1972!.632H. Ghadiri, P. J. Shea, G. A. Wicks, and L. C. Haderlie, J. Environ. Q
13, 549 ~1984!.633C. I. Harris, Weeds14, 6 ~1966!.634J. M. Novak, T. B. Moorman, and D. L. Karlen, J. Agric. Food Chem.42,
1809 ~1994!.635E. A. Rochette and W. C. Koskinen, Soil Sci. Soc. Am. J.60, 453~1996!.636G. Wehtje, L. N. Mielke, J. R. C. Leavitt, and J. S. Schepers, J. Envir
Qual.13, 507 ~1984!.637E. Barriuso, U. Baer, and R. Calvet, J. Environ. Qual.21, 359 ~1992!.638R. Grover and R. J. Hance, Can. J. Plant Sci.49, 378 ~1969!.639R. C. Wietersen, T. C. Daniel, K. J. Fermanich, B. D. Girard, K. M
Sweeney, and B. Lowery, J. Environ. Qual.22, 811 ~1993!.640R. Celis, J. Cornejo, M. C. Hermosı´n, and W. C. Koskinen, Soil Sci. Soc
Am. J. 61, 436 ~1997!.641R. C. Rhodes, I. J. Belasco, and H. L. Pease, J. Agric. Food Chem.8, 524
~1970!.642J. Kanazawa, Environ. Toxicol. Chem.8, 477 ~1989!.643S. A. Clay, R. R. Allmaras, W. C. Koskinen, and D. L. Wyse, J. Enviro
Qual.17, 719 ~1988!.644J. T. Majka and T. L. Lavy, Weed Sci.25, 401 ~1977!.645K. N. Reddy, M. A. Locke, and L. A. Gaston, Soil Sci.162, 501 ~1997!.646A. P. Mallawatantri and D. J. Mulla, J. Environ. Qual.21, 546 ~1992!.647G. A. O’Connor, B. C. Fairbanks, and E. A. Doyle, J. Environ. Qual.10,
510 ~1981!.648H. M. Selim, R. S. Mansell, and A. Elzeftawy, Soil Sci.121, 176~1976!.649S. U. Khan, Environ. Sci. Technol8, 236 ~1974!.650A. J. A. Vinten, B. Yaron, and P. H. Nye, J. Agric. Food Chem.31, 662
~1983!.651M. Arienzo, M. Sanchez-Camazano, T. Crisanto Herrero, and M.
Sanchez-Martı´n, Chemosphere27, 1409~1993!.
d
l.
.
.
652M. Arienzo, T. Crisanto, M. J. Sa´nchez-Martı´n, and M. Sa´nchez-Camazano, J. Agric. Food Chem.42, 1803~1994!.
653P. W. Lee, S. M. Stearns, H. Hernandez, W. R. Powell, and M. V. NaiJ. Agric. Food Chem.37, 1169~1989!.
654T. C. Herrero and L. F. L. Martı´n, Toxicol. Environ. Chem.31Õ32, 63~1991!.
655B. A. Brown, R. M. Hayes, D. D. Tyler, and T. C. Mueller, Weed Sci.42,629 ~1994!.
656C. B. Rogers, R. E. Talbert, J. D. Mattice, T. L. Lavy, and R. E. FraWeed Sci.34, 122 ~1985!.
657F. Huggenberger, J. Letey, and J. Farmer, Soil Sci. Soc. Am. Proc.36,544 ~1972!.
658R. C. Rhodes, J. Agric. Food Chem.28, 311 ~1980!.659M. J. Sanchez-Martı´n and M. Sa´nchez-Camazano, Soil Sci.152, 283
~1991!.660J. B. Weber and L. R. Swain, Soil Sci.156, 171 ~1993!.661L. S. Wood, H. D. Scott, D. B. Marx, and T. L. Lavy, J. Environ. Qua
16, 251 ~1987!.662M. A. Locke, S. S. Harper, and L. A. Gaston, Soil Sci.157, 279 ~1994!.663M. Leistra, L. G. M. Th. Tuinstra, A. M. M. van der Burg, and S. J. H
Crum, Chemosphere13, 403 ~1984!.664H. M. Gaber, S. D. Comfort, W. P. Inskeep, and H. A. El-Attar, Soil S
Soc. Am. J.56, 1392~1992!.665K. S. La Fleur, Soil Sci.121, 9 ~1976!.666G. Wehtje, R. Dickens, J. W. Wilcut, and B. F. Hajek, Weed Sci.35, 858
~1987!.667W. C. Koskinen, G. A. O’Connor, and H. H. Cheng, Soil Sci. Soc. A
J. 43, 871 ~1979!.668W. C. Koskinen and H. H. Cheng, J. Environ. Qual.12, 325 ~1983!.669G. A. O’Connor and J. U. Anderson, Soil Sci. Soc. Am. Proc.38, 433
~1974!.670S. S. Chang and J. F. Stritzke, Weed Sci.25, 184 ~1977!.671P. Jamet and M. A. Piedaller, Phytiatrie Phytopharmacie27, 111 ~1978!.672W. A. Jury, R. Grover, W. F. Spencer, and W. J. Farmer, Soil Sci. S
Am. J. 44, 445 ~1980!.673W. L. Banwart, A. Khan, and J. J. Hassett, J. Environ. Sci. HealthB15,
165 ~1980!.674C. R. Worthing,The Pesticide Manual, 8th ed.~British Crop Protection
Council, Thornton Heath, U.K., 1987!.675V. P. Kozak, G. V. Simsiman, G. Chester, D. Stensby, and J. Har
EPA-600/1-79-0.12, U.S. Environmental Protection Agency, Washiton, DC ~1979!.
676K. Ugland, T. Lundales, T. Greinbrokk, and A. Bjorseth, J. Chromato213, 83 ~1981!.
677A. Albert and E. P. Sergeant, inIonization Constants of Acid and Base~Methuen and Co., Ltd., London, 1962!.
678M. A. Callahan, M. W. Slimak, N. W. Gabel, I. P. May, C. Fowler, J. RFreed, P. Jennings, R. L. Durfee, F. C. Whitmore, B. Maestri, W.Mabey, B. R. Holt, and C. Gould, EPA-440/4-79-029a and EPA-44079-029b, U.S. Environmental Protection Agency, Washington,~1979!.
679J. B. Weber, Adv. Chem. Series111, 55 ~1972!.680J. B. Weber, inResearch Methods in Weed Science, edited by B. True-
love ~Southern Weed Sci. Soc., Auburn Print., Inc., Auburn, AL, 197!,pp. 109–118.
681R. C. Weast, editor,Handbook of Chemistry and Physics, 50th ed.~CRC,Cleveland, OH, 1969–70!.
J. Phys. Chem. Ref. Data, Vol. 30, No. 1, 2001