factors affecting the adoption of mobile phone
TRANSCRIPT

FACTORS AFFECTING THE ADOPTION OF MOBILE PHONE
TECHNOLOGIES BY SMALLHOLDER DAIRY FARMERS IN
LIMURU SUB-COUNTY
MAINA RICHARD WANJOHI
A RESEARCH PROJECT SUBMITTED IN PARTIAL FULFILMENT
OF THE REQUIREMENTS FOR THE AWARD OF MASTER OF
SCIENCE IN MARKETING DEGREE, SCHOOL OF BUSINESS,
UNIVERSITY OF NAIROBI
NOVEMBER 2015

ii
DECLARATION
This research project is my original work and has not been presented for award of any degree in any university.
Signed: _________________________ Date: _________________________
Richard Wanjohi Maina D65/60385/2013
This research project has been submitted for examination with my approval as the University Supervisor.
Signed: _________________________Date: _________________________
Catherine Ngahu
Senior Lecturer
Department of Business Administration
School of Business, University of Nairobi

iii
DEDICATION
With the inspiration, enduring support and confidence through this academic point, I
thank my parents’ Agnes Nyawira and my late father Duncan Paul Maina for untiringly
encouraging us to pursue our academic aims to the highest possible level. My wife Njeri
Wangari and daughters Naomi Nyawira and Wanda Wangari for exercising their
fortitude, faith and reassurance. To my siblings and larger family, for your conviction and
prayers, I’m forever grateful.

iv
ACKNOWLEDGEMENT
For the gift of life and good health, my indebtedness to God during the pursuit of this
course amidst seemingly insurmountable challenges.
For the guidance, support and invaluable contribution, special thanks to my moderator
and supervisor Dr. Justus Munyoki and Ms. Catherine Ngahu in developing and
completing of this paper.
For the fledging course of Master of Science in Marketing, gratitude to The University of
Nairobi and course partners GFK Verein, as well as staff, colleagues and friends during
my time at the Chiromo and Lower Kabete Campus’ respectively.
v
TABLE OF CONTENTS
DECLARATION..................................................................................................................... ii
DEDICATION........................................................................................................................ iii
ACKNOWLEDGEMENT ..................................................................................................... iv
LIST OF TABLES ............................................................................................................... viii
LIST OF FIGURES ............................................................................................................... ix
LIST OF ABBREVIAABSTRACTTIONS & ACRONYMS .............................................. x
ABSTRACT ............................................................................................................................. v
CHAPTER ONE: INTRODUCTION ................................................................................... 1
1.1 Background of the Study ................................................................................................. 1
1.1.1 Concepts in Mobile Phone Technology and Agriculture .................................... 3
1.1.2 Adoption of Mobile Phone Technologies ........................................................... 5
1.1.3 Dairy Farming in Kenya ..................................................................................... 6
1.1.4 Dairy Farming in Limuru Sub-County ............................................................... 6
1.2 Research Problem ....................................................................................................... 7
1.3 Objectives of the Study .............................................................................................. 8
1.4 Value of the Study ...................................................................................................... 8
CHAPTER TWO: LITERATURE REVIEW .................................................................... 10
2.1 Introduction ................................................................................................................... 10
2.2 Theoretical Review ....................................................................................................... 10
2.2.1 Diffusion of Innovation Theory .............................................................................. 10
2.2.2 Theory of Reasoned Action .................................................................................... 11
2.2.3 Social Judgement Theory .................................................................................. 12
2.2.4 Technology Acceptance Model ........................................................................ 12
2.2.4 Unified Theory of Acceptance and Use of Technology (UTAUT) Model ............ 13

vi
2.3 Types and the Uses of Mobile Technology in Agriculture in Kenya............................ 14
CHAPTER THREE: RESEARCH METHODOLOGY ................................................... 17
3.1 Introduction ................................................................................................................... 17
3.2 Research Design ............................................................................................................ 17
3.3 Population of the Study ................................................................................................. 17
3.4 Sample Design............................................................................................................... 17
3.5 Data Collection .............................................................................................................. 18
3.6 Data Analysis ................................................................................................................ 19
CHAPTER FOUR: DATA ANALYSIS .............................................................................. 20
4.1 Introduction ................................................................................................................... 20
4.1.1 Response Rate......................................................................................................... 20
4.2 General Farmer Information.......................................................................................... 20
4.2.1 Sample Demographics ............................................................................................ 20
4.3 Dairy Farming – Ownership, Milk Production, Commercial Activities and Related Activities ............................................................................................................................. 25
4.5 Mobile Phone Technologies – Attitudinal and Behavioral Measurement .................... 27
4.5.1 Mobile Phone Technologies Adoptability .............................................................. 27
4.5.2 Mobile Phone Technologies Attitudes and Behaviour ........................................... 28
4.6 Summary and Discussion of Findings ........................................................................... 30
CHAPTER FIVE .................................................................................................................. 32
SUMMARY AND CONCLUSIONS ................................................................................... 32
5.1 Introduction ................................................................................................................... 32
5.2 Summary of Findings .................................................................................................... 32
5.3 Conclusions ................................................................................................................... 33
5.4 Recommendations for Policy, Theory and Practice ...................................................... 34
5.5 Recommendations for Further Study ............................................................................ 35
5.6 Limitations of the Study ................................................................................................ 35

vii
REFERENCES: .................................................................................................................... 36
APPENDIX 1: LETTER OF INTRODUCTION ............................................................... 40
APPENDIX 2: SAMPLE QUESTIONNAIRE ................................................................... 41

viii
LIST OF TABLES Table 1: Population of Limuru Sub-County (Kenya Census, 2009) and Proposed Sample ........... 18
Table 2: Marital Status ................................................................................................................... 21
Table 3: Age Bracket ...................................................................................................................... 21
Table 4: Gender .............................................................................................................................. 21
Table 5: Employment Status .......................................................................................................... 22
Table 6: Household's Head Income ................................................................................................ 22
Table 7: Level of Education ........................................................................................................... 23
Table 8: Summary of Assembly Wards .......................................................................................... 24
Table 9: Animal Ownership ........................................................................................................... 25
Table 10: Type of Dairy Animal .................................................................................................... 25
Table 11: Mobile Phone Applications ............................................................................................ 28
Table 12: Factor Analysis of Adoption Components ..................................................................... 29
Table 13: Component Analysis ...................................................................................................... 30
ix
LIST OF FIGURES Figure 1: Technology Acceptance Model ............................................................................... 13
Figure 2: Number of years in Dairy Farming ......................................................................... 26
Figure 3: Farming practises including Dairy Farming .................................................................. 26

x
LIST OF ABBREVIATIONS & ACRONYMS
CDMA Code Division Multiple Access
CAK Communications Authority of Kenya
CCK Communications Commission of Kenya
CPI Consumer Price Index
EAC East Africa Community
FAO Food and Agriculture Organisation
GDP Gross Domestic Product
GPRS General Packet Radio Services
GPS Global Positioning System
GSMA Global Services for Mobile Association
ICT Information Communications and Technology
ICT4D Information Communications Technology for Development
ITU International Telecommunications Union
KACE Kenya Agricultural Commodity Exchange
KDB Kenya Dairy Board
KNBS Kenya National Bureau of Statistics
NLMIS National Livestock Marketing Information System
PDA Personal Data Assistant
SMS Short Messaging Service
SPSS Statistics Package for Social Scientists
SSA Sub-Saharan Africa
UN United Nations
USAID United States of America International Development
USSD Unstructured Supplementary Service Data
VAT Value Added Tax
WLAN Wireless Local Area Network
3G 3rd Generation (of Mobile Network technology)
4G 4th Generation (of Mobile Network technology)

xi
ABSTRACT With the high penetration of mobile phone networks in Kenya, there is bound to be appreciation and adoption of these technologies’ in agriculture. According to a GSMA Report 2014, 96% of the population is covered by a mobile network. The study also suggests that there are still a few millions of unconnected Kenyans predominantly in the rural areas with a market penetration of only 33% in these areas. Rural users are likely to be farmers; entrepreneurs have been quick to pick up on the opportunities for engaging rural people in mobile services. This study was done to determine adoption of mobile phone technologies among smallholder dairy farmers. The main objective of the study was to determine the existence, adoption and flow of mobile technologies in the dairy sub-sector. Literature was collected from various authors and publications who focused on mobile phone technologies, dairy farming practices as well as factors influencing adoption of these technologies. This research used the descriptive research design which involved acquiring information on a group of dairy farmers about their characteristics, opinions, attitudes and previous as well as current experiences. To achieve this, the main data was collected using structured questionnaires. Strata comprised of county assemblies within Limuru Sub-County. The study revealed that the factors that were considered among the variables and demographics which included innovativeness, reliability, penetration, relevance and affordability. The study found that respondents were aware of various mobile phone technologies and also demonstrated that respondents had a high adoptability towards attributes that these technologies. A good majority of the respondents indicated using mobile phone technologies for payment, animal health and complementary dairy services. The findings also found that nearly all respondents are positively adoptable to these technologies. The researcher recommended that similar studies can be carried out in other counties with a high concentration of dairy farmers and farmers are on the look-out for new mobile phone solutions to assist in animal health. The study found that there are number of mobile phone technologies in use largely for extension services and animal health. Adoption of these technologies dependent on their reliability, relevance and information provided about them. It is recommended that those developing these technologies work closely with farmers to find out what challenges are currently in existence. Learnings from countries that adopted mobile phone technologies widely in their dairy farming can be used and adapted by Kenyan dairy farmers and other forms of farming too.

1
CHAPTER ONE: INTRODUCTION
1.1 Background of the Study
In Kenya today, agriculture has become more complex and with this, a need for changing
and enhancing the means of production. Information Communications Technologies
(ICTs) have formed products and services adopted by agricultural practitioners in
developing better methods to improve their yields and farming practices. Using mobile
phones and SMS, for example, farmers have been able to expand their distribution
channels to more remote rural areas and offer products and services to farmers that were
not available to them before (ICT Applications and Agricultural Input Supply Companies,
USAID, 2013).
The proliferation of mobile phones on the continent has impacted agriculture in various
ways. Mobile phones are being used as tools to raise farmer households’ incomes,
lowering information costs, reducing and making the marketing channels more efficient,
reducing incidental and transport costs as well as continually serving as platforms for
innovation. Mobile phones are in the vanguard of ICTs in agriculture. (ICT in
Agriculture- Connecting Smallholders to Knowledge, Networks and Institutions, World
Bank e-Sourcebook, 2011).
While the main focus of this study is on the adoption and use of ICT technologies and in
particular mobile phone technologies, it is important to remember that ICT is a tool, not a
universal remedy, and not all solutions fit all business models or contexts. In addition, the
landscape is changing so rapidly that it is important to carry out this research on how ICT
continues to be used, both effectively and poorly, by input suppliers. One of the
objectives of this study is to cover the main constructs derived from Technology
Acceptance Model (F.D. Davis, 1989); including intention to adopt mobile technologies
products and services, perceived usefulness, and perceived ease of use. The additional
variables perceived risk and social influence are included in the Technology Acceptance
Model in order to develop a research model to probe variables affecting adoption of
mobile phone technologies by farmer households in Kenya.
Mobile phone technologies are the most flexible technology for improving connections
within farmer organizations and providing a wider range services. Documented benefits
of ICTs include improved connections to members, better accounting and administration,

2
and stronger collective voice. Mobile phones are in the vanguard of ICTs in agriculture.
(ICT in Agriculture- Connecting Smallholders to Knowledge, Networks and Institutions,
World Bank e-Sourcebook, 2011). The mobile phone has been one of the most rapidly
adopted forms of Information, Communications and Technology in Sub-Saharan Africa.
There are 253 million unique mobile subscriptions in Sub-Saharan Africa, growing at an
average rate of 18% per annum, by June 2013 (GSMA Sub-Saharan Mobile Economy
Report, 2013). The Report further indicates that Kenya had 13.4 million unique mobile
subscriptions within the same period. Mobile telephony has brought myriad opportunities
in different economic sectors, to both rural and urban dwellers, connecting single entities
and individuals to businesses, co-operatives and institutions as well as markets and
information hubs across the country. The increased ubiquity of the mobile phone and
associated technologies is presenting both opportunities and challenges in the agricultural
sector.
Agriculture is the mainstay of the Kenyan economy contributing 24% of the GDP directly
and 27% indirectly through various linkages with the manufacturing, distribution and
other service-related sectors (Food Security Report-KARI; KNBS Statistical Abstract,
2013). Part of the reason it remains a major sector is the growing population, urbanization
and increase in incomes of households, all increasing the demand for food. The current
estimates from the Kenya National Bureau of Statistics and the World Bank 2013 data
estimate the number to be 44.35 million people. This indicates the integral part that
agriculture plays. This paper will concentrate on the study of the dairy sector as a sub-
sector of the agriculture sector. In Kenya, the dairy industry is the single largest
agricultural sub-sector contributing 14% of the agricultural GDP and estimates of 3.5 %
of the country’s GDP (KNBS Statistical Abstract 2013,). It has been one of the fastest
growing agricultural sectors in the country contributing an average of KES 320 billion per
year and supporting the livelihoods of 10 million people (Nestle, Model Milk District
Report 2013). There are many players in the dairy sector: those offering services and
inputs; industry facilitators and development partners; and the users of services/inputs. A
unique characteristic of dairy production in this setting is that milk supply comes
predominantly from smallholder farmers in both informal and formal markets.
There are more than one million smallholder dairy farmers according to surveys done by
the Smallholder Dairy (Research and Development) Project. These farmers contribute
3
70% of the gross marketed production from the farms. There are about 30 licensed milk
processors, two of which process more than 60 percent of the total processed milk (KDB).
Part of the rapid growth in the sector can be attributed to the use of improved forms of
production. Technologies such as mobile technologies have been playing an integral role
in auxiliary services such as payment processing, loan repayment and other services made
to dairy farmers (ICT in Agriculture, e-Sourcebook, World Bank, 2011). Diffusion of
mobile phones in rural areas presents one of the most profound changes in rural Kenya
and Sub-Saharan Africa (GSMA SSA Mobile Telephony, 2013). Farmers, market players
along with milk processors have shifted from a culture of long communication lines to
one where the mobile phone is an important tool for communication as well as
information sharing and dissemination.
Timely adoption and appropriate use of the easily and widely available mobile phone
technologies in agricultural operations is one of the opportunities that may help in
realizing the ‘digital opportunities’ of enhancing rural productivity and contribute to
reducing rural-urban inequalities (Islam, 2011). There are digital platforms developed to
work as information intermediaries to farmers agricultural data including the Kenya
Agricultural Commodity Exchange, e-Soko, i-Cow and m-Farm to name but a few. These
platforms communicate agricultural inputs such as product or input advertisements, price
fluctuations, breeding and extension services and advisory services among others.
Although the dairy sub-sector farmers have become targets for mobile phone services,
studies of technology adoption and diffusion in such context are currently limited
(Adesina & Baidu-Forson, 1995). These limitations inform this study and the subsequent
review of literature and data collected. The next section looks at the concepts which will
form the basis of this study, theories and models relating to the topic of the study.
1.1.1 Concepts in Mobile Phone Technology and Agriculture
Mobile phone technology is one form of Information Communication Technologies used
for cellular communication. It has evolved from the simple pager with two-way
communication and PDAs and hand-held devices to the CDMA technology, GSM, 3G
and 4G networks along with Internet-enabled phones and devices fitted with Wi-Fi and
GPRS features. Currently mobile technology is revolving around smartphones and tablets
each with features to enhance communication and use of technology in different sectors

4
of the world economy (Information Office, UK, 2012). Feature phones are the most
preferred by farmers and majority of the both rural and urban populace in Kenya.
However this trend is changing the country as well as the rest of Sub-Saharan Africa. This
can be attributed to affordable entry-level smartphones, affordable Internet and data plans
as well as deployment of the 3G mobile network technology (Communications’ Authority
of Kenya - Quarterly Report, 2014)
The mobile phone has the fastest penetration among Information Communication
Technologies. In developing countries, mobile-cellular penetration will reach 90% by end
of 2014, compared with 121% in developed countries. (ITU, 2014). Mobile telephony
has made it possible for citizenry in the continent to connect among themselves;
individuals, information, markets and services. In Ghana, farmers can send a text message
to learn the prices of corn and tomatoes in Accra, which is 400 kilometres away (Aker
and Mbiti, 2010). The regulatory design has improved in recent decades helping boost
competition among the telecommunications companies, which in turn has made it
possible for innovation in business models in mobile telephony (Ling and Bonner, 2009).
The mobile phone has been identified as the first form of telephony for many of the
world’s poor including those in Sub-Saharan Africa and Kenya. Mobile telephony has
extended to the poorer populations across the world, majority of whom are small-scale
farmers and engage in agriculture as their main source of livelihood. Agriculture accounts
for a majority of the rural employment. Thus any improvement seen in agriculture will
largely help improving the lot for the rural communities and those involved in the various
agricultural value chains such as the dairy sub-sector. The increase in usage of mobile
phones in Sub-Saharan Africa has caused disruptions in the agricultural sector in a
number of ways. This includes making agricultural information more accessible and
lowering information costs, making agriculture marketing more efficient, connecting
previously un-served and under-served agricultural potent areas, reducing transport costs
and providing a platform for delivering advisory services and innovations.
For the purposes of this study, the mobile phone technologies to be considered include
mobile applications for both hardware and software. The hardware include mobile
gadgets, PDAs, smartphones and tablets. Software that sits on top of the operating system
or on top of a platform, for example, served-based applications such as
Vodafone/Safaricom’s M-Pesa that provide services to mobile users are considered too as

5
part of the study (InfoDev, 2012). The M-Pesa is an example of USSD platform, which
runs on the GSM cellular phones and more recent mobile networks.
1.1.2 Adoption of Mobile Phone Technologies
Available data on adoption of improved agriculture technologies indicates a low level of
adoption in developing countries such as the majority of Sub-Saharan African countries
where Kenya lies. This shows a disparity compared with other sectors such as financial
services which have grown exponentially (GSMA Sub-Saharan Africa Report, 2013). The
rate of adoption can be attributed to learning; where learning that a new technology is not
as effective will thus reduce adoption in the next period (Foster and Rosenzwig, 2010).
This is from the deduction that mobile technologies reduce communication and
information for those in the rural areas engaging in agriculture.
Foster and Rosenzweig (1995) show that there are two potential opposing effects of social
networks on adoption of mobile technologies by farmers. The first is the individual
farmer’s incentive to adopt increases as those members within a social network use the
new technology. For example, a farmer in a Farmers’ or Savings’ Co-operative is likely to
adopt the technology on the influence of other farmers or members of the SACCO. This
may also create an incentive to delay adoption due to the free-riding behaviour and
information spill-overs. Most studies have come to a general consensus on the
determinants of or constraints to mobile technologies adoption to include other reasons.
These include levels of education, expected returns, tastes, wealth, risk preferences and
access to information and learning.
Islam and Gronlund in the Rural Area Technology Acceptance and Diffusion of
Innovation model explore the factors that affect the adoption of mobile phone
technologies in Bangladesh. The model among other studies explore the rural areas in
understanding the adoption or lack thereof of mobile phone technologies. In Kenya,
mobile phone technologies have been adopted following the success of the mobile money
platforms such as M-Pesa. This has led to other forms of mobile technologies adopted in
even in agriculture such as m-Farm, i-Cow which have changed the face of agricultural
practices in the country (i-Hub Research and GSMA Sub-Saharan Reports, 2013). These
technologies have been accepted by farmers to embrace better farming practices. These

6
technologies have also been made for marketing services and easier access to
information.
1.1.3 Dairy Farming in Kenya
Milk is produced everyday giving regular income to many small-scale producers. Milk
production is labour-intensive and provides employment to a large part of the world’s
population. It can be obtained from domesticated animals including cows, goats, sheep
and camels and in other economies such as the Asian sub-continent, buffaloes (McGee,
2004 and FAO, 2013). Dairy farming is the rearing of these animals to produce and
process the milk. This can be through single small-scale farmers, large-scale farms, dairy
co-operative schemes who pass on the function of processing to the different milk
processors. Commercial dairy farming started in 1902 with indigenous Kenyans being
allowed to rear dairy animals from the mid-1950s. The sector has witnessed a shift from
the export-oriented and large-scale holders in the 1960s to growth of small-holders and
local consumption in the 2000s (Kenya Dairy Board, 2010). Milk production in Kenya is
mainly from cattle, camels and goats with dairy cattle produce accounting for about 70%
of the total national milk output. In 2013, recorded milk production stood at 523 million
litres, a rise from the decline seen in 2012 of 495.2 million litres. Earnings from dairy
produce increased from KES. 15.4 billion in 2010 to KES. 16.8 billion in 2013 (KNBS,
2014).
1.1.4 Dairy Farming in Limuru Sub-County
Limuru Sub-County (also known as Kiambu West) is one of the five sub-counties that
make up Kiambu County. Sub-county is the administrative formerly known as
constituency in Kenya. The sub-county has a population of 131,132 (National Census,
2009) in an area covering 281.8 square kilometres. This study is based on the farmers
from this sub-county due to the high incidence of dairy farming in this area. The area has
a total of 22,484 cows and 5765 goats (National Census, 2009). The area was also part of
a pilot study commissioned by the Kenya Dairy Board under the Promoting the Adoption
of Management Information Systems in the Dairy Industry where one of the objectives
was to “facilitate electronic and mobile commerce in the dairy industry”. This study was
undertaken at the Limuru Dairy Farmers Cooperative in 2012. The population in this area
is homogenous such that the farmers are exposed to similar climatic conditions and

7
practice similar livestock and crop production structures. A distinctive characteristic of
dairy production in this locale is that milk supply comes predominantly from smallholder
farmers in both informal and formal markets.
1.2 Research Problem
While mobile telephone technologies have witnessed phenomenal growth and
penetration, studies show there is still a large part of the population that is under-served
and not enjoying mobile services at all. This majority is in the agricultural rural areas of
most parts of the world (Islam and Gronlund, 2011). Mobile technologies have also been
adopted in other sectors of the economies such as financial and banking services, utilities
and health, education and to some extent in agriculture. Studies in Bangladesh assessed
the factors that have led to the adoption of mobile technologies in general and the larger
agricultural sector (Islam and Gronlund, 2011; Kalba, 2008 and Jain and Hundal, 2007).
Mobile financial applications such as ‘m-money’ and ‘m-banking’ have been widely
adopted in Africa with examples such as m-Pesa and m-Shwari from mobile services
provider Safaricom and Commercial Bank of Africa respectively (Aker and Mbiti, 2010).
A variety of applications, services and applications have been developed and deployed
using the mobile as the primary tool of collection or delivery. This is the case in a number
of m-health projects such as monitoring and tracking of epidemics and illnesses in parts
of Africa and Caribbean. The crowd-sourcing application Ushahidi relies heavily on texts
and messages from mobile phone users to source for information and manage
emergencies as was the case during the 2008 post-election crisis in Kenya and earthquake
in Haiti ( Granot, Ivorra and Rubinsky, 2008; Aker and Mbiti, 2010). In agriculture,
mobile phones are facilitating access to agricultural marketing information replacing
message boards and radio programs of traditional marketing information systems. They
are also providing agricultural extension services in Kenya, Uganda and India for
technical agricultural advice (Donovan, 2010).
A study was conducted on mobile phone communication in diffusion of goat rearing in
Kitui in 2013. This study looked into the role played by the mobile phone in undertaking
goat rearing (Adongo, 2012). Another study conducted in Limuru sought to explore how
dairy farmers can access credit better using mobile technologies (Kinuthia, 2012).
Though these aforementioned studies were focusing on mobile telephone technologies,

8
there is limited evidence and information on the impact of the same in the dairy sub-
sector in Kenya. Emerging patterns from other studies looking at the smallholder
farmers’ adoption of new technologies and market participation is that there is a highly
variable of participation and non-participation or adoption and non-adoption cycles of
improved production techniques. Gaps identified in these studies are that they have not
assessed what technologies are currently in existence, the level of adoption and
continuous usage of these technologies and impact of the mobile technologies on
improving dairy farming productivity. No clear distinct finding offers an explanation to
address the exogenous factors constraining continuous participation of smallholder
farmers in dairy production. Hence the question, how many smallholder farmers have
adopted mobile technologies in their dairy farming activities?
1.3 Objectives of the Study
The overall objective of the study was to determine the existence, adoption and flow of
mobile technologies in the dairy industry while the specific objectives are as follows;
a) To establish the proportion of farmers engaging in dairy farming who have adopted
mobile phone technologies.
b) To investigate the factors that affect the adoption of mobile phone technologies
relevant to smallholder farmers in Limuru.
c) To identify the attitudes towards mobile technologies in dairy farming.
d) To determine constraints and challenges facing the dairy farmers in adopting the
mobile phone technologies.
1.4 Value of the Study
The findings of this study are expected to enrich the existing studies in mobile
applications and the agricultural sector. It will contribute further to theory building, policy
issues in mobile application and services development and the management information
services in the dairy sub-sector. It will assist developers on existing gaps and challenges
in mobile phone technologies and how they can overcome them. The study will also form
a source for future researchers as the trove of information will help advance similar

9
studies acting as a reference. The insights from this study can help mobile phone
developers on how best to serve an unserved market in the rural areas not yet penetrated.
The findings of the study will aid policy makers in the counties and national governments
on better mobile phone adoption practices and faster diffusion rates. The findings will
also help stakeholders in the mobile telephony and agricultural sectors of the economy in
reaching a wider underserved population of farmers and greater country population. The
researcher is expected to benefit through the communication and writing skills to be
gained by the time of completion of the research project.
This study will also provide a clear picture of the role that mobile phone technologies
play in various marketing functions including distribution, product development and
innovation. It will also show ways that adoption of mobile technologies has impacted
dairy farming and agriculture and is continually doing the same for marketing and market
research.

10
CHAPTER TWO: LITERATURE REVIEW
2.1 Introduction
This chapter will evaluate the theories guiding this study and the importance of mobile
phone technologies along with the adoption and diffusion of these tools. It will also
review the dairy industry. The literature is from various researchers, scholars and authors.
2.2 Theoretical Review
The following theories will be discussed for the purpose of this research; namely the
diffusion of innovations theory; technology acceptance model; theory of planned
behaviour; and unified theory of acceptance and use of technology (UTAUT) model.
2.2.1 Diffusion of Innovation Theory
The theory seeks to explore why, how and at what rate new ideas and in this case
technology spread through cultures. Diffusion is explained as the process by which an
innovation is communicated through certain channels over time among the participants in
a social system. Thus diffusion is explained as ‘a special type of communication
concerned with the spread of messages that are perceived as new ideas (Rogers, 2003).
An innovation is ‘an idea, practice or object that is perceived as new by an individual or
other unit of adoption. The characteristics of an innovation, as perceived by the members
of a social system, determine its rate of adoption (Rogers, 1995). Innovations may also be
classified based on their impact on behaviour and social structure into continuous,
dynamically continuous and discontinuous products or innovations (Robertson, 1971).
Technological innovations fall into the discontinuous innovation category and thus they
can be regarded to as knowledge intensive innovations. This is because the knowledge
needed for technological innovation comprehension is possibly contingent on aspects of
technology (Moore, 1999).
Technology consists of both a hardware and software component, with the hardware
embodying the technology as a material or physical object (in this case, mobile handsets,
hand-held devices such as PDAs, tablets). Software on the other hand is the information
base used (for example, Symbian and Java for Nokia phone handsets or Android for smart
devices). Though the latter is less observable than the hardware, they should both be
11
considered when being researched for a study such as is intended here (Rogers, 1995).
There are four main elements which influence the spread of a new idea; the innovation
itself, communication channels, time and a social system. This process is dependent on
human capital and the innovation must be widely adopted to be identified as sustainable.
Within the rate of adoption, the innovation reaches critical mass as identified by the
categories of adopters: innovators, early adopters, early majority, late majority and
laggards (Rogers, 1995).
Relating this to adoption of mobile technology in agriculture, it is expected that the
technology is technically and culturally appropriate while the problem of adoption is one
of asymmetric information and high search cost (Feder and Slade, 1984; Shampine, 1998;
Smale et al, 1994). The adoption of a technology can be measured by ‘the timing and
extent of new technology utilization by individuals’ (Sunding and Zilberman, 2001). In
this study the consideration will be on adoption and diffusion of mobile technology
among dairy farmers. The timing of adoption and diffusion can be split into three levels,
i.e. the decision process a dairy farmer whether or not to adopt a technology, the
innovativeness of the farmer in terms of when to adopt the diffusion process and the rate
at which is adopted in the system (Rogers, 2003). The extent of adoption will be
measured by the usage rate, number of dairy farmers using the technologies, the change in
amount of milk produced and processed, the amount paid among other items to be
measured by the research tool.
2.2.2 Theory of Reasoned Action
The theory proposes that a person’s actual behaviour can be determined by considering
their prior intention along with the beliefs that the person has for the given behaviour. The
intention that a person has prior to an actual behaviour is referred to as the behavioural
intention of that person and is defined as a measure of one’s intention to perform a
behaviour (Fishbein and Ajzen, 1971). This theory has four constructs that a user has in
actual behaviour since behavioural intention is positively influenced by beliefs, attitudes,
subjective norms and normative beliefs. Attitude according to this theory is defined as a
person’s positive or negative feelings about performing the actual behaviour, suggesting
that the attitude of a person towards a behaviour can be measured by considering the sum
of the product of all relevant beliefs about consequences of performing that behaviour.

12
The subjective norm associated with a behaviour is also described as the person’s
perception that most people who are important to him or her think he/she should or
should not perform the behaviour. Thus subjective norm can be determined by
considering the sum of the product of a person’s normative beliefs (Fishbein and Ajzen,
1971, 1980). Normative beliefs are identified as the perceived expectations of other
individuals or groups and one’s motivation to comply. This theory though suggests that
attitudes and norms are not weighted equally in predicting behaviour. Depending on the
individual and the situation faced, these factors may have different effects on the
behavioural intention, thus a weight is associated with each of these factors in the
predictive formula of the theory (Fishbein and Ajzen,1980) (Miller (2005).
2.2.3 Social Judgement Theory
The theory assumes that people assimilate new information about attitude objects in the
light of what they already know or feel. The initial attitude acts as a point of reference,
and the new information is categorized in terms of the existing standard. People contrast
in terms of the information they will find acceptable or unacceptable. They form latitudes
of acceptance and rejection around an attitude standard. This is the case with mobile
phone technologies, once people adopted a technology, they either formed a latitude of
accepting or rejecting it. Ideas that fall within latitude will be favourably received while
those falling outside the zone will not.
Messages that fall within the latitude of acceptance tend to be seen as more consistent
with one’s position than they actually are. This process is called an assimilation effect. On
the other hand, messages that fall within the latitude of rejection tend to be seen as even
further from one’s position that they actually are, resulting in a contrast effect. A
consumer or farmer in this case accepts fewer ideas that are removed from his or her own
position and tends to oppose even mildly divergent position.
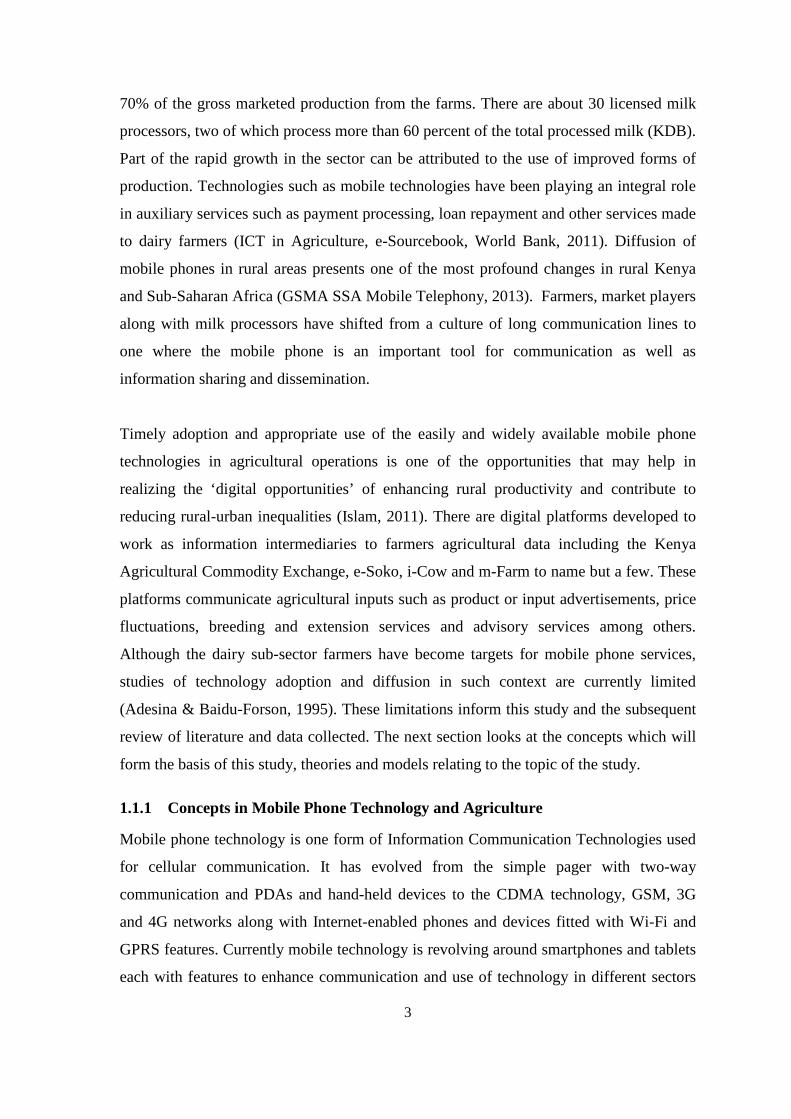
2.2.4 Technology Acceptance Model
This model is an extension of the Theory of Reasoned Action (Fishbein and Ajzen, 1980).
It proposes to explain why users accept or reject and use a technology. It suggests that
when consumers or users are presented with a new technology, there are a number of
factors which influence their decision on how and when they will use it explained by the

13
following two constructs; Perceived usefulness – defined as ‘ the degree to which an
individual believes that using a particular system would enhance his or her job
performance; Perceived ease-of-use – outlined as ‘the degree to which a person believes
that using a particular system would be free from physical and mental effort (Davis,
1989).
Figure 1: Technology Acceptance Model
According to the theory, an individual’s use of a technology is influenced directly or
indirectly by the user’s behavioural intentions, attitude, perceived usefulness of the
system and perceived ease of the system. It also suggests that external factors affect
intention and actual use through mediated efforts on both perceived usefulness and
perceived ease of use (Davis, Bagozzi and Warshaw, 1989).
2.2.4 Unified Theory of Acceptance and Use of Technology (UTAUT) Model
This is a model to describe user acceptance of information technology. It aims to explain
user intentions of an information system and subsequent usage behaviour (Venkatesh et
al, 2003). It holds that the following four constructs; effort expectancy, performance
expectancy, social influence and facilitating conditions; are direct determinants of usage
intention and behaviour. The model suggests that gender, age, experience and
voluntariness are posited to mediate the impact of the four constructs on usage intention
and behaviour. The theory holds that the four key constructs are direct determinants of
usage intention and behaviour. Gender, age, experience, and voluntariness of use are
posited to mediate the impact of the four key constructs on usage intention and behaviour.
Many user acceptance models with different determinants exist to measure the user
agreement of information systems which is an important factor to indicate a system
14
success or failure. These models have been widely tested to predict user acceptance. No
comprehensive instrument to measure the variety of perceptions of information
technology innovations had existed until the UTAUT model attempted to review and
compare the existing user acceptance models with an ultimate goal to develop a unified
theory of technology acceptance by integrating every major parallel aspect of user
acceptance determinants from those models (Venkatesh et al. 2003 and Sundarajev,
2009). The key constructs of performance expectancy, effort expectancy, social influence
and facilitating conditions can be applied to this study. This makes UTUAT a more
relevant model to this study as compared to TAM.
2.3 Types and the Uses of Mobile Technology in Agriculture in Kenya
Mobile technologies in review for this study will include cell phones, smartphones,
tablets, hand-held devices, PDAs and computing devices. Mobile devices have been used
to perform weather monitoring from remote areas. This is through a solar-powered
wireless network from the fields to local users through WLAN and to remote users via the
cellular network and the Internet (Gichamba and Lukandu, 2012). Mobile technologies
have been used for geo-referenced environmental monitoring (Vivoni and Camilli, 2003).
This was through a wireless prototype system to acquire, store, display and transmit real-
time geo-referenced environmental data between multiple field teams and remote
locations. SMS applications have been adopted too. Farmers use these applications to
interact with experts and systems to receive weather updates, information on best
practices on sectors of agriculture. An SMS service that brings information on demand
and supply to farmers and extensions workers has been developed in Uganda (Hellstrom,
2010).
In Kenya, Kilimo Salama - Swahili for ‘Safe Agriculture’- is an initiative by Syngenta
Foundation for Sustainable Agriculture in partnership with UAP Insurance and Safaricom
Limited to support farmers in dealing with weather risks by developing and piloting
agricultural micro-insurance products (Webb, 2010; Aker and Mbiti, 2010). Kenya
Farmers Helpline is another form of mobile platform that has had an impact on farmers.
Through a call centre, farmers are able to interact and talk with agricultural experts from
across the country on various agricultural issues (Murray, 2010). NLMIS is also an
enterprise created for pastoralists and cattle traders in Kenya to access market trends on

15
cattle and dairy farming. This is from the now defunct Ministry of Livestock, currently
housed under the Ministry of Agriculture (Mwangi, 2010). Angaza Kilimo is web-based
and text-messaging system developed by FarmChem-a Kenyan agricultural input
company in partnership with ICT4D and USAID in 2010. It targets existing and potential
customers by giving them tips on farming and strategies to help them increase their yields
and profits. It also allows farmers to give feedback on products and identify farmer field
days near them. It helps locate the nearest authorized retailer, updates on new products
and ordering of products directly to their nearest dealer. Distributors can also access the
system to place orders directly from FarmChem. By 2012, the system had 50,000
registered farmers and other individuals with access to useful information on inputs and
production (FarmChem Kenya and USAID, 2012).
Kenya Agricultural Commodity Exchange developed a text-messaging service SMS
Sokoni in partnership with mobile services provider, Safaricom. This helps farmers
across the country to access up-to-date and reliable market information on prices and
commodity offers at an affordable rate via mobile. In 2006, average monthly usage stood
at 1,273 and by 2008, the usage had increased to 24,716 users. This indicates the potential
of such solutions and the usefulness in accessing market information and linkage systems.
M-Farm is a mobile subscription service aiming to improve the agricultural sector in
Kenya by connecting farmers through peer-to-peer collaboration to improve market
information and enhance learning opportunities. The application offers price information,
ways for farmers to sell their crops collectively and to buy farm inputs together by use of
their mobile phone or through the website (Donovan, 2013). i-Cow is another mobile
service that helps dairy farmers to track their animals on breeding, nutrition, milk
production efficiency among other dairy best practices. It also assists access animal health
specialists and extension service on the nearest veterinarian or artificial insemination
specialist through text messaging or the Web. The application also has a platform where
farmers can trade livestock and related products on their phones (Macharia, 2013).
According to a GSMA 2013 report, Kenya leads other countries in Africa in developing
and deploying mobile agricultural services. By December 2013, there were 17 such
services compared to 5 in Uganda, 4 in Ghana, 3 in Senegal and Zambia respectively.
This shows the potential in mobile technologies in changing and affecting agricultural
practices in the country.

16
There is existing available data in Kenya to support the adoption of mobile phone
technologies in agriculture. The data focuses more on credit access using the mobile
while others have focussed on diffusion of animal rearing with initiatives like Kuza
Biashara (ICT Authority, 2012). In addition, there are proposals to set up an electronic
animal monitoring system to provide end-to-end data on farm animal produce (ICT
Authority White Paper 2014). However other studies in Swaziland and Bangladesh were
used to understand the role and factors that lead to adoption of mobile technologies.
Empirical data from these studies demonstrates the existence of agricultural market
information systems and the use of mobile phones by farmers in Bangladesh. Evidence
also demonstrates the existence of persistent poverty traps which lead to lower adoption
rates of technologies in under-developed countries (Mulford, 2013).
Summary
The studies aforementioned have covered different aspects of mobile telephony and
adoptability of the technologies. This is captured by the tool of data collection in this
study. Aspects such as how mobile technologies have helped improve productivity, act as
a source of information and aided in payment models are captured unlike previous
studies.

17
CHAPTER THREE: RESEARCH METHODOLOGY
3.1 Introduction
The chapter defined the proposed research method to be used in conducting the study.
This included the research design, target population, sampling design and procedures,
data collection and techniques for analysing data.
3.2 Research Design
A research design is a blueprint for conducting a study with maximum control over
factors that may interfere with the validity of the findings (Burns and Grove, 2003). This
research used the descriptive research design which involved acquiring information about
one or more groups of people about their characteristics, opinions, attitudes and previous
as well as current experiences. This design was concerned with finding out who, what,
when, which, where and how of a phenomenon (Cooper, R. and Schindler, S. 2008).
3.3 Population of the Study
The population of importance for the study comprised of Kenyan adult males and females
engaging in smallholder dairy farming within Limuru Sub-County. A target population is
described as a complete set of individual cases with some common characteristics to
which researchers want to generalize the results of the study (Mugenda and Mugenda,
2003). The Sub-County is composed of 5 county assembly wards and population as
follows; Bibirioni, Limuru Central, Limuru East, Ndeiya and Ngecha Tigoni with a total
population of 131,132 (Kenya National Census, 2009). The sub-county was the area of
interest due to the concentration of dairy farmers. The area also has active co-operative
societies and milk processors who provided additional information to assist data availed
by the respondents.
3.4 Sample Design
The sample was identified using a stratified random sampling method. However to
identify and capture the individual farmers or households, sampling was done in two
phases. The first was proportional, that is according to the number of farmers in a given
cluster or stratum, then random sampling was undertaken within that stratum. Survey
strata was dependent on the administrative boundaries of the sub-county. These identified
the random sample of farmer households.

18
A sample of 125 was proposed for this study, divided according to the number of farmer
households proportionate to the population in each of the 5 county wards. Rosco (1975)
proposes a rule of thumb for determining a sample size and posits that a sample size of 30
- 500 is appropriate for most academic researches. Within these limits (30 to 500), the use
of a sample about 10% size of parent population is recommended. The primary tool for
collecting data was the questionnaire. The respondents were selected through sample
sizes weighted by household estimates extrapolated from the 2009 census figures.
Households were selected using to a random sampling procedure using transects between
randomly selected landmarks in each sample community (Staal & Baltenweck, 2002).
The Table below represents the Sample Representation in the 5 assembly wards in the
Sub-County;
NAME OF
ASSEMBLY WARD
POPULATION (Kenya National
Population Census, 2009)
% of Total
Population
Sample
Bibirioni 21,202 16% 20
Limuru Central 31,211 24% 30
Ndeiya 26,387 20% 25
Limuru East 28,348 22% 27
Ngecha Tigoni 23,984 18% 23
TOTAL 131,132 100% 125
Table 1: Population of Limuru Sub-County (Kenya Census, 2009) and Proposed Sample
3.5 Data Collection
The farmer household respondents were accessed in the farms within the divisions or
constituencies (strata) through household questionnaire administration (see appendix 2).
The primary data was collected using structured questionnaires, administered to the
respondents per stratum comprising of Kenyan male and female adults who were
accessed in their farms and through their respective co-operative societies and milk
processors. Administration of questionnaires was through both drop and pick method as
well as one-on-one interviews.
19
The questionnaire was divided into four sections; with section I consisting of general
information about the respondents, section II, III and IV consisting of questions relating
to the dairy farming, mobile technologies and their applicability and attitudes and
behaviour towards the technologies in dairy farming and related services.
3.6 Data Analysis
Data collected was analysed using both descriptive and inferential indicators. Descriptive
indicators included frequencies, percentages, means and standard deviation. They were
used to describe the socio-economic characteristics of smallholder farmers. Descriptive
statistics enable meaningful description of a distribution of scores or measurements using
a few indices or statistics. Measures of central tendency yield the expected score or
measure from a group of scores in a study (Mugenda and Mugenda, 2003). Tables and
figures were used to illustrate trends especially performance indicators such as the size of
the herd or number of animals, milk production and income levels.
It provided profiles of the dairy farmers on ownership or access to mobile phones and
related services, frequency of use of the phones and mobile services, rating of usefulness
of these services, supplementary services such as mobile money and insurance among
others. Borg (1996) proposes that a descriptive research design is a logical and valuable
way of looking at the world. Measures of variability, such as standard deviation, inform
the analyst about the distribution. Frequency distribution showed a record of the number
of times a score or record of the number appears. The analysis tool explained the
variables, codes and the data items. The SPSS program was used to analyse the data and
output presented in form of tables, pie charts and bar graphs as well as analyse the factors
that are seen to affect the adoption of mobile phone technologies.
3.7 Summary The area of study offered a glimpse of the dairy farming industry. It also offered a good
spread of usage of mobile phone technologies. The area has fair penetration of mobile
network. The sample picked was representative of the population. The data collection tool
was tested and adapted to the study. The data was adequate enough for analysis and
reporting.
20
CHAPTER FOUR: DATA ANALYSIS
4.1 Introduction Data analysis was guided by the research objectives presented in chapter one. The report
contains tables directly related to the research objectives which were primarily on the
existence, adoption and flow of mobile technologies in the dairy industry. SPSS was also
instrumental in the analysis especially in attempting to find the correlation between
demographics and variables of study.
4.1.1 Response Rate The reverted questionnaires were cleaned, edited and coded. Out of the 125
questionnaires distributed 2 were not returned; 3 were incomplete allowing for 5 new
interviews in the respective areas thus leading to a response rate of 100% good enough to
facilitate data analysis. The success rate in questionnaire response was aided by
explaining to participants the importance of the study and assuring them of confidentiality
and benefit of the findings. The researcher deemed the response rate adequate and
sufficient for the study and for the purpose of data analysis.
4.2 General Farmer Information The information collected from the questionnaires consisted of demographic
characteristics of respondents, financial status and mobile phone technologies
adoptability.
4.2.1 Sample Demographics The demographic characteristics of respondents are discussed and analysed in details as
marital status, age in years, gender, respondent’s occupation, household expenditure and
highest level of education.

21
Table 4.1 Marital Status of the Respondents
Marital Status Frequency Percent Married 76 60% Single 47 38% Divorced 1 1% Widowed 1 1%
Total 125 100% Table 2: Marital Status
Source: Author (2015)
Majority of those sampled were married 72 with a percentage of 60% followed by the
single ones at 51 respondents contributing 38% while only 1 person each was divorced
and widowed at an approximate percentage of 1% respectively.
Table 4.2 Age of the Respondents
Age (in Years) Frequency Percent 19-29 74 59% 30-39 24 19% 40-49 14 11.5% 50-59 9 10.5% Total 125 100% Table 3: Age Bracket
Source: Author (2015)
A fair majority of the respondents interviewed, 59% were in the age bracket of 19 - 29
years followed by those in the age bracket of 30 - 39 years at 19% then 40 -49 years at
11.5% with the final 10.5% aged between 50-59 years. The analysis shows that most of
the respondents were single giving an indication of the youthful population in the county.
Table 4.3 Gender
Gender Frequency Percent Male 94 75% Female 31 25% Total 125 100% Table 4: Gender Source: Author (2015)

22
75% of the respondents were male and 25% of the respondents were female, implying
that there were more males in the study area.
Table 4.4 Employment Status
Employment Status Frequency Percent Full-time 39 31.2% Business 27 21.6% Student 23 18.4% Part-time 20 16% Retired/Unemployed 15 12% Government 1 0.8% Total 125 100% Table 5: Employment Status
Source: Author (2015)
31.2% of the respondents were employed full-time, while 21.6% were in business.
Students comprised of 18.4% of the sample while part-timers were 16% and those retired
or unemployed were 12%. Government employees was at 0.8%.
Table 4.5 Household Monthly Income
Household Income per Month (in
Frequency Percentage Below 15,000 75 60% 15,001 - 50,000 32 26% 50,001 – 85,000 12 9.6% 85,001 – 120,000 5 4% More than 120,000 1 0.4% Total 125 100% Table 6: Household's Head Income
Source: Author (2015)
A fair proportion of the respondents at 60% indicated that they earn a monthly income of
below KES 15000 followed by those between KES 15001 and 50000 at 26%. Those
earning between KES 50001 and 85000 were at 9.6% of the respondents. 4% of the
respondents were said to earn between KES 85001 and 120000. Only 0.4% or 1
respondent of the total sample earned more than KES 120,000.

23
Table 4.6 Level of Education
Education attainment Frequency Percentage College/University 91 72.8% Secondary 23 18.4% Primary 6 4.8% Post-graduate 4 3.2% Self-taught 1 0.8% Total 125 100% Table 7: Level of Education
Source: Author (2015)
From the sample, 72.8% of the respondents have attended college or university; 18.4%
secondary; 4.8% primary school while 3.2% have attained post-graduate qualifications
and only 0.8% were self-taught.
Table 4.7 General Farmer Information per Assembly Ward
The demographic characteristics of respondents were discussed and analyzed in terms of
marital status, age in years, gender, respondent’s occupation, household income and
highest level of education then cross tabulated with respect to the five assembly wards
used for the study.
Limuru County: Summary of Assembly Wards and their Percentages
Lim
uru
Cen
tral
Lim
uru
Eas
t
Nde
iya
Nge
cha
Tig
oni
Bib
irio
ni
Marital
Status
Married 57% 48% 72% 74% 35% Single 40% 48% 28% 26% 65% Divorced - 4% - - - Widowed 3% - - - -
Age 19-29 yrs 63% 67% 40% 43% 80% 30-39 yrs 30% 26% 36% 35% 20% 40-49 yrs 7% 4% 8% 4% - 50-59 yrs - 4% 16% 17% -
Gender Male 80% 48% 48% 48% 65% Female 20% 52% 52% 52% 35%

24
Occupation Full-time 37% 30% 32% 30% 25% Business 23% 19% 24% 22% 20%
Student 17% 19% 12% 26% 35% Part-time 20% 7% 16% 13% 10% Retired/Unemployed 3% 22% 16% 9% 10% Government - 4% - - -
Household
Income per
Month
Below KES 15000 60% 56% 60% 57% 65% KES.15001-50000 30% 37% 16% 13% 35% KES.50001-85000 10% 4% 16% 22% - KES.85001-12000 - - 8% 9% - Over KES.120000 - 4% - - -
Education College/University 67% 78% 68% 78% 75% Secondary 23% 19% 24% 5% 5% Primary 10% - 4% 17% 10% Post-Graduate - - 4% - 10% Self-taught - 4% - - -
Table 8: Summary of Assembly Wards
Ngecha Tigoni and Ndeiya had the highest population 74% and 72% respectively of those
married and the rest 26% and 28% being single in the two sub-counties; this was followed
by Limuru Central 57% and Limuru East at 48% while Bibirioni had 65% singles. On age
groups the most predominant age group across all sub-counties was 19 - 29 years with
Bibirioni having the highest 80% hence clarifying the reason for high percentage of those
who were single. Limuru Central and Bibirioni had the highest percentage of male
respondents at 80% and 65% respectively. Limuru East, Ndeiya and Ngecha Tigoni had
52% each of their respondents being female. 37% of the respondents in Limuru Central
were in full employment while 32% in Ndeiya were fully employed, 30% of those in
Limuru East too. 65% of households in Bibirioni earn than KShs. 15,000 in a month
while 60% in Limuru Central and Ndeiya also earn below KShs.15000 in a month. The
highest level of education for majority of the respondents was a college certificate or
university degree showing high levels of literacy in the constituencies particularly in
Limuru East and Ngecha Tigoni where 78% were college certificate or university degree
holders followed by Bibirioni 75%, with Ndeiya and Limuru Central having respectively
68% and 67% of their respondents respectively graduating from a college or university.

25
4.3 Dairy Farming – Ownership, Milk Production, Commercial Activities and
Related Activities
This information was collected to confirm the ownership of dairy animals, types of dairy
animals, length of time farmer has been in dairy farming and what type of dairy farming
they practice. The information will also show amount of milk produced, where milk
produced is sold and earnings from the same.
Table 4.8: Animal Ownership
Number of Animals Frequency Percentage Between 1- 5 animals 93 74.4% 6 -10 animals 23 18.4% 11 -15 animals 3 2.4% 16-20 animals - - More than 20 animals 6 4.8% Total 125 100% Table 9: Animal Ownership
From the data collected, the highest number of respondents kept between 1 to 5 animals at
74.4%, 18.4% of the respondents kept between 6-10 animals while 4.8% have more than
20 animals and 2.4% have 11 to 15 animals.
Table 4.9 Types of Dairy Animals
Type of Animal Frequency Percentage Cows 111 88.8% Goats 9 7.2% Others 3 2.4% Sheep 2 1.6% Table 10: Type of Dairy Animal
A large majority of the respondents’ rear cows for dairy farming at 88.8%, while 7.2%
kept goats, 1.6 reared sheep while 2.4% kept other animals.

26
Figure: Number of Years Engaged in Dairy Farming
0 20 40 60 80
3-6 years
6-9 years
9-12 years
Less than 3 years
More than 12years
How long have you been involved in dairy farming?
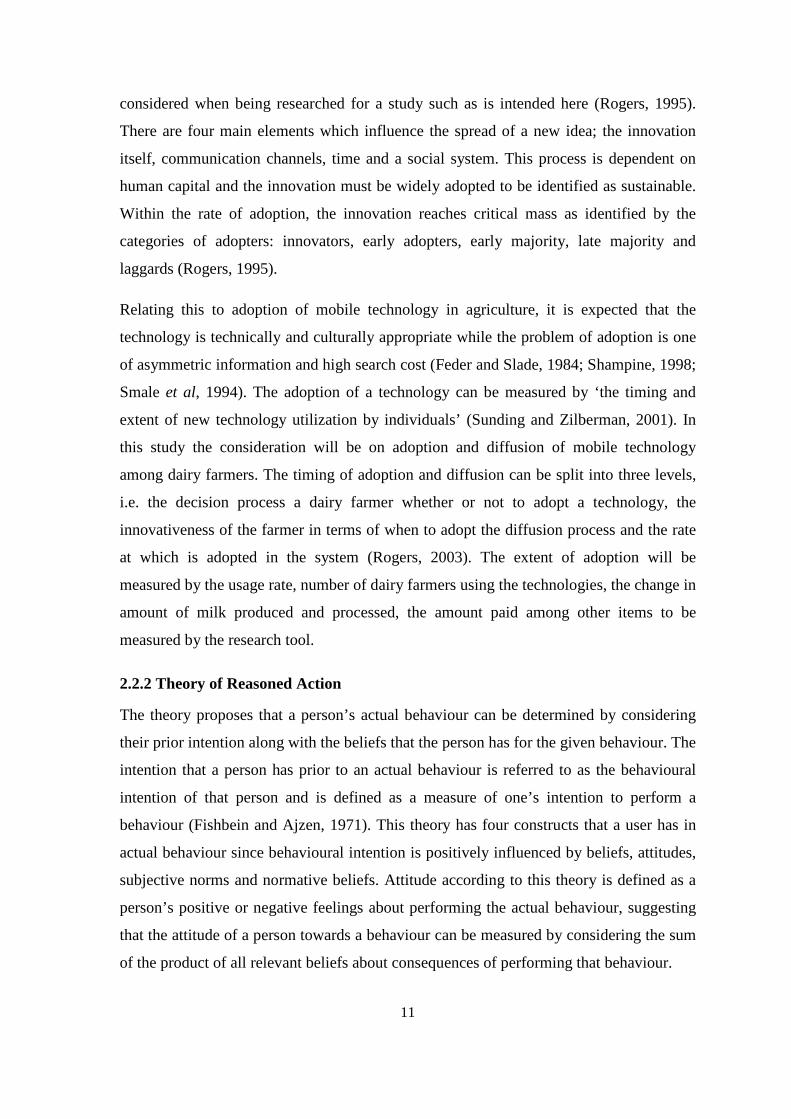
Figure 2: Number of years in Dairy Farming
Majority of the respondents interviewed indicated engaging in dairy farming for between
3 to 6 years at 54.4%, with another 30.4% having started dairy farming less than 3 years
ago. 7.2% have done dairy farming for between 6 to 9 years.
Figure 3: Farming practises including Dairy Farming

27
From the figure and data collected, 70.4% of the respondents indicated engaging in mixed
farming, 14.4% are in subsistence farming while 8.8% exclusively keep dairy animals
with the remaining 6.4% being in commercial farming.
Figure: Total Milk Production of all Dairy Animals
From the data collected, 62.4% of the respondents indicated producing a total of 10 to 50
litres per day. 17.6% produce less than 10 litres, with 15.2% producing 50 to 100 litres of
milk per day from their farms.
4.5 Mobile Phone Technologies – Attitudinal and Behavioral Measurement
4.5.1 Mobile Phone Technologies Adoptability
The data collected from the respondents indicated all of them owned a mobile phone of
one kind. 54.4% of the respondents owned a smartphone with 45.6% owning a feature
phone. However only 72.8% of the respondents use the mobile phone or related
applications for dairy farming and related activities such as veterinary services, payments
and dairy farming education. 57.6% of the respondents indicated using a mobile phone or
application in the last 12 months.

28
Table 5.0 Mobile Phone Applications Usage
Mobile Phone Application Frequency Percentage Kilimo Salama 35 41% i-Cow 30 35% SMSSokotext 14 16% m-Farm 6 7% TOTAL 85 100% Table 11: Mobile Phone Applications
From table 5.0 above, 84 respondents had used a mobile phone application of one kind or
another. 41% of the respondents using mobile phone applications had used Kilimo
Salama, 35% used i-Cow, 16% used SMSSokotext meaning only 7% used m-Farm for
their dairy farming practices.
4.5.2 Mobile Phone Technologies Attitudes and Behaviour The study also sought to gauge the respondents’ attitudes towards mobile phone
technologies which includes feelings towards their current uses and future adoption. The
study used semantic differential scale and Likert scale to establish the attitudes and
behaviours of different attributes regarding mobile phone technology. From the responses
a majority of the respondents indicated that they had positive feelings by the number of
percentages based on the specific questions asked.

29
Using Factor Analysis, the findings of the study were as follows;
Table 5.1: Factor Analysis of Mobile Phone Technology Adoption Components
Factor/Component Description
1. Necessity: The mobile phone is important in my dairy farming
2. Innovations: The mobile phone has changed the way I practice dairy farming
3. Information: Mobile phone technologies provide relevant information relating to
dairy farming
4. Productivity: Mobile phone technologies have helped me increase the produce from
the dairy animals
5. Savings: Mobile phone technologies have helped save costs of dairy farming
operations
6. Affordability: Mobile phone technologies are expensive to use
7. Penetration: I intend to use a mobile phone technology in the next 6 months
8. Reliability: I will always use a mobile phone technology
9. Relevance: Using mobile phone technologies makes no difference in my dairy
farming
Table 12: Factor Analysis of Adoption Components
Using answers given by the respondents on the Likert scale component of the
questionnaire, a factor analysis was undertaken and is postulated in two tables starting
with the table above. The study revealed that four of the nine factors had an over 50%
explanatory power in the respondents’ decision to adopt mobile phone technologies.
These four factors were namely innovations, reliability, penetration and relevance, were
the dominant reasons given for the decision to acquire mobile phone technologies, as
shown in table 5.2 below. To a large extent, the adoption of mobile phone technologies by
the dairy farmers in Limuru was driven by the innovations made in mobile phone
technologies which changed the way they practice their dairy farming for the better. The
farmers were also of the view that mobile phone technologies were reliable and as such
they would continue to use and adopt them in the foreseeable future. This would ensure
penetration of these technologies in the dairy farming sector.

30
Table 5.2: Total Variance of Components Explained
Table 13: Component Analysis
However there was also a sizeable number of respondents who were of the view that the
use of mobile phone technologies did not make much different in their dairy farming.
This is evidenced in the fact that 74% of the respondents were engaged in mixed farming
thus giving the likelihood that they adopted mobile phone technologies to a greater extent
for the crop husbandry as opposed to animal husbandry.
4.6 Summary and Discussion of Findings
The findings indicated those sampled were largely male at 75% and were married (60%)
showing they have households and dependents. Their age bracket was between 19-29
years at 59% showing that they are fairly youthful with a monthly income of below KSh.
15000 signifying little or no disposable income. From the sample findings it does indicate
that the respondents have mobile phones whether they are basic feature phones or
smartphones which are slightly more expensive and adaptable to mobile phone
applications. The outcomes also point to the use of mobile phone technologies in
improving their farming – be it dairy farming or mixed farming as respondents indicated
they do. A larger percentage of those respondents using mobile phone applications were
using them for animal health services and information on improving the animals they
own. It is still yet to be seen what impact mobile phone technologies have in the
Total Variance Explained Factor/ Component
Initial Eigenvalues Rotation Sums of Squared Loadings Total % of Variance Cumulative % Total % of Variance Cumulative %
Innovations 3.972 44.131 44.131 1.265 14.054 14.054 Reliability 1.169 12.989 57.121 1.131 12.570 26.625 Penetration .985 10.944 68.065 1.062 11.795 38.420 Relevance .829 9.212 77.277 1.058 11.761 50.180 Information .645 7.163 84.440 1.045 11.608 61.788 Affordability .504 5.604 90.044 1.039 11.545 73.333 Necessity .484 5.380 95.424 1.022 11.360 84.692 Productivity .262 2.912 98.335 1.019 11.325 96.017 Savings .150 1.665 100.000 .358 3.983 100.000 Extraction Method: Principal Component Analysis.

31
marketing and more commercial aspects of dairy farming. From the study, the adoption of
mobile phone technologies by the dairy farmers in Limuru was driven by the innovations
made in mobile phone technologies as indicated by the factor analysis variance of 44%.
Reliability was also a major factor in adoption of the technologies due to the ease of
relaying and obtaining information by mobile phone. Penetration is the third main factor
indicating the mobile telephony penetration across the county.

32
CHAPTER FIVE
SUMMARY AND CONCLUSIONS
5.1 Introduction
This chapter summarizes the major findings of the study, conclusions, limitations of the
study and recommendations for further research. The overall objective of the study was to
determine existence, adoption and flow of mobile phone technologies in the dairy
industry. Specific objectives were to establish the proportion of farmers engaging in dairy
farming who have adopted mobile phone technologies, investigate the factors that affect
the adoption of these technologies as well as determine the constraint and challenges
facing dairy farmers in adopting the mobile phone technologies.
5.2 Summary of Findings
The study findings do establish and indicate the existence of mobile phone technologies
in the dairy farming industry. These technologies range from animal health services, to
general dairy farming information as well as those that help marketing and selling of
dairy products. The respondents did also indicate using the mobile phone for basic
services such as calling veterinary and extensions service officers. They also use mobile
money services from their respective mobile network providers to be able to facilitate
their farming operations. The findings noted that 75% of all respondents were male. The
data also indicated that 60% of the respondents were married showing the role of farming
in most households. Indicative from the findings was the fact that 72.8% of the
respondents had education level of college or university level. Over 85% of the
respondents indicated engaging in dairy farming of cows with the other 15% keeping
goats and sheep. This is due to the amount of milk produced which was recorded at
mainly between 5-20 litres per animal per day at 58.4%.
The study was able to determine the factors that affect mobile phone technologies
adoption with innovations being the most important influence. Answering to the
statement, ‘The mobile phone has changed the way I practice dairy farming’, 83% of the
respondents agreed that the technologies will have an impact in their dairy farming. Other

33
factors seen determining the adoption include reliability, penetration, relevance and
information. 81.6% of the respondents either agreed or strongly agreed that mobile phone
technologies provide relevant information relating to dairy farming. It is also noted that
100% of the respondents from the sample had mobile phones of one or another type.
Some of the constraints for adopting mobile phones were identified as income levels
meaning less of disposable income to buy innovative mobile phone handsets. This is
evidenced from the income levels of the respondents with 60% of them indicating an
income of less than KSh. 15000 per month. The type of phone as well as the lack of
extension and dairy information platforms offered by the mobile network providers.
While some mobile networks have a mobile technology of one or the other type, others do
not have any mobile application or information portal for farmers. Interestingly 58.8% of
the respondents reported owning a smartphone showing that there is an opportunity for
those willing to develop mobile applications and appeal to such farmers. This can be
corroborated by the data which indicates that 59% of all respondents were between the
ages of 19 -29 years.
The study indicated that dairy farmers would look to adopt mobile phone technologies to
look at animal health, payment schemes as well as milk sales and general information.
This is shown from the data where 30% each of the respondents answered in the
affirmative of intending to use mobile phone technologies for both animal health and
payment systems. The data showed that respondents would like mobile applications
developed for animal health (28.8%), general dairy farming information (24%) as well as
milk production improvement practices (24%) respectively. The findings also saw that
68% of the respondents are using one form of mobile application such as Kilimo Salama,
i-Cow, SMSSokotext or m-Farm to get information or improve their agricultural practice.
5.3 Conclusions
The study concludes that the adoption of mobile phone technologies in Limuru Sub-
county is influenced by the innovation around the technologies, their reliability,
penetration, relevance and information offered. Other factors shown to influence this
adoption include; affordability, necessity, productivity and savings. The findings also
show that there is a significant level of usage of mobile phone applications such as
Kilimo Salama, i-Cow, SMSSokotext as well as m-Farm to source for information on
dairy farming as well as on general agricultural practices. The study also found a high

34
penetration of mobile telephony within the county showing that there is a huge potential
for mobile phone technologies currently in use or intended to be developed in future.
5.4 Recommendations for Policy, Theory and Practice
The researcher recommends that innovators and technology enthusiasts still have a
largely untapped market in mobile phone technology development. From mobile
applications that maybe embedded in the operating systems of mobile phones to services
that maybe prescribed using short text codes or USSDs. From the study it is indicative
that a large number of farmers do intend to use these technologies once availed and
customized to suit their farming needs. These needs include animal health, milk
production and milk sales, insurance, marketing and selling as well as general dairy
farming information. With regards to factors influencing the adoption of mobile phone
technologies, it can be noted that how innovative a technology is remains as the most
important consideration by farmers in adopting them. The other major factors include
reliability given that most farmers would prefer a reliable technology, penetration or how
widespread it is in its location, relevance and information. It is important to note that
there are mobile phone technologies already in existence but there seems to be a void that
these technologies have not filled for Limuru Sub-County farmers.
It is important to note too to mobile phone technology firms which either develop
hardware (the handsets and related gadgets) as well as mobile network providers that they
can partner with innovative developers of mobile technologies who can leverage on their
brand names or network coverage to be able to provide additional information on the
same. This is the case with i-Cow which leveraged its relationship with one of the mobile
network providers to be able to appeal to a larger number of farmers in the sub-county
and across the country too. Milk processing firms should capitalize and incorporate some
of these mobile technologies which farmers can learn or adopt through their networks.
These can be from the extension services offered – veterinary and vaccines; milk
collection and delivery; milk processing and marketing and finally selling of the final
processed products. Milk processors such as Brookside Milk, Kenya Co-operative
Creameries as well as Githunguri Dairies each operate within the area of study and have
some amount of influence in the way farmers adopt and use different products and
services. Savings and Credit Co-operative Societies would also be used to facilitate the
adoption of mobile technologies through innovative financial products and tools such as

35
animal health insurance services and payment services to the dairy farmers. The Dairy
Board of Kenya had proposed the development of eDairy (2010), an innovative
application in ICT proposed to help achieve self-sufficiency in national milk production.
This was meant to minimize cost and time while improving on efficiency. This innovation
would have both the web and mobile technology using online and SMS services to lure
young and seasoned dairy farmers in using the application. Development and deployment
of such an innovation to sub-counties such as Limuru would realize the quick adoption of
mobile technologies.
5.5 Recommendations for Further Study
Certain that a large majority of respondents in Limuru Sub-county do show the
adoptability of mobile phone technologies, it is recommended that use of these
technologies be widely spread across the wards in the sub-county. The adoption could be
largely driven by innovation, reliable services and applications, resourceful and helpful
sources of up-to-date information. Also given that initially the study was limited to dairy
and animal husbandry, there is an indication that farmers in food and cash crop farming
are using mobile applications for improving their produce and selling practices.
Additional studies can be done to establish factors that are aiding in use of mobile phone
technologies in crop farming more than is the case in dairy farming. Comparative studies
on the adoption of mobile phone technologies in animal husbandry and crop farming can
be done to determine which one has a higher adoption rate than the other and why.
5.6 Limitations of the Study
One major limitation of the study was accessing the right person to respond to the
questionnaire. This was due to the fact that most of them were either employed full-time
or part-time and are not exclusively dairy farmers. Still on the respondents, a number of
them did not have proper records such as the amount of milk produced or sold which
would be used to verify the changes in milk productivity from the time they started using
mobile phone technologies to the current state. The researcher had also intended to carry
out a mobile survey to validate the data given from the questionnaire but this proved
futile due to time constraints and the size of sample intended for the study from each of
the wards.

36
REFERENCES: Adongo, M.J (2013), The Role played by Mobile Phone Communication in Diffusion of
Dairy Goats Rearing in Kitui County, Kenya. University of Nairobi
Ajzen, I. and Fishbein, M. (1980), Understanding Attitudes and Predicting Social
Behaviour. Englewood Cliffs, NJ: Prentice Hall
Ajzen, I. (1985), From Intentions to Actions: A Theory of Planned Behaviour. In J.Kuhl
and J. Beckmann (Eds), Action Control: From Cognition to Behaviour. New York;
Springer-Verlag.
Aker C. Jenny. (2010), Dial “A” for Agriculture: Using Information and Communication
Technologies for Agricultural Extension in Developing Countries. Tufts University
Aker, J. (2010). Information from markets near and far: Mobile phones and agricultural
markets in Niger. American Economic Journal: Applied Economics, 2, 46-59
Aker, J. and Mbiti, I. (2010). Mobile phones and economic development in Africa.
Journal of Economic Perspectives. 24(3): 207-32
Angaza Mkulima: Customer relationship management and agricultural information.
Farmchem Kenya, 2012. http://www.angazamkulima.com
American Marketing Association. Resource library, Electronic document Retrieved from
https://www.ama.org/publications/MarketingNews/Pages/your-mobile-moments-are-
shrinking.aspx
Bhattacherjee. A (2001). Understanding Information Systems Continuance: an
Expectation-Confirmation Model. MIS Quarterly 25(3), 351-370
Bhattacherjee. A and Premkumar, G (2004). Understanding Changes in Belief and
Attitude toward Information Technology Usage: A Theoretical Model and
Longitudinal Test. MIS Quarterly 28 (2), 229-254
Bolarinwa, K.K., and Oyeyinka, R.A (2011). Use of Cell Phone by Farmers and its
Implication on Farmers “Production Capacity in Oyo State, Nigeria”
Boyd, Jr. H. Westfall, R. and Stasch, S. (2004), Marketing Research. 7th Ed. Richard D.
Irwin Inc
Cooper, R.D. and Schindler, S.P (2008) Business Research Methods, McGraw-Hill
Communications Authority. Quarterly Sector Statistics Report, Q4 2013/14, April-June
2014

37
Crandall, A. Kenyan Farmers’ Usage of Cell Phones: Calling preferred over SMS,
published on i-Hub Research website:
http://www.research.ihub.co.ke/pages/resources.php
Crossbow Technology (2004). Smart Dust/Mote Training. Paper presented at Crossbow
Technology Seminar, San Francisco, California
Davis, F.D., R.P. Bagozzi, and P.R., Warshaw, "User Acceptance of Computer
Technology: A Comparison of Two Theoretical Models," Management Science, 35,
8 (1989), 982-1003
Donner, J. (2008). Research approaches to mobile use in the Developing World: a Review
of the Literature. The Information Society 24 (3), 140-159.
Feder, G. and Slade, R. (1984). The Acquisition of Information and the Adoption of New
Technology, American Journal of Agricultural Economics, 66 (3), pg. 312-320
Ghandi, S., Mittal, S. & Tripathi, G. 2009. “The Impact of Mobiles on Agricultural
Productivity.” Paper prepared for Vodaphone, Indian Council for Research on
International Economic Relations (ICRIER), New Delhi
Gichamba, A. and Lukandu, I. A (2012). A Model for Designing m-Agriculture
Applications for Dairy Farming. The African Journal of Information Systems Vol 4,
Issue 4
Granot Y, Ivorra A, Rubinsky B. (2008). A New Concept for Medical Imaging Centred
on Cellular Phone Technology. PLoS ONE 3(4): e2075.
doi:10.1371/journal.pone.0002075
GSMA, mAgri Airtel Kilimo Programme (2015)
GSMA, The Airtel Kilimo Case Study (2014)
Hellstrom, J. (2009). Mobile phones and good governance – challenges and the way
forward. Stockholm University
Islam, Sirajul. M and Gronlund, A (2011). Factors influencing the Adoption of Mobile
Phones among the Farmers in Bangladesh: Theories and Practices. International
Journal on Advances in ICT for Emerging Regions, pg 4-14
ICT in Agriculture- Connecting Smallholders to Knowledge, Networks and Institutions,
World Bank e-Sourcebook, Report 64605, (2011)
Kenya Census Report (2009)
Kenya National Dairy Masterplan – Volume 1 – A Situational Analysis of the Dairy Sub-
Sector, Ministry of Livestock Development, (2010)

38
Kibera, F., and Waruinge, B.C. (1998), Fundamentals of Marketing: An African
Perspective, Kenya Literature Bureau, Nairobi
“Kilimo Salama becomes ACRE, retrieved from
http://www.syngentafoundation.org/index.cfm?pageID=562 on 2nd October, 2014
Kothari, C.R. (2004), Research Methodology. New Age International. New Delhi. India
Kotler, P. (2003), Marketing Management. 11th ed. Prentice Hall India
Kotler, P., and Kevin, L.K (2009), Marketing Management. 13 Ed. Pearson International
Limited
Lee, W.; Burks, T and Schueller, J (2002). Silage yield monitoring system. The American
Society of Agriculture Engineers, St. Joseph, Michigan
Levine, Ross (2005), “Finance and Growth: Theory and Evidence” in Handbook of
Economic Growth, Eds: Philippe Aghion and Steve Durlauf, The Netherlands Elsvier
Science, 2005
Moore, G. A. (1999). Crossing the chasm: Marketing and selling high-tech products to
mainstream customers. New York: Harper Business.
Morawczynski, Olga and Mark Pickens. 2009. “Poor People Using Mobile Financial
Services: Observations on Customer Usage and Impact from M-PESA” CGAP Brief
Onlinehttp://www.cgap.org/gm/document-
1.9.36723/BR_Poor_People_Using_Mobile_Financial_Services.pdf
Mugenda, O.M., and Mugenda, A.G., (2003), Readings in Research Methods:
Quantitative and Qualitative Approaches. African Centre for Technology Studies
Mulford, Michael, R (2013). Smallholder Market Participation and Welfare Effects:
Evidence from the Kenya Dairy Sector. Cornell University
Mureithi, Muriuki. 2004. “Kenya Telecommunications Sector Performance Review:
1999-2003” Research ICT Africa Report.
Muto, M. and Yamano, T. 2009. “The Impact of Mobile Phone Coverage Expansion on
Market Participation: Panel Data Evidence from Uganda” World Development
Oliver, R.L (1980). A Cognitive Model of the Antecedents and Consequences of
Satisfaction Decisions. Journal of Marketing Research; 460-469
Onkvisit, S.S. (2004), International Marketing, Analysis and Strategy. 4th Ed. Routledge,
New York
Rogers, E. M. (1995). Diffusion of innovations. New York: The Free Press. (Original
publication 1962)

39
Roscoe, J.T. (1975), Fundamentals Research Statistics for Behavioural Sciences. “What
Sample Size is ‘Enough’ in Internet Survey Research”? Interpersonal Computing
and Technology: An electronic Journal for the 21st Century
Schiffman G. Leon, Kanuk Lazar Leslie and Wisenblit Joseph (2010), Consumer
Behavior. 10th Ed. Pearson Prentice Hall
Schindler, P.S. and Cooper, D.R. (2006), Business Research Methods, 9th Ed. Mc Graw
Hill
Simelone, N (2011). An Assessment of the Role of Cooperatives in Smallholder Dairy
Production and Marketing in Swaziland. University of Pretoria
Statistical Abstract (2014), Kenya National Bureau of Statistics
Statistical Abstract (2013), Kenya National Bureau of Statistics
Sunding, D. & Zilberman, D., 2001. The agricultural innovation process: Research and
technology adoption in a changing agricultural sector. In B. L. Gardner & G. C.
Rausser, eds. Handbook of Agricultural Economics. Oxford: Elsevier, pp. 207–261
The Policy Paper Series No.9, (2009). India: The Impact of Mobile Phones
Thorpe, W., H. G. Muriuki, A. Omore, M. O. Owango and S. Staal (2000). Development
of small-holder dairying in Eastern Africa with particular reference to Kenya. A
Paper prepared for the UZ/RVAU/DIAS/DANIDA-ENRECA Project Review
Workshop, Harare, Zimbabwe.
Venkatesh, V., M.G. Morris, G.B. Davis and F.D. Davis, "User Acceptance of
Information Technology: Toward a Unified View," MIS Quarterly, 27, 3 (2003),
425-478
Vivoni, E.R. and Camilli, R. (2003). Real-time streaming of Environmental Field Data,
Comput. Geosci 29, 457-468
Webb, T. (2010). 3 Reasons why Mobile technology is helping farmers in Kenya.
Retrieved September 18, 2014 from
http://2010globalmarketing.wordpress.com/2010/07/23/3-reasons-why-mobile-
technology-is-helping-farmers-in-kenya/
Zhou, T (2011). An Empirical Examination of Users’ Post-Adoption Behaviour of Mobile
Services. Behaviour and Information Technology, 30 (2), 241-250
40
APPENDIX 1: LETTER OF INTRODUCTION
LETTER OF INTRODUCTION
University of Nairobi School of Business P.O Box 30197 - 00100 June 2015
Dear Respondent,
REF: REQUEST FOR RESEARCH ASSISTANCE IN DATA COLLECTION
Currently I am a postgraduate student at the University of Nairobi and as part of my academic work; I am required to undertake and submit a research project related to my field of study as part of fulfilment of the requirements for the post-graduate programme, M.Sc.-Marketing Research.
It’s my humble request to fill the questions in the accompanying questionnaire to generate data required for this study. Information obtained will be used purely for academic purpose and will be held in strict confidence. Upon request, you will be provided with a copy of the final report for perusal. Your assistance and cooperation will be highly appreciated.
Yours Faithfully,
Richard Wanjohi Post-Graduate Research Student University of Nairobi

41
APPENDIX 2: SAMPLE QUESTIONNAIRE