factors influencing product quality in milk processing
TRANSCRIPT
Proceedings of the International Conference on Industrial Engineering and Operations Management Pilsen, Czech Republic, July 23-26, 2019
© IEOM Society International
Factors Influencing Product Quality in Milk Processing Industry
M Dachyar and Galuh Paramitha Rachmadhani Department of Industrial Engineering
Universitas Indonesia Depok, Jawa Barat 16424, Indonesia
[email protected], [email protected]
Abstract
The production of liquid milk has many defects which result in the loss of the opportunity to gain benefits that can be obtained if the quality of the product complies with the prescribed standards. This study aims to determine what factors influence the quality of milk bottled products in the milk processing industry in Jakarta. Quality Function Deployment (QFD) is used to find out what factors influence the quality and how to achieve these factors. Failure Mode and Effect Analysis (FMEA) is used to determine the risk of potential failure of factors that achieve high credence at the QFD stage. The results of the data processing show that workers/operators, production equipment, and production processes have the highest importance in influencing product quality in the milk processing industry. The results of the data processing also show that the filling and sterilization process have the highest risk of causing defects with Risk Priority Number (RPN) above 100. Dented (body) receives an RPN of 240, channeling receives an RPN of 140, dented (skewed) receives an RPN of 128, and scratch receives an RPN of 120.
Keywords Quality Management, Dairy Manufacturing Industry, QFD, FMEA
1. Introduction
The Processing Industry in Indonesia accounts for 19.83% and is the largest contributor to Indonesia's GDP in the second quarter of 2018. The Food and Beverage Industry contributes up to 31.8% of the processing industry's GDP. Therefore, the Food and Beverage Industry is still a mainstay sector for Indonesia's economic growth contributors. The growth is driven by the increase of the civil incomes and the growing of the middle-class population accompanied by their tendency towards the public consumption pattern which leads to consuming ready-to-eat processed food products. In Government Regulations number 14 of 2015 which concerns the master plan for national industrial development, one of the basis sectors is the food industry. One of the priority subsectors in the food industry is the milk processing industry. This subsector is a strategic industry group and has bright prospects to be developed, it is indicated by the growth rate of domestic beverage industry which is able to rise by 8.41% in the first semester of 2018. The number of Milk Processing Industries in Indonesia keeps increasing every year, and in 2018 the amount reaches 36 units.
There are three types of dairy products that are the leading intake of Indonesian people, namely sweetened condensed milk, powdered milk, and factory liquid milk with a percentage of 50%, 30%, and 20% respectively. The volume of milk consumption in Indonesia is still dominated by sweetened condensed milk by half. According to statistic of food consumption by Ministry of Agriculture, although liquid milk has the lowest market share, for the past five years, ready-to-drink liquid milk has the fastest growth rate at 25% per year, followed by sweetened condensed milk which grows 11% per year, while powdered milk only grows 4% per year. With the large growth rate of consumption of ready-to-drink liquid milk in Indonesia and the increasing number of competitors entering the market, milk processing companies must be able to produce high quality and nutritious dairy products.
One of many milk processing companies in Jakarta has an average amount of liquid milk production of 66,590 liters per day. Based on historical data, the average number of products that do not meet established quality standard is 1,940 cartons out of 320,699 cartons produced or equivalent to 0.62% per month, even though the company determines
98
Proceedings of the International Conference on Industrial Engineering and Operations Management Pilsen, Czech Republic, July 23-26, 2019
© IEOM Society International
the maximum defect limit is 0.2%. The product is categorized as a defect product that is not worth selling and must be destroyed. In addition to cause losses to the company, rejected product wastes also need to be destroyed. The destruction itself requires additional costs because it uses the services of a third party. On the basis of the above background, it is necessary to analyze factors which cause the defects. Therefore, this study aims to determine what factors influence the quality of the product in the company. 2. Literature Review 2.1 Quality Management The term ‘quality’ has different meanings due to differences in how experts define it. Juran defines Quality as product features that meet customer needs and make customers satisfied. It also means freedom from shortcomings, namely freedom from mistakes that need rework or that result in field failure, customer dissatisfaction, customer claims, etc. According to Deming, quality has many different criteria and keeps changing depending on who the interpreter is. Therefore, it is important to measure consumer preferences and remeasure continuously. Crosby interpreted the term quality briefly as conformity with the requirements or standards that have been set. In conclusion, ‘quality’ is defined as a dynamic state that is related to products, services, people, processes, and environments that meet or exceed consumer expectations and help produce superior values (Goetsch & Davis, 2016). Anything that does not meet the specified quality requirements will be categorized as a defect (Pande, Neuman, & Cavanagh, 2002). 2.2 GMP Good Manufacturing Practice (GMP) is an aspect of quality assurance which ensures that the goods produced are consistently manufactured and controlled according to quality standards that go in accordance with the intended use and as required by product specifications. GMP is a requirement for all activities related to food production, manufacturing, and distribution. These principles must be applied at all stages of production for the distribution and retail sale of the final products through the procurement of raw materials and the manufacturing of products. The aim of GMP is to ensure that the food is consistent with those needs (Jarvis, 2014). GMP contains complete and detailed specifications of a product and everything that goes into its making, storing, and distribution; material management, resources, and preventive measures to ensure that specification requirements are met (Blanchfield, 2005). 2.3 QFD Yoji Akao proposed QFD in 1970 as a tool to develop quality. QFD is a very significant technique to take the stakeholder needs into account. QFD changes the quality requirements for stakeholders or company customers, suppliers, and employees for quality characteristics. At present, QFD has been used extensively in various fields (Abdel-Basset, Manogaran, Mohamed, & Chilamkurti, 2018). The QFD framework is used to understand the requirements set by potential users (industry, product end users) (Eldermann, Siirde, & Gusca, 2017). 2.4 FMEA FMEA has the ability to define, identify, and eliminate potential product failures from the process (Nooted & Tangjitsitcharoen, 2017). FMEA is an effective method and tool for analyzing procedures and risk assessment and is able to offer critical assistance for analysis and improvement in manufacturing processes (Zhao & Zhu, 2010). FMEA can help evaluate the product, the project, and the whole process itself. It can help eliminate defects that have occurred as well as those that may appear during production (Rekas, Kurek, Latos, & Milczanowska, 2014). FMEA can be used to identify potential causes to diminish and detect failures in a production process which are determined by factors that are Severity (S), Occurrence (O) and Detection (D). Risk Priority Number (RPN) can be obtained from multiplying the three factors (S x O x D) to determine potential failure effect. (Nooted & Tangjitsitcharoen, 2017). A number of risk priority higher than 100 indicates that there’s a potential failure and correction action should be performed. The highest RPN possible is 1000 (10 x 10 x 10) which means it has the greatest possible failure. From an RPN of 1000, 10% of that amount has statistical confidence of 90%. Control measures of each potential failure mode
99
Proceedings of the International Conference on Industrial Engineering and Operations Management Pilsen, Czech Republic, July 23-26, 2019
© IEOM Society International
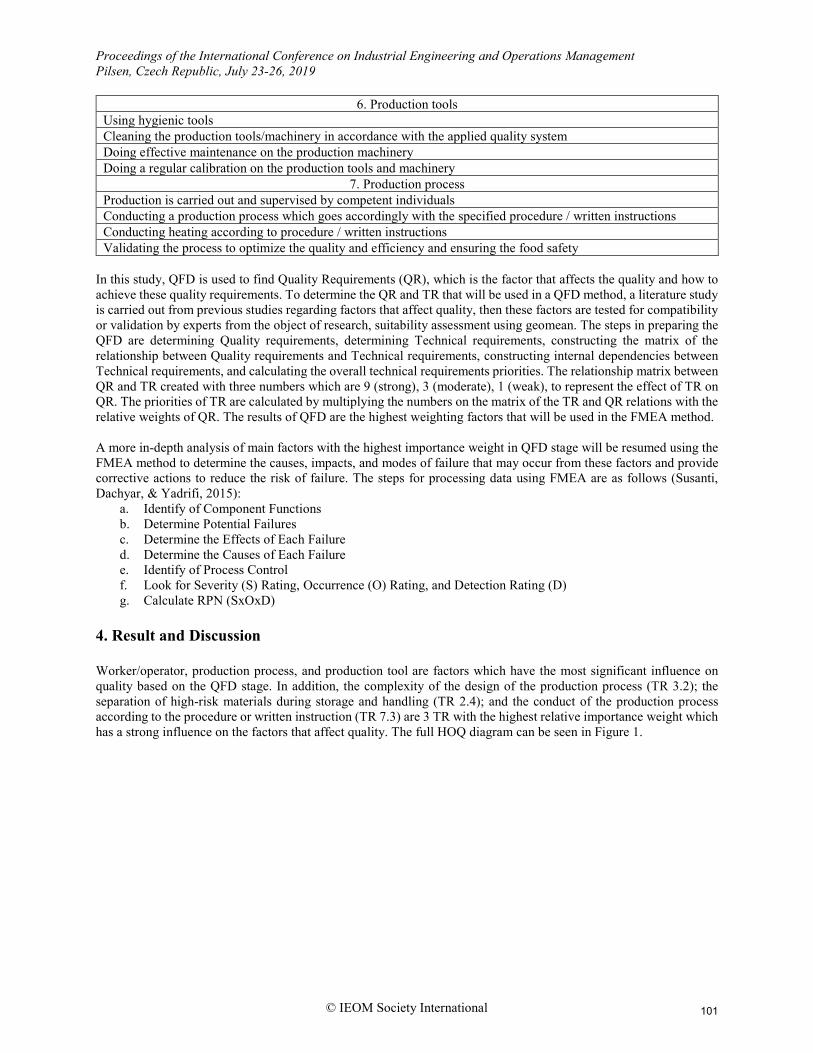
and the RPN should be calculated to identify the corrective actions effect possibilities to be done in the process improvement (Ozilgen, 2012). 3. Methods First, data collection is carried out by searching the (Quality Requirements) QR and (Technical Requirements) TR factors through literature studies. From the literature study conducted, there are 9 QR that affect product quality in the milk processing industry which can be seen in Table 1.
Table 1. Factors influencing product quality from the literature study
No. Variable/QR References
1 Worker/Operator (Bargelis, Čikotienė, & Ramonas, 2014), (Doulatabadi & Yusof, 2014), (Nooted & Tangjitsitcharoen, 2017)
2 Working environment (Bargelis et al., 2014), (Doulatabadi & Yusof, 2014), (Teh, Adebanjo, & Ahmed, 2014)
3 Production complexity (Lombard, Waveren, & Chan, 2014), (Nooted & Tangjitsitcharoen, 2017) 4 Raw materials (Bargelis et al., 2014) 5 Production facility (Bargelis et al., 2014), (Nooted & Tangjitsitcharoen, 2017) 6 Production tools (Bargelis et al., 2014), (Nooted & Tangjitsitcharoen, 2017) 7 Production process (Nooted & Tangjitsitcharoen, 2017), (Lombard et al., 2014) 8 Organization culture (Lombard et al., 2014), (Doulatabadi & Yusof, 2014) 9 Labor management (Teh et al., 2014), (Lombard et al., 2014)
Then the QR and TR obtained will be assessed by six experts. QR and TR factors that exceed the threshold will be used in this study. After the assessment is conducted, the average value for each variable and indicator will be calculated. Factors that have an average value smaller than 3.5 will be eliminated because they are considered out of synch with the conditions of the Milk Processing Industry in Indonesia. From the calculation, 7 QR and 24 TR are obtained and can be seen in Table 2.
Table 2. QR and TR obtained from the calculation
1. Worker/Operator
Washing hands with water and soap before making a contact with a product Not touching a product with bare hands Wearing production attire only inside the production room Not inviting workers who indicate clinical symptoms Applying workers’ discipline
2. Working environment The temperature of production and storage room The humidity of production and storage room Separating high-risk materials when safekeeping and handling
3. Production complexity Production process design complexity
4. Raw materials Choosing the compatible supplier Testing the sample of the raw materials
5. Production facility Smooth floor, not cracked, easy to clean Not cracked/perforated wall Sealed roof (not cracked/perforated) to prevent foreign material from falling into the production process The production building must be safe from disturbance caused by animals (for example birds, pests, and other insects) Each part of the building, including the outer part, must be maintained and in a clean and orderly condition
100
Proceedings of the International Conference on Industrial Engineering and Operations Management Pilsen, Czech Republic, July 23-26, 2019
© IEOM Society International
6. Production tools Using hygienic tools Cleaning the production tools/machinery in accordance with the applied quality system Doing effective maintenance on the production machinery Doing a regular calibration on the production tools and machinery
7. Production process Production is carried out and supervised by competent individuals Conducting a production process which goes accordingly with the specified procedure / written instructions Conducting heating according to procedure / written instructions Validating the process to optimize the quality and efficiency and ensuring the food safety
In this study, QFD is used to find Quality Requirements (QR), which is the factor that affects the quality and how to achieve these quality requirements. To determine the QR and TR that will be used in a QFD method, a literature study is carried out from previous studies regarding factors that affect quality, then these factors are tested for compatibility or validation by experts from the object of research, suitability assessment using geomean. The steps in preparing the QFD are determining Quality requirements, determining Technical requirements, constructing the matrix of the relationship between Quality requirements and Technical requirements, constructing internal dependencies between Technical requirements, and calculating the overall technical requirements priorities. The relationship matrix between QR and TR created with three numbers which are 9 (strong), 3 (moderate), 1 (weak), to represent the effect of TR on QR. The priorities of TR are calculated by multiplying the numbers on the matrix of the TR and QR relations with the relative weights of QR. The results of QFD are the highest weighting factors that will be used in the FMEA method. A more in-depth analysis of main factors with the highest importance weight in QFD stage will be resumed using the FMEA method to determine the causes, impacts, and modes of failure that may occur from these factors and provide corrective actions to reduce the risk of failure. The steps for processing data using FMEA are as follows (Susanti, Dachyar, & Yadrifi, 2015):
a. Identify of Component Functions b. Determine Potential Failures c. Determine the Effects of Each Failure d. Determine the Causes of Each Failure e. Identify of Process Control f. Look for Severity (S) Rating, Occurrence (O) Rating, and Detection Rating (D) g. Calculate RPN (SxOxD)
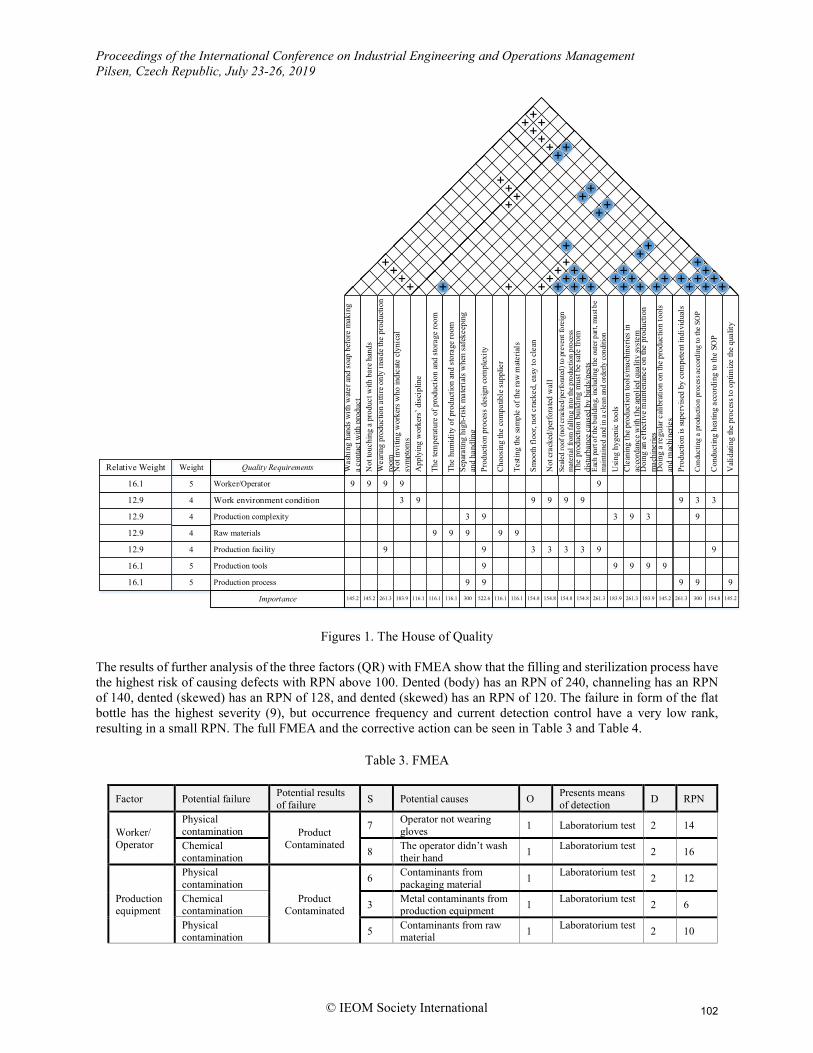
4. Result and Discussion Worker/operator, production process, and production tool are factors which have the most significant influence on quality based on the QFD stage. In addition, the complexity of the design of the production process (TR 3.2); the separation of high-risk materials during storage and handling (TR 2.4); and the conduct of the production process according to the procedure or written instruction (TR 7.3) are 3 TR with the highest relative importance weight which has a strong influence on the factors that affect quality. The full HOQ diagram can be seen in Figure 1.
101
Proceedings of the International Conference on Industrial Engineering and Operations Management Pilsen, Czech Republic, July 23-26, 2019
© IEOM Society International
Work environment condition
Was
hing
han
ds w
ith w
ater
and
soa
p be
fore
mak
ing
a co
ntac
t with
pro
duct
Not
touc
hing
a p
rodu
ct w
ith b
are
hand
s
Not
invi
ting
wor
kers
who
indi
cate
cly
nica
l sy
mpt
oms
Wea
ring
prod
uctio
n at
tire
only
insi
de th
e pr
oduc
tion
room
App
lyin
g w
orke
rs’ d
isci
plin
e
The
tem
pera
ture
of p
rodu
ctio
n an
d st
orag
e ro
om
The
hum
idity
of p
rodu
ctio
n an
d st
orag
e ro
omSe
para
ting
high
-ris
k m
ater
ials
whe
n sa
feke
epin
g an
d ha
ndlin
gPr
oduc
tion
proc
ess
desi
gn c
ompl
exity
Cho
osin
g th
e co
mpa
tible
sup
plie
r
Test
ing
the
sam
ple
of th
e ra
w m
ater
ials
Smoo
th fl
oor,
not c
rack
ed, e
asy
to c
lean
Not
cra
cked
/per
fora
ted
wal
lSe
aled
roof
(not
crac
ked/
perfo
rated
) to
prev
ent f
orei
gn
mat
eria
l fro
m fa
lling
into
the p
rodu
ctio
n pr
oces
sTh
e pr
oduc
tion
build
ing
mus
t be
safe
from
di
stur
banc
e ca
used
by
bird
s/pe
sts
Each
par
t of t
he b
uild
ing,
incl
udin
g th
e ou
ter p
art,
mus
t be
mai
ntai
ned
and
in a
clea
n an
d or
derly
cond
ition
Usi
ng h
ygen
ic to
ols
Cle
anin
g th
e pr
oduc
tion
tool
s/mac
hine
ries
in
acco
rdan
ce w
ith th
e ap
plie
d qu
ality
syst
emD
oing
an
effe
ctiv
e m
aint
enan
ce o
n th
e pr
oduc
tion
mac
hine
ries
Doi
ng a
regu
lar c
alib
ratio
n on
the
prod
uctio
n to
ols
and
mac
hine
ries
Worker/Operator
Production complexity
Raw materials
Production facility
Production tools
Production process
Val
idat
ing
the
proc
ess t
o op
timiz
e th
e qu
ality
Con
duct
ing
heat
ing
acco
rdin
g to
the
SOP
Cond
uctin
g a
prod
uctio
n pr
oces
s acc
ordi
ng to
the
SOP
Prod
uctio
n is
supe
rvis
ed b
y co
mpe
tent
indi
vidu
als
5
5
4
4
4
4
5
Importance
Weight Quality Requirements
9 9 9 9
3 9
9
9 9 9
3 9
9 9
9
9
9
9
3 3 3 3 9
9 9 9 9
9 9 9
9
++
339
9393
9
9999
145.2 145.2 261.3 183.9 116.1 116.1 116.1 300 522.6 116.1 154.8 154.8 154.8 154.8 261.3 183.9 261.3 183.9 145.2 261.3116.1 300 154.8 145.2
16.1
16.1
12.9
12.9
12.9
12.9
16.1
Relative Weight
Figures 1. The House of Quality
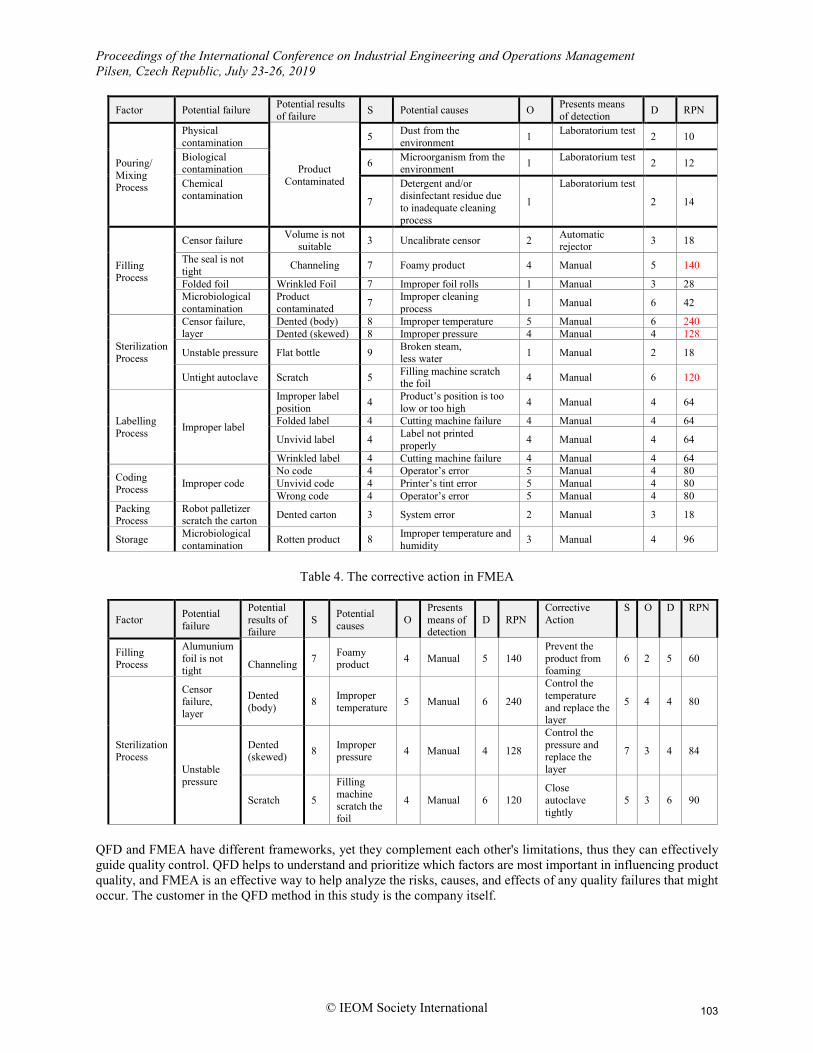
The results of further analysis of the three factors (QR) with FMEA show that the filling and sterilization process have the highest risk of causing defects with RPN above 100. Dented (body) has an RPN of 240, channeling has an RPN of 140, dented (skewed) has an RPN of 128, and dented (skewed) has an RPN of 120. The failure in form of the flat bottle has the highest severity (9), but occurrence frequency and current detection control have a very low rank, resulting in a small RPN. The full FMEA and the corrective action can be seen in Table 3 and Table 4.
Table 3. FMEA
Factor Potential failure Potential results of failure S Potential causes O Presents means
of detection D RPN
Worker/ Operator
Physical contamination Product
Contaminated
7 Operator not wearing gloves 1 Laboratorium test 2 14
Chemical contamination 8 The operator didn’t wash
their hand 1 Laboratorium test 2 16
Production equipment
Physical contamination
Product Contaminated
6 Contaminants from packaging material 1 Laboratorium test 2 12
Chemical contamination 3 Metal contaminants from
production equipment 1 Laboratorium test 2 6
Physical contamination 5 Contaminants from raw
material 1 Laboratorium test 2 10
102
Proceedings of the International Conference on Industrial Engineering and Operations Management Pilsen, Czech Republic, July 23-26, 2019
© IEOM Society International
Factor Potential failure Potential results of failure S Potential causes O Presents means
of detection D RPN
Pouring/ Mixing Process
Physical contamination
Product Contaminated
5 Dust from the environment 1 Laboratorium test 2 10
Biological contamination 6 Microorganism from the
environment 1 Laboratorium test 2 12
Chemical contamination 7
Detergent and/or disinfectant residue due to inadequate cleaning process
1
Laboratorium test 2 14
Filling Process
Censor failure Volume is not suitable 3 Uncalibrate censor 2 Automatic
rejector 3 18
The seal is not tight Channeling 7 Foamy product 4 Manual 5 140
Folded foil Wrinkled Foil 7 Improper foil rolls 1 Manual 3 28 Microbiological contamination
Product contaminated 7 Improper cleaning
process 1 Manual 6 42
Sterilization Process
Censor failure, layer
Dented (body) 8 Improper temperature 5 Manual 6 240 Dented (skewed) 8 Improper pressure 4 Manual 4 128
Unstable pressure Flat bottle 9 Broken steam, less water 1 Manual 2 18
Untight autoclave Scratch 5 Filling machine scratch the foil 4 Manual 6 120
Labelling Process Improper label
Improper label position 4 Product’s position is too
low or too high 4 Manual 4 64
Folded label 4 Cutting machine failure 4 Manual 4 64
Unvivid label 4 Label not printed properly 4 Manual 4 64
Wrinkled label 4 Cutting machine failure 4 Manual 4 64
Coding Process Improper code
No code 4 Operator’s error 5 Manual 4 80 Unvivid code 4 Printer’s tint error 5 Manual 4 80 Wrong code 4 Operator’s error 5 Manual 4 80
Packing Process
Robot palletizer scratch the carton Dented carton 3 System error 2 Manual 3 18
Storage Microbiological contamination Rotten product 8 Improper temperature and
humidity 3 Manual 4 96
Table 4. The corrective action in FMEA
Factor Potential failure
Potential results of failure
S Potential causes O
Presents means of detection
D RPN Corrective Action
S O D RPN
Filling Process
Alumunium foil is not tight
Channeling 7 Foamy
product 4 Manual 5 140 Prevent the product from foaming
6 2 5 60
Sterilization Process
Censor failure, layer
Dented (body) 8 Improper
temperature 5 Manual 6 240
Control the temperature and replace the layer
5 4 4 80
Unstable pressure
Dented (skewed) 8 Improper
pressure 4 Manual 4 128
Control the pressure and replace the layer
7 3 4 84
Scratch 5
Filling machine scratch the foil
4 Manual 6 120 Close autoclave tightly
5 3 6 90
QFD and FMEA have different frameworks, yet they complement each other's limitations, thus they can effectively guide quality control. QFD helps to understand and prioritize which factors are most important in influencing product quality, and FMEA is an effective way to help analyze the risks, causes, and effects of any quality failures that might occur. The customer in the QFD method in this study is the company itself.
103
Proceedings of the International Conference on Industrial Engineering and Operations Management Pilsen, Czech Republic, July 23-26, 2019
© IEOM Society International
In this study, experts consider that the factors of organizational culture and management of labor do not have a large influence on the quality of the products. This result is contrary to (Lombard et al., 2014) which stated that organizational culture and labor management are important factors that affect the quality of the products. Based on the results of in-depth interviews with experts in companies who control liquid milk production, it is stated that, in other branch factories, there are differences in the tools used in the production process, namely baskets. Baskets that are used in Jakarta factories do not have barriers for each bottle, while in other factories the baskets have barriers for each bottle. The difference results in a number of different defects. For example, if one uses a basket without a partition, the dented products will be produced to a large degree because the products in the basket without the bulkhead will intersect with each other. In other words, there will be no limit, but the level of the scratch product is small. On the other hand, if one uses baskets with bulkheads, the products will not come into contact with each other so the damage to the dented category products is minimal. However, due to the bulkhead in the basket, the possibility of the product being shaken is very high, causing the product head in the form of aluminum foil scratched with the upper layer. 5. Conclusion A reliable worker/operator (QR1), a good production process (QR6), and adequate production tools (QR7) are three main factors that influence product quality in the milk processing industry. The complexity of production process design (TR 3.2); separation of high-risk materials during storage and handling (TR 2.4); and conducting the production process according to the procedure or written instruction (TR 7.3) are 3 TR with the highest relative importance. The filling and sterilization process have the highest potential of causing defects with an RPN above 100. Dented (body) has an RPN of 240, channeling has an RPN of 140, the dented body has an RPN of 128, and dented (skewed) has an RPN of 120. Failure in form of a flat bottle gets the highest severity (9), but the ranking for the occurrence frequency and the current detection control is so low that the resulting RPN is small.
Based on the results of the above analysis, managerial advice and recommendations that goes accordingly with the current condition of the company and can be applied to reduce defects are by replacing the layer with the new one and analyzing the layer material currently used to see whether it is suitable for the existing requirements. Therefore, to suppress the number of dents, benchmarking can be done to other branch factories regarding the temperature used for the sterilization process in order to reduce the risk of overheating, resulting the bottle to deform from its initial form. In addition to improve the tools and methods used, it is also important to provide problem solving training for workers/operators to enhance their skill in taking action as well as increase their contribution in every job (production process) that is carried out, such as when there is temperature or pressure instability, workers/operators in the field must be able to take an action so that the damage is not too severe. References Abdel-Basset, M., Manogaran, G., Mohamed, M., & Chilamkurti, N. (2018). Three-way decisions based on
neutrosophic sets and AHP-QFD framework for supplier selection problem. Future Generation Computer Systems, 89, 19–30. https://doi.org/10.1016/j.future.2018.06.024
Bargelis, A., Čikotienė, D., & Ramonas, Z. (2014). Impact of human factors and errors for product quality and reliability in the integrated approach of product and process design, maintenance and production, 20(1), 92–98.
Blanchfield, J. R. (2005). Good manufacturing practice (GMP) in the food industry. Handbook of Hygiene Control in the Food Industry. Woodhead Publishing Limited. https://doi.org/10.1533/9781845690533.3.324
Doulatabadi, M., & Yusof, S. M. (2014). Driving ’ Soft ’ Factors for Sustaining Quality Excellence : perceptions from quality managers, 808–812.
Eldermann, M., Siirde, A., & Gusca, J. (2017). QFD framework for selection of industry development scenarios. Energy Procedia, 128, 230–233. https://doi.org/10.1016/j.egypro.2017.09.060
Goetsch, D. L., & Davis, S. B. (2016). Quality Management for Organizational Excellence: Introduction to Total Quality. Pearson. https://doi.org/British Library Cataloguing- In Publication data
Jarvis, B. (2014). Good Manufacturing Practice. Encyclopedia of Food Microbiology: Second Edition (Second Edi, Vol. 2). Elsevier. https://doi.org/10.1016/B978-0-12-384730-0.00149-X
Lombard, R., Waveren, C. C. Van, & Chan, K. (2014). Factors Affecting Quality in a Manufacturing Environment
104
Proceedings of the International Conference on Industrial Engineering and Operations Management Pilsen, Czech Republic, July 23-26, 2019
© IEOM Society International
for a Non- Repairable Product, 137–142. Nooted, O., & Tangjitsitcharoen, S. (2017). DEFECTIVE REDUCTION IN FROZEN PIE DEFECTIVE
REDUCTION IN FROZEN PIE. https://doi.org/10.1088/1757-899X/215/1/012015 Ozilgen, S. (2012). Failure Mode and Effect Analysis (FMEA) for confectionery manufacturing in developing
countries: Turkish delight production as a case study. Food Science and Technology (Campinas), 32(3), 505–514. https://doi.org/10.1590/S0101-20612012005000083
Pande, P. S., Neuman, R. P., & Cavanagh, R. R. (2002). The Six Sigma way team fieldbook : an implementation guide for project improvement teams.
Rekas, A., Kurek, M., Latos, T., & Milczanowska, K. (2014). Implementation of FMEA into mass production process to identify and eliminate causes of defects. Key Engineering Materials, 641, 266–277. https://doi.org/10.4028/www.scientific.net/KEM.641.266
Susanti, Y. S. N., Dachyar, M., & Yadrifi. (2015). Analysis of Factors that Support the Operational Excellence in Telecommunication-Supporting Companies. International Journal of Applied Engineering Research, 10(15), 35461–35465.
Teh, P., Adebanjo, D., & Ahmed, P. K. (2014). Factors Affecting Product Quality and Reliability : A Comparison of Developed and Developing Countries, 1481–1485.
Zhao, X., & Zhu, Y. (2010). Research of FMEA knowledge sharing method based on ontology and the application in manufacturing process. 2010 2nd International Workshop on Database Technology and Applications, DBTA2010 - Proceedings, 1–4. https://doi.org/10.1109/DBTA.2010.5658936
Biographies M Dachyar is head of Management Information System and Decision Support (MISDS) Laboratory, Industrial Engineering Dept. Universitas Indonesia. His research focused on management information system, decision support system, operation management, and business process reengineering. Galuh Paramitha Rachmadhani holds a Bachelor of Engineering degree in Industrial Engineering from Universitas Indonesia. Her research focused on quality improvement an defect reduction.
105