factors influencing quality of service delivery in public
TRANSCRIPT

FACTORS INFLUENCING QUALITY OF SERVICE
DELIVERY IN PUBLIC UNIVERSITIES IN KENYA CASE OF
CITY CAMPUSES IN NAIROBI COUNTY
CHRISTINE WAIRIMU TITI
A RESEARCH PROJECT REPORT SUBMITTED IN PARTIAL
FULFILLMENT OF THE REQUIREMENTS FOR THE AWARD OF THE
DEGREE OF MASTER OF ARTS IN PROJECT PLANNING AND
MANAGEMENT OF THE UNIVERSITY OF NAIROBI.
2016

ii
DECLARATION
This Research project report is my original work and has never been presented for the award of
degree in this University or any other institution.
Signature ____________________________ Date_______________________
Christine Wairimu Titi
L50/82773/2012
This Research project has been submitted for examination with my approval as a University
Supervisor.
Signature ____________________________ Date_______________________
Dr. John Mbugua
Department of Extra Mural Studies
(Lecturer, University of Nairobi)

iii
DEDICATION
I dedicate this project to my family, A special feeling of gratitude is dedicated to the bright
memory of my grandmother Teresia Njoki and My aunt Margaret Wairimu. Who were always
concerned about my academic life.
.

iv
ACKNOWLEDGEMENT
My most sincere gratitude first goes to my Supervisor Dr. John Mbugua, I truly appreciate the
support, constructive criticism, insight, patience and guidance in writing this research project. I
recognize that without his immense support and knowledge this research project could not be
complete. I am truly indebted to my dad and mum and am ever grateful for their tireless moral
and financial support. To my siblings Triza and Gladys I truly appreciate their great concern in
my academic journey .I would like to appreciate the librarians and all the project management
lecturers who taught me during my course work and formed a basis for my project. I also wish to
acknowledge the support and encouragement given by the entire Nairobi Extra mural Centre
right from my classmates to the administrative staff.
Finally I wish to thank my friends Allan Kurgat, Naomi Wangui,Carol Nyambura and my sister
Gladys Titi Mwenda for their moral support and encouragement during the course of this study.
May the almighty Lord reward them in all their endeavors.

v
TABLE OF CONTENT
DECLARATION............................................................................................................ ii
DEDICATION............................................................................................................... iii
ACKNOWLEDGEMENT ............................................................................................ iv
TABLE OF CONTENT ................................................................................................ v
LIST OF TABLES ....................................................................................................... viii
ABBREVIATIONS AND ACRONYMS ...................................................................... x
ABSTRACT ................................................................................................................... xi
CHAPTER ONE: INTRODUCTION .......................................................................... 1
1.1 Background of the study ............................................................................................ 1
1.2 Statement of the Problem ......................................................................................... 5
1.3 Purpose of Study ........................................................................................................ 7
1.4 Objectives of the study............................................................................................... 8
1.5 Research Questions .................................................................................................... 8
1.6 Significance of study................................................................................................. 8
1.8 Delimitation of the study ........................................................................................... 9
1.9 Limitation of the study ............................................................................................ 9
1.10 Definitions of Terms as used in the study ............................................................... 10
1.11 Organization of the Study. ..................................................................................... 11
CHAPTER TWO: LITERATURE REVIEW ............................................................ 12
2.1 Introduction ............................................................................................................... 12
2.2 Concept of quality service delivery ......................................................................... 12
2.3 Leadership and quality service delivery .................................................................. 13
2.4 Competitiveness and quality service delivery ........................................................... 20
2.5 Institutional Funding and quality service delivery ................................................... 26
2.6 Technological Changes and quality service delivery ............................................. 30
2.7 Human Resource Management and quality service delivery ................................... 31
2.8 Theoretical Framework ............................................................................................ 33
2.9 Conceptual framework ............................................................................................. 34
2.10 Knowledge gaps ...................................................................................................... 36

vi
2.11 Summary of Literature Review .............................................................................. 37
CHAPTER THREE: RESEARCH METHODOLOGY ........................................... 39
3.1 Introduction .............................................................................................................. 39
3.2 The research design................................................................................................... 39
3.3 Target population ...................................................................................................... 39
3.4 Sample Size and Sampling Procedure ..................................................................... 40
3.5 Data Collection Instruments .................................................................................... 41
3.5.1 Pilot Testing of the Research Instrument ............................................................. 41
3.5.3 Reliability of Research Instrument ....................................................................... 41
3.6 Procedure of data collection ..................................................................................... 42
3.7 Data analysis techniques .......................................................................................... 43
3.8 Ethics......................................................................................................................... 43
3.9 Operationalization of Variables ............................................................................. 44
CHAPTER FOUR: DATA ANALYSIS, PRESENTATION AND
INTERPRETATION .................................................................................................... 47
4.1 Introduction .............................................................................................................. 47
4.2 Questionnaires Return Rate .................................................................................... 47
4.3 Demographic Characteristics of the Respondents .................................................... 48
4.4 Competitiveness and quality service delivery.......................................................... . 52
4.7 Institutional funding and quality service delivery ................................................... 57
4.8 Human resource management and quality service delivery .................................... 60
CHAPTER FIVE SUMMARY OF FINDINGS, DISCUSSIONS, CONCLUSIONS
AND RECOMMENDATIONS AND SUGGESTIONS
FOR FURTHER STUDIES ......................................................................................... 63
5.1 Introduction .............................................................................................................. 63
5.2 Summary of Findings ............................................................................................... 63
5.3 Discussions of Results ............................................................................................. 65
5.3.1 Leadership and quality service delivery ............................................................... 65
5.3.2 Competitiveness and quality service delivery........................................................ 66
5.3.3 Institutional funding and quality service delivery ................................................. 67
5.3.4 Human resource management and quality service delivery .................................. 67

vii
5.3.5 Technological changes and quality service delivery .......................................... 68
5.4 Conclusions .............................................................................................................. 68
5.5 Recommendations ..................................................................................................... 69
5.6 Suggestion for Further study .................................................................................... 70
REFERENCES .............................................................................................................. 71
APPENDICES ............................................................................................................... 80
APPENDIX I: Questionnaire For Students In Public Universities ................................. 81
APPENDIX II:Questionnaire For Academic And Non-Academic Staff II ................. 85
APPENDIX III: Table of Accredited Universities in Kenya ......................................... 90
APPENDIX IV: Table For Determining Sample Size .................................................... 91
APPENDIX V: Research permit ..................................................................................... 91

viii
LIST OF TABLES
Table 2.1 Knowledge gaps ..............................................................................................30
Table 3.1 Target Population ............................................................................................ 40
Table 3.2 Sample population ......................................................................................... 40
Table 3.3 Reliability index .............................................................................................. 42
Table 3.1: Operationalization of Variables .................................................................... 44
Table 4.1 Questionnaire Return Rate for Students ........................................................ 47
Table 4.2 Questionnaire Return Rate for Staff ............................................................... 48
Table 4.3 Distribution of Respondents by Age(Staff) .................................................. 48
Table 4.4 Gender distribution of the staff ...................................................................... 49
Table 4.5 Beaucracy as a factor of leadership .............................................................. 50
Table 4.6 Participatory management and decision making ........................................... 51
Table 4.7 Communication .............................................................................................. 52
Table 4.8 Teaching methodologies and programs offered and quality service delivery 53
Table 4.9 Variety of programs offered and quality service delivery ............................. 54
Table 4.10 Ability of grauates to be competitive .............................................................54
Table 4.11 Lecturers have great range of experience ..................................................... 57
Table 4.12 Staff trainings and quality service delivery .................................................. 58
Table 4.13 Programmes on personal development ability ............................................. 58
Table 4.14 Research funds ............................................................................................ 59
Table 4.15 Funds set aside for research ........................................................................ 60
Table 4.16 Highest level of education . ........................................................................ 57
Table 4.17 Academic facilities ........................................................................................58
Table 4.18 Percentage of graduates ...............................................................................59
Table 4.19 Remuneration package is favourable ...........................................................59
Table 4.20 Transparency in hiring staff ..........................................................................60
Table 4.21 Technological changes .................................................................................. 62

ix
LIST OF FIGURES
Figure 1: Conceptual Framework ............................................................................................. 35

x
ABBREVIATIONS AND ACRONYMS
CHE Commission of Higher Education
CUE Commission of university education.
DUC Distributed unit cost
HR Human Resource
HRM Human Resource management
ICT Information and Communication Technology
IT Information Technology
J.K.U.A.T Jomo Kenyatta University of Agriculture and Technology
JAB Joint Admission Board which is currently the Kenya Universities and Colleges
Central Placement Service (KUCCPS)
K. U. Kenyatta University
MDG Millennium Development Goals.
NACOSTI National Council of Science and Technology
SERVPERF Service Performance
SPSS Statistical package for social scientists
SPSS Statistical Package for Social Science
UNESCO United Nations Educational Scientific & Cultural Organization
UON University of Nairobi
USA United States of America
FREQ Frequency
JKUAT Jomo Kenyatta University
JARAMOGI OO Jaramogi Oginga Odinga

xi
ABSTRACT
Public Universities comprise of institutions that are part of the government apparatus. For service
delivery to be effective in any institution, the beneficiaries must be able to access services when required.
The purpose of this study was to establish the factors influencing quality service delivery in public
universities in Kenya: a case of City campuses in Nairobi County. The study sought to establish how
leadership, institutional funding, competiveness, technological changes and human resource management,
influences the quality of service delivery in public universities in Nairobi City County. The target
population was 7,740 individuals which was derived from Students and the University staff (Academic
and non-academic) of 5 public university satellite campuses in Nairobi City County.The questionnaire
rate of return was 95% for students and 97% for staff. The data collected was analyzed, interpreted and
presented using tables and frequencies. It was found that the four objectives of the study influenced the
quality service delivery of the public university satellite campuses. It was established that bureaucracy is
a key area that needs to be addressed. 39(52.7%) of the staff members agreed that there was
bureaucracy in their institutions . From the results majority agreed that decision making process was
efficient as well as participatory management .The results showed that across the campuses 31(41.9%)
were in agreement while 18(24.3%) strongly agreed that there was participatory management in the
institutions. Another aspect of leadership was having well laid down communication structures. Majority
of the staff members agreed that communication policies were well laid down ,having 7(41.2%) of
JKUAT,6(40%) from Kimathi,12(46.2.%) from Moi ,3 (42.9%) from Masaai Mara and 3(42.9%) from
Jaramogi .O .O. Further we had (35.3%) in JKUAT,3(20%) in Kimathi, 9(34.6%) of Moi ,3 (33.3%)
and 2(28.6%) in Jaramogi .O .O. who strongly agreed that there were well laid down communication
policies in their organizations. The study found that the curriculums by the university were up to date with
139(40.4%) being in agreement and 121(35.4%) strongly agreeing that there were suitable teaching
methods. The results also slightly differed on the opinion of whether the use of up to date teaching
methodologies was in place. This meant that there should be an improvement of the teaching
methodologies to match the curriculum to ensure that the institutions remained competitive. However the
students were not satisfied with the range of programs offered by their respective institutions with
106(30.8%) strongly disagreeing and 144(41.9%) in disagreement. The study further revealed the need
for this institutions to increase essential academic facilities to enable students get quality education,
having a total of 155(45.1%) and 40(11.6%) who agreed and strongly agreed respectively that their
campuses had adequate academic facilities . The five institutions had embraced modern technology,
having 35(47.3%) and 16(21.6%) being in agreement and strongly agreement respectively. The rate at
which the staff had embraced technology was abit lower compared to the rate at which the institutions
adopted it , 27(36.5%) being in agreement and 11(14.9%) strongly agreeing . The researcher established
that for satellite campuses to offer high quality services there was need to reduce bureaucracy to ease
and hasten services offered .The leadership of this institutions should work towards a thinner organization
and enhance open door policy .More training that are core to staff should be conducted both in HRM and
IT . The following were suggested for future research. Given that Nairobi is the capital city and given
different experiences that satellite campuses face in other Semi urban areas, similar research should be
done in other counties in order to generalize conclusion .Similar research should also be done in main
campuses, ,private universities and tertiary colleges. This would bring fair competition hence benefiting
both the students and the staff as well as sustain and enhance quality service delivery in education
institutions.

1
CHAPTER ONE
INTRODUCTION
1.1 Background of the study
Public Universities comprise of institutions that are part of the government apparatus. These
entities include education related authorities that fund or administer public policy and public
service delivery more so to students (Forrer, Kee, & Boyer 2014). Quality of service delivery in
public universities in Kenya has been key due to completion. For service delivery to be effective
in any institution, whether public or private, population must be able to access services when
required. The concept that access should be on the basis of need is supported by international
humanitarian (Howard, Sondorp & Ter2012).
In Africa, which has many low and middle income countries, dismal failures in the quality of
public service delivery are demonstrated by high rates of absenteeism among workers. These
failures have driven the agenda of better governance and accountability in public sector (Ringold
& World Bank, 2012).In sub-Saharan Africa, public service delivery has been supported by
developed transition and developing economies under the notion of the public sector reform
(PSR). The government has been trying to support the initiative though sustainability issues
become a challenge .Citizens in the Sub-Saharan Africa are not organised well enough to
exercise influence of service delivery especially in public institutions. This is because the
organisers are part of the elite and not ordinary citizens. (In Paulos, In Mihyo & Organization
for Social Science Research in Eastern and Southern Africa. 2013).
In Australia, USA and Canada, service delivery in public institutions is influenced by the forms
of governments in power. The nature of policy and service delivery arrangements will reflect the
political and civic structure of the jurisdiction (Wanna, Butcher &Freyens 2010). In Australia,
common wealth increased its funding for education and other core areas like health which also
increased the incentive payments to institutions that achieve service delivery improvements. In
this case, a reform for funding administration was put in place to separate funding at the
common wealth level, policy formulation and service funding (Kim, Vammalle, Han'guk Chose
Yon'guwon& Organisation for Economic Co-operation and Development 2011).

2
Leadership features as a major determinant in service delivery .There are different leadership
styles which are defined by the way a leader typically behaves towards his followers/group
members. These styles have been classified into: Autocratic/Bureaucratic Leadership – This
approach refers to where all authority centres around the leader .Global concept of bureaucratic
leadership is associated with following the established rules and procedures. The leadership
style reflects a risk-reverse attitude and support for status quo ( Khurana and Anand 2010).
Secondly we have the democratic style of leadership considers the suggestions of members and
leader. It is a human relations approach where all group members are seen as important
contributors to a decision. Lastly there is the Laisser Faire Leadership style the leader exercises
very little control or influence over the group members. Members are given a goal and left alone
to decide how to achieve it, hence any institution should adopt a leadership style that will suite
all its stakeholders (Martindale, 2011).
Funding is any institution is the key driver to quality service delivery; Institutional funds are
funds that are injected into institutions to help in meeting operational as well as development
agendas. Institutional funding works well with priorities that the institutions have been set. This
is because the funding institutions are required to see the list to ensure that the funds given are
used in the correct way. It also helps in accountability of the institution receiving the funds
(Organisation de cooperationist de d velopement conomiques 2005).
The Australian Law on fiscal equalization stipulates that the federal and sub-federal levels
should periodically evaluate and if necessary, renegotiate fiscal equalisation and
intergovernmental fiscal relations. This would assist in funding core public universities fairly
(Kim and Organisation for Economic Co-operation and Development. 2011).
The quality of services delivered is an important determinant of people‟s well-being for a given
bundle of resources. Resources are critical to the delivery of services to clients. But resources are
just only one, and sometimes a small component, of the performance factors that impact on the
quality of service provision. Recent evidence shows that even when resources are allocated for
provision of services, a large portion of the resources might not reach the intended clients. In
some cases, services may not even being provided because frontline providers do not show up to
work, resulting in poor delivery of services. The implication is that availability of resources does

3
not guarantee that intended beneficiaries do in fact receive the benefits from the resources
allocated (Okwakol, 2009).
The growth of the private university sector in Kenya has been fuelled by several factors
including limited opportunities available in public universities, regular closures of state-funded
universities, and the desire to complement government-managed higher institutions of learning.
Also, interestingly, two-thirds of the new universities are run by religious organizations, mainly
Protestant churches that try to attract their followers in an effort to ensure that as young minds
mature academically they stay within the faith (Kalb, 2010).
Kenya today has 22 public and 26 private universities ,with either full or interim charter, and
20% of a total of 150,000 students attend private institutions. Now public universities have
joined the fray by opening new colleges in different parts of the country and introducing
„parallel‟ degree programs in response to spiraling demand for higher education (World
university news 2012). The increase in the number of satellite campuses is a positive trend, but it
is undeniable that many universities are so money-oriented that they do not give much attention
to ensuring quality education.
In Britain, since 1989, parents had the right to send their children to any publicly funded school
of their choice, as long as there were spaces available. Sweden and New Zealand introduced
parental choice of school years later. This parental choice in education remained controversial
since it leads to unhealthy competition between the schools to an extent of affecting service
delivery (Le, 2007).
As the world enters the post-industrial era, the professional division of labour becomes
increasingly detailed and demands of enterprises for external service providers are increasingly
broad and specific. Information and communication technology has been introduced to ease the
work in the industries hence the growth of the service economy (Jin, Z. 2011).
Establishment of an E-skills hub in Durban University of Technology has enhanced training staff
in information systems and information technology, improved the administration ,governance,
and eased decision making process, planning as well as enhanced remote learning. The hub has

4
played a big role in empowering professional development of political, civic and community
leaders on the value of ICT systems.(Theo ,2012)
Human Resource Management deals with organizing and planning, it as well deals with staffing.
Staffing in this case depends on various environmental issues like fluctuating economic
conditions and global completion, choice and availability within the local job market and finally
completion for scarce skills (Price, A. 2011). Human resource is a key driver in any organization,
if employees are not satisfied it‟s unlikely that the organization as a whole will be productive and
offer quality service, hence it is important to set attainable employee performance indicators that
are aligned with the organization goals and objectives (Huselid, Becker and
Beatty,2005).Performance indicators are valid and effective when applied in a consistent and
comprehensive manner.(Bean and Gerathy 2003)
There has been growing attention to the effects of organizational work practices lately, especially
on employee job performance , the level of job demands placed on employees poor job design,
increase in work load ,time pressure and the degree of job autonomy or control afforded to
employees are significantly related to low job performance. These practices have been argued to
be detrimental to individual job outcomes that is quality service and productivity. (Griffin et al,
2007)
Today Kenyan Government is pursuing Vision 2030.Vision 2030 is the country‟s new
development blueprint covering the period 2008 to 2030. It government is a critical player in
achieving Kenya Vision 2030 are the universities. This is because education and training at
university level, according to the Government ,is expected to Impart hands-on skills and capacity
to perform multiple and specific national and international tasks, Create dependable and
sustainable workforce in form of human resource capital for national growth and development
,create a strong national research base at various sectors of economic and national development
and bridge the gap between theory and practice in various disciplines of education and training.
Hence justifies current concern that they provide the kind of education and training expected of
them. The stakeholders need an assurance that there is quality in provision of university
education in Kenya (Republic of Kenya, 2006).Universities should promote the MDGs more

5
directly by inculcating and translating them into every facet of institutional operations, by
ensuring that each MDG finds expression in university policies (Kotecha, 2006).
Investing in higher education is critical to achieving the MDG targets .This is by first looking at
the neo-liberal paradigm, which has influenced much policy thinking on how higher education
has to be provided in the context of the „knowledge economy‟ era there has been greater
advocacy towards privatization as critical to attaining the balance between access, quality and
equity in the higher education system. The second shift has been the steady expansion of public
universities, both in terms of student numbers, institutions and localities. Whereas the
developmental university inherited from the colonial period was often urban based and served a
limited number of students, an emerging trend, and which is being translated into policy in
Kenya by localizing the territory of the university, to deurbanize the university as a symbol of
modernity and establish it as an institution physically inserted in rural life and responding to the
social development challenges of rural areas. The third conceptual trend has been in the switch
from the perception of the university as a national institution, whose intellectual work cascades
from the national to the local, to a university as a local institution that should facilitate local
students and elites to have access to national resources. (Mohamedbhai, 2008).
University education needs to be responsive, adoptive and proactive to the extent of individuals
and organizations to make full use of its resources. The relevance of education to economic
survival has been recognized by successive governments over the last century and has been a
major influence on their education and training (Shultz ,1986). This is supported by( Forret
,2007) who notes that, with the global approach to production and service provision, the factors
which will determine the economic future 4 will be the quality, relevance, scale, and cost-
effectiveness of its university education and training.
1.2 Statement of the Problem
Public universities have become an area of concern by many people due to emergence of many
private universities in the county. The difference of interests by various concerned staff unions
has brought up misunderstanding hence deteriorating the quality of services being offered.
Politics in selection of various university heads, low bargaining power of the staff unions due to

6
external related forces has negatively influenced staff performance and quality of work(Nzuve,
2010),
Organizations of all types including learning institutions have, in recent times, found themselves
grappling with the challenge of being efficient and effective in meeting their goals amid rising
demands from various stakeholders(Kalb, 2010). University education seeks not only to
generate, transmit, store and retrieve knowledge but also form persons of virtue and integrity.
University education trains leaders who are critical, creative and innovative .Such leaders in
training are offered the challenge of actualizing their potential and transformational society
(Casas, Cabrillo & Puchades 2013).
A report by UNESCO emphasizes and states that, issues of Quality of Education , rather than
mass production, needs to move to the forefront of the educational agenda of policy makers at
higher education level. Considering the huge public and private investment in university
education of between US$588 to US$627 million per fiscal year , there is an urgent need to
evaluate how infrastructure, the cadre of qualified tutors and other resources in place ,and the
quality of teaching and learning(UNESCO, 2003)
In most developing countries higher education exhibits severe deficiencies, with the expansion of
the system an aggravating factor. A lack of quality issues in the expansion of university
education in Kenya, information about institutional quality makes it difficult for students to
make choices about their education, making it hard to enlist consumer demand in the battle to
raise standards. Developing countries are left with a formidable task expanding their higher
education system and improving quality, all within continuing budgetary constraints (Kombo,
2012)
The Inter-University Council for East Africa Raised concerns in their report on a survey on
employers on quality of graduates .The survey revealed disturbing facts that between 51% to
63% of the graduates in Kenya were found to be unfit for jobs and lacking job market skills. In
the same year, on similar grounds, the Council of Legal Education of Kenya rejected the
applications to practice law from graduates of several public and private universities in Kenya.
(IUCEA, 2014)

7
Gradually, public universities have moved to establishing town campuses in major urban centers,
such that it is now possible to find a town campus of a public university housed in single-room
apartments. This expansion has been articulated in terms of higher education institutions
responding to development requirements in the towns . But far from it, the campuses and the
courses offered are influenced more by commercial considerations; the competition by the
various universities to enroll more students, as a way of generating more revenues, than
increasing the contribution of the institutions by engaging in social policy.(Oanda,2010)
The increasing number of students accessing universities would be going through low quality
academic processes, with the effect that increased access to universities may not necessarily
result in a realization of equality as fairness, equality of opportunity or fair distribution of wealth
in the long term (Tettey, 2010).
The Commission for University Education (CUE) ordered the closure of 11 town campuses of
two public universities . The commission has launched a colossal audit of all public universities
with the hopes of filtering out sub-standard providers to boost the reputation and performance of
Kenyans higher Education. This comes at a time when sector professionals have voiced concerns
that rapidly rising student numbers have compromised the quality of academic provisions
coming out of Kenyan universities (CUE,2016).This has made (Professor David Some) the Chief
Executive at CUE and the education Cabinet secretary to request for an action plan to address the
issues and have given a deadline to the same effect. The researcher therefore decided to carry out
research in Public universities satellite campuses in Nairobi County Due To Time Limit. In this
study the researcher wishes to establish the factors influencing quality service delivery: A Case
of city Campuses in Nairobi city county
1.3 Purpose of Study
The purpose of the study was to analyze the factors influencing quality of service delivery in
public universities in Kenya case of public universities in Nairobi City County.

8
1.4 Objectives of the study
The study was guided by the following objectives: -
i) To determine how leadership influences the quality service delivery of public universities
in Nairobi City County, Kenya. .
ii) To assess the influence of competitiveness on quality service delivery of public
universities in Nairobi City County, Kenya.
iii) To examine how institutional funding influences quality service delivery of public
universities in Nairobi City County, Kenya
iv) To assess out how technological changes influences service delivery of public
universitiesin Nairobi City County, Kenya
v) To establish how human resource management influences service delivery of public
universitiesin Nairobi City County, Kenya
1.5 Research Questions
The study was guided by the following research questions: -
i) How does leadership influence quality service delivery of public universities in Nairobi City
County, Kenya?
ii) How does competitiveness influence quality service delivery of public universities in
Nairobi City County, Kenya?
iii) How does institutional funding influence quality service delivery of public universities in
Nairobi City County, Kenya?
iv) How do technological changes influence the quality of service delivery of public universities
in Nairobi City County, Kenya?
v) How do human resource management influence service delivery of public universities in
Nairobi City County, Kenya
1.6 Significance of study
The results of the study helped the researcher to identify the dimensions and elements that
influence quality service delivery in public universities city campuses of Nairobi County in the
five factors discussed as well as the entire continent. This research was hoped to assist the

9
policy makers who formulate policies to improve service delivery in the economy . The study
was also hoped to be beneficial to the Commission of University Education (CUE) in
particular the department that monitors quality of higher education, as to look specifically into
some of the key areas to work and improve on, to ensure that there is high quality of services
rendered in this institutions which in turn reflects on the end product who are students.
Future researchers will have a basis of study in research. They will also have an opportunity of
enhancing the research of the study topic from the recommended research areas. The research
distinctive knowledge of key factors that inhibit them form delivering their services fully to
their clients as a way of satisfying their needs. More importantly, to advise all stakeholders to
play their part and this will enable the institutions to succeed as a whole.
1.7 Assumption of the study
The researcher assumed that the public university city campuses could provide assistance as far
as the research was concerned. The researcher also assumed that respondents would be honest
and give adequate information to the researcher without fear or any kind of reservation. The
researcher further assumed that the economic, social and other factors with regard to public
universities city campuses were constant
1.8 Delimitation of the study
The study was limited to public universities in Nairobi City County. The county was selected
because it has the most city campuses of public universities in Kenya and the time frame
provided for research could only fit the scope. The study target population was the students and
the staff(academic and non-academic) in Nairobi city county.
1.9 Limitation of the study
Students varying lecture times was a great challenge .However the researcher had to seek one
trained research assistant who was more flexible and was available at given times when the
students were available before or after the lecturers.
Lack of adequate resources in terms of finances was another key limitation. The researcher took
longer than expected to complete the research so allow time to raise funds required.

10
Finally some of the respondents didn‟t have enough time to respond to the questionnaires
especially the lecturers, hence the researcher had to leave the questionnaires behind to give the
respondents enough time to finish up at their convenient time.
1.10 Definitions of Terms as used in the study
Distance learning: Distance education is teaching and planned learning in which teaching
normally occurs in a different place from learning, requiring communication through
technologies as well as special institutional organization.
Human resource management: This is having a proper laid down recruitment process in the
public institutions right from recruitment to placement, that is fair and transparent. Having an
effective performance development system and a having regular employee training as per the
identified needs.
Institutional funding: In this study this refers to the fund required to run the day to day
activities of the entity and the long range projects of the academic institutions. This funds are
either from the government or other designated sources. For any institution to have a credible
financial record regular audits are essential to ensure accountability .The need to set aside some
funds for academic research for both the students and lecturers is a key driver to growth of the
of a firm , institution to deliver quality services in a learning institution in relation to the
other institutions in the same market segment as well as looking into the position of the
institution globally and the position of the graduates in the job market.
Leadership: This is having an efficient decision making process which is timely and all
inclusive in the public universities. Having regular sessions where employees are able to air their
bureaucracy and autonomy is minimal.
Quality Service Delivery: This is comparison of the expectations with performance of services
offered by public universities.
Technological changes: This is the need to embrace technology in academic institutions in
order to enhance growth and develop. All stakeholders and staff in the public universities need

11
to be trained regularly with regard to technology and the need to incorporate modern
technology and equipment.
1.11 Organization of the Study.
The study encompasses five chapters. Chapter one looked at the background information to the
study, the statement of the problem, the research objectives and questions, purpose and
significance of the study, assumptions, limitations and delimitations of the study and definition
of significant terms.
Chapter two was a review of literature on factors influencing quality service delivery.
Highlighting theoretical information covered in the study with the aim of identifying knowledge
gaps.
Chapter three dwelt on the methods of carrying out the research study. It covers the research
design, target population, sample and sampling techniques, methods of data collection, research
instruments, validity and reliability of the instruments, operational definition of variables,
methods of data analysis and the ethical considerations of the research.
Chapter four covered data presentation, analysis and interpretation. Chapter five focused on the
summary of findings, discussion of the findings, recommendation and lastly suggestions for
further studies.
`

12
CHAPTER TWO
LITERATURE REVIEW
2.1 Introduction
This chapter covered proper review of the literature of the research done on quality
service delivery by various researchers. The researcher reviewed theories related to
research and with this the researcher was able to locate the gaps that the other researchers
left and was able to come up with solutions to this gaps. The chapter also looked at
conceptual framework which assisted the researcher to relate both independent and
dependent variables .
2.2 Concept of quality service delivery
Services must, of necessity concern people dealing with other people (Mwendar, 2007). Service
as a concept has been defined by different authors differently. Rust et al (2006) defines service
as any act or performance that one party can offer to another that is essentially intangible, and
does not result in the ownership of anything. The production may or may not be tied to a
physical product (Kotler, 2009).
Quality is an issue that cannot be avoided in education at present and what institutions do to
ascertain quality turns out to be most important and effective of all efforts and initiatives.
However the entry of “private” providers of high education coupled with crying voices of
declining government funding to public institutions is a response to therein increasing demand
for higher education that has caused decline in the quality services delivered in the public
academic institutions (Basheka et al 2009).
The quality of higher education is mainly affected by the changing University customs
characteristics, Increasing competition, Rising costs, and the impending crises. Hence the
institutions of higher education need to continuously improve and strengthen themselves or else
they cease to be centers of academic excellence (Mpaata, 2010) .

13
Service delivery in Public institutions and in particular Public universities was on great concern
in 1960s.However this has been compromised due factors such as universities annual Research
grant program only allocating up to Ksh.500,000 per school (Sulo, 2008).
There is inadequate and lack of lecturers to accomplish heavy teaching work load. The
introduction of trimester classes by the government which doubled the doubled government
intake inadequate facilities‟ to expand the universities creation of counties as per the new
constitution among others. (Moi university research policy, 2008).There are as many different
ways of conceptualizing quality as there are different types of in higher education. But at this
particular point in its life cycle Kenya‟s higher education system urgently needs to educate
train, and develop an information-age workforce in order to achieve economic transformation in
the next several years (Nyangau, 2014).
2.3 Leadership and quality service delivery
Leadership has many definitions but no real consensus; essentially it is a relationship through
which one person influences the behavior or actions of other people. Good leadership is about
accountability and transparency which gives people under the leadership a reason to confide in
them. One of the critical roles of management is to create a work (Micheal, 2008). It also
includes influencing these employees‟ decision to be committed and remain with the
organization even when other job opportunities exist outside the organization.(Beardwell, 2007)
The role of leadership and a supervisor is crucial in staff retention, and argues that employees
leave managers not companies (Micheal, 2008).
Employees are more likely to remain with an organization if they believe that their leaders
,shows interest and concern for them ,if they know what is expected of them, if they are given a
role that fits their capabilities and if they receive regular positive feedback and recognition. The
quality of relationship an employee has with his or her immediate leaders elongates employee
stay in an organization (Ferreira, 2007 cited in Michael (2008). Research conducted on the state
of South African Training industry indicated that management style was the most prominent
employee retention factor in South Africa. The leadership in the universities who include top
management and Chairmen of Departments who are the immediate supervisor to the academic

14
staff should play crucial role in portraying to the staff that their University is the employer of
choice. (Netswera, 2005)
The universities‟ top management and Chairs of Departments (lecturers‟ immediate supervisors)
are expected to present the university as a brand employer. This is achievable by showing
interest and concern for lecturers, communicating to them beforehand what is expected of them,
ensuring that they are given the job that fits their qualifications and by the administration
themselves delivering what lecturers expect of them. Academicians expect their employers to
provide good leadership and sound management skills, fairness equitable pay, impartiality,
consistency in applying rules and acceptance of union involvement and transparency in
promotion and recognition ( Krivokapic-Skoko ,2006)
In many African Universities leaders are not recruited and awarded for their leadership potential
but for their academic qualifications, research, teaching and community service and rarely
receive critical training in strategic planning, budgeting, human resource development and
faculty management (Sifuna ,2012).Further observation was that many senior managers/ faculty
heads take themselves as academics and not as leaders. They feel that they are not responsible
for leadership and management of the activities in their faculties and departments. This in most
cases has led to problems in how work/ activities of universities are coordinated. Poor
coordination of activities could result in poor service delivery (Bryman, 2007).
Leadership style in an organization is one of the factors that play significant role in enhancing or
retarding the interest and commitment of individuals in the organization (Obiruwu et al 2011).
Leadership issues includes trust, clear and honest communication, transparency, advocacy,
individual consideration and respect (O‟Neill 2008). Academicians wanted autonomy, job
discretion and participation in decision making. Poor management; lack of communication,
openness, transparency; lack of professional autonomy and lack of fairness in promotion lead to
perceived psychological contract breaches and hence low quality services(Krivokapic-Skoko,
2006).

15
Accountability failures in leadership is a key cause of weak service delivery. Accountability is
needed between policy makers in this the leaders, service providers and service users, with the
key relationship being direct accountability between providers and users. In developing countries
this accountability relationship is often missing. Traditionally accountability mechanisms have
been divided into „vertical‟ where external systems are used by non-state actors to hold the state
to account or „horizontal‟ where internal checks and balances are in operation. New types of
accountability are now emerging which tend to be more informal and utilize new sites of
engagement in online complaints forums. (Joshi, 2008).
The impact of transparency and accountability on service delivery has always been an underlying
motif in the literature on service delivery. Accountability as a central theme of the debates on
service delivery however, only took root after the World Development Report of 2004 which
identified failures in service delivery squarely as failures in accountability (World Bank Group.,
2004) .By showing how the „long route‟ of accountability through public institutions the world
bank report argued in favor of strengthening the short route direct accountability between users
and providers. (Sirker, 2007). The WDR sparked off a spate of work that examined ways of
strengthening the short route: from amplifying voice, increasing transparency and enhancing
accountability (McNeil, 2006).
The CUE should be more proactive in promoting a culture of accountability in higher education
leadership. This can be achieved by the creation of a broad policy framework that would require
public universities to collect and publish pertinent data regarding performance relative to various
indicators of accountability such as student learning outcomes assessments, student satisfaction,
graduation rates, faculty productivity and research output, quality of faculty, mission focus, and
the level of student success in the labor market following graduation (Lederman, 2013).
Human and financial resources are crucial determinants of service delivery , however availability
of resources does not guarantee efficient delivery. Institutions and institutional arrangements
appear to be very important determinants of service delivery. The quality of institutions for
service delivery can, therefore, be evaluated on the degree to which they promote accountability
in their leadership within the service delivery chain. Thus, linking institutions to service delivery
requires a clear understanding of the factors that impact on service delivery and how those
factors vary across institutions.

16
Leadership is also about ensuring there is an all-inclusive decision making process, fair
delegation duties and well as accountability that is leaders are expected to be autonomous.
Autonomy is the degree to which an employee exercises power relative to his or her job. As
emphasized by self-determination theory ,Autonomy concerns an experience of choice and
feeling like the origin of once actions (Ryans and Deci 2008).Autonomy is fostered by the
leadership style that offers opportunities ,participation, providing meaning ,acknowledges
followers for perspective and encourages self-initiation(Deci et al 2001)
Autonomous work may satisfy higher order needs for achievement and accomplishment which in
turn can generate positive regard for the employing organization and higher levels of intent to
stay. Autonomy is an important construct in faculty value systems however the current
competitive environment may impinge upon faculty autonomy due to external demands and thus
diminish their intent to stay. A politically com-promised university management cannot promote
a delivery of quality education. It has also been found that tribalism and nepotism hinder equal
employment opportunities in universities, as they promote negative ethnicity and intolerance
from university administrators (Gitahi, 2010).
Kenyan public universities do not have systematic approaches to recognizing the contributions of
staff within the university and national levels which contributes to turnover and discouraged
innovation (GOK, 2006). Academic staffs are the core employees in universities and their
contribution in these institutions should be overtly made known for them to feel valued. From the
reviewed literature it is postulated that extrinsic factors (leadership, distributive justice, work
environment, salary) and intrinsic factors (promotion, training and development, autonomy and
recognition) determine academic staff retention (GOK, 2006).
The quality of services delivered is an important determinant of people‟s well-being for a given
bundle of resources. Resources are critical to the delivery of services to clients. But resources are
just only one, and sometimes a small component, of the performance factors that impact on the
quality of service provision. Recent evidence shows that even when resources are allocated for
provision of services, a large portion of the resources might not reach the intended clients. In
some cases, services may not even be provided because frontline providers do not show up to
work, resulting in poor delivery of services. The implication is that availability of resources does

17
not guarantee that intended beneficiaries do in fact receive the benefits from the resources
allocated (Okwakol, 2009).
Offering quality services to customers its key, but we should not forget that staff retention is
also an important aspect. According to (Buche, 2012). academic staff retention refers to the
process of the ability of an institution to not only employ qualified academic staff, but also retain
competent staff through the establishment of a quality work-life, motivated staff climate, best
place of work, and being an employer of choice, depending upon dedicated formulation and
execution of best practices in human resource and talent management. Staff retention involves
influencing academic employees‟ decisions to be committed and remain with the institution,
even when job opportunities do not exist within the organisation, by reducing structural change,
and reducing change in administrative demands and the demands of quality reviews, while
maintaining high academic standards. This is because universities, by their unique nature, serve
as a storehouse for knowledge and very few institutions can afford to employ, train and permit
their most valued and talented employees to leave when it is difficult to find better replacements
(Netswera, 2005).
Retention of talented academic employees is at a critical juncture, as low retention represents a
potentially large, yet controllable, organisational expense and demand and competition for highly
qualified academics has intensified. In order for higher education institutions to effectively
manage and retain their academic employees, they should pay specific attention to the
importance of job satisfaction and its effect on the performance level of employees. According to
Dockel, Basson, and Coetzee (cited in Mubarak, Wahab , & Khan, 2013) compensation, training
and development, and promotion are the most important retention factors for skilled employees.
Employee intention to leave or stay not only depends on work factors, but also on non-work
factors. These authors are of the view that the issues within the broader areas of work-life and
retention have a significant, direct, or indirect impact on the intended turnover of academic
employees. (Moorhead, 2009) .However, in the higher education context a blend of both
transactional and transformational leadership is recommended, while transformational skills are
highly recommended for their vision and sense of mission, transactional skills focusing on the
exchange of work for various types of rewards are critical (Basham,2012). Historically,

18
organizations were viewed as learning systems and success depended on the ability of leaders to
become direction givers and on the organization‟s capacity for continuous learning (Garratt,
1987).
Transformational leaders are at the top of their functional specialty and have limited perspective
to see that change is required and to consider the consequences of continuing with the same
practices (Bass et al, 2003).Many organizations have been performing badly yet they claim to
have great leadership. Effective leadership in universities is measured through quality service
delivery to students and staff which then transforms to superior results. Followers should have
confidence and satisfaction in their leadership. Many universities around the world operate
multiple campuses and programs and these have proved to be difficult to coordinate and manage.
The multiple duties and responsibilities for management could compromise quality service
delivery in universities thereby exposing the leadership of the institution. (Astin , 2000).
Implementation of quality management systems in horticultural industry in Kenya is faced by
many challenges such as employee resistance, lack of qualified personnel, lack of management
commitment and high financial costs which will impact on the service delivery (Awino,2012).
(Iseu ,2013) established that there existed a significantly strong 5 positive correlation between
extent of participation, top management commitment, school culture, capacity building and
experience and heads of departments‟ participation in TQM among secondary schools in
Makueni County, Kenya. (Muturi,2013) found out that the main problems towards TQM
implementation in Kenyan SMEs was lack of management/ leadership commitment, employee
participation and employee training
To encourage retention in higher education institutions, (Netswera, 2005) suggests that the
following elements are of importance for an effective human resource management:
Communicating how each employee contributes to the corporate vision and mission, developing
a climate of trust, improving the skills level of the managers who supervise professional staff,
providing management training, including effective leadership skills, by emphasising
development clarifying the understanding of employees‟ needs and reinforcement of frequent
communication.

19
Promotion especially for academic staff is dependent on teaching, research and publications
however, due to financial constraints; non-prioritization of research by government and
inadequate publishing facilities, publishing of refereed articles has become a monumental
challenge for Kenya and other African academics (Kipkebut, 2010).
Promotional procedures in African Universities are long, stressful and cumbersome, while the
requirements are unreasonable, for example possession of a doctorate as a prerequisite for
promotion beyond the position of a lecturer (Tettey, 2006). In Kenya, other than the inconsistent
promotion criteria, another challenge in Public Universities was how to de-link promotion from
establishments and the availability given by the exchequer that this ends up denying deserving
persons their rightful upward mobility (Waswa, 2008).
Attractive remuneration packages are one of the very important factors of retention because it
fulfills the financial and material desires (Shoaib, 2009).The staff in Kenyan public universities
have functioned under conditions of extreme individual sacrifice over the last twenty years,the
rapid increase in student numbers has not been commensurate with staff numbers, the staff take
on additional load each successive year(Report of the public universities inspection board, 2006).
Salary retirement and job security have been shown to be important personal issues that may
affect the satisfaction of faculty members in colleges and universities. (International Journal of
Humanities and Social Science Vol. 2 No. 13; July 2012)
Rosser observed that although much of the overall research on faculty members suggests that
salary, in and of itself, is not the most important aspect of their work life and satisfaction, salary
is one of the primary reasons why Public university employees leave their institution. In
examining faculty workload and compensation of Australian academics, (Comm and Mathaisel
2003) cited in (Kipkebut, 2010) found that 51% of the faculty did not believe that they were
compensated fairly, relative to those other comparable institutions. As a result, 50% of the
respondents felt the need to work outside their institutions to earn extra income. According to
(Tettey, 2006) dissatisfaction with salaries is one of the key factor undermining the commitment
of academics to their institutions and careers, and consequently their decision or intent to leave.

20
Fringe benefits is another important aspect in remuneration. Fringe benefits refer to non-wage
compensation provided to employees in addition to their normal wages/ salaries.They may
include housing, paid leave, paid vacation, group insurance (health, dental, life ), tuition
reimbursement and funding for education. Fringe benefits are given to employees in order to
increase their economic security, enhance their satisfaction, corporate loyalty and retention.
(Tirmizi & Bashir, 2009) while studying the determinants of employee retention in telecom
sector of Pakistan posit that attractive remuneration packages fulfill financial and material
desires and thus enhance staff retention.
While, (Comm and Mathaisel, 2003) cited in (Kipkebut, 2010) on a study on faculty workload
and compensation of Australian academics, revealed that 51 percent of the faculty did not
believe that they were compensated fairly, relative to other comparable institutions. Staff
retention in African universities is highly influenced by dissatisfaction with salaries undermining
the commitment of academics to their institutions and careers and consequently their decision or
intent to leave. (Tettey, 2006)
2.4 Competitiveness and quality service delivery
One of the challenges facing public higher institutions is an increasingly competitive, marketing-
oriented and highly regulated environment. In this environment, these institutions have to
function, survive and compete, not only with one another, but also with the private institutions.
Hence public universities need to find new ways to compete if they wish to survive in this
dynamic environment. As indicated previously, leadership appears to influence service quality,
which is essential in gaining a competitive edge in this ever-evolving environment. Every
educational institution needs to understand its internal strength and weakness, and external
opportunities and threats (Kalb, 2010).
Most students in Kenya prefer private universities as they are guaranteed of uninterrupted studies
and are likely to graduate without any interruptions. Public Kenyan universities are from time to
time interrupted by either students strike or lecturers strike. Private universities provide a very
simple application process and have smaller classes hence there‟s a better student to lecturer ratio
and this means a better learning environment. Additionally private universities, have automated
many systems, providing better service to their customers which include ease in accessing

21
examination results, fee statements and registration of courses can all be done online. Most
importantly, they are now offering students an opportunity to study and pay their tuition fees
before the exams. This reasonable payment structure has allowed most parents to afford the high
tuition costs of private universities (Mwanafunzi, 2014)
In the latest survey by Web metrics which included 12,000 institutions, only two Kenyan
universities were ranked among the top 50 in Africa. The University of Nairobi was at number
26, while Strathmore was at position 31. The other public universities were almost at the bottom
of the list with Moi university being ranked at position 74, Kenyatta at 80 and Egerton at 97. If
these results were to be relied on, graduates from Kenya's universities will be subjected to a
judgment based on the ranking of the institution they attended, which raises questions of
employability, especially in the international labour market. The situation becomes serious
considering that local universities have been expanding at a breakneck speed with campuses and
constituent colleges taking over middle-level colleges, sometimes in disregard to opposing views
(Juma 2010).
Kenyan employers prefer graduates from private universities to public ones, a new study shows.
The research conducted by Moi University‟s School of Education noted that graduates from
private universities were more competent and exude high personal confidence as opposed to their
counterparts in the public universities as they seem to be more in touch with what employers
expect from them, and they are prepared accordingly( Mottanya,2015).
A decade ago private universities were perceived to be academically inferior to public
universities. Today, they are seen as mainstream institutions offering instruction of comparable
or even higher quality than public universities. The growing numbers of school-leavers will go to
great lengths to obtain much-coveted public or private university degrees. Until 1987, higher
education in Uganda was entirely a public venture. But because of the numbers of students who
qualify for higher education, the public sector could not meet the demand; public private
partnerships (PPPs) were introduced in the 1990s with a hope of improving the provision of
services, quality and accessibility of higher education.(University Word News, 2010).
Organizations engage in Strategic changes, Technological changes, Structural changes, Changing
the attitudes and behaviors of personnel, all aimed at achieving competitiveness and viability. As

22
a multidisciplinary practice, Organizational Change Management requires creative marketing to
enable communication between change audience and a deep social understanding about
leadership‟s styles and group dynamics. As a visible track on transformation projects,
Organizational Change Management aligns groups‟ expectations communicates integrates
teams and manages people training. It makes use of metrics, such as staff attraction, university
rankings, number of students interested in taking up courses and the extent of satisfaction of
employees to determine their relative standing compared to other institutions of higher learning
in terms of service delivery and relevance to the educational requirements of the economy.(Paul,
2006)
Despite the existence of PPPs in the Higher Education sector, the quality and accessibility of
higher education has continued to fall short of the stakeholders‟ expectations in many sub-
Saharan countries including Uganda, In Uganda, the National Council for Higher Education was
established by an Act of Parliament, and it has developed administrative and operation structures
to regulate higher education, to guide the establishment of institutions of higher learning, as well
as ensure that quality and relevant education is delivered. The higher education system is now
under the University and Other Tertiary Institutions Act 2001, which is a new legal and
institutional framework (Kasenene, 2010).
There is urgent need to invest in human resource for open and distance learning to expand and
for its potential to be realized .Notably, there is a serious shortfall in capacities for curriculum
design and course content(writers ,reviewers ,editors and curriculum developers )for production
and development of high quality learning materials. To develop high level human resource in all
areas in order to have adequate national capacities and capabilities such as subject experts,
technical operators and maintenance personnel are required. (Butcher, 2012)
The political leadership in Kenya has been quoted in the recent past of its intentions to increase
student intake to public universities through a double intake. This statement meant that each
public university will take higher number of students above the admissions of previous years.
This academic year (2011/2012), universities will be admitting 32, 611 students. This number is
8,000 more than the 24,000 students admitted the previous year (Musembi, 2011).

23
Australian universities face an uphill battle to command respect in a global higher education
environment that is becoming increasingly competitive (Chubb, 2005).They are struggling to
maintain parity with universities abroad and to cope with pressures from alternative providers of
higher education and training that have emerged in recent years with sector deregulation and new
communication technologies (Davis,2006).Amid claims that they have been perennially
underfunded by government (Bradley., 2008). Australian public universities will need to make
major adjustments to deal with a forecast decline in the numbers of fee-paying overseas students,
the source of income that has kept many of them afloat in the last three decades (Lavelle, 2008).
All universities compete for scarce public and private funding, for top-calibre teaching and
research staff, for the brightest and best students, for alliances with strong professional bodies
and scientific organizations and, most especially, for the levels of reputation, prestige and status
that attract all of these. Although cries for the Australian public universities to become more
competitive are growing louder (Slattery, 2009). It is possible that strategy shifts to effect
greater competitiveness will be too late for some (Craven, 2008).
Public universities in Kenya are operating in highly competitive environment locally and
globally and this call for management styles that enhance staff retention in order to gain
competitive advantage. There are major issues facing these institutions including massification of
higher education without commensurate increase in staff. This has created disillusionment
among the staff due to heavy workload. The situation is compounded by poor remuneration that
is given to the academic staff compared to their colleagues in the public and private sector. Brain
drain and brain in drain has resulted to these universities losing the already few staff and hence
raising capacity concerns. Majority of academic staff sent abroad for further studies do not return
(GOK, 2006).
institutions, leadership comprises the Vice Chancellors and their deputies down to the Chairmen
of Departments who act as the line managers. The role of these leaders in employee retention is
crucial since literature indicates that employee leave leaders and not organizations (Beardwell ,
2007).

24
Public universities should balance teaching load and quality offered so as to remain competitive.
Teaching load refers to the amount of hours assigned to a lecturer for teaching in a week. The
current University of Nairobi strategic plan (2008-2013) and the previous one (2005-2010)
recognize teaching and learning as the core business of the university. However, lecturers need
manageable teaching loads to enable them engage in research, student supervision and
consultancy which are key for the university‟s ability to enhance knowledge generation
preservation and utilization. A lot of workload is a stressor and reduces the productivity and
ingenuity of lecturers besides demotivating them.
Faculty turnover intent in urban public universities posit that heavy workloads, including
assignments to teach large classes, may generate hostility toward the organization and diminish
levels of faculty commitment to the institution (Daly and Dee 2006) .Increased teaching load is
caused by expansion of higher education, large classes and shortage of lecturers (Mutisya et al,
2010).Heavy workload increases stress level (Metcalf, 2005), while (Mohamedbhai ,2011) posit
that large classes do not only result in inefficiency in handling high student/staff ratios but also
lead to heavy teaching and administrative responsibilities that are affecting the quality of
education, while crowding out research and other non-teaching academic activities.
Reduction in the number and quality of research carried out by the teaching staff at universities
was due to overloading of staff with mainly teaching and marking duties. This might explain the
finding of the report of the Taskforce on the alignment of Higher Education, Science and
Technology sector with the constitution, 2012 (TAHEST), which found out that there is reduced
research activity in public universities to an extent that research publications had fallen to just
about 0.11 per full-time faculty member at University of Nairobi by the year 2007. (Olel, 2006)
Training are a major ingredient for continued growth and increased competitiveness of any
institution and with increased competition there is need for public universities to organize and
facilitate training and symposiums at all levels so as to remain at per with private institutions of
higher learning. Training is considered form of human capital investment whether that
investment is made by the individual or by the firm. Training is also defined as any procedure
intended to foster and enhance learning among employees and particularly directed at acquiring
job skills (DuBrin, 2009). Training means learning information and skills for the present job.

25
Development involves learning not only for the present job but also for the future jobs and
possible promotion opportunities. Development is defined as a form of personal improvement
that usually consists of enhancing knowledge and skills of a complex and unstructured nature
(DuBrin, 2009).
Currently, academic staff retention in public universities in Kenya is still a problem. The rate at
which employees quit their job in an organization is in many ways indicative of either
misunderstandings or availability of better opportunities elsewhere . High turnover is frequently
an indicator of low morale, poor supervision, unsatisfying work and poor working conditions .It
may be noted that escalating labor turnover may send messages to the remaining employees that
senior management does not care about the welfare and working conditions of employees.
(Nzuve 1997 cited in Okinyi, 2015)
Professional development is the engine that keeps the universities true to their mandate as centers
of ideas and innovation. (Tettey ,2006) Without efforts in this direction intellectual capital can
stagnate and the relevance of universities to society may diminish. (Rosser, 2004) emphasized on
the need of faculty members thrive on intellectual and collegial stimulation from their peers
when they attend professional activities and national and international research meetings. Thus,
development activities for faculty members continue to be an important aspect associated with
their professional work lives
Training should be comprehensive enough to allow employees understand the nature of work to
be performed. Therefore the training given should be appropriate to the type of work to be
performed (Nzuve, 2010). The management should therefore develop clear job specifications and
job descriptions to understand the required type of training in the organization to improve its
competitiveness. This is because, competition sometimes adversely affect service delivery. In
Britain, since 1989, parents had the right to send their children to any publicly funded school of
their choice, as long as there were spaces available and quality services. Sweden and New
Zealand introduced parental choice of a school years later. This parental choice in education
remained controversial since it lead to unhealthy competition between the school to an extent of
affecting service delivery (Le ,2007).

26
2.5 Institutional Funding and quality service delivery
Funding is perhaps the most powerful and pervasive policy steering change instruments available
to any government or organization. In fact, the resource dependency perspective of organizations
explains that organizations and universities, must actively re-organize their activities and
structures in order to ensure a continuous flow of various resources that are critical to their
survival and to the change process (Oliver, 2001)
According to (Carlucci and Schiuma, 2010)public organizations still face the challenge of
balancing the costs reduction and the continuous improvement of the service quality. Up to early
1990s, public Universities in Kenya were fully funded by government. Since then the
government gave in to pressure from the International Monetary Fund (IMF) to reduce
expenditure on education thus paving way to cost-sharing and corporatization of public
Universities (Oanda, 2008). These universities are thus endeavoring to generate their own
finances in order to remain operational in the emerging regional and global education market.
This shift in the style of business management seems to have occurred when university managers
may not have been ready, trained or equipped with business management skills necessary for
managing (Oanda, 2008).
The number of students in Kenya‟s universities is soaring up by 28% in 2014 compared to
2013. But, contrary to expectations, the government has cut funding by 6% for the upcoming
fiscal year, adjusting its higher education spending to US$588 million compared to the US$627.2
million allotted in 2014/15.The funding cuts will make it difficult for universities to cater for the
growing numbers of students taking courses, and they will necessitate strategies to secure funds
from alternative sources.Public universities are faced with both decreased government subsidies
and the removal of an important alternate source of funding, hence the need to allocate them
more resources to boost research and innovation(ICEF ,2015)
According to the, Economic Survey 2014 ,enrolments in Kenyans‟ public universities rose seven
times faster than funding, pushing universities more and more into income generating activities
to meet the costs of extra students. State capitation of public universities has nearly tripled over
the past three years, rising from US$247 million in 2010 to US$624 million in 2014. During this
period, enrolments have grown four-fold (Ng‟ang‟a,2014).Funding higher education has
emerged as one of the biggest concerns in Kenya, with the surge in student numbers.

27
Government subsidies are no longer enough and universities are going into commercial activities
.Kenyan families sacrifice so much for higher education and on analysis contribute more than the
government in funding this public good(Some, 2014)
Universities as corporate entities also presented the fear of a mismatch between students and
educational facilities that could lead to the lowering of the quality of education in Uganda. Since
the 1970s, higher education enrolments in Uganda have been growing at an annual average rate
of 10-20 per cent with limited improvement on facilities(Kasozi, 2005).Declining state funding
for higher education is a ubiquitous problem.(Santiago, 2008) reports that between 1995 and
2004, public expenditure per higher education student in Chile, Hungary, Austria and the United
Kingdom declined by 34, 28, 27 and 19 percent respectively.
In the USA, (Rizzo, 2004) shows that federal and state agencies have consistently decreased
higher education funding over the last quarter century. By 2004, the decline of state funding of
higher education translated into real institutional appropriation losses of US$ 2800 per student
significantly more than the US$ 1 ,700 increase in real average public four-year instate tuition
rates since 1977 (Rizzo, 2004). Further, it is argued that state funding for higher education in the
peak reached in 1979 (Finken, 2004).
The trends in university expansion has been an increasing mismatch between the academic
programmes that the institutions are offering and the knowledge needs of the economy according
to the Vision 2030 blueprint. The mismatch is deepened by the drive for the institutions to peg
the introduction of academic programmes not on the country‟s development needs but on
institutional strategies to generate additional funds. Subsequently, there has been increased
duplication in the academic programmes instead of diversification. Academic programmes in
architecture and surveying, agriculture, water, environment and energy do not attract students in
the institutions yet these programmes are critical to the country‟s development (Riechi 2008).
Regardless of all social and economic characteristics of any given country, all the costs of higher
education must ultimately be paid by a combination of four basic sources of finance: taxpayers,
students, and donor agencies (Johnstone,1986). The higher education funding calculus is such
that any cost shifted from one source must be shifted to another source ,given that higher
education costs are by their nature unavoidable, irreducible, and continually escalating

28
(Woodhall, 2008). The high costs are related to the natural economic character of the tertiary
education function that is characterized as both labour and capital intensive and has proven
throughout the world to be especially resistant to labour-saving technologies (Johnstone, 2004).
According to the (Ministry of Higher Education, 2012)University education is expensive and
requires huge investments by all partners. The average spending per student at the university
level was 31 times, 6 times, and twice as expensive in relation to primary, secondary and TVET
education, respectively. It indicates that university education through public universities is
particularly expensive to Government and is not sustainable with current resources. Public
universities will, therefore, have to reduce their dependence on the Government by diversifying
their sources of income as well as ensuring more efficient and cost effective use of institutional
resources. They will also be required to establish comprehensive financial management systems
that ensure efficiency in the application of resources. The Government will also increase the
incentives to encourage the growth of private universities in the Country.
There is need for public universities to adopt a Differentiated Unit Cost (DUC). This is defined
as the annual cost of providing a particular degree program per student, taking into account the
staff costs, facility costs and other institutional overhead costs. Each public university will set its
own DUC based on its own unique circumstances subject to a programme-based maximum
DUC. The maximum DUC will be determined by the Government in consultation with the public
universities.(Mwiria, 2007).
The introduction of DUC in public universities will eliminate the distinction between the
Government-sponsored and self-sponsored students in public universities. As a result, public
universities will need to develop appropriate staff compensation mechanisms and encourage
continued optimum use of university facilities through the provision of services to students in the
evenings and on weekends, with a view to increasing access (Mwiria, 2007). The challenges in
financing public universities include: inadequate budgetary support; inadequate funds for capital
development; lack of programme differentiated unit cost in provision of funds from Government;
inadequate internal income generation by the universities; and system inefficiencies.
In South Africa, as a percentage of Gross Domestic Product (GDP), state funding of higher
education declined from 0.82 percent in 1996 to 0.67 percent in 2006 (Cloete 2008). In Kenya,
various indicators illustrate declining state funding of higher education. From 1996 to 2000, state

29
funding for Kenya‟s public higher education as a percentage of GDP averaged 0.94 percent and
reduced to 0.74 percent in the period from 2001–2005 (Wangenge., 2008).
One of the ways in which extra funding has been raised locally to meet the cutbacks in public
funds, has been through securing increased student enrolment at relatively lower costs and
changes from grants to student loans. These developments have led to competition for students
as well as revenue. However, many of the ways to generate more funds have been clearly
market-like behaviours, some of which are for profit and others not for profit. But the manner in
which many universities have been implementing these programmes has raised serious doubts on
their impact and sustainability (Mwiria, 2007).
Most of the concerns relate to the quality of programmes provided, lack of legal protection for
students who register at satellite campuses, and lack of basic resources. Concerns have also been
raised about the academic staff in the public universities who spend the bulk of their time
teaching at private institutions and thus, prejudice their main function in the public institutions
which employ them. Another concern has been some cases of open fraud in which students are
registered and issued with certificates after a very scanty academic exposure (Kendo, 2007)
The higher education institutions are either private or public. Private institutions generate money
from fees and external aid, while public institutions get government grants as well as generating
funds from fees and donors. As the demand for higher education increases, it presents
educational entrepreneurs and managers with a challenge of making investment decisions by
which they can attain desired financial goals without setting fees structures that are so exorbitant
as to scare away potential customers. (Kayongo ,2010).
Several countries are in the process of incorporating more performance based assessment into
teaching funding decision. One of these countries is Australia. This would reward universities
that meet agreed targets in key areas including improving quality of learning and teaching and
outcomes for students from low socio-economic backgrounds (OECD-Norway Workshop on
Performance-based Funding of Public Research in Tertiary Education Institutions, &
Organisation for Economic Co-operation and Development, 2010).

30
2.6 Technological Changes and quality service delivery
The prevalence and increasing pervasiveness of information and communication technologies is
resulting in far-reaching change in how nearly every healthcare organization and healthcare
functions. While most sectors have embraced ICT with open arms, taking advantage of its
benefits to enhance customer service, connect with customers, reduce costs and increase market
share, the health care industry has been painstakingly slow in incorporating ICT to aid in the
delivery of healthcare services and the collection, management and use of health information
(Kabene, 2010).
Early automation of library was less impactful on identity and service delivery, it has now
proved to work due to the knowledge that people have been impacted on. This is because
manual searching of books used to take a lot of time than searching though the digital way.
(Hicks, 2014)
Technology has enhanced distance education in African Virtual University they rely heavily on
the Internet for the delivery of academic courses; digital library; the portal and many other
products. Unfortunately, slow Internet connection and low bandwidth in Kenya mitigate the
effectiveness of the long distance courses. Increasingly the issue of high costs for large
bandwidth is also a problem.(Juma, 2001)
Computing resources, both hardware and software are expensive for any university to afford in
reasonable quantities and quality. Technology is very dynamic and some universities cannot
cope with these changes in terms of cost and relevancy. Most university academics and students
have very low skills in ICT to the extent that AVU‟s digital library E-learning platform and
many other products are not fully utilized by faculty members(Mason, 2001)
Telecom firms usually have a huge base of complex legacy systems. These systems are disparate
with their own data. Integration (system and data) of such systems has been a problem. All this
has a heavy toll on Customer loyalty, Product lifecycle management and Process improvements.
Moreover, technologies are swiftly Converging; this in turn means that greater penetration of
broadband is necessary, to deliver the converged product bundles as quality of Service needs to
be of higher standards. Cloud Computing is one of the new technologies that brings many

31
challenges as to how the telecommunication companies can use it to their competitive advantage
(Oodan, 2011).
According to (Manyasi, 2010) ,while studying how using information technology could increase
access to higher education through distance learning in Kenya found that institutions of higher
learning lacked the necessary technology. The institutions had only a few computers, which were
used by lecturers to access internet services. Lecturers and administrators lacked instructional
competencies and information design for distance learning associated with delivery of high
quality services. Advances in Information Technology could provide solution for the demand in
university education in Kenya. However, there was insufficient institutional preparedness. Apart
from inadequate space and shortage of current books and journals, public universities did not
have satisfactory internet provision for the learners. This was a great impediment to provision of
quality teaching and learning. As was noted earlier, computers and internet services are integral
ingredients to modern day higher education without which quality of education suffers
2.7 Human Resource Management and quality service delivery
Staff attraction is about utilising the best of employee for the job and finding ways of keeping
these employees within the organization. It involves a range of ideas and human resource
practices that should all be seen as interlinked and focusing both on attracting employees to join
the organization through focusing on recruitment strategies and keeping those who are already
employed, especially those who possess scarce skills that are difficult to get from the labour
market and are more crucial to the organization. It is also motivating to the staff, covers both the
psychological aspects of the employee that is their perception, goals and behaviours and
operational aspects attached to the job or tasks for which they were appointed. It requires a
management approach that takes all factors both inside and outside the organization into account.
The work environments and the attitudes of the modern day employees have changed. Although
most employees today are self-directed and willing to work hard, they want to do so on their own
terms and expect development in the work environment (Webb 2008).
The Human Resource function of an organization needs to develop a compelling value
proposition that focuses on how it can increase the value of the organization‟s assets. For
decades, the human resources functions has been organized and staffed to carry out

32
administrative activities and people. To change business strategies and organizational designs,
human resource function is required. The strength of the HR function matters in the
sustainability of the working environment(Lawler, & Boudreau, 2009).
The majority of today‟s Human Resource practices benchmarks and measures still reflect the
traditional paradigm of excellence defined as delivering high-quality HR services in response to
clients‟ needs. Even as the field advocates more strategic practices , it is often defined as
delivering the HR services that are important to execute clients. This traditional service delivery
paradigm is fundamentally limited as it assumes that clients know what they need. (Lawler &
Boudreau 2009).
Employees who participate in decision making process at their work place with regard to change
that affects them are more involved with their work after the change as compared to employees
who do not participate in decision making regarding such change. This may be attributed to the
fact that these employees feel part of the decision and therefore part of the organization.
Rabindra (2007)
Performance appraisal done by the HRM department has been viewed as a painful annual event,
when the manager evaluates the employees‟ performance; it rarely has close links with the
overall mission and program of the organization that were designed to maximize human effort
(Boyd, 2004). Appraisal results have a very important role in the HRM activities of the
organization, a well-established appraisal system helps to make justified decisions and avoid
litigation by terminated employees (Mani, 2002).Yet, in the ideal case, a performance appraisal
system should establish a connection between the organizational and personal goals as well as
shape and change organizational culture towards a result-driven climate (Grote, 2000) .The
modern appraisal process is an essential part of organizational life, for it helps to justify, besides
compensation differentiation, such as promotions, demotions, selection validations and
terminations .A well-established performance appraisal system should render enough
information for determining a fair compensation. Although performance-based compensation
has been traditionally quite common, and sometimes complemented by experience-based
compensation, more contemporary compensation systems are based upon an employee‟s skills
and competence. Interestingly, a comparative study of the HRM functions showed that private-

33
sector companies tend to use skills-based or competency-based systems, while public
organizations prefer more traditional compensation systems (Budhwar, 2004).
New strategies in HR diminish employee rights hence affecting service delivery, it is becoming
more likely that employees hired into temporary and part-time positions will receive lower pay
and benefits and will be unprotected by civil service regulations or even collective bargaining
agreements.(Condrey,2010)
To be a strategic contributor, HR executives needs to know HR, an expert understanding of
business strategies, organizational design and change management and they need to know how
integrated HR practices and strategies can support organisational designs and strategies. This
role requires extending their focus beyond delivery of the HR services and practices that are
associated with being a business partner to a focus on making decisions about talent,
organizational design, and business strategy (Lawler & Boudreau, 2015). Netswera, (2005) says
that research conducted on the state of South African Training industry indicated that
management style was the most prominent retention factor in South Africa.
2.8 Theoretical Framework
SERVPERF (Service performance) theory supports this study. It enabled the researcher and
readers to understand the basics of quality service delivery in public universities. The
SERVPERF theory, argues that customer preferences are more relevant to a long-term service
quality than impending differences in expectations and performance(Cronin and Taylor 1992) .
Perceived service quality is said to be a reflection of the firm‟s performance. On using the firm‟s
service, customers are said to form an attitude towards service quality performance. This
satisfaction level with regard to the products / services indicates how the firm performs. The
SERVPERF model claims that to find the performance of a firm in service quality, all that is
required is to collect data by directly asking the customer through a simple survey and a
questionnaire.

34
(McDougall and Levesque, 1994) have claimed that knowing the relative importance of each
dimension of service quality can help service providers to prioritize their efforts and resources
and deploy them more effectively to improve each dimension of service quality. Furthermore,
this knowledge allows institutional leaders to concentrate on those dimensions that offer the
greatest opportunity to enhance customer satisfaction and their loyalty. SERVPERF measures
actual performance based on customer satisfaction.
Universities should ensure that they are able to establish what the students and employees who
are the backbone of institution value and should work towards continuous improvement to
ensure they meet and surpass their stakeholder‟s expectations. SEVPERF theory clearly
elaborates and clearly outlines how public universities should device ways to ensure the goals of
the institution are met and hence the Mission and broader vision of the institution by offering
quality services
2.9 Conceptual framework
The use of a variety of measures of service quality in the private sector as critical indicators of
both organizational performance and general customer satisfaction is widely accepted and has
given rise to considerable empirical research. Organisations operating in the public sector have
also come to the realization that customer service and quality are critical strategic issues. It has
also been noted that public sector service dimensions are somewhat different from private sector
as they are not threatened by competitors and hence lack in continuous improvement through
competitive strategy. Conceptual framework is defined as an interconnected set of ideas
(theories) about how a particular phenomenon functions or is related to its parts .

35
Independent variable
Dependent variable
Dependent Variable
Figure 1: Conceptual Framework
MODERATING
VARIABLE
Political
Quality Service delivery in
public universities
-The ratio between students and
lecturers
-Level of education and
experience of the lecturers and
administrative staff.
-Number of graduates per
academic year vie sa vie the total
number of students expected to
graduate in such a particular
academic year.
-Number of students who are
satisfied with the administrative
services offered by the university
-Average percentage in number
of classes attended by the
lecturers per semester
Competitiveness
-Frequency of external examiners coming to access
main semester examination
-Number of trainings attended per year by staff
-Existence of variety of programs in the institution
-Graduates being competitive in job market.
Leadership
-Existence of proper communication policy
channels
-No. of procedures and processes that decisions
take.
-Existence and frequency of meeting and open
sessions where staff members take part in decision
Institution funding.
-Number of audits in the institutions that enhance
accountability
-Percentage of money received from HELB to
support the students in fee payment
-Availability of funds allocated to students for
research
Technological Changes
-The No. of trainings staff are offered by the
University with regard to technology
- Availability of proper machines and gadgets in the
offices.
Human Resource Management
-Existence of a proper laid down strategy and
structure on recruitment, selection and placement.
-No. of trainings offered to staff by the University.
-Existence of an efficient performance development
sand appraisal system.

36
2.10 Knowledge gaps
Various studies have been conducted on quality service delivery in public universities in Kenya.
The researcher reviewed some of this studies and found none of this studies have been done in
Nairobi city county and have discussed the five factors combined .The researcher therefore wants
to fill this this gap that previous researchers have not filled. Table 2.1 shows knowledge gap as
far as the study is concerned .This is in relation to the previous studies that have been conducted
by various researchers

37
Table 2.1 Knowledge gaps
Variable Author Findings Knowledge gap
Leadership Khurana & Anand 2010
Le, 2007
Netswera,2005
Gitahi,2010
Leadership style that
is not all inclusive
and lack of autonomy
has negative effects
on employees.
Did no look at how best
proper communication system
as well as open door policy
can enhance leadership in an
organization.
Competitiveness Kalb ,2010
Craven, 2008
Mutisya,2010
Competition from
private universities
has had a great
impact.
No suggestions on how
introduction of external
examiners to evaluate exams
and global ranking of
universities serves as a
complacent competitive tool.
Institutional
funding
Kasozi ,2005
Mwiria, 2007
Rizzo, 2004
The allocated funds
to public universities
are only a small
fraction the
universities
requirements.
Study did no look at how best
public universities should
ensure they embrace
accountability and also
engage in self-financing
projects to be sustainable
Technological
changes
Mason,2001
Hicks,2014
Juma,2001
Most public
universities are not
unto date in
technology as it is an
expensive investment
as it is dynamic
Did not propose the
importance of training both
academic and administrative
staff on the dynamic
technological advancements,
as to be in line with global
requirement.
Human resource Condrey,2010
Lawler&Boudeau,2009
Staff empowerment
and growth is key in
every institution.
Little insight on the need to
sensitize workers on the
required skills so that they can
apply them accordingly. Have
a clear recruitment process as
well as an efficient
performance development
system
2.11 Summary of Literature Review
From the literature reviewed it emerged, that this proportional relationship between different
factors and quality service delivery could be affected by other factors outside the control of the
public universities. Inclusive leadership is the backbone of a successful institution. Leaders
should always strive to meet and surpass their stakeholder‟s expectations. To ensure that they are
on top of the bar interms of competitiveness public universities should strive to always be at per

38
with the market as well as the global standards and this can only happen if they have enough
funds to finance various projects in information technology and other developmental projects.
Human resource is the single most important asset of any firm hence its of great concern to
always be aware of the employees needs at any particular time. Factors such as attitude of people
towards work and the organization culture have far reaching consequences if their people who
do not have the initiative and need a lot of supervision. Other factors include the prevailing
political environment.

39
CHAPTER THREE
RESEARCH METHODOLOGY
3.1 Introduction
This chapter outlined the methodology that was used in the collection of data pertinent in
answering the research questions. The areas that were covered are research design, target
population, sampling procedures, validity and reliability of research instruments, data collection
procedure, data analysis and presentation.
3.2 The research design
The researcher used descriptive cross-sectional survey design to establish how the five factors
influence quality service delivery. This is because the researcher needed to assess thoughts,
opinions, and feelings of the respondents. According to (Heppner et al 2008), surveys design is
normally used when collecting data about people‟s attitudes, habits or opinions and other
possible behavior. A descriptive survey design allows for quantitative description of the
antecedents of service quality in a higher education context. This research design allowed for
generalization of the sample survey findings. The appropriateness of cross sectional design is
anchored on its versatility, admissibility of questionnaires and its leverage in collection of data
from a large number of respondents in a relatively short period.
3.3 Target population
The population of interest comprised of students in public universities in Nairobi city county in
particular satellite campuses. Nairobi County has 12 public university satellite campuses. The
researcher chose 5 satellite campuses due to time constraints and finances. The choice of the five
campuses was also based the on the duration that the campuses have been operational; 3
campuses were operational for more than five years and 2 were new in the market. The target
population comprised of 7740 undergraduate students and 94 full time staff(academic and
nonacademic) from the 5 satellite campuses ( CUE ,2015 and University Registrars) The study
adopted a stratified random sampling procedure. From the target population, the students were
stratified into three universities and a proportionate sampling procedure employed to ensure that
the numbers of samples drawn were relative to the size of each stratum. Stratification was
further applied in choosing the year of study of the respondents. Because this study was
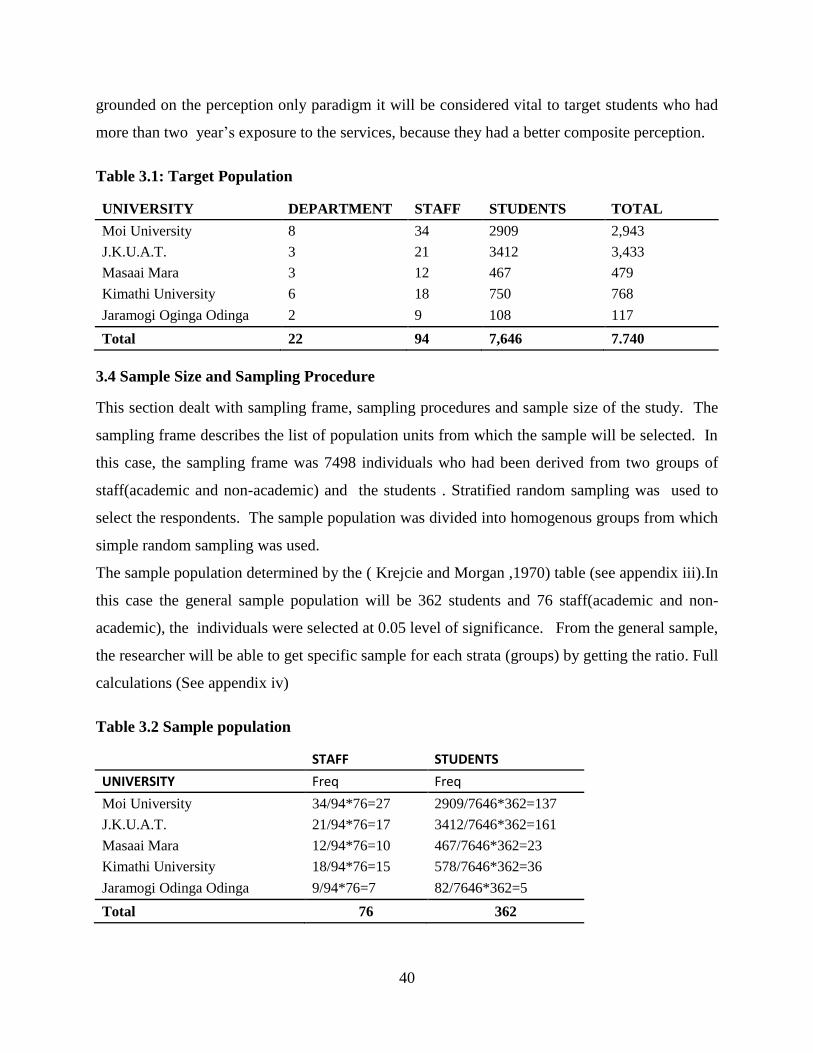
40
grounded on the perception only paradigm it will be considered vital to target students who had
more than two year‟s exposure to the services, because they had a better composite perception.
Table 3.1: Target Population
UNIVERSITY DEPARTMENT STAFF STUDENTS TOTAL
Moi University 8 34 2909 2,943
J.K.U.A.T. 3 21 3412 3,433
Masaai Mara 3 12 467 479
Kimathi University 6 18 750 768
Jaramogi Oginga Odinga 2 9 108 117
Total 22 94 7,646 7.740
3.4 Sample Size and Sampling Procedure
This section dealt with sampling frame, sampling procedures and sample size of the study. The
sampling frame describes the list of population units from which the sample will be selected. In
this case, the sampling frame was 7498 individuals who had been derived from two groups of
staff(academic and non-academic) and the students . Stratified random sampling was used to
select the respondents. The sample population was divided into homogenous groups from which
simple random sampling was used.
The sample population determined by the ( Krejcie and Morgan ,1970) table (see appendix iii).In
this case the general sample population will be 362 students and 76 staff(academic and non-
academic), the individuals were selected at 0.05 level of significance. From the general sample,
the researcher will be able to get specific sample for each strata (groups) by getting the ratio. Full
calculations (See appendix iv)
Table 3.2 Sample population
STAFF STUDENTS
UNIVERSITY Freq Freq
Moi University 34/94*76=27 2909/7646*362=137
J.K.U.A.T. 21/94*76=17 3412/7646*362=161
Masaai Mara 12/94*76=10 467/7646*362=23
Kimathi University 18/94*76=15 578/7646*362=36
Jaramogi Odinga Odinga 9/94*76=7 82/7646*362=5
Total 76 362

41
3.5 Data Collection Instruments
The researcher used both primary and secondary methods to collect data. The main instrument in
data collection was a questionnaire (open and closed ended questions).Closed ended questions
ensured that the respondents were restricted to certain categories in their responses while the
open ended questions captured the areas in the research where there was need to explore other
possible responses that differ from respondent to respondent. In a later case ,secondary data was
obtained from existing documents from the university books and magazines.
3.5.1 Pilot Testing of the Research Instrument
The pilot testing of the instrument was done with respondents from the target population. The
subjects of the pre-test were encouraged to give suggestions concerning the instructions, clarity
of the questions, and sensitivity of the questions as well as the flow of the questionnaire.
After the filled questionnaires in the pilot study were received together with the suggestions and
comments by the respondents, the questionnaire was reviewed to find out comprehension and
suitability of the wordings used the sequencing of questions and the time taken to complete the
questionnaire. The study of the completed pilot questionnaire gave an indication of the
reliability of the instrument through the responses received.
3.5.2 Validity of the Research Instrument.
According to (Kombo and Tromp, 2009) ,validity is a measure of how well a test measures what
it is supposed to measure. The researcher used face validity to review and develop an informal
opinion as to whether or not the test measured what it was supposed to measure .The researcher
used 3 groups and 10 respondents from the pilot study .Content validity on the other hand was
used to check whether the items in the questionnaire answered the research objectives. The
questionnaire was re-examined to ensure that the questions are not ambiguous, confusing, or
potentially offensive to the respondents leading to biased responses.
3.5.3 Reliability of Research Instrument
In this study, split half method was used to test reliability to ensure that the results obtained
through its use was consistent from one respondent to the other. Split-half reliability was
assessed by splitting the questionnaire into two halves ,odd and even questions for all questions.
Pearson‟s r formula will be used to find the correlation between the two halves. The correlation

42
was re-evaluated using the spearman-brown prophesy formula to increase the estimate reliability.
Spearman-brown formula
R=2r/1+r,
Where,
r=estimated correction between two halves (Pearson r, 2001).
R=Corrected spearman brown reliability
The r values should range from -1 to 1 .If a coefficient greater than 0.7 is obtained is means
there is high correlation meaning high consistency and reliability and therefore the instrument
will be retained after the pretest. If the R value is less than 0.7 this will imply that the variable
low correlation and this implies that there the reliability is low hence instrument needs to be
reviewed (Singh ,2007).
Table 3.3 Reliability index
R=2r/1+r Correlation r R
R=2(0.81)/1.81 0.81 0.89
In this case Table 3.3 shows a reliability index of 89.5%.This indicates a high level of
consistency of the results obtained .This is a clear indicator that the results obtained are highly
correlated with r being 81% The measurement procedure will be considered to demonstrate split-
half reliability if the two sets of scores are highly correlated, there is a strong relationship
between the scores .
3.6 Procedure of data collection
The researcher got permission from the Extra Mural Department to go on with the research.
Then a research permit was obtained from the National Council of Science and Technology
(NACOSTI) followed by a letter of introduction by the researcher. While all the documentation
was ready, the researcher with the help of trained research assistants administered the
questionnaires to the participants of the study who had been randomly selected.
43
3.7 Data analysis techniques
Data analysis followed after the data has been collected. Coding is usually done through in
which categories of data are transformed into symbols that may be tabulated and counted
(Kothari, 2004).The data was entered, checked, cleaned, recorded, labeled using redcap and
then analyzed using SPSS (statistical package for social scientists. Quantitative and qualitative
methods of data analysis were used in which descriptive statistics such as means, standard
deviations, proportions and confidence intervals described the end line scores and values. One-
sample and two-sample tests of proportions were used to elucidate changes from end at each
campus that is within and between campuses, respectively. Factor analysis was used to elucidate
the relevant information from the data collected using the scales. Documented field notes,
together with other qualitative data, were analyzed through qualitative methods in this case
content analysis.
3.8 Ethics
Ethics deal with ones conduct and services as a guide to his or her behavior. The study met the
ethical standards of research in Kenya. The researcher ensured confidentiality and anonymity of
the respondents throughout the data collection period by ensuring that they did not capture
personal details in the questionnaire, this improved confidence as in turn the respondents were
more open which improved the dissemination of information. In this case, the researcher was
through vetting and through training of the research assistant to be involved in data collection.

44
3.9 Operationalization of Variables
Table 3.3 shows the operational definition of independent and dependent variables, and means of measuring the indicators.
Table 3.4 : Operationalization of Variables
Variables Type of Variable Indicators Measurement
scale used
Tools Data Analysis
Dependent
Variable
Quality service
delivery of public
universities
-Completion of tasks on time.
-The ratio between students and
lecturers.
-Level of education and experience
of the lecturers and the senior staff.
-Number of graduates per academic
year.
-Number of students who are
satisfied with the services offered
by the university.
-Average percentage in number of
classes attended by the lecturers .
Ordinal
Questionnaire Descriptive Statistics
(mean, mode, median
and percentage )
Independent
Variables.
To establish the
influence of leadership
in public universities on
quality service delivery.
Leadership
Existence of proper communication
policy channels within the
university.
Ordinal
Questionnaire
Descriptive Statistics
(Mean, mode median

45
-Existence of proper laid out
processes and process in the
decision making process.
-Existence of frequent meeting and
open sessions where staff members
take part in decision making.
and percentage )
Variables Types of variables Indicators Measurement
Scale used
Tools Data Analysis
To examine the
influence of Institutional
funding on quality
service delivery in
public universities in
Nairobi county
Institutional
Funding
Number of audits in the
institutions that ensure
accountability.
Percentage of money received from
HELB to support the students in fee
payment.
Existence of funds allocated to
students for research.
Ordinal
Questionnaire
Descriptive Statistics
(Mean, mode median
and percentage )
To assess the influence
of competitiveness on
quality service delivery
in public universities in
Nairobi county
Competitiveness
.
-Frequency of external examiners
coming to access main semester
examinations.
-Number of trainings attended per
year by staff.
-Rank of the institutions locally and
globally
-Graduates absorption in the job
market
Ordinal
Questionnaire
Descriptive Statistics
(Mean, mode median
and percentage )

46
Variables
Type of a
Variables
Indicators Measurement
Scale used
Tools Data Analysis
To assess the influence
of technological changes
on quality service
delivery in public
universities in Nairobi
county.
Technological
Changes.
-The No. of trainings staff are
offered by the University with
regard to technology.
-Availability of proper hardware
and software in offering services
Ordinal
Questionnaire Descriptive Statistics
(Mean, mode median
and percentage )
To establish the
influence of human
resource management on
quality service delivery
in public universities in
Nairobi county.
Human resource
management
.
-Existence of a proper laid down
strategy and structure on
recruitment, selection and
placement.
-No. of trainings offered to staff by
the University.
Ordinal
Questionnaire Descriptive Statistics
(Mean, mode, median
and percentage )

47
-Existence of an efficient
performance development and
appraisal system

47
CHAPTER FOUR
DATA ANALYSIS, PRESENTATION AND INTERPRETATION
4.1 Introduction
This chapter presents the data analysis, presentation and interpretation of the finding of the study.
It presents findings on influences of leadership, influences of institutional funding, influences of
competiveness, influences of technological changes and human resource management on
quality service delivery in public universities city campuses in Nairobi City County.
4.2 Questionnaires Return Rate
The study sample for students in the 5 public universities satellite campuses was 364 but only
344 respondents managed to participate in the study. University staff members sample
population was 76 and only 74 respondents managed to participate in the study. The table 4.2
explains the results
Table 4.1: Questionnaire Return Rate for Students
University Actual No of %
Sample questionnaire Population Received
Moi University 137 127 92%
J.K.U.A.T. 161 154 95%
Masaai Mara 23 22 95%
Kimathi University 36 35 97%
Jaramogi O.O 5 6 120%
Total 362 344 95%
The general questionnaire return rate for all the students was respondents 344(95%) using the
total figure. Having 127(92%) were from Moi university while those from Jkuat, Masaai Mara
,Kimathi university and Jaramogi Oginga Odinga were 161(95%),22(95%),35(97%) and
5(120%) respectively. This was an impression that the students were willing to know what
influences quality service delivery in their campuses.

48
Table 4.2: Questionnaire Return Rate for Staff
University Actual No of %
Sample questionnaire Population. Received.
Moi University 27 26 96%
J.K.U.A.T. 17 17 100%
Masaai Mara 10 9 90%
Kimathi University 15 15 100%
Jaramogi O.O 7 7 100%
Total 76 74 97%
The public university staff questionnaire return rate was 97%.Having 26(96%) respondents
were from Moi university while those from Jkuat, Masaai Mara ,Kimathi university and
Jaramogi Oginga Odinga were 17(100%), 9(90%), 15(100%) and 7(100%) respectively. This
was an impression that the staff both the academic and the non-academic were willing to know
what is affecting quality service delivery in their campuses and could be willing to improve the
areas that are lacking in order to achieve excellent results.
4.3 Demographic Characteristics of the Respondents
The demographic data of the respondents was assessed and the results obtained are as shown in
Table 4.3: Distribution of Respondents by Age(Staff)
Factor
University name
JKUAT Kimathi Moi
Masaai
Mara Jaramogi .O .O Total
Age 20-24 years 0 1 1 0 1 3
25-34 years 0 0 1 0 0 1
35-44years 10 8 11 1 5 35
45-60years 5 6 13 8 1 33
61 and Above
0 0 0 0 0 0
Total 15 15 26 9 7 72

49
Table 4.3 shows that majority of the staff members are more than 35 years . A total of 3 staff
members and 1staff member were in the age bracket 20-24 and 25-34 respectively .With the
majority of the members being those in the age bracket of 35 - 44years having 10(67%) in
JKUAT,8(53%) in Kimathi,11(42%) of Masaai Mara , Moi,1(11%) and 11(71%) in Jaramogi .O
.O. The study shows that the second ranking age bracket was between 45-60 years which had
5(33%) of JKUAT, 6(40%) of Kimathi,13(50%) of Moi,8(89%) of Masaai Mara and 1(14%) of
Jaramogi .O.O and none was the age bracket of 60 and above. The report shows that majority of
the academic and non-academic staff are young and mid age and they are the most energetic
hence transformation in the satellite campuses is expected.
Table 4.4: Gender distribution of the staff
Gender for staff Male Female
Freq % Freq %
University name JKUAT 8 47.1 9 52.9
KIMATHI 8 53.3 7 46.7
MOI 12 46.2 14 53.8
Masaai Mara 5 55.6 4 44.4
Jaramogi O. O. 3 42.9 4 57.1
37 50.0 37 50.0
From table 4.4 its evident that gender distribution is fair being exactly equal with the Men
distribution being 8(47.1%) in JKUAT 8(53.3%) in Kimathi,12(46.2%) in Moi,5(55.6%) in
Masaai Mara and 3(42.9%) .Female distribution being 9(52.9%) in JKUAT 7(46.7%) in
Kimathi,14(53.8%) in Moi,4(44.4%) in Masaai Mara and 4(57.1%) in Jaramogi Odinga Odinga.
This is a good implication that shows that the city campuses are gender sensitive and as this
enhances cohesiveness as they there is equal distribution and equality in inclusion
4.4 Leadership and quality service delivery
The study sought to establish how leadership influences quality various aspects are looked into
as shown in tables 4.5 to 4.6

50
Table 4.5: Bureaucracy as a factor of leadership
The study assessed the effect of leadership on quality service delivery in the universities. The
results are shown in the table 4.5 .The universities indicated their opinion on the table below.
University name
JKUAT Kimathi Moi Masaai
Mara Jaramogi
.O.O Total
Is there
bureaucracy
in the org
Strongly
disagree
Frequency 0 1 2 0 1 4
% 0.0 6.7 7.7 0.0 14.3 5.4%
Disagree Frequency 2 1 2 4 0 9
% 11.8 6.7 7.7 44.4 0.0 12.2%
Agree Frequency 12 7 12 4 4 39
% 70.6 46.7 46.2 44.4 57.1 52.7%
Strongly
Agree
Frequency 3 6 10 1 2 22
% 17.6 40.0 38.5 11.1 28.6 29.7%
Table 4.5 shows that majority of the staff members agreed that there is bureaucracy in their
organizations with 12(70.6%) from JKUAT,7(46.7%) from Kimathi,12(46.2.%) from Moi ,4
(44.4%) from Masaai Mara and 4(57.1%) from Jaramogi .O .O. Further 3(17.6%) of JKUAT,
6(40%) of Kimathi,10(38.5%) of Moi,1(11.1%) of Masaai Mara and 2(28.6%) of Jaramogi .O.O
strongly agreeing that there is bureaucracy in their institutions .With Masaai Mara university
having almost equal split of the staff who were for the opinion that there was bureaucracy in the
organization against those who were for a contrary opinion.
The overall results across the universities showed that most of the staff members agreed and
strongly agreed that there was bureaucracy in their institutions and there is great need for the
leaders in this institutions to have strategies to have a thinner organization to enhance service
delivery to all stakeholders. According to (Chakravarthy, 2011) there is need for the universities
to work on their structures to reduce bureaucracy in order to increase efficiency and ensure no
delays are caused to the complex structure of the institution.

51
Table 4.6 Participatory management and decision making
JKUAT Kimathi Moi
Masaai
Mara Jaramogi
.O.O Total
Freq % Freq % Freq % Freq % Freq % Freq %
S.disagree 0 0 3 20 4 15.4 0 0 3 42.9 10 13.5
Efficient
decision Disagree 4 23.5 1 6.7 3 11.5 2 22.2 2 28.6 12 16.2
making process Agree 8 47.1 5 33.3 11 42.3 4 44.4 2 28.6 30 40.5
S. Agree 5 29.4 6 40 8 30.8 3 33.3 0 0 22 29.7
Participatory
management S.disagree 0 0 2 13.3 3 11.5 2 22.2 3 42.9 10 13.5
is the institution Disagree 2 11.8 5 33.3 5 19.2 0 0 3 42.9 15 20.3
Agree 10 58.8 5 33.3 12 46.2 4 44.4 0 0 31 41.9
S. Agree 5 29.4 3 20 6 23.1 3 33.3 1 14.3 18 24.3
Table 4.6 shows that across the universities staff members agree that the decision making
process is efficient having 30(40.5%) being in agreement while 22(29.7%) strongly agreeing,
though 10(13.5%) strongly disagreed and 12(16.2%) disagreed .Hence the decision making
process, highly correlated with participatory management in an institution as participatory
management entails having an all-inclusive decision making process while engaging staff and
continuously updating them on all that is happening across the institution. The table further show
that 31(41.9%) being in agreement while 18(24.3%) strongly agreeing, though 10(13.5%)
strongly disagreed and 15(20.3%) disagreed that there is participatory management in the
institutions.
(Kezar and Eckel 2004) pointed out that the substance of governance and decision-making has
changed during the last decades with more emphasis put on high stake issues and more
incremental decisions made in a less collegial mode – the reasons for this stem from trends that
have devalued the notion of participation and also from the external pressures for more
accountability and demands for quicker decision-making that sometimes is achieved through
bureaucracy. Comparing results in table 4.5 and table 4.6 it is clear that though there is
beaucracy in satellite campuses it does not affect the decision making process.

52
Table 4.7 Effective Communication channels
JKUAT Kimathi Moi Masaai
Mara Jaramogi
.O.O Total
Freq % Freq % Freq % Freq % Freq % Freq %
S.disagree 1.0 5.9 3 20.0 3.0 11.5 1 11.1 2.0 28.6 10 13.5
Well laid down
policies Disagree 3.0 17.6 3 20.0 2.0 7.7 4 44.4 0.0 0.0 12 16.2 on
communication Agree 7.0 41.2 6 40.0 12.0 46.2 1 11.1 3.0 42.9 29 39.2
S. Agree 6.0 35.3 3 20.0 9.0 34.6 3 33.3 2.0 28.6 23 31.1
Communication is key for the success of any organization. Table 4.7 shows that communication
highly influences quality service delivery as it ensures that timely services are offered and there
is a smooth flow of activities. After assessing the opinions of staff on whether the institution‟s
communication policies are, well laid down ,it was clear that most of the city campuses are still
embracing but have not fully implemented communication policies in their institutions having
29(39.2%) and 23(31.1%) who agreed and strongly agreed respectively ,across the universities
.The results are slightly above average performance hence the need to put more effort to ensure
that communication is efficient and effective.
If there is lack of mutual communication between administrative and university staff there will
be lack of efficiency. Furthermore, reduction of involvement of the faculty in institutional
decision making results into many challenges where governance systems cannot respond
appropriately, ending up in strikes (Murphy , 2000).
4.4 Competitiveness and quality service delivery.
The study assessed the effect of competition on the quality services offered. The results are
shown in table 4.8.The staff members indicated their opinion on appropriateness of teaching
methodology and the curriculum design to, compare whether this had an influence on the
graduates from this institutions

53
Table 4.8 Teaching methodologies and programs offered and quality service delivery
JKUAT Kimathi Moi Masaai
Mara Jaramogi
.O.O TOTAL
Freq % Freq % Freq % Freq % Freq % Freq %
Curriculums
designed S.disagree 10 6.5 2 5.7 12 9.4 4 18.2 0 0 28 8.1
by the university Disagree 26 16.9 7 20 18 14.2 4 18.2 1 16.7 56 16.3
are up-to date Agree 71 46.1 12 34.3 43 33.9 8 36.4 5 83.3 139 40.4
S. Agree 47 30.5 14 40 54 42.5 6 27.3 0 0 121 35.2
Teaching
methodology S.disagree 16 10.4 0 0 23 18.1 4 18.2 0 0 43 12.5
is appropriate Disagree 44 28.6 9 25.7 41 32.3 11 50 0 0 105 30.5
Agree 65 42.2 20 57.1 48 37.8 6 27.3 5 83.3 144 41.9
S. Agree 29 18.8 6 17.1 15 11.8 1 4.5 1 16.7 52 15.1
In the table 4.8 shows the results on the opinion that curriculum development is upto date
having,139 (40.4%) being in agreement while 121(35.2%) strongly agreeing, though 28(8.1%)
strongly disagreed and 56(16.3%) disagreed. Majority of the students were for the opinion that
that teaching methodology used was appropriate with, 144(41.9%) being in agreement
52(15.1%) strongly agreeing, though 52(15.1%) strongly disagreed and 105(30.5%) disagreed
that there teaching methodology was update.
From the results there is need and comparing the results there is a gap between those who believe
that the curriculum is well designed and those who are for the opinion that right teaching
methodologies are used hence there is need for institutions to embrace modern and variety of
teaching methods like use of power point presentation and engage students in more practical than
theory

54
Table 4.9 Variety of programs offered and quality service delivery
Table4.9 shows that out of the five city campuses have 54(35.1%) in JKUAT,14(40%) in
Kimathi,29(22.8%) of Moi ,9(40.9%) in Masaai Mara and 0(0%) in Jaramogi .O .O. who
strongly disagreed the university offered a wide range of programs, with the majority having
71(46.1%) in JKUAT, 14(40%) in Kimathi, ,45(35.4%) of Moi of 8(36.4%) of Masaai Mara and
6(100%) in Jaramogi .O .O. who The table further shows that 29(18.8%) of JKUAT, 7(20%) of
Kimathi,45(35.4%) of Moi,8(36.4%) of Masaai Mara and 0(0%) of Jaramogi .O.O agreed .
Lastly having 0(0%) of JKUAT,0(0%) from Kimathi,5(3.9%) from Moi ,1 (4.5%) from Masaai
Mara and 0(0%) from Jaramogi .O .O Strongly agreed .
Across the universities 106(30.8) Strongly disagreed that their institutions offer a wide range of
programs, while majority 144(41.9%) disagreed ,88(25.6%) agreed and 6(1.7%) Strongly agreed
.This clearly implies that there university should introduce more programs and courses so as
remain competitive as well as enable the students to choose the courses that best suits them.
JKUAT Kimathi Moi Masaai
Mara Jaramogi
.O.O TOTAL
Freq % Freq % Freq % Freq % Freq % Freq %
S.disagree 54 35.1 14 40 29 22.8 9 40.9 0 0 106 30.8
University offers Disagree 71 46.1 14 40 45 35.4 8 36.4 6 100 144 41.9
a wide range Agree 29 18.8 7 20 48 37.8 4 18.2 0 0 88 25.6
of programs S. Agree 0 0 0 0 5 3.9 1 4.5 0 0 6 1.7

55
Table 4.10 Ability of graduates to be competitive in the job market
Table 4.10:Shows that Majority of the students were not of the opinion that their learning
experience prepared them for the job market with 127( 36.9%) being in agreement while
217(63.1%) were in disagreement. Looking at the student: lecturer ratio only 138(40.1%)
strongly agreed that there was a favorable student to lecturer hence when we compare the this
results with the results above , it‟s evident that there is need for the satellite campuses to
employ more lecturers to ensure that ,they give students specialized attention and to a great
extent have enough time for consultation. They should also have attachment programs and
training to ensure that the graduates are ready for the job market.
JKUAT Kimathi Moi
Masaai
Mara
Jaramogi
O.O Total
Freq % Freq % Freq % Freq % Freq % Freq %
Learning prepares
students for the Yes 56 36.4 20 57.1 43 33.9 6 27.3 2 33.3 127 36.9
job market No 98 63.6 15 42.9 84 66.1 16 72.7 4 66.7 217 63.1
S.
disagree 33 21.4 6 17.1 22 17.3 1 4.5 5 83.3 65 18.9
Favorable
Proportion of Disagree 45 29.2 9 25.7 56 44.1 10 45.5 1 16.7 121 35.2
students to lecturers Agree 7 4.5 3 8.6 8 6.3 0 0.0 0 0.0 18 5.2
S. Agree 69 44.8 17 48.6 41 32.3 11 50.0 0 0.0 138 40.1

56
Table 4.11 Lecturers have a great range of experience
JKUAT Kimathi Moi Masaai
Mara Jaramogi
.O.O Total
Freq % Freq % Freq % Freq % Freq % Freq %
S.disagree 10 5.2 1 2.9 2 1.6 2 33.3 0 0.0 12 4.1 Lecturers have
a wide Disagree 23 14.9 6 17.1 30 23.6 7 116.7 2 0.6 65 18.9
of experience Agree 19 12.3 5 14.3 35 27.6 9 150.0 2 0.6 63 18.3
S.Agree 102 66.2 23 65.7 60 47.2 4 66.7 2 0.6 202 58.7
Table 4.11 clearly shows that majority of the staff were for opinion that lecturers had a wide
range of experience with 63(58.7%) being in agreement and 202(56.7%) strongly agreeing,
though a small percentage differed with the opinion having 12(3.5%) who strongly disagreed
and 65(18.9%) who disagreed. This was commendable and a positive ,indicator that the public
universities were implementing ISO certification ,whose one of the major pillars is offering
quality in higher institutions of learning.
Table 4.12 Staff training and quality service delivery
` JKUAT Kimathi Moi
Masaai
Mara Jaramogi
.O.O
Freq % Freq % Freq % Freq % Freq %
Rarely 1 5.9 4.0 26.7 8 30.8 1.0 11.1 4 57.1 Training that are core
Quite often 6 35.3 1.0 6.7 3 11.5 2.0 22.2 0 0.0 to staff are conducted
Often 8 47.1 10.0 66.7 15 57.7 6.0 66.7 3 42.9
Very often 2 11.8 0.0 0.0 0 0.0 0.0 0.0 0 0.0
Table 4.12 shows that training conducted have a positive impact and are core to the staff
having 2(11.8%) in JKUAT,0(0%) in Kimathi,0(0%) of Moi ,0(0%) in Masaai Mara and 0(0%)
in Jaramogi .O .O. responding that they conducted very often .The table further shows that
8(47.1%) of JKUAT,10(66.7%) of Kimathi,15(57.7%) of Moi 6(66.7%) of Masaai Mara and
3(42.9%) having responded that the training that are core are conducted often .While those that
were for the opinion that the training are conducted quite often were 6(35.3%)ofJKUAT,1(6.7%)
from Kimathi,3( 11.5%) from Moi ,2 (22.2%) from Masaai Mara and 0(0%) from Jaramogi .O

57
.O. Further we have 1(5.9%) in JKUAT,4(26.7%) in Kimathi,1(11.1%) of Moi ,1(11.1%) of
Masaai Mara and 4(57.1%) in Jaramogi .O .O. who strongly agreed that there well laid down
communication policies in their organizations.
Table 4.13: Programs on Personal Development Ability
JKUAT Kimathi Moi Masaai
Mara Jaramogi
O.O Total
Personal
development Yes 1 6 7 0 4 18
ability No 16 9 19 9 3 56
Table 4.13 shows that having a total 18( ) were for the opinion that the personal development
programs exist and majority of the staff were against the opinion. There is dire need for the
institutions to develop programs that identify and nurture personal development, to ensure
employees have an ability to explore their talents and work in their places of expertise
4.7 Institutional funding and quality service delivery
For any institution to operate efficiently there is need for adequate funding in all the areas to
ensure that they give the best quality to their stakeholders. Different aspects of funding were
looked into.
Table 4.14 Research funds
JKUAT Kimathi Moi Masaai Mara Jaramogi O.O Total
Availability of Yes 7 8 9 4 1 29 research funds No 10 7 17 5 6 45
Looking at table 4.14 According to staff members they are of the opinion that there are no
enough funds for research having 45 (60.9%) and the one in affirmation being 29(39.1%) hence
the city campuses despite their goal of growth and development in terms of student numbers they
should strive to balance their finances so as to allocate funds for research as well the main
campuses should support the city campuses as their overall growth depends on the city
campuses.

58
Table 4.15 Funds set aside for research
` JKUAT Kimathi Moi Masaai
Mara Jaramogi
.O.O Total
Freq % Freq % Freq % Freq % Freq % Freq %
S.disagree 14 26.6 13 37.1 48 37.8 4 18.2 2 0.6 108 31.4
Are there funds set aside for
Research
Disagree 78 50.6 7 20 30 23.6 12 54.5 4 1.2 131 38.1
Agree 15 9.7 2 5.7 24 18.9 4 18.2 0 0 45 13.1
S. Agree 20 13 13 37.1 25 19.7 2 9.1 0 0 60 17.4
Table 4.15 shows the students opinion on availability of research funds in their campuses
14(26.6%)JKUAT, 13(37.1%) in Kimathi,48(37.8%) of Moi ,4(18.2%) in Masaai Mara and
2(0.6%) in Jaramogi .O .O strongly disagree. The study shows that the highest percentage across
the campus of 131(38.1) disagreed that there were funds set aside by the campus for research
purposes with 78(50.6 %) in JKUAT,7(20%) in Kimathi,30(23.9%) of Moi ,12(54.5%) in Masaai
Mara and 4(1.2%) in Jaramogi .O .O. While 15(9.7%) in JKUAT, 2(5.7%) in Kimathi,24(18.9%)
of Moi ,4(18.2%) in Masaai Mara and 0(0%) in Jaramogi .O .O 14(26.6%) agreed . Finally in
across the campuses 60(17.4%) of the students Strongly agreed with 20(13 %) in
JKUAT,13(37.1%) in Kimathi,25(19.7%) of Moi ,2(9.1%) in Masaai Mara and 0(0%) in
Jaramogi .O .O.
The results showed that majority of the students disagreed that there were funds set aside for
research hence comparing this with the results of table 4.10 it shows having 45(60.9%) who
were for the opinion that there were no funds available for research .It is clear that there is need
for the satellite campuses to invest in research as it is the backbone of any academic institution as
this could mean that the institution does that allow the student and staff to fully exploit their
potential.
Table 4.16 Highest level of Education
JKUAT Kimathi Moi Masaai
Mara Jaramogi
.O.O TOTAL Freq % Freq % Freq % Freq % Freq % Freq %
Diploma 0 0.0 1 7.1 3 11.5 0 0.0 2 28.6 6 8.1
Highest Level
of Degree 2 11.8 4 28.6
3 11.5 0 0.0
4 57.1 13 17.6
Education Masters 13 76.5 6 42.9 17 65.4 7 77.8 0 0.0 43 58.1
PHD 2 11.8 3 21.4 4 15.4 2 22.2 1 14.3 12 16.2

59
Table 4.16 shows qualifications of the academic and non-academic staff with 6(8.1%) having a
Diploma ,13(17.6%) having degree ,Most of them having a masters 43(58.1) ,12(16.2%) being
PHD graduates ,while especially, one would expect most them to have doctorates ,this is a key
area to note that when Comparing table 4.15 and table 4.16 we clearly see a correlation of the
results ,as when research funds are limited the staff will not have an opportunity to further their
studies and this will in turn will have an impact on the publications made and hinder growth of
the institution.
Table 4.17: Academic facilities
Table 4.17 indicates that across the campuses that majority of the students agree that there are
adequate academic facilities with 56(16.3%) who strongly disagreed , 93(27%) having
disagreed , with the majority 155(45.1%)%) who agreed and 40(11.6%) who strongly agreed
the institution academic facilities were adequate. The study clearly shows that the city campuses
are well equipped with the facilities that the students require to have a conducive studying
environment.
JKUAT Kimathi Moi Masaai
Mara Jaramogi
.O.O Total Freq % Freq % Freq % Freq % Freq % Freq %
S.disagree 28 18.2 2 5.7 24 18.9 2 9.1 0 0.0 56 16.3
Academic
facilities Disagree 49 31.8 7 20.0 28 22.0 7 31.8 2 0.6 93 27.0
are adequate Agree 56 36.4 20 57.1 66 52.0 9 40.9 4 1.2 155 45.1
S.Agree 21 13.6 6 17.1 9 7.1 4 18.2 0 0.0 40 11.6
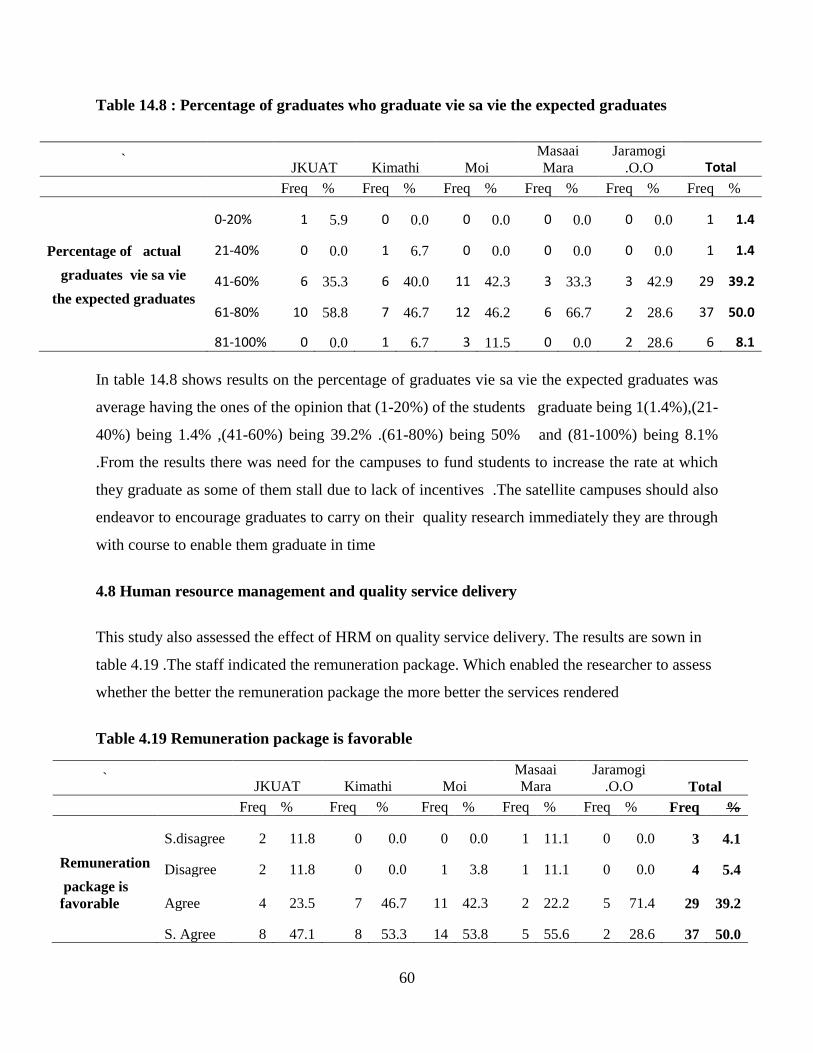
60
Table 14.8 : Percentage of graduates who graduate vie sa vie the expected graduates
` JKUAT Kimathi Moi
Masaai
Mara Jaramogi
.O.O Total Freq % Freq % Freq % Freq % Freq % Freq %
0-20% 1 5.9 0 0.0 0 0.0 0 0.0 0 0.0 1 1.4
Percentage of actual 21-40% 0 0.0 1 6.7 0 0.0 0 0.0 0 0.0 1 1.4
graduates vie sa vie 41-60% 6 35.3 6 40.0 11 42.3 3 33.3 3 42.9 29 39.2 the expected graduates
61-80% 10 58.8 7 46.7 12 46.2 6 66.7 2 28.6 37 50.0
81-100% 0 0.0 1 6.7 3 11.5 0 0.0 2 28.6 6 8.1
In table 14.8 shows results on the percentage of graduates vie sa vie the expected graduates was
average having the ones of the opinion that (1-20%) of the students graduate being 1(1.4%),(21-
40%) being 1.4% ,(41-60%) being 39.2% .(61-80%) being 50% and (81-100%) being 8.1%
.From the results there was need for the campuses to fund students to increase the rate at which
they graduate as some of them stall due to lack of incentives .The satellite campuses should also
endeavor to encourage graduates to carry on their quality research immediately they are through
with course to enable them graduate in time
4.8 Human resource management and quality service delivery
This study also assessed the effect of HRM on quality service delivery. The results are sown in
table 4.19 .The staff indicated the remuneration package. Which enabled the researcher to assess
whether the better the remuneration package the more better the services rendered
Table 4.19 Remuneration package is favorable
` JKUAT Kimathi Moi
Masaai
Mara Jaramogi
.O.O Total
Freq % Freq % Freq % Freq % Freq % Freq %
S.disagree 2 11.8 0 0.0 0 0.0 1 11.1 0 0.0 3 4.1
Remuneration Disagree 2 11.8 0 0.0 1 3.8 1 11.1 0 0.0 4 5.4
package is
favorable Agree 4 23.5 7 46.7 11 42.3 2 22.2 5 71.4 29 39.2
S. Agree 8 47.1 8 53.3 14 53.8 5 55.6 2 28.6 37 50.0

61
Table.4.19 shows that 2(11.8%) in JKUAT, 0(0%) in Kimathi 0(0%) of Moi, 1(11.1%) in
Masaai Mara and 0(0%) in Jaramogi .O .O. Strongly disagree that there the remuneration
package was favorable. While 2(11.8 %) in JKUAT,0(0%) in Kimathi 1(3.8%) of Moi ,1(11.1%)
in Masaai Mara and 0(0%) in Jaramogi .O .A significant number of the staff found their
remuneration package suitable with 4(23.5%) from JKUAT, 7(46.7%) in Kimathi,11(42.3%) of
Moi ,2(22.2%) in Masaai Mara and 5(71.4%) in Jaramogi .O .O.
Hence majority strongly agreed that or were on the opinion that their remuneration package was
favorable having 8(47.1%) from JKUAT, 8(53.3%) in Kimathi, 14(53.8%) of Moi ,5(55.6%) in
Masaai Mara and 2(28.6%) in Jaramogi .O .O. The results of the study shows that the satellite
campuses remuneration package is favorable hence it‟s a good indicator that the campuses, as
employees are the most important and valuable asset of any institution hence when they feel
appreciated their output and outcome is of high quality.
Table 4.20: Transparency in staff hiring
The process, procedure and rules that govern hiring in an institution is key and is affected the
quality of service delivery of the staff .In this case the staff responses show that they are
contented with the hiring process as it is a competitive process based on experience and
academic qualifications as shown
` JKUAT Kimathi Moi
Masaai
Mara Jaramogi
.O.O Total Freq % Freq % Freq % Freq % Freq % Freq %
S.disagree 0 0.0 1 6.7 2 7.7 0 0.0 0 0.0 3 4.1
Process of
hiring is Disagree 1 5.9 4 26.7 5 19.2 0 0.0 2 28.6 12 16.2
transparent Agree 13 76.5 9 60.0 15 57.7 7 77.8 5 71.4 49 66.2
S. Agree 3 17.6 1 6.7 4 15.4 2 22.2 0 0.0 10 13.5
Table 4.20 shows that the staff members have appreciate the hiring process in place is
transparent and they find it effective and efficient looking at the overall responses across the
universities 3(4.1%) strongly disagree that the hiring process is transparent, while 12(16.2)
disagree , having the majority agree having 49(66.2%) and 10(13.5) strongly disagree .This is
positions awarded and this always encourages them to work harder to be promote

62
Table 4.21 Technological changes
` JKUAT Kimathi Moi
Masaai
Mara Jaramogi
.O.O Total Freq % Freq % Freq % Freq % Freq % Freq %
S.disagree 2 11.8 5 33.3 0 0.0 0 0.0 2 28.6 9 12.2 Modern
technology Disagree 4 23.5 2 13.3 3 11.5 4 44.4 1 14.3 14 18.9
is in place Agree 6 35.3 6 40.0 19 73.1 1 11.1 3 42.9 35 47.3
S. Agree 5 29.4 2 13.3 4 15.4 4 44.4 1 14.3 16 21.6
S.disagree 5 29.4 4 26.7 2 7.7 2 22.2 2 28.6 15 20.3
University
staff Disagree 2 11.8 3 20.0 11 42.3 3 33.3 2 28.6 21 28.4 are at per
with Agree 9 52.9 4 26.7 10 38.5 2 22.2 2 28.6 27 36.5 technological
changes S. Agree 1 5.9 4 26.7 3 11.5 2 22.2 1 14.3 11 14.9
S.disagree 1 5.9 0 0.0 1 3.8 0 0.0 0 0.0 2 2.7 IT Training
offered Disagree 4 23.5 6 40.0 12 46.2 5 55.6 0 0.0 27 36.5 are useful to
staff Agree 8 47.1 8 53.3 9 34.6 2 22.2 3 42.9 30 40.5
S. Agree 4 23.5 1 6.7 4 15.4 2 22.2 4 57.1 15 20.3
Table 4.21 indicates that across the universities staff members agree that modern technology is
in place having 35(47.3%) being in agreement while 16(21.6%) strongly agreeing that modern
technology is in use in the institution, though 9(12.2%) strongly disagreed and 14(18.9%)
disagreed .This is a clear indicator that city campuses have embraced modern technology. On the
other hand we see that the rate at which the staff have embraced technology is a bit slower that
compared to the institutions IT development having 27(36.5)%) being in agreement while
21(28.4%) strongly agreeing, though having a significant number of staff who are not at per
with the technological developments with 15(20.3%) who strongly disagreed and 21(28.4%)
who disagreed. On the flip side a significant number of the staff had a feeling that the IT training
offered were useful to them .Looking at the table 15(20.3%) Strongly agreed, 30 (40.5%) agreed
27(36.5)disagreed and 2(2.7) strongly disagreed. It clearly shows that the training department
need to work and improve on their teaching skills in order to offer trainings that are more
meaningful and useful to employees.

63
CHAPTER FIVE
SUMMARY OF FINDINGS, DISCUSSIONS, CONCLUSIONS AND
RECOMMENDATIONS AND SUGGESTIONS FOR FURTHER STUDIES
5.1 Introduction
This chapter presents the summary of the findings of the study, discussions, conclusions and
recommendations arrived at. The study assessed the various factors influencing quality service
delivery in public universities case of city campuses in Nairobi City County. These factors are
leadership, institutional funding, competiveness, technological changes and human resource
management.
5.2 Summary of Findings
This section summarized the finding of the study. This would help readers understand the results
in better ,in a simpler and summarized way. The study different aspects of leadership were
looked into the first being bureaucracy, the results found that majority of the staff in the five city
campuses attested that there was bureaucracy in their institutions with a total of 39 (52.7) in
agreement and 22(29.7) strongly in agreement, while having the highest number being from
JKUAT campus 12(70.6) it should be a key area for the leadership of the campus to work on .It
has been a norm in many public universities over the years ,hence as institutions all over the
world and private universities in Kenya have almost finished bureaucracy ,there is need for the
leadership of this institutions right from the top to abolish many processes that could be made
simpler and easier to ease the daily activities and achieve quality and timely service delivery to
all stakeholders and especially the main stakeholders who are the students and the staff.
Looking at decision making and participatory management most of the university staff were in
agreement that they the decision making process is well laid down and they are usually involved
in the decision making process which is one of the components of participatory decision making
having 30(40.5%) being in agreement while 22(29.7%) strongly agreeing that the decision
making process is efficient while 31(41.9%) being in agreement while 18(24.3.7%) strongly
agreeing that there is participatory decision making in their institution. However Masaai Mara
CBD campus had the lowest values of among the other university of those who were of the

64
opinion that there is there was bureaucracy in the institution and this clearly shows that if there is
less bureaucracy then there the decision making process is more efficient and participatory
management is a key area that leaders focus on.
Communication process was another key area of focus majority of the staff were in agreement
there were well laid down communication policies having 7(41.2%) of JKUAT,6(40%) from
Kimathi,12(46.2.%) from Moi ,3 (42.9%) from Masaai Mara and 3(42.9%) from Jaramogi .O .O
being in agreement . Further having (35.3%) in JKUAT,3 (20%) in Kimathi,9(34.6%) of Moi
,3 (33.3%) and 2(28.6%) in Jaramogi .O .O. who strongly agreed that there well laid down
communication policies in their organizations.
The study found that the curriculums by the university were up to date with 139(40.4%) being in
agreement and 121(35.4%) strongly agreeing the students similarly appreciated that suitable
teaching methods were in use from table 4.8 and Table 4.9. though not at the same rate ,this
means there should be a slight improvement of the teaching methodologies to match the
curriculums that are being taught to ensure that the institution remains competitive. Table 4.8
however indicated that students were not satisfied with the range of programs offered by their
respective institutions with 106(30.8%) strongly disagreeing and 144(41.9%) being in
disagreement ,this implies that the structures and the programs are in place but there is need for
the same to be expanded to accommodate different student preferences and academic areas of
interest and especially in Jaramogi Oginga Odinga where none of the students appreciated
having wide range of programs though it‟s a young institution.
The study sought to determine how institutional funding influencing quality service delivery. It
was evident that the finances that an institution operate with has a great impact on the students
and staff. The results showed that if less funds are allocated to research it will hinder growth of
the stakeholders academically .The students and the staff had almost the same opinion regarding
availability of research funds in the institution referring to table 4.12and 4.13 ,This inturn had a
direct impact on the staff highest qualification as most of them had the highest academic
qualification as masters43(58.1) as opposed to the general assumption that most university staff
are PHD graduates.

65
The study further revealed the need for this institutions to increase all the academic facilities to
enable students get the best quality of education as a total of 155(45.1%) and 40(11.6%) agreed
and strongly agreed respectively ,this adds up to 195(56.7%) which is just slightly above 50%
The study found out that Staff in the institutions appreciated and were satisfied with their
remuneration package this may be attributed by the fact that most staff are on permanent basis
and they feel that their jobs are secured. This would allow them to be in a position to access
credit facilities and other fringe benefits with 29(39.2%) being in agreement and 37(50%) being
strongly in agreement that the remuneration package is favorable. This was a positive indicator
as workers who have a good remuneration package are usually motivate and the end result is
seen through their quality service delivery ,this is seen by the frequency of class attendance by
lecturers being 61-80% as per table 4.14.Further from the results the staff were equally satisfied
with the with the transparency in the hiring process as per table 4.15.
From the study the five institutions have embraced modern technology from table 4.18 we see
that the campuses have embraced technology though having 35(47.3%) and 16(21.6%) being in
agreement and strongly agreement respectively ,though the rate at which the staff have
embraced technology is a bit slower that compared to the institutions rate at adopted it in the
same institutions with 27(36.5%) being in agreement and 11(14.9%) having being in strongly
agreement this rates are lower than the above, hence the need of the more training in core IT
areas. However staff in this institution appreciate that technological training offered are useful to
them, this as well should be a continuous process to ensure that the rate a which staff embrace
technology is at per with the rate of technological growth in the institutions
5.3 Discussions of Results
This section discussed the results found in the study .This would help readers and future
researchers in a simpler way.
5.3.1 Leadership and quality service delivery
The study revealed that leadership has a great influence of quality service delivery of city
campuses in Nairobi city county. Leadership has many definitions but no real consensus;
essentially it is a relationship through which one person influences the behaviour or actions of
other people. One of the critical roles of management is to create a work environment that will

66
endear the organization to employees. It also includes influencing these employees‟ decision to
be committed and remain with the organization even when other job opportunities exist outside
the organization (Michael, 2008).
Beardwell (2007) observes that the role of leadership and a supervisor is crucial in staff
retention, and argues that employees leave managers not companies. Employees are more likely
to remain with an organization if they belief that their managers shows interest and concern for
them, if they know what is expected of them, if they are given a role that fits their capabilities
and if they receive regular positive feedback and recognition. The quality of relationship an
employee has with his or her immediate managers elongates employee stay in an organization
(Ferreira, 2007 cited in Michael, 2008). Centre for Promoting Ideas, USA www.ijhssnet.com 208
Research conducted on the state of South African Training industry indicated that management
style was the most prominent retention factor in South Africa (Netswera, 2005). The leadership
in the universities who include top management and Chairmen of Departments who are the
immediate supervisor to the academic staff can play crucial role in portraying to the staff that
their University is the employer of choice.
5.3.2 Competitiveness and quality service delivery
Professional development is the engine that keeps the universities true to their mandate as centers
of ideas and innovation. (Tettey ,2006) Without efforts in this direction intellectual capital can
stagnate and the relevance of universities to society may diminish. (Rosser, 2004) emphasized on
the need of faculty members thrive on intellectual and collegial stimulation from their peers
when they attend professional activities and national and international research meetings. Thus,
development activities for faculty members continue to be an important aspect associated with
their professional work lives
Training should be comprehensive enough to allow employees understand the nature of work to
be performed. Therefore the training given should be appropriate to the type of work to be
performed (Nzuve, 2010). The management should therefore develop clear job specifications and
job descriptions to understand the required type of training in the organization to improve its
competitiveness. This is because, competition sometimes adversely affect service delivery. In
Britain, since 1989, parents had the right to send their children to any publicly funded school of

67
their choice, as long as there were spaces available and quality services. Sweden and New
Zealand introduced parental choice of a school years later. This parental choice in education
remained controversial since it lead to unhealthy competition between the school to an extent of
affecting service delivery (Le ,2007).
5.3.3 Institutional funding and quality service delivery
Its evident there is need for more funding for the city campuses either from the main campuses
or from the government as funds from HELB are not sufficient as well other sources of income
.Lack of enough funds influences quality service delivery and important area of allocation like
research are not catered for and hence the institutions rate of academic growth becomes slow.
The trends in university expansion has been an increasing mismatch between the academic
programmes that the institutions are offering and the knowledge needs of the economy according
to the Vision 2030 blueprint. Regardless of all social and economic characteristics of any given
country, all the costs of higher education must ultimately be paid by a combination of four basic
sources of finance: taxpayers, students, and donor agencies (Johnstone,1986). The higher
education funding calculus is such that any cost shifted from one source must be shifted to
another source ,given that higher education costs are by their nature unavoidable, irreducible, and
continually escalating (Woodhall, 2008). The high costs are related to the natural economic
character of the tertiary education function that is characterized as both labour and capital
intensive and has proven throughout the world to be especially resistant to labour-saving
technologies (Johnstone, 2004).
According to the (Ministry of Higher Education, 2012)University education is expensive and
requires huge investments by all partners. The average spending per student at the university
level was 31 times, 6 times, and twice as expensive in relation to primary, secondary and TVET
education, respectively.
5.3.4 Human resource management and quality service delivery
Attractive remuneration packages are one of the very important factors of retention because it
fulfils the financial and material desires (Shoaib et al, 2009). Less than half of the faculty
members in a national study indicated that they were satisfied with their salary and fringe

68
benefits (Rosser, 2004). Salary retirement and job security have been shown to be important
personal issues that may affect the satisfaction of faculty members in colleges and universities.
Rosser observed that although much of the overall research on faculty members suggests that
salary, in and of itself, is not the most important aspect of their work life and satisfaction, salary
is one of the primary reasons why faculty members leave their institution. In examining faculty
workload and compensation of Australian academics, Comm and Mathaisel (2003) cited in
Kipkebut (2010) found that 51% of the faculty did not believe that they were compensated fairly,
relative to those other comparable institutions. As a result, 50% of the respondents felt the need
to work outside their institutions to earn extra income. According to Tettey (2006) dissatisfaction
with salaries is one of the key factor undermining the commitment of academics to their
institutions and careers, and consequently their decision or intent to leave
5.3.5 Technological changes and quality service delivery
The research found that the five institutions have embraced technology but there was there was
need for more training to enable staff appreciate the role and importance of technological growth
both as individuals and as group.
While studying how using information technology could increase access to higher education
through distance learning in Kenya found that institutions of higher learning lacked the necessary
technology. The institutions had only a few computers, which were used by lecturers to access
internet services. Lecturers and administrators lacked instructional competencies and information
design for distance learning associated with delivery of high quality services (Manyasi, 2010) ,
Advances in Information Technology could provide solution for the demand in university
education in Kenya. However, there was insufficient institutional preparedness. Apart from
inadequate space and shortage of current books and journals, public universities did not have
satisfactory internet provision for the learners.
5.4 Conclusions
From the study the researcher established that for satellite campuses to offer high quality services
there is need to reduce bureaucracy to ease and hasten services offered .The leadership of this
institutions should work towards a thinner organization and enhance open door policy .More
training that are core to staff should be conducted both in HRM and IT .

69
There is need for the institutions to come up with initiatives are profit to bridge the gap in the
funding and resources required to run the institution.
5.5 Recommendations
In line with the findings and the results of the study, the study recommends that public universities
universities should liase with the Government to establish appropriate, reliable, effective
diversified and sustainable mechanisms for fully financing university operations. In keeping ,with
their core mandate ,universities should enhance the focus on increased quantity and quality of
research output. Any countries especially Kenya‟s development critically depends on a high quality
research output. .Kenya should strengthen collaboration and partnership among research entities .
Commission for University Education (CUE) should institute strict quality monitoring and evaluation
mechanisms to universities and revises its accreditation requirements. An accreditation system could
be linked to an international accreditation system. An internationally accepted criterion is needed not
only for setting standards but measuring quality. Besides, universities need to have well established
benchmarks and indicators of quality which can serve as positive indicators of self-criticism by both
universities and stakeholders.
.
There should be frequent curriculum review like after every five years to ensure that there is
continuous monitoring and evaluation by the commission of university education (CUE),of the
quality of services offered. There is need for institutions to establish benchmarks to enable them
measure position at any one time and establish and set targets . The critical and crucial
challenge is to ensure that for every programme, a rich and sound curriculum that meets the
needs of the students, the university and the wider community, is developed and implemented. It
is imperative that the content and process of the curriculum be current and up-to-date
More academic and non-academic staff should be recruited to match the increase in student
enrolment and improve lecturers incentive system. As observed in the results most of academic
staff are masters graduates hence there is need for academic staff to have a Doctor of
Philosophy (PHD) degree or its equivalent who are recruited, developed, and retained. Also by
ensuring staff have incentives and systems that make them competitive in teaching industry.

70
5.6 Suggestion for Further study
The scope of the study was limited due to time constraints. Nevertheless the study was successful in
finding the factors influencing quality service delivery in city campuses. The following were
suggested for future research.
Given that Nairobi is the capital city , given different experiences that satellite campuses face in
other Semi urban areas, similar research should be done in other counties in order to generalize
conclusion.
Similar research should also be done universities taken as a sample ,private universities and tertiary
college‟s included. This would bring fair competition hence benefiting both the students and the
staff as well as sustain and enhance quality service delivery in satellite campuses in different
counties

71
REFERENCES
Allport, C. (2009, January 14). Not all institutions can be treated equally. Australian, p. 3.
Andrew, T. (2012), E-skills hub to improve Quality service delivery.www.dou.ac.ke/press
_release eskill s(Feb 2008).
Astin, A.W and Astin H.S. (2000) Leadership reconsidered: Engaging higher education in social
change. Battle Creek, M1 Kellogg Foundation.
Awino, Z. B., Muchara, M., Ogutu, M., & Oeba, L. K. (2012). Total quality and competitive
advantage of firms in the horticultural industry in Kenya. Prime Journal of Business
Administration and Management (BAM), 2(4), 521-532.
Baboucarr, S. A. (2012). "Perceptions of international students on service quality delivery in a
Malaysian public university", Quality Assurance in Education. Vol.20 Issue 2 pp 153-
163.
Basham, L.M. (2012) Transformational and Transactional leaders in higher education. SAM
Advanced Management Journal. Society for Advancement of Management .
Basheka, B. C.; Muhanda, M. B.; Kittobe, J. (2009). Programme delivery, quality benchmarks
and outcomes based education at Uganda Management Institute: A correlational
approach. NCHE, Kampala
Bass, et al (2003) Predicting unit performance by assessing transformational and transactional
leadership.
Bean, C. & Geraghty, K. (2003). Navigating the road to KPI success. Focus, 5(6), 37-41.
Beardwell J., &. C. (2007). Human Resource Management. A contemporary Approach. London:
Prentice Hallobserves.
Bean, C.& Geraghty, K .(2003).Navigating road to KPIs succes .Focus5(6),37-41.
Boyd, N. M. (2004). Expanding the view of performance appraisal by introducing social justice
concerns. Administrative Theory & Praxis 26,3,249-277.
Bradley., D. (2008). Review of Australian higher education report. Canberra. AGPS: Canberra.
Bryman , A. (2007) Effective Leadership in Higher Education: Literature Review. Studies in
Higher Education.32 (6) pp. 693-710
Buchanan, H. A. (2001). Organizational Behaviour:An introductory text. London: Pearson
education.

72
Buche. B., C. o. (2012). The impact of academic staff recruitment, development and retention
policies at Ba Isago University College on their commitment to the College. Research
journal of Business Management and Accounting, 279.
Budhwar, Pawan S. and George Boyne (2004) “Human resource management in the Indian
public and private sectors: an empirical comparison”. International Journal of Human
Resource Management 15, 2, 346–370.
Butcher, N. 2008. A Summary of Key Issues for Consideration. UNESCO 2009 World
Conference: 'The New Dynamics of Higher Education.
Carmel H., &. s. (2007). Can banks Improve Customer Relationships with high quality online
service. vol 17 NO.4 pp.404-427.
Charles, K. O, Erick, N. O, Yobes ,B. N(2012). Chinese Business Review, Kisii University.
David publications.
Chakravarthy B. (2011). “A new strategy framework for coping with turbulence” Sloan
Management Review, Winter, pp. 69-82
Chubb., I. (2005, March 5). Diversity, competition and quality healthy for higher education.
Group of Eight Media Release.
Cronin, J. and Taylor, S., "Measuring Service Quality: A Re-examination and Extension,"
Journal of Marketing, 56 (July), 1992, 55-68.
Cochran, W. G. (1977). Sampling techniques (3rd
ed.). New York: John Wiley & Sons.
Condrey, S. E. (2010). Handbook of Human Resource Management in Government. New York,
NY: John Wiley & Sons.
Craven, G. (2008, December 18). Craven, G.. Educated guess has its risks. Age, p. 17. Age, p.17.
Daly, C. &. (2006). Greener Pastures: Faculty Turnover Intent in Urban Public Universities.
Journal of Higher Education, 59-64.
Davis, G. (2006). ). Campus unrest: Our public universities will need more diversity and less
regulation in order to survive. Australian financial review.
Davis, J. H. (1997). Towards a stewardship theory of management. 22(120 20-47: Academy of
Management review.
Deci. E. L., Ryan, R.M .,Gauge, M., Leone,D.R & Kornazhera, B.P.(2001).Need satisfaction
,motivation & well being in the work organization of a former eastern bloc country ,A
cross cultural study of self determination.Personality & Social Psychology Bulletin,
27,930-942.

73
Dockel, A. (2003). The Effect of Retention Factors on Organisational Commitment: An
Investigation of High Technology Employees. Pretoria: University of pretoria.
D‟Souza, A., 2008. Le leadership: Conduire les autres. 2nd Edn., Kinshasa: Paulines.
Dubrin ., A. (2009). Essentials of Management 8th ed. Canada.
Eshiwani, G (2009). University expansion in Eastern Africa: Challenges and options in higher
education, 39, 17-22. Inter-University Council for East Africa (IUCEA), Newsletter
Finken D A (2004) „Refuelling funding‟ community week July 19:6-8
Firdaus ., A. (2005). HEdPERF versus SERVPERF, the quest for ideal measuring instrument of
service quality in higher .
Forrer, J. J., Kee, J. E., & Boyer. E. (2014). Governing cross-sector collaboration. San Francisco,
CA:Jossey-Bass.
Garret, B. (1987) the learning Organization and the need for Directors who think. New York:
Harper Collin
Gitahi. (2010, June 16). 'Varsity Recruitment Marred by Ethnicity‟ p.12. Nairobi: Daily Nation.
Government of Kenya. (2006). Public Universities Inspection Board report. Government printer.
Governments and educators in Kenya struggling to keep pace with demand for higher education
(1st June 2015)Retrieved from http://monitor.icef.com/2015/06/governments-and-
educators-in-kenya-struggling-to-keep-pace-with-demand-for-higher-education/
Griffin, M.A.,Neal, A . and Parker,S.(2007). A new model of work role performance positive
behavior in uncertain and interdependent context.Academy of Management Journal,
50(2),327-347
Grote, D. (2000). “Public sector organizations”.. . Public Personnel Management 29, 1, 1–20.
Johnstone, R. (2004). Issues in change management (2nd ed.). Oxford: Blackwell Business.
Hepper, P.P., Kivlinghan ,D.M., & Wampold ,B.E.(2008). Research design in counseling.
Belmont ,CA: Thomson Brooks /Cole.
Hicks, D. (2014). Technology and professional identity of librarians: The making of the
cybrarian.
Higher, M. O. (2012). Reforming education and training in kenya-Sessional paper. Ministry of
Education and ministry of higher education.
Hillman, A. A. (2000). The resource dependency role of corporatedirectors: Strategic adaptation
of board composition in response to environmental change. Journal of management
Studies, 35(2)235-255.

74
Howard N, Sondorp E, Ter Veen A, eds. Conflict and health. Open University Press, 2012:155–
60.
Huselid ,M. A, Becker, B. E.& Beatty. R (2005)The workforce score card. Harvard Business
School press
Iseu, S. M. (2013). Factors affecting participation of secondary schools heads od department in
total quality management in Makueni county, Kenya (Doctoral dissertation).
J.C, R. (2003). ). Examining Social Presence in On-line Courses in relation to Students Perceived
Learning and . Journal OF asynchronous Learning Nt, Vol 7.
Jin, Z. (2011). Global technological change: From hard technology to soft technology.
Joshi.A. (2008). 'Institutions and Service Delivery in Asia', . London: Oversees Development
Institute.
Juma, M.N. (2001), From Traditional Distance Learning to Virtual Distance Learning in Higher
Education in Africa, Trends and Challenges in F.T. Tschang and T.D. Senta, (eds.)
Access to Knowledge: New Information Technologies and the Emergence of the Virtual
University, UNESCO/Pergamon Press
Kabene, S. M. (2010). Healthcare and the effect of technology: Developments, challenges and
advancements. Hershey, PA: Medical Information Science Reference.
Karriker, J., & M.L, W. (2009 ). Organizational Justice and Organizational Citizenship Behavior:
A Mediated Multifoci Model. Journal of management, 112.
Kasozi, A. (2005). The development of a strategic plan for higher education in Uganda 2001-5:
the interplay of internal and external forces in higher education policy formation in a
southern country”. Nuffic conference "A changing Landscape . Hague.
Kashorda, M & Waema, M, T .(2016) ,Baseline Survey of Engineering Departments 2015,
.Kenya Education Network.
Keller, G. (2009). Mangerial Statistics Abbreviated, 8th ed. : 2-4,159, 513, 355. South Western:
Cengage Learning.
Kendo, O. (2007, April 16). Bad planning undermining university programmes. The Stardard.
Kezar A. J. & Eckel P. D. (2004). Meeting today‟s governance challenges: A synthesis of the
literature and examination of a future agenda for scholarship. The Journal of higher
Education, 75 (4): 371-399.

75
Kim, J. Vammalle C. Han guk Chose n guw n. & Organisation for Economic Co-operation
and Development. (2011). Institutional and financial relations across levels of
government. Paris: OECD.
Kipkebut, D. (2010). Organisational Commitment and Job Satisfaction in Higher Educational
Institutions. Nairobi: Middlesex university.
Korbarcha. ( 2008). Re-engineering processes. Acadamy of health care journal.
Kotecha P. 2006 „Interrogating the Role of Higher Education in the Delivery of the MDGs‟
Africa Renewal 20, No 2, July 2006, p. 16.
Kombo K AK ‟Secondary School principals‟ Perceptions of Influence of KEMI Programmes on
Leadership Competence Levels in Two counties in Kenya :Msingi Journal Vol No.1
2014,CUEA Press: ISSN 231-3493
Kotler, P(2009). Marketing Management (13th ed.). Upper Saddle River, NJ: Prentice Hall
Krivokapic -Skoko, B. I. (2006). „Psychological contracts: Conceptual and empirical
considerations‟. Charles Sturt University,. NSW: Faculty of Commerce Working paper
Series,No. 01/06.
Landrum, H. P. (2007). A comparison of Magal's service Quality instrument with SERPERF.
Information and Management.
Lavelle, A. (2008, October 29). Underfunding the future. Australian, p. 32.
Lawler, E.E., & Boudreau, J. (2009). Achieving Excellence in Human Resources Management:
An Assessment of Human Resource Functions. Palo Alto: Stanford University Press.
Lawler, E. E., & Boudreau, J. W. (2015). Global trends in human resource management: A
twenty-year analysis.
Le amstrong. (2007). Human Resources Management: An Educational Perspective Newsletter,
Educational Development and research Bureau. Nairobi: Kenya
Lederman, D. (2013, May). Public university accountability 2.0. Inside Higher Ed . Retrieved
September 20, 2013, from Inside Higher Ed website,
http://www.insidehighered.com/news/2013/05/06/public-university-accountability-
system- expands-ways-report-student-learning
Levesque Terrence and Gordon H. G. McDougall (1994) “Determinants of Customer
Satisfaction in Retail Banking ” International Journal of Bank Marketing, 14(7), 12-20
M, B. (2002). Evaluating the student Experience :An approach to Managing and Enhancing
quality in Higher education. Journal of Hospitality Leisure ,sport and Tourism, 17-26.

76
Mani, B. G. (2002). Performance appraisal systems, productivity, and motivation: a case study.
Public Personnel Management 31, 2, 141–59.
Manyasi, B (2010). OL & DE as a Means of Increasing Access to Higher Learning in Kenya. A
Journal of the KIM School of Management Vol 1 pp 123 – 130.
Matiangi, F(2016, 16th
March )Mushrooming of university campuses needs to be checked.Daily
Nation,p2.
Mcintyre.(1999) .Fundamentals of survey research methodology.
Mapesela . M. L. E., &. F. (2004). Performance management of academic staff in South African
higher education: A developmental research project. Conferemce on Trends in the
management of Human Resource in Higher Education.
Martindale, N (2011). Leadership styles: How to handle the different personas. Strategic
Communication Management, 15(8), 32–35.
Mason, R. 2001 Institutional Models for Virtual Universities in F.T. Tschang and T.D. Senta
(eds.) Access to Knowledge: New Information Technologies and Emergence of the
VirtualUniversity, UNESCO/Pergamon.
Mbirithi, D.M,(201). anagement challedges facing Kenya's public universities and implications
for the quality education, Kenyatta University,Nairobi.
McNeil, M. a. (2006). Demanding Good Governance: A Stocktaking of Social Accountability
Initiatives by Civil Society in Anglophone Africa. Washigton: The world bank.
Micheal, S. (2008). environment that will endear the organization to employees. (Michael,
2008). Michael, S.O. (2008). Using Motivational Strategy as Panacea for Employee
Retention and Turnover in Selected Public and Private Sector Organisations in the
Eastern Cape Province . Capetown: University of Fort Hare.
Ministry of Education (2012). A Policy framework for education and training , Reforming
Education and Training in Kenya. Nairobi: Ministry of Education and Ministry of Higher
Education.
Ministry of education report (2012) .Policy framework for university Education. Government
press
Moore, M. G. (2012). Distance education: A systems view of online learning. USA: Wadsworth-
Cengage Learning.
Moorhead., &. G. (2009). ). Organisational behaviour: Managing people and organisations (7th
ed.). Boston: Miffin Company.

77
Mohamedbhai G. 2008 „The Contribution of Higher Education to the Millennium
Development Goals‟ paper presented at the 4th International Barcelona Conference on
Higher Education; New Challenges and Emerging Roles for Human and Social
Development‟ Barcelona
Mpaata ., A. (2010). University Competiveness through Quality assurance; The Challenging
Battles of intellectuals.
Murphy, P. B. (2000). Autonomy, leadership and demonstration. Changes in University
Governance in Spanish Public Universities, 1983-96. Un published PhD Dissertation
Boston College.
Musembi, O (2011). Varsity Double Intake Opposed. Daily Nation Monday June 20, 2011, p.9
Mwanafunzi(8th
September 2014) Public Vs Private Universities In Kenya. Retrieved from
http://kenyaeducationreview.com/public-vs-private-universities-in-kenya-best/.
Mwiria K., N. Njuguna, C.K. Ngome, V.K. Wawire, D. Wesonga and G. Ouma. 2007. Public
and private universities in Kenya: New challenges, issues and achievements. Oxford and
Nairobi: James Currey and East African Educational Publishers.
Netswera, F. &. (2005). Employee Retention Factors for South African Higher Education
Institutions. South African Journal of Human Resourse management, 36-40.
Ndegwa ,S (2008,April 13),Private university growth mixed blessing. World University News.
Retrieved from: http://www.universityworldnews.com.
Ng'ang'a ,G (9th
May 2014), Student numbers soar by 35%, university funding lags,Retrieved
from http://www.universityworldnews.com/article.php?story=20140508075050866
Ng'ethe .J, I. .. (2012). Determinants of academic staff retention in Public universities in Kenya:
Empirical review. International Journal of Humanities ans Social Science, 205-212.
Nyangau, (2014) Higher Education as an Instrument of Economic Growth in Kenya. FIRE:
Forum for International Research in Education, 1(1).
Nzuve S. N. M. (2010). Management o f Human Resources: A Kenyan perspective (4th Edition).
Star bright services publishers: Nairobi
O, M. (2011, JUNE 20). Varsity Double Intake Opposed. Daily nation.
Oanda IO, C. F. (2008). ). Privatisation and Private Higher Education in Kenya; Implications
for Access, Equity and Knowledge Production. Dakar: Condesria.
Oanda I.O. 2010 „African Higher Education in the Context of Internationalization: Altruistic
Partnerships or Global Academic Pillage; A Review Essay of Damtew Teferra and Jane

78
Knight (eds.)‟s „Higher Education in Africa: The International Dimension‟. In African
Review of Books, Vol. 6, No 1, pp. 6-7.
Obiruwu, T.C., Okwu, A.T.,Akpa, V.O, & Nkwankwere ,I.A.(2011),Effects of Leadership style
on Organizational Performance ,Australian Journal of Business and Management
Research Vol .1No 7p100-111.
Okwakol ., M. (2009). The need for transformative Strategic Planning in Uganda. NCHE journal
Kampala. :
Okinyi OM (2015) Reward Systems in the Public Universities in Kenya: Implication on Retention of
Teaching Staff.
Oliver, F. (2001). Changing systems in organizations , San Francisco: Jossey-Bass
Ouma, W. (2011). Surviving Austerity: Kenya‟s public universities and S.S. Higher Education,
Policy,
Oodan, A. P. (2011, August). User centric QoS standards and challenges for the future. In FITCE
Congress (FITCE), 2011 50th (pp. 1-5). IEEE
Oliver, F. (2001). Changing systems in organizations, San Francisco: Jossey-Bass
O Neill G. (2008) Psychological contracts: Conceptual and empirical considerations‟. Charles
Sturt University, Bathurst, NSW: Faculty of Commerce Working Paper Series, No.
01/06.
Oodan, A. P. (2011, August). User centric QoS standards and challenges for the future. In FITCE
Congress (FITCE), 2011 50th (pp. 1-5). IEEE
Price, A. (2011). Human resource management. Andover: Cengage Learning EMEA.
Paul, Q. (2006). Employee retention : Quinntessential Marketing Consulting Pty Ltd. Reprinted
Rabindra, A. (2007). Organizational change . New York: The Free Press.
Republic of Kenya (2006). Transformation of Higher Education and Training in Kenya to Secure
Kenya‟s Development in Knowledge Economy: Report of The Universities Inspection
Board (Kinyanjui Report), Nairobi: Government Printers.
Ringold, D., & World Bank. (2012). Citizens and service delivery: Assessing the use of social
accountability approaches in the human development sectors. Washington, DC: World Bank.
Wanna, J., Butcher, J., & Freyens, B. (2010). Policy in action: The challenge of service
delivery. Sydney, NSW: UNSW Press.
Riechi, A.O.R., 2008, „Demand for Academic Programmes Offered in Kenya‟s Public Uni-
versities and their Relevance to the Labour Market‟.

79
Rosser, V. (2004). Faculty Members‟ Intention to leave. A national Study on their Work- life and
Satisfaction. 285-309: Research in Higher Education.
Rust, R. D. (2000). Using service Quality Data for competitive Marketing Decisions.
International Journal of services Industry Management, Vol 11 No.5 438-439.
Ryan R.M., & Deci E.L. (2008) Self-determination theory & role of basic psychological needs in
personality and the organization of behavior. In O,P John ,R W Robbins & L A Pervin
(Eds), Handbook personality: Theory and research (pp 654-678).New york
,NY:Guilford press.
Sanchez, P. M. (2007). Effects of service Quality Dimentions on Behavioral purchase
Intentions;study in public sector transport.Managing quality . Vol 17 No.2pp134-151.
Santiago, P. B. (2008). . Tertiary education for the knowledge society, Volume 1. paris:
Organization for Economic Co-operation and Development(OECD).
Shoaib, M. A. (2009). Determinants of employee Retention in Telecom Sector of Pakistan.
Proceedings 2nd CBRC, . Lahore.
Shultz, T.W., (1986). Investment in Human Capital in Phelps, E. S. (ed) The Goal of Economic
Growth. New Investment in Human Capital in Phelps, E. S. (ed) The goal of Economic
Growth. New York, Norton Publishers.
Sifuna, D. N. (2012) .Leadership in Kenyan Public Universities and the Challenges of Autonomy
and Academic Freedom: An Overview of Trends since Independence”. CODESRIA
Journal for Higher education in Africa;Vol. 10, No.1, pp.121–137.
Singh,K.(2007).Quantitative social research methods .Los Angeles u a.: Sage Publishers.
Sirker, K. a. (2007). Empowering the Marginalized: Case Studies of Social Accountability
Intitiatives in Asia. Washigton D.C: The world bank.
Slattery. (2009 January 21). Let‟s get more competitive. Australian, p. 34.
Some, D(2016,1st Feb) CUE launches crucial audit of public universities .University World
News.p9
Sulo., T. (2008). Factors Affecting Research Productivity in Public Universities of Kenya: The
Case of Moi University, Eldoret. Journal of Emerging Trends in Economics and
Management Sciences (JETEMS).
Tettey, J. (2006). Staff Retention in African Universities: Elements of a Sustainable strategy,.
Washignton D.C: World Bank.
Tettey W.J. 2010 „Challenges of Developing and Retaining the Next Generation of

80
Academics‟: Deficits in Academic Staff Capacity in African Universities‟ Partner- ship
for Higher Education in Africa.
Theo A(2012 ,Feb 8),Eskills hub to improve quality service delivery. Retrieved from
http://www.dut.ac.za.
Unesco(2003),Measuring Education quality ,Ministerial Round table on the quality of Education
,Unesco Institute of Statistics ,Paris.
(IUCEA, 2014) ,Quality of Graduates in Africa. Center for International Higher Education,
Nairobi.
University World News. (2010). http://www.universityworldnews.com.
Wangenge., O. (2008). Higher education marketization and its discontents: The case of quality
in Kenya. Higher education.
Waswa, F. K. (2008). Academic Staff Perspectives on Operating Beyond Industrial Actions for
Sustainable Quality Assurance in Public Universities in Kenya. International Journal of
environment.
Webb, E. & Quinn, R. (2008). Organizational change and development. Annual Review of
Psychology, 50: 361- 386
World Bank Group. (2004). World development report. Washigton .D.C: World Bank
Publications.

81
APPENDIX I
QUESTIONNAIRE FOR STUDENTS IN PUBLIC UNIVERSITIES
SECTION A: DEMOGRAPHIC DATA
Name of University and Campus:
Date of Interview (dd/mm/yyyy):
Sex of respondent:
Male__________ Female___________
Course of study
_______________________________________
MODE OF STUDY.
Full time( ) Part Time( )
Q_CODE #: ________________________
Year of study……………………….
Dear Respondent
Your responses will be kept CONFIDENTIAL.
1. Before you complete this form, please be sure that you have read and signed the consent form
2. Please be as honest as you can be. I will not ask for your name, and anything you write on this
form will be kept completely confidential. Participation in this study will in no way affect your
studies at the university.
3. If you are uncomfortable at any time for any reason during the completion of this
questionnaire, please do not hesitate to ask for assistance.
4. It is estimated that this questionnaire will take between 25-45mins to complete.
Comments:
PLEASE DO NOT FILL IN ANY INFORMATION IN THIS BOX; FOR REVIEWER’S
USE ONLY
Data reviewed by:
Data entry:
[STAMP WHEN COMPLETED]
Date of Review:
…….(dd)/……(mm)/…….(yyyy)

82
SECTION B
These Section is related to certain aspects of the service that you experience in your University.
Please mark the appropriate response to indicate your own personal feeling by circling based on
the following scale
1= strongly disagree 2=disagree 3= agree 4= strongly agree
COMPETETIVENESS
1 2 3 4 5
1. When I have a problem, administrative staff show a sincere
interest in solving it.
2. Inquiries are dealt with efficiently
3. The university offers a wide range of programs with various
specializations
4. Instructor allocate sufficient time for consultation
5. Teaching Methodology is appropriate.
6. Instructor are highly educated in their respective fields
7. The timing of the class is suitable
8. Instructor is never too busy to respond to my request for
assistance and they do so in a time.
9. Instructor show positive attitude towards students
10. The staff are easy to contact
11. When I have a problem, Instructor shows a sincere interest in
solving it.
12. Curriculums designed by the university are up to date.
13. Small class size helps the class make more interactive and
help students to understand better
14. The proportion between theory and practice are appropriate
15. The assessment and the grading by the instructor are fair.

83
16. Administration offices keep accurate and retrievable records
17.The university offers programs with flexible structure
18. As a percentage how would you rate the lecturers‟ class attendance?
0-20%
20-40%
40-60%
60-80%
80-100%
INSTITUTIONAL FUNDING.
These Sections are related to certain aspects of the service that you experience in your
University. Please mark the appropriate response to indicate your own personal feeling by
circling based on the following scale
1= strongly disagree 2=disagree 3= agree 4= strongly agree
1 2 3 4 5
Academic facilities and equipment are adequate and necessary.
Runs excellent quality programs.
Recreation facilities and equipment are adequate and necessary.
Class sizes are kept to minimum to allow personal attention.
Existence of funds allocated to students for research
Existence of development projects in the institution.

84
QUALITY SERVICE DELIVERY IN PUBLIC UNIVERSITIES.
1. Is course work finished in good time to allow for revision.
Agree Strongly agree Disagree Strongly
disagree
2. How often on average do the lecturers attend classes in a semester.
a. Rarely b. Quite often c. Often d. Very often
3. Are you satisfied with the services offered at the university?
Yes No
4. The proportion between students and lecturers are favorable for learning.
Agree Strongly agree Disagree Strongly disagree
5. Lecturers have a range of experience and expertise
Agree Strongly agree Disagree Strongly disagree
6. Do you feel that the learning offered by the university is adequate to enable
graduates to fit on the job without any retraining?
a. Yes [ ] No [ ]

85
APPENDIX II
QUESTIONNAIRE FOR ACADEMIC AND NON-ACADEMIC STAFF
1. Kindly indicate your gender
Male Female
2.Tick your age Category
a) 20-24
b) 25-34
c) 35-44
d) 45-60
e) Over 60 years
3. Kindly indicate the position held in the university
4. What is your highest academic qualification?
a) Diploma
b) Bachelor‟s degree
c) Masters
d) PHD
e) Any other specify
LEADERSHIP (Tick appropriately)
1. There is existence of proper communication policy in the University.
Agree Strongly agree Disagree Strongly disagree
2. There is bureaucracy in dealing with issues in the University.
Agree Strongly agree Disagree Strongly disagree

86
3. There is all inclusive decision making meetings in the University.
Agree Strongly agree Disagree Strongly disagree
4. There is Participatory management in the institution.
Agree Strongly agree Disagree Strongly disagree
5.There are frequent motivational sessions where staff have a proper succession plan strategy by
consistently developing leadership skills and strengthen employees .
Agree Strongly agree Disagree Strongly disagree
INSTITUTIONAL FUNDING
1.Number of audits in the institutions that ensure accountability.
Once Twice Thrice
2. Are there funds allocated to students for research?
Yes No
COMPETETIVENESS
1. Is there a plan for any Expansion and development projects.
Yes No
2. How often are training for core staff conducted.
a. Rarely
b. Quite often

87
c. Often
d. Very often
3. Are benchmarking and appraisals practices, part of your end year staff evaluations.
Agree Strongly agree Disagree Strongly disagree
4. Are there weekend intensive and evening classes in all the courses?
Yes ( ) No( )
5. Does a fully-fledged marketing department exist in your institution.
Yes No
6. To what extent have you implemented the ISO 9001:2008 .Give your answer as a
percentage.
7. University is run like a corporate organization?
Agree Strongly agree Disagree Strongly disagree
8. Procedure of hiring out university resources and staff transparent
Agree Strongly agree Disagree Strongly disagree
9. Are the graduates from the institution marketable in the job market.
Agree Strongly agree Disagree Strongly disagree
11. What is position (Ranking) of your university globally……………………………
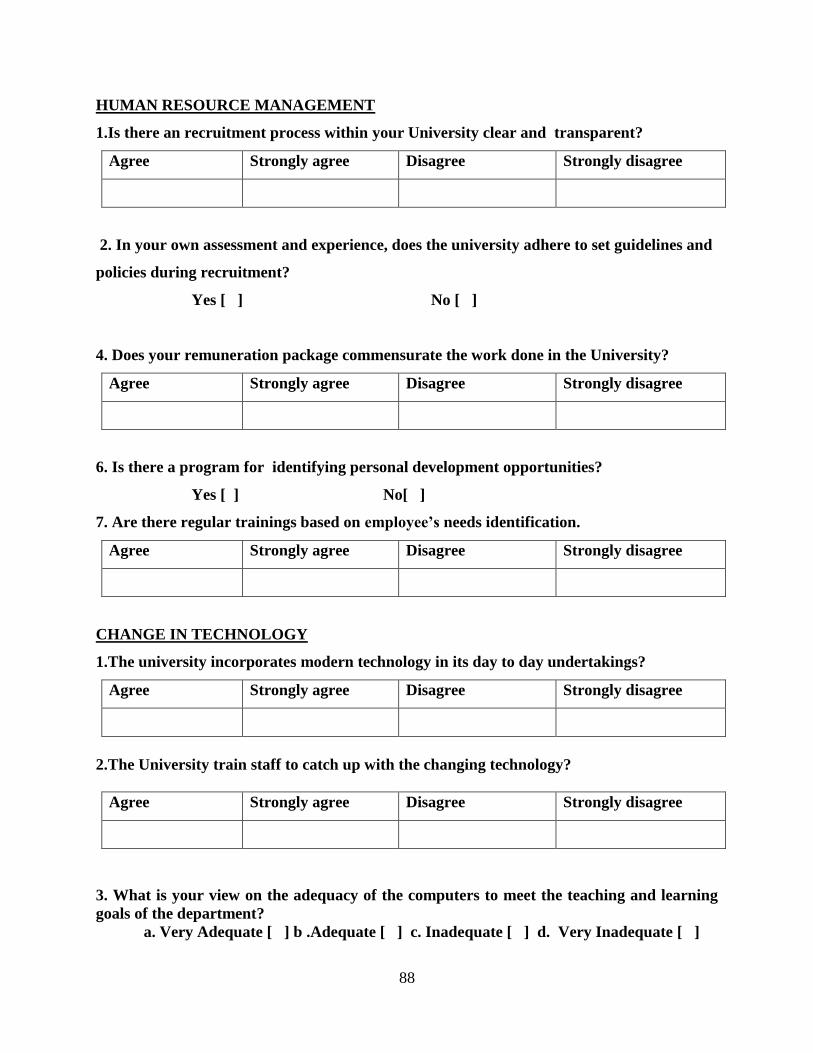
88
HUMAN RESOURCE MANAGEMENT
1.Is there an recruitment process within your University clear and transparent?
Agree Strongly agree Disagree Strongly disagree
2. In your own assessment and experience, does the university adhere to set guidelines and
policies during recruitment?
Yes [ ] No [ ]
4. Does your remuneration package commensurate the work done in the University?
Agree Strongly agree Disagree Strongly disagree
6. Is there a program for identifying personal development opportunities?
Yes [ ] No[ ]
7. Are there regular trainings based on employee’s needs identification.
Agree Strongly agree Disagree Strongly disagree
CHANGE IN TECHNOLOGY
1.The university incorporates modern technology in its day to day undertakings?
Agree Strongly agree Disagree Strongly disagree
2.The University train staff to catch up with the changing technology?
Agree Strongly agree Disagree Strongly disagree
3. What is your view on the adequacy of the computers to meet the teaching and learning
goals of the department?
a. Very Adequate [ ] b .Adequate [ ] c. Inadequate [ ] d. Very Inadequate [ ]

89
4.The trainings offered useful to staff?
Agree Strongly agree Disagree Strongly disagree
5. Are there ways the University can improve its training techniques?
Yes [ ] No [ ]
6.If yes in number (4) above, give details………………………………………………………
QUALITY SERVICE DELIVERY IN PUBLIC UNIVERSITIES
1. Number of graduates per academic compared to the total number of students expected to
graduate in such a particular academic year.
i) 0-20%[ ] ii) 20-40%[ ] iii)40-60 [ ] iv)60-80%[ ] v)80-100%[ ]
2. How often on average do the lecturers attend classes in a semester?
b. Rarely b. Quite often c. Often d. Very often n
3. Are you satisfied with the administrative services offered at the university?
Yes No
4.The proportion between students and lecturers are favorable for learning.
Agree Strongly agree Disagree Strongly disagree
5.Lecturers have a range of experience and expertise
Agree Strongly agree Disagree Strongly disagree
6. Do you feel that the training offered by the university is adequate to enable graduates to fit
on the job without any retraining?
Yes [ ] No [ ]

90
APPENDIX III: Table of Accredited Universities in Kenya
Public Chartered Universities
1. University of Nairobi (UoN) Established - 1970
Chartered - 2013
2. Moi University (MU) Established - 1984
Chartered - 2013
3. Kenyatta University (KU) Established - 1985
Chartered - 2013
4. Egerton University (EU) Established - 1987
Chartered - 2013
5. Jomo Kenyatta University of Agriculture and Technology
(JKUAT)
Established - 1994
Chartered - 2013
6. Maseno University (Maseno) Established - 2001
Chartered - 2013
7. MasindeMuliro University of Science and Technology
(MMUST)
Established - 2007
Chartered - 2013
8. DedanKimathi University of Technology 2012
9. Chuka University 2013
10. Technical University of Kenya 2013
11. Technical University of Mombasa 2013
12. Pwani University 2013
13. Kisii University 2013
14. University of Eldoret 2013
15. Maasai Mara University 2013
16. JaramogiOgingaOdinga University of Science and
Technology
2013
17. Laikipia University 2013
18. South Eastern Kenya University 2013
19. Meru University of Science and Technology 2013
20. Multimedia University of Kenya 2013
21. University of Kabianga 2013
22. Karatina University 2013
Public University Constituent Colleges
Murang‟a University College (JKUAT) 2011
Machakos University College (KU) 2011
The Co-operative University College of Kenya (JKUAT) 2011
Embu University College (UoN) 2011
Kirinyaga University College (JKUAT) 2011
Rongo University College (MU) 2011
KibabiiUniverstity College (MMUST) 2011
Garissa University College (MU) 2011
TaitaTaveta University College (JKUAT) 2011

91
APPENDIX IV: TABLE FOR DETERMINING SAMPLE SIZE

92
APPENDIX V: RESEARCH PERMIT