factors positively affecting customer’s satisfaction...
TRANSCRIPT

FACTORS POSITIVELY AFFECTING CUSTOMER’S SATISFACTION OF A
SUPERMARKET’S CUSTOMERS IN BANGKOK
FACTORS POSITIVELY AFFECTING CUSTOMER’S SATISFACTION OF A
SUPERMARKET’S CUSTOMERS IN BANGKOK
Siyu Wang
This Independent Study Manuscript Presented to
The Graduate School of Bangkok University
in Partial Fulfillment
of the Requirements for the Degree
Master of Business Administration
2016

©2016
SIYU WANG
All Right Reserved
Siyu, W. M.B.A., July 2016, Graduate School, Bangkok University.
Factors Positively Affecting Customer’s Satisfaction of A Supermarket’s Customers
in Bangkok. (90 pp.)
Advisor: Penjira Kanthawongs. Ph.D.
ABSTRACT
The researcher studied factors that could impact customer’s satisfaction of A
supermarket’s customers in Bangkok. The factors included Empathy, Responsiveness,
Location, Facilities, Product Consciousness, Pricing, Promotion, and Perceived value.
The 250 usable questionnaires were collected from both Thai people and foreigners
shopping in the “A” supermarket. Multiple regression analysis and Pearson Product-
Moment Correlation Coefficient were used for data analysis. The researcher found
that Perceived Value (β = 0.566), Location (β = 0.295), Responsiveness (β = 0. 276),
and Promotion (β = 0. 210) were tested to be positively affected customer’s
satisfaction of “A” supermarket’s customers in Bangkok at .01 level of significance,
explaining 59.2% of the influence toward customer satisfaction.
Keywords: Supermarket in Bangkok, Customers’ Satisfaction, perceived value.
v
ACKNOWLEDGEMENT
First, this study is dedicated to my dear family and friends in the course of this
project, stood beside me and offer their knowledge and support.
I would like to express my unreserved thanks for valuable advice my mentor Dr.
Penjira Kanthawongs provided constant encouragement and support for the successful
completion of the study. This is a unique opportunity to learn about and work with
her.
I want to emphasize that I am grateful thanks to my university (Bangkok University)
provided me with useful and necessary resources to complete the study. I also have a
great opportunity to expand my knowledge to better develop their future career.
vi
TABLE OF CONTENTS
Page
ABSTRACT ............................................................................................................. iv
ACKNOWLEDGMENT ........................................................................................... v
LIST OF TABLES .................................................................................................. viii
LIST OF FIGURES ................................................................................................... x
CHAPTER1: INTRODUCTION
1.1. Background ................................................................................................... 1
1.2 SWOT Analysis ............................................................................................. 3
1.3. Statement of problems ................................................................................... 4
1.4 Objective of Research .................................................................................. 4
1.5 Scope of research ........................................................................................... 5
1.6 Research Question ........................................................................................ 5
1.7. Significant of Research ................................................................................. 5
1.8 Definition of terms ......................................................................................... 6
CHAPTER 2: THE THEORY AND LITERATURE
2.1 Concept theories of Customer’s Satisfaction................................................... 8
2.2 Concept theories of Empathy ......................................................................... 9
2.3 Concept theories of Responsiveness ............................................................. 10
2.4 Concept theories of Location .........................................................................11
2.5 Concept theories of Facilities ....................................................................... 12
2.6 Concept theories of Consciousness ............................................................... 13
2.7 Concept theories of Pricing .......................................................................... 13
2.8 Concept theories of Promotion ..................................................................... 14
2.9 Concept theories of Perceived value ............................................................. 16
2.10 Related document and previous research .................................................... 16
2.11 Hypothesis ................................................................................................. 21
2.12 Variable used in research ............................................................................ 22
vii
TABLE OF CONTENTS (Continued)
Page
CHAPTER 2: THE THEORY AND LITERATURE (Continued)
2.13 Conceptual framework ............................................................................... 23
CHAPTER 3: RESEARCH METHODOLOGY
3.1. Research Design ......................................................................................... 24
3.2. Population and Sample Selection ................................................................ 25
3.3. Research Instrument .................................................................................... 26
3.4. Testing Research Instrument........................................................................ 29
3.5. Data Collection ........................................................................................... 30
3.6. Data Collection ........................................................................................... 31
3.7 Statistic Method ........................................................................................... 31
CHAPTER 4: DATA ANALYSIS
4.1 Demographic data ........................................................................................ 36
4.2 Mean, Standard Deviation and Respondents perception ................................ 40
4.3 Analysis of the data based on assumptions ................................................... 49
4.4 Other Analysis ............................................................................................. 55
CHAPTER 5: CONCLUSIONS AND SUGGESTION
5.1 Hypothesis Assumption. ............................................................................... 59
5.2 Summary ..................................................................................................... 61
5.3 Recommendation for future application ........................................................ 65
5.3 5.4 Recommendation for future research ...................................................... 65
5.5 Limitation .................................................................................................... 66
BIBLIOGRAPHY ................................................................................................... 67
APPENDIX ............................................................................................................. 69
BIODATA ............................................................................................................... 88
LICENSE AGREEMENT ........................................................................................ 89

viii
LIST OF TABLES
Page
Table 1.1: SWOT analysis ......................................................................................... 3
Table 3.1 Reliability test .......................................................................................... 29
Table 3.2 : ANOVA Analysis.................................................................................... 33
Table 4.1: Gender of respondents ............................................................................. 36
Table 4.2: Age of respondents .................................................................................. 36
Table 4.3: Monthly income of respondents ............................................................... 37
Table 4.4: Martial statues of respondents ................................................................. 37
Table 4.5: Education level of respondents ................................................................ 38
Table 4.6: Occupation status of respondents ............................................................. 38
Table 4.7: Mean, Standard Deviation and Respondents perception of Empathy ........ 39
Table 4.8: Mean, Standard Deviation and Respondents perception of Responsiveness40
Table 4.9: Mean, Standard Deviation and Respondents perception of Location ........ 41
Table 4.10: Mean, Standard Deviation and Respondents perception of Facilities ...... 42
Table 4.11: Mean, Standard Deviation and Respondents perception of Product
Consciousness ................................................................................................ 43
Table 4.13: Mean, Standard Deviation and Respondents perception of Pricing ......... 44
Table 4.14: Mean, Standard Deviation and Respondents perception of Promotion .... 45
Table 4.14: Mean, Standard Deviation and Respondents perception of Perceived value46
Table 4.15: Mean, Standard Deviation and Respondents perception of Customer’s
satisfaction ..................................................................................................... 47
Table 4.16: Analysis of correlation between independent variables and the dependent
variable using Pearson's Correlation Coefficient of Empathy, Responsiveness,
Location, Facilities, Product Consciousness, Pricing, Promotion, Perceived
value with customer’s satisfaction of A supermarket’s customers in Bangkok. 48
Table 4.17: Analysis of variance using ANOVA of Empathy, Responsiveness,
Location, Facilities, Product Consciousness, Pricing, Promotion, Perceived
ix
TABLE OF CONTENTS (Continued)
Page
value with customer’s satisfaction of A supermarket’s customers in Bangkok. 51
Table 4.18: Multiple Regression Analysis of Empathy, Responsiveness, Location,
Facilities, Product Consciousness, Pricing, Promotion, Perceived value with
customer’s satisfaction of A supermarket’s customers in Bangkok. ............... 52
Table 4.19: Testing Collinearity of independent variable. ....................................... 55
x
LIST OF FIGURES
Page
Figure 2.1: Framework. ........................................................................................... 22
Figure 4.1 Framework ............................................................................................. 56
CHAPTER 1
GENERALITIES OF THE STUDY
The customer’s satisfaction of supermarket’s customers in Bangkok and the
factors related to it will be introduced primarily. The entire research will be presented
at first. And the statement of problem, research objective, scope of research limitation
of the study, intension and reason to study, assumptions, major research questions,
benefit of study will present as well.
1.1 Background
Thailand is one of the most promising retail markets in Southeast Asia,
offering modern retailers’ plenty of room to grow as traditional trade still holds
approximately half of the total retail sales. The market place is very dynamic and
competition among various players is intensive. Thai customers’ changing lifestyles
and growing urban population are also offering modern retailers many growth
opportunities, as people have less time for shopping and higher expectations, the
convenience and quality of service modern retailers are offering makes them more
attractive to a modern consumer.
Still the year 2014 was by no means an easy year for all Thai retailers as
consumer sentiment continued sluggish, impacted by political and economic situation
especially during the first half of the year. The military coup in May lifted up the
mood somewhat after months of street protest in Bangkok but the recovery in second
half was still not rapid (Thailand Retail Market 2016-2020, 2016).
A supermarket is a grocery and general merchandising retailer
headquartered in Bangkok, Thailand. It is the leading hypermarket chain in Thailand,
managed under the umbrella of Grouped Casino (Thailand Retail Market 2016-2020,
2016). It has operations in three countries, namely Thailand, Vietnam and Laos. The
company was founded by Central Group and the First A supermarket opened on
Chaengwattana Road in Bangkok. It was first listed on the Stock Exchange of
Thailand (Thailand Retail Market 2016-2020, 2016). A is a hypermarket/supercenter
2
brand format, which sells consumer products and foodstuffs. The stores have five
main sale categories: fresh food, dry foods, clothing, home decor and electrical
appliances.
A dual retail-rental business model has enabled our shopping centers to
answer to customers’ needs and preferences through a carefully selected tenant mix.
From A’s first hypermarket opening at Wong Sawang area of Bangkok, store network
has expanded nationwide and our formats have expanded from hypermarkets to cover
multiple formats (Thailand Retail Market 2016-2020, 2016). In 2011, network leaped
forward when we integrated Carrefour’s operations in Thailand. The integration gave
A access to key catchments in both Bangkok and upcountry, enhanced ability to offer
customers the best price available, and widened reach to cover all customer segments
from low to high income (Thailand Retail Market 2016-2020, 2016).
Whether customer shops in A stores, you are a part of the A family. Over the
years A family has grown significantly. A currently employs over 27,000 members of
communities across Thailand (Thailand Retail Market 2016-2020, 2016). As for the
customers, A popular Card loyalty program has grown rapidly into a big family since
its inauguration in 2009, reaching 7.6 million members by the end of 2013 (Thailand
Retail Market 2016-2020, 2016).
An overall competitive landscape in Thai retail business continued intense and
intensified in some cases especially in small store format sector. There are currently
three main players in Thai retail market including A, Tesco Lotus and CP All / Makro,
with all of them having multiple store formats and nationwide mnetwork. In
hypermarket segment our acquisition of Carrefour Thailand operations at the
beginning of 2011 increased significantly our exposure to large cities and tourist
destinations and their more resilient spending.
3
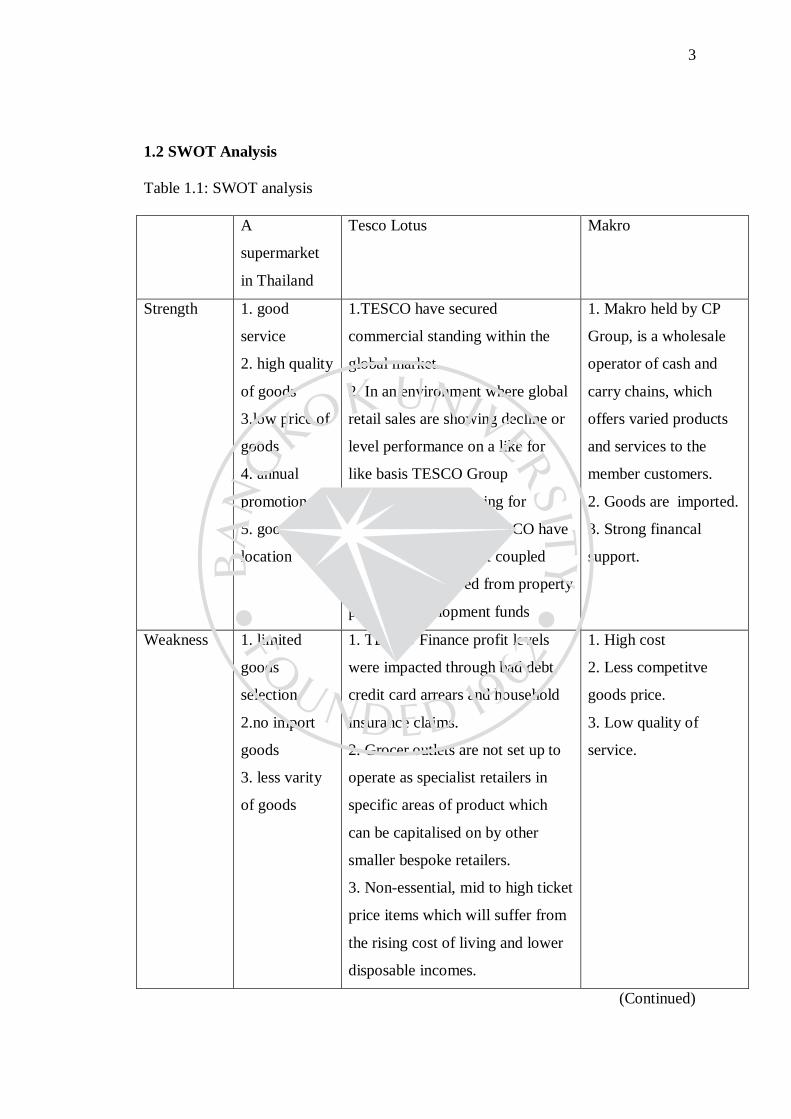
1.2 SWOT Analysis
Table 1.1: SWOT analysis
A
supermarket
in Thailand
Tesco Lotus Makro
Strength 1. good
service
2. high quality
of goods
3.low price of
goods
4. annual
promotion
5. good
location
1.TESCO have secured
commercial standing within the
global market.
2. In an environment where global
retail sales are showing decline or
level performance on a like for
like basis TESCO Group
3. As a business looking for
continued expansion TESCO have
reserve funds of credit coupled
with income derived from property
portfolio development funds
1. Makro held by CP
Group, is a wholesale
operator of cash and
carry chains, which
offers varied products
and services to the
member customers.
2. Goods are imported.
3. Strong financal
support.
Weakness 1. limited
goods
selection
2.no import
goods
3. less varity
of goods
1. TESCO Finance profit levels
were impacted through bad debt,
credit card arrears and household
insurance claims.
2. Grocer outlets are not set up to
operate as specialist retailers in
specific areas of product which
can be capitalised on by other
smaller bespoke retailers.
3. Non-essential, mid to high ticket
price items which will suffer from
the rising cost of living and lower
disposable incomes.
1. High cost
2. Less competitve
goods price.
3. Low quality of
service.
(Continued)

4
Table 1.1(Continued): SWOT analysis
Opportunity 1. lots of
forgin buyers
2. no cooking
habits of Thai
people
3. local
supplier
1. lots of forgin buyers
2. no cooking habits of Thai
people
3. local supplier
1. lots of forgin buyers
2. no cooking habits of
Thai people
3. local supplier
Threat 1. Thai Baht
depreciate
2. political
instable
3. natural
disaster
1. Thai Baht depreciate
2. political instable
3. natural disaster
1. Thai Baht depreciate
2. political instable
3. natural disaster
Source: TransWorldNews (2013). Retrieved from
http://www.transworldnews.com/1308493/big-c-supercenter-public-company-
limited-company-profile-new-swot-report
1.3 Statement of problems
The retail super market is significant interest because of substantial
impacts of product sales and use on a variety of business concerns including
customer supply-demand, business cycles, and customer consumption. Additional,
retailer sales growth has obviously proved the importance of economy for
Thailand. That’s is very important for the owner of super market to understand
what kind of factors will impact on the customer’s satisfaction, so that can affect
to the volume of sales.
1.4 Objective of Research
The research objective of this study is to determine the factors related and
affect relationship between customers’ satisfaction. The factors include are
5
Empathy, Responsiveness, Location, Facilities, Product Consciousness, Pricing,
Promotion, and Perceived value.
1.5 Scope of research
In the study, the factor that can impact on the customer’s satisfaction of A
supermarket’s customers in Bangkok will be determined. The factors include are
Empathy, Responsiveness, Location, Facilities, Product Consciousness, Pricing,
Promotion, Perceived value. The targeted customers are the both Thai people and
foreigner shopping in the A super market. The target customers are no and limitation
on age and genders.
This paper describes eight independent variables which are Empathy,
Responsiveness, Location, Facilities, Product Consciousness, Pricing, Promotion,
Perceived value and only one dependent variable which is customer’s satisfaction.
There are 250 questionnaires were send to target population in the A super market. In
the questionnaires will be nine sections to cover all the independent variables and
dependent variables. And judgment with convenience of non-probability sampling
was applied during that time.
1.6 Research Question
Major research question:
Are there having relationship and impact of Empathy, Responsiveness,
Location, Facilities, Product Consciousness, Pricing, Promotion, Perceived value
towards customer’s satisfaction of A supermarket’s customers in Bangkok.
1.7 Significant of Research
The manager of sales and market manager can apply this research to
determine the efficiency of their market strategies and sales technical. And also,
they can use the information of this study to improve knowledge of understanding
the real needs and wants when customers shopping in A. So that, the owner of A
6
can know the key factors that determine the customer’s satisfaction, then it will
help to increase the sales of buying for get more revenues. The Empathy,
Responsiveness, Location, Facilities, Product Consciousness, Pricing, Promotion,
Perceived value can be adjusted after mangers apply this research to match
customers’ wants better.
1.8 Definition of terms
Customer’s Satisfaction
Satisfaction is an overall attitude towards a product provider or an emotional
reaction to the difference between what customers expect and what they actually
receive regarding the fulfillment of a need. Satisfaction as a person’s feelings of
pleasure, excitement, delight or disappointment which results from comparing a
products perceived performance to his or her expectations. Satisfaction means the
contentment one feels when one has fulfilled a desire, need or expectation.
Empathy
Empathy is the capacity to understand or feel what another being (a human or
non-human animal) is experiencing from within the other being's frame of reference,
i.e., the capacity to place oneself in another's position.
Responsiveness
Responsiveness refers to the willingness on the part of the service provider to
deliver assistance to the customer.
Location
Location can mean convenience and accessibility. Location can also refer to the
number of stores in a particular geographical setting.
Facilities

7
A grocery store facility is described as a place of sensory stimuli where consumers
find colorful product displays coupled with fruits and flowers with perfectly displayed
packages of snacks and advertisements covering the floor.
Product Consciousness
Customers, who score high on this factor are more product conscious or variety
seeking customers or always like different varieties of the products for getting
satisfaction.
Pricing
Pricing is the process whereby a business sets the price at which it will sell its
products and services, and may be part of the business's marketing plan.
Promotion
Promotion refers to raising customer awareness of a product or brand, generating
sales, and creating brand loyalty. It is one of the four basic elements of the market mix,
which includes the four P's: price, product, promotion, and place.
Perceived value
Customer-perceived value is the difference between a prospective customer's
evaluation of the benefits and costs of one product when compared with others.
CHAPTER 2
LITERATURE REVIEW
Chapter 2 is literature review and mainly introduces the concepts of theories
that give academic viewpoints to support study topic “The factors positively affect the
customer’s satisfaction of A supermarket’s customers in Bangkok”. There included
customer’s satisfaction, purchase tangibles, empathy, responsiveness, quality
expectation, personnel, atmosphere, pricing, in-store convenience. A study framework
is presented. So the main purpose of chapter two is to give an insight and guide of this
study.
2.1 Concept theories of Customer’s Satisfaction
According to Abril, et al. (2009) explained that “satisfaction is an overall
attitude towards a product provider or an emotional reaction to the difference between
what customers expect and what they actually receive regarding the fulfillment of a
need”. Bateson, and Hoffman, (2011) also define satisfaction as a person’s feelings
of pleasure, excitement, delight or disappointment which results from comparing a
products perceived performance to his or her expectations. Satisfaction means the
contentment one feels when one has fulfilled a desire, need or expectation.
Furthermore, Customer satisfaction can be a measure of how happy customers are
with the services and products of a supermarket. Keeping customers happy is of
tremendous benefit to companies. Satisfied customers are more likely to stay loyal,
consume more and are more likely to recommend their friends to the business.
Abril, et al., (2009) suggest that “customer satisfaction can be defined as the
overall evaluation of the service performances or utilization.” Customer satisfaction
can also be measured using some questions like, considering all your experience of
company X, how satisfied are you in general on a scale from completely satisfied to
dissatisfied? Another question could be to what degree did company X fulfill your
expectations? On a scale of much less than expected to much more than expected?
(Bateson and Hoffman 2011). According to Bloemer, and Schroder, (2002)
satisfaction can be associated with feelings of acceptance, relief, excitement and
delight. Furthermore, Chang, and Tu, (2005) says that many studies have viewed the
9
impact of customer satisfaction on repeat purchase, loyalty and retention and they
have all echoed concern that customers who are satisfied are most likely to share their
experiences with other people with regards to about five to six people. Additionally,
this research is supported by Chang and Tu, (2005) who also imply that satisfaction
influences repurchase intentions whereas dissatisfaction is seen as a primary reason
for customer defection or discontinuation of purchase. Bateson and Hoffman, (2011)
also say that dissatisfied customers can choose to discontinue purchasing the goods or
services and engage in negative word of mouth.
Bateson and Hoffman, (2011) define customer satisfaction as the level of a
person’s felt state resulting from comparing a product’s perceived performance or
outcome in violation to his/her own expectations. The efficient satisfaction of
customer needs is the ultimate test of a business enterprise’s success and focus of
business activity should be to serve customer needs and wants more efficiently than
competitors. The long term survival of a business enterprise depends not only on the
sales volume and the variety of business enterprise’s products but also on the former’s
ability to satisfy the needs of customers efficiently. A business enterprise’s ability to
deliver superior value is thus the starting point in efficient customer need satisfaction.
A satisfied customer is the only true asset of the business enterprise and represents the
sole justification of the business enterprise’s existence.
2.2 Concept theories of Empathy
Empathy is the capacity to understand or feel what another being (a human or
non-human animal) is experiencing from within the other being's frame of reference,
i.e., the capacity to place oneself in another's position (Fatma. and Gulhayat 2011).
There are many definitions for empathy which encompass a broad range of emotional
states. Types of empathy include cognitive empathy, affective empathy, and somatic
empathy (Javadi,. and Gol,. 2011). In the development of human empathy, individual
differences appear, ranging from no apparent empathic ability, or empathy which is
harmful to self or others, to well-balanced empathy, including the ability to
distinguish between self and other.
10
Empathy has many different definitions that encompass a broad range of
emotional states, including caring for other people and having a desire to help them;
experiencing emotions that match another person's emotions; discerning what another
person is thinking or feeling; and making less distinct the differences between the self
and the other. It also is the ability to feel and share another person's emotions. Some
believe that empathy involves the ability to match another's emotions, while others
believe that empathy involves being tenderhearted toward another person.
Empathy relates to treating customers in such a way that they feel important
to the organization, and that their needs are seen as important to the organization
(Javadi, and Gol, 2011). Nguyễn T. (2016) define empathy as the care and
individualized attention that an organization provides its customers. As such, service
providers need to ensure that service provision is customized to customers’ unique
needs.
2.3 Concept theories of Responsiveness
Responsiveness refers to the willingness on the part of the service provider to
deliver assistance to the customer (Ram (2013). Nguyễn. (2016) state that this
dimension emphasizes attentiveness as well as promptness in handling customer
questions, complaints, requests and problems. It also refers to the ability to develop
customized solutions for customers. As such, the responsiveness dimension reflects a
service firm’s commitment to provide its services in a timely manner.
Responsiveness as a concept of computer science refers to the specific ability
of a system or functional unit to complete assigned tasks within a given time. For
example, it would refer to the ability of an artificial intelligence system to understand
and carry out its tasks in a timely fashion. It is one of the criteria under the principle
of robustness (from a v principle). The other three are observability, recoverability,
and task conformance.
Market responsiveness can generally be defined as the ability for a company
to respond timeously, effectively and efficiently to customers’ needs, competitive
11
threats, and market and business environmental changes. In order to be timeously and
effectively responsive to such changes organizations need to be able to gather,
analyses, process data into meaningful information in order to make viable and
appropriate strategic decisions so as to maintain or even increase their competitive
advantage. This process of collecting, processing, analyzing, and dissemination of
intelligence that is required for formulating high-level organizational strategy is
known as strategic intelligence. In world-class organizations, strategic intelligence is
supported by business intelligence which is the process is by which raw data
(including strategic intelligence and decisions) is transformed into meaningful and
useful information for tactical and operational purposes.
2.4 Concept theories of Location
The location of any store is always very important. Location can mean
convenience and accessibility. Location can also refer to the number of stores in a
particular geographical setting. According to Yongmei et al., (2013), suggest that
once a location is near to the home then transaction costs associated with purchase
such as transport costs and time spent are likely to be reduced. According to Yongmei
et al., (2013) who developed Reilly law of retail gravitation which proposes that
people are drawn to larger shopping thus larger cities tend to attract more customers
to shop their than smaller ones therefore the need for supermarkets to consider
location when putting up facilities. This is further supported by Choi, and Coughlan,
(2006) who use the central place theory to explain how people living far away are
attracted to larger stores which are centrally located in larger shopping malls offering
more collection of goods and services than those stores within their own vicinity
offering less goods and services.
In the marketing mix, the process of moving products from the producer to
the intended user is called place. In other words, it is how your product is bought and
where it is bought. This movement could be through a combination of intermediaries
such as distributors, wholesalers and retailers. In addition, a newer method is the
internet which itself is a marketplace now.
12
Competitive Location Literature is one line of study within the retail store field
which addresses the issue of optimally locating firms that compete for clients in space.
Consumers would shop at the nearest store. Different models based on this
assumption of consumer behavior have been developed since then.
2.5 Concept theories of Facilities
According to Harris, (2010) a grocery store is described as a place of sensory
stimuli where consumers find colorful product displays coupled with fruits and
flowers with perfectly displayed packages of snacks and advertisements covering the
floor. They further argue that some customers then use the in store stimuli as cues to
remind them of what groceries they need and also assert that certain consumers enter
shops without the intention of buying certain goods but end up buying a particular set
of goods because the in store stimuli has triggered unrecognized needs and desires
leading to in store decision making. This is supported by Harris, (2010) who asserts
that the sales outlets/supermarkets facilities are very important since they have the
ability to influence or change the purchasing behavior of consumers; therefore
extreme care has to be observed when making a decision on merchandising because
70 percent of purchase decisions are made during shopping. Olabanji and Olawale
(2013) describe supermarket facilities as the sum of elements that contribute to a
pleasant shopping atmosphere such as shop layout/ aisles that make it easy to move
around, store cleanliness and well-shaped product displays.
Because of increased competition in the market, retailers are being driven to
improve their aisle and display management strategies. This is being done to improve
company share of consumer purchases and wallet. Olabanji and Olawale (2013)
asserts that aisle management involves the effective placement of categories in the
store aisles to improve customers´ shopping experience. Harris. (2010) found that
good store facility design (overall appearance of the shop, cleanliness, departments in
the right places and wide and well-marked aisle directions) leads to enhanced
perceptions of overall merchandise quality. Furthermore, Harris, (2010) say that
physical aspects such as a good store layout and attractive service materials give
customers a good impression and attitude towards the store.

13
2.6 Concept theories of Consciousness
Consciousness is the state or quality of awareness, or, of being aware of an
external object or something within oneself. It has been defined as: sentience,
awareness, subjectivity, the ability to experience or to feel, wakefulness, having a
sense of selfhood, and the executive control system of the mind. Despite the difficulty
in definition, many philosophers believe that there is a broadly shared underlying
intuition about what consciousness is. Thanks to developments in technology over the
past few decades, consciousness has become a significant topic of interdisciplinary
research in cognitive science, with significant contributions from fields such as
psychology, neuropsychology and neuroscience. The primary focus is on
understanding what it means biologically and psychologically for information to be
present in consciousness—that is, on determining the neural and psychological
correlates of consciousness.
Customers, who score high on this factor are more product conscious or
variety seeking customers or always like different varieties of the products for getting
satisfaction. Customers always appreciate and visit those shopping malls, which have
total product availability or variety. Even for getting this type of customer satisfaction
they go to more than one store to get better range of the products or latest products.
These types of customers are not quality conscious, but they have consciousness
about only different varieties of product or multiple options of the product.
2.7 Concept theories of Pricing
Pricing is the process whereby a business sets the price at which it will sell
its products and services, and may be part of the business's marketing plan. Lemuel In
setting prices, the business will take into account the price at which it could acquire
the goods, the manufacturing cost, the market place, competition, market condition,
brand, and quality of product.
14
Pricing is also a key variable in microeconomic price allocation theory.
Pricing is a fundamental aspect of financial modeling and is one of the four Ps of the
marketing mix. (The other three aspects are product, promotion, and place.) Price is
the only revenue generating element amongst the four Ps, the rest being cost centers.
However, the other Ps of marketing will contribute to decreasing price elasticity and
so enable price increases to drive greater revenue and profits.
Pricing can be a manual or automatic process of applying prices to purchase
and sales orders, based on factors such as: a fixed amount, quantity break, promotion
or sales campaign, specific vendor quote, price prevailing on entry, shipment or
invoice date, combination of multiple orders or lines, and many others. Automated
systems require more setup and maintenance but may prevent pricing errors. The
needs of the consumer can be converted into demand only if the consumer has the
willingness and capacity to buy the product. Thus, pricing is the most important
concept in the field of marketing; it is used as a tactical decision in response to
comparing market situation.
Customers, who score high on this factor, are very particular about price and
very conscious to get the best price for the products they buy for getting satisfaction
in shopping malls (ODonnell, 2014). They always appreciate and visit those shopping
malls which have some schemes on price; they check and compare the prices of
products before purchasing them.
2.8 Concept theories of Promotion
Promotion refers to raising customer awareness of a product or brand,
generating sales, and creating brand loyalty. It is one of the four basic elements of the
market mix, which includes the four P's: price, product, promotion, and place.
Promotion is also defined as one of five pieces in the promotional mix or
promotional plan ( Harris, 2010). These are personal selling, advertising, sales
promotion, direct marketing, and publicity. A promotional mix specifies how much
15
attention to pay to each of the five factors, and how much money to budget. The
purpose of a promotion and thus its promotional plan can have a wide range,
including: sales increases, new product acceptance, creation of brand equity,
positioning, competitive retaliations, or creation of a corporate image Fatma and
Gulhayat (2011). Promotions designed to create a short term increase in sales.
Examples of sales promotion include money off coupons, discount codes and "flash
sales".
Promotion is a form of corporate communication that uses various methods
to reach a targeted audience with a certain message in order to achieve specific
organizational objectives ( Fatma and Gulhayat (2011). Nearly all organizations,
whether for-profit or not-for-profit, in all types of industries, must engage in some
form of promotion. Such efforts may range from multinational firms spending large
sums on securing high-profile celebrities to serve as corporate spokespersons to the
owner of a one-person enterprise passing out business cards at a local
businessperson’s meeting.
Like most marketing decisions, an effective promotional strategy requires
the marketer understand how promotion fits with other pieces of the marketing puzzle
(e.g., product, distribution, pricing, target markets). Consequently, promotion
decisions should be made with an appreciation for how it affects other areas of the
company. For instance, running a major advertising campaign for a new product
without first assuring there will be enough inventory to meet potential demand
generated by the advertising would certainly not go over well with the company’s
production department (not to mention other key company executives). Thus,
marketers should not work in a vacuum when making promotion decisions. Rather,
the overall success of a promotional strategy requires input from others in impacted
functional areas.
2.9 Concept theories of Perceived value
Customer-perceived value is the difference between a prospective customer's
evaluation of the benefits and costs of one product when compared with others.
16
Perceived value may also be expressed as a straightforward relationship between
perceived benefits and perceived costs: Value = Benefits / Cost. Armstrong, G. and
Keller, (2006) defined perceived value of customer as the outcome of comparative
relation of private between on the whole advantage perception and perceived offering
or payment by the customer.
Armstrong, and Keller, (2006) proposed that the relationship model of price,
quality and perceived value and mentioned that perceived value is an important factor
in consumers’ purchasing decision process, and consumers will buy a product with
high perceived value. Armstrong, and Keller, (2006) contended that consumers will
evaluate what they give and what they get in their subjective perception when they are
buying a product/service. According to Utility Theory, the probability of purchase
intention will increase, when consumers acquire more benefits than they pay for a
product. Armstrong, and Keller, (2006) also considered that perceived value is an
important antecedent to influence consumer purchase intention because it is the
composition of transaction utility and acquisition utility. Armstrong, and Keller,
(2006) used logic models to analyze the influence of customer perceived value on
consumer purchase intention in retailing industry and found that different perceived
value customers have different purchase behavior. In fact, many researchers
considered perceived value an important factor for marketing companies. It is because
perceived value can be a differentiation and competitiveness to a company.
Furthermore, consumer can transfer their attitudes and feelings from an advertising
endorser to product and create perceived value. Thus, if consumers can receive
trustworthy perceived value in the process of product or service consumption, it will
create a good brand image, loyalty, profit and competiveness to a business.
2.10 Related document and previous research
Chaisamran and Kanthawongs (2015) studied that Factors Positively
Affecting Purchase Intention of Automobile Consumers at Thailand International
Motor Expo 2015 in Bangkok. The researchers studied the positive influence of car
attributes, emotional connection, accessibility, external Influence, brand-loving
tendency, support environmental protection, drive for environmental responsibility,
17
and vivacity towards purchase intention of automobile consumers at Thailand
International Motor Expo 2015 in Bangkok. The 258 usable survey questionnaires
were received from the attendants of Thailand International Motor Expo 2015 at
IMPACT Muang Thong Thani Convention Centre between 5 to 13 December in 2015.
The data were analyzed using Multiple Regression Analysis found that vivacity (β =
0.361) and accessibility (β = 0.141) were positively affected purchase intention of the
potential automobile consumers in the Expo at .05 level of significant, explaining 57%
of the influence towards purchase intention of the consumers. However, car attribute,
emotional connection, brand-loving tendency, supporting environmental protection,
and drive for environmental responsibility were not found to be significantly affected
purchase intention of working people in Bangkok. The factor of external Influence in
the research of Chaisamran and Kanthawongs (2015) might be used in the study of
Chinese students’ loyalty.
Nguyễn (2016) studied that “Factors Influencing Customer Satisfaction towards
Supermarkets in Thai Nguyen City, Vietnam”. The study attempts to find out the
determinants of customer satisfaction towards supermarkets in Thai Nguyen city. In
this study 200 responses of the 4 selected supermarkets in Thai Nguyen city were
surveyed by convenient method. From the literature review and expert opinion, it has
been found out that the dimensions of customer satisfaction are based on: product,
price, personal interaction, convenience, services and physical appearance. Regression
Analysis was used to identify the impact of these factors on customer satisfaction. The
research findings showed that product, price, personal interaction, convenience,
services and physical appearance were positively impacted on customer satisfaction
towards studied supermarkets. Among them price had a strongest influence on
customer satisfaction. Based on these findings, some recommendations were proposed.
Darry et al., (2015) studied that “Customer satisfaction within pharmacies in a
supermarket: a South African perspective”. South Africa is experiencing an expansion
of pharmacy chains. Globalization and deregulations have increase competition within
the retail pharmacy sector. In this highly competitive sector, the most important
strategy for a pharmacy chain to obtain customer satisfaction and maintain market
18
profitability is attributed to customer-focus. The aim of this paper was to investigate
customer satisfaction at a pharmacy chain in South Africa. A total of 400 customers
completed the survey using a questionnaire. All the service quality dimensions in the
customers’ survey contain negative mean gap scores. From these findings, the
pharmacy chain can identify specific gaps in the service quality dimensions and seek
to close them. Service quality dimensions that are deemed to be good predictors of
customer satisfaction have been related to factors relating to tangibles, reliability,
responsiveness, assurance and empathy. The retail pharmacy chain should address
these dimensions in its attempt to offer superior customer service. The
recommendations would provide other pharmacies within a supermarket with
knowledge to address possible shortcomings and improve the service levels.
Olabanji and Olawale (2013) claimed that “Customer Satisfaction and
Loyalty to Small Township Retail Stores in Mankweng, Limpopo Province, South
Africa”. The study investigates customer satisfaction and customer loyalty to small
retail stores that are located close to big retail stores. Data collecting was done
through convenience sampling using self-administered questionnaires. Data was
analyzed through univariate analysis. The results indicated that perceptions of
customer satisfaction are lower than the expectations. The respondents indicated their
intention to make repeat purchases and also recommend the stores to friends and
family indicating customer loyalty. The presence of big retail stores impacts
negatively on the loyalty to small retail stores. Recommendations to improve
customer satisfaction and loyalty are suggested.
Yongmei et al., (2013) studied that “The Customer Satisfaction Research of 7-
ELEVEn Stores in Hong Kong”. Using the 7-ELEVEn stores in Hong Kong as an
example, this paper has studied customer satisfaction from the point of view of the
enterprise. This paper has established a retail enterprise customer satisfaction model
based on CCSI models. The secondary indexes of this customer satisfaction model
include the following content: enterprise/brand image, quality expectations (shopping
environment of convenience stores), quality perception (staff’s service quality), value
perception, customer satisfaction, complaints and loyalty of customers and there are
19
also 18 indexes in third class indicators. With the principal component analysis, it can
be found that three important factors were value and overall satisfaction, employee
service quality, shopping environment and brand image, besides three satisfaction
factors were shopping environment, the staff’s service quality and perceived value.
The aim of this paper is to provide reference for the key of enterprise’s future work
and also for the optimal distribution of resources.
Ram (2013) made research about “To Identify the Factors Impacting
Customer Satisfaction in Food Retail Supermarkets”. Many research studies have
been conducted in the area of retailing services, but there has been no research that
takes into account both service quality and retail store features and identifies the
factors that lead to customer satisfaction in food retail supermarkets. Customer
satisfaction is defined as the extent to which a product or service meets or exceeds the
customers’ expectations. The importance of such a study is immense in one of the
fastest growing retail markets like India, where the impact of service quality and retail
store features on customer satisfaction from the retail customers’ point of view is a
very crucial field of discussion. After extracting different variables of service quality
and retail store features from studying a body of literature on services in food retail
supermarkets, this study aims to identify the main factors that lead to customer
satisfaction in food retail supermarkets. The main factors are extracted from the
independent variables using factor analysis. Then regression analysis is done taking
the extracted factors as independent variables and customer satisfaction as dependent
variable. Likert scale and multiple choice questions are used in the questionnaire.
There are 17 independent variables which by factor analysis are reduced to 5 main
factors which are found to significantly impact customer satisfaction in food retail
supermarkets.
Satnam and Bedia (2012) studied that “A Study of Customer Satisfaction
From Organized Retailing (With reference to Indore City). Organized retailing is
gradually inching its way and becoming the next boom industry. The organized
retailing sector in India has undergone significant transformation in the last decade.
Customer satisfaction is a complex phenomenon for marketers as well as researchers.
20
The purchases of goods or services consist of a number of factors that could affect
purchase decision. The objectives of the present study were to analyze the customer
satisfaction in shopping malls with respect to product, price, place and promotion in
Indore city and to study the variations in customer satisfaction due to different
demographic variables. The sample of the study included 175 active mall shoppers.
The data was collected using self-designed questionnaire and during data analysis,
eleven factors relating to customer satisfaction were explored. The factors were
product consciousness, comfort with entertainment seeker, extra service conscious,
store and hygiene consciousness, and price consciousness, billing flexibility and
facility, sales people consciousness, over choice of store, employee consciousness and
taste consciousness. The study will help the managers of shopping malls to
understand the factors that are related to shopping malls and may help in a analyzing
the customer satisfaction to the shoppers in the malls.
Fatma and Gulhayat (2011) studied that “Structural Determinants of
Customer Satisfaction in Loyalty Models: Turkish Retail Supermarkets”. Customer
satisfaction and loyalty are very important to develop the retail strategies. The main
goal of this study is to examine the determinants of customer satisfaction by customer
and store related factors. In this study, using structural equation modeling, structural
determinants of satisfaction are investigated in the context of loyalty models. We use
Dickson’s (1982) and Bloemer’s (2002) frameworks as a starting point and
distinguish a person determinant, a situation determinant and a person within situation
determinant of customer satisfaction. The results of this study provide that positive
effect, image and customer relationship proneness play a significant role in creating
satisfaction.
Phuc (2011) explained that “Customer Satisfaction towards Retailers”. In the
midst of stiff and fierce competition and increased number of grocery retail outlets
providing a variety of products, customers have become accustomed to patronizing
multiple outlets. Retailers have recognized this trend and are of the view that
customer satisfaction plays a role in the success of business strategies. Therefore it
has become important for grocery retail stores to try and manage customer satisfaction.
21
This paper was thus developed to investigate the satisfaction levels of customers in
supermarkets. Data was collected from three supermarkets in Visby, Gotland. The
study examined the importance of overall dimensions and specific elements of
customer satisfaction towards the measurement of satisfaction levels. In addition,
comparative analysis was conducted between the three relative grocery stores.
Customer satisfaction levels were measured. The highest percentage of customers of
the whole sample belonged to medium level of satisfaction. The statistical result
concluded that customers of ICA Nära and customers of ICA were higher satisfied
than those of Coop Forum. The results showed that customers felt satisfied with
Location, Staff courtesy and Reliability of supermarkets as the top aspects that drive
satisfaction while additional services were ranked lowest. Due to these results, the
impact of these attributes on Customer satisfaction must not be underestimated.
2.11 Hypothesis
H1: Empathy can positively related with the customer’s satisfaction of
supermarket’s customers in Bangkok.
H2: Responsiveness can positively related with the customer’s satisfaction of
supermarket’s customers in Bangkok.
H3: Location can positively related with the customer’s satisfaction of
supermarket’s customers in Bangkok.
H4: Facilities can positively related with the customer’s satisfaction of
supermarket’s customers in Bangkok.
H5: Product Consciousness can positively related with the customer’s
satisfaction of supermarket’s customers in Bangkok.
H6: Pricing can positively related with the customer’s satisfaction of
supermarket’s customers in Bangkok.
22
H7: Promotion can positively related with the customer’s satisfaction of
supermarket’s customers in Bangkok.
H8: Perceived value can positively related with the customer’s satisfaction of
supermarket’s customers in Bangkok.
H9: Empathy, Responsiveness, Location, Facilities, Product Consciousness,
Pricing, Promotion, and Perceived value can have positive impact towards the
customer’s satisfaction of supermarket’s customers in Bangkok.
2.12 Variable used in research
2.12.1 Independent Variable categorized into
2.12.1.1 Empathy
2.12.1.2 Responsiveness
2.12.1.3 Location
2.12.1.4 Facilities
2.12.1.5 Product Consciousness
2.12.1.6 Pricing
2.12.1.7 Promotion
2.12.1.8 Perceived value
2.12.2 Dependent Variable is Customer’s satisfaction
23
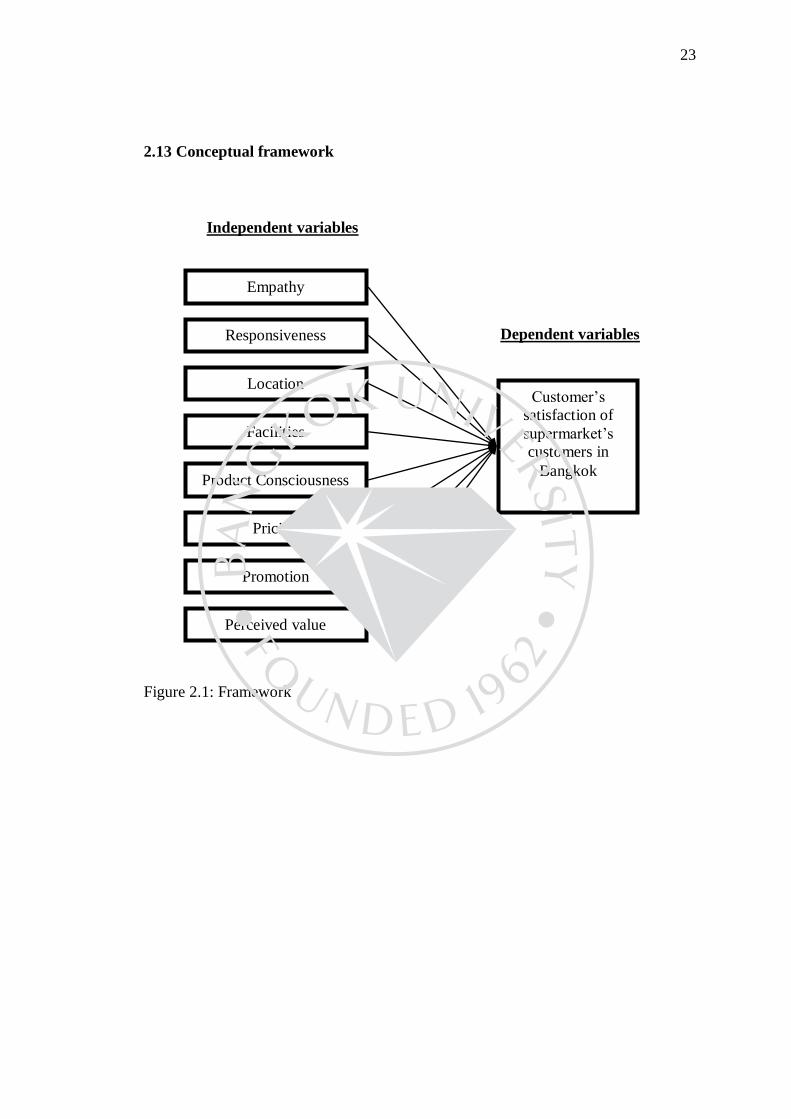
2.13 Conceptual framework
Figure 2.1: Framework
Empathy
Responsiveness
Location
Facilities
Product Consciousness
Pricing
Promotion
Perceived value
Customer’s
satisfaction of
supermarket’s
customers in
Bangkok
Independent variables
Dependent variables
Chapter 3
Research Methodology
This chapter is illustrated the information in term of research methodology
which is about the process used to collect data and information on behalf of running
data. In this chapter, there are 6 parts including method of research used, respondents
and sampling procedures, research instrument, pretest, collection and statistical
treatment of data respectively. Therefore, the additional information of this chapter
are as follows;
3.1 Research Design
There are many types of research which can apply to several studies as
exploratory research, descriptive research and casual research respectively. However,
in this study, the appropriated type of this study was conducted in term of descriptive
research which refers to describe answer to specify research problems in detail.
Descriptive research is devoted to the collecting the information about widespread
situations or conditions for the purpose of description and interpretation (Armstrong,
G. and Keller, P. (2006). The significance of descriptive research is focusing in term
of the characteristics of individual and the characteristics of the whole sample which
can support to provide useful information to the problems’ solution. Then, this type of
research is the most suitable to collect the data as well as depict the relationship
between measured variables. Besides, this research also uses the techniques of survey
by distributing the questionnaires as gathering the primary data with 250 employees
who are customers of A Bangkok, Thailand. So as to know their attitudes toward
shopping satisfactions for related to the several factors that can be affected. In
addition, secondary data is another technique for using because of providing on the
several sources such as internet, textbook and so forth which is benefit as easily
access, low cost and saving time in finding the useful information. Furthermore, these
secondary data also come from the reliable sources to get more exactly information to
adapt with this study effectively.
25
3.2 Population and Sample Selection
Population in Research
Data used in this study were obtained from A shopping mall in Bangkok,
Thailand which is a grocery and general merchandising retailer headquartered in
Bangkok, Thailand. It is the leading hypermarket chain in Thailand, managed under
the umbrella of Grouped Casino. This study will be opened for customers in each
branch of A shopping mall in Bangkok, Thailand. Because it is minimizing sample
selection bias, and it helps to avoid over representation or under representation on a
certain segment. Besides, it can accurately reflect the population.
Sample Size in Research
Considered the population is known and we have received the population from
customers shopping in supermarket. In this study, we will apply with sample size
formula that is determined by using estimated proportions.
The sample size for this study was based on a Cohen (1977) formula to
determine the sample size from 40 questionnaires done by customers who
experienced the A shopping Mall. According to the formula, Cohen (1977), using in
G*power and an approval from several researchers (Erdfelder, Faul, & Buchner,
1996; Wiratchai, 2012). G*power version 3.1.9.2 is using to calculate 40 sets of Pilot
Test with the Power (1– β) of 0.85, Alpha (α) of 0.15, Number of Test Predictor of 8,
Effect Size of 0.06695119 (Calculated by Partial R2 of 0.06275). The result shows
that the minimum of the total sample size is 188 (Cohen, 1977). Thus, 250 sets of
questionnaire have been collected.
26
Sample Selection in Research
Data were gathered from 250 customers-as a part of a larger study. Accidental
sampling method will be applied in the research from A supermarket. Judgment
sampling called purposive sampling involves choosing objects/ samples that are
believed will give accurate results. An experienced individual selects the sample
based on his or her judgment about some appropriate characteristics required of the
sample member. The researcher chose to conduct judgment sampling on customers
who experienced the A shopping supermarket.
3.3 Research instruments
The researcher conduct research instrument in the following order
3.3.1 Research from books, documents, articles, and Journals that relate to the
Empathy, Responsiveness, Location, Facilities, Product Consciousness, Pricing,
Promotion, Perceived value, Customer Satisfaction responsibility, together with
guidance and assistance from an advisor.
3.3.2 Creating a questionnaire from theory in related researches, which are
Empathy, Responsiveness, Location, Facilities, Product Consciousness, Pricing,
Promotion, and Perceived value, Customer Satisfaction, with the approval of an
advisor, Dr. Penjira Kanthawongs, and 2 supermarket experts, Mr. Wang Nathaphat
and Ms. Anongnut Boonrueangnam , both are supermarket sales in Big C supermarket
of Thailand.
3.3.3 Using comment and guidance from the advisor to remake the
questionnaire. After that, launch 40 pilot test questionnaires and analyze the reliability
of each variable in each factor using Cronbach's Alpha Coefficient. Value of
Cronbach's Alpha is between 0≤α≤ 1, higher value mean higher reliability and closely
related of section.
27
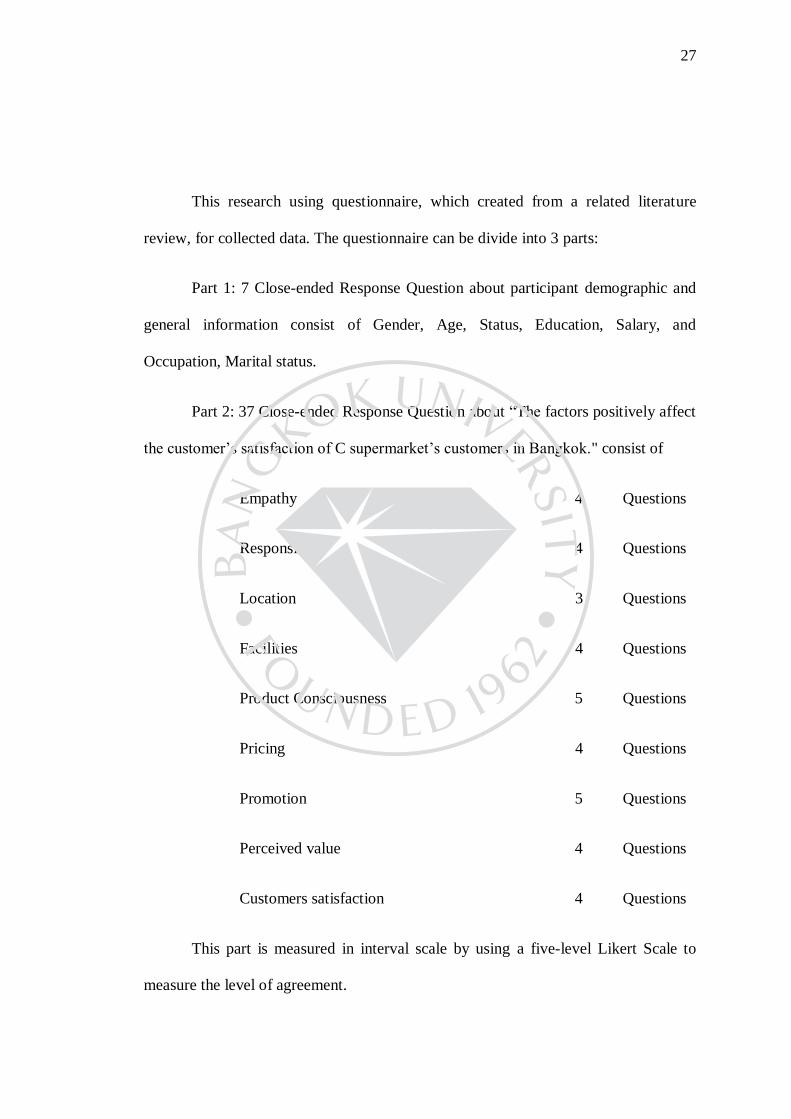
This research using questionnaire, which created from a related literature
review, for collected data. The questionnaire can be divide into 3 parts:
Part 1: 7 Close-ended Response Question about participant demographic and
general information consist of Gender, Age, Status, Education, Salary, and
Occupation, Marital status.
Part 2: 37 Close-ended Response Question about “The factors positively affect
the customer’s satisfaction of C supermarket’s customers in Bangkok." consist of
Empathy 4 Questions
Responsiveness 4 Questions
Location 3 Questions
Facilities 4 Questions
Product Consciousness 5 Questions
Pricing 4 Questions
Promotion 5 Questions
Perceived value 4 Questions
Customers satisfaction 4 Questions
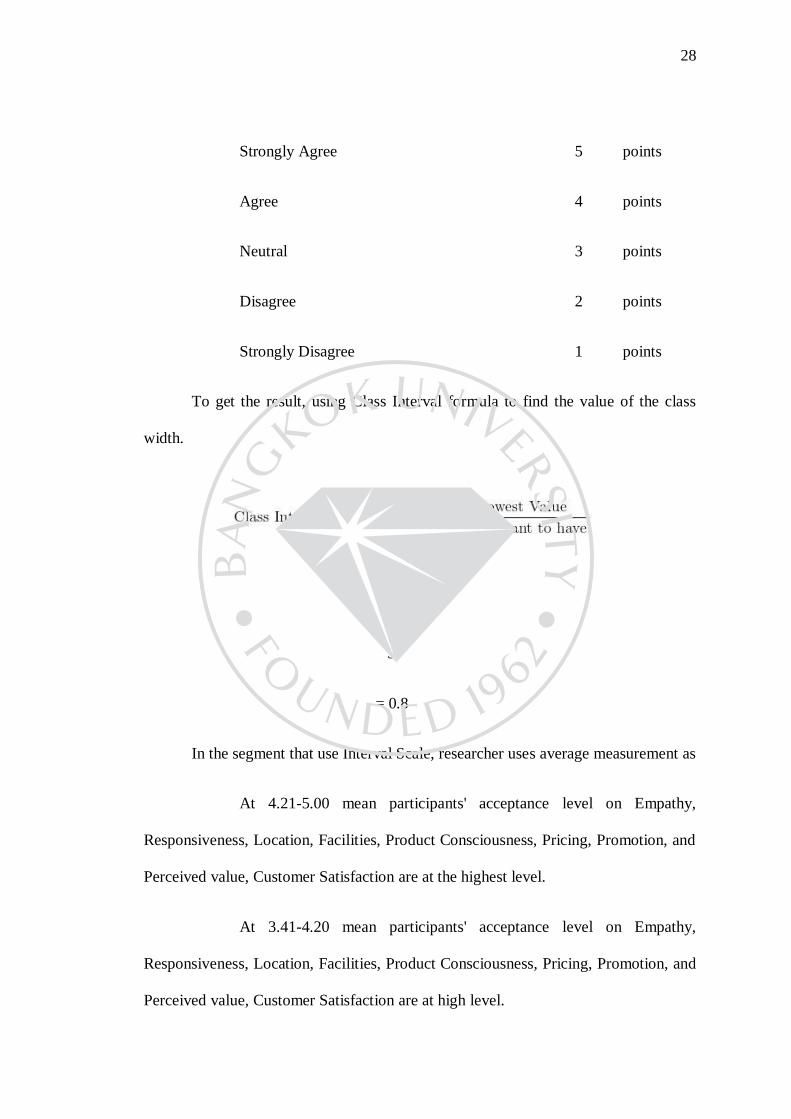
This part is measured in interval scale by using a five-level Likert Scale to
measure the level of agreement.
28
Strongly Agree 5 points
Agree 4 points
Neutral 3 points
Disagree 2 points
Strongly Disagree 1 points
To get the result, using Class Interval formula to find the value of the class
width.
= 5-1
5
= 0.8
In the segment that use Interval Scale, researcher uses average measurement as
At 4.21-5.00 mean participants' acceptance level on Empathy,
Responsiveness, Location, Facilities, Product Consciousness, Pricing, Promotion, and
Perceived value, Customer Satisfaction are at the highest level.
At 3.41-4.20 mean participants' acceptance level on Empathy,
Responsiveness, Location, Facilities, Product Consciousness, Pricing, Promotion, and
Perceived value, Customer Satisfaction are at high level.
29
At 2.61-3.40 mean participants' acceptance level on Empathy,
Responsiveness, Location, Facilities, Product Consciousness, Pricing, Promotion, and
Perceived value, Customer Satisfaction are at normal level.
At 1.81-2.60 mean participants' acceptance level on Empathy,
Responsiveness, Location, Facilities, Product Consciousness, Pricing, Promotion, and
Perceived value, Customer Satisfaction are at low level.
At 1.00-1.80 mean participants' acceptance level on Empathy,
Responsiveness, Location, Facilities, Product Consciousness, Pricing, Promotion, and
Perceived value, Customer Satisfaction are at the lowest level.
Part 3: An Open–Ended Response Question that allows participants to leave
some advice or comment for researcher.
3.4 Testing Research Instrument
In order to develop the good questionnaire, it is very important to test the
factor which affect to the variables and comprehend that there are any questions in the
questionnaire have to revise or not. Also, to study about the possibility. Importantly,
the sample size for the pretest should be the small size around 40 people as the
recommendation from many researchers.
To investigate the feasibility of the questionnaire, a samples of a customers in
A supermarket.
30
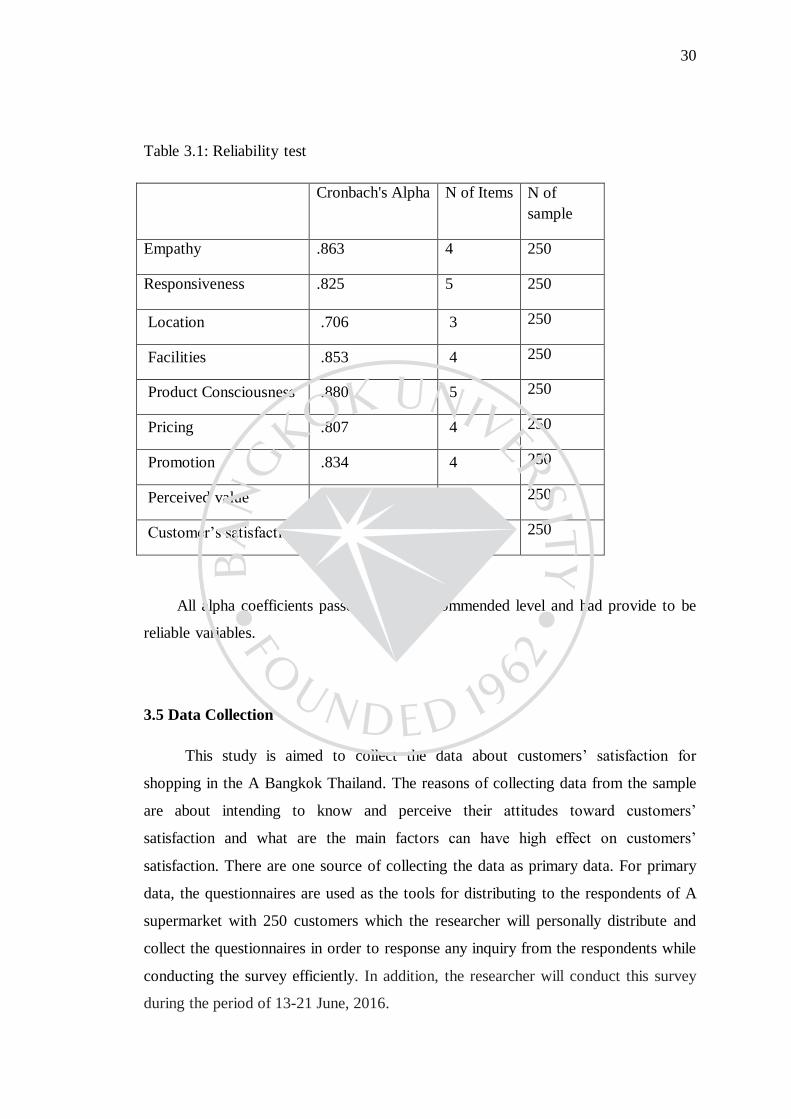
Table 3.1: Reliability test
Cronbach's Alpha N of Items N of
sample
Empathy .863 4 250
Responsiveness .825 5 250
Location .706 3 250
Facilities .853 4 250
Product Consciousness .880 5 250
Pricing .807 4 250
Promotion .834 4 250
Perceived value .722 4 250
Customer’s satisfaction .865 4 250
All alpha coefficients passed the 0.65recommended level and had provide to be
reliable variables.
3.5 Data Collection
This study is aimed to collect the data about customers’ satisfaction for
shopping in the A Bangkok Thailand. The reasons of collecting data from the sample
are about intending to know and perceive their attitudes toward customers’
satisfaction and what are the main factors can have high effect on customers’
satisfaction. There are one source of collecting the data as primary data. For primary
data, the questionnaires are used as the tools for distributing to the respondents of A
supermarket with 250 customers which the researcher will personally distribute and
collect the questionnaires in order to response any inquiry from the respondents while
conducting the survey efficiently. In addition, the researcher will conduct this survey
during the period of 13-21 June, 2016.
31
3.6 Preparation and Data Analysis
SPSS was applied to convert the data collected into results to link with the
objective of the study. The following method was used for statistical treatment of the
data.
Inferential Statistics are information used in making reference or judgments
about a population on the basis of a sample (Bateson, J.E.G. and Hoffman, K.D.
2011). Pearson Correlation Analysis was adopted in the testing of the eleven
hypotheses. Pearson Correlation Coefficient is a parametric technique which gives a
measurement of the strength of association between two interval scaled variables .
For this research objective, The Correlation Coefficient between the (X) main
factors includes the following:
Empathy,
Responsiveness,
Location,
Facilities,
Product Consciousness,
Pricing,
Promotion,
Perceived value,
Customer Satisfaction of C.
3.7 Statistic Method
Statistic analysis method in this research consist of
3.7.1 Reliability of the Test using Cronbach's Alpha Coefficient
32
reliability value of total questionnaire
number of question
total variability of questionnaire
variability of total questionnaire
3.7.2 Descriptive Statistics Analysis
3.7.2.1 Percentage
P percentage
f percentage frequency
N frequency
3.7.2.2 Mean
mean
total group score
number of group score
33
3.7.2.3 Standard Deviation
S.D. standard deviation
X score
n number of score in each group
∑ Total amount
3.7.3 Inferential Statistics
3.7.3.1 Multiple Regression Analysis (MRA) is an analysis progress to
find relationship between Dependent Variable and Independent Variable
Ý = b0+b1X1+b2X2+ ··· +bkXk
Ý predicted dependent variable
b0 value of Y when all of the independent variables
are equal to zero
b1 ,..., bk estimated regression coefficients
X0 ,…, Xk predictor variables
34
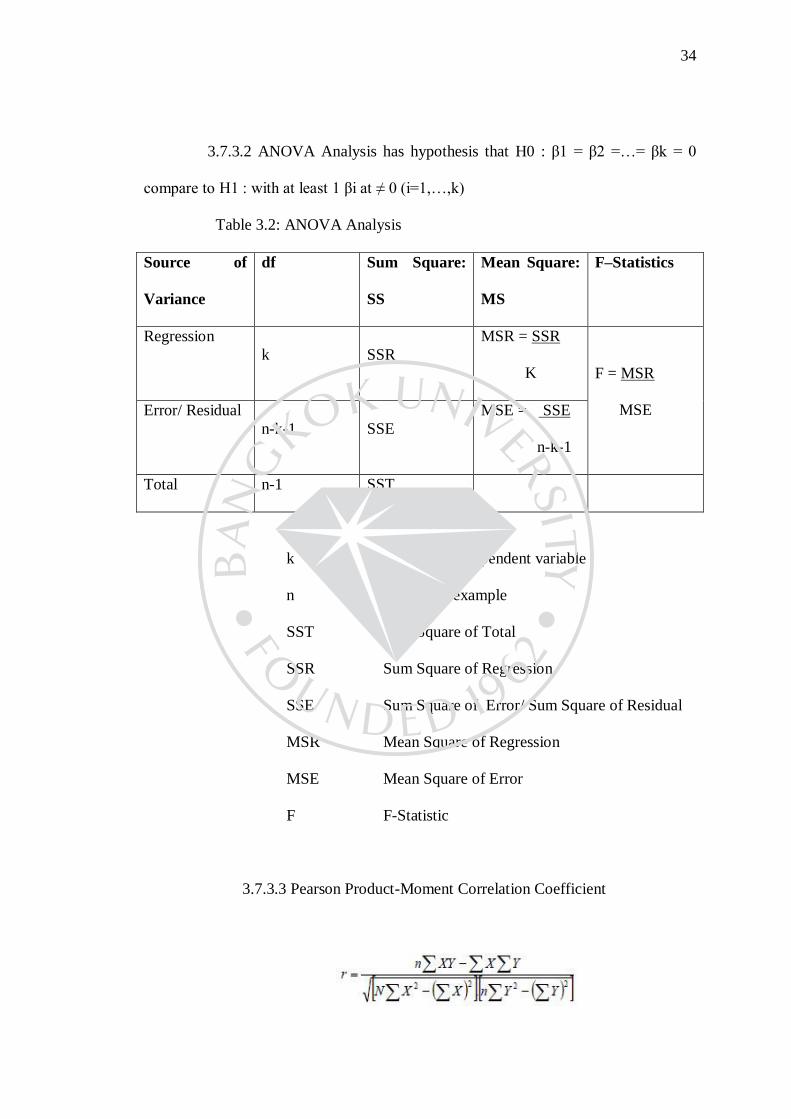
3.7.3.2 ANOVA Analysis has hypothesis that H0 : β1 = β2 =…= βk = 0
compare to H1 : with at least 1 βi at ≠ 0 (i=1,…,k)
Table 3.2: ANOVA Analysis
Source of
Variance
df Sum Square:
SS
Mean Square:
MS
F–Statistics
Regression
k SSR
MSR = SSR
K F = MSR
MSE Error/ Residual
n-k-1 SSE
MSE = SSE
n-k-1
Total n-1 SST
k number of independent variable
n number of example
SST Sum Square of Total
SSR Sum Square of Regression
SSE Sum Square of Error/ Sum Square of Residual
MSR Mean Square of Regression
MSE Mean Square of Error
F F-Statistic
3.7.3.3 Pearson Product-Moment Correlation Coefficient
35
Rxy Pearson Correlation Coefficient
x Values in the first set of data
y Values in second set of data
n Total number of value
The value of Pearson Correlation Coefficient is between –1≤ r ≤ 1.
The positive and negative value of r determine the direction of
relationship.
Positive r show that 2 variable have same direction of relationship.
Negative r show that 2 variable have opposite direction of
relationship.
The size of the relationship can be determine by value of r
r value nearly +1 show that 2 variable have close relationship in
the same direction.
r value nearly -1 show that 2 variable have least relationship in
opposite direction.
r value equal to 0 mean there is no correlation between 2 variable.
r value close to 0 mean that 2 variable has few relationship.
CHAPTER 4
FINDING
In this study, for the sake of obtaining the exact sample size as calculated in chapter 3,
the questionnaire was actually distributed 250 during 13-21 June, 2016.
So the information acquired from 250 valid questionnaires survey which collected, and
then the results of data collection and analysis were presented based on the research
methodology discussed in chapter3. The data were showed in three parts; the first part was the
data analysis of demographic characteristics by using frequency and percentage. Then second
part was the data analysis of measuring variables by using mean and standard deviation. The
last part was hypothesis test.
The data presented also explored to support research questions mentioned in chapter 3.
The reliability of research instrument will be test.
4.1 Demographic data
The following tables are that this is the ratio of the frequency and distribution of
the defendants were described demographic analysis.
37
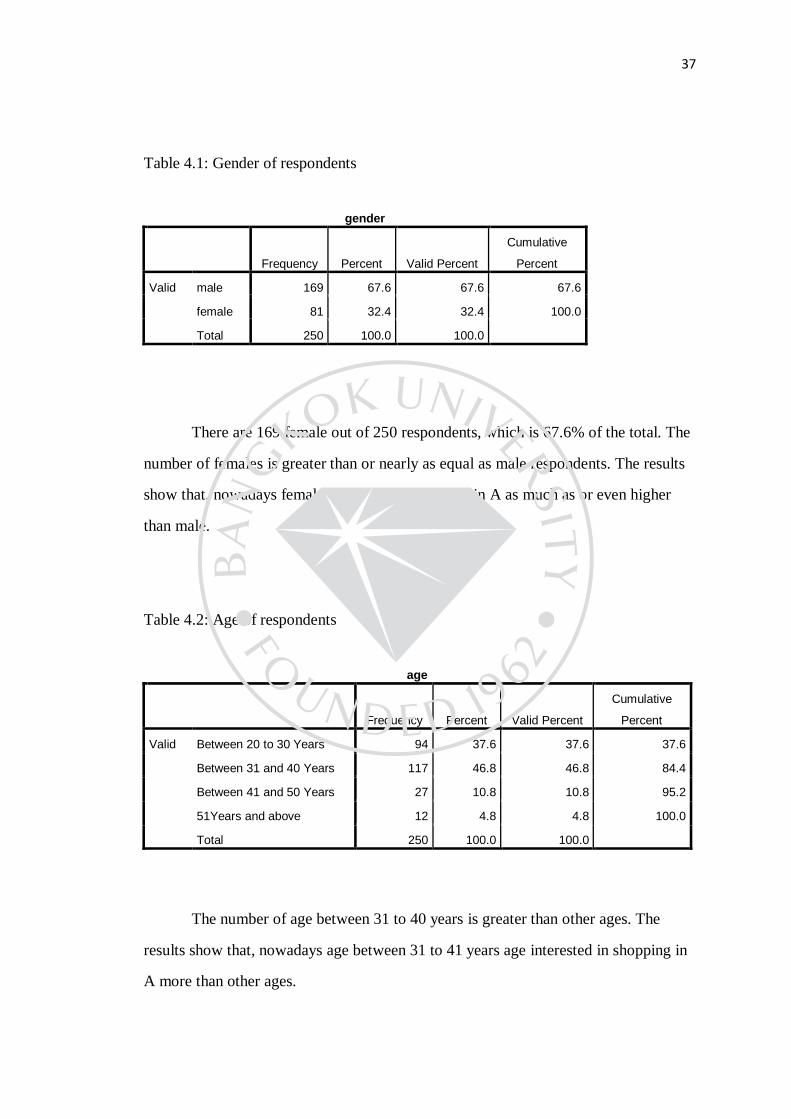
Table 4.1: Gender of respondents
gender
Frequency Percent Valid Percent
Cumulative
Percent
Valid male 169 67.6 67.6 67.6
female 81 32.4 32.4 100.0
Total 250 100.0 100.0
There are 169 female out of 250 respondents, which is 67.6% of the total. The
number of females is greater than or nearly as equal as male respondents. The results
show that, nowadays female interested in shopping in A as much as or even higher
than male.
Table 4.2: Age of respondents
age
Frequency Percent Valid Percent
Cumulative
Percent
Valid Between 20 to 30 Years 94 37.6 37.6 37.6
Between 31 and 40 Years 117 46.8 46.8 84.4
Between 41 and 50 Years 27 10.8 10.8 95.2
51Years and above 12 4.8 4.8 100.0
Total 250 100.0 100.0
The number of age between 31 to 40 years is greater than other ages. The
results show that, nowadays age between 31 to 41 years age interested in shopping in
A more than other ages.
38
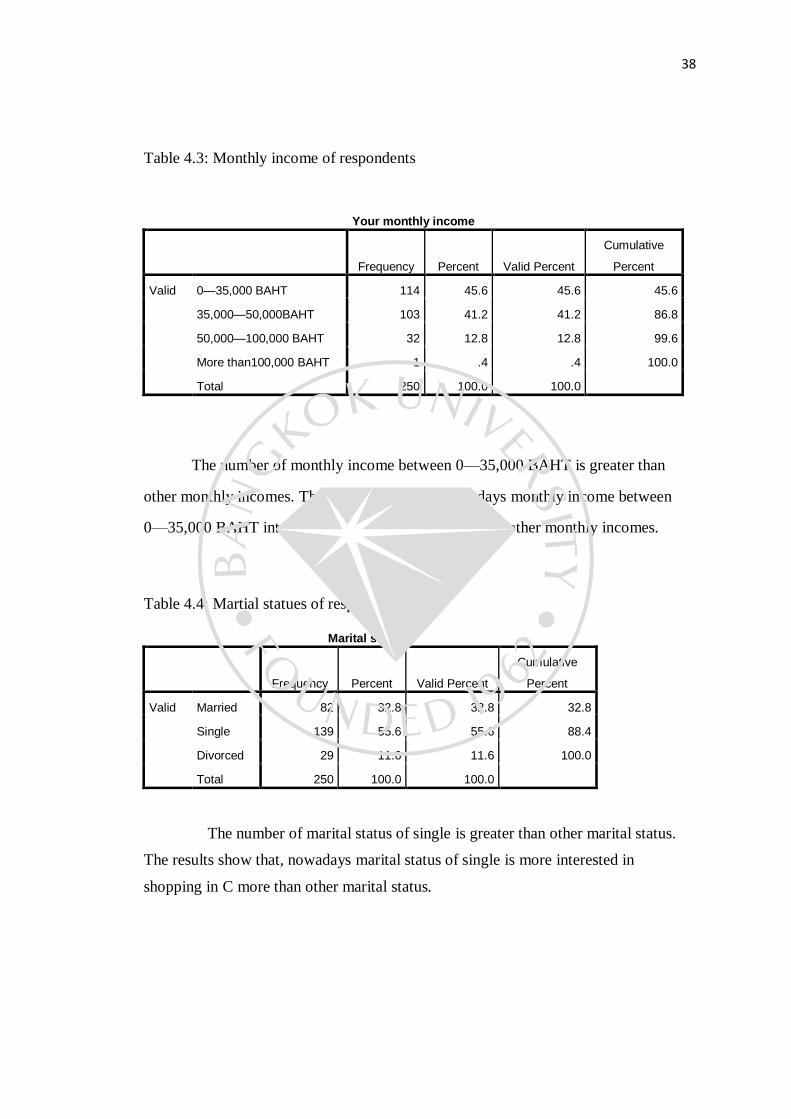
Table 4.3: Monthly income of respondents
Your monthly income
Frequency Percent Valid Percent
Cumulative
Percent
Valid 0—35,000 BAHT 114 45.6 45.6 45.6
35,000—50,000BAHT 103 41.2 41.2 86.8
50,000—100,000 BAHT 32 12.8 12.8 99.6
More than100,000 BAHT 1 .4 .4 100.0
Total 250 100.0 100.0
The number of monthly income between 0—35,000 BAHT is greater than
other monthly incomes. The results show that, nowadays monthly income between
0—35,000 BAHT interested in shopping in A more than other monthly incomes.
Table 4.4: Martial statues of respondents
Marital statues
Frequency Percent Valid Percent
Cumulative
Percent
Valid Married 82 32.8 32.8 32.8
Single 139 55.6 55.6 88.4
Divorced 29 11.6 11.6 100.0
Total 250 100.0 100.0
The number of marital status of single is greater than other marital status.
The results show that, nowadays marital status of single is more interested in
shopping in C more than other marital status.
39
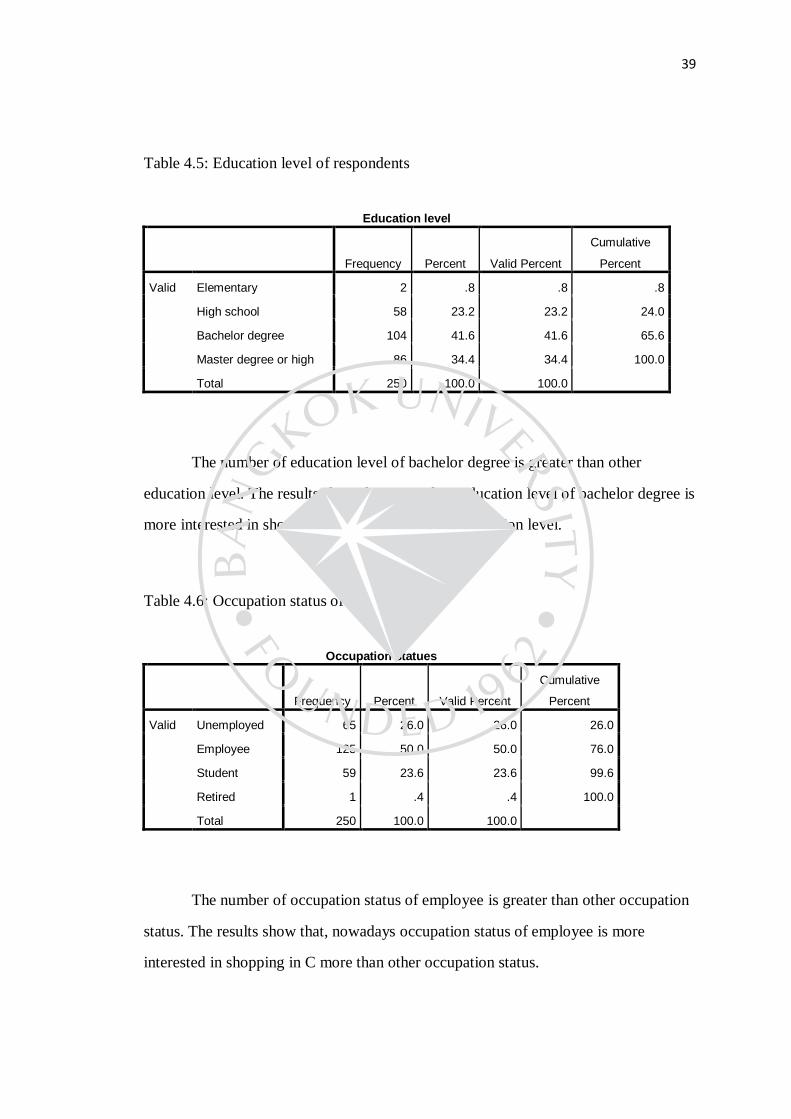
Table 4.5: Education level of respondents
Education level
Frequency Percent Valid Percent
Cumulative
Percent
Valid Elementary 2 .8 .8 .8
High school 58 23.2 23.2 24.0
Bachelor degree 104 41.6 41.6 65.6
Master degree or high 86 34.4 34.4 100.0
Total 250 100.0 100.0
The number of education level of bachelor degree is greater than other
education level. The results show that, nowadays education level of bachelor degree is
more interested in shopping in C more than other education level.
Table 4.6: Occupation status of respondents
Occupation statues
Frequency Percent Valid Percent
Cumulative
Percent
Valid Unemployed 65 26.0 26.0 26.0
Employee 125 50.0 50.0 76.0
Student 59 23.6 23.6 99.6
Retired 1 .4 .4 100.0
Total 250 100.0 100.0
The number of occupation status of employee is greater than other occupation
status. The results show that, nowadays occupation status of employee is more
interested in shopping in C more than other occupation status.
40
4.2 Mean, Standard Deviation and Respondents perception
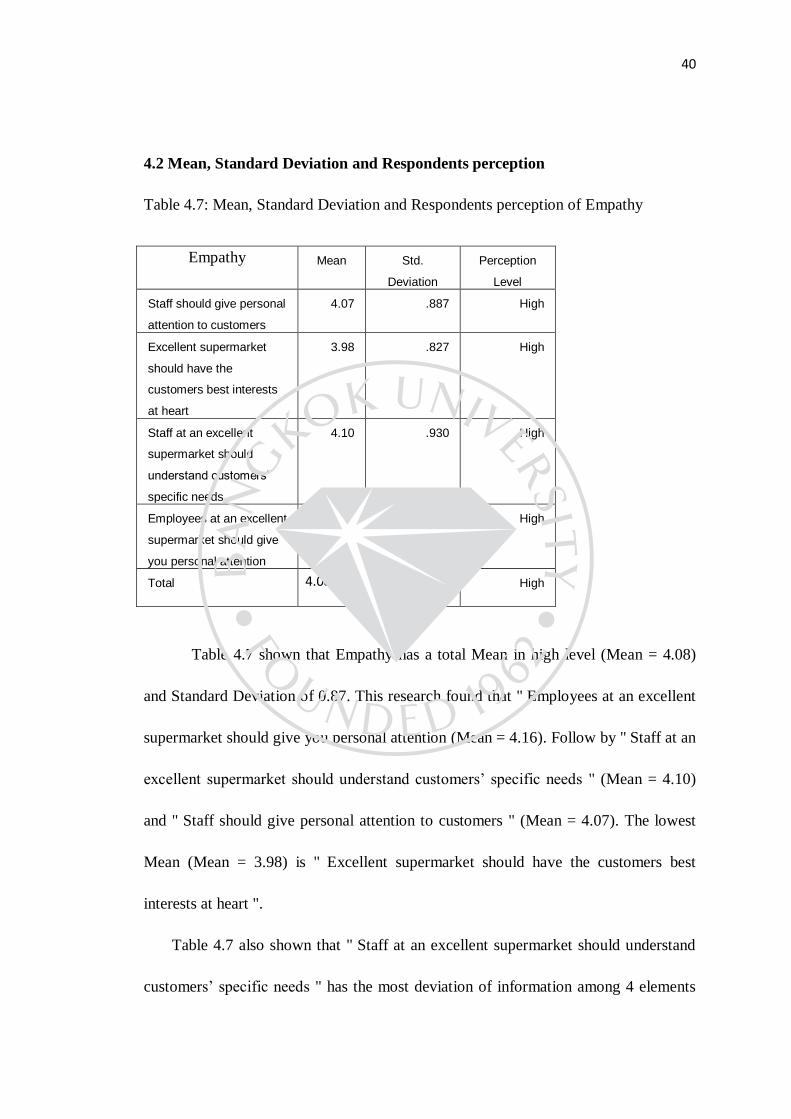
Table 4.7: Mean, Standard Deviation and Respondents perception of Empathy
Empathy Mean Std.
Deviation
Perception
Level
Staff should give personal
attention to customers
4.07 .887 High
Excellent supermarket
should have the
customers best interests
at heart
3.98 .827 High
Staff at an excellent
supermarket should
understand customers’
specific needs
4.10 .930 High
Employees at an excellent
supermarket should give
you personal attention
4.16 .848 High
Total 4.08 0.87 High
Table 4.7 shown that Empathy has a total Mean in high level (Mean = 4.08)
and Standard Deviation of 0.87. This research found that " Employees at an excellent
supermarket should give you personal attention (Mean = 4.16). Follow by " Staff at an
excellent supermarket should understand customers’ specific needs " (Mean = 4.10)
and " Staff should give personal attention to customers " (Mean = 4.07). The lowest
Mean (Mean = 3.98) is " Excellent supermarket should have the customers best
interests at heart ".
Table 4.7 also shown that " Staff at an excellent supermarket should understand
customers’ specific needs " has the most deviation of information among 4 elements
41
(S.D. = 0.93). While the least deviation of information among 4 elements is "
Excellent supermarket should have the customers best interests at heart " (S.D. =
0.827).
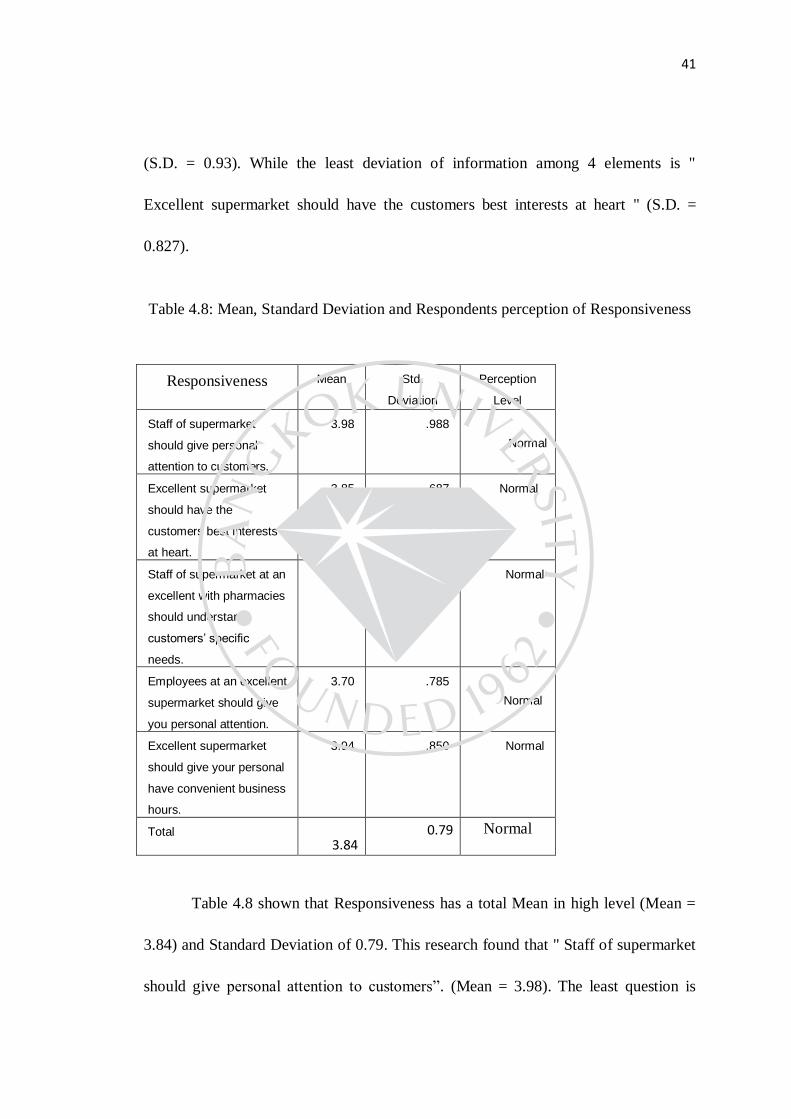
Table 4.8: Mean, Standard Deviation and Respondents perception of Responsiveness
Responsiveness Mean Std.
Deviation
Perception
Level
Staff of supermarket
should give personal
attention to customers.
3.98 .988
Normal
Excellent supermarket
should have the
customers best interests
at heart.
3.85 .687 Normal
Staff of supermarket at an
excellent with pharmacies
should understand
customers’ specific
needs.
3.75 .795 Normal
Employees at an excellent
supermarket should give
you personal attention.
3.70 .785
Normal
Excellent supermarket
should give your personal
have convenient business
hours.
3.94 .850 Normal
Total 3.84
0.79 Normal
Table 4.8 shown that Responsiveness has a total Mean in high level (Mean =
3.84) and Standard Deviation of 0.79. This research found that " Staff of supermarket
should give personal attention to customers”. (Mean = 3.98). The least question is
42
“Employees at an excellent supermarket should give you personal attention.” (Mean =
3.70).
Table 4.8 also shown that " Staff of supermarket should give personal attention to
customers " has the most deviation of information among 5 elements (S.D. = 0.988).
While the least deviation of information among 5 elements is " Excellent supermarket
should have the customers best interests at heart. " (S.D. = 0.687).
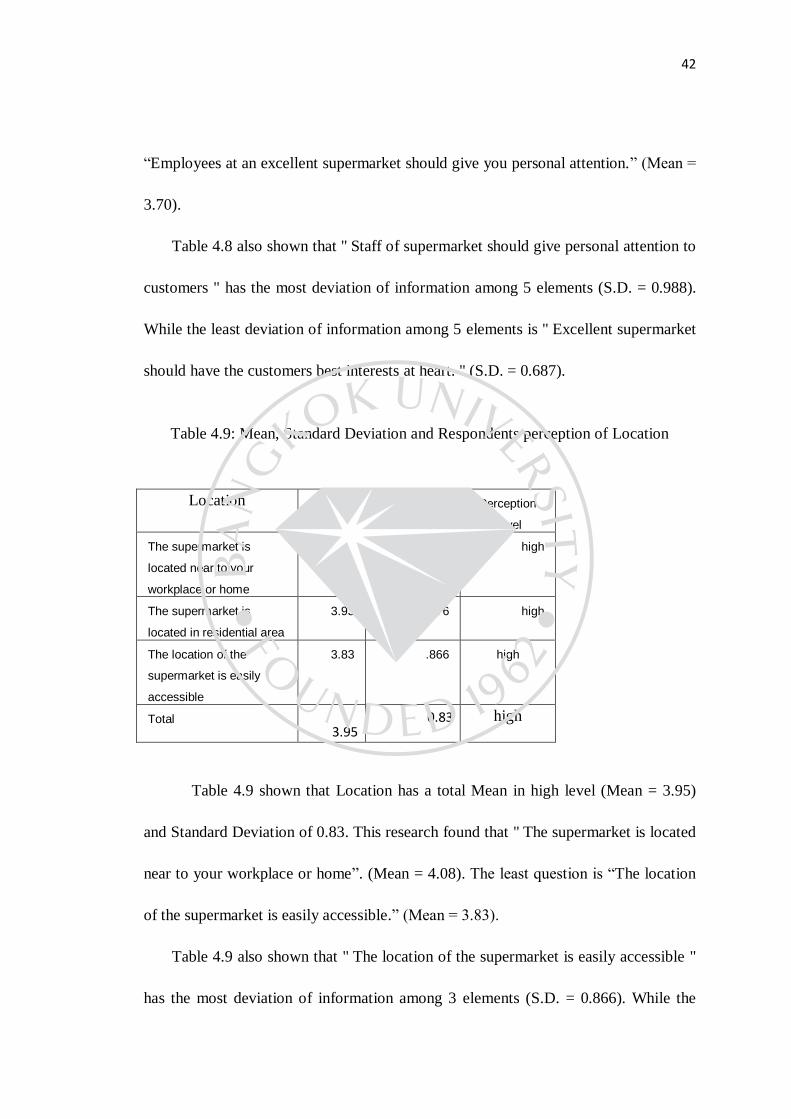
Table 4.9: Mean, Standard Deviation and Respondents perception of Location
Location Mean Std.
Deviation
Perception
Level
The supermarket is
located near to your
workplace or home
4.08 .838 high
The supermarket is
located in residential area
3.93 .776 high
The location of the
supermarket is easily
accessible
3.83 .866 high
Total 3.95
0.83 high
Table 4.9 shown that Location has a total Mean in high level (Mean = 3.95)
and Standard Deviation of 0.83. This research found that " The supermarket is located
near to your workplace or home”. (Mean = 4.08). The least question is “The location
of the supermarket is easily accessible.” (Mean = 3.83).
Table 4.9 also shown that " The location of the supermarket is easily accessible "
has the most deviation of information among 3 elements (S.D. = 0.866). While the
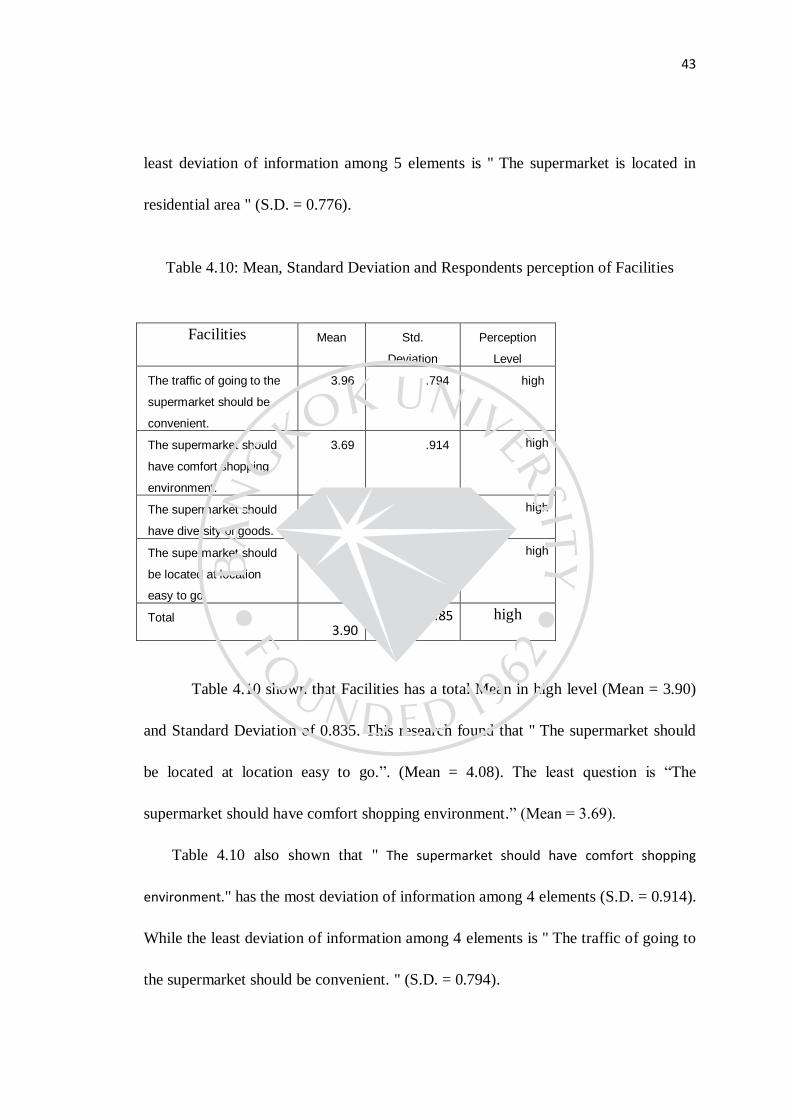
43
least deviation of information among 5 elements is " The supermarket is located in
residential area " (S.D. = 0.776).
Table 4.10: Mean, Standard Deviation and Respondents perception of Facilities
Facilities Mean Std.
Deviation
Perception
Level
The traffic of going to the
supermarket should be
convenient.
3.96 .794 high
The supermarket should
have comfort shopping
environment.
3.69 .914 high
The supermarket should
have diversity of goods.
3.85 .821 high
The supermarket should
be located at location
easy to go.
4.08 .862 high
Total 3.90
0.85 high
Table 4.10 shown that Facilities has a total Mean in high level (Mean = 3.90)
and Standard Deviation of 0.835. This research found that " The supermarket should
be located at location easy to go.”. (Mean = 4.08). The least question is “The
supermarket should have comfort shopping environment.” (Mean = 3.69).
Table 4.10 also shown that " The supermarket should have comfort shopping
environment." has the most deviation of information among 4 elements (S.D. = 0.914).
While the least deviation of information among 4 elements is " The traffic of going to
the supermarket should be convenient. " (S.D. = 0.794).
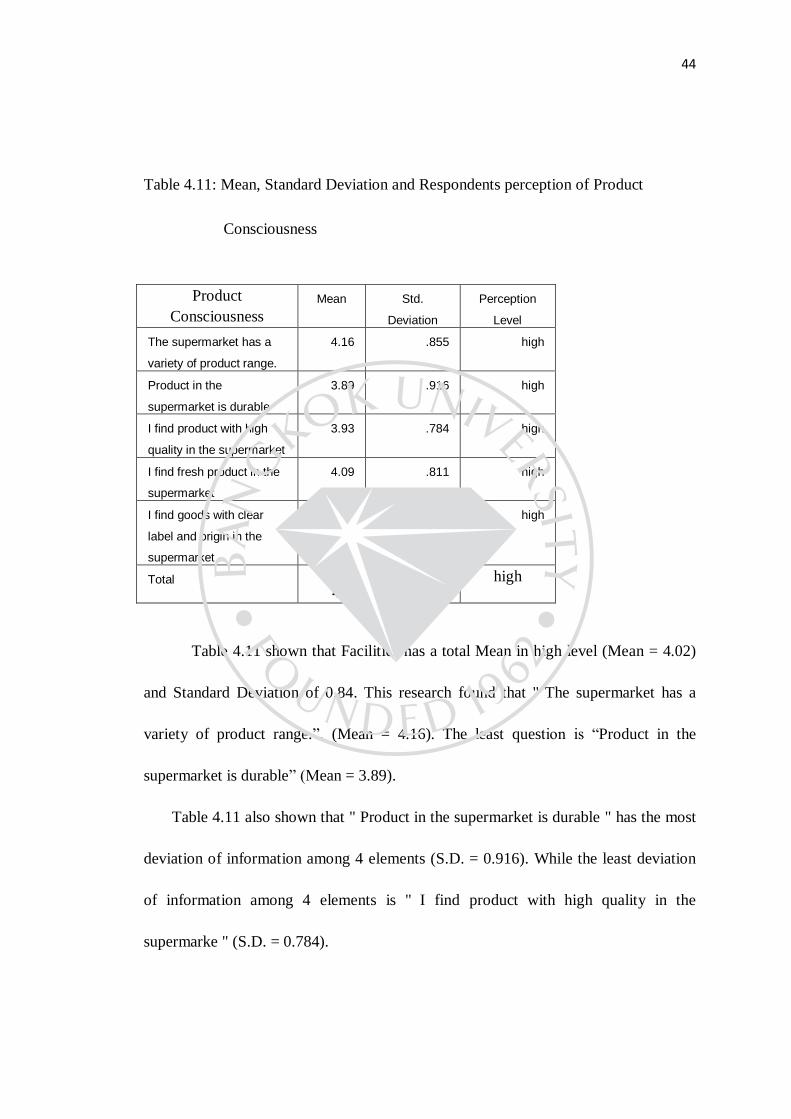
44
Table 4.11: Mean, Standard Deviation and Respondents perception of Product
Consciousness
Product
Consciousness
Mean Std.
Deviation
Perception
Level
The supermarket has a
variety of product range.
4.16 .855 high
Product in the
supermarket is durable
3.89 .916 high
I find product with high
quality in the supermarket
3.93 .784 high
I find fresh product in the
supermarket
4.09 .811 high
I find goods with clear
label and origin in the
supermarket
4.08 .794 high
Total 4.02
0.84 high
Table 4.11 shown that Facilities has a total Mean in high level (Mean = 4.02)
and Standard Deviation of 0.84. This research found that " The supermarket has a
variety of product range.”. (Mean = 4.16). The least question is “Product in the
supermarket is durable” (Mean = 3.89).
Table 4.11 also shown that " Product in the supermarket is durable " has the most
deviation of information among 4 elements (S.D. = 0.916). While the least deviation
of information among 4 elements is " I find product with high quality in the
supermarke " (S.D. = 0.784).
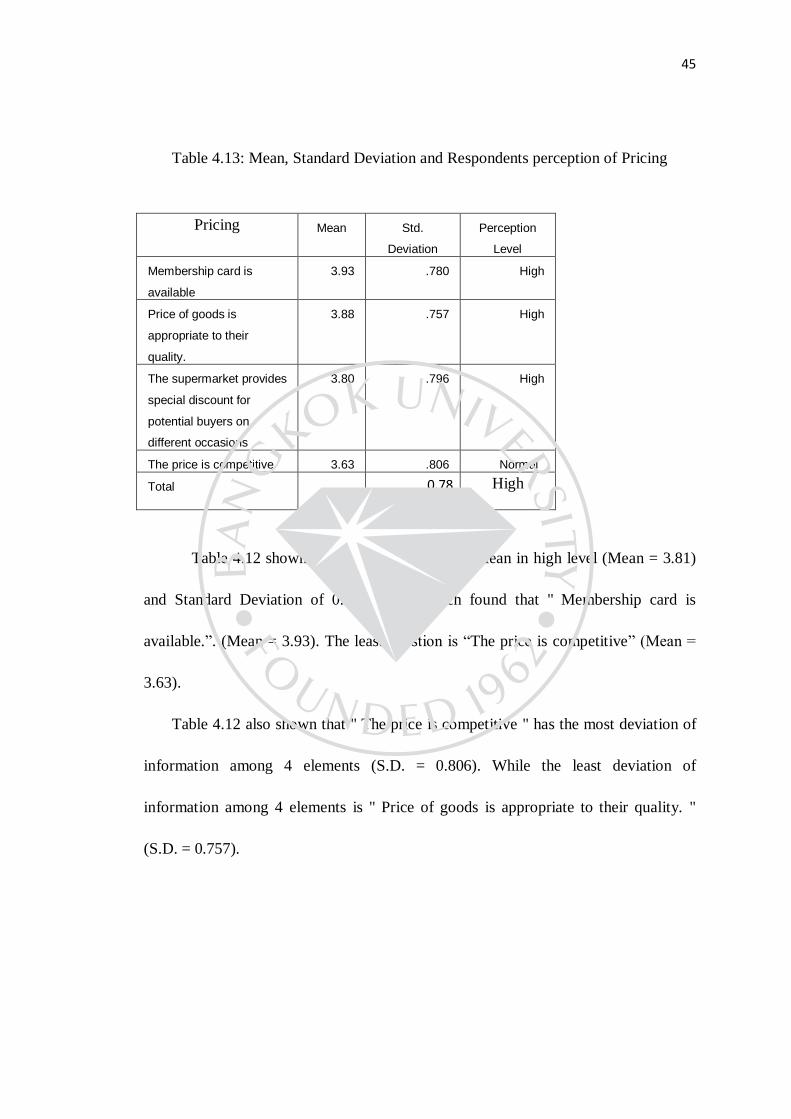
45
Table 4.13: Mean, Standard Deviation and Respondents perception of Pricing
Pricing Mean Std.
Deviation
Perception
Level
Membership card is
available
3.93 .780 High
Price of goods is
appropriate to their
quality.
3.88 .757 High
The supermarket provides
special discount for
potential buyers on
different occasions
3.80 .796 High
The price is competitive 3.63 .806 Normal
Total 3.81
0.78 High
Table 4.12 shown that Facilities has a total Mean in high level (Mean = 3.81)
and Standard Deviation of 0.78. This research found that " Membership card is
available.”. (Mean = 3.93). The least question is “The price is competitive” (Mean =
3.63).
Table 4.12 also shown that " The price is competitive " has the most deviation of
information among 4 elements (S.D. = 0.806). While the least deviation of
information among 4 elements is " Price of goods is appropriate to their quality. "
(S.D. = 0.757).
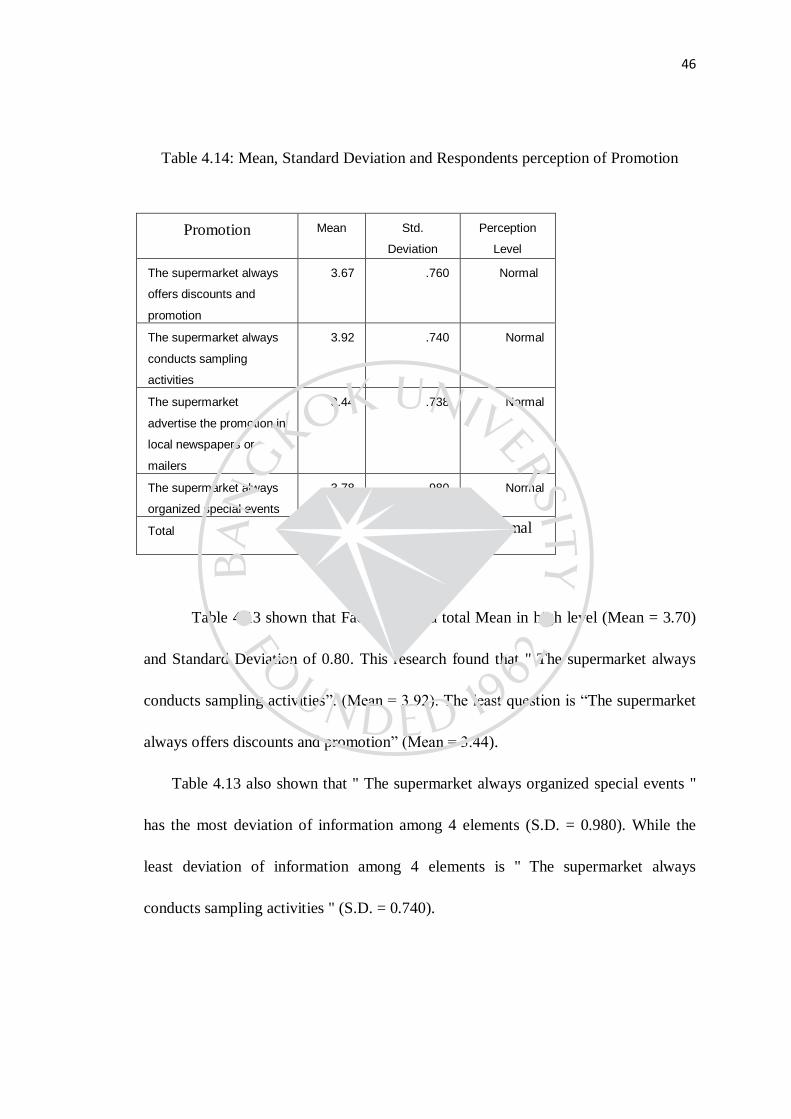
46
Table 4.14: Mean, Standard Deviation and Respondents perception of Promotion
Promotion Mean Std.
Deviation
Perception
Level
The supermarket always
offers discounts and
promotion
3.67 .760 Normal
The supermarket always
conducts sampling
activities
3.92 .740 Normal
The supermarket
advertise the promotion in
local newspapers or
mailers
3.44 .738 Normal
The supermarket always
organized special events
3.78 .980 Normal
Total 3.70
0.80 Normal
Table 4.13 shown that Facilities has a total Mean in high level (Mean = 3.70)
and Standard Deviation of 0.80. This research found that " The supermarket always
conducts sampling activities”. (Mean = 3.92). The least question is “The supermarket
always offers discounts and promotion” (Mean = 3.44).
Table 4.13 also shown that " The supermarket always organized special events "
has the most deviation of information among 4 elements (S.D. = 0.980). While the
least deviation of information among 4 elements is " The supermarket always
conducts sampling activities " (S.D. = 0.740).
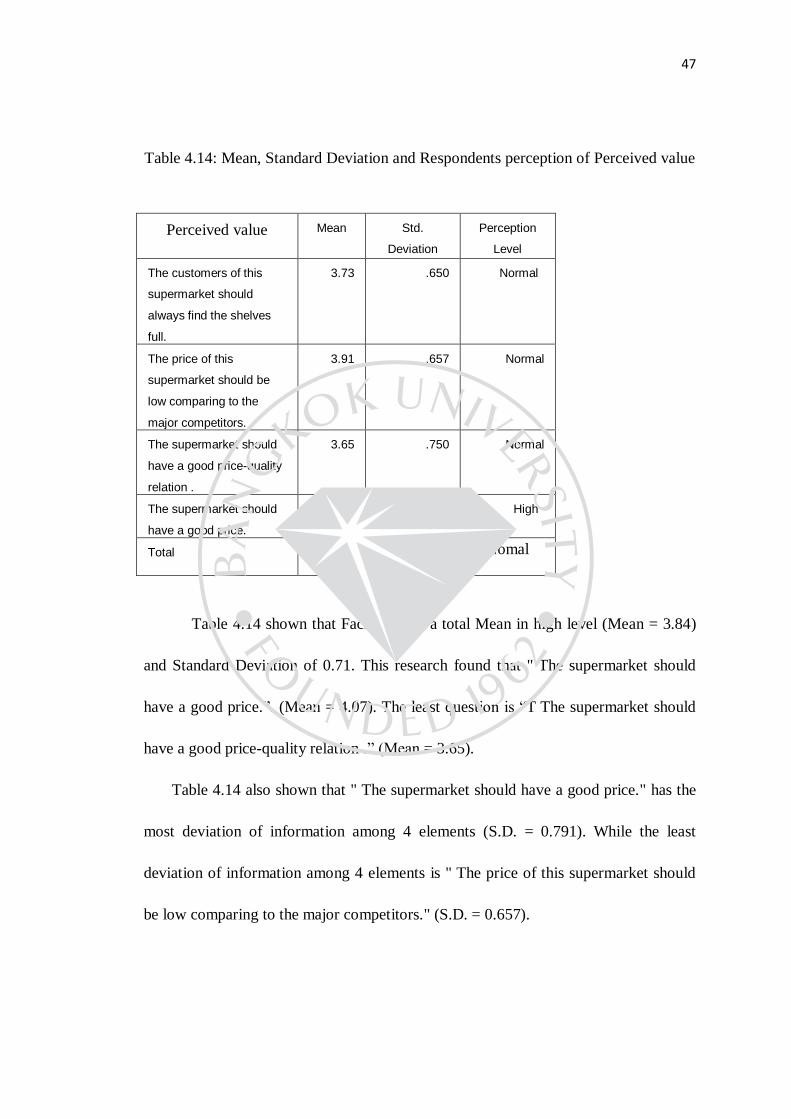
47
Table 4.14: Mean, Standard Deviation and Respondents perception of Perceived value
Perceived value Mean Std.
Deviation
Perception
Level
The customers of this
supermarket should
always find the shelves
full.
3.73 .650 Normal
The price of this
supermarket should be
low comparing to the
major competitors.
3.91 .657 Normal
The supermarket should
have a good price-quality
relation .
3.65 .750 Normal
The supermarket should
have a good price.
4.07 .791 High
Total 3.84
0.71 Nomal
Table 4.14 shown that Facilities has a total Mean in high level (Mean = 3.84)
and Standard Deviation of 0.71. This research found that " The supermarket should
have a good price.”. (Mean = 4.07). The least question is “T The supermarket should
have a good price-quality relation .” (Mean = 3.65).
Table 4.14 also shown that " The supermarket should have a good price." has the
most deviation of information among 4 elements (S.D. = 0.791). While the least
deviation of information among 4 elements is " The price of this supermarket should
be low comparing to the major competitors." (S.D. = 0.657).
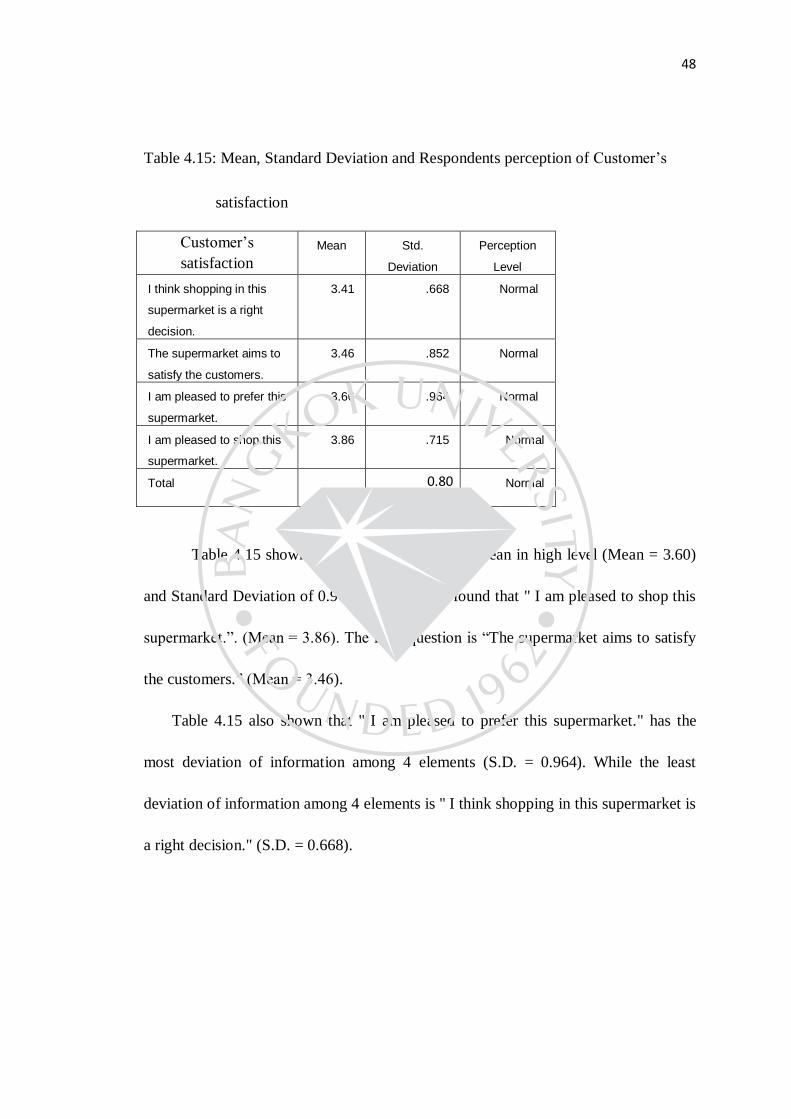
48
Table 4.15: Mean, Standard Deviation and Respondents perception of Customer’s
satisfaction
Customer’s
satisfaction
Mean Std.
Deviation
Perception
Level
I think shopping in this
supermarket is a right
decision.
3.41 .668 Normal
The supermarket aims to
satisfy the customers.
3.46 .852 Normal
I am pleased to prefer this
supermarket.
3.66 .964 Normal
I am pleased to shop this
supermarket.
3.86 .715 Normal
Total 3.60
0.80 Normal
Table 4.15 shown that Facilities has a total Mean in high level (Mean = 3.60)
and Standard Deviation of 0.964. This research found that " I am pleased to shop this
supermarket.”. (Mean = 3.86). The least question is “The supermarket aims to satisfy
the customers.” (Mean = 3.46).
Table 4.15 also shown that " I am pleased to prefer this supermarket." has the
most deviation of information among 4 elements (S.D. = 0.964). While the least
deviation of information among 4 elements is " I think shopping in this supermarket is
a right decision." (S.D. = 0.668).
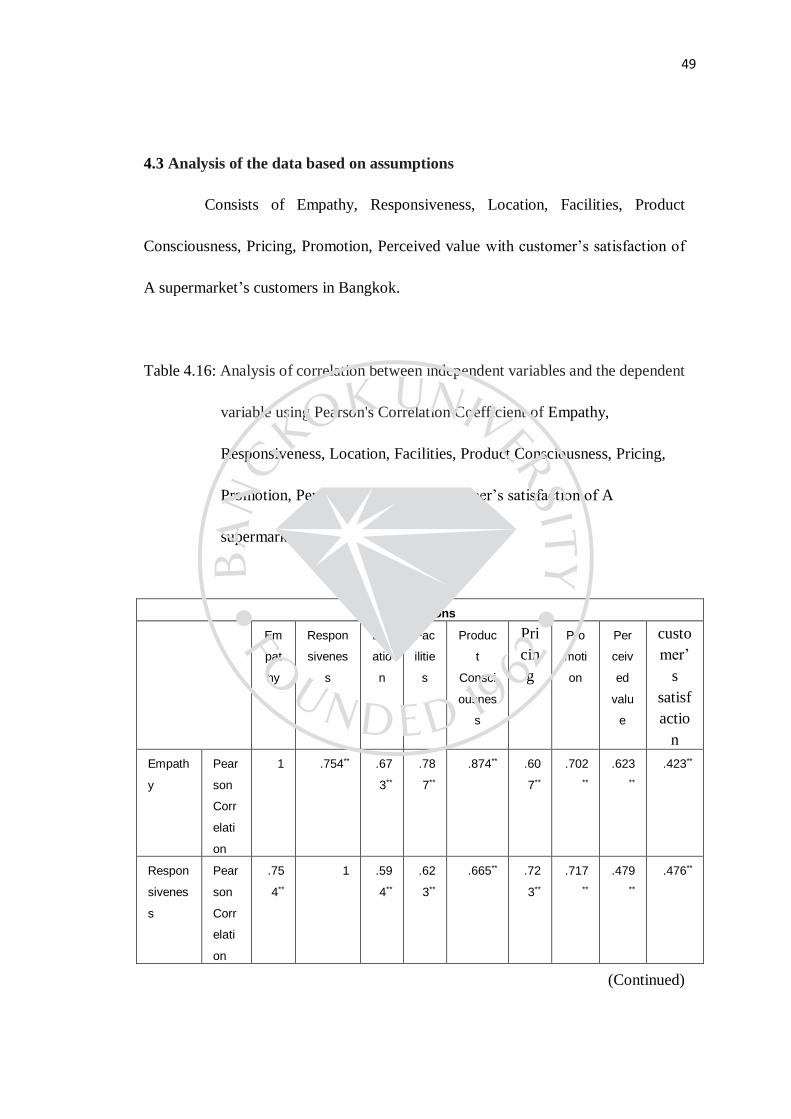
49
4.3 Analysis of the data based on assumptions
Consists of Empathy, Responsiveness, Location, Facilities, Product
Consciousness, Pricing, Promotion, Perceived value with customer’s satisfaction of
A supermarket’s customers in Bangkok.
Table 4.16: Analysis of correlation between independent variables and the dependent
variable using Pearson's Correlation Coefficient of Empathy,
Responsiveness, Location, Facilities, Product Consciousness, Pricing,
Promotion, Perceived value with customer’s satisfaction of A
supermarket’s customers in Bangkok.
Correlations
Em
pat
hy
Respon
sivenes
s
Loc
atio
n
Fac
ilitie
s
Produc
t
Consci
ousnes
s
Pri
cin
g
Pro
moti
on
Per
ceiv
ed
valu
e
custo
mer’
s
satisf
actio
n
Empath
y
Pear
son
Corr
elati
on
1 .754** .67
3**
.78
7**
.874** .60
7**
.702
**
.623
**
.423**
Respon
sivenes
s
Pear
son
Corr
elati
on
.75
4**
1 .59
4**
.62
3**
.665** .72
3**
.717
**
.479
**
.476**
(Continued)
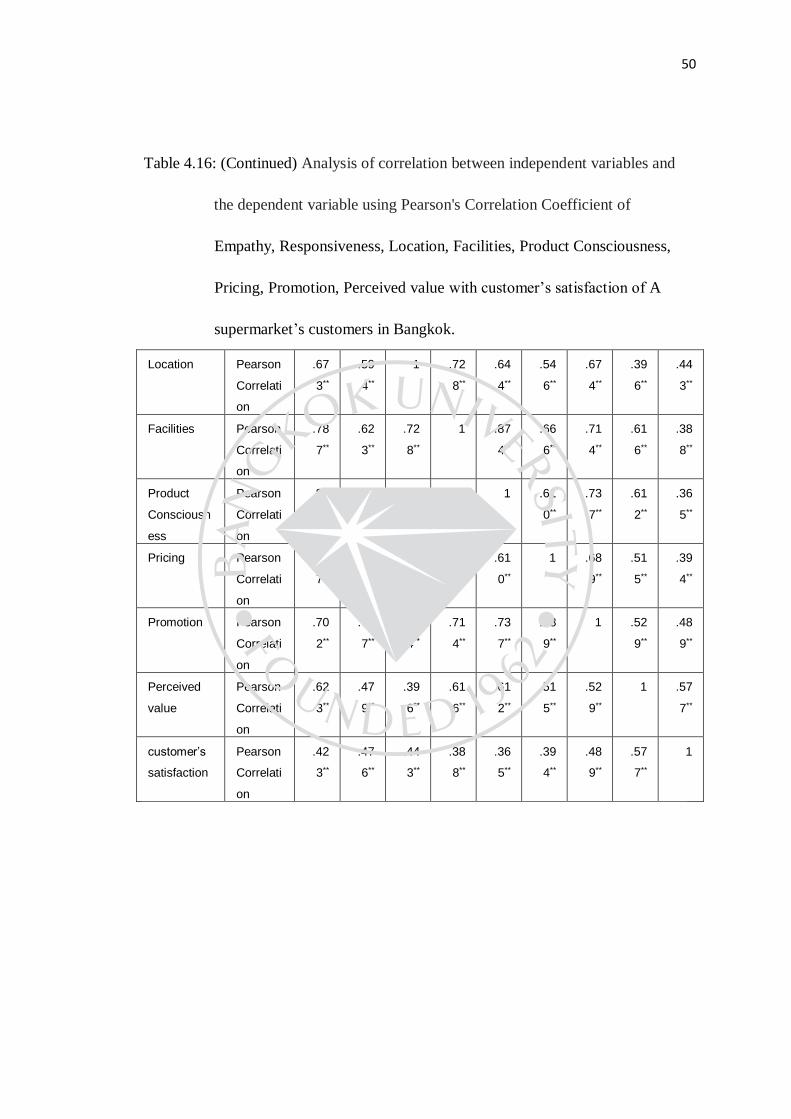
50
Table 4.16: (Continued) Analysis of correlation between independent variables and
the dependent variable using Pearson's Correlation Coefficient of
Empathy, Responsiveness, Location, Facilities, Product Consciousness,
Pricing, Promotion, Perceived value with customer’s satisfaction of A
supermarket’s customers in Bangkok.
Location Pearson
Correlati
on
.67
3**
.59
4**
1 .72
8**
.64
4**
.54
6**
.67
4**
.39
6**
.44
3**
Facilities Pearson
Correlati
on
.78
7**
.62
3**
.72
8**
1 .87
4**
.66
6**
.71
4**
.61
6**
.38
8**
Product
Consciousn
ess
Pearson
Correlati
on
.87
4**
.66
5**
.64
4**
.87
4**
1 .61
0**
.73
7**
.61
2**
.36
5**
Pricing Pearson
Correlati
on
.60
7**
.72
3**
.54
6**
.66
6**
.61
0**
1 .68
9**
.51
5**
.39
4**
Promotion Pearson
Correlati
on
.70
2**
.71
7**
.67
4**
.71
4**
.73
7**
.68
9**
1 .52
9**
.48
9**
Perceived
value
Pearson
Correlati
on
.62
3**
.47
9**
.39
6**
.61
6**
.61
2**
.51
5**
.52
9**
1 .57
7**
customer’s
satisfaction
Pearson
Correlati
on
.42
3**
.47
6**
.44
3**
.38
8**
.36
5**
.39
4**
.48
9**
.57
7**
1
51
From table 4.16: Hypothesis can be explain as
Hypothesis 1, Empathy positively relate the customer’s satisfaction of A
supermarket’s customers in Bangkok or not. The result from the analysis show that
Empathy can positively affect the customer’s satisfaction of A supermarket’s
customers in Bangkok (Pearson's Correlation = .423) at 0.01 significant level.
Hypothesis 2, Responsiveness positively relate the customer’s satisfaction of A
supermarket’s customers in Bangkok or not. The result from the analysis show that
Responsiveness can positively affect the customer’s satisfaction of A supermarket’s
customers in Bangkok (Pearson's Correlation = .476) at 0.01 significant level.
Hypothesis 3, Location positively relate the customer’s satisfaction of A
supermarket’s customers in Bangkok or not. The result from the analysis show that
Location can positively affect the customer’s satisfaction of A supermarket’s customers
in Bangkok (Pearson's Correlation = .443) at 0.01 significant level.
Hypothesis 4, Facilities positively related the customer’s satisfaction of A
supermarket’s customers in Bangkok or not. The result from the analysis show that
Facilities can positively affect the customer’s satisfaction of A supermarket’s
customers in Bangkok (Pearson's Correlation = .388) at 0.01 significant level.
Hypothesis 5, Product Consciousness positively relate the customer’s satisfaction
of A supermarket’s customers in Bangkok or not. The result from the analysis show that
Product Consciousness can positively affect the customer’s satisfaction of A
52
supermarket’s customers in Bangkok (Pearson's Correlation = .365) at 0.01 significant
level.
Hypothesis 6, Pricing positively relate the customer’s satisfaction of A
supermarket’s customers in Bangkok or not. The result from the analysis show that
Pricing can positively affect the customer’s satisfaction of A supermarket’s customers
in Bangkok (Pearson's Correlation = .394) at 0.01 significant level.
Hypothesis 7, Promotion positively relate the customer’s satisfaction of A
supermarket’s customers in Bangkok or not. The result from the analysis show that
Promotion can positively affect the customer’s satisfaction of A supermarket’s
customers in Bangkok (Pearson's Correlation = .389) at 0.01 significant level.
Hypothesis 8, Perceived value positively relate the customer’s satisfaction of A
supermarket’s customers in Bangkok or not. The result from the analysis show that
Perceived value can positively affect the customer’s satisfaction of A supermarket’s
customers in Bangkok (Pearson's Correlation = .577) at 0.01 significant level.
Table 4.17: Analysis of variance using ANOVA of Empathy, Responsiveness,
Location, Facilities, Product Consciousness, Pricing, Promotion, Perceived value with
customer’s satisfaction of A supermarket’s customers in Bangkok.
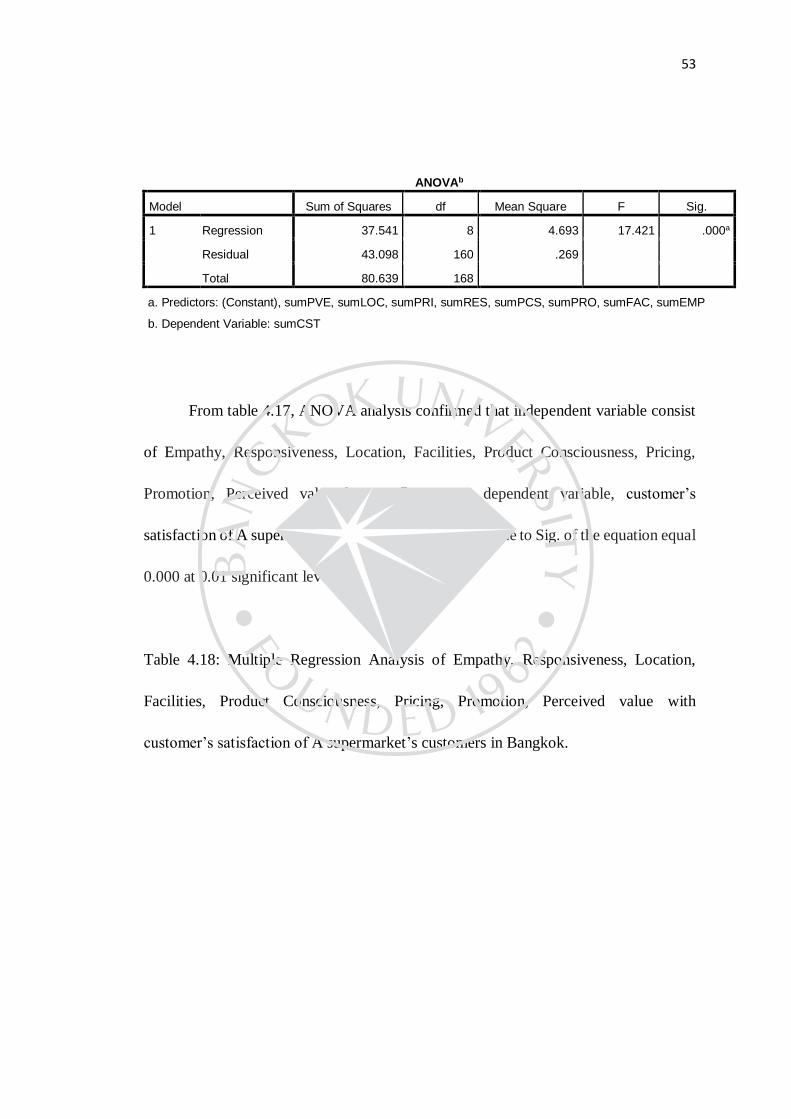
53
ANOVAb
Model Sum of Squares df Mean Square F Sig.
1 Regression 37.541 8 4.693 17.421 .000a
Residual 43.098 160 .269
Total 80.639 168
a. Predictors: (Constant), sumPVE, sumLOC, sumPRI, sumRES, sumPCS, sumPRO, sumFAC, sumEMP
b. Dependent Variable: sumCST
From table 4.17, ANOVA analysis confirmed that independent variable consist
of Empathy, Responsiveness, Location, Facilities, Product Consciousness, Pricing,
Promotion, Perceived value have influence on dependent variable, customer’s
satisfaction of A supermarket’s customers in Bangkok, due to Sig. of the equation equal
0.000 at 0.01 significant level.
Table 4.18: Multiple Regression Analysis of Empathy, Responsiveness, Location,
Facilities, Product Consciousness, Pricing, Promotion, Perceived value with
customer’s satisfaction of A supermarket’s customers in Bangkok.
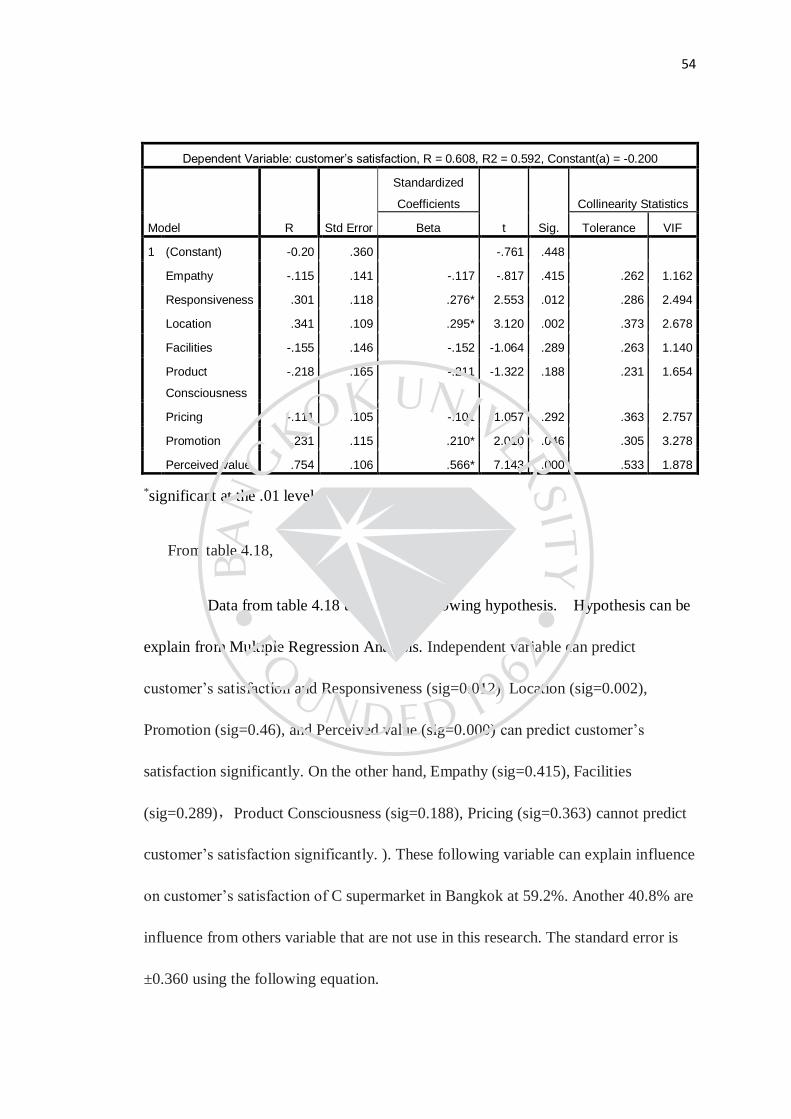
54
Dependent Variable: customer’s satisfaction, R = 0.608, R2 = 0.592, Constant(a) = -0.200
Model R Std Error
Standardized
Coefficients
t Sig.
Collinearity Statistics
Beta Tolerance VIF
1 (Constant) -0.20 .360 -.761 .448
Empathy -.115 .141 -.117 -.817 .415 .262 1.162
Responsiveness .301 .118 .276* 2.553 .012 .286 2.494
Location .341 .109 .295* 3.120 .002 .373 2.678
Facilities -.155 .146 -.152 -1.064 .289 .263 1.140
Product
Consciousness
-.218 .165 -.211 -1.322 .188 .231 1.654
Pricing -.111 .105 -.101 -1.057 .292 .363 2.757
Promotion .231 .115 .210* 2.010 .046 .305 3.278
Perceived value .754 .106 .566* 7.143 .000 .533 1.878
*significant at the .01 level
From table 4.18,
Data from table 4.18 used to test following hypothesis. Hypothesis can be
explain from Multiple Regression Analysis. Independent variable can predict
customer’s satisfaction and Responsiveness (sig=0.012), Location (sig=0.002),
Promotion (sig=0.46), and Perceived value (sig=0.000) can predict customer’s
satisfaction significantly. On the other hand, Empathy (sig=0.415), Facilities
(sig=0.289),Product Consciousness (sig=0.188), Pricing (sig=0.363) cannot predict
customer’s satisfaction significantly. ). These following variable can explain influence
on customer’s satisfaction of C supermarket in Bangkok at 59.2%. Another 40.8% are
influence from others variable that are not use in this research. The standard error is
±0.360 using the following equation.
55
Y (customer’s satisfaction) = -0.2 + 0.566 (Perceived value) + 0.295
(Location) + 0.276 (Responsiveness) + 0 .210(Promotion)
From this equation
If Responsiveness increase by 1 point and other factors remain the same.
customer’s satisfaction by 0.276 point.
If Location increase by 1 point and other factors remain the same.
customer’s satisfaction will increase by 0.295 point.
If Promotion increase by 1 point and other factors remain the same.
customer’s satisfaction will increase by 0.210 point.
If Perceived value increase by 1 point and other factors remain the same.
customer’s satisfaction will increase by 0.566 point.
By using Multiple Regression Analysis. The result show that Location,
Promotion, Perceived value have positive influence on word of mouth at statistical
significant level of 0.05. While Empathy, Responsiveness, Location, Facilities,
Product Consciousness, Pricing have no positive influence on word of mouth t 0.05
statistical significant.
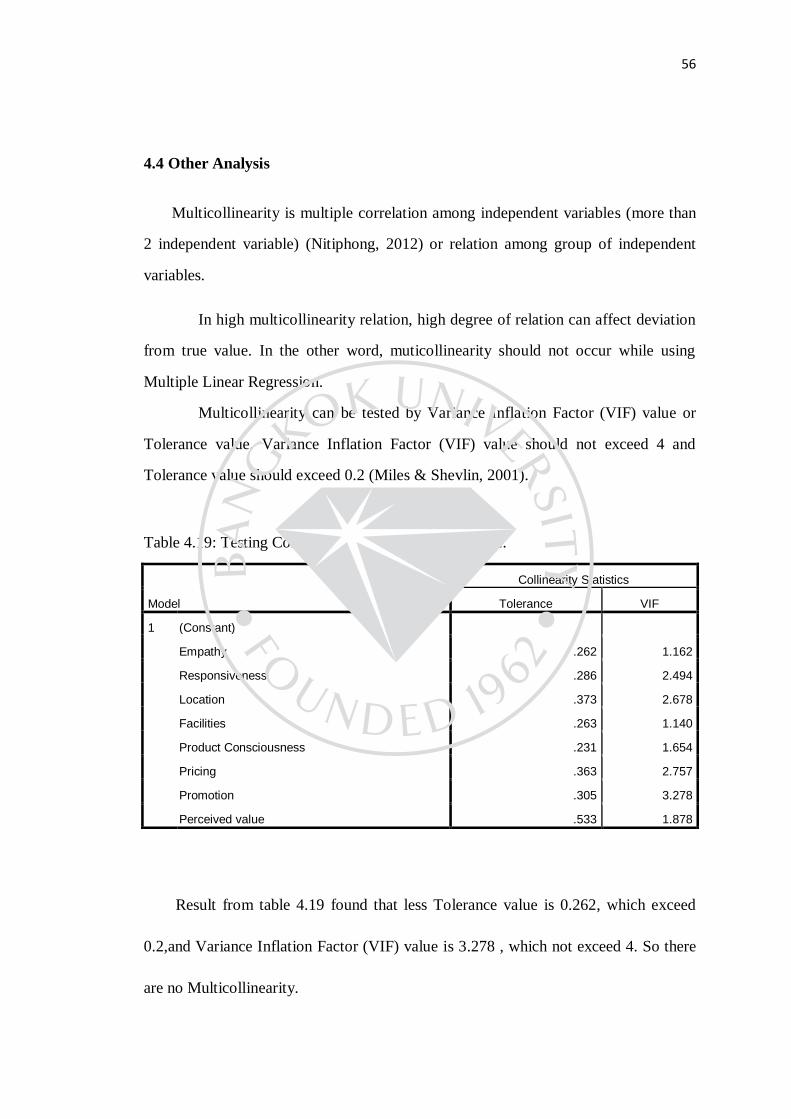
56
4.4 Other Analysis
Multicollinearity is multiple correlation among independent variables (more than
2 independent variable) (Nitiphong, 2012) or relation among group of independent
variables.
In high multicollinearity relation, high degree of relation can affect deviation
from true value. In the other word, muticollinearity should not occur while using
Multiple Linear Regression.
Multicollinearity can be tested by Variance Inflation Factor (VIF) value or
Tolerance value. Variance Inflation Factor (VIF) value should not exceed 4 and
Tolerance value should exceed 0.2 (Miles & Shevlin, 2001).
Table 4.19: Testing Collinearity of independent variable.
Model
Collinearity Statistics
Tolerance VIF
1 (Constant)
Empathy .262 1.162
Responsiveness .286 2.494
Location .373 2.678
Facilities .263 1.140
Product Consciousness .231 1.654
Pricing .363 2.757
Promotion .305 3.278
Perceived value .533 1.878
Result from table 4.19 found that less Tolerance value is 0.262, which exceed
0.2,and Variance Inflation Factor (VIF) value is 3.278 , which not exceed 4. So there
are no Multicollinearity.
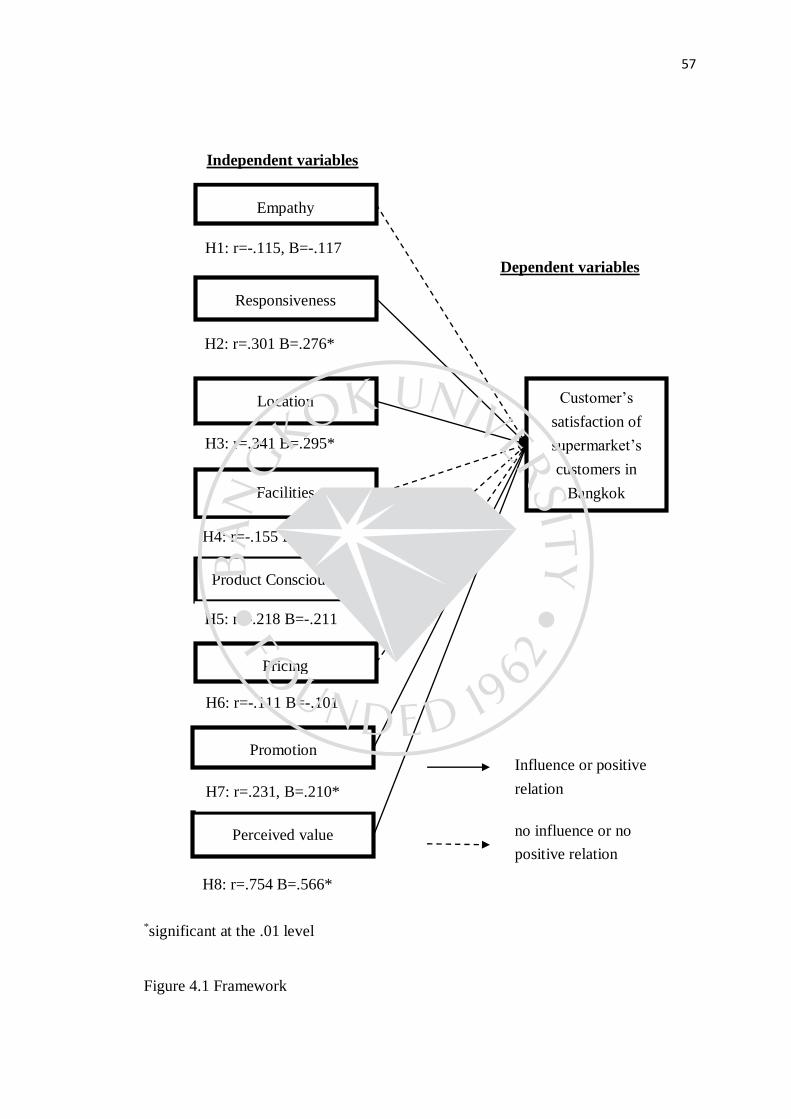
57
*significant at the .01 level
Figure 4.1 Framework
Empathy
Responsiveness
Location
Facilities
Product Consciousness
Pricing
Promotion
Perceived value
Customer’s
satisfaction of
supermarket’s
customers in
Bangkok
Independent variables
Dependent variables
H1: r=-.115, B=-.117
H2: r=.301 B=.276*
H3: r=.341 B=.295*
H4: r=-.155 B=-.152
H5: r=-.218 B=-.211
H6: r=-.111 B=-.101
H7: r=.231, B=.210*
H8: r=.754 B=.566*
Influence or positive
relation
no influence or no
positive relation
58
Figure 4.1 showed that that Location, Promotion, Perceived value have
positive influence on word of mouth. While Empathy, Responsiveness, Location,
Facilities, Product Consciousness, Pricing have no positive influence on word of
mouth.

CHAPTER 5
CONCLUSIONS AND RECOMMENDATIONS
The research on factors positively affect the customer’s satisfaction of A
supermarket’s customers in Bangkok is a survey research using questionnaires to
collect data.
The research objective of this study is to determine the relationship between
customers’ satisfaction and the factors that may affect it. The factors include are
Empathy, Responsiveness, Location, Facilities, Product Consciousness, Pricing,
Promotion, Perceived value.
This paper describes eight independent variables which are Empathy,
Responsiveness, Location, Facilities, Product Consciousness, Pricing, Promotion,
Perceived value and only one dependent variable which is customer’s satisfaction.
There are 250 questionnaires were send to target population in the A super market. In
the questionnaires will be nine sections to cover all the independent variables and
dependent variables. And judgment with convenience of non-probability sampling
was applied during that time.
5.1 Hypothesis Assumption.
The important factors studied in this research are Empathy, Responsiveness,
Location, Facilities, Product Consciousness, Pricing, Promotion, Perceived value
positively affect the customer’s satisfaction of A supermarket’s customers in Bangkok
found that most of the respondents are female, ages between 31 and 40 Years, single,
monthly income between 0—35,000 BAHT, Bachelor degree, and Employee.
Research result base on hypothesis can be concluded as
Hypothesis 1, Empathy positive relate the customer’s satisfaction of A
supermarket’s customers in Bangkok or not. The result from the analysis show that
60
Empathy positive relate the customer’s satisfaction of A supermarket’s customers in
Bangkok (Pearson's Correlation = .423) at 0.01 significant level.
Hypothesis 2, Responsiveness positive relate the customer’s satisfaction of A
supermarket’s customers in Bangkok or not. The result from the analysis show that
Responsiveness positive relate the customer’s satisfaction of A supermarket’s
customers in Bangkok (Pearson's Correlation = .476) at 0.01 significant level.
Hypothesis 3, Location positive relate the customer’s satisfaction of A
supermarket’s customers in Bangkok or not. The result from the analysis show that
Location positive relate the customer’s satisfaction of A supermarket’s customers in
Bangkok (Pearson's Correlation = .443) at 0.01 significant level.
Hypothesis 4, Facilities positive relate the customer’s satisfaction of A
supermarket’s customers in Bangkok or not. The result from the analysis show that
Facilities positive relate the customer’s satisfaction of A supermarket’s customers in
Bangkok (Pearson's Correlation = .388) at 0.01 significant level.
Hypothesis 5, Product Consciousness positive relate the customer’s satisfaction
of A supermarket’s customers in Bangkok or not. The result from the analysis show
that Product Consciousness positive relate the customer’s satisfaction of A
supermarket’s customers in Bangkok (Pearson's Correlation = .365) at 0.01 significant
level.
Hypothesis 6, Pricing positive relate the customer’s satisfaction of A
supermarket’s customers in Bangkok or not. The result from the analysis show that
Pricing positive relate the customer’s satisfaction of A supermarket’s customers in
Bangkok (Pearson's Correlation = .394) at 0.01 significant level.

61
Hypothesis 7, Promotion positive relate the customer’s satisfaction of A
supermarket’s customers in Bangkok or not. The result from the analysis show that
Promotion positive relate the customer’s satisfaction of A supermarket’s customers in
Bangkok (Pearson's Correlation = .389) at 0.01 significant level.
Hypothesis 8, Perceived value positive relate the customer’s satisfaction of A
supermarket’s customers in Bangkok or not. The result from the analysis show that
Perceived value positive relate the customer’s satisfaction of A supermarket’s
customers in Bangkok (Pearson's Correlation = .577) at 0.01 significant level.
Hypothesis 9, Factors that can predict customer satisfaction of A supermarket
(Y) are Responsiveness, Location, Promotion, and Perceived value which has 59.2%
influence. Another 40.8% are influence from others variable that are not used in this
research.
Y (customer’s satisfaction) = -0.2 + 0.566 (Perceived value) + 0.295 (Location) +
0.276 (Responsiveness) + 0 .210(Promotion)
5.2 Summary
The research on the Empathy, Responsiveness, Location, Facilities, Product
Consciousness, Pricing, Promotion, and Perceived value positively affect the
customer’s satisfaction of A supermarket’s customers in Bangkok is a survey research
using questionnaires to collected data found the interesting issue as follows.
Hypothesis 1, Empathy positive relate the customer’s satisfaction of A
supermarket’s customers in Bangkok or not. The result from the analysis show that
Empathy positive relate the customer’s satisfaction of A supermarket’s customers in
Bangkok (Pearson's Correlation = .423) at 0.01 significant level. Bloemer, J., and
62
Schroder, G. (2002) define empathy as the care and individualized attention that an
organization provides its customers. As such, service providers need to ensure that
service provision is customized to customers’ unique needs.
Hypothesis 2, Responsiveness positive relate the customer’s satisfaction of A
supermarket’s customers in Bangkok or not. The result from the analysis show that
Responsiveness positive relate the customer’s satisfaction of A supermarket’s
customers in Bangkok (Pearson's Correlation = .476) at 0.01 significant level. Chang
C.H., and Tu, CY. (2005) state that this dimension emphasizes attentiveness as well as
promptness in handling customer questions, complaints, requests and problems. It
also refers to the ability to develop customized solutions for customers. As such, the
responsiveness dimension reflects a service firm’s commitment to provide its services
in a timely manner.
Hypothesis 3, Location positive relate the customer’s satisfaction of A
supermarket’s customers in Bangkok or not. The result from the analysis show that
Location positive relate the customer’s satisfaction of A supermarket’s customers in
Bangkok (Pearson's Correlation = .443) at 0.01 significant level. According to Choi,
S. C. and Coughlan, A. T. (2006), suggest that once a location is near to the home
then transaction costs associated with purchase such as transport costs and time spent
are likely to be reduced. According to Choi. and Coughlan, (2006) who developed
Reilly law of retail gravitation which proposes that people are drawn to larger
shopping thus larger cities tend to attract more customers to shop their than smaller
ones therefore the need for supermarkets to consider location when putting up
facilities. This is further supported by Choi, and Coughlan. (2006) who use the central
place theory to explain how people living far away are attracted to larger stores which
63
are centrally located in larger shopping malls offering more collection of goods and
services than those stores within their own vicinity offering less goods and services.
Hypothesis 4, Facilities positive relate the customer’s satisfaction of A
supermarket’s customers in Bangkok or not. The result from the analysis show that
Facilities positive relate the customer’s satisfaction of A supermarket’s customers in
Bangkok (Pearson's Correlation = .388) at 0.01 significant level. This is supported by
Darry et. al (2015) who asserts that the sales outlets/supermarkets facilities are very
important since they have the ability to influence or change the purchasing behavior
of consumers; therefore extreme care has to be observed when making a decision on
merchandising because 70 percent of purchase decisions are made during shopping.
Darry et. al (2015) describe supermarket facilities as the sum of elements that
contribute to a pleasant shopping atmosphere such as shop layout/ aisles that make it
easy to move around, store cleanliness and well-shaped product displays.
Hypothesis 5, Product Consciousness positive relate the customer’s satisfaction
of C supermarket’s customers in Bangkok or not. The result from the analysis show
that Product Consciousness positive relate the customer’s satisfaction of A
supermarket’s customers in Bangkok (Pearson's Correlation = .365) at 0.01 significant
level. Customers always appreciate and visit those shopping malls, which have total
product availability or variety. Even for getting this type of customer satisfaction they
go to more than one store to get better range of the products or latest products (Harris,
E.K. (2010). These types of customers are not quality conscious, but they have
consciousness about only different varieties of product or multiple options of the
product.
64
Hypothesis 6, Pricing positive relate the customer’s satisfaction of A
supermarket’s customers in Bangkok or not. The result from the analysis show that
Pricing positive relate the customer’s satisfaction of A supermarket’s customers in
Bangkok (Pearson's Correlation = .394) at 0.01 significant level. Customers, who
score high on this factor, are very particular about price and very conscious to get the
best price for the products they buy for getting satisfaction in shopping malls (Harris,
2010). They always appreciate and visit those shopping malls which have some
schemes on price; they check and compare the prices of products before purchasing
them.
Hypothesis 7, Promotion positive relate the customer’s satisfaction of A
supermarket’s customers in Bangkok or not. The result from the analysis show that
Promotion positive relate the customer’s satisfaction of A supermarket’s customers in
Bangkok (Pearson's Correlation = .389) at 0.01 significant level. Consequently,
promotion decisions should be made with an appreciation for how it affects other
areas of the company. For instance, running a major advertising campaign for a new
product without first assuring there will be enough inventory to meet potential
demand generated by the advertising would certainly not go over well with the
company’s production department (not to mention other key company executives)
(Olabanji and Olawale. 2013). Thus, marketers should not work in a vacuum when
making promotion decisions. Rather, the overall success of a promotional strategy
requires input from others in impacted functional areas.
Hypothesis 8, Perceived value positive relate the customer’s satisfaction of A
supermarket’s customers in Bangkok or not. The result from the analysis show that
Perceived value positive relate the customer’s satisfaction of A supermarket’s
65
customers in Bangkok (Pearson's Correlation = .577) at 0.01 significant level.
Perceived value may also be expressed as a straightforward relationship between
perceived benefits and perceived costs: Value = Benefits / Cost. Olabanji and Olawale
(2013) defined perceived value of customer as the outcome of comparative relation of
private between on the whole advantage perception and perceived offering or
payment by the customer.
5.3 Recommendation for future application
For business benefits, the result from this study showed staff of supermarket
should give personal attention to customers. The customers of this supermarket should
always find the shelves full. The price of this supermarket should be low comparing
to the major competitors. The supermarket should have a good price-quality relation.
The supermarket should have a good price. The supermarket is located near to your
workplace or home. The supermarket is located in residential area. The location of the
supermarket is easily accessible. Staff of supermarket should give personal attention
to customers. Excellent supermarket should have the customer’s best interests at
heart. Staff of supermarket at an excellent with pharmacies should understand
customers’ specific needs. Employees at an excellent supermarket should give your
personal attention. Excellent supermarket should give your personal have convenient
business hours. The supermarket always offers discounts and promotion. The
supermarket always conducts sampling activities. The supermarket advertise the
promotion in local newspapers or mailers. The supermarket always organized special
events.
5.4 Recommendation for future research
Researcher should consider the following issue in the future research.
66
Opportunities for further research could take into consideration the above
limitations and enhance the scope of the study. The demographic information could
be exploited to better serve the needs of the customers, who specifically cater to the
groups identified, changing gender role, age, occupation, education and income,
expenditure. For example, increase in working women population resulted in
increased total income of the family causing an increase in personal asset belongings,
related to continuing shopping loyalty. It is believed that tracking the customer
oriented strategy can also shed light on the effectiveness of retailers recent actions to
reposition their brand and how different marketing activities influence consumers’
perception of the supermarkets.
For academic benefits, theories and knowledge on Empathy, Responsiveness,
Location, Facilities, Product Consciousness, Pricing, Promotion, and Perceived value
had been expanded. Future research includes data collection in other big cities like
Chiangmai or Phuket to compare the results. Also, the data can be collected,
compared, and analyzed between the Thai and the foreign supermarket consumers in
Thailand.
5.5 Limitation
The factor that can impact on the customer’s satisfaction of A supermarket’s
customers in Bangkok will be studied by the researcher. There is a limitation for data
collecting is only 250 questionnaires cannot cover all the target populations in
Bangkok, and also the time period. Researcher cannot research other independent
variables besides these eight independent variables which are Empathy,
Responsiveness, Location, Facilities, Product Consciousness, Pricing, Promotion,
Perceived value and one dependent variable customer’s satisfaction which is another
limitation for this study. Because of those two limitations this study cannot cover the
entire retail super market research.
67
BIBLIOGRAPHY
Abril, C., Avello, M. y Gavilan, D. (2009). Positioning Analysis and Consumer
Typologies of Spanish Store Brand Consumers. International Academy of
Management and Business, Istanbul, 3(8), 45-89.
Armstrong, G. and Keller, P. (2006). Marketing: An Introduction. 8th ed. Upper
Saddle, River: Prentice-Hall.
Bateson, J.E.G. and Hoffman, K.D. (2011). Services Marketing. 4th ed. Sydney:
South-Western.
Bloemer, J., and Schroder, G. (2002). Store satisfaction and store loyalty explained by
customer and store related factors. Journal of Consumer Satisfaction,
Dissatisfaction and Complaining Behavior,15 (2), 68-80.
Bloemer, J.M.M., and De Ruyter, K. (1998). On the relationship between store image,
store satisfaction and store loyalty. European Journal of Marketing
Management, 32(6), 499-513.
Chang C.H., and Tu, C.Y. (2005).Exploring store image, customer satisfaction and
customer loyalty relationship: evidence from Taiwanese hypermarket industry. J.
Am. Acad. Bus., 7(2), 197–202.
Chin, W.M. (2010). Analyzing structural relationships between service quality,
disconfirmation, satisfaction and loyalty. Asia-Pacific Management Accounting
Journal, 5 (2), 31-44.
Choi, S. C. and Coughlan, A. T. (2006). Private label positioning: Quality versus
feature differentiation from the national brand. Journal of Retailing, 82(2), 79-
93.
Darry S. P. et. al (2015). Customer satisfaction within pharmacies in a supermarket: a
South African perspective. Problems and Perspectives in Management, Volume
13(2), 97-134.
68
Fatma N. and Gulhayat G. S. (2011). Structural Determinants of Customer
Satisfaction In Loyalty Models: Turkish Retail Supermarkets. Procedia - Social
and Behavioral Sciences 30, 2134 – 2138.
Harris, E.K. (2010). Customer Service: A Practical approach. 3rd ed. New Jersey:
Prentice-Hall.
Javadi, M.H. and Gol, R. (2011). Service quality evaluation in general department of
health insurance of Fars Province using a Servqual model (case study: Shiraz),
Interdisciplinary. Journal of Contemporary Research in Business, 3 (4), 118-125.
Nguyễn T. (2016). FACTORS INFLUENCING CUSTOMER SATISFACTION
TOWARDS SUPERMARKETS IN THAI NGUYEN CITY, VIETNAM.
International Journal of Economics 5(2), 257-262.
Olabanji O. and Olawale F. (2013). Customer Satisfaction and Loyalty to Small
Township Retail Stores in Mankweng, Limpopo Province, South Africa. J
Economics, 4(2), 83-88.
Ram M. (2013). TO IDENTIFY THE FACTORS IMPACTING CUSTOMER
SATISFACTION IN FOOD RETAIL SUPERMARKETS. International Journal
of Research and Development - A Management Review. 2(2). 2319–5479.
THAILAND RETAIL MARKET 2016-2020, (2016). Retrieved from
http://www.technavio.com/report/thailand-general-retail-goods-and-services-
retail-market
Yongmei X. et al., (2013). The Customer Satisfaction Research of 7-ELEVEn Stores
in Hong Kong. Journal of Service Science and Management, 6, 46-55.

APPENDIX
70
Master of Business Administration Program
Survey Questionnaire
“The factors positively affect the customer’s satisfaction of A supermarket’s
customers in Bangkok.”
My name is Siyu Wang .I am a MBA student of MBA program at Bangkok
University. I am doing the research on “The factor positively affecting the customers’
satisfaction of C supermarket’s customers in Bangkok.” This questionnaire is part of a
thesis conducted for the requirement of a Master’s degree in Business Administration
of University of Bangkok University, the information acquired from this
questionnaire will be confidentially kept and used for academic purpose only. Thank
you for taking the time to fill in this questionnaire.
71
Note: please tick in ( ) that related with your answer.
1. Please indicate your gender
1. Male 2. Female
2. Please indicate your age
1. Between 20 to 30 Years 2. Between 31 and 40 Years
3. Between 41 and 50 Years 4. 51Years and above
3. Your monthly income:
1. 0—35,000 BAHT 2. 35,001—50,000BAHT
3. 50,001—100,000 BAHT 4. More than100,001 BAHT
4. Marital statues
Married Single
Divorced
5. Please indicate your education lever
Elementary High school
Bachelor degree Master degree or Doctor degree
6. Occupation statues
Unemployed Employee
72
Student Retired
Please check ( ) to the extent that you agree with the following item:
(1 = Strongly disagree, 2 = Disagree, 3 = Neutral�4 = Agree 5 = Strongly agree)
7.
No. Empathy Agreement level
1 2 3 4 5
1 Staff should give personal attention to customers
2 Excellent supermarket should have the
customers best interests at heart
3 Staff at an excellent supermarket should
understand customers’ specific needs
4 Employees at an excellent supermarket should
give you personal attention
8.
No. Responsiveness Agreement level
1 2 3 4 5
1 Staff of supermarket should give personal
attention to customers.
2 Excellent supermarket should have the
73
customers best interests at heart.
3 Staff of supermarket at an excellent with
pharmacies should understand customers’
specific needs.
4 Employees at an excellent supermarket should
give you personal attention.
5 Excellent supermarket should
give you personal have convenient business hours.
9.
No. Location Agreement level
1 2 3 4 5
1 The supermarket is located near to your
workplace or home
2 The supermarket is located in residential area
3 The location of the supermarket is easily
accessible
10.
No. Facilities Agreement level
1 2 3 4 5
1 The traffic of going to the supermarket should
be convenient.
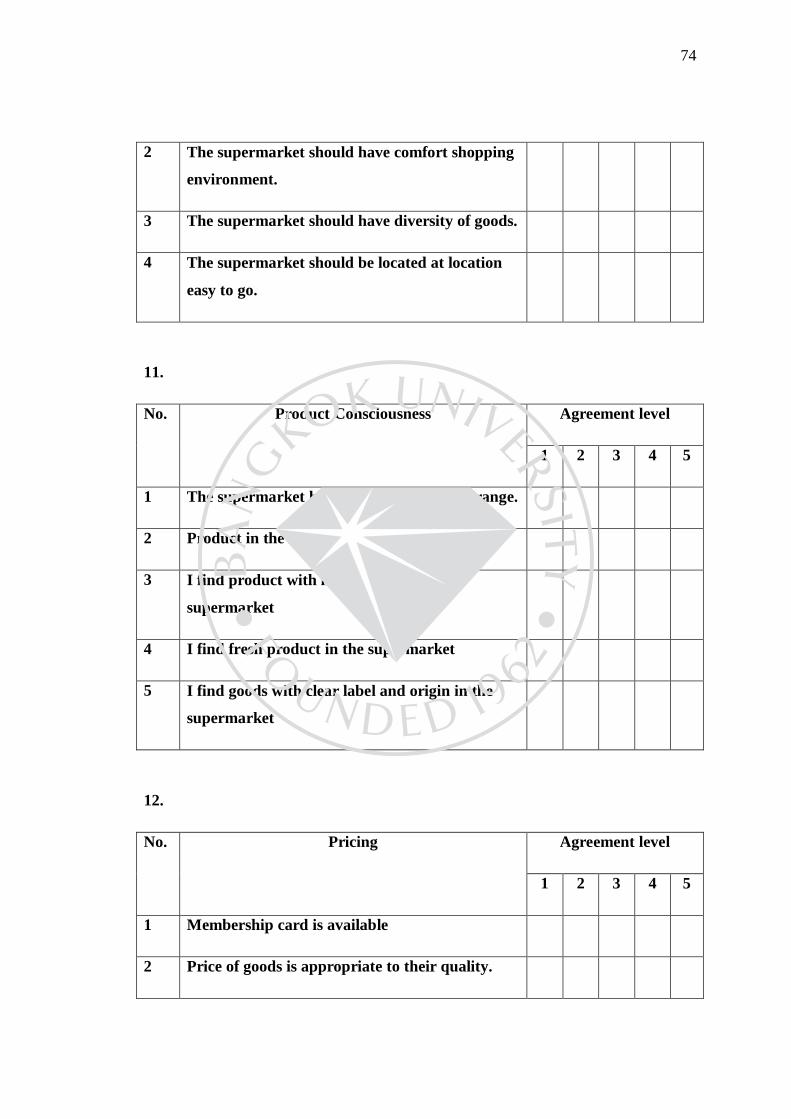
74
2 The supermarket should have comfort shopping
environment.
3 The supermarket should have diversity of goods.
4 The supermarket should be located at location
easy to go.
11.
No. Product Consciousness Agreement level
1 2 3 4 5
1 The supermarket has a variety of product range.
2 Product in the supermarket is durable
3 I find product with high quality in the
supermarket
4 I find fresh product in the supermarket
5 I find goods with clear label and origin in the
supermarket
12.
No. Pricing Agreement level
1 2 3 4 5
1 Membership card is available
2 Price of goods is appropriate to their quality.
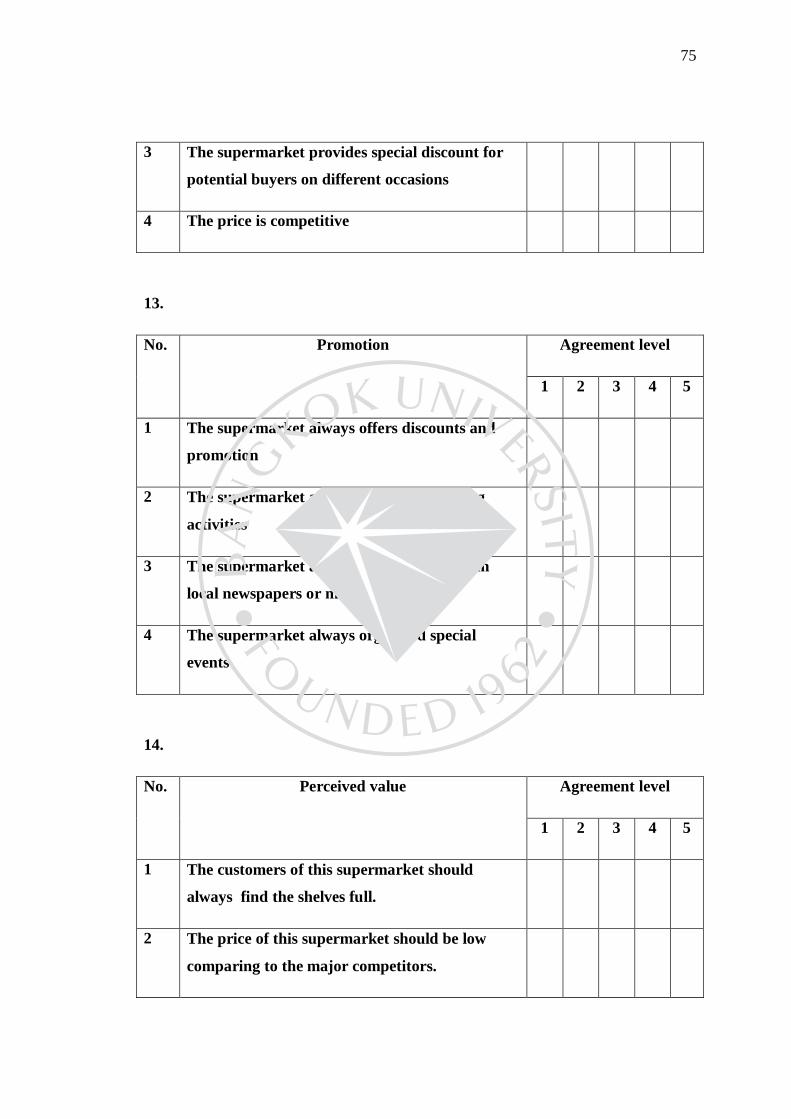
75
3 The supermarket provides special discount for
potential buyers on different occasions
4 The price is competitive
13.
No. Promotion Agreement level
1 2 3 4 5
1 The supermarket always offers discounts and
promotion
2 The supermarket always conducts sampling
activities
3 The supermarket advertise the promotion in
local newspapers or mailers
4 The supermarket always organized special
events
14.
No. Perceived value Agreement level
1 2 3 4 5
1 The customers of this supermarket should
always find the shelves full.
2 The price of this supermarket should be low
comparing to the major competitors.
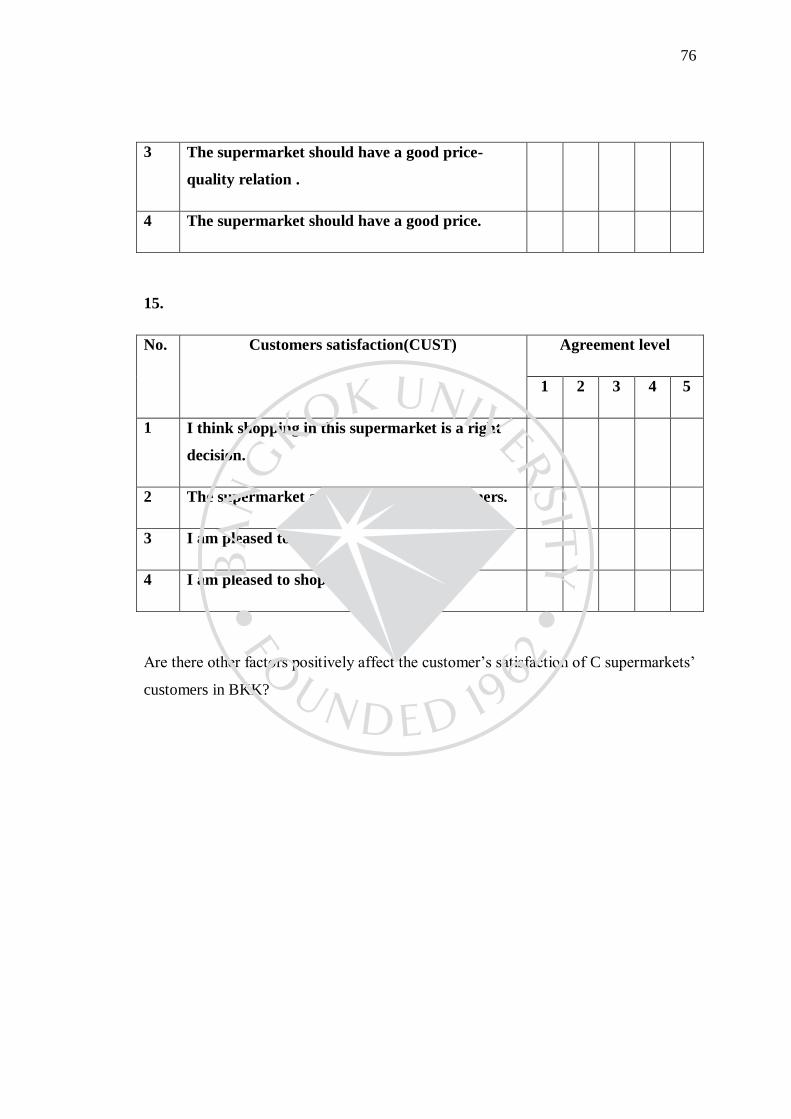
76
3 The supermarket should have a good price-
quality relation .
4 The supermarket should have a good price.
15.
No. Customers satisfaction(CUST) Agreement level
1 2 3 4 5
1 I think shopping in this supermarket is a right
decision.
2 The supermarket aims to satisfy the customers.
3 I am pleased to prefer this supermarket.
4 I am pleased to shop this supermarket.
Are there other factors positively affect the customer’s satisfaction of C supermarkets’
customers in BKK?
77
โครงการปรญญาโท สาขาบรหารธรกจ
แบบสอบถามส ารวจความคดเหน
"ปจจยทสงผลกระทบตอความพงพอใจของลกคาทมตอบกซซเปอรมารเกตในกรงเทพมหานคร"
ขาพเจาชอซอย หวง ขาพเจาเปนนกศกษาระดบปรญญาโท ของโครงการ MBA มหาวทยาลยกรงเทพ ขาพเจาท าการ
วจยเรอง "ปจจยทสงผลกระทบตอความพงพอใจของลกคาทมตอบกซซเปอรมารเกตในกรงเทพมหานคร" แบบสอบถามนเปน
สวนหนงของวทยานพนธในการศกษาระดบปรญญาโท สาขาบรหารธรกจ มหาวทยาลยกรงเทพ ขอมลทไดมาจากการตอบ
แบบสอบถามนจะถกเกบไวเปนความลบและใชเพอวตถประสงคทางวชาการเทานน ขอขอบคณทสละเวลาในการกรอกขอมลใน
แบบสอบถามน
78
หมายเหต: โปรดท าเครองหมายในชอง () ทเก ยวของกบค าตอบของคณ
1. โปรดระบเพศของคณ
1. ชาย 2. หญง
2. โปรดระบอายของคณ
1. ระหวาง 20 ถง 30 ป 2. ระหวาง 31 ถง 40 ป
3. ระหวาง 41 ถง 50 ป 4. 51 ปขนไป
3. รายไดตอเดอนของคณ:
1. 0—35,000 บาท 2. 35,001—50,000 บาท
3. 50,001—100,000 บาท 4. มากกวา 100,001 บาท
4. สถานภาพ
แตงงาน โสด
หยาราง
5. โปรดระบระดบการศกษาของคณ
ประถม มธยม
ปรญญาตร ปรญญาโทหรอปรญญาเอก
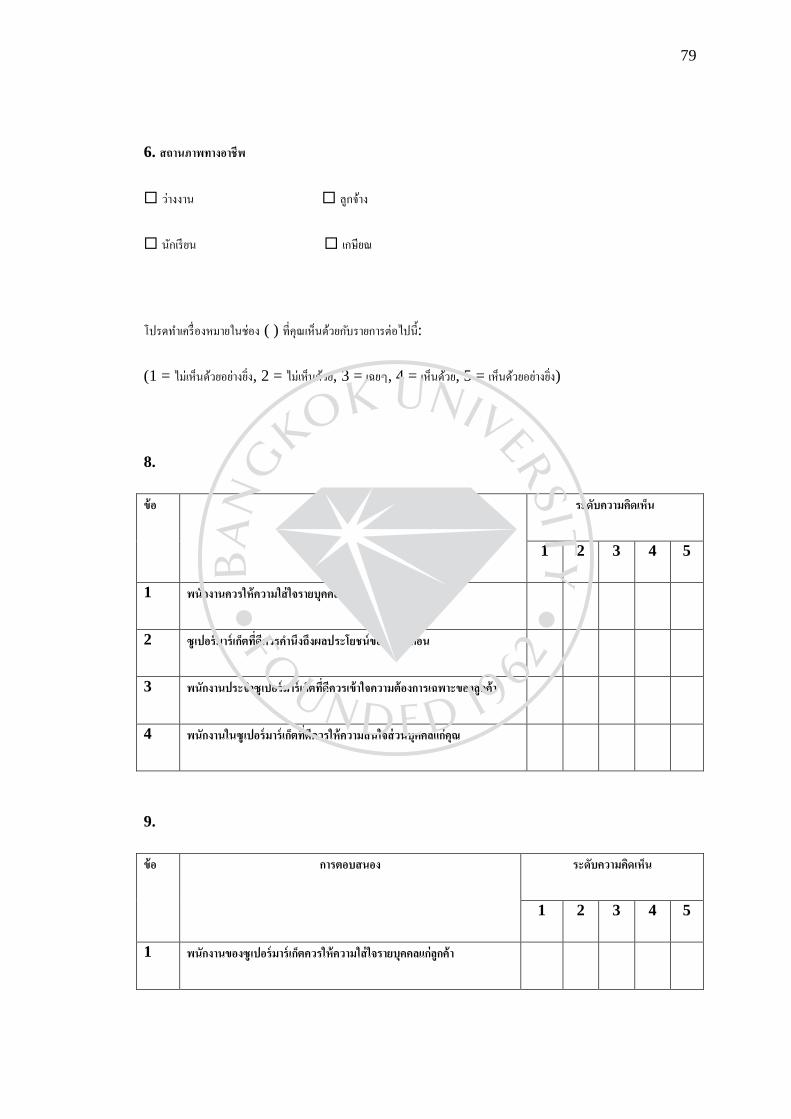
79
6. สถานภาพทางอาชพ
วางงาน ลกจาง
นกเรยน เกษยณ
โปรดท าเครองหมายในชอง ( ) ทคณเหนดวยกบรายการตอไปน:
(1 = ไมเหนดวยอยางยง, 2 = ไมเหนดวย, 3 = เฉยๆ, 4 = เหนดวย, 5 = เหนดวยอยางยง)
8.
ขอ การเอาใจใส ระดบความคดเหน
1 2 3 4 5
1 พนกงานควรใหความใสใจรายบคคลแกลกคา
2 ซเปอรมารเกตทดควรค านงถงผลประโยชนของลกคากอน
3 พนกงานประจ าซเปอรมารเกตทดควรเขาใจความตองการเฉพาะของลกคา
4 พนกงานในซเปอรมารเกตทดควรใหความสนใจสวนบคคลแกคณ
9.
ขอ การตอบสนอง ระดบความคดเหน
1 2 3 4 5
1 พนกงานของซเปอรมารเกตควรใหความใสใจรายบคคลแกลกคา
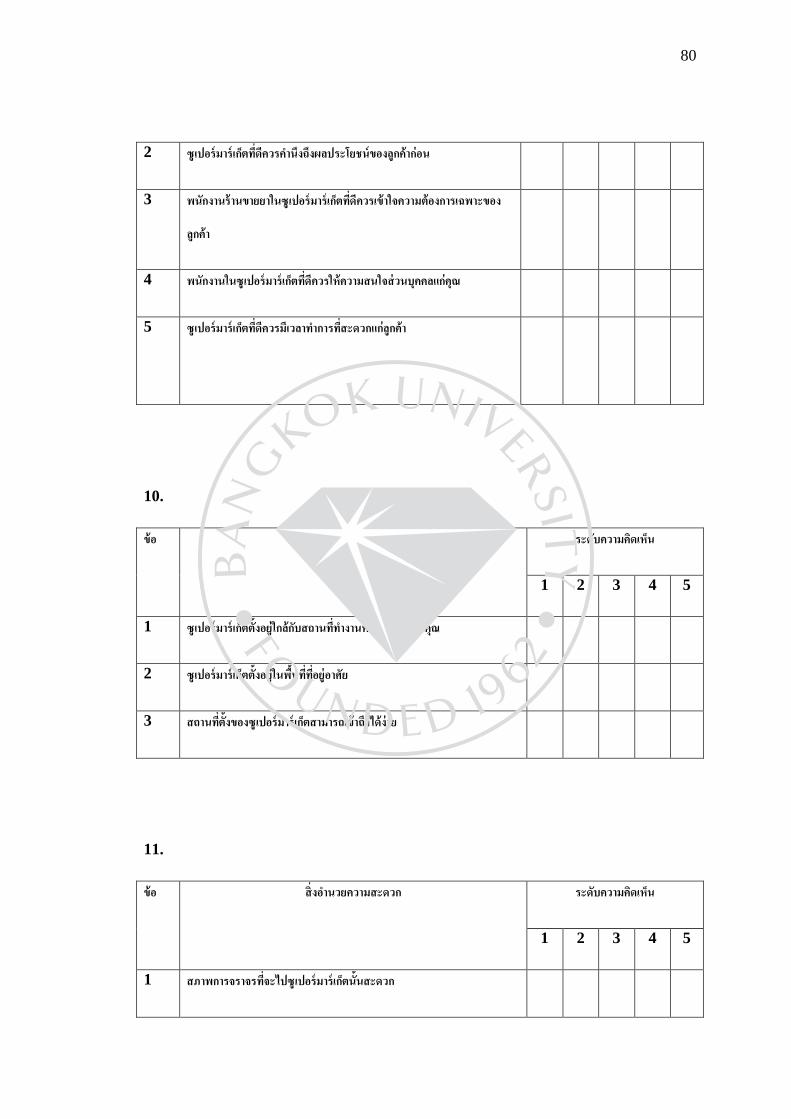
80
2 ซเปอรมารเกตทดควรค านงถงผลประโยชนของลกคากอน
3 พนกงานรานขายยาในซเปอรมารเกตทดควรเขาใจความตองการเฉพาะของ
ลกคา
4 พนกงานในซเปอรมารเกตทดควรใหความสนใจสวนบคคลแกคณ
5 ซเปอรมารเกตทดควรมเวลาท าการทสะดวกแกลกคา
10.
ขอ สถานท ระดบความคดเหน
1 2 3 4 5
1 ซเปอรมารเกตตงอยใกลกบสถานทท างานหรอทบานของคณ
2 ซเปอรมารเกตตงอยในพนททอยอาศย
3 สถานทตงของซเปอรมารเกตสามารถเขาถงไดงาย
11.
ขอ สงอ านวยความสะดวก ระดบความคดเหน
1 2 3 4 5
1 สภาพการจราจรทจะไปซเปอรมารเกตนนสะดวก
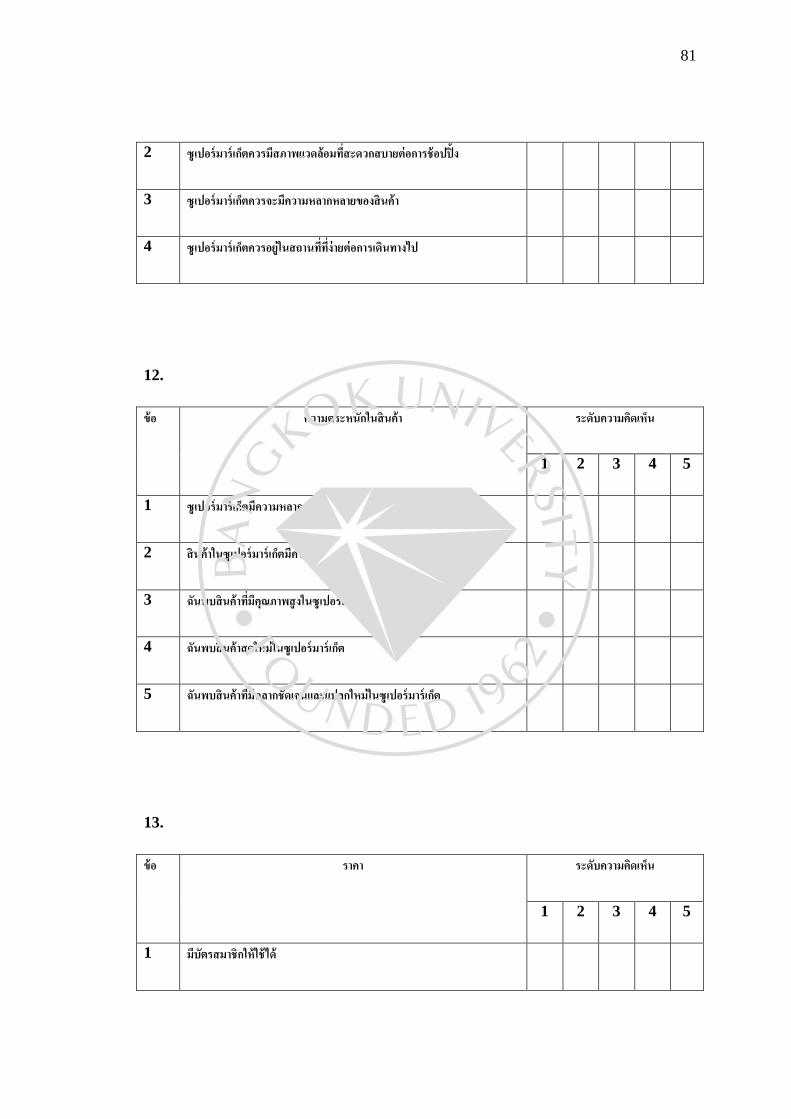
81
2 ซเปอรมารเกตควรมสภาพแวดลอมทสะดวกสบายตอการชอปปง
3 ซเปอรมารเกตควรจะมความหลากหลายของสนคา
4 ซเปอรมารเกตควรอยในสถานททงายตอการเดนทางไป
12.
ขอ ความตระหนกในสนคา ระดบความคดเหน
1 2 3 4 5
1 ซเปอรมารเกตมความหลากหลายของชวงผลตภณฑ
2 สนคาในซเปอรมารเกตมความทนทาน
3 ฉนพบสนคาทมคณภาพสงในซเปอรมารเกต
4 ฉนพบสนคาสดใหมในซเปอรมารเกต
5 ฉนพบสนคาทมฉลากชดเจนและแปลกใหมในซเปอรมารเกต
13.
ขอ ราคา ระดบความคดเหน
1 2 3 4 5
1 มบตรสมาชกใหใชได
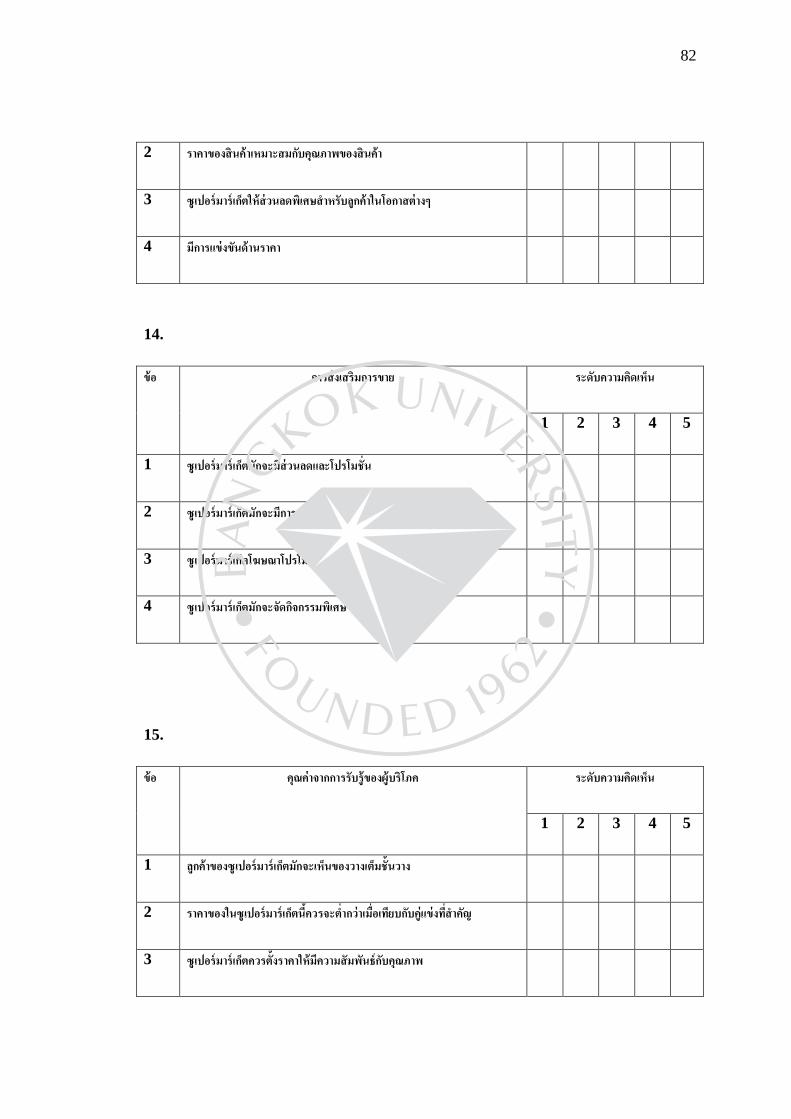
82
2 ราคาของสนคาเหมาะสมกบคณภาพของสนคา
3 ซเปอรมารเกตใหสวนลดพเศษส าหรบลกคาในโอกาสตางๆ
4 มการแขงขนดานราคา
14.
ขอ การสงเสรมการขาย ระดบความคดเหน
1 2 3 4 5
1 ซเปอรมารเกตมกจะมสวนลดและโปรโมชน
2 ซเปอรมารเกตมกจะมการแจกสนคาตวอยาง
3 ซเปอรมารเกตโฆษณาโปรโมชนในหนงสอพมพทองถนหรอจดหมาย
4 ซเปอรมารเกตมกจะจดกจกรรมพเศษ
15.
ขอ คณคาจากการรบรของผบรโภค ระดบความคดเหน
1 2 3 4 5
1 ลกคาของซเปอรมารเกตมกจะเหนของวางเตมชนวาง
2 ราคาของในซเปอรมารเกตนควรจะต ากวาเมอเทยบกบคแขงทส าคญ
3 ซเปอรมารเกตควรตงราคาใหมความสมพนธกบคณภาพ
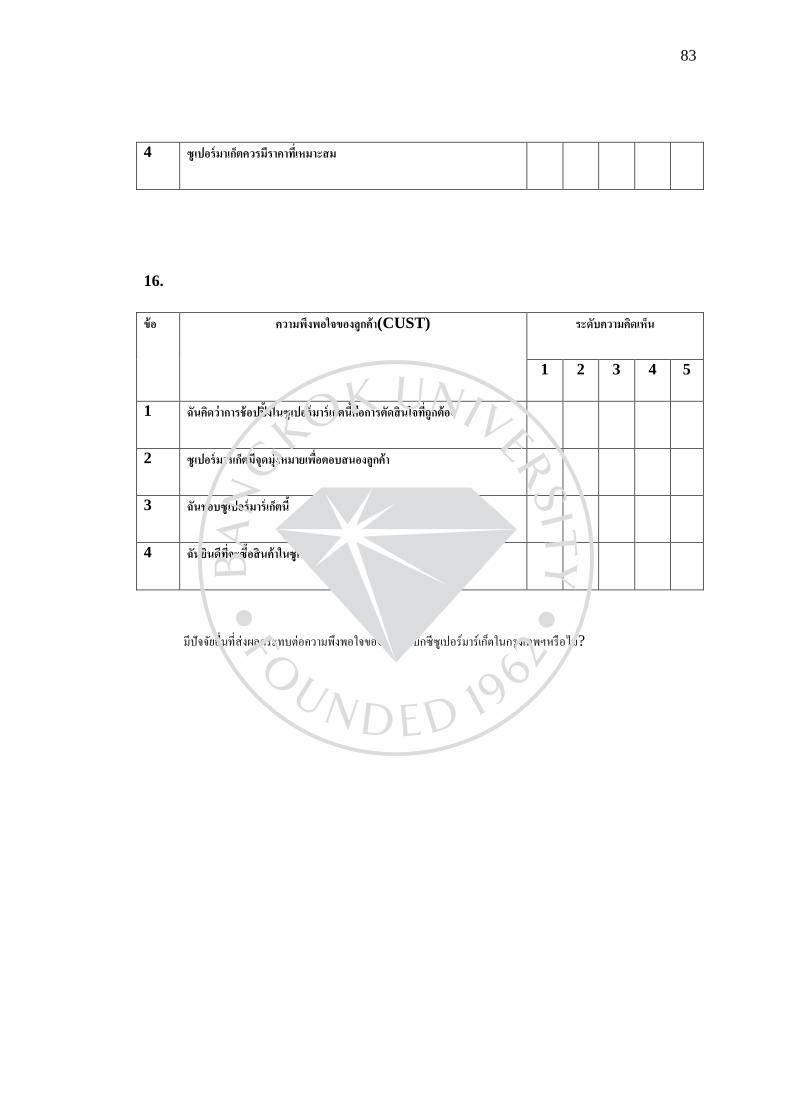
83
4 ซเปอรมาเกตควรมราคาทเหมาะสม
16.
ขอ ความพงพอใจของลกคา(CUST) ระดบความคดเหน
1 2 3 4 5
1 ฉนคดวาการชอปปงในซเปอรมารเกตนคอการตดสนใจทถกตอง
2 ซเปอรมารเกตมจดมงหมายเพอตอบสนองลกคา
3 ฉนชอบซเปอรมารเกตน
4 ฉนยนดทจะซอสนคาในซเปอรมารเกตน
มปจจยอนทสงผลกระทบตอความพงพอใจของลกคาทบกซซเปอรมารเกตในกรงเทพฯหรอไม?
84
85

86
87
BIODATA
Name-Surname: Siyu Wang
Date of Birth: 19 October 1991
Residential Address: 58/712 B Building condo Fuse M
Bangkobies Ramkanmheang Road Suanluang Bangkok
10900
Email: [email protected]
Education Background:
2010-2014 Bachelor Guangxi Nationality University