factorytalk metrics user guide - rockwell...
TRANSCRIPT
USER GUIDE
Rockwell Automation Publication PLTMT-UM001M-EN-P-June 2014
Supersedes Publication PLTMT-UM001L-EN-P-June 2013
Customer Support Telephone — 1.440.646.3434 Online Support — http://www.rockwellautomation.com/support/overview.page
© 2014 Rockwell Automation Technologies, Inc. All Rights Reserved.
This document and any accompanying Rockwell Software products are copyrighted by Rockwell Automation, Inc. Any reproduction and/or distribution without prior written consent from Rockwell Automation, Inc. is strictly prohibited. Please refer to the license agreement for details.
FactoryTalk, FactoryTalk Activation, FactoryTalk Diagnostics, FactoryTalk Directory, FactoryTalk Live Data, FactoryTalk Metrics, FactoryTalk Services Platform, FactoryTalk Transaction Manager, FactoryTalk VantagePoint, FactoryTalk ProductionCentre, Report Expert, Rockwell, Rockwell Automation, Rockwell Software, and RSBizWare are trademarks of Rockwell Automation, Inc.
Any Rockwell Automation logo, software or hardware not mentioned herein is also a trademark, registered or otherwise, of Rockwell Automation, Inc.
For a complete list of products and their respective trademarks, go to
http://www.rockwellautomation.com/rockwellautomation/legal-notices/overview.page?%23tab4#/tab4.
ActiveX, Microsoft, Microsoft Access, SQL Server, Visual Basic, Visual C++, Visual SourceSafe, Windows, Windows ME, Windows NT, Windows 2000, Windows Server, Windows XP, Windows 7, Windows Vista, and Windows 8 are either registered trademarks or trademarks of Microsoft Corporation in the United States and/or other countries.
Adobe, Acrobat, and Reader are either registered trademarks or trademarks of Adobe Systems Incorporated in the United States and/or other countries.
ControlNet is a registered trademark of ControlNet International.
DeviceNet is a trademark of the Open DeviceNet Vendor Association, Inc. (ODVA)
OLE for Process Control (OPC) is a registered trademark of the OPC Foundation.
Oracle, SQL*Net, and SQL*Plus are registered trademarks of Oracle Corporation.
All other trademarks are the property of their respective holders and are hereby acknowledged.
This product is warranted in accordance with the product license. The product’s performance may be affected by system configuration, the application being performed, operator control, maintenance, and other related factors. Rockwell Automation is not responsible for these intervening factors. The instructions in this document do not cover all the details or variations in the equipment, procedure, or process described, nor do they provide directions for meeting every possible contingency during installation, operation, or maintenance. This product’s implementation may vary among users.
This document is current as of the time of release of the product; however, the accompanying software may have changed since the release. Rockwell Automation, Inc. reserves the right to change any information contained in this document or the software at any time without prior notice. It is your responsibility to obtain the most current information available from Rockwell when installing or using this product.
Contacting Rockwell
Copyright Notice
Trademark Notices
Other Trademarks
Warranty
Table of Contents
Chapter 1
What Is FactoryTalk Metrics? ................................................................... 9 Features and Benefits .................................................................................. 10 Intended Audience ...................................................................................... 10 Where Can I Go for Help? ....................................................................... 12
Get Web Support ................................................................................... 12 Get Phone Support ................................................................................ 13 Get Consulting Services ....................................................................... 13 Contact Us .............................................................................................. 13
Chapter 2 The RSBizWare Architecture .................................................................. 15 Importing Sample Data to the RSBizWare Database......................... 16 Connecting to the Information Services Manager .............................. 17
Using the Information Services Manager in Internet Explorer .. 17 Using the Information Services Manager in the Configuration Console ..................................................................................................... 18 Getting Started with the Configuration Console .......................... 19
The Plant Model .......................................................................................... 20 Configuring the Plant Model .............................................................. 21 Loading Sample Activity Areas ........................................................... 23
Chapter 3 Collecting Part Count Data When the Metrics Server Manager Is Stopped .......................................................................................................... 25 OEE Rating ................................................................................................... 27 Fault Metrics Ratings ................................................................................. 28
Mean Time Between Failure ............................................................... 28 Mean Time To Repair .......................................................................... 29
Configuring Activity Area Schedules ..................................................... 29 Time Patterns ......................................................................................... 29
Configuring Time Patterns ............................................................ 30 Configuring Work Day Time Patterns ....................................... 34 Configuring Work Week Time Patterns .................................... 36
Composites and Schedule Exceptions ............................................... 38 Configuring Composites and Schedule Exceptions ................. 39
Welcome to FactoryTalk Metrics
Getting Started
Collecting Performance Data
Rockwell Automation Publication PLTMT-UM001M-EN-P-June 2014 3

Table of Contents
Configuring OEE Performance Parameters For Activity Areas ...... 41 Configuring Data Collection .............................................................. 44 Configuring Cycle Time ...................................................................... 44
Configuring a Part ID/Cycle Time Lookup List ...................... 47 Configuring Part Id ............................................................................... 50 Configuring Summarization Criteria ............................................... 52 Configuring Part Count ....................................................................... 55
Configuring Part Count Using an Unscheduled Data Point 58 Configuring Part Count Using an Unscheduled Data Point and a FTTM Expression ................................................................. 58 Configuring Part Count Using a FTTM Expression On a Scheduled Basis ................................................................................. 59 Configuring a Formula .................................................................... 60
Availability ............................................................................................... 63 Configuring Scheduled Availability ............................................. 65 Configuring Monitored Availability ............................................ 73 Configuring Running State ............................................................ 78
Generating Performance Parameter Events ..................................... 81 Viewing Performance Parameter Events for an Activity Area .......... 81
System-generated Events ...................................................................... 83 User-defined Events .............................................................................. 85 Manual Events ........................................................................................ 88 The Recycle Bin ...................................................................................... 89
Configuring User-defined Performance Parameter Events .............. 90 Configuring the Event Data Summary ............................................. 90
Event Data Summarization Types ................................................ 92 Configuring the Event Trigger ........................................................... 93
Event Trigger Types ......................................................................... 96 Configuring the Event Value .............................................................. 99
Event Value Types ......................................................................... 101 Using the Expression Editor ....................................................... 104 Creating Event Value Reason Code Lookup Lists ................ 109
Configuring the Machine State / Faults ........................................ 111 Configuring the Reporting ............................................................... 113
Advanced Properties ................................................................................ 115 Scheduled Part Count Collection Parameters ............................. 115
4 Rockwell Automation Publication PLTMT-UM001M-EN-P-June 2014
Table of Contents
System-generated Event Data Summarization ............................. 116 Availability Interpretation Options ............................................... 117 Performance Data Trending Rate ................................................... 118
Machine States .......................................................................................... 118 Machine States at the Sample Enterprise ...................................... 120 Prioritizing Machine States .............................................................. 122 Configuring Machine States ............................................................. 123 Mapping Machine States to User-defined Events ....................... 125 Determining Availability and Running State From Machine State .................................................................................................... 126
Configuring FactoryTalk Metrics to Perform Downtime Tracking ... 126
Running Versus Downtime .............................................................. 128 User-defined Downtime Events ...................................................... 129 Machine State ...................................................................................... 130
Reviewing the Status of Performance Parameters Events ............... 131 Start Data Collection .............................................................................. 133 Stop Data Collection ............................................................................... 134 Manual Data Collection ......................................................................... 134
Chapter 4 FactoryTalk Metrics UDT ..................................................................... 139
UDT Tags and FactoryTalk Metrics Performance Parameters 140 Setting up Communication Between a ControlLogix Controller and FactoryTalk Metrics ................................................................................ 143
Configuring RSLinx Enterprise ....................................................... 144 Importing the FactoryTalk Metrics UDT to the ControlLogix Controller ............................................................................................. 148 Creating Tags Based on the FactoryTalk Metrics UDT ........... 150 Creating FactoryTalk Transaction Manager and FactoryTalk Metrics Configurations ..................................................................... 154
Configuration Types ..................................................................... 154 Configuration Flow ...................................................................... 154
Guidelines for Modifying Imported Performance Parameters 168
Automated Configuration
Rockwell Automation Publication PLTMT-UM001M-EN-P-June 2014 5
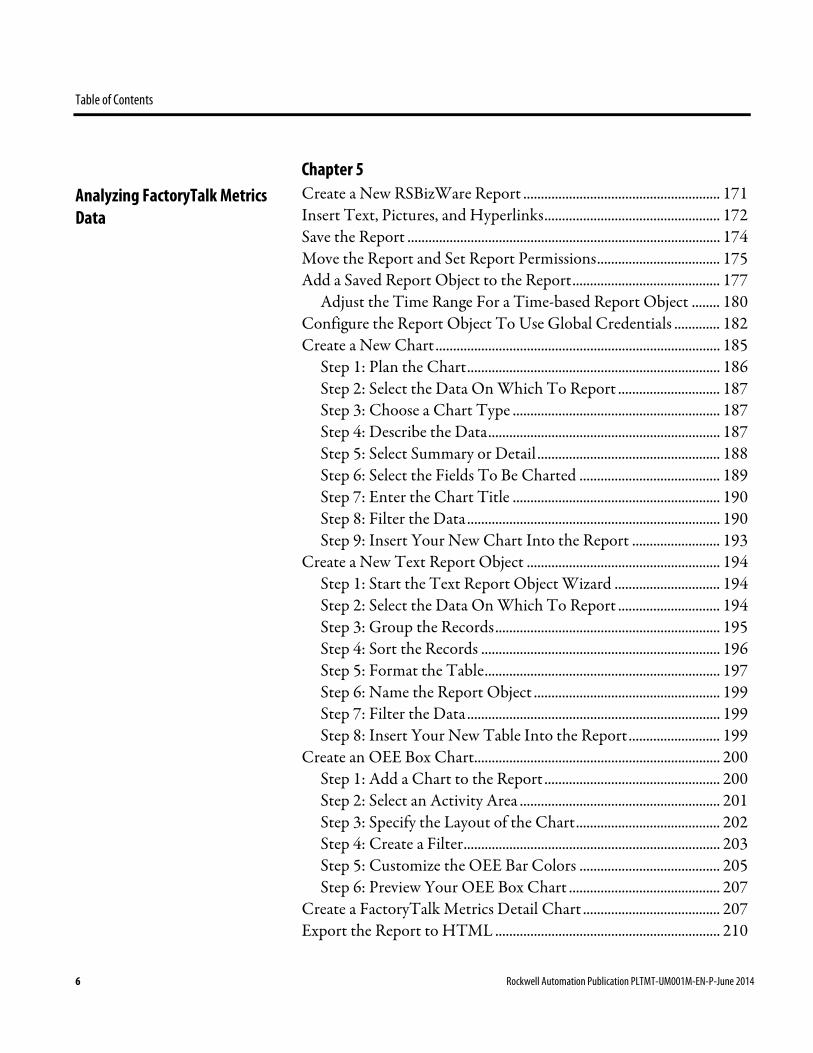
Table of Contents
Chapter 5
Create a New RSBizWare Report ........................................................ 171 Insert Text, Pictures, and Hyperlinks .................................................. 172 Save the Report ......................................................................................... 174 Move the Report and Set Report Permissions ................................... 175 Add a Saved Report Object to the Report .......................................... 177
Adjust the Time Range For a Time-based Report Object ........ 180 Configure the Report Object To Use Global Credentials ............. 182 Create a New Chart ................................................................................. 185
Step 1: Plan the Chart ........................................................................ 186 Step 2: Select the Data On Which To Report ............................. 187 Step 3: Choose a Chart Type ........................................................... 187 Step 4: Describe the Data .................................................................. 187 Step 5: Select Summary or Detail .................................................... 188 Step 6: Select the Fields To Be Charted ........................................ 189 Step 7: Enter the Chart Title ........................................................... 190 Step 8: Filter the Data ........................................................................ 190 Step 9: Insert Your New Chart Into the Report ......................... 193
Create a New Text Report Object ....................................................... 194 Step 1: Start the Text Report Object Wizard .............................. 194 Step 2: Select the Data On Which To Report ............................. 194 Step 3: Group the Records ................................................................ 195 Step 4: Sort the Records .................................................................... 196 Step 5: Format the Table ................................................................... 197 Step 6: Name the Report Object ..................................................... 199 Step 7: Filter the Data ........................................................................ 199 Step 8: Insert Your New Table Into the Report .......................... 199
Create an OEE Box Chart...................................................................... 200 Step 1: Add a Chart to the Report .................................................. 200 Step 2: Select an Activity Area ......................................................... 201 Step 3: Specify the Layout of the Chart ......................................... 202 Step 4: Create a Filter ......................................................................... 203 Step 5: Customize the OEE Bar Colors ........................................ 205 Step 6: Preview Your OEE Box Chart ........................................... 207
Create a FactoryTalk Metrics Detail Chart ....................................... 207 Export the Report to HTML ................................................................ 210
Analyzing FactoryTalk Metrics Data
6 Rockwell Automation Publication PLTMT-UM001M-EN-P-June 2014
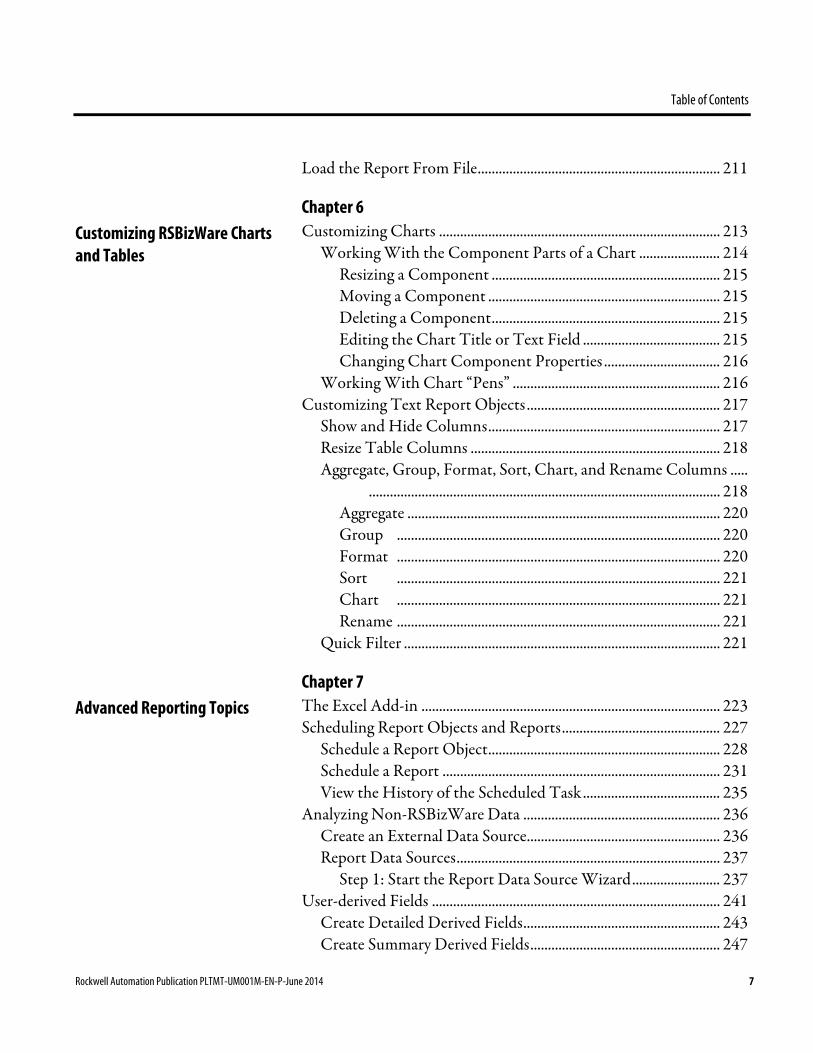
Table of Contents
Load the Report From File ..................................................................... 211
Chapter 6
Customizing Charts ................................................................................ 213 Working With the Component Parts of a Chart ....................... 214
Resizing a Component ................................................................. 215 Moving a Component .................................................................. 215 Deleting a Component ................................................................. 215 Editing the Chart Title or Text Field ....................................... 215 Changing Chart Component Properties ................................. 216
Working With Chart “Pens” ........................................................... 216 Customizing Text Report Objects ....................................................... 217
Show and Hide Columns .................................................................. 217 Resize Table Columns ....................................................................... 218 Aggregate, Group, Format, Sort, Chart, and Rename Columns ..... .................................................................................................... 218
Aggregate ......................................................................................... 220 Group ............................................................................................ 220 Format ............................................................................................ 220 Sort ............................................................................................ 221 Chart ............................................................................................ 221 Rename ............................................................................................ 221
Quick Filter .......................................................................................... 221
Chapter 7 The Excel Add-in ..................................................................................... 223 Scheduling Report Objects and Reports ............................................. 227
Schedule a Report Object .................................................................. 228 Schedule a Report ............................................................................... 231 View the History of the Scheduled Task ....................................... 235
Analyzing Non-RSBizWare Data ........................................................ 236 Create an External Data Source....................................................... 236 Report Data Sources ........................................................................... 237
Step 1: Start the Report Data Source Wizard ......................... 237 User-derived Fields .................................................................................. 241
Create Detailed Derived Fields ........................................................ 243 Create Summary Derived Fields ...................................................... 247
Customizing RSBizWare Charts and Tables
Advanced Reporting Topics
Rockwell Automation Publication PLTMT-UM001M-EN-P-June 2014 7

Table of Contents
Configuring Reports ................................................................................ 250
Chapter 8
Plant Model Element State Icons ......................................................... 253 Performance Parameter Event State Icons ......................................... 254
Chapter 9 Filter permissions ..................................................................................... 258 Report permissions ................................................................................... 258 Report data source permissions ............................................................. 259 Report object permissions ...................................................................... 259
Appendix A Workcell History ...................................................................................... 261 Event History ............................................................................................ 263 Machine State Data.................................................................................. 264
FactoryTalk Metrics Icon Definitions
Object Permissions
Report Data Sources
8 Rockwell Automation Publication PLTMT-UM001M-EN-P-June 2014
Chapter 1
Welcome to FactoryTalk Metrics
In this chapter you will learn about the following:
• What Is FactoryTalk Metrics? (page 9)
• Features and Benefits (page 10)
• Intended Audience (page 10)
• Where Can I Go for Help? (page 12)
Companies in the discrete and repetitive manufacturing industries are being challenged by management to maximize production from existing lines, to meet required cycle times and delivery dates for each product, and to reduce costs. To meet this challenge, production management is striving to operate the equipment at its highest efficiency.
Real-time identification of production assets that fail to reach the required standard is critical to maintaining world-class efficiency. A thorough understanding of the details behind production performance will allow you to identify sources of production inefficiencies, and to maximize asset utilization.
The RSBizWare software is a suite of tools and services aimed at increasing your manufacturing floor effectiveness and profitability with solutions that target performance analysis and improvement, and with data acquisition and integration. FactoryTalk Metrics is just one of the applications that are available within the RSBizWare software. FactoryTalk Metrics builds on the report, analysis, and management capabilities of the RSBizWare software by providing a
What Is FactoryTalk Metrics?
Rockwell Automation Publication PLTMT-UM001M-EN-P-June 2014 9
Chapter 1 Welcome to FactoryTalk Metrics
powerful, yet simple set of tools to analyze the performance of production assets.
FactoryTalk Metrics provides ratings - Overall Equipment Effectiveness (OEE), Mean Time Between Failure (MTBF), and Mean Time to Repair (MTTR) - that allow you to evaluate the performance of your production assets. A production asset (or activity area) can be anything from a single piece of equipment to a complete manufacturing plant. These ratings provide a simple way to determine quickly whether a production asset is performing adequately, based on data collected from the control system.
FactoryTalk Metrics offers the following features and benefits:
• Rich reporting, graphing, analyzing, and querying functionality providing a complete and easy-to-use solution for performance analysis.
• High-level analysis tools to easily identify poorly performing assets, including the ability to drill into the underlying detail to identify the causes of production inefficiencies.
• The ability to evaluate every production asset based on OEE, MTBF, and MTTR ratings.
• The ability to isolate each asset so that its rating is not affected by upstream or downstream performance.
• The ability to connect most of the OEE parameters to either a data point or a formula, providing flexibility in the configuration of the OEE rating.
• The ability to embed a report object in any Microsoft ActiveX container, such as Visual Basic or Internet Explorer.
The FactoryTalk Metrics User Guide is designed to help you understand how to access and use the FactoryTalk Metrics product. This document focuses on the end-user functions of FactoryTalk
Features and Benefits
Intended Audience
10 Rockwell Automation Publication PLTMT-UM001M-EN-P-June 2014

Welcome to FactoryTalk Metrics Chapter 1
Metrics and does not cover the installation and operation of underlying system services.
This document is intended for the following types of users of the RSBizWare software:
• RSBizWare administrators
RSBizWare administrators configure the RSBizWare system so that it can capture performance data for use by report designers and report users.
They should be familiar with:
• Control systems, process information (line and plant), and databases.
• Microsoft Windows operating system.
• The location and structure of databases.
• Report designers
Report designers create the reports that will be used by report users.
They should be familiar with:
• Process information (the physical representation of the production line and plant).
• Microsoft Windows operating systems.
• Query logic (how to write a database query).
• Web publishing tools.
• The location and structure of databases.
• Report users
Report users make use of the reports created by the report designer to perform their jobs.
Rockwell Automation Publication PLTMT-UM001M-EN-P-June 2014 11
Chapter 1 Welcome to FactoryTalk Metrics
They should be familiar with:
• Microsoft Windows operating systems.
Consult the following resources for additional information about the product:
• Release Notes
The release notes contain current information about the product, including hardware and software requirements, new features, known and fixed anomalies.
• RSBizWare Administration Guide
The administration guide helps the RSBizWare administrator install and configure the software as well as understand the architecture of the RSBizWare suite and its components.
• Online help
The online help provides general information and step-by-step procedures for working with the product.
• Rockwell Automation Support Center
The support center provides a variety of services, such as trainings, webinars, and online support that will improve your experience using the RSBizWare suite.
TIP For web-based product support, and for detailed information on technical support resources, please visit the support site.
Access the Rockwell Automation Knowledge base for 24/7 technical information and assistance. You can also download software patches and new software versions, ask questions via email, participate in user forums, and access other useful problem-solving tools.
The support resources available vary, depending on the product purchased. The latest information can be obtained from the Rockwell Automation Technical Support website.
Where Can I Go for Help?
Get Web Support
12 Rockwell Automation Publication PLTMT-UM001M-EN-P-June 2014

Welcome to FactoryTalk Metrics Chapter 1
A current TechConnect Support contract may be required to use some online features.
To speak with a Technical Support representative in North America, call 1-440-646-3434.
For information on how to contact Technical Support in other locations worldwide, please visit the support site.
A current TechConnect Support contract may be required to obtain phone support.
Rockwell Automation provides expert consulting and turnkey implementation of this product. Please contact your local representative for more information.
We strive to help all of our customers become successful in their manufacturing improvement efforts. Toward this objective, we invite you to contact your local representative or Rockwell Automation at any time that we may be of service to you.
Get Phone Support
Get Consulting Services
Contact Us
Rockwell Automation Publication PLTMT-UM001M-EN-P-June 2014 13

Chapter 1 Welcome to FactoryTalk Metrics
14 Rockwell Automation Publication PLTMT-UM001M-EN-P-June 2014

Chapter 2
Getting Started
Before you walk through the examples and tutorials that are discussed in this book, it is assumed that the RSBizWare administrator has installed, configured, and started the RSBizWare server on the server computer.
The RSBizWare architecture is a scalable, multi-tiered, distributed architecture consisting of a data collection subsystem, an Oracle or SQL Server database repository, the Information Services Manager, and clients. Rockwell Automation’s FactoryTalk Transaction Manager is the embedded engine that collects data from the control system(s), and the Metrics Server Manager logs it to the predefined RSBizWare database repository. There are several types of clients, including the Configuration Console and the Internet Explorer Web client.
The RSBizWare Architecture
Rockwell Automation Publication PLTMT-UM001M-EN-P-June 2014 15

Chapter 2 Getting Started
The RSBizWare architecture can be configured to run on a single computer, or it can be distributed across multiple computers. In the simplest case, the Configuration Console, the Information Services Manager, the RSBizWare administrative tools used by the RSBizWare administrator, the database, the Metrics Server Manager, and the FactoryTalk Transaction Manager data collection engine run on a single computer. In a distributed setting, these components may reside on separate computers. Clients connect to the Information Services Manager using TCP/IP, so they can be deployed over a LAN, WAN, intranet, or the Internet. The scalability of the RSBizWare architecture allows many clients to connect to a single server.
You may import the FactoryTalk Metrics sample data so that you can use it as a reference and/or for demonstration purposes.
To import the sample data into the RSBizWare database:
1. Go to Start > All Programs > Rockwell Software > FactoryTalk Tools > Database Wizard.
The Database Load and Update Wizard appears.
2. Click Next.
The Product and Database Connection page appears.
3. In the ODBC DSN list, select your ODBC data source.
4. In the User text box, type the user name of your RSBizWare database owner.
5. In the Password box, type the password of your RSBizWare database owner.
6. Click Connect.
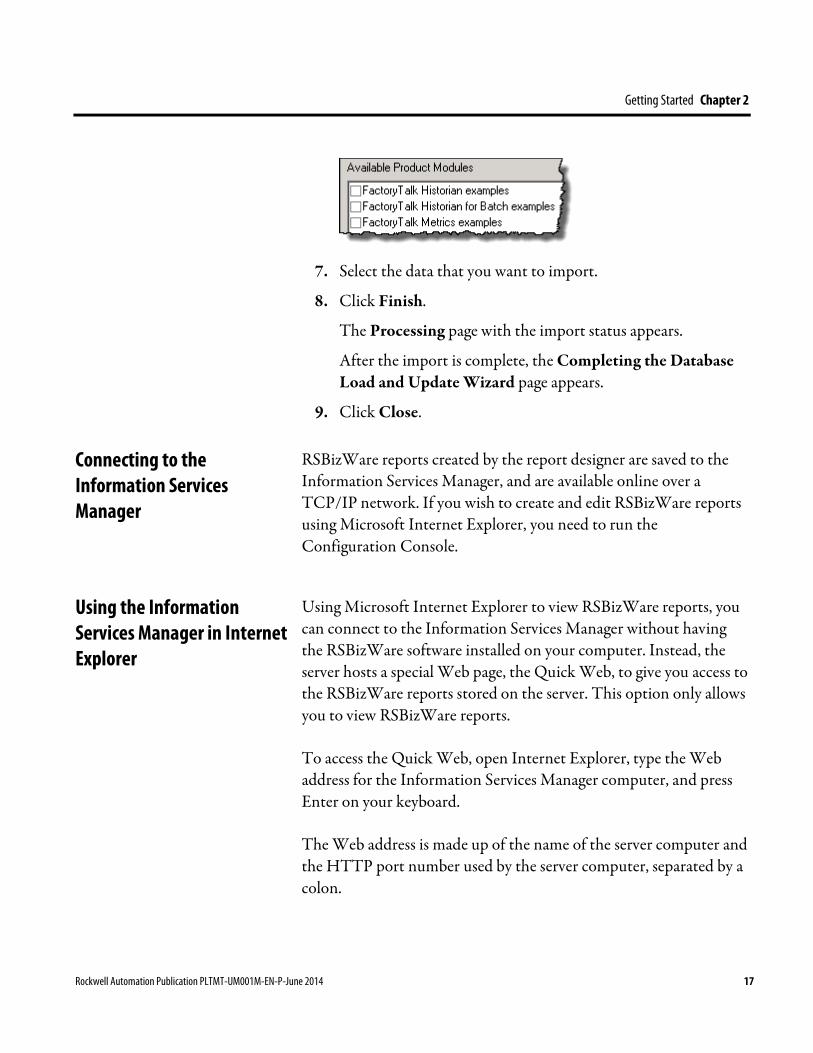
Under Available Product Modules, a list of sample data appears.
Importing Sample Data to the RSBizWare Database
16 Rockwell Automation Publication PLTMT-UM001M-EN-P-June 2014
Getting Started Chapter 2
7. Select the data that you want to import.
8. Click Finish.
The Processing page with the import status appears.
After the import is complete, the Completing the Database Load and Update Wizard page appears.
9. Click Close.
RSBizWare reports created by the report designer are saved to the Information Services Manager, and are available online over a TCP/IP network. If you wish to create and edit RSBizWare reports using Microsoft Internet Explorer, you need to run the Configuration Console.
Using Microsoft Internet Explorer to view RSBizWare reports, you can connect to the Information Services Manager without having the RSBizWare software installed on your computer. Instead, the server hosts a special Web page, the Quick Web, to give you access to the RSBizWare reports stored on the server. This option only allows you to view RSBizWare reports.
To access the Quick Web, open Internet Explorer, type the Web address for the Information Services Manager computer, and press Enter on your keyboard.
The Web address is made up of the name of the server computer and the HTTP port number used by the server computer, separated by a colon.
Connecting to the Information Services Manager
Using the Information Services Manager in Internet Explorer
Rockwell Automation Publication PLTMT-UM001M-EN-P-June 2014 17
Chapter 2 Getting Started
For example, if you were attempting to connect to a server computer named rsi-rockwell that uses the default HTTP port 8080, you would use the following address: http://rsi-rockwell:8080. Please contact your RSBizWare administrator for the specific Information Services Manager Web address to which you should connect.
The first time you try to use the Quick Web, you need to download several ActiveX controls from the server computer. The download will begin automatically.
After you have downloaded the ActiveX controls from the Information Services Manager, you may be prompted to log on. If prompted, type the user name and password for the account that your RSBizWare administrator has authorized for you, and then click OK. A connection to the RSBizWare server is established.
If you wish to configure your plant model, manage the collection of control system data, and/or edit RSBizWare reports, you should connect to the Information Services Manager via the Configuration Console. Your RSBizWare administrator needs to assign a FactoryTalk Metrics Author license and the appropriate privileges to you, to enable you to perform these functions.
You need to have the client software installed on your computer to run the Configuration Console. To install the Configuration Console from the RSBizWare DVD, select the Minimal installation option.
To start the Configuration Console:
1. Go to Start > All Programs > Rockwell Software > RSBizWare > Configuration Console.
The RSBizWare Login dialog box appears.
Using the Information Services Manager in the Configuration Console
18 Rockwell Automation Publication PLTMT-UM001M-EN-P-June 2014
Getting Started Chapter 2
2. If prompted, type the user name and password for the account that your RSBizWare administrator has authorized for you, type the name of the server computer where the Information Services Manager is running in the Server box, and then click Login.
A client session with the RSBizWare server is established.
The status bar at the bottom of the client application shows your user name, the activations that have been assigned to you, and the Information Services Manager to which you are connected.
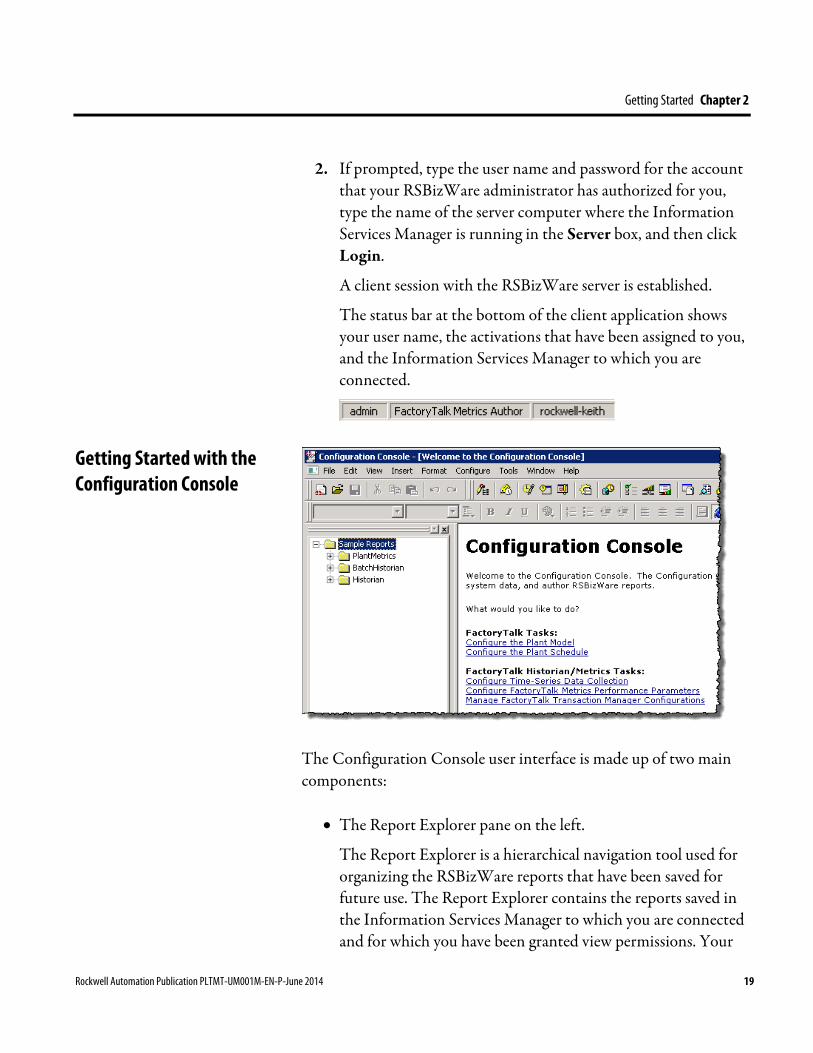
The Configuration Console user interface is made up of two main components:
• The Report Explorer pane on the left.
The Report Explorer is a hierarchical navigation tool used for organizing the RSBizWare reports that have been saved for future use. The Report Explorer contains the reports saved in the Information Services Manager to which you are connected and for which you have been granted view permissions. Your
Getting Started with the Configuration Console
Rockwell Automation Publication PLTMT-UM001M-EN-P-June 2014 19
Chapter 2 Getting Started
ability to modify and delete the reports listed in the Report Explorer depends on the licenses and features that you have been assigned by your RSBizWare administrator, and the permissions that you have been granted by the creator of each individual report.
• The report design and display work area on the right.
When you click an item in the Report Explorer, the specified RSBizWare report appears in this area. The work area is a region where report designers can create and modify reports.
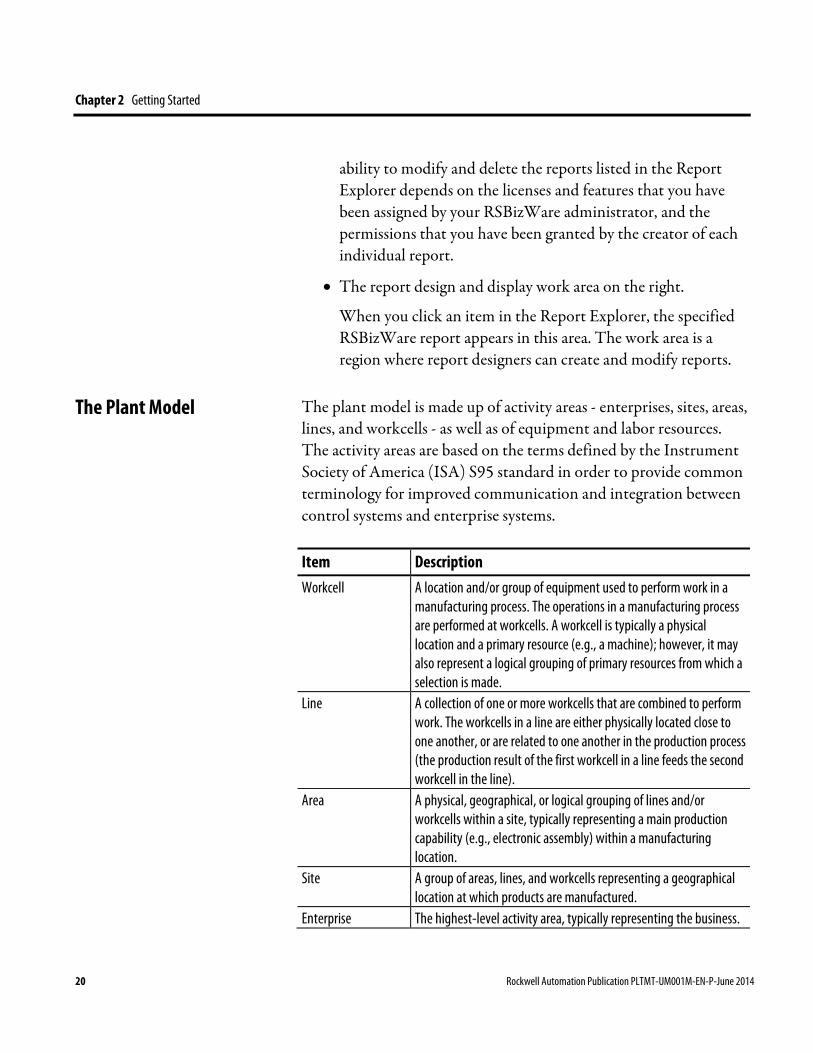
The plant model is made up of activity areas - enterprises, sites, areas, lines, and workcells - as well as of equipment and labor resources. The activity areas are based on the terms defined by the Instrument Society of America (ISA) S95 standard in order to provide common terminology for improved communication and integration between control systems and enterprise systems.
Item Description Workcell A location and/or group of equipment used to perform work in a
manufacturing process. The operations in a manufacturing process are performed at workcells. A workcell is typically a physical location and a primary resource (e.g., a machine); however, it may also represent a logical grouping of primary resources from which a selection is made.
Line A collection of one or more workcells that are combined to perform work. The workcells in a line are either physically located close to one another, or are related to one another in the production process (the production result of the first workcell in a line feeds the second workcell in the line).
Area A physical, geographical, or logical grouping of lines and/or workcells within a site, typically representing a main production capability (e.g., electronic assembly) within a manufacturing location.
Site A group of areas, lines, and workcells representing a geographical location at which products are manufactured.
Enterprise The highest-level activity area, typically representing the business.
The Plant Model
20 Rockwell Automation Publication PLTMT-UM001M-EN-P-June 2014
Getting Started Chapter 2
The plant model may be used by all RSBizWare applications in your organization (FactoryTalk Metrics, FactoryTalk Historian Classic, and FactoryTalk Scheduler). The enterprises, sites, areas, lines, and workcells in your plant model are the subjects of your performance parameter evaluation. For implementations of RSBizWare that incorporate the FactoryTalk Scheduler application, the plant model also includes capacity, which is the property of an activity area describing its availability over time. The performance parameters can also be configured for resources.
NOTE: To create and edit the plant model, you must be granted the Organize Plant Model privilege by your RSBizWare administrator. If you want to have access to sample data, see "Loading Sample Activity Areas (page 23)".
To configure the plant model in the Configuration Console:
1. On the Configure menu, click Plant Model.
The Plant Model dialog box appears.
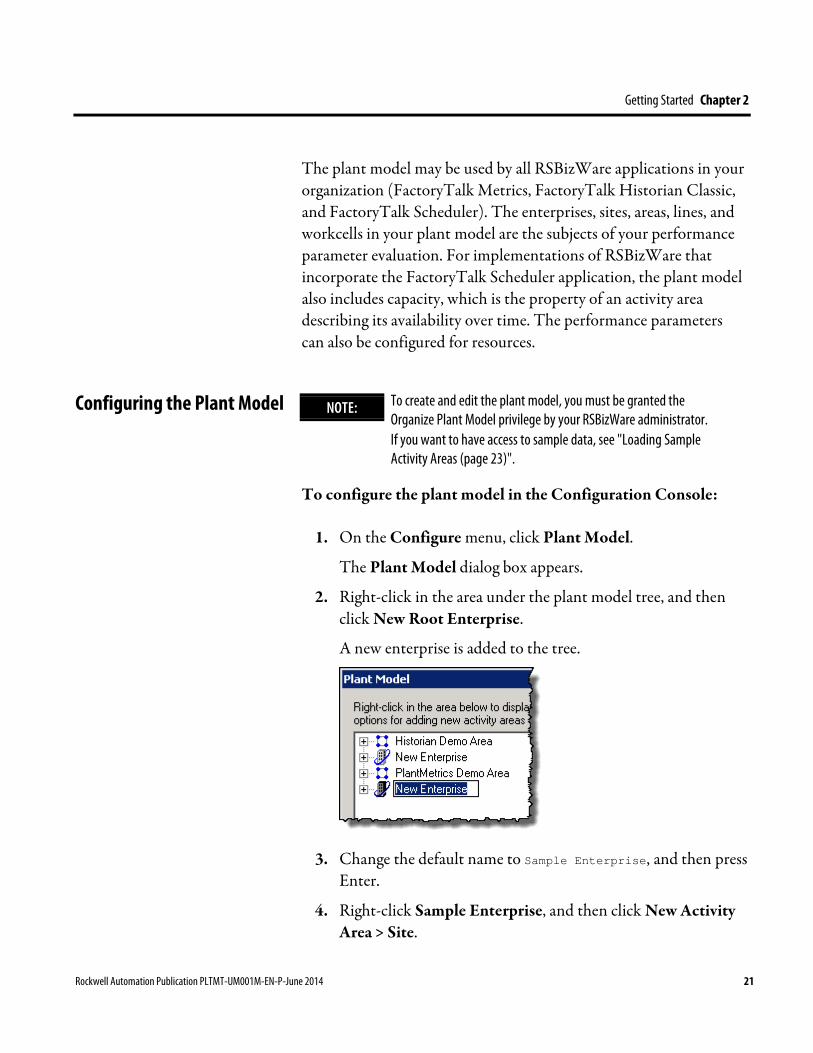
2. Right-click in the area under the plant model tree, and then click New Root Enterprise.
A new enterprise is added to the tree.
3. Change the default name to Sample Enterprise, and then press
Enter.
4. Right-click Sample Enterprise, and then click New Activity Area > Site.
Configuring the Plant Model
Rockwell Automation Publication PLTMT-UM001M-EN-P-June 2014 21

Chapter 2 Getting Started
A new site is added to the tree.
5. Change the default name to Sample Site.
6. Right-click Sample Site, and then click New Activity Area > Area.
A new area is added to the tree.
7. Change the default name to Sample Area.
8. Right-click Sample Area, and then click New Activity Area > Line.
A new line is added to the tree.
9. Change the default name to Sample Line.
10. Right-click Sample Line, and then click New Activity Area > Work Cell.
A new workcell is added to the tree.
11. Change the default name to Sample Work Cell 1.
12. Right-click each activity area that you have created, and then
click Add Capacity.
TIP The capacity of an activity area describes its availability over time. Add capacity for your activity areas so that you can associate them with time patterns.
22 Rockwell Automation Publication PLTMT-UM001M-EN-P-June 2014
Getting Started Chapter 2
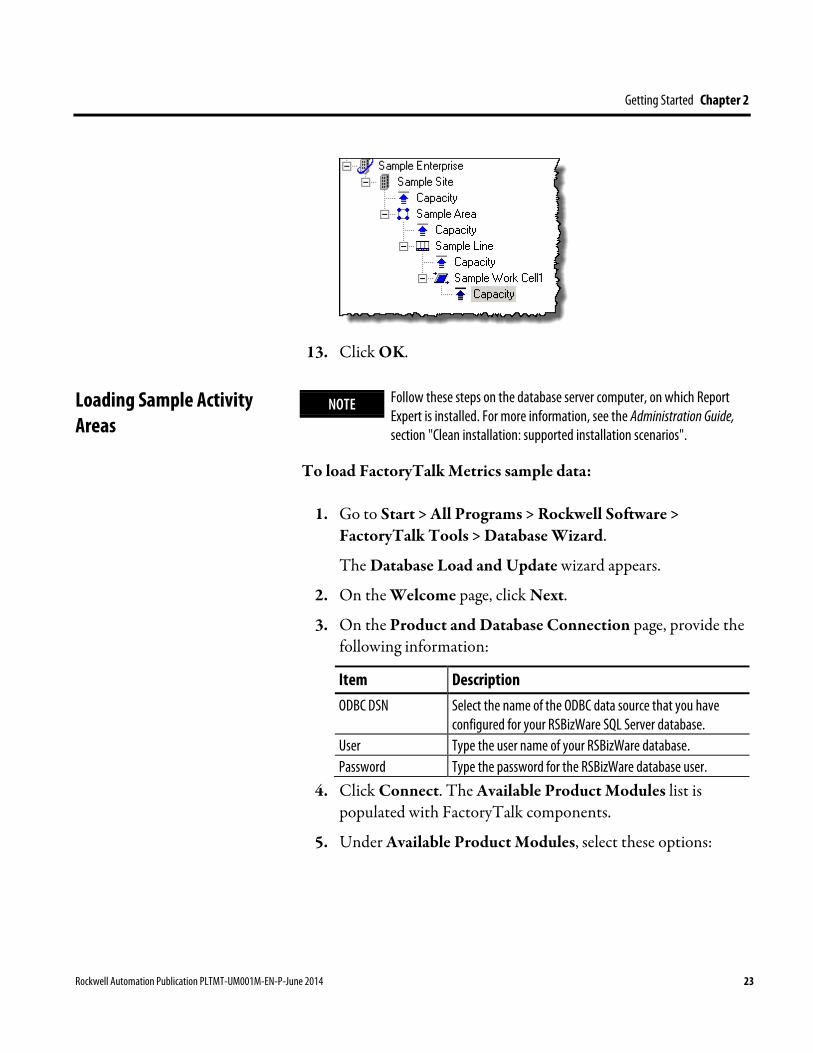
13. Click OK.
NOTE Follow these steps on the database server computer, on which Report Expert is installed. For more information, see the Administration Guide, section "Clean installation: supported installation scenarios".
To load FactoryTalk Metrics sample data:
1. Go to Start > All Programs > Rockwell Software > FactoryTalk Tools > Database Wizard.
The Database Load and Update wizard appears.
2. On the Welcome page, click Next.
3. On the Product and Database Connection page, provide the following information:
Item Description ODBC DSN Select the name of the ODBC data source that you have
configured for your RSBizWare SQL Server database. User Type the user name of your RSBizWare database. Password Type the password for the RSBizWare database user.
4. Click Connect. The Available Product Modules list is populated with FactoryTalk components.
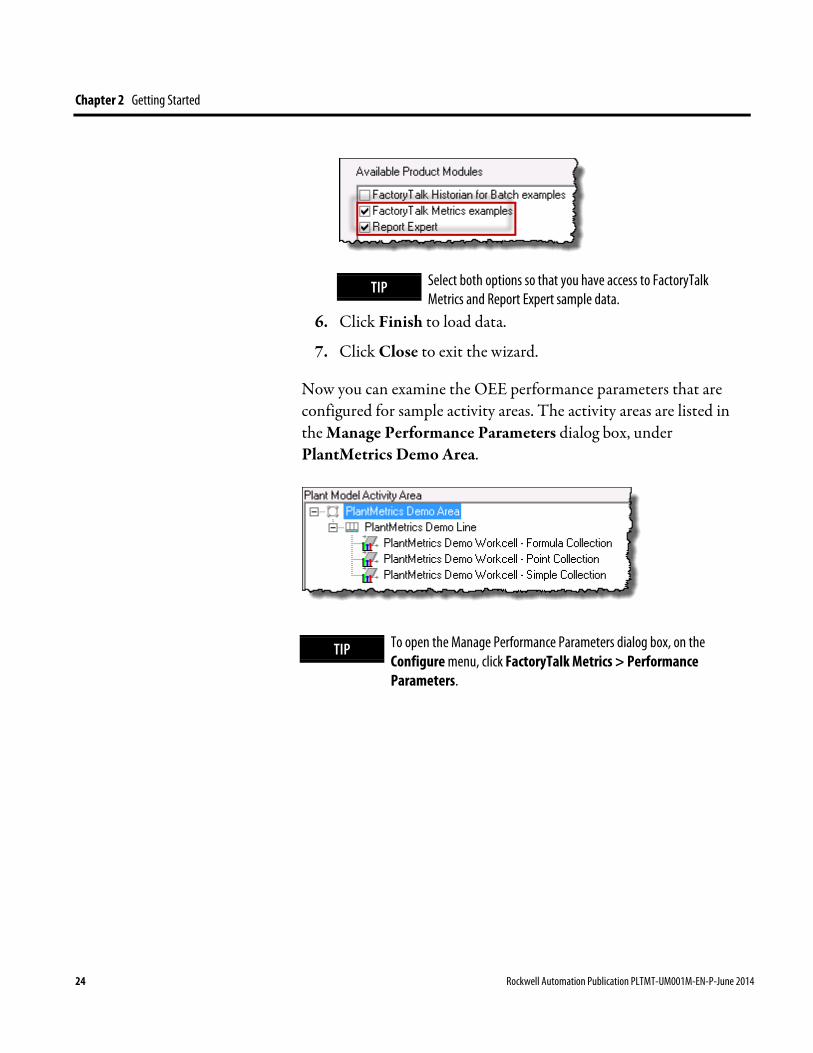
5. Under Available Product Modules, select these options:
Loading Sample Activity Areas
Rockwell Automation Publication PLTMT-UM001M-EN-P-June 2014 23
Chapter 2 Getting Started
TIP Select both options so that you have access to FactoryTalk Metrics and Report Expert sample data.
6. Click Finish to load data.
7. Click Close to exit the wizard.
Now you can examine the OEE performance parameters that are configured for sample activity areas. The activity areas are listed in the Manage Performance Parameters dialog box, under PlantMetrics Demo Area.
TIP To open the Manage Performance Parameters dialog box, on the Configure menu, click FactoryTalk Metrics > Performance Parameters.
24 Rockwell Automation Publication PLTMT-UM001M-EN-P-June 2014
Chapter 3
Collecting Performance Data
The primary functions of FactoryTalk Metrics are collecting and analyzing production data to provide performance ratings for every activity area. Before the report designer can create performance rating reports for the report user, the RSBizWare administrator must set up the application to collect data from the control system.
This chapter will help you understand the two key categories of ratings used to evaluate the performance of a production asset, and understand how to identify and configure the data points that will be used to collect the production data necessary to calculate performance ratings.
We will:
• Define the OEE and Fault Metrics ratings.
• Configure the FactoryTalk Metrics application, including plant model configuration, time pattern configuration, time pattern exception configuration, composite time pattern configuration, and performance parameter configuration.
• Start and stop data collection.
• Perform manual data collection.
The examples in "Analyzing FactoryTalk Metrics Data (page 171)" will help you understand how to analyze the data that is collected in FactoryTalk Metrics.
In version 7.0 of FactoryTalk Metrics a change was made to the way the data collection is initialized. Prior to this it was possible to have partial FactoryTalk Transaction Manager .rsl files (still stored on
Collecting Part Count Data When the Metrics Server Manager Is Stopped
Rockwell Automation Publication PLTMT-UM001M-EN-P-June 2014 25
Chapter 3 Collecting Performance Data
disk when data collection started) processed as current data values. This approach could lead to inaccurate count information being recorded in the event of a part count reset in the control system. The most serious effect of this issue was observed when the counter used in a FactoryTalk Metrics part count formula was reset, and the resulting formula evaluated to a negative number. The change required that the initial data used as a baseline for calculations all come from the same time period. In certain environments with continuous counters that do not get reset, this change could result in the loss of count data that was collected erroneously in previous versions. The data collected this way can account for part counts that were produced since the last time the Metrics server was running.
In order to accommodate customers that found this data useful, the Metrics Server Manager settings file (PlantMetricsServerSettings.xml) can be configured so that it forces the Metrics Server Manager to initialize its data in the pre-7.0 manner.
The file is located in the <ProgramFiles>\Rockwell Software\RSBizWare folder. It contains the InitializeFromSingleTimestamp tag. The tag is set by default to 1. The default value causes the Metrics Server Manager to process data in the standard way to prevent the inclusion of older data. If you change the value to 0, the Metrics Server Manager will process data regardless of its timestamp. This change may be appropriate for some production environments, but in others may lead to incorrect values being logged for count information.
For more information on the Metrics Server Manager settings file, refer to "The Metrics Server Manager settings file" in the RSBizWare Administration Guide.
26 Rockwell Automation Publication PLTMT-UM001M-EN-P-June 2014
Collecting Performance Data Chapter 3
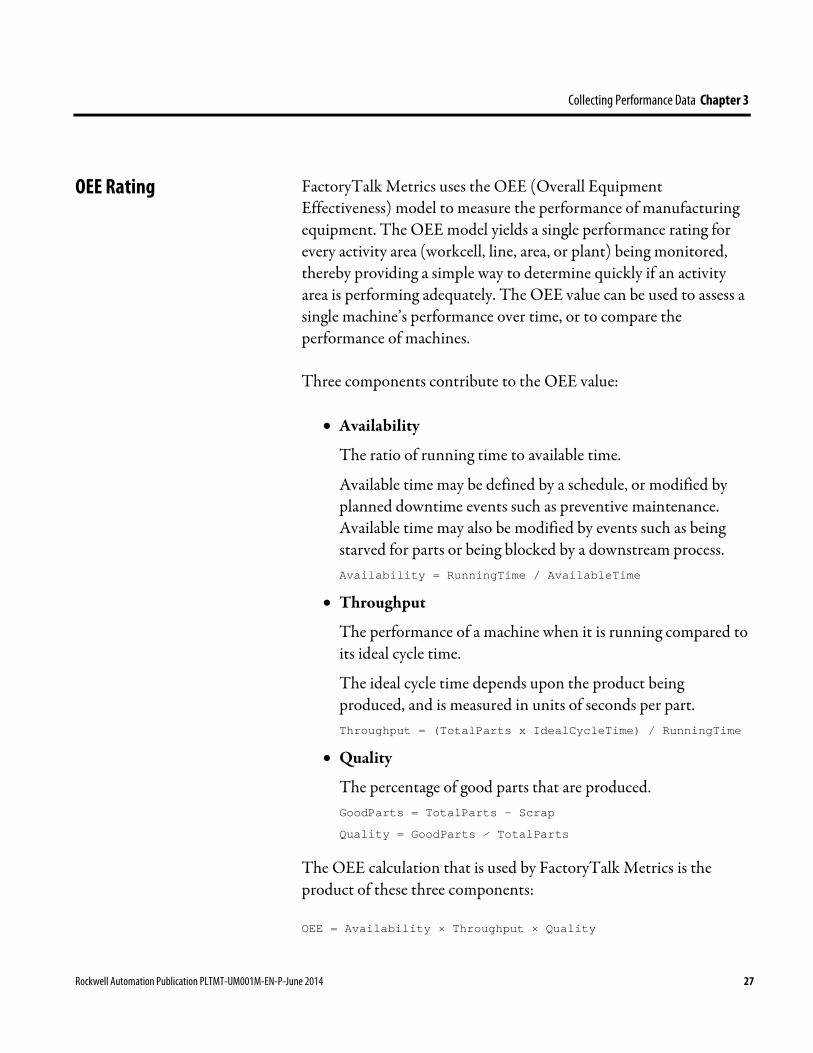
FactoryTalk Metrics uses the OEE (Overall Equipment Effectiveness) model to measure the performance of manufacturing equipment. The OEE model yields a single performance rating for every activity area (workcell, line, area, or plant) being monitored, thereby providing a simple way to determine quickly if an activity area is performing adequately. The OEE value can be used to assess a single machine’s performance over time, or to compare the performance of machines.
Three components contribute to the OEE value:
• Availability
The ratio of running time to available time.
Available time may be defined by a schedule, or modified by planned downtime events such as preventive maintenance. Available time may also be modified by events such as being starved for parts or being blocked by a downstream process. Availability = RunningTime / AvailableTime
• Throughput
The performance of a machine when it is running compared to its ideal cycle time.
The ideal cycle time depends upon the product being produced, and is measured in units of seconds per part. Throughput = (TotalParts x IdealCycleTime) / RunningTime
• Quality
The percentage of good parts that are produced. GoodParts = TotalParts – Scrap Quality = GoodParts ⁄ TotalParts
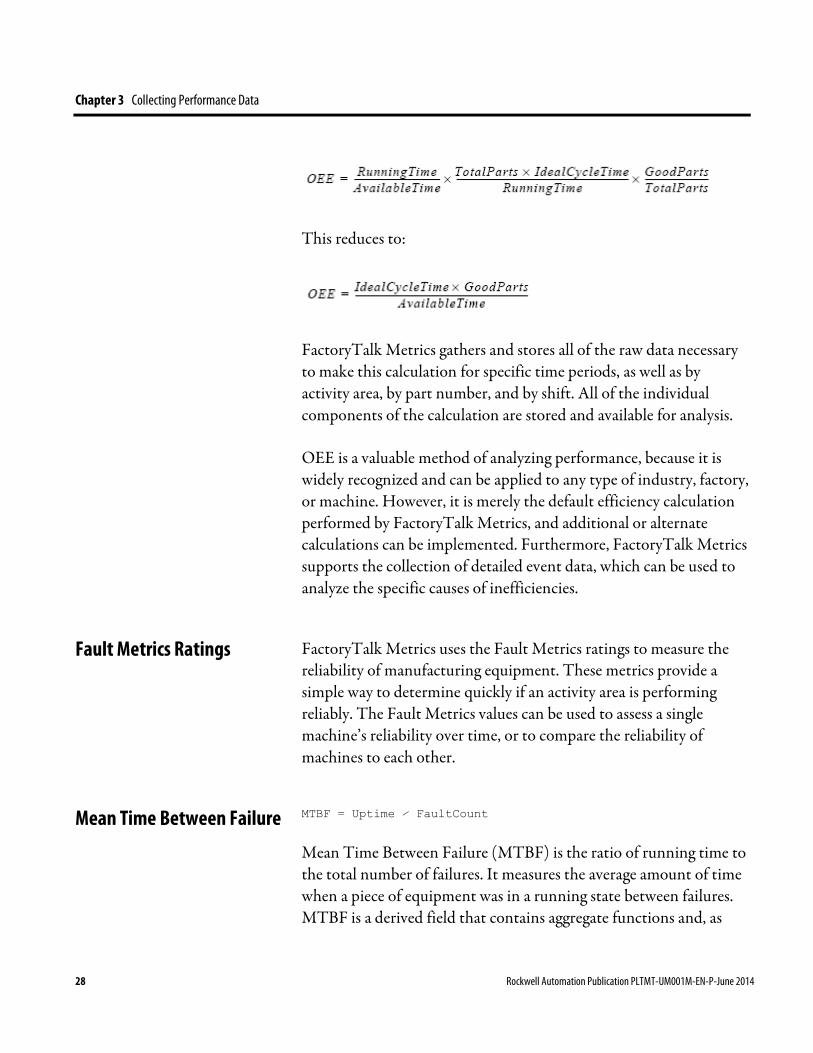
The OEE calculation that is used by FactoryTalk Metrics is the product of these three components:
OEE = Availability × Throughput × Quality
OEE Rating
Rockwell Automation Publication PLTMT-UM001M-EN-P-June 2014 27
Chapter 3 Collecting Performance Data
This reduces to:
FactoryTalk Metrics gathers and stores all of the raw data necessary to make this calculation for specific time periods, as well as by activity area, by part number, and by shift. All of the individual components of the calculation are stored and available for analysis.
OEE is a valuable method of analyzing performance, because it is widely recognized and can be applied to any type of industry, factory, or machine. However, it is merely the default efficiency calculation performed by FactoryTalk Metrics, and additional or alternate calculations can be implemented. Furthermore, FactoryTalk Metrics supports the collection of detailed event data, which can be used to analyze the specific causes of inefficiencies.
FactoryTalk Metrics uses the Fault Metrics ratings to measure the reliability of manufacturing equipment. These metrics provide a simple way to determine quickly if an activity area is performing reliably. The Fault Metrics values can be used to assess a single machine’s reliability over time, or to compare the reliability of machines to each other.
MTBF = Uptime ⁄ FaultCount
Mean Time Between Failure (MTBF) is the ratio of running time to the total number of failures. It measures the average amount of time when a piece of equipment was in a running state between failures. MTBF is a derived field that contains aggregate functions and, as
Fault Metrics Ratings
Mean Time Between Failure
28 Rockwell Automation Publication PLTMT-UM001M-EN-P-June 2014
Collecting Performance Data Chapter 3
such, can only be used in summary report objects and cannot have aggregate functions applied.
MTTR = FaultTime ⁄ FaultCount
Mean Time to Repair (MTTR) is the ratio of the time spent in a failure state to the total number of failures. It measures the average amount of time when a piece of equipment was in a failure state. MTTR is a derived field that contains aggregate functions and, as such, can only be used in summary report objects and cannot have aggregate functions applied.
NOTE To collect fault metrics for an activity area, you will need to create custom events for the workcell. For information on creating custom events, see “Viewing the Performance Parameter Events for an Activity Area (page 81)”.
FactoryTalk Metrics allows you to create time patterns that will be used to calculate the amount of available time for an activity area. The OEE calculation is based on available time, so the calculation will not be accurate unless the available time is defined accurately.
It is not necessary for you to use a time pattern to define available time for an activity area; however, if you do, the OEE calculation for the activity area will not be negatively impacted by the periods of time when the activity area is scheduled to be unavailable (e.g., weekends or evenings).
NOTE To define time patterns, configure composites, and schedule exceptions, you must be granted the Manage Time Pattern privilege by your RSBizWare administrator.
A time pattern defines the availability of an activity area over time, which repeats as necessary during the activity area schedule. We can define the following durations of repeating periods:
Mean Time To Repair
Configuring Activity Area Schedules
Time Patterns
Rockwell Automation Publication PLTMT-UM001M-EN-P-June 2014 29
Chapter 3 Collecting Performance Data
• Day
A time pattern for a 24-hour day.
• Week
A time pattern for a standard 7-day week.
• Custom
A time pattern for arbitrary duration, e.g., a 14-day cycle or an 8-hour shift.
A time pattern is composed of a default value and a series of time spans. The default value defines the value of the time pattern during intervals where no time span is specified. Each time span specifies the start time, end time, value (e.g., Available, Unavailable), and the optional report name for the span. The default value for the time pattern and the value for the time span can be a named state, a numeric value, or another time pattern. Named states are simply a set of values (e.g., 1, 0) to which you have applied descriptions (e.g., Available, Unavailable).
The sample time patterns available with FactoryTalk Metrics consist of three 8-hour shift periods, each with a 30-minute break (Unavailable), that make up the work day. The time pattern applies Monday through Friday, and the facility is closed (Unavailable) during the weekends.
The ability to reference other time patterns allows you to build time patterns from other time patterns.
In the following tutorials you will create sample shift time patterns in the Configuration Console: a Work Day time pattern that is made up of shifts, and a Work Week time pattern made up of five Work Days.
Configuring Time Patterns
30 Rockwell Automation Publication PLTMT-UM001M-EN-P-June 2014

Collecting Performance Data Chapter 3
To configure time patterns:
1. On the Configure menu, click Time Pattern.
The Time Patterns dialog box appears.
2. On the File menu, click New Folder.
A new folder is added to the Time Patterns tree.
3. Change the default name to My Time Patterns, and then press Enter.
4. Right-click My Time Patterns, and then click New Time
Pattern.
A new time pattern is added to the My Time Patterns folder.
Rockwell Automation Publication PLTMT-UM001M-EN-P-June 2014 31
Chapter 3 Collecting Performance Data
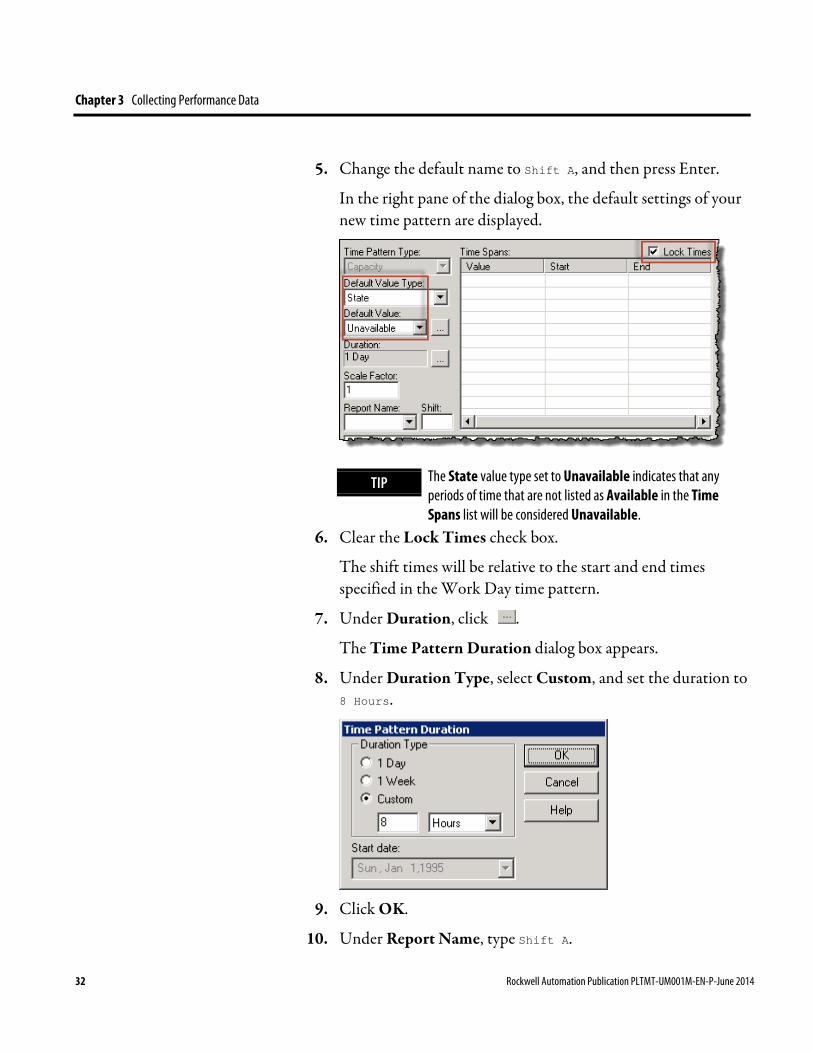
5. Change the default name to Shift A, and then press Enter.
In the right pane of the dialog box, the default settings of your new time pattern are displayed.
TIP The State value type set to Unavailable indicates that any periods of time that are not listed as Available in the Time Spans list will be considered Unavailable.
6. Clear the Lock Times check box.
The shift times will be relative to the start and end times specified in the Work Day time pattern.
7. Under Duration, click .
The Time Pattern Duration dialog box appears.
8. Under Duration Type, select Custom, and set the duration to 8 Hours.
9. Click OK.
10. Under Report Name, type Shift A.
32 Rockwell Automation Publication PLTMT-UM001M-EN-P-June 2014
Collecting Performance Data Chapter 3
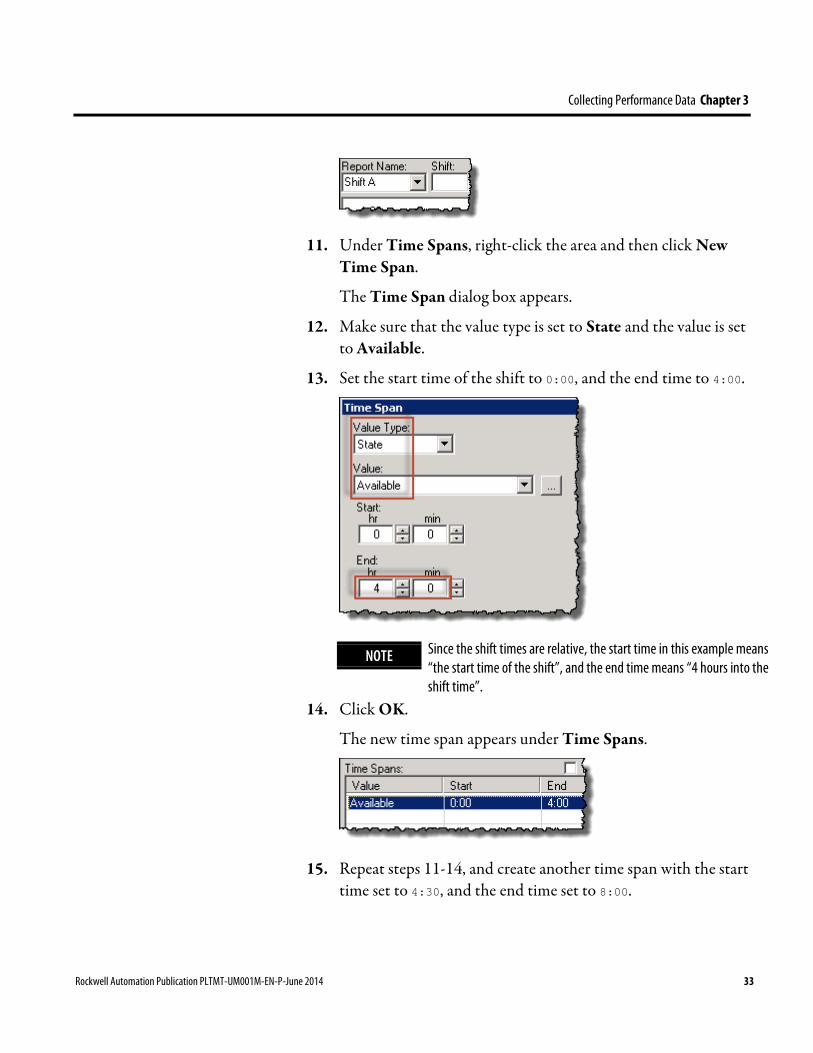
11. Under Time Spans, right-click the area and then click New
Time Span.
The Time Span dialog box appears.
12. Make sure that the value type is set to State and the value is set to Available.
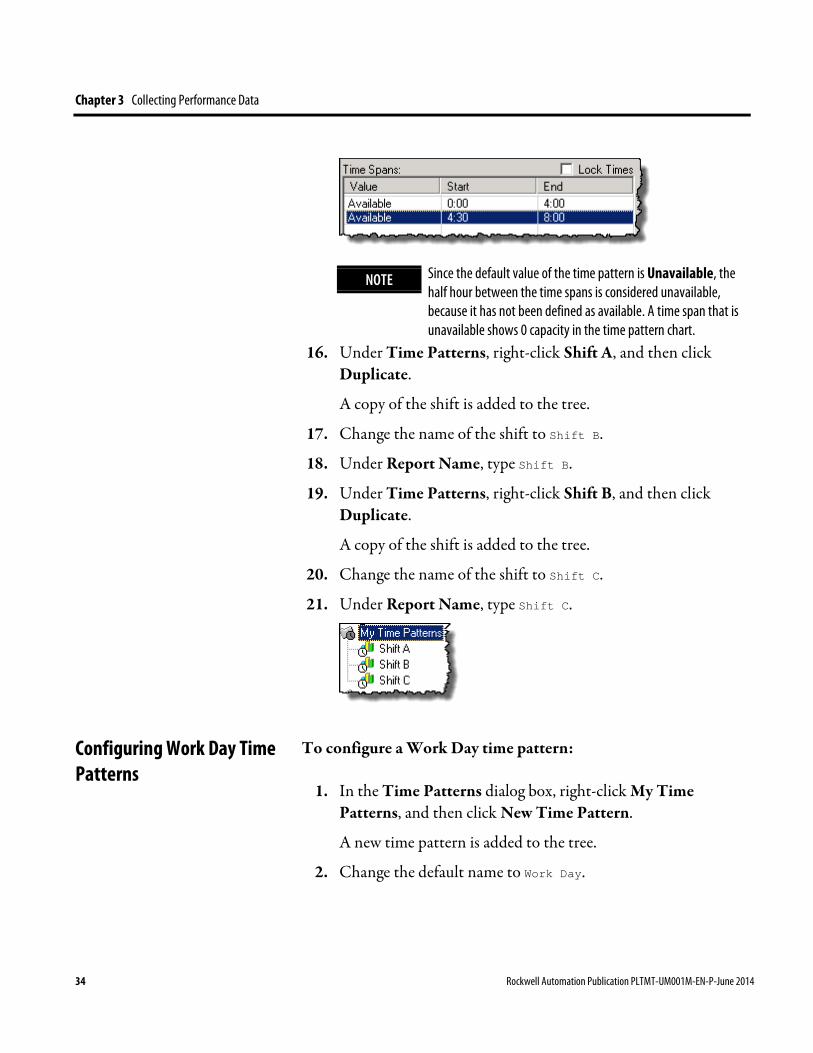
13. Set the start time of the shift to 0:00, and the end time to 4:00.
NOTE Since the shift times are relative, the start time in this example means “the start time of the shift”, and the end time means “4 hours into the shift time”.
14. Click OK.
The new time span appears under Time Spans.
15. Repeat steps 11-14, and create another time span with the start
time set to 4:30, and the end time set to 8:00.
Rockwell Automation Publication PLTMT-UM001M-EN-P-June 2014 33
Chapter 3 Collecting Performance Data
NOTE Since the default value of the time pattern is Unavailable, the half hour between the time spans is considered unavailable, because it has not been defined as available. A time span that is unavailable shows 0 capacity in the time pattern chart.
16. Under Time Patterns, right-click Shift A, and then click Duplicate.
A copy of the shift is added to the tree.
17. Change the name of the shift to Shift B.
18. Under Report Name, type Shift B.
19. Under Time Patterns, right-click Shift B, and then click Duplicate.
A copy of the shift is added to the tree.
20. Change the name of the shift to Shift C.
21. Under Report Name, type Shift C.
To configure a Work Day time pattern:
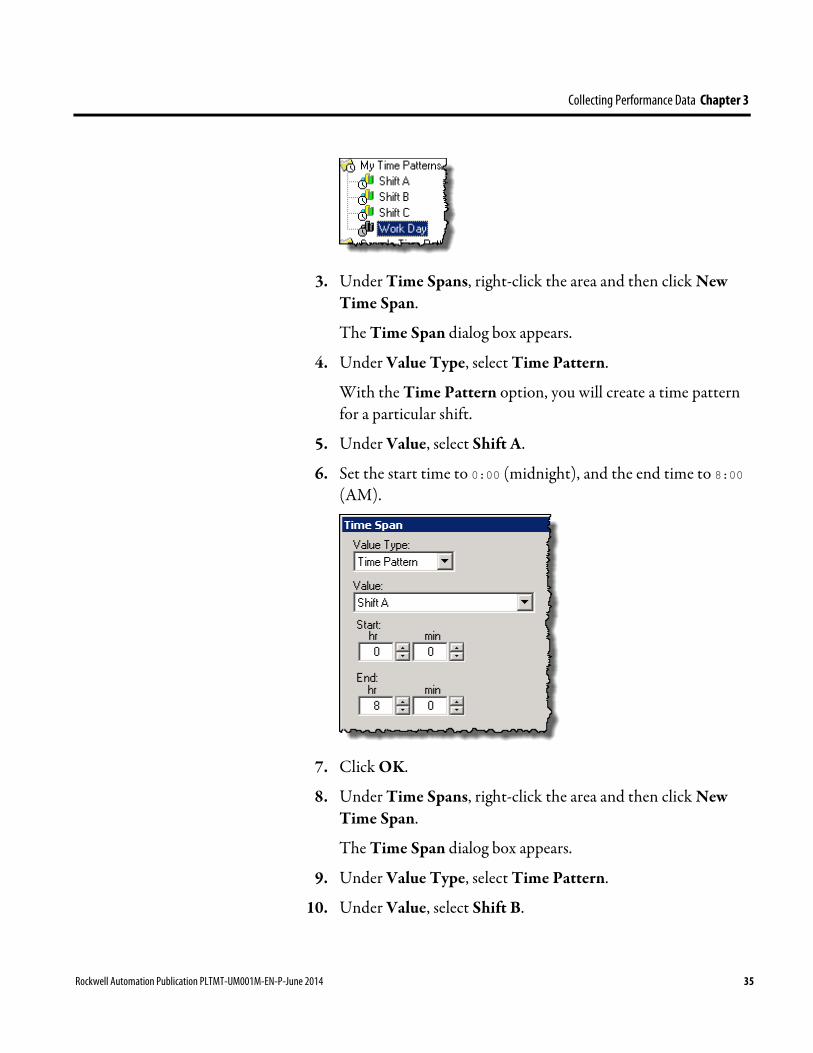
1. In the Time Patterns dialog box, right-click My Time Patterns, and then click New Time Pattern.
A new time pattern is added to the tree.
2. Change the default name to Work Day.
Configuring Work Day Time Patterns
34 Rockwell Automation Publication PLTMT-UM001M-EN-P-June 2014
Collecting Performance Data Chapter 3
3. Under Time Spans, right-click the area and then click New
Time Span.
The Time Span dialog box appears.
4. Under Value Type, select Time Pattern.
With the Time Pattern option, you will create a time pattern for a particular shift.
5. Under Value, select Shift A.
6. Set the start time to 0:00 (midnight), and the end time to 8:00 (AM).
7. Click OK.
8. Under Time Spans, right-click the area and then click New Time Span.
The Time Span dialog box appears.
9. Under Value Type, select Time Pattern.
10. Under Value, select Shift B.
Rockwell Automation Publication PLTMT-UM001M-EN-P-June 2014 35
Chapter 3 Collecting Performance Data
11. Set the start time to 8:00 (AM), and the end time to 16:00 (4 PM).
NOTE Type the time in the 24-hour format.
12. Click OK.
13. Under Time Spans, right-click the area and then click New Time Span.
The Time Span dialog box appears.
14. Under Value Type, select Time Pattern.
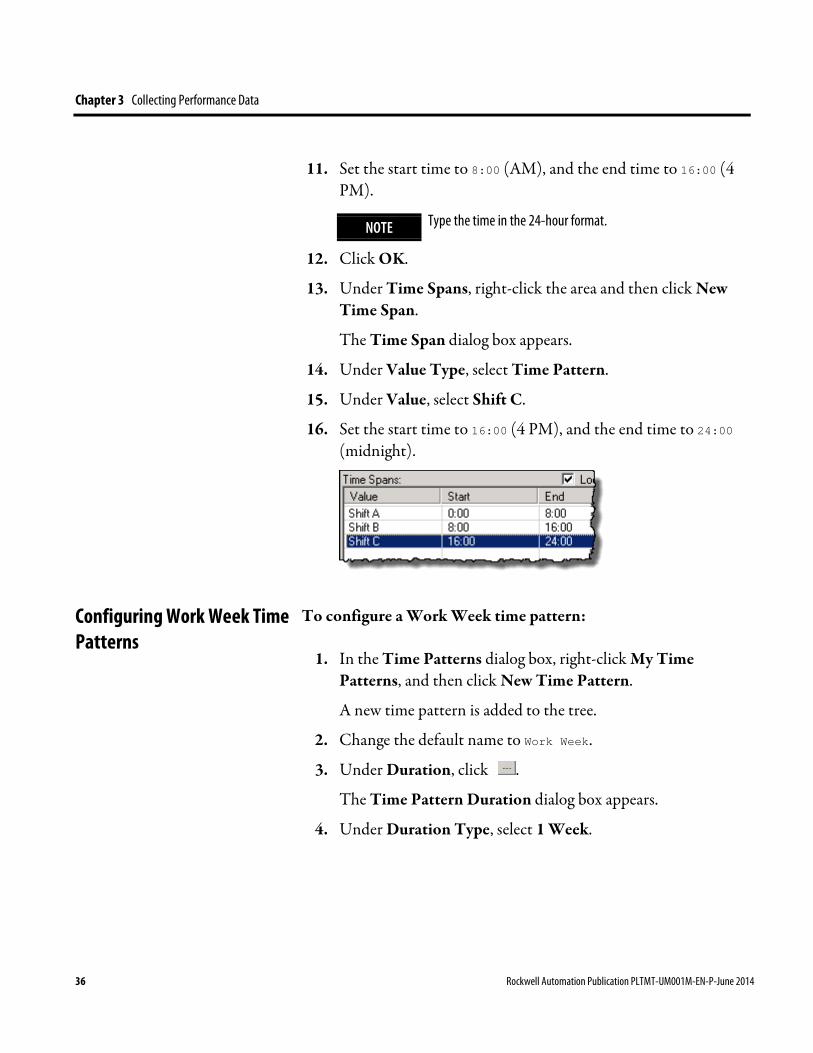
15. Under Value, select Shift C.
16. Set the start time to 16:00 (4 PM), and the end time to 24:00 (midnight).
To configure a Work Week time pattern:
1. In the Time Patterns dialog box, right-click My Time Patterns, and then click New Time Pattern.
A new time pattern is added to the tree.
2. Change the default name to Work Week.
3. Under Duration, click .
The Time Pattern Duration dialog box appears.
4. Under Duration Type, select 1 Week.
Configuring Work Week Time Patterns
36 Rockwell Automation Publication PLTMT-UM001M-EN-P-June 2014

Collecting Performance Data Chapter 3
5. Click OK.
6. Under Time Spans, right-click the area and select New Time Span.
The Time Span dialog box appears.
7. Under Value Type, select Time Pattern.
8. Under Value, select Work Day.
9. Under Start, select Monday 0:00 (Monday at midnight).
10. Under End, select Tuesday 0:00 (Tuesday at midnight).
11. Click OK.
12. Repeat steps 6-11, and create the following time spans:
Time span for Tuesday
For this item: Select: Value Type Time Pattern Value Work Day Start Tuesday 0:00 End Wednesday 0:00
Time span for Wednesday
For this item: Select: Value Type Time Pattern Value Work Day Start Wednesday 0:00 End Thursday 0:00
Rockwell Automation Publication PLTMT-UM001M-EN-P-June 2014 37

Chapter 3 Collecting Performance Data
Time span for Thursday
For this item: Select: Value Type Time Pattern Value Work Day Start Thursday 0:00 End Friday 0:00
Time span for Friday
For this item: Select: Value Type Time Pattern Value Work Day Start Friday 0:00 End Saturday 0:00
Your My Time Patterns folder should contain now the following time patterns:
A composite is a base time pattern that is associated with an activity area. A time pattern defines the normal schedule for the activity area, and a composite may have exceptions that define any changes to the normal schedule. These exceptions may be outages (unavailable times) such as holidays or planned maintenance periods, or
Composites and Schedule Exceptions
38 Rockwell Automation Publication PLTMT-UM001M-EN-P-June 2014

Collecting Performance Data Chapter 3
additional available times such as overtime hours or extended seasonal hours.
In this tutorial you will use your Work Week time pattern created in "Configuring Work Week Time Patterns (page 36)", as the base time pattern for your Sample Line and Sample Work Cell 1 created in "Configuring the Plant Model (page 21)". You will also schedule an exception for the New Year's Day.
To configure a composite and schedule exceptions:
1. On the Configure menu, click Composite Time Pattern.
The Composite Time Patterns dialog box appears.
2. Under Elements, expand the Sample Enterprise item until you get to the Sample Line item.
3. Expand Sample Line, and then click Capacity.
4. In the right pane of the dialog box, under Exceptions,
right-click the area and select New.
The Exception dialog box appears.
Configuring Composites and Schedule Exceptions
Rockwell Automation Publication PLTMT-UM001M-EN-P-June 2014 39
Chapter 3 Collecting Performance Data
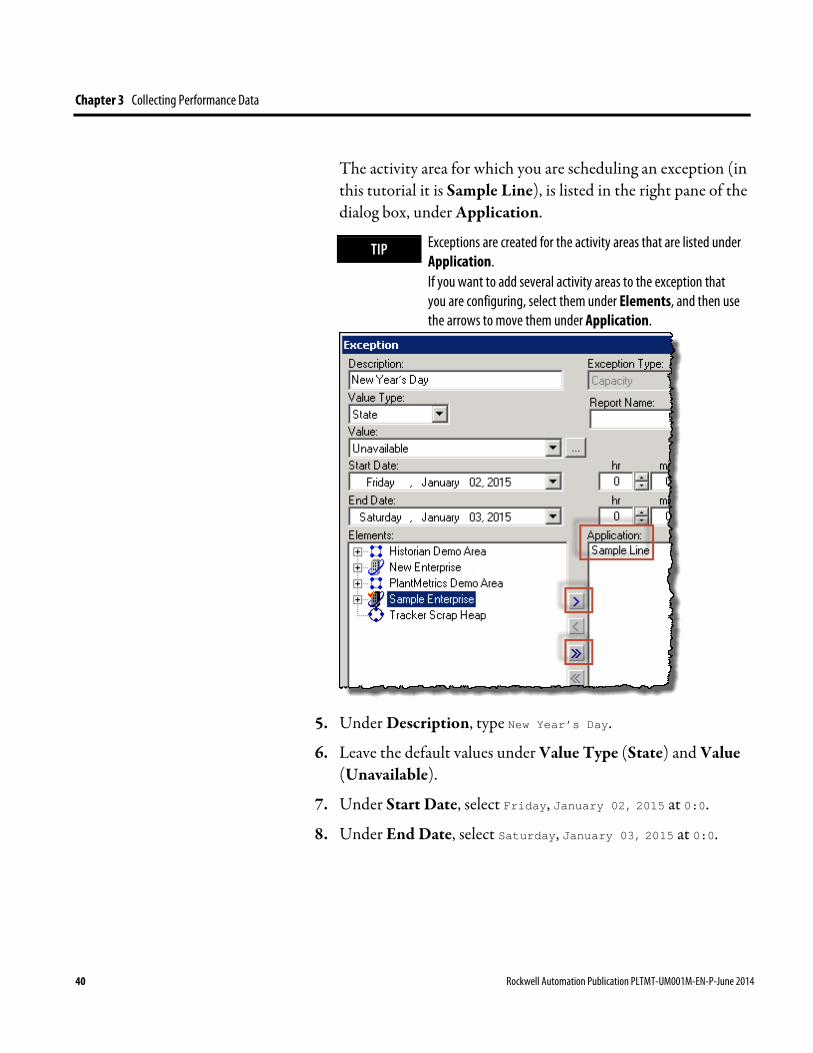
The activity area for which you are scheduling an exception (in this tutorial it is Sample Line), is listed in the right pane of the dialog box, under Application.
TIP Exceptions are created for the activity areas that are listed under Application. If you want to add several activity areas to the exception that you are configuring, select them under Elements, and then use the arrows to move them under Application.
5. Under Description, type New Year’s Day.
6. Leave the default values under Value Type (State) and Value (Unavailable).
7. Under Start Date, select Friday, January 02, 2015 at 0:0.
8. Under End Date, select Saturday, January 03, 2015 at 0:0.
40 Rockwell Automation Publication PLTMT-UM001M-EN-P-June 2014

Collecting Performance Data Chapter 3
9. Click OK.
The new exception appears under Exceptions in the Composite Time Patterns dialog box.
After you have created a plant model and a time pattern, and associated the time pattern with activity areas in the plant, you can set additional parameters that will be used to measure the OEE rating and gather custom events for these activity areas.
FactoryTalk Metrics provides a great deal of flexibility in configuring the parameters that will be used to measure the OEE rating of an activity area. At a minimum, you must provide the following information:
• The FactoryTalk Transaction Manager configuration that will be the link to the control system.
• The amount of time it should take the activity area to produce one good part (ideal cycle time).
• The control system counter keeping track of production counts.
Configuring OEE Performance Parameters For Activity Areas
Rockwell Automation Publication PLTMT-UM001M-EN-P-June 2014 41
Chapter 3 Collecting Performance Data
For more sophisticated configurations, you can define other key parameters and custom events. You can connect many of the parameters either to a data point in the control system or to a formula. Depending on the sophistication of your control system, you can use a combination of data points and formulas. This tutorial illustrates the different methods that you can use to configure performance parameters.
NOTE To configure OEE performance parameters for an activity area, you must be granted the Manage Performance Parameters privilege by your RSBizWare administrator.
Use the Configuration Console to configure the performance parameters.
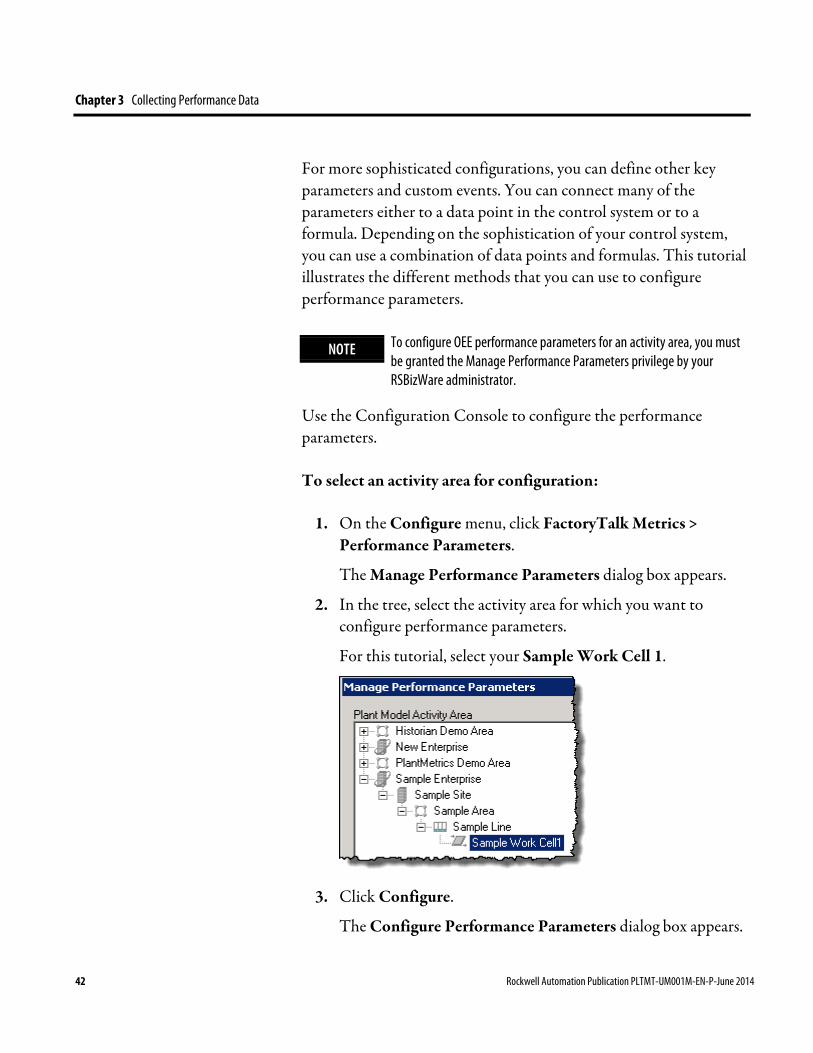
To select an activity area for configuration:
1. On the Configure menu, click FactoryTalk Metrics > Performance Parameters.
The Manage Performance Parameters dialog box appears.
2. In the tree, select the activity area for which you want to configure performance parameters.
For this tutorial, select your Sample Work Cell 1.
3. Click Configure.
The Configure Performance Parameters dialog box appears.
42 Rockwell Automation Publication PLTMT-UM001M-EN-P-June 2014

Collecting Performance Data Chapter 3
In this dialog box you can configure the parameters that will be used to collect performance data and measure the OEE rating for the activity area.
The upper section of the dialog box provides basic information on the activity area that you have selected, and the following options that you can use with your activity area:
• Enable Manual Activity Area
Select this option if you want to create a manual workcell. This indicates that the activity area can be configured without data points assigned.
For more information, refer to "Configure FactoryTalk Metrics Data Collection Parameters" in the Configuration Console Online Help.
If the FactoryTalk Transaction Manager configuration associated with this activity area is running and enabled for online edits, you can edit the performance parameters of the selected activity area without stopping the configuration. If the configuration is running and not enabled for online edits, you cannot make changes to the configuration until the configuration is stopped.
The FactoryTalk Transaction Manager Live Data Migration Tool allows you to enable configurations that are not currently enabled for online edits. For additional information about editing a running configuration and using the FactoryTalk Transaction Manager Live Data Migration Tool, refer to the Online Edits Tutorial in the FactoryTalk Transaction Manager online help.
• Enable Data Collection for this Plant Model Activity Area
Rockwell Automation Publication PLTMT-UM001M-EN-P-June 2014 43
Chapter 3 Collecting Performance Data
Select this option if you want to start the data collection for the activity area that you have selected.
NOTE Enabling the data collection for the activity area also consumes one workcell license for the Information Services Manager to which the Configuration Console is connected.
To configure the Data Collection:
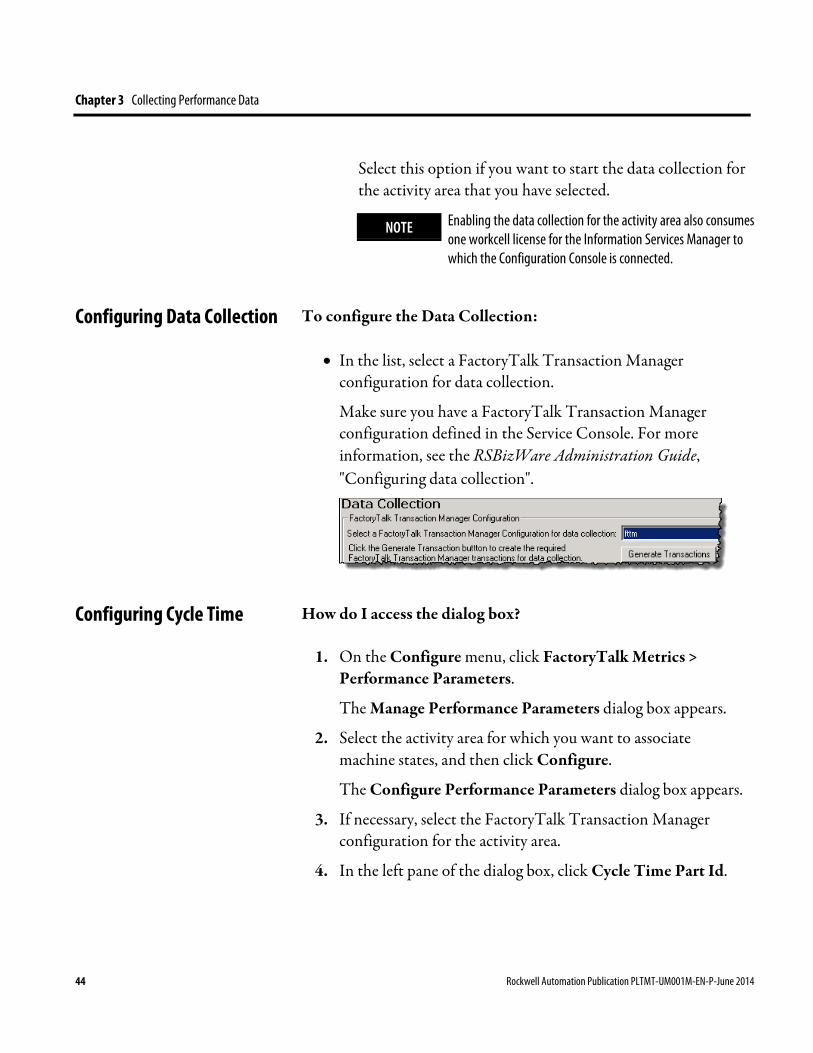
• In the list, select a FactoryTalk Transaction Manager configuration for data collection.
Make sure you have a FactoryTalk Transaction Manager configuration defined in the Service Console. For more information, see the RSBizWare Administration Guide, "Configuring data collection".
How do I access the dialog box?
1. On the Configure menu, click FactoryTalk Metrics > Performance Parameters.
The Manage Performance Parameters dialog box appears.
2. Select the activity area for which you want to associate machine states, and then click Configure.
The Configure Performance Parameters dialog box appears.
3. If necessary, select the FactoryTalk Transaction Manager configuration for the activity area.
4. In the left pane of the dialog box, click Cycle Time Part Id.
Configuring Data Collection
Configuring Cycle Time
44 Rockwell Automation Publication PLTMT-UM001M-EN-P-June 2014
Collecting Performance Data Chapter 3
The Ideal Cycle Time parameter is part of the Throughput value in the OEE equation. It indicates the time, in seconds, which the activity area should take to produce a single good part. It can have a decimal value. If the activity area produces parts faster than the ideal cycle time, the OEE rating will improve. If the activity area produces parts slower than the ideal cycle time, the OEE rating will deteriorate.
To configure the Ideal Cycle Time:
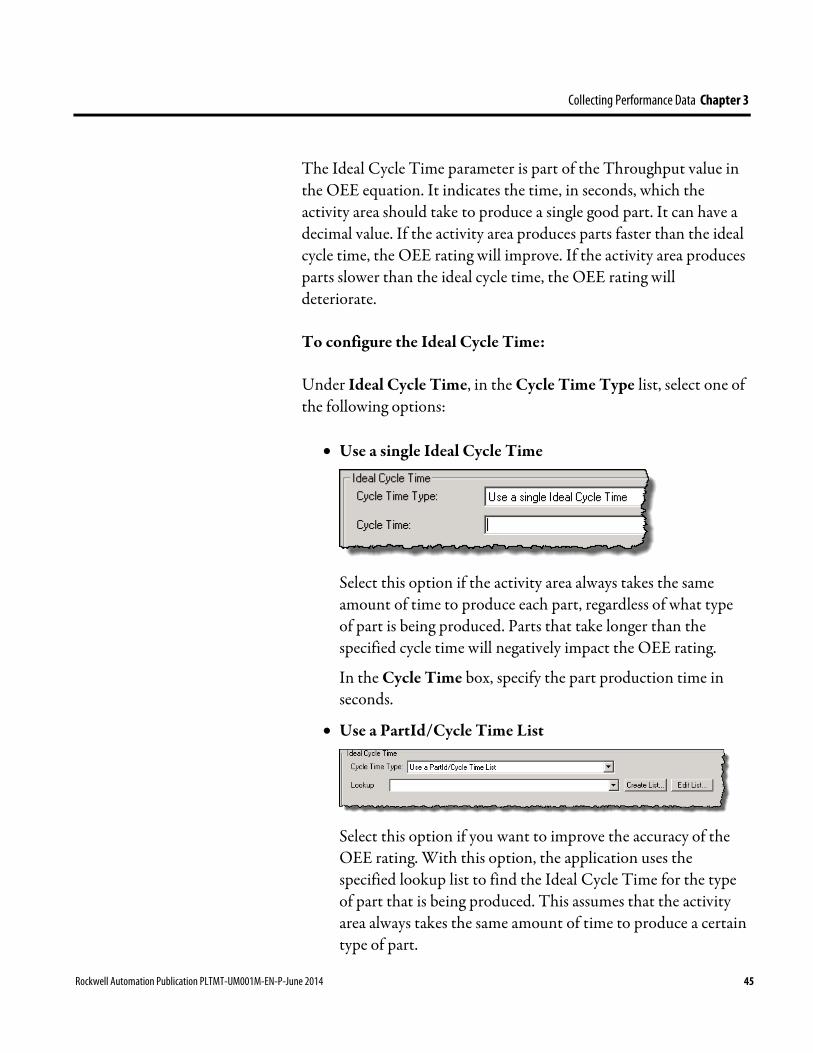
Under Ideal Cycle Time, in the Cycle Time Type list, select one of the following options:
• Use a single Ideal Cycle Time
Select this option if the activity area always takes the same amount of time to produce each part, regardless of what type of part is being produced. Parts that take longer than the specified cycle time will negatively impact the OEE rating.
In the Cycle Time box, specify the part production time in seconds.
• Use a PartId/Cycle Time List
Select this option if you want to improve the accuracy of the OEE rating. With this option, the application uses the specified lookup list to find the Ideal Cycle Time for the type of part that is being produced. This assumes that the activity area always takes the same amount of time to produce a certain type of part.
Rockwell Automation Publication PLTMT-UM001M-EN-P-June 2014 45

Chapter 3 Collecting Performance Data
In the Lookup list, select the lookup list that you want to use:
• Click Create List to create a new list.
• Click Edit List to modify the list that you have selected.
TIP For more information on creating and editing Part Id/Cycle Time lists, see "Configuring a Part ID/Cycle Time Lookup List (page 47)".
• Monitor an Unscheduled data point for Ideal Cycle Time
Select this option to obtain the most accurate ideal cycle time. With this option, the control system specifies the amount of time it should take to produce a good part.
You can either only select a data point or first select a data point as the ideal cycle time event trigger, and then set the actual ideal cycle time using a FactoryTalk Transaction Manager expression:
1. Click Select.
The Select Data Point dialog box appears.
2. Under Filtering Tools, in the FT Transaction Manager Topic/Device list, select the device from which you want to load data points.
3. At the top of the dialog box, click Refresh Points.
The Data Points area at the bottom of the dialog box is populated with data points for the selected device.
4. Double-click the data point that you want to use.
The data point appears in the Data Point box in the Configure Performance Parameters dialog box.
46 Rockwell Automation Publication PLTMT-UM001M-EN-P-June 2014
Collecting Performance Data Chapter 3
TIP To delete the data point that you have selected, click Clear.
5. (Optional) Set the actual ideal cycle time using a FactoryTalk Transaction Manager expression:
1. Select the Use a FactoryTalk Transaction Manager Expression to determine the Ideal Cycle Time value check box.
2. Click Edit.
The Expression Editor - Ideal Cycle Time Expression dialog box appears.
3. Create or modify the expression that you want to use.
If you use a FactoryTalk Transaction Manager expression, the only data point it can reference is the one that you have provided in the Data Point box.
How do I access the dialog box?
1. On the Configure menu, click FactoryTalk Metrics > Lookup Lists > Part Id/Cycle Times.
The Part Id/Cycle Time Lookup List dialog box appears.
2. Do either of the following:
• Click Add.
• Select a lookup list, and then click Edit.
The Part Id/Cycle Time List Configuration dialog box appears.
Use the Part Id/Cycle Time List Configuration dialog box to configure a Part Id/Cycle Time Lookup List and its parameters:
• Default cycle time for Total Parts.
Configuring a Part ID/Cycle Time Lookup List
Rockwell Automation Publication PLTMT-UM001M-EN-P-June 2014 47
Chapter 3 Collecting Performance Data
• Cycle times for individual Part Ids.
Click the links below to learn how to:
• Configure the default cycle time for Total Parts. (page 48)
• Configure the ideal cycle time values for individual Part Ids. (page 48)
• Manage Part Id configurations. (page 49)
• Import the cycle time values for individual Part Ids. (page 49)
To configure the default Cycle Time for Total Parts:
1. In the List Description box, type a name for the new Part Id/Cycle Time lookup list.
The name will be displayed in the Part Id/Cycle Time Lookup list in the Part Id/Cycle Time section of the Configure Performance Parameters dialog box.
2. In the Default Cycle Time box, type a value for the default cycle time for Total Parts in seconds.
To configure the Ideal Cycle Time values for individual Part Ids:
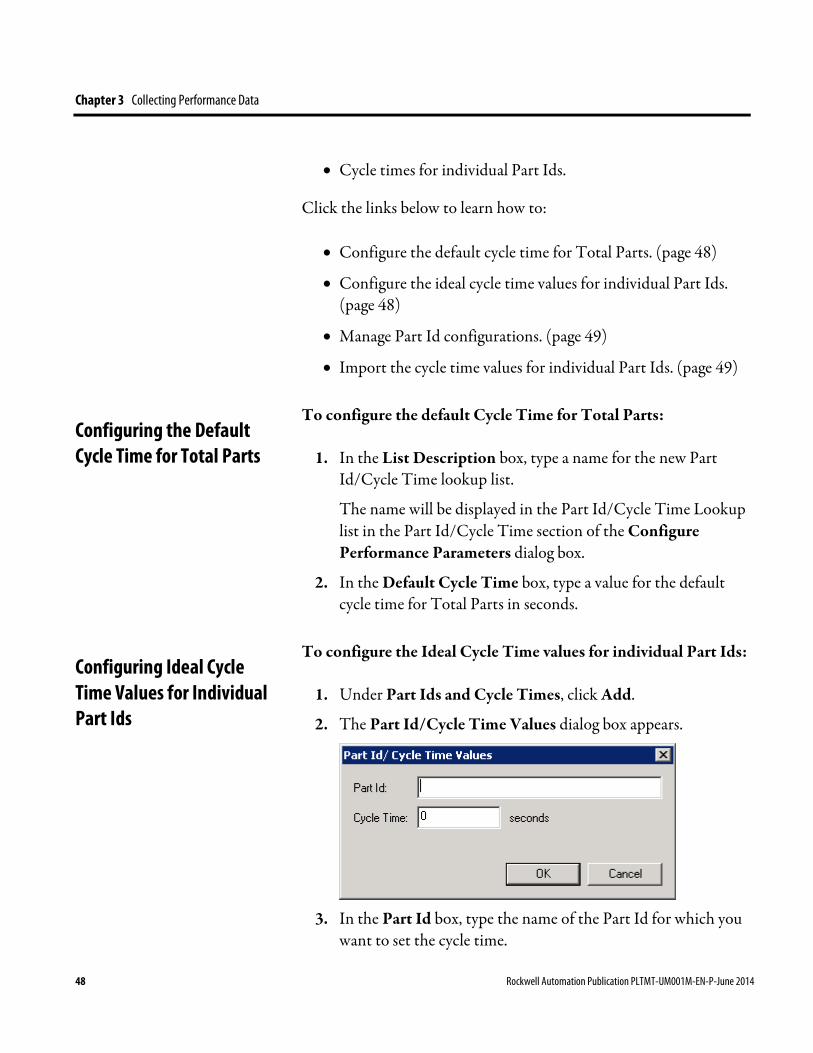
1. Under Part Ids and Cycle Times, click Add.
2. The Part Id/Cycle Time Values dialog box appears.
3. In the Part Id box, type the name of the Part Id for which you
want to set the cycle time.
Configuring the Default Cycle Time for Total Parts
Configuring Ideal Cycle Time Values for Individual Part Ids
48 Rockwell Automation Publication PLTMT-UM001M-EN-P-June 2014
Collecting Performance Data Chapter 3
4. In the Cycle Time box, type an ideal cycle time value in seconds.
5. Click OK.
The Part Id and its cycle time value appear under Part Ids and Cycle Times in the Part Id/Cycle Time List Configuration dialog box.
6. Repeat the steps for other Part Ids for which you want to set individual ideal cycle time values.
To manage Part Id configurations:
• To edit a Part Id configuration, click the Part Id item under Part Ids and Cycle Times, and then click Edit.
The Part Id/Cycle Time Values dialog box appears.
• To delete a Part Id configuration, click Delete.
To import Part Id configurations:
1. Create a text file with Part Id configurations.
2. In the file, type the data in the order in which it will be displayed in the dialog box, that is: <Part Id>,<Ideal cycle time>
3. Separate each chunk of data with a comma, for example: AAA,2
4. Save the file in the .csv format.
5. Under Previous Import File Path, click Import.
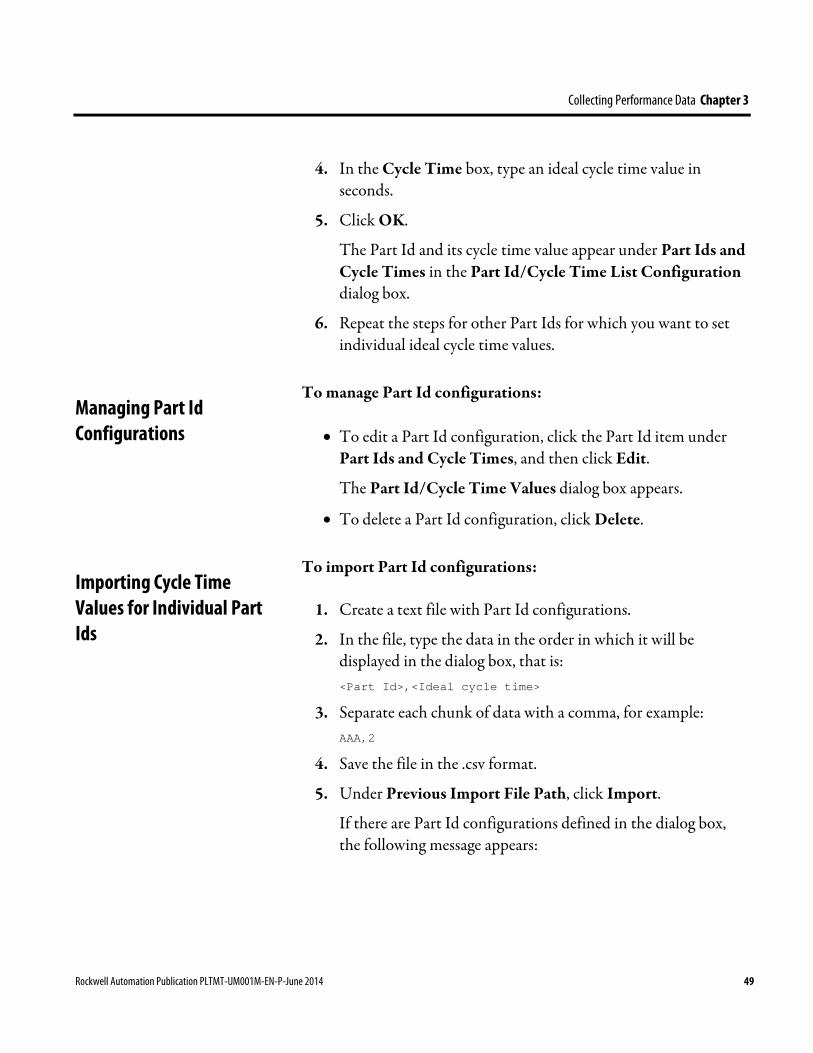
If there are Part Id configurations defined in the dialog box, the following message appears:
Managing Part Id Configurations
Importing Cycle Time Values for Individual Part Ids
Rockwell Automation Publication PLTMT-UM001M-EN-P-June 2014 49
Chapter 3 Collecting Performance Data
6. Click Yes.
The Open dialog box appears.
7. Navigate to the file that you want to import, and then click Open.
The table under Part Ids and Cycle Times is populated with the data imported from the file.
How do I access the dialog box?
1. On the Configure menu, click FactoryTalk Metrics > Performance Parameters.
The Manage Performance Parameters dialog box appears.
2. Select the activity area for which you want to associate machine states, and then click Configure.
The Configure Performance Parameters dialog box appears.
3. If necessary, select the FactoryTalk Transaction Manager configuration for the activity area.
4. In the left pane of the dialog box, click Cycle Time Part Id.
Configuring Part Id
50 Rockwell Automation Publication PLTMT-UM001M-EN-P-June 2014

Collecting Performance Data Chapter 3
The Part Id parameter tells FactoryTalk Metrics what type of part is being produced by the activity area. Changes in the Part Id value allow FactoryTalk Metrics to track what type of part is being produced. If you always know what kind of part the activity area is producing, you can obtain the OEE ratings for the activity area sorted by part.
To configure the Part Id:
Under Part Id, in the Part Id Type list, select one of the following options:
• Do not monitor Part Id
Select this option if the application does not have information about the types of parts the activity area is producing. The OEE rating for the activity area will always be based on all parts produced by the activity area.
• Use a single Part Id
Select this option if the activity area produces only one type of part, and the OEE rating for the activity area will always be associated with that particular type of part.
In the Part Id box, type the part ID.
• Monitor an Unscheduled data point for Part Id
Rockwell Automation Publication PLTMT-UM001M-EN-P-June 2014 51

Chapter 3 Collecting Performance Data
Select this option if you want to monitor a data point in the control system to determine the type of part being produced. Changes in the Part Id value allow FactoryTalk Metrics to track operation conditions to the type of part being produced. If FactoryTalk Metrics knows what kind of part the activity area is producing, you can obtain the OEE rating for the activity area when it is producing a specific type of part:
1. Click Select.
The Select Data Point dialog box appears.
2. Under Filtering Tools, in the FT Transaction Manager Topic/Device list, select the device from which you want to load data points.
3. At the top of the dialog box, click Refresh Points.
The Data Points area at the bottom of the dialog box is populated with data points for the selected device.
4. Double-click the data point that you want to use.
The data point appears in the Data Point box in the Configure Performance Parameters dialog box.
TIP To delete the data point that you have selected, click Clear.
How do I access the dialog box?
1. On the Configure menu, click FactoryTalk Metrics > Performance Parameters.
The Manage Performance Parameters dialog box appears.
2. Select the activity area for which you want to associate machine states, and then click Configure.
The Configure Performance Parameters dialog box appears.
Configuring Summarization Criteria
52 Rockwell Automation Publication PLTMT-UM001M-EN-P-June 2014
Collecting Performance Data Chapter 3
3. If necessary, select the FactoryTalk Transaction Manager configuration for the activity area.
4. In the left pane of the dialog box, click Summarization Criteria.
Summarization criteria take the form of a user-defined parameter, similar to the Shift, Part Id, and Ideal Cycle Time parameters, for which data can be collected. When the value of the parameter changes, it triggers the summarization of historical performance data for the activity area. The collected values can then be used to filter OEE performance data for the activity area. For example, if your system is configured to collect a user-defined summarization criterion called Operator ID, you will be able to calculate the OEE performance for the selected activity area when a particular operator is running this equipment.
NOTE User-defined summarization criteria are defined by the RSBizWare administrator in the Service Console.
To configure summarization criteria:
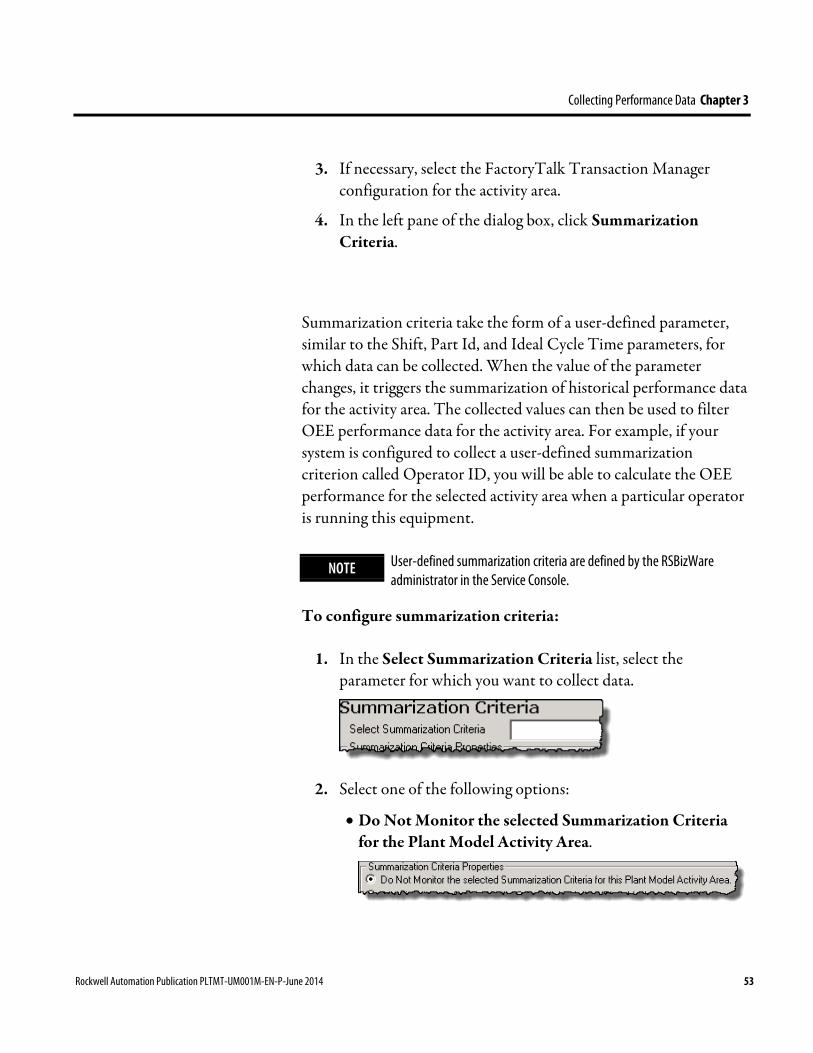
1. In the Select Summarization Criteria list, select the parameter for which you want to collect data.
2. Select one of the following options:
• Do Not Monitor the selected Summarization Criteria for the Plant Model Activity Area.
Rockwell Automation Publication PLTMT-UM001M-EN-P-June 2014 53

Chapter 3 Collecting Performance Data
Select this option if you do not want the application to collect values for this parameter. The OEE rating for the activity area will always be based on all user-defined summarization criterion values of this type.
• Specify a default Summarization Criteria Value for this Plant Model Activity Area.
Select this option if you want to set a single value for the summarization criterion. The OEE rating for the activity area will always be based on this value. For example, if a particular operator always runs this piece of equipment, you may set the Operator ID parameter as the default value.
In the Value box, type the name of the parameter that you want to use.
• Specify an Unscheduled Data Point to provide Summarization Criteria information for this Plant Model Activity Area.
Select this option if you want to monitor a data point in the control system to determine the value for the summarization criterion. Changes in the value allow FactoryTalk Metrics to track operation conditions to a specific value. For example, for the Operator ID, this would allow FactoryTalk Metrics to track which operator is running the machinery, and allow you to obtain the OEE rating for the activity area if a specific operator is running the machinery:
1. Click Select.
The Select Data Point dialog box appears.
54 Rockwell Automation Publication PLTMT-UM001M-EN-P-June 2014
Collecting Performance Data Chapter 3
2. Under Filtering Tools, in the FT Transaction Manager Topic/Device list, select the device from which you want to load data points.
3. At the top of the dialog box, click Refresh Points.
The Data Points area at the bottom of the dialog box is populated with data points for the selected device.
4. Double-click the data point that you want to use.
The data point appears in the Data Point box in the Configure Performance Parameters dialog box.
TIP To delete the data point that you have selected, click Clear.
How do I access the dialog box?
1. On the Configure menu, click FactoryTalk Metrics > Performance Parameters.
The Manage Performance Parameters dialog box appears.
2. Select the activity area for which you want to associate machine states, and then click Configure.
The Configure Performance Parameters dialog box appears.
3. If necessary, select the FactoryTalk Transaction Manager configuration for the activity area.
4. In the left pane of the dialog box, click Part Count.
The Part Count parameter is part of the Throughput value in the OEE equation. It indicates how many parts have been produced by the activity area. FactoryTalk Metrics compares the rate of items produced to the value given for the ideal cycle time, so the unit of measure is not important (however, it must be the same unit of measure as the ideal cycle time).
Configuring Part Count
Rockwell Automation Publication PLTMT-UM001M-EN-P-June 2014 55
Chapter 3 Collecting Performance Data
It is important to make sure that the total part counter and the good/bad part counter fire at the same time (e.g., when the part leaves the activity area). If the total part counter fires when a part arrives, but the good/bad part counter does not fire until the part leaves, the two part counters may be incremented in different summarization periods, resulting in misleading part counts in reports.
To configure the Part Count parameter:
1. Click the tab for the type of part count you want to collect:
• Total Part Count
• Good Part Count, or
• Scrap/Bad Part Count
NOTE It is not necessary to collect all three count values; however, at the minimum, you must collect either of the following: • The good part count. • The total part count and scrap/bad count (from
which the good part count can be calculated). For activity areas configured as manual activity areas, you do not have to collect any part counts (i.e., Total, Good, Scrap/Bad).
TIP The options listed in all three tabs are identical for all part count types.
2. Select one of the following options to indicate how FactoryTalk Metrics should determine the number of parts of the selected type (total, good, or scrap/bad) that the activity area has produced:
• This Part Count Type is not in use.
56 Rockwell Automation Publication PLTMT-UM001M-EN-P-June 2014
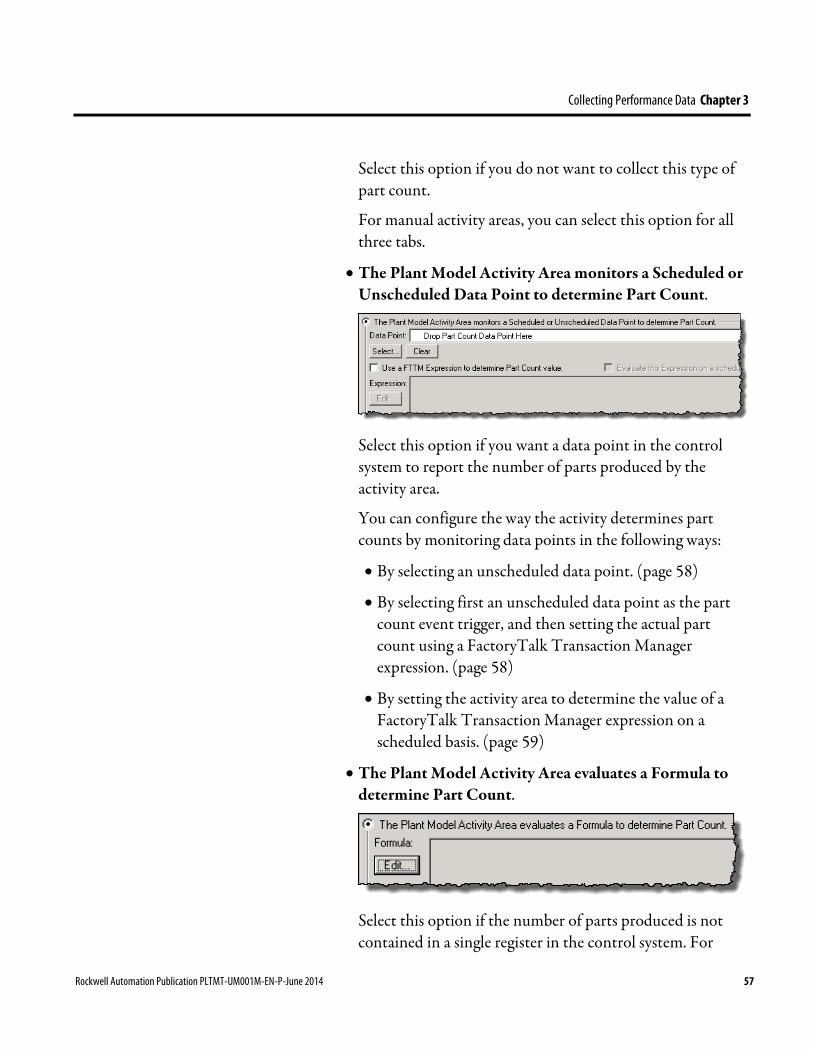
Collecting Performance Data Chapter 3
Select this option if you do not want to collect this type of part count.
For manual activity areas, you can select this option for all three tabs.
• The Plant Model Activity Area monitors a Scheduled or Unscheduled Data Point to determine Part Count.
Select this option if you want a data point in the control system to report the number of parts produced by the activity area.
You can configure the way the activity determines part counts by monitoring data points in the following ways:
• By selecting an unscheduled data point. (page 58)
• By selecting first an unscheduled data point as the part count event trigger, and then setting the actual part count using a FactoryTalk Transaction Manager expression. (page 58)
• By setting the activity area to determine the value of a FactoryTalk Transaction Manager expression on a scheduled basis. (page 59)
• The Plant Model Activity Area evaluates a Formula to determine Part Count.
Select this option if the number of parts produced is not contained in a single register in the control system. For
Rockwell Automation Publication PLTMT-UM001M-EN-P-June 2014 57
Chapter 3 Collecting Performance Data
example, if the activity area for which you configure performance parameters is actually two separate physical machines, you can create a formula to add the part counts from the two machines, in order to create a single good part count.
Click Edit to define the formula (page 60).
To use an unscheduled Data Point:
1. Click Select.
The Select Data Point dialog box appears.
2. Under Filtering Tools, in the FT Transaction Manager Topic/Device list, select the device from which you want to load data points.
3. At the top of the dialog box, click Refresh Points.
The Data Points area at the bottom of the dialog box is populated with data points for the selected device.
4. Double-click the data point that you want to use.
The data point appears in the Data Point box in the Configure Performance Parameters dialog box.
TIP To delete the data point that you have selected, click Clear.
To set the actual Part Count using an unscheduled Data Point and a FactoryTalk Transaction Manager expression:
1. Choose an unscheduled data point. (page 58)
2. Check the Use a FTTM Expression to determine Part Count value option.
Configuring Part Count Using an Unscheduled Data Point
Configuring Part Count Using an Unscheduled Data Point and a FTTM Expression
58 Rockwell Automation Publication PLTMT-UM001M-EN-P-June 2014
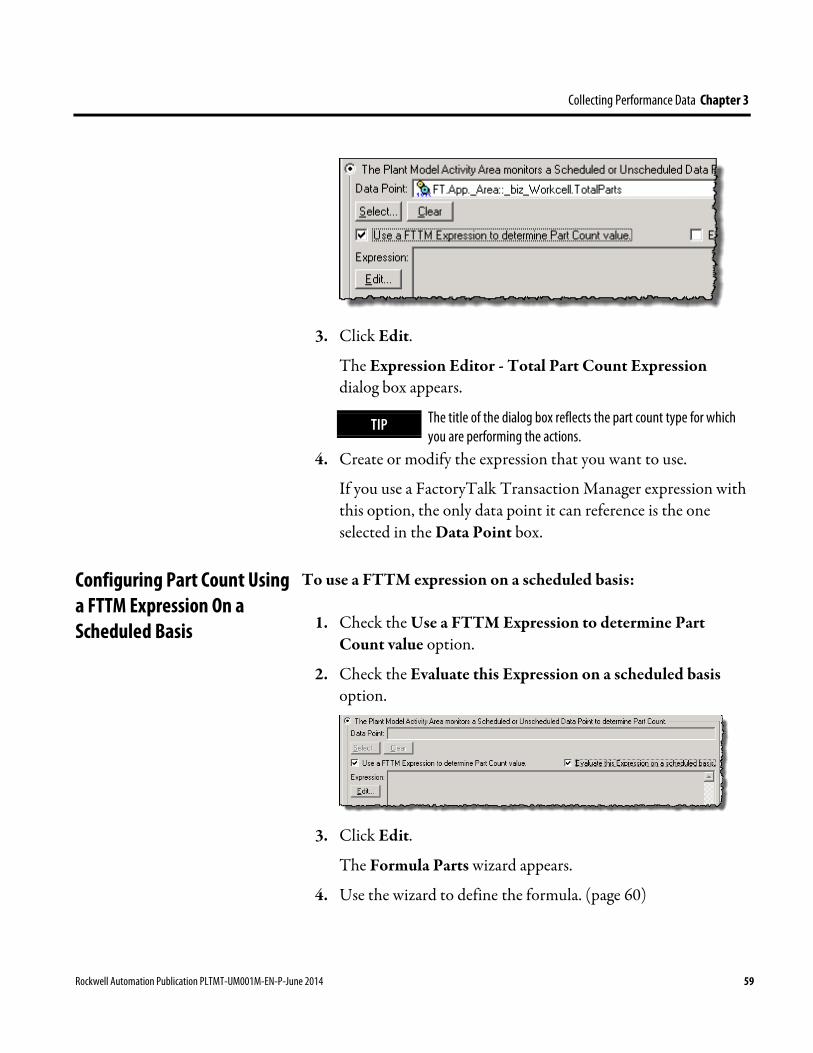
Collecting Performance Data Chapter 3
3. Click Edit.
The Expression Editor - Total Part Count Expression dialog box appears.
TIP The title of the dialog box reflects the part count type for which you are performing the actions.
4. Create or modify the expression that you want to use.
If you use a FactoryTalk Transaction Manager expression with this option, the only data point it can reference is the one selected in the Data Point box.
To use a FTTM expression on a scheduled basis:
1. Check the Use a FTTM Expression to determine Part Count value option.
2. Check the Evaluate this Expression on a scheduled basis option.
3. Click Edit.
The Formula Parts wizard appears.
4. Use the wizard to define the formula. (page 60)
Configuring Part Count Using a FTTM Expression On a Scheduled Basis
Rockwell Automation Publication PLTMT-UM001M-EN-P-June 2014 59

Chapter 3 Collecting Performance Data
How do I access the dialog box?
1. In the left pane of the Configure Performance Parameters dialog, click Part Count.
2. Click the Total Part Count, Good Part Count, or Scrap/Bad Part Count tab.
3. Click The Plant Model Activity Area evaluates a Formula to determine Part Count.
4. Click Edit.
The performance parameter formulas are used to perform an advanced calculation for an OEE Performance Parameter. They consist of Boolean or arithmetic operations that are applied to data point values. A formula can be based on operations against multiple data points, so the collection of data from a formula allows you to collect more specific information about your activity area.
To configure a formula:
1. In the Formula Parts wizard, click Add >.
Configuring a Formula
60 Rockwell Automation Publication PLTMT-UM001M-EN-P-June 2014
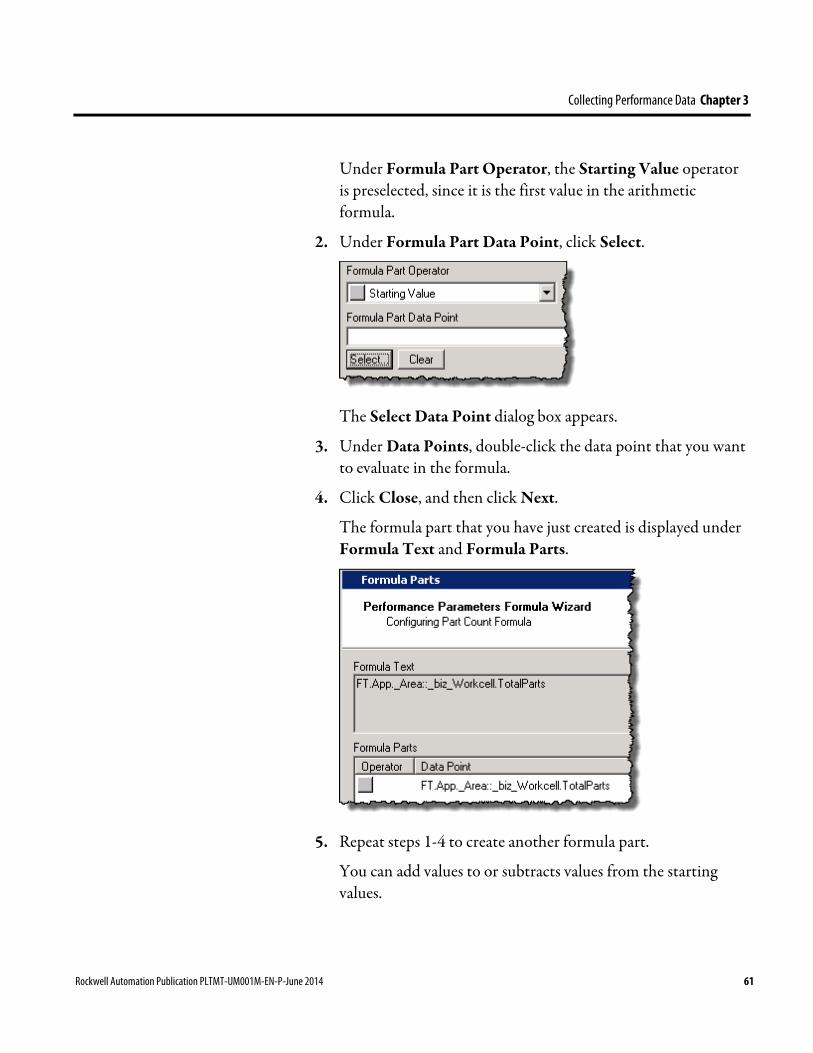
Collecting Performance Data Chapter 3
Under Formula Part Operator, the Starting Value operator is preselected, since it is the first value in the arithmetic formula.
2. Under Formula Part Data Point, click Select.
The Select Data Point dialog box appears.
3. Under Data Points, double-click the data point that you want to evaluate in the formula.
4. Click Close, and then click Next.
The formula part that you have just created is displayed under Formula Text and Formula Parts.
5. Repeat steps 1-4 to create another formula part.
You can add values to or subtracts values from the starting values.
Rockwell Automation Publication PLTMT-UM001M-EN-P-June 2014 61
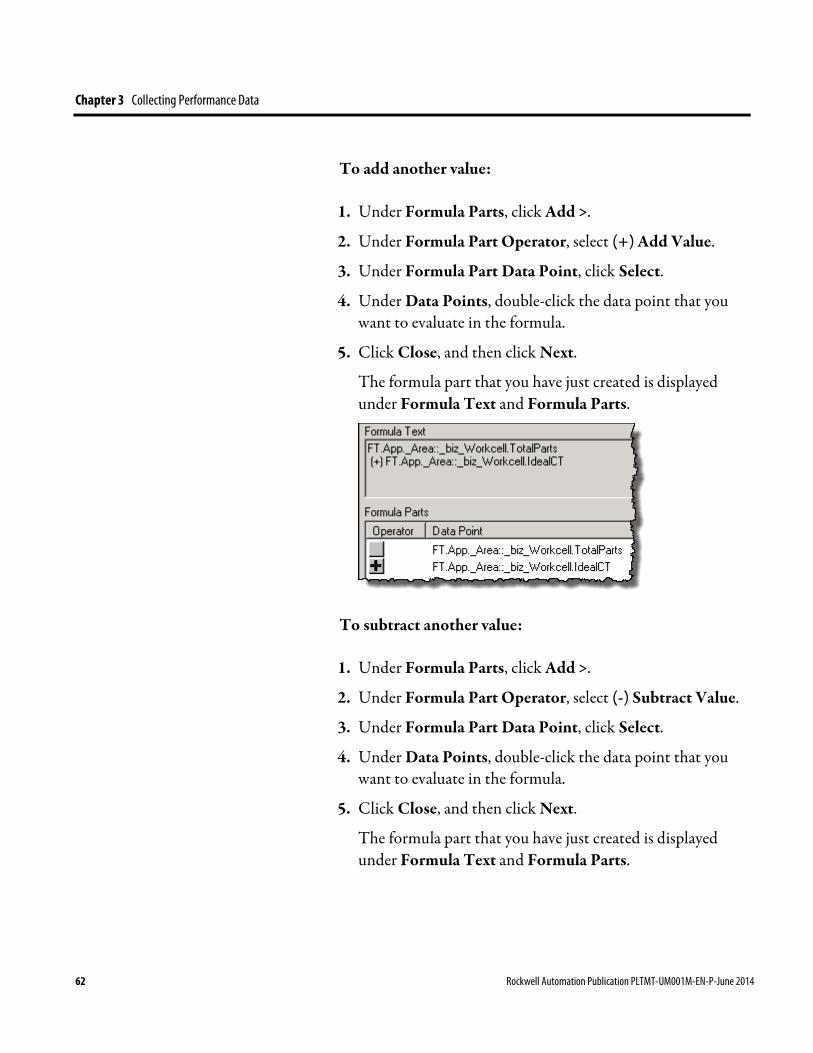
Chapter 3 Collecting Performance Data
To add another value:
1. Under Formula Parts, click Add >.
2. Under Formula Part Operator, select (+) Add Value.
3. Under Formula Part Data Point, click Select.
4. Under Data Points, double-click the data point that you want to evaluate in the formula.
5. Click Close, and then click Next.
The formula part that you have just created is displayed under Formula Text and Formula Parts.
To subtract another value:
1. Under Formula Parts, click Add >.
2. Under Formula Part Operator, select (-) Subtract Value.
3. Under Formula Part Data Point, click Select.
4. Under Data Points, double-click the data point that you want to evaluate in the formula.
5. Click Close, and then click Next.
The formula part that you have just created is displayed under Formula Text and Formula Parts.
62 Rockwell Automation Publication PLTMT-UM001M-EN-P-June 2014

Collecting Performance Data Chapter 3
6. Click Finish.
The formula is added to the Configure Performance Parameters dialog box.
Availability is the ratio of running time to available time, and is a key component of the OEE formula.
Availability = Running Time / Available Time
Available Time is also one of the three variables in the OEE calculation itself:
OEE = (Good Part Count x Ideal Cycle Time) / Available Time
The calculation of Available Time is very important to get accurate OEE data. The fundamental issue is to determine when a machine (activity area) should be producing and when it should not. Some companies count all shift time as available time, so any non-productive time, no matter what the cause, is considered lost capacity and reduces OEE. Others exclude some types of non-productive time from the total available time, which results in higher overall OEE values. This is not done to inflate OEE scores, but to more accurately determine how efficiently the machine is performing. Such exclusions can include:
Availability
Rockwell Automation Publication PLTMT-UM001M-EN-P-June 2014 63
Chapter 3 Collecting Performance Data
• Scheduled breaks, meetings, etc.
• Planned maintenance.
• External conditions that prevent the machine from working, such as being starved or blocked.
In FactoryTalk Metrics, Available Time is the result of two other measures: Scheduled Availability and Monitored Availability.
Scheduled Availability is the expected availability that results from a predictable shift schedule (including exceptions such as meetings or planned maintenance).
Monitored Availability is the determination of machine availability based on the real-time events that are occurring on the plant floor (such as blocked/starved). Monitored Availability may override Scheduled Availability to make a machine unavailable when it would be available otherwise.
Because collecting accurate Available Time is so important, there are several options within FactoryTalk Metrics for configuring both Scheduled Availability and Monitored Availability. In addition, overall Available Time can be configured to accumulate when both the Scheduled Availability and Monitored Availability conditions are true, or when only one of them is true. The methods used for determining Available Time are configured separately for each activity area.
The following approaches can be used to determine if a machine is available:
• Defining a schedule (time pattern), which defines specific periods of available and unavailable time that repeat into the future, and which is subject to exceptions like holidays or scheduled maintenance activities.
64 Rockwell Automation Publication PLTMT-UM001M-EN-P-June 2014
Collecting Performance Data Chapter 3
• Combining a time pattern optionally with Monitored Availability, so that a control system condition can override the predetermined schedule. This is how dynamic conditions such as blocked and starved are commonly handled.
The Monitored Availability may be determined by:
• A control system condition.
This may be the state of a single data point or the resolution of a complex expression or formula involving one or more data points.
• The current state of the machine.
When machine states are configured, there is an option to specify whether that state indicates that the activity area is available or not available.
• Collecting shift information, scheduled availability information, or both from the control system. If shift schedules change frequently, this option is more flexible than using a time pattern. Using this method, both shift information and an optional Scheduled Availability value are collected from the control system and used to define availability.
How do I access the dialog box?
1. On the Configure menu, click FactoryTalk Metrics > Performance Parameters.
The Manage Performance Parameters dialog box appears.
2. Select the activity area for which you want to associate machine states, and then click Configure.
The Configure Performance Parameters dialog box appears.
3. If necessary, select the FactoryTalk Transaction Manager configuration for the activity area.
Configuring Scheduled Availability
Rockwell Automation Publication PLTMT-UM001M-EN-P-June 2014 65
Chapter 3 Collecting Performance Data
4. In the left pane of the dialog box, click Scheduled Availability.
The Scheduled Availability parameter is part of the Availability value in the OEE equation. It indicates when the activity area is supposed to be available to produce parts.
Scheduled Availability and Monitored Availability are used together to determine the availability (page 63) component of the OEE equation and to accumulate available time. Together, these values indicate when the activity area is supposed to be available to produce parts and define shift information. Scheduled Availability provides the basic availability information for the activity area, and provides the shift information. This is most commonly done by means of a fixed and repeating time pattern.
To configure Scheduled Availability:
Select one of the following options to indicate how FactoryTalk Metrics should determine when the activity area is available to produce parts:
• The Plant Model Activity Area is scheduled to be available at all times.
Select this option if the activity area runs 24 hours a day, seven days a week, or you intend to rely on the Monitored Availability to determine the availability.
With this option selected, it is difficult to determine when the activity area is actually available. As a result, non-production time (e.g., weekends) may cause the OEE rating of the activity area to be artificially low.
66 Rockwell Automation Publication PLTMT-UM001M-EN-P-June 2014
Collecting Performance Data Chapter 3
Since no shift information is collected, the reporting by shift is not allowed.
• Collect Scheduled Availability information from the control system.
Select this option if shift schedule changes on the site are frequent and variable.
With this option selected, both shift information and an optional Scheduled Availability value are collected from the control system and used to define availability.
You can configure the option in the following ways:
• Select a data point to monitor for Shift information.
The data point should be an unscheduled numeric data point that will contain the current shift number:
1. Click Select.
The Select Data Point dialog box appears.
2. Under Filtering Tools, in the FT Transaction Manager Topic/Device list, select the device from which you want to load data points.
3. At the top of the dialog box, click Refresh Points.
The Data Points area at the bottom of the dialog box is populated with data points for the selected device.
Rockwell Automation Publication PLTMT-UM001M-EN-P-June 2014 67

Chapter 3 Collecting Performance Data
4. Double-click the data point that you want to use.
The data point appears in the Data Point box in the Configure Performance Parameters dialog box.
TIP To delete the data point that you have selected, click Clear.
• Select a lookup list to provide a description for the numeric shift value collected from the control system.
Select the lookup list that you want to use:
• Click New to create a new list.
• Click Edit to modify the list that you have selected.
TIP For more information on creating and editing the Shift Description Lookup lists, see "Create Shift Description Lookup Lists (page 71)".
• (Optional.) Select a data point to monitor for Scheduled Availability.
1. Click Select.
The Select Data Point dialog box appears.
2. Under Filtering Tools, in the FT Transaction Manager Topic/Device list, select the device from which you want to load data points.
3. At the top of the dialog box, click Refresh Points.
The Data Points area at the bottom of the dialog box is populated with data points for the selected device.
4. Double-click the data point that you want to use.
68 Rockwell Automation Publication PLTMT-UM001M-EN-P-June 2014
Collecting Performance Data Chapter 3
The data point appears in the Data Point box in the Configure Performance Parameters dialog box.
TIP To delete the data point that you have selected, click Clear.
If no data point is selected, the scheduled availability will be determined from the current shift.
If the optional data point for the scheduled availability is selected, that is the only value used to determine the state of the scheduled availability.
If only the Shift Id data point is selected, the plant model activity area will be considered to be scheduled available when the Shift Id value indicates that a shift is currently active.
The value collected for Shift Id is interpreted as an integer value.
A positive value indicates that the plant model activity area is in an active shift.
A zero or negative value indicates that the plant model activity area is out of shift.
Any time that it is in an active shift is considered to be scheduled available, and any out-of-shift time is scheduled unavailable.
• A configured Capacity Time Pattern specifies the Plant Model Activity Area’s Scheduled Availability and Capacity state.
Select this option to define when the activity area is scheduled to be available. If the availability of the activity area is based on a time pattern, the OEE rating of the activity area will not be
Rockwell Automation Publication PLTMT-UM001M-EN-P-June 2014 69

Chapter 3 Collecting Performance Data
negatively affected by time periods that are scheduled as unavailable (e.g., weekends, evenings).
Click one the available buttons to access the respective editors that you can use to create or modify composites, exceptions, or time patterns:
• Click Composite to assign time patterns and exceptions to activity areas.
• Click Exception to define availability exceptions and apply them to appropriate activity areas.
• Click Pattern to define repeating time patterns of available time, unavailable time, and shifts.
If a site changes shift schedules frequently, the Collect Scheduled Availability information from the control system option is more flexible than using a time pattern.
The following table illustrates how data collection will behave for different configurations of Shift Id and Scheduled Availability.
Shift Data Point Value
Scheduled Available Data Point Value
Scheduled Availability Accumulating
Shift information that is written to the database
Value > 0 Not Selected Yes > 0 value with description.
Value is 0 Not Selected No
If previous shift value > 0 then -1 * previous Shift value. Otherwise, -1 for shift number with no shift description.
Value < 0 Not Selected No < 0 value for shift number with no shift description. Value > 0 Value is not 0 Yes > 0 value with description. Value > 0 Value is 0 No > 0 value with description.
Value is 0 Value is not 0 Yes
If previous shift value > 0 then -1 * previous Shift value. Otherwise, -1 for shift number with no shift description
Value is 0 Value is 0 No If previous shift value > 0 then -1 * previous Shift value. Otherwise, -1 for shift number with no shift
70 Rockwell Automation Publication PLTMT-UM001M-EN-P-June 2014

Collecting Performance Data Chapter 3
Shift Data Point Value
Scheduled Available Data Point Value
Scheduled Availability Accumulating
Shift information that is written to the database description.
Value < 0 Value is not 0 Yes < 0 value for shift number with no shift description. Value < 0 Value is 0 No < 0 value for shift number with no shift description.
How do I access the dialog box?
1. In the left pane of the Configure Performance Parameters dialog box, click Scheduled Availability.
2. Click Collect Scheduled Availability information from the control system.
3. Under Select a lookup list to provide a description for the numeric shift value collected from the control system, click Create.
When a value is collected for Shift Id from the control system, that value is numeric and can be associated with a text value to be used as the Shift Description. For example, the collected Shift Id value of 1 may be associated with a Shift Description of “Shift 1 Crew A”. The associated shift description values are stored in lookup lists.
To configure a Shift Description lookup list:
1. In the Lookup Code Description box, type a name for the Shift Description lookup list.
2. Under Lookup Code Values, click Add.
The Shift Description Lookup Code Value dialog box appears.
3. In the Value box, type a value.
4. In the Description box, type a description of the value.
Creating Shift Description Lookup Lists
Rockwell Automation Publication PLTMT-UM001M-EN-P-June 2014 71
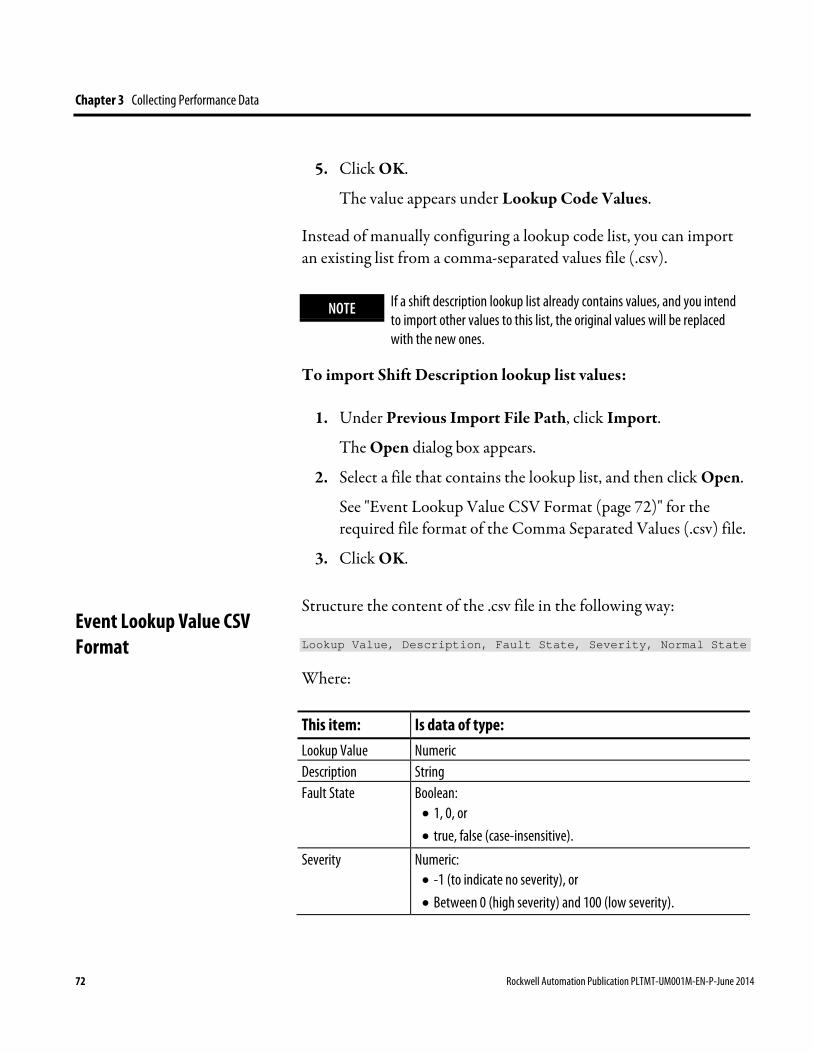
Chapter 3 Collecting Performance Data
5. Click OK.
The value appears under Lookup Code Values.
Instead of manually configuring a lookup code list, you can import an existing list from a comma-separated values file (.csv).
NOTE If a shift description lookup list already contains values, and you intend to import other values to this list, the original values will be replaced with the new ones.
To import Shift Description lookup list values:
1. Under Previous Import File Path, click Import.
The Open dialog box appears.
2. Select a file that contains the lookup list, and then click Open.
See "Event Lookup Value CSV Format (page 72)" for the required file format of the Comma Separated Values (.csv) file.
3. Click OK.
Structure the content of the .csv file in the following way:
Lookup Value, Description, Fault State, Severity, Normal State
Where:
This item: Is data of type: Lookup Value Numeric Description String Fault State Boolean:
• 1, 0, or • true, false (case-insensitive).
Severity Numeric: • -1 (to indicate no severity), or • Between 0 (high severity) and 100 (low severity).
Event Lookup Value CSV Format
72 Rockwell Automation Publication PLTMT-UM001M-EN-P-June 2014

Collecting Performance Data Chapter 3
This item: Is data of type: Normal State Boolean:
• 1, 0, or • true, false (case-insensitive).
How do I access the dialog box?
1. On the Configure menu, click FactoryTalk Metrics > Performance Parameters.
The Manage Performance Parameters dialog box appears.
2. Select the activity area for which you want to associate machine states, and then click Configure.
The Configure Performance Parameters dialog box appears.
3. If necessary, select the FactoryTalk Transaction Manager configuration for the activity area.
4. In the left pane of the dialog box, click Monitored Availability.
The Monitored Availability parameter is part of the Availability value in the OEE equation. The parameter indicates when the activity area is actually available to produce parts. While the activity area may be scheduled to be available at a specified time, it may not actually be available at that time. An example of this is when the activity area is scheduled to be available, but is not able to work, because it is waiting for parts from an upstream process. Using the Monitored Availability parameter helps understand which machine in the facility really causes the problems. For the Monitored Availability parameters you can create Boolean formulas.
The benefit of using Monitored Availability to determine the available time for an activity area is more accurate efficiency measurements. For example, even though an activity area can be
Configuring Monitored Availability
Rockwell Automation Publication PLTMT-UM001M-EN-P-June 2014 73
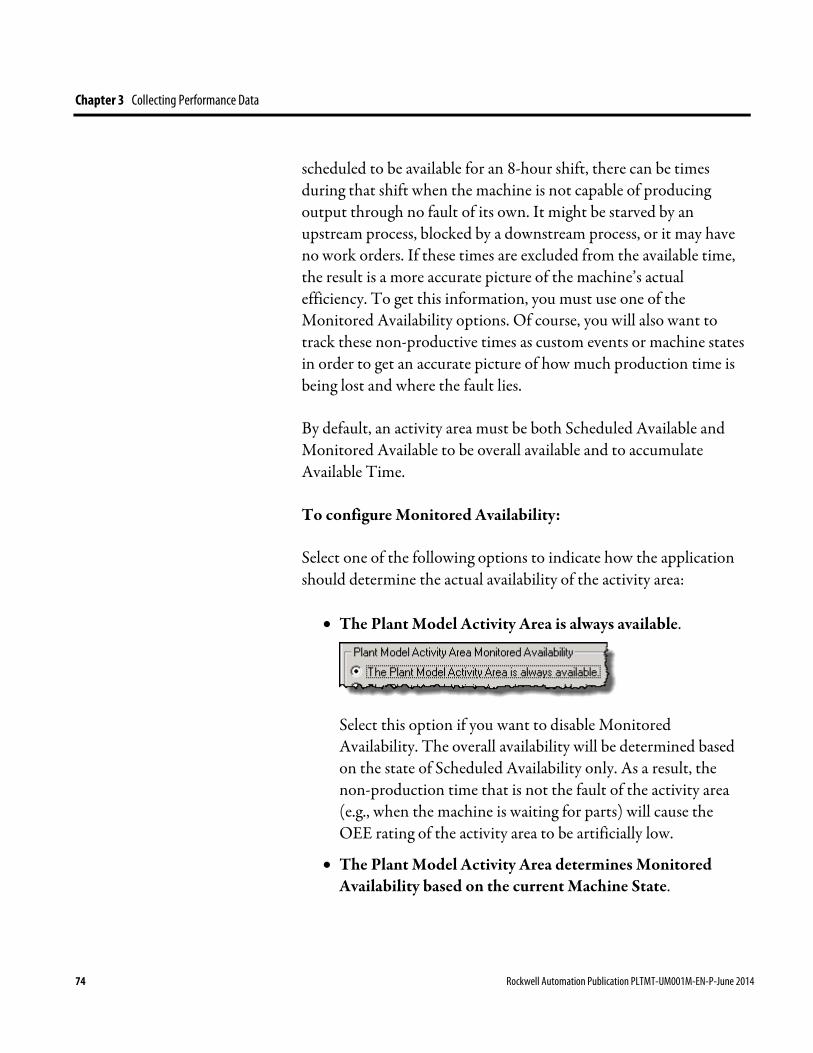
Chapter 3 Collecting Performance Data
scheduled to be available for an 8-hour shift, there can be times during that shift when the machine is not capable of producing output through no fault of its own. It might be starved by an upstream process, blocked by a downstream process, or it may have no work orders. If these times are excluded from the available time, the result is a more accurate picture of the machine’s actual efficiency. To get this information, you must use one of the Monitored Availability options. Of course, you will also want to track these non-productive times as custom events or machine states in order to get an accurate picture of how much production time is being lost and where the fault lies.
By default, an activity area must be both Scheduled Available and Monitored Available to be overall available and to accumulate Available Time.
To configure Monitored Availability:
Select one of the following options to indicate how the application should determine the actual availability of the activity area:
• The Plant Model Activity Area is always available.
Select this option if you want to disable Monitored Availability. The overall availability will be determined based on the state of Scheduled Availability only. As a result, the non-production time that is not the fault of the activity area (e.g., when the machine is waiting for parts) will cause the OEE rating of the activity area to be artificially low.
• The Plant Model Activity Area determines Monitored Availability based on the current Machine State.
74 Rockwell Automation Publication PLTMT-UM001M-EN-P-June 2014
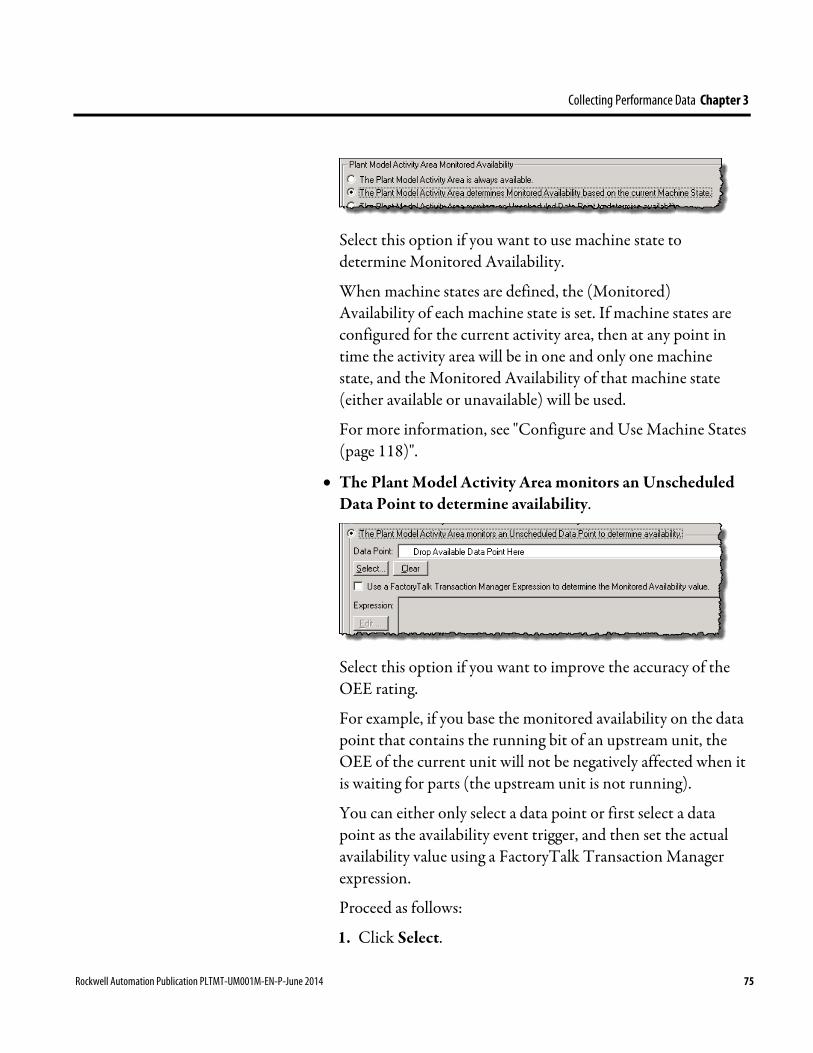
Collecting Performance Data Chapter 3
Select this option if you want to use machine state to determine Monitored Availability.
When machine states are defined, the (Monitored) Availability of each machine state is set. If machine states are configured for the current activity area, then at any point in time the activity area will be in one and only one machine state, and the Monitored Availability of that machine state (either available or unavailable) will be used.
For more information, see "Configure and Use Machine States (page 118)".
• The Plant Model Activity Area monitors an Unscheduled Data Point to determine availability.
Select this option if you want to improve the accuracy of the OEE rating.
For example, if you base the monitored availability on the data point that contains the running bit of an upstream unit, the OEE of the current unit will not be negatively affected when it is waiting for parts (the upstream unit is not running).
You can either only select a data point or first select a data point as the availability event trigger, and then set the actual availability value using a FactoryTalk Transaction Manager expression.
Proceed as follows:
1. Click Select.
Rockwell Automation Publication PLTMT-UM001M-EN-P-June 2014 75
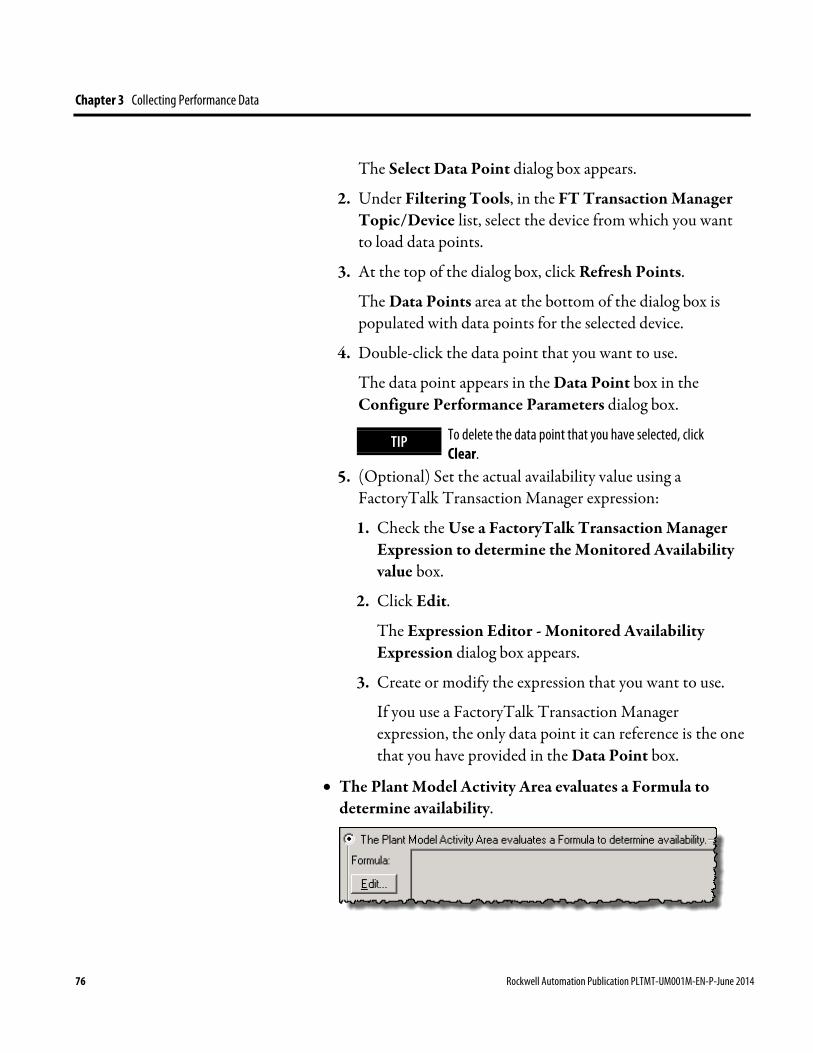
Chapter 3 Collecting Performance Data
The Select Data Point dialog box appears.
2. Under Filtering Tools, in the FT Transaction Manager Topic/Device list, select the device from which you want to load data points.
3. At the top of the dialog box, click Refresh Points.
The Data Points area at the bottom of the dialog box is populated with data points for the selected device.
4. Double-click the data point that you want to use.
The data point appears in the Data Point box in the Configure Performance Parameters dialog box.
TIP To delete the data point that you have selected, click Clear.
5. (Optional) Set the actual availability value using a FactoryTalk Transaction Manager expression:
1. Check the Use a FactoryTalk Transaction Manager Expression to determine the Monitored Availability value box.
2. Click Edit.
The Expression Editor - Monitored Availability Expression dialog box appears.
3. Create or modify the expression that you want to use.
If you use a FactoryTalk Transaction Manager expression, the only data point it can reference is the one that you have provided in the Data Point box.
• The Plant Model Activity Area evaluates a Formula to determine availability.
76 Rockwell Automation Publication PLTMT-UM001M-EN-P-June 2014

Collecting Performance Data Chapter 3
Select this option if you want to determine the availability of the activity area based on the results of a formula.
This option specifies a formula that is constructed from one or more unscheduled numeric or binary data points, and when the result of that formula has a non-zero or true value, it indicates that the activity area is Monitored Available.
For example, if you base the monitored availability on the running state of the upstream and downstream units, you can determine that the activity area is actually available because it is not waiting for parts and is not blocked.
Proceed as follows:
1. Click Edit.
The Formula Parts wizard appears.
2. Use the wizard to define the formula. (page 60)
Click Apply.
The Monitored Availability configuration results in creating several system events contained in an event category called Available (in addition to those created by the Scheduled Availability configuration).
To view the events, in the left pane of the Configure Performance Parameters dialog box, under Custom, click Events.
For more information, see "Viewing the Performance Parameter Events for an Activity Area (page 81)".
The data from the events is logged to the database and used to calculate OEE and other metrics. The events include (depending on selected options):
• Activity Area Available – Formula
• Activity Area Available – Point
Rockwell Automation Publication PLTMT-UM001M-EN-P-June 2014 77

Chapter 3 Collecting Performance Data
• Available Formula Point
How do I access the dialog box?
1. On the Configure menu, click FactoryTalk Metrics > Performance Parameters.
The Manage Performance Parameters dialog box appears.
2. Select the activity area for which you want to associate machine states, and then click Configure.
The Configure Performance Parameters dialog box appears.
3. If necessary, select the FactoryTalk Transaction Manager configuration for the activity area.
4. In the left pane of the dialog box, click Running State.
The Running State parameter is part of the Availability (page 63) value in the OEE equation. The parameter allows the control system to indicate when the activity area is actually producing products.
For the Running State parameters you can create Boolean formulas.
To configure the Running State:
Select one of the following options to indicate how FactoryTalk Metrics should determine when the activity area is actually running and producing parts:
• The Plant Model Activity Area is always in a running state.
Select this option if you want the running time to be set equal to the available time.
Configuring Running State
78 Rockwell Automation Publication PLTMT-UM001M-EN-P-June 2014
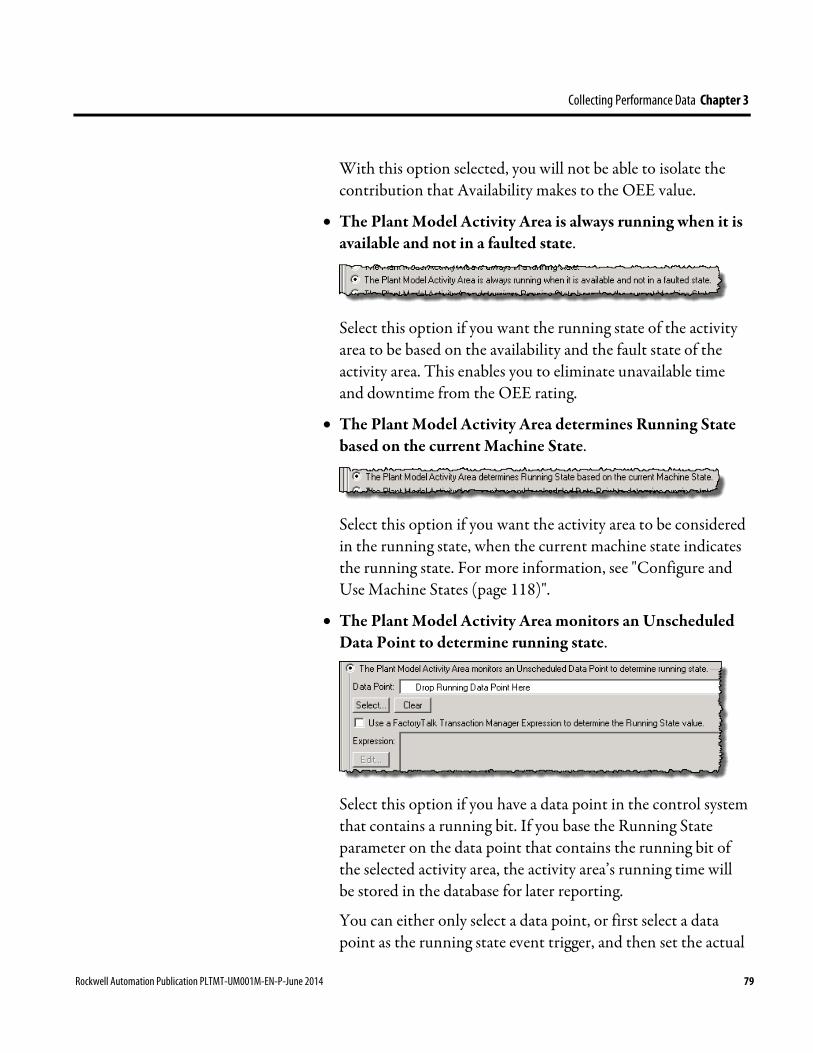
Collecting Performance Data Chapter 3
With this option selected, you will not be able to isolate the contribution that Availability makes to the OEE value.
• The Plant Model Activity Area is always running when it is available and not in a faulted state.
Select this option if you want the running state of the activity area to be based on the availability and the fault state of the activity area. This enables you to eliminate unavailable time and downtime from the OEE rating.
• The Plant Model Activity Area determines Running State based on the current Machine State.
Select this option if you want the activity area to be considered in the running state, when the current machine state indicates the running state. For more information, see "Configure and Use Machine States (page 118)".
• The Plant Model Activity Area monitors an Unscheduled Data Point to determine running state.
Select this option if you have a data point in the control system that contains a running bit. If you base the Running State parameter on the data point that contains the running bit of the selected activity area, the activity area’s running time will be stored in the database for later reporting.
You can either only select a data point, or first select a data point as the running state event trigger, and then set the actual
Rockwell Automation Publication PLTMT-UM001M-EN-P-June 2014 79
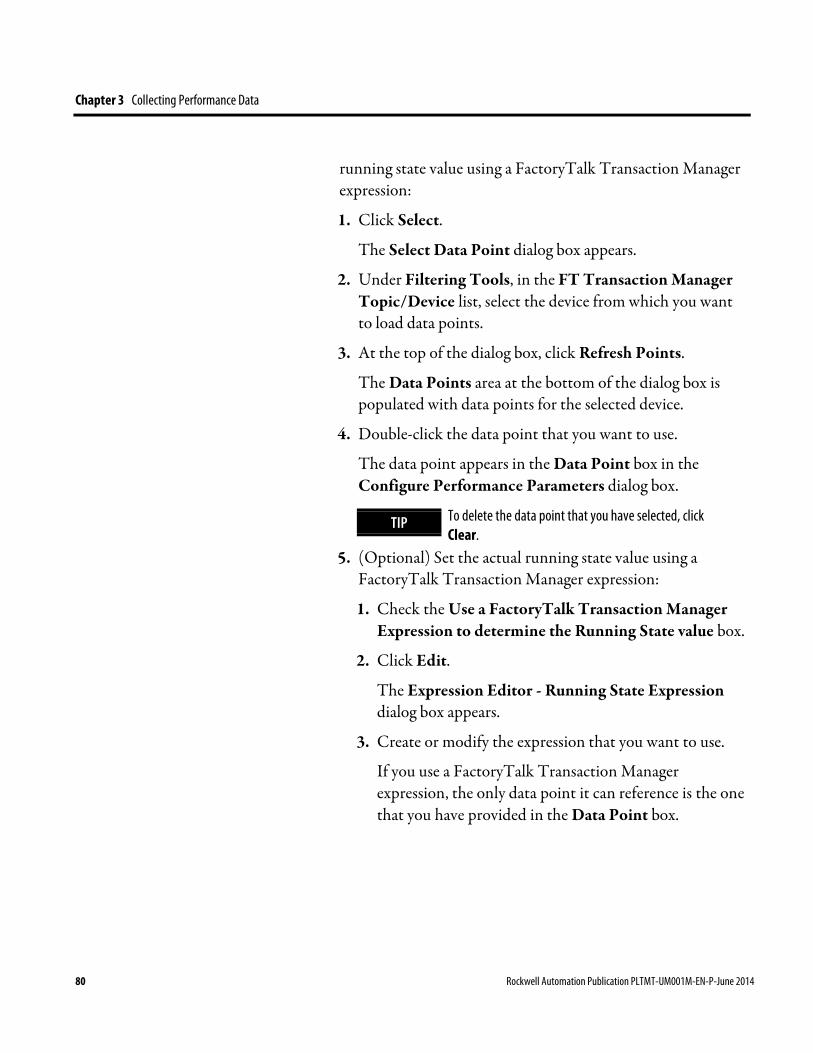
Chapter 3 Collecting Performance Data
running state value using a FactoryTalk Transaction Manager expression:
1. Click Select.
The Select Data Point dialog box appears.
2. Under Filtering Tools, in the FT Transaction Manager Topic/Device list, select the device from which you want to load data points.
3. At the top of the dialog box, click Refresh Points.
The Data Points area at the bottom of the dialog box is populated with data points for the selected device.
4. Double-click the data point that you want to use.
The data point appears in the Data Point box in the Configure Performance Parameters dialog box.
TIP To delete the data point that you have selected, click Clear.
5. (Optional) Set the actual running state value using a FactoryTalk Transaction Manager expression:
1. Check the Use a FactoryTalk Transaction Manager Expression to determine the Running State value box.
2. Click Edit.
The Expression Editor - Running State Expression dialog box appears.
3. Create or modify the expression that you want to use.
If you use a FactoryTalk Transaction Manager expression, the only data point it can reference is the one that you have provided in the Data Point box.
80 Rockwell Automation Publication PLTMT-UM001M-EN-P-June 2014
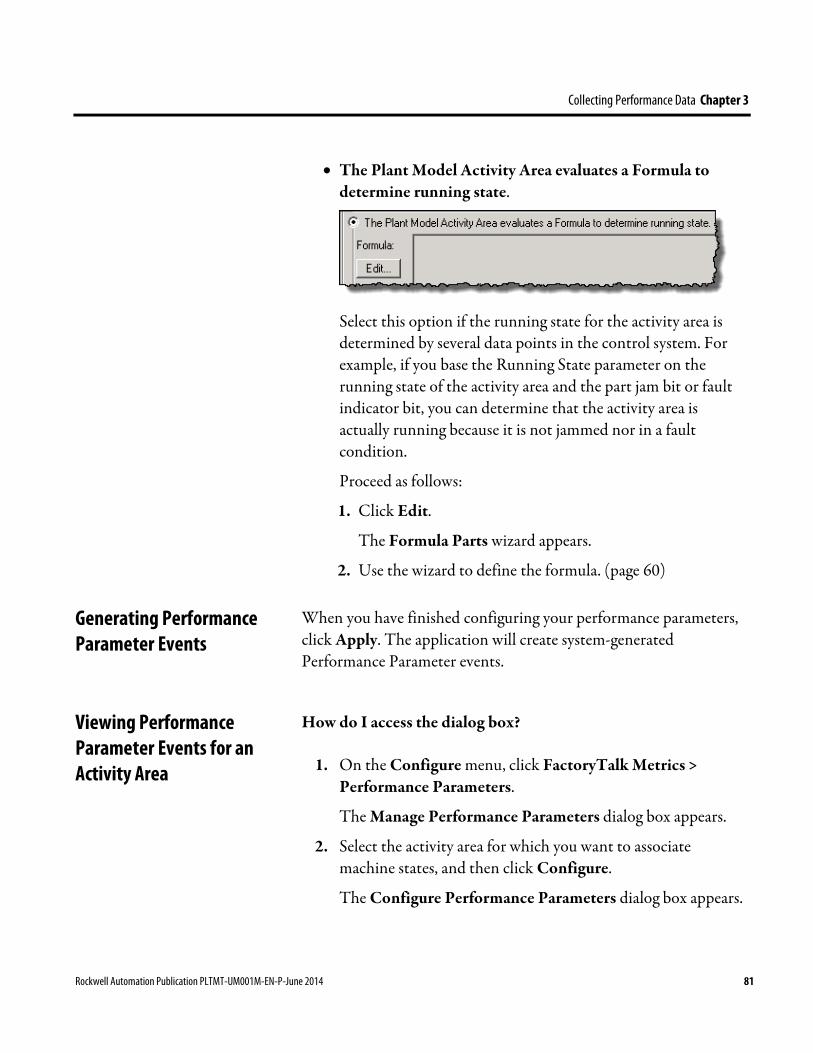
Collecting Performance Data Chapter 3
• The Plant Model Activity Area evaluates a Formula to determine running state.
Select this option if the running state for the activity area is determined by several data points in the control system. For example, if you base the Running State parameter on the running state of the activity area and the part jam bit or fault indicator bit, you can determine that the activity area is actually running because it is not jammed nor in a fault condition.
Proceed as follows:
1. Click Edit.
The Formula Parts wizard appears.
2. Use the wizard to define the formula. (page 60)
When you have finished configuring your performance parameters, click Apply. The application will create system-generated Performance Parameter events.
How do I access the dialog box?
1. On the Configure menu, click FactoryTalk Metrics > Performance Parameters.
The Manage Performance Parameters dialog box appears.
2. Select the activity area for which you want to associate machine states, and then click Configure.
The Configure Performance Parameters dialog box appears.
Generating Performance Parameter Events
Viewing Performance Parameter Events for an Activity Area
Rockwell Automation Publication PLTMT-UM001M-EN-P-June 2014 81
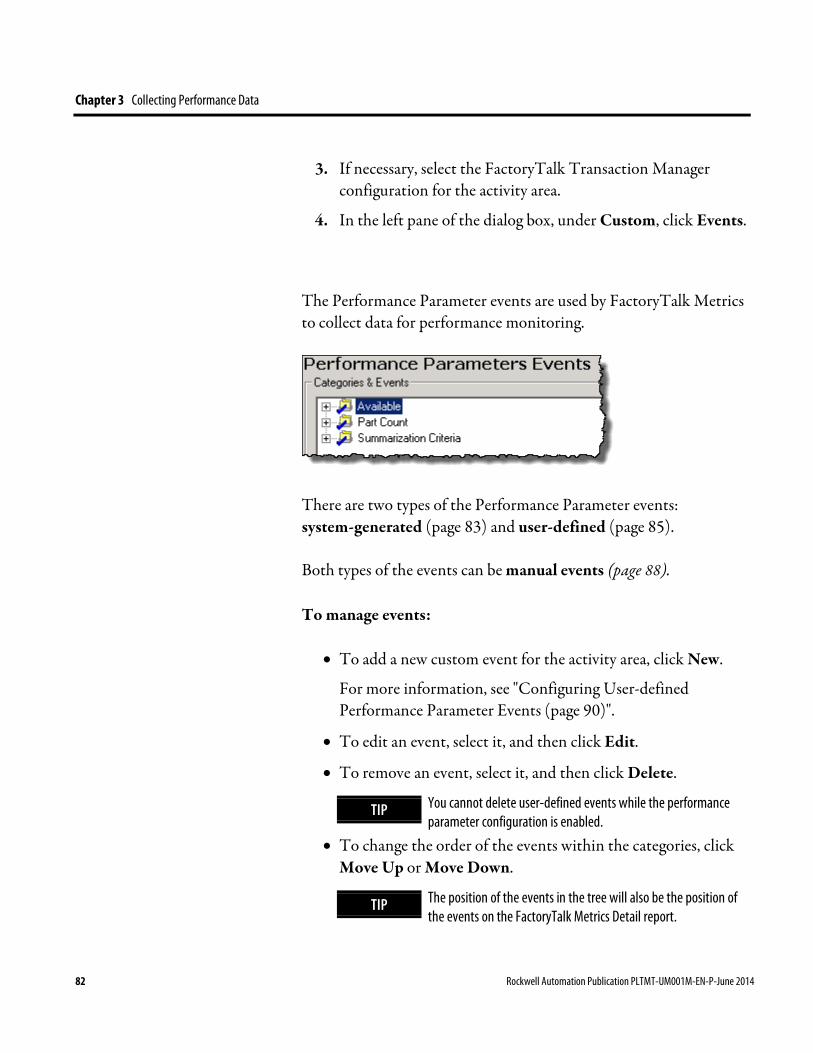
Chapter 3 Collecting Performance Data
3. If necessary, select the FactoryTalk Transaction Manager configuration for the activity area.
4. In the left pane of the dialog box, under Custom, click Events.
The Performance Parameter events are used by FactoryTalk Metrics to collect data for performance monitoring.
There are two types of the Performance Parameter events: system-generated (page 83) and user-defined (page 85).
Both types of the events can be manual events (page 88).
To manage events:
• To add a new custom event for the activity area, click New.
For more information, see "Configuring User-defined Performance Parameter Events (page 90)".
• To edit an event, select it, and then click Edit.
• To remove an event, select it, and then click Delete.
TIP You cannot delete user-defined events while the performance parameter configuration is enabled.
• To change the order of the events within the categories, click Move Up or Move Down.
TIP The position of the events in the tree will also be the position of the events on the FactoryTalk Metrics Detail report.
82 Rockwell Automation Publication PLTMT-UM001M-EN-P-June 2014
Collecting Performance Data Chapter 3
• To copy a user-defined event from another performance parameter configuration to the current performance parameter configuration, click Copy.
• To import new performance parameter events that you have created or overwrite existing performance parameter events that you have modified in Excel (.csv) or XML (.xml) files, click Import.
• To export existing performance parameter event information to an Excel (.csv) or XML (.xml) file, click Export.
System-generated (default) events are created and maintained by the FactoryTalk Metrics software and reflect the selections that you have made for the Performance Parameters configuration. You are only able to edit the description of a system-generated event. All other properties of the events are locked.
System-generated events cannot be deleted.
System-generated events that may be created include:
• Schedule Available
If a schedule is assigned to a workcell, a Schedule Available event record will be created when the schedule indicates the workcell should be available. That record will close when the schedule indicates the workcell is no longer available. So there will be a Schedule Available event record in the database for every continuous period of schedule availability for every workcell.
• Schedule Exception Unavailable
A Schedule Exception Unavailable event record is created for every continuous time period where Schedule Exception Unavailable Time occurs. This Unavailable time is associated with the schedule, and thereby an event record will be created for every workcell that uses the schedule.
System-generated Events
Rockwell Automation Publication PLTMT-UM001M-EN-P-June 2014 83

Chapter 3 Collecting Performance Data
• Overall Available
An Overall Available event record is created for each workcell for each continuous period of Overall Availability. Overall Availability takes into account all of the applicable availability factors that may determine if a workcell is available: schedule, schedule unavailable time, availability data point, and activity area exception unavailable time. The time spent in an Overall Available status is also captured in the Available Seconds field of the FactoryTalk Metrics Workcell History report data source.
• Activity Area Exception Unavailable
An event record will be created for every continuous period of time that a workcell experiences Exception Unavailable Time.
• Activity Area Available - Point
An event record will be created for every continuous period of time that a workcell is available as defined by an activity area Availability data point, which is specified in the Availability section of the Performance Parameter screen. A record will be created every time the Availability point in the control system goes high, and closed when it goes low. If an Availability formula is used, there will be an event created for each component of the formula.
• Running - Point
An event record will be created for every continuous period of time that a workcell is Running as defined by a Running data point, which is specified in the Running section of the Performance Parameter screen. A record will be created every time the Running point in the control system goes high, and closed when it goes low. If a Running formula is used, there will be an event created for each component of the formula.
• Activity Area Part Count - Formula
This system-level event is created when a part count formula is used in a workcell. An event record is created when data
84 Rockwell Automation Publication PLTMT-UM001M-EN-P-June 2014
Collecting Performance Data Chapter 3
collection begins, remains open for as long as the data for the Part Count Formula is collected, and is subject to the event data summarization rules. Each record contains a zero for the start value and the cumulative result of the part count formula over the time duration of the event record for the end value.
• Part Count Formula Point
One of these system-level events is created for every component of a part count formula, when used in a workcell. An event record is created when data collection begins, remains open for as long as the data for the Part Count Formula is collected, and is subject to the event data summarization rules. Each record contains a zero for the start value and the cumulative change of the formula data point value over the time duration of the event record for the end value.
• Activity Area Part Count - Point
This system-level event is created when a data point is used for a part count in a workcell (not a part count formula). An event record is created when data collection begins, remains open for as long as the data for the Part Count Point is collected, and is subject to the event data summarization rules. Each record contains the a zero for the start value and the cumulative change of the part count data point value over the time duration of the event record in the end value.
For more information on the event data summarization rules, see "Set the Event Data Summarization Parameters" in the Configuration Console online help.
User-defined events are custom events that are used to collect extra data that you would like to associate with the existing performance data. By defining custom events, you can direct FactoryTalk Metrics to monitor specific bits or registers in the plant control system, and maintain historical records on the behavior of those data points. For
User-defined Events
Rockwell Automation Publication PLTMT-UM001M-EN-P-June 2014 85

Chapter 3 Collecting Performance Data
example, you can create user-defined events to trap and record downtime occurrences, e-stops, the upstream/ downstream status, machine state information, and operator input.
The ability to direct FactoryTalk Metrics to monitor custom events in the control system is extremely powerful, because it allows you to customize FactoryTalk Metrics for your unique situation and objectives.
It is up to you what is captured and how it is interpreted. There is no enforced limit to the number of custom events that can be associated with a plant model activity area in FactoryTalk Metrics. However, the addition of each new event consumes more resources from all the system's components.
The performance parameters for a user-defined event include:
• Identifying information
The plant model activity area (referred to as “workcell description” in the FactoryTalk Metrics event history report data source), event category (a user-defined grouping or folder of related events), and event description (user-defined).
For more information, see "FactoryTalk Metrics Event History Report Data Source" in the Configuration Console online help.
• Summarization rules
Define how FactoryTalk Metrics will handle the creation of multiple summary records in the database for a single event occurrence.
For more information, see "Set the Event Data Summarization Parameters" in the Configuration Console online help.
86 Rockwell Automation Publication PLTMT-UM001M-EN-P-June 2014
Collecting Performance Data Chapter 3
• Trigger
Defines how the event starts and ends (e.g., a bit in the control system goes high to signal the start of the event and it goes low at the end of the event).
For more information, see "Set the Event Trigger Parameters" in the Configuration Console online help.
• Additional data
Optionally, an additional data point can be collected at the start or end of the event, or a counter can be monitored through the duration of an event. The additional data collected may be the event reason code entered by the operator, explaining why the event occurred.
For more information, see "Collect Additional Event Information" in the Configuration Console online help.
• Event fault metrics
Not all events are relevant in the calculation of fault metrics. Specify how the event should be used when calculating fault metrics (Mean Time Between Failure, Mean Time To Repair). Mean Time Between Failure and Mean Time to Repair are derived fields that contain aggregate functions and, as such, they can only be used in summary report objects, and you cannot apply additional aggregate functions to them.
For more information, see "Set the Event Fault Metric And Machine State Options" in the Configuration Console online help.
• Event reporting properties
The reporting value property determines the type of value that is reported for the event. The severity level property determines the severity that is associated with the event. This is useful for reporting and sorting events.
For more information, see "Set the Event Reporting Properties" in the Configuration Console online help.
Rockwell Automation Publication PLTMT-UM001M-EN-P-June 2014 87

Chapter 3 Collecting Performance Data
Manual events are events without a physical data point attached to them. They can be both system-generated events and user-defined events.
There is only one type of system-generated manual events, Activity Area Good Part Count - Manual, and only one event of this type may exist in a workcell.
Manual events can be created only in an activity area configured as a manual activity area. For more information on configuring manual activity areas, refer to "Configure FactoryTalk Metrics Data Collection Parameters" in the Configuration Console online help.
To configure an event as a manual event, select the Manual Event check box in the Configure Performance Parameters Events dialog box.
Configuring an event as a manual event influences the following settings:
• The Part Count performance parameter in the Configure Performance Parameters dialog box.
• The following performance parameters in the Configure Performance Parameters Event dialog box:
• Event Trigger types.
• Event Value.
The system-generated manual event is automatically described as manual in the Categories & Events list.
Manual Events
88 Rockwell Automation Publication PLTMT-UM001M-EN-P-June 2014
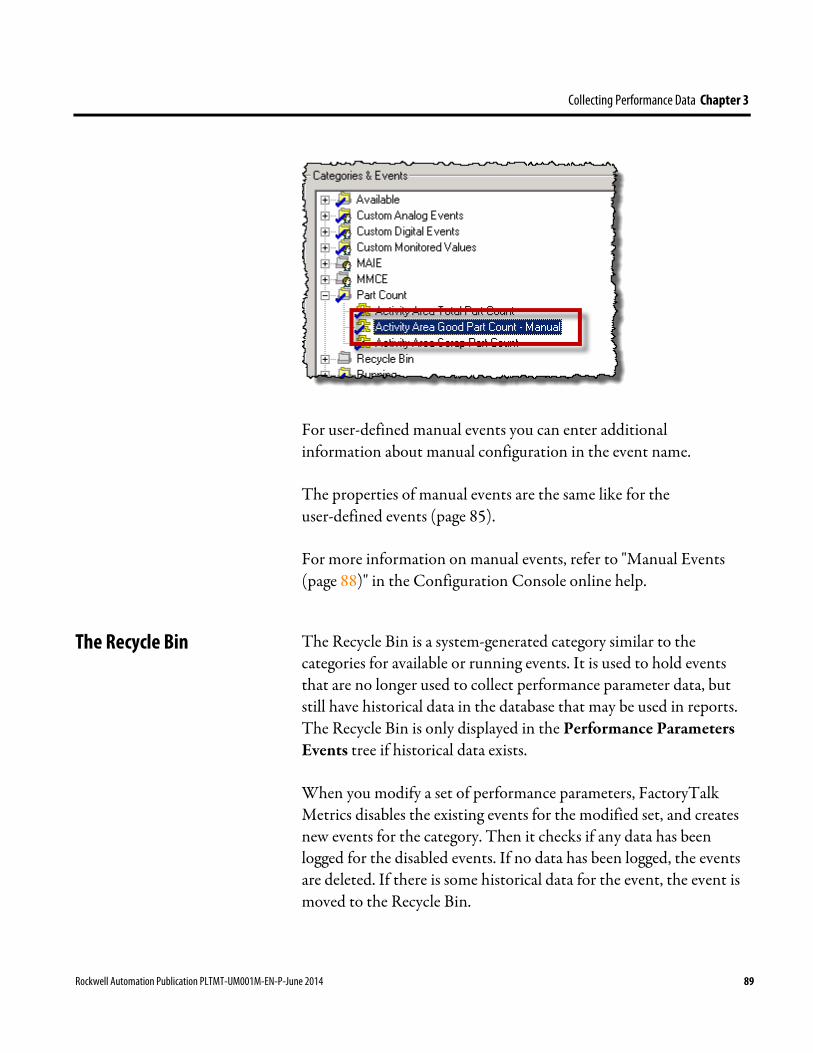
Collecting Performance Data Chapter 3
For user-defined manual events you can enter additional information about manual configuration in the event name.
The properties of manual events are the same like for the user-defined events (page 85).
For more information on manual events, refer to "Manual Events (page 88)" in the Configuration Console online help.
The Recycle Bin is a system-generated category similar to the categories for available or running events. It is used to hold events that are no longer used to collect performance parameter data, but still have historical data in the database that may be used in reports. The Recycle Bin is only displayed in the Performance Parameters Events tree if historical data exists.
When you modify a set of performance parameters, FactoryTalk Metrics disables the existing events for the modified set, and creates new events for the category. Then it checks if any data has been logged for the disabled events. If no data has been logged, the events are deleted. If there is some historical data for the event, the event is moved to the Recycle Bin.
The Recycle Bin
Rockwell Automation Publication PLTMT-UM001M-EN-P-June 2014 89
Chapter 3 Collecting Performance Data
For example, if you changed the activity area availability from Data Point to Formula, the system would disable the existing events in the Available category, delete the events that do not have historical data, move the events that have historical data to the Recycle Bin, and then create new available events.
NOTE If you delete an event from the Recycle Bin, the event and any historical data associated with it will be deleted.
The process of creating performance parameter events consists of the following stages:
1. Configuring the event data summary. (page 90)
2. Configuring the event trigger. (page 93)
3. Configuring the event value. (page 99)
4. Configuring the machine state / faults. (page 111)
5. Configuring the reporting. (page 113)
How do I access the dialog box?
1. On the Configure menu, click FactoryTalk Metrics > Performance Parameters.
The Manage Performance Parameters dialog box appears.
2. Select the activity area for which you want to associate machine states, and then click Configure.
The Configure Performance Parameters dialog box appears.
3. If necessary, select the FactoryTalk Transaction Manager configuration for the activity area.
4. In the left pane of the dialog box, under Custom, click Events.
In the right pane of the dialog box, a list of available categories and events appears.
5. Click New.
Configuring User-defined Performance Parameter Events
Configuring the Event Data Summary
90 Rockwell Automation Publication PLTMT-UM001M-EN-P-June 2014
Collecting Performance Data Chapter 3
The Configure Performance Parameter Event dialog box appears.
To configure the event data summary:
1. In the Description box, type a name for the event.
2. In the Category list, either select a category from the list, or create a new one.
To create a new category:
1. Next to the Category list, click New.
The New Event Category dialog box appears.
2. Under Enter Event Category Name, type a name for the new category.
3. Click OK.
3. In the Data Summarization Type list, select one of the following summarization types:
• Scheduled Shift Start
• Scheduled Shift Start and End
• Any Scheduled Shift Change
• Summarization Criteria Change
• Scheduled Shift Start or Summarization Criteria Change
• Scheduled Shift Start and End or Summarization Criteria Change
• Any Scheduled Shift Change or Summarization Criteria Change
• Performance Trending Summarization
• No Summarization
Rockwell Automation Publication PLTMT-UM001M-EN-P-June 2014 91
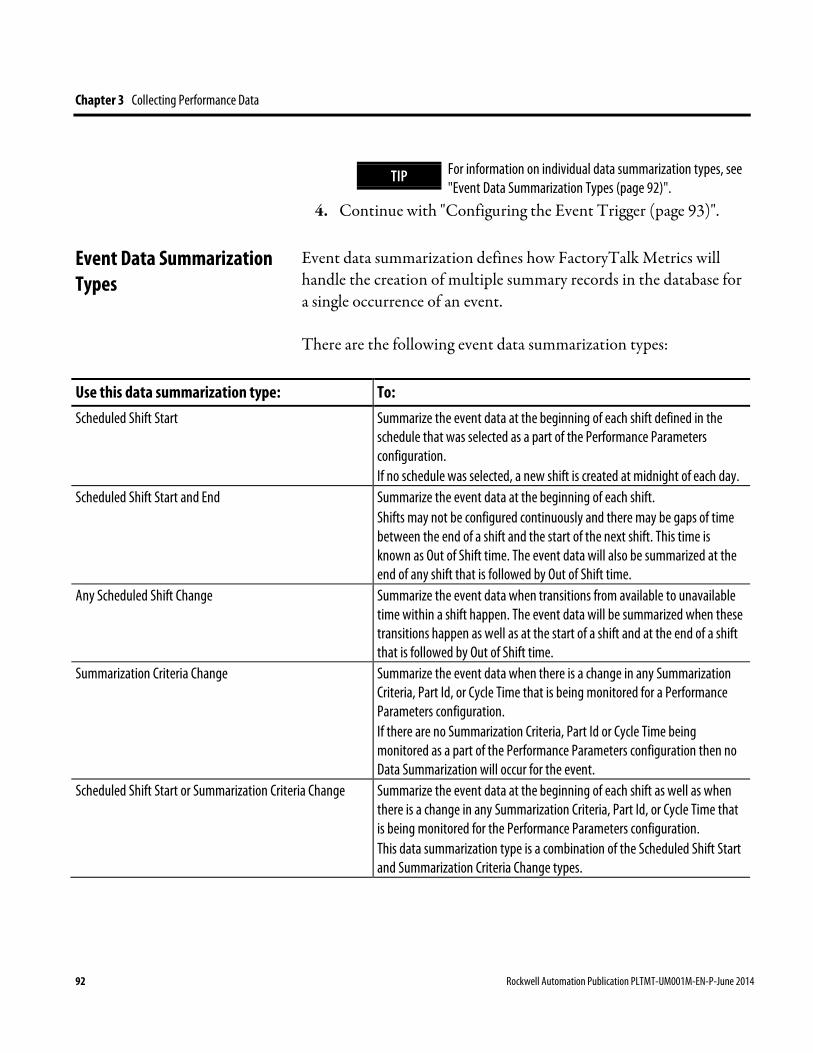
Chapter 3 Collecting Performance Data
TIP For information on individual data summarization types, see "Event Data Summarization Types (page 92)".
4. Continue with "Configuring the Event Trigger (page 93)".
Event data summarization defines how FactoryTalk Metrics will handle the creation of multiple summary records in the database for a single occurrence of an event.
There are the following event data summarization types:
Use this data summarization type: To: Scheduled Shift Start Summarize the event data at the beginning of each shift defined in the
schedule that was selected as a part of the Performance Parameters configuration. If no schedule was selected, a new shift is created at midnight of each day.
Scheduled Shift Start and End Summarize the event data at the beginning of each shift. Shifts may not be configured continuously and there may be gaps of time between the end of a shift and the start of the next shift. This time is known as Out of Shift time. The event data will also be summarized at the end of any shift that is followed by Out of Shift time.
Any Scheduled Shift Change Summarize the event data when transitions from available to unavailable time within a shift happen. The event data will be summarized when these transitions happen as well as at the start of a shift and at the end of a shift that is followed by Out of Shift time.
Summarization Criteria Change Summarize the event data when there is a change in any Summarization Criteria, Part Id, or Cycle Time that is being monitored for a Performance Parameters configuration. If there are no Summarization Criteria, Part Id or Cycle Time being monitored as a part of the Performance Parameters configuration then no Data Summarization will occur for the event.
Scheduled Shift Start or Summarization Criteria Change Summarize the event data at the beginning of each shift as well as when there is a change in any Summarization Criteria, Part Id, or Cycle Time that is being monitored for the Performance Parameters configuration. This data summarization type is a combination of the Scheduled Shift Start and Summarization Criteria Change types.
Event Data Summarization Types
92 Rockwell Automation Publication PLTMT-UM001M-EN-P-June 2014

Collecting Performance Data Chapter 3
Use this data summarization type: To: Scheduled Shift Start and End or Summarization Criteria Change
Summarize the event data at the beginning of each shift, at the end of each shift that is followed by Out of Shift time, and when there is a change in any Summarization Criteria, Part Id, or Cycle Time that is being monitored for the Performance Parameters configuration. This data summarization type is a combination of the Scheduled Shift Start and End and Summarization Criteria Change types.
Any Scheduled Shift Change or Summarization Criteria Change
Summarize the event data at the beginning of each shift, at the end of each shift that is followed by Out of Shift time, when there is a change of Available states within a shift, and when there is a change in any Summarization Criteria, Part Id, or Cycle Time that is being monitored for the Performance Parameters configuration. This data summarization type is a combination of the Any Scheduled Shift Change and Summarization Criteria Change types.
Performance Trending Summarization Summarize the historical data for Performance Parameters at regular intervals specified by the Performance Data Trending Rate, on any change of Shift or Available states within a shift, as well as when a change in any Summarization Criteria, Part Id, or Cycle Time data occurs. The event data will be summarized at the same time that Performance Parameters data is summarized.
No Summarization Choose not to summarize the event data at any time. The event will have one record for its entire duration. Note: Use this data summarization type with caution because using it could result in creating event records that would make reporting less accurate.
How do I access the dialog box?
1. On the Configure menu, click FactoryTalk Metrics > Performance Parameters.
The Manage Performance Parameters dialog box appears.
2. Select the activity area for which you want to associate machine states, and then click Configure.
The Configure Performance Parameters dialog box appears.
3. If necessary, select the FactoryTalk Transaction Manager configuration for the activity area.
Configuring the Event Trigger
Rockwell Automation Publication PLTMT-UM001M-EN-P-June 2014 93
Chapter 3 Collecting Performance Data
4. In the left pane of the dialog box, under Custom, click Events.
In the right pane of the dialog box, a list of available categories and events appears.
5. Click New.
The Configure Performance Parameter Event dialog box appears.
To configure the event trigger:
1. In the left pane of the dialog box, click Event Trigger.
2. In the Event Trigger Type list, select one of the following:
• Monitored Bit Low to High Transition
• Monitored Bit High to Low Transition
• Monitored Value
• Monitored Formula Low to High Transition
• Monitored Formula High to Low Transition
• Monitored Periodic Value
• None
TIP For information on the event trigger types, see "Event Trigger Types for System-generated and User-defined Events (page 97)".
The following steps will differ depending on the event trigger type that you have selected.
If you have selected any of these event trigger types:
• Monitored Bit Low to High Transition
• Monitored Bit High to Low Transition
• Monitored Value
94 Rockwell Automation Publication PLTMT-UM001M-EN-P-June 2014
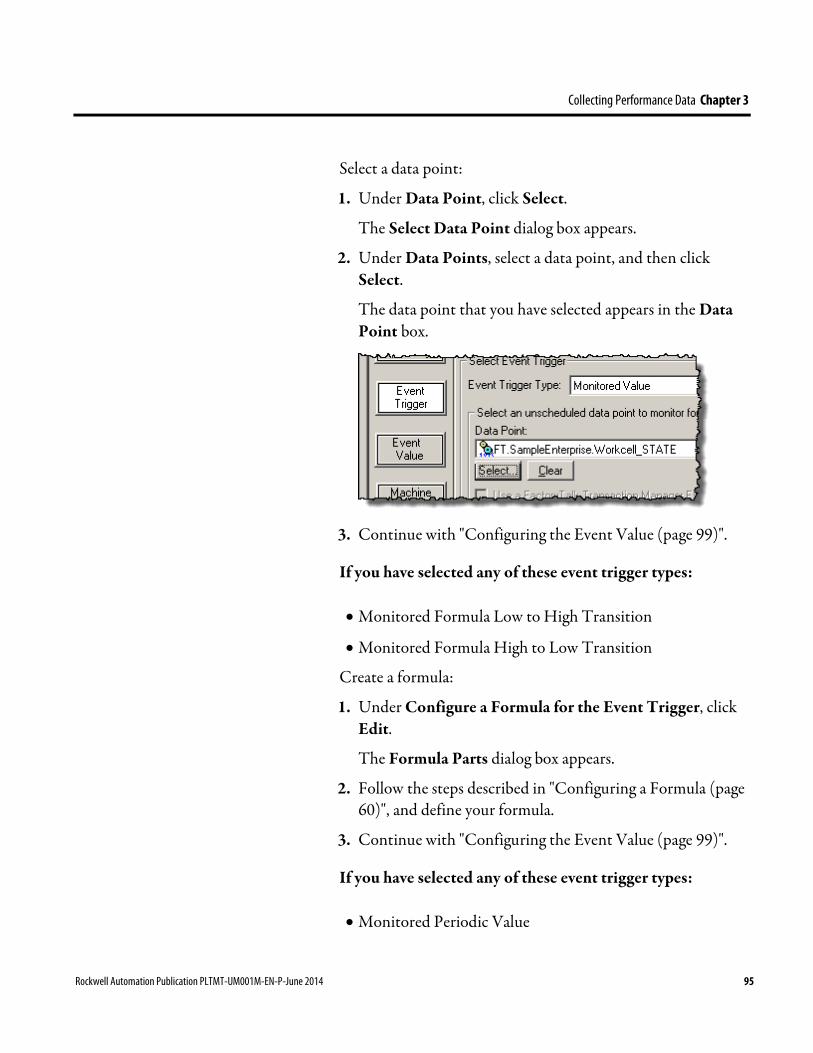
Collecting Performance Data Chapter 3
Select a data point:
1. Under Data Point, click Select.
The Select Data Point dialog box appears.
2. Under Data Points, select a data point, and then click Select.
The data point that you have selected appears in the Data Point box.
3. Continue with "Configuring the Event Value (page 99)".
If you have selected any of these event trigger types:
• Monitored Formula Low to High Transition
• Monitored Formula High to Low Transition
Create a formula:
1. Under Configure a Formula for the Event Trigger, click Edit.
The Formula Parts dialog box appears.
2. Follow the steps described in "Configuring a Formula (page 60)", and define your formula.
3. Continue with "Configuring the Event Value (page 99)".
If you have selected any of these event trigger types:
• Monitored Periodic Value
Rockwell Automation Publication PLTMT-UM001M-EN-P-June 2014 95

Chapter 3 Collecting Performance Data
• None
Continue with "Configuring the Event Value (page 99)".
There are the following types of event triggers:
• Event trigger types for system-generated events only (page 96).
• Event trigger types for system-generated and user-defined events (page 97).
• Event trigger types for manual events (page 99).
The following event trigger types are available for system-generated events only:
This event trigger: Is used by: Activity Area Overall Available • Overall Available Event
Activity Area Schedule • Schedule Available Event
Activity Area Schedule Exception Unavailable
• Schedule Exception Unavailable Event
Activity Area Exception Unavailable • Activity Area Exception Unavailable Event
Activity Area Available • Activity Area Available - Point Event • Activity Area Available - Formula Event
Activity Area Running • Activity Area Running - Point Event • Activity Area Running - Formula Event
The system-generated events cannot be edited by users.
Event Trigger Types
Event Trigger Types for System-generated Events
96 Rockwell Automation Publication PLTMT-UM001M-EN-P-June 2014

Collecting Performance Data Chapter 3
The following event trigger types are available for system-generated events and user-defined events that are not manual:
Use this event trigger type: To: Monitored Bit Low to High Transition Monitor a bit value in the control system.
For this event trigger type, you need to specify a control system value as the trigger data point. The trigger data point does not have to be a bit but it must be numeric. Because this event is triggered by a change in the value reported by the control system, only values that report their data in an unscheduled manner may be selected as the trigger data point. The values that are collected and interpreted in a binary fashion with a value of zero being Low or Off and a non-zero value being High or On. Use the trigger to track a value whose natural state is Low and you want to activate the event when the value goes High and deactivate the event when the value returns to Low. This event trigger type will accumulate the amount of time that the control system value is in a High state.
Monitored Bit High to Low Transition Monitor a bit value in the control system. For this event trigger type, you need to specify a control system value as the trigger data point. The trigger data point does not have to be a bit but it must be numeric. Because this event is triggered by a change in the value reported by the control system only values that report their data in an unscheduled manner may be selected as the trigger data point. The values that are collected are interpreted in a binary fashion with a value of zero being Low or Off and a non-zero value being High or On. Use the trigger to track a value whose natural state is High and you want to activate the event when the value goes Low and deactivate the event when the value returns to High. This event trigger type will accumulate the amount of time that the control system value is in a Low state.
Event Trigger Types for System-generated and User-defined Events
Rockwell Automation Publication PLTMT-UM001M-EN-P-June 2014 97
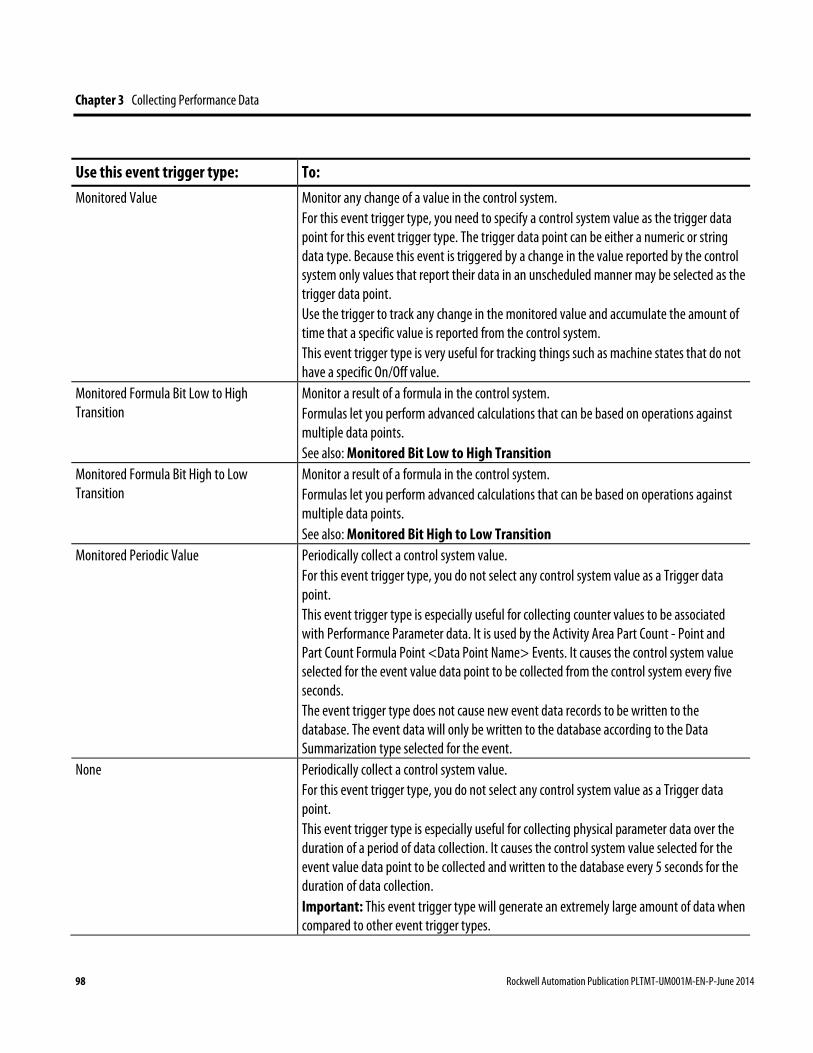
Chapter 3 Collecting Performance Data
Use this event trigger type: To: Monitored Value Monitor any change of a value in the control system.
For this event trigger type, you need to specify a control system value as the trigger data point for this event trigger type. The trigger data point can be either a numeric or string data type. Because this event is triggered by a change in the value reported by the control system only values that report their data in an unscheduled manner may be selected as the trigger data point. Use the trigger to track any change in the monitored value and accumulate the amount of time that a specific value is reported from the control system. This event trigger type is very useful for tracking things such as machine states that do not have a specific On/Off value.
Monitored Formula Bit Low to High Transition
Monitor a result of a formula in the control system. Formulas let you perform advanced calculations that can be based on operations against multiple data points. See also: Monitored Bit Low to High Transition
Monitored Formula Bit High to Low Transition
Monitor a result of a formula in the control system. Formulas let you perform advanced calculations that can be based on operations against multiple data points. See also: Monitored Bit High to Low Transition
Monitored Periodic Value Periodically collect a control system value. For this event trigger type, you do not select any control system value as a Trigger data point. This event trigger type is especially useful for collecting counter values to be associated with Performance Parameter data. It is used by the Activity Area Part Count - Point and Part Count Formula Point <Data Point Name> Events. It causes the control system value selected for the event value data point to be collected from the control system every five seconds. The event trigger type does not cause new event data records to be written to the database. The event data will only be written to the database according to the Data Summarization type selected for the event.
None Periodically collect a control system value. For this event trigger type, you do not select any control system value as a Trigger data point. This event trigger type is especially useful for collecting physical parameter data over the duration of a period of data collection. It causes the control system value selected for the event value data point to be collected and written to the database every 5 seconds for the duration of data collection. Important: This event trigger type will generate an extremely large amount of data when compared to other event trigger types.
98 Rockwell Automation Publication PLTMT-UM001M-EN-P-June 2014
Collecting Performance Data Chapter 3
There are the following event trigger types available for manual events:
Event trigger type Description Manual active/inactive event The behavior of this trigger type is similar to the
following trigger types available for user-defined events: • Monitored Bit Low to High Transition • Monitored Bit High to Low Transition • Monitored Formula Low to High Transition • Monitored Formula High to Low Transition
The difference between those trigger types and the Manual active/inactive event trigger type is that the latter does not require a data point attached to it.
Manual monitored continuous event The behavior of this trigger type is similar to the Monitored Value trigger type available for user-defined events. The difference between those trigger types is that the Manual monitored continuous event trigger type does not require a data point attached to it.
How do I access the dialog box?
1. On the Configure menu, click FactoryTalk Metrics > Performance Parameters.
The Manage Performance Parameters dialog box appears.
2. Select the activity area for which you want to associate machine states, and then click Configure.
The Configure Performance Parameters dialog box appears.
3. If necessary, select the FactoryTalk Transaction Manager configuration for the activity area.
4. In the left pane of the dialog box, under Custom, click Events.
In the right pane of the dialog box, a list of available categories and events appears.
Event Trigger Types for Manual Events
Configuring the Event Value
Rockwell Automation Publication PLTMT-UM001M-EN-P-June 2014 99

Chapter 3 Collecting Performance Data
5. Click New.
The Configure Performance Parameter Event dialog box appears.
To configure the event value:
1. In the left pane of the dialog box, click Event Value.
2. In the Event Value Type list, select one of the following:
• Collect Value at the Start of the Event
• Collect Value at the End of the Event
• Collect Value at the Start and the End of the Event
• Accumulate Value for the Duration of the Event
• None
TIP For information on individual event value types, see "Event Value Types (page 101)".
The following steps will differ depending on the event value type that you have selected.
If you have selected any of these event value types:
• Collect Value at the Start of the Event
• Collect Value at the End of the Event
• Collect Value at the Start and the End of the Event
• Accumulate Value for the Duration of the Event
Choose either of the following:
• Select a data point for the Event Value
1. Under Data Point, click Select.
The Select Data Point dialog box appears.
100 Rockwell Automation Publication PLTMT-UM001M-EN-P-June 2014

Collecting Performance Data Chapter 3
2. Under Data Points, select a data point, and then click Select.
The data point that you have selected appears in the Data Point box.
• Configure a FactoryTalk Transaction Manager Expression for the Event Value
1. Under Expression, click Edit.
The Expression Editor dialog box appears.
2. Follow the steps described in "Using the Expression Editor (page 104)", and define your expression.
3. Select or create an Event Value/Reason Code Lookup List, if you have selected any of these event value types:
• Collect Value at the Start of the Event
• Collect Value at the End of the Event
• Collect Value at the Start and the End of the Event
With the lookup list you can provide descriptive names for your event values:
Under Event Value/Reason Code Lookup List, select an existing lookup list for your event value.
• To edit the list, click Edit List.
The Lookup Code Configuration dialog box appears.
• To create a new list, click Create List.
The Lookup Code Configuration dialog box appears.
TIP See "Creating Event Value Reason Code Lookup Lists (page 109)" for details.
4. Continue with "Configuring the Machine State / Faults (page 111)".
Event Value Types
Rockwell Automation Publication PLTMT-UM001M-EN-P-June 2014 101

Chapter 3 Collecting Performance Data
The historical event data contains fields to record an initial value and an ending value for an event. The Event Value type defines which of these fields is used as well as what is stored there.
There are the following event value types:
Event value type Description This event value type is available for:
Plant Model Unit Part Count Sets the initial value of the event to be zero and the ending value of the event to be the accumulated Part Count for the duration of the event.
System-generated events
Collect Value at the Start of the Event Collects a value when the Event Trigger is activated. No value is collected at the end of the Event Trigger and the ending value field is ignored for this event. Use this Event Value type when you are only interested in the data that will be collected when the Event Trigger is activated. For example, an event that uses the Monitored Value Event Trigger type and is supposed to associate time-in-state information with the additional Event Value data would only use the initial collected value because the ending collected value would be the same as the initial collected value of the next historical event data record. If you select this Event Value type, you should select a device scheduled data point OR the same data point used to trigger the event. If a Scheduled data point is used, there is no guarantee that the value collected when the event is triggered is current. You may select a Value Lookup list to associate descriptive string values with collected numeric codes.
• System-generated events
• User-defined events • Manual events
Collect Value at the End of the Event Collects a value at the termination of an event. No value is collected when the event is activated and the initial value field is ignored for this event. Use this Event Value type when you are only interested in the data that will be collected at the termination of the Event Trigger. For example, if an event is triggered by a machine breakdown and the operator enters a reason code for the breakdown and resets the trigger bit, the Event Value is only available to be collected when the event terminates. You may select a Value Lookup list to associate descriptive string values with collected numeric codes.
• System-generated events
• User-defined events • Manual events
102 Rockwell Automation Publication PLTMT-UM001M-EN-P-June 2014
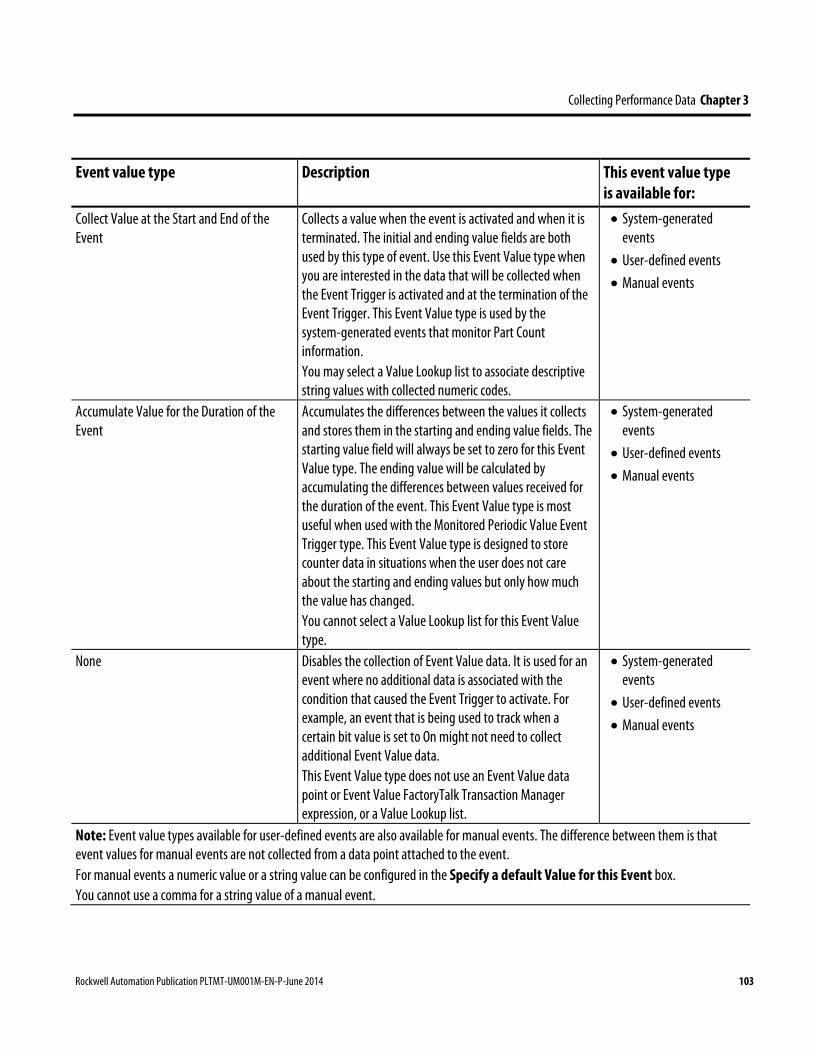
Collecting Performance Data Chapter 3
Event value type Description This event value type is available for:
Collect Value at the Start and End of the Event
Collects a value when the event is activated and when it is terminated. The initial and ending value fields are both used by this type of event. Use this Event Value type when you are interested in the data that will be collected when the Event Trigger is activated and at the termination of the Event Trigger. This Event Value type is used by the system-generated events that monitor Part Count information. You may select a Value Lookup list to associate descriptive string values with collected numeric codes.
• System-generated events
• User-defined events • Manual events
Accumulate Value for the Duration of the Event
Accumulates the differences between the values it collects and stores them in the starting and ending value fields. The starting value field will always be set to zero for this Event Value type. The ending value will be calculated by accumulating the differences between values received for the duration of the event. This Event Value type is most useful when used with the Monitored Periodic Value Event Trigger type. This Event Value type is designed to store counter data in situations when the user does not care about the starting and ending values but only how much the value has changed. You cannot select a Value Lookup list for this Event Value type.
• System-generated events
• User-defined events • Manual events
None Disables the collection of Event Value data. It is used for an event where no additional data is associated with the condition that caused the Event Trigger to activate. For example, an event that is being used to track when a certain bit value is set to On might not need to collect additional Event Value data. This Event Value type does not use an Event Value data point or Event Value FactoryTalk Transaction Manager expression, or a Value Lookup list.
• System-generated events
• User-defined events • Manual events
Note: Event value types available for user-defined events are also available for manual events. The difference between them is that event values for manual events are not collected from a data point attached to the event. For manual events a numeric value or a string value can be configured in the Specify a default Value for this Event box. You cannot use a comma for a string value of a manual event.
Rockwell Automation Publication PLTMT-UM001M-EN-P-June 2014 103
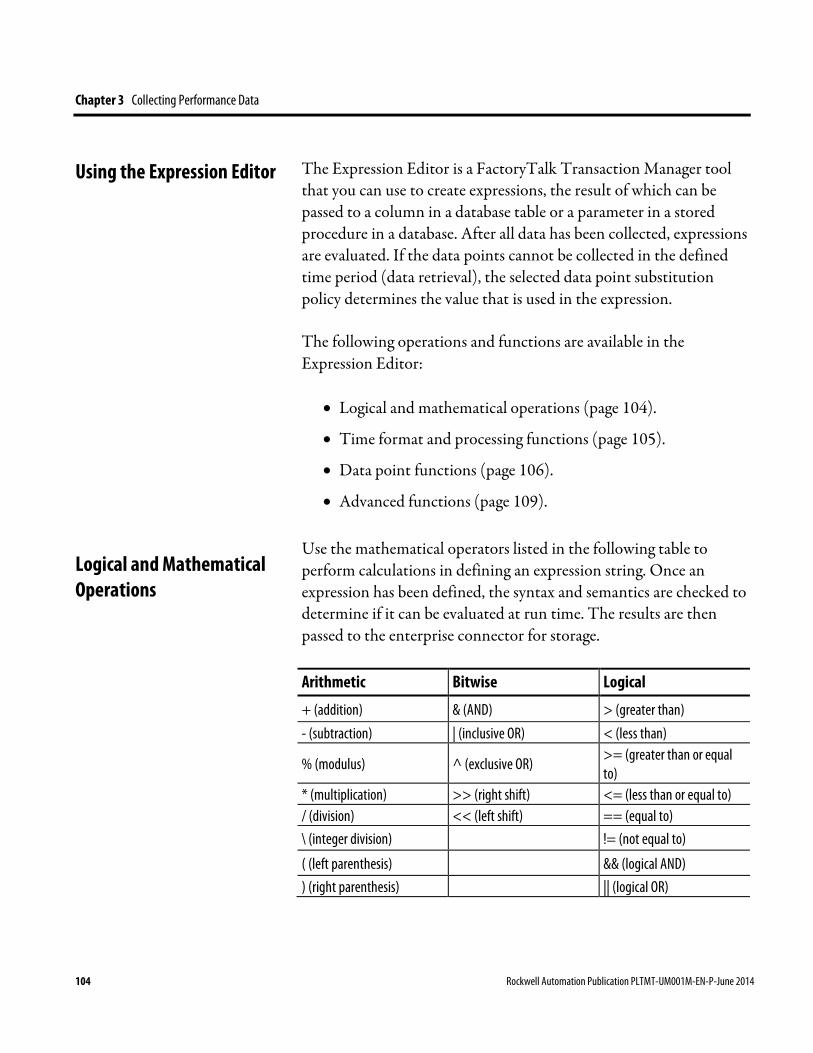
Chapter 3 Collecting Performance Data
The Expression Editor is a FactoryTalk Transaction Manager tool that you can use to create expressions, the result of which can be passed to a column in a database table or a parameter in a stored procedure in a database. After all data has been collected, expressions are evaluated. If the data points cannot be collected in the defined time period (data retrieval), the selected data point substitution policy determines the value that is used in the expression.
The following operations and functions are available in the Expression Editor:
• Logical and mathematical operations (page 104).
• Time format and processing functions (page 105).
• Data point functions (page 106).
• Advanced functions (page 109).
Use the mathematical operators listed in the following table to perform calculations in defining an expression string. Once an expression has been defined, the syntax and semantics are checked to determine if it can be evaluated at run time. The results are then passed to the enterprise connector for storage.
Arithmetic Bitwise Logical
+ (addition) & (AND) > (greater than) - (subtraction) | (inclusive OR) < (less than)
% (modulus) ^ (exclusive OR) >= (greater than or equal to)
* (multiplication) >> (right shift) <= (less than or equal to) / (division) << (left shift) == (equal to) \ (integer division) != (not equal to)
( (left parenthesis) && (logical AND) ) (right parenthesis) || (logical OR)
Using the Expression Editor
Logical and Mathematical Operations
104 Rockwell Automation Publication PLTMT-UM001M-EN-P-June 2014
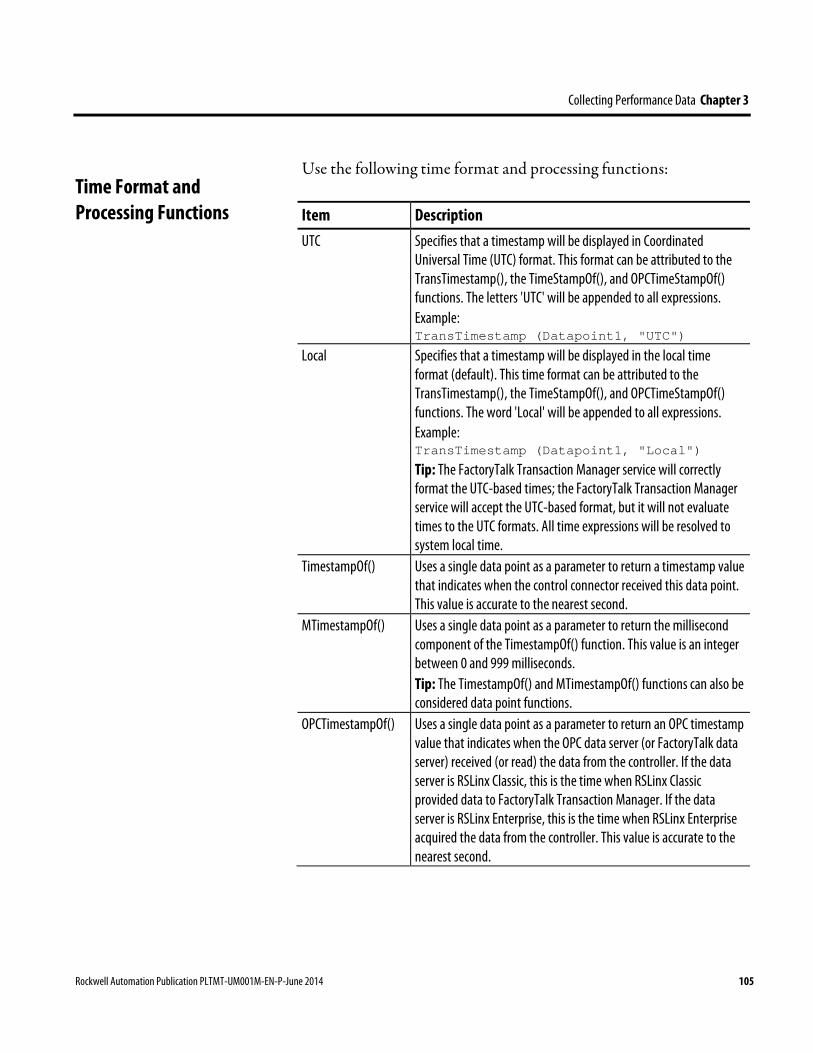
Collecting Performance Data Chapter 3
Use the following time format and processing functions:
Item Description UTC Specifies that a timestamp will be displayed in Coordinated
Universal Time (UTC) format. This format can be attributed to the TransTimestamp(), the TimeStampOf(), and OPCTimeStampOf() functions. The letters 'UTC' will be appended to all expressions. Example: TransTimestamp (Datapoint1, "UTC")
Local Specifies that a timestamp will be displayed in the local time format (default). This time format can be attributed to the TransTimestamp(), the TimeStampOf(), and OPCTimeStampOf() functions. The word 'Local' will be appended to all expressions. Example: TransTimestamp (Datapoint1, "Local") Tip: The FactoryTalk Transaction Manager service will correctly format the UTC-based times; the FactoryTalk Transaction Manager service will accept the UTC-based format, but it will not evaluate times to the UTC formats. All time expressions will be resolved to system local time.
TimestampOf() Uses a single data point as a parameter to return a timestamp value that indicates when the control connector received this data point. This value is accurate to the nearest second.
MTimestampOf() Uses a single data point as a parameter to return the millisecond component of the TimestampOf() function. This value is an integer between 0 and 999 milliseconds. Tip: The TimestampOf() and MTimestampOf() functions can also be considered data point functions.
OPCTimestampOf() Uses a single data point as a parameter to return an OPC timestamp value that indicates when the OPC data server (or FactoryTalk data server) received (or read) the data from the controller. If the data server is RSLinx Classic, this is the time when RSLinx Classic provided data to FactoryTalk Transaction Manager. If the data server is RSLinx Enterprise, this is the time when RSLinx Enterprise acquired the data from the controller. This value is accurate to the nearest second.
Time Format and Processing Functions
Rockwell Automation Publication PLTMT-UM001M-EN-P-June 2014 105

Chapter 3 Collecting Performance Data
Item Description MOPCTimestampOf() Uses a single data point as a parameter to return the millisecond
component of the OPCTimestampOf() function. This value is an integer between 0 and 999 milliseconds. Tips: • The Transaction Control Manager will correctly evaluate the
time as it was received from the OPC or FactoryTalk Live Data server. The FactoryTalk Transaction Manager will substitute the TimeStampOf() or MTimeStampOf() functions for the OPCTimeStampOf() or MOPCTimeStampOf() functions.
• Any OPC time is returned to the Transaction Control Manager service as an UTC-formatted time. If you specify the local format, then the time is converted based on the local time of the Transaction Control Manager service, not the local time on the OPC or FactoryTalk Live Data server.
TransTimestamp() Returns a timestamp value that indicates when the transaction occurred. This value is accurate to the nearest second.
MTransTimestamp() Returns the millisecond component of the TransTimestamp() function. This value is an integer between 0 and 999 milliseconds.
An expression can contain a range of values which it can use to calculate an average of the previous 10 transaction values ( avg ( datapoint [0:9]). This functionality also works to calculate the minimum (min) or maximum (max) value of a data point over several transactions. Note that the transaction must be run to reflect changes in the historical values. The results, however, do not need to be stored. Using the Store on Every N Transactions option, you can collect the data needed for an average, but not store the data to the database. If a transaction executes every second, but only stores its data every 60 times and there is an avg ( datapoint [0:59]), the value that is stored once a minute is the average of the values collected every second.
Data Point Functions
106 Rockwell Automation Publication PLTMT-UM001M-EN-P-June 2014

Collecting Performance Data Chapter 3
Use the following data point functions:
Item Description SUM() Returns the sum of multiple parameters for data points, ranges,
numbers, or numeric expressions. DIFF() Uses two parameters to return the difference between the previous
value and the current value. The first parameter is a data point, usually a counter accumulator. The second parameter is a rollover value and is used when the current value is less than the previous value. This function has built in rollover logic used when the current value is less than the previous value. This logic calculates the difference between the rollover value and the previous value and adds the current value. • If current value > previous value, then Diff = (current value -
previous value) • If current value < previous value, then Diff = (rollover value -
previous value) + current value
AVG() Returns the average of multiple parameters for data points, ranges, numbers, or numeric expressions.
MIN() Returns the minimum value of multiple parameters for data points, ranges, numbers, or numeric expressions.
MAX() Returns the maximum value of multiple parameters for data points, ranges, numbers, or numeric expressions.
NameOf() Returns a string that contains the name of a single data point as a parameter.
ItemOf() Returns a string that contains the item or tag name of a single data point as a parameter.
StationOf() Returns a string that contains the topic name of a DDE data point as a parameter. If the data point was retrieved from RSView32, the resulting string contains the project name. If the data point was retrieved from FactoryTalk, the resulting string contains the application area and server information.
Rockwell Automation Publication PLTMT-UM001M-EN-P-June 2014 107
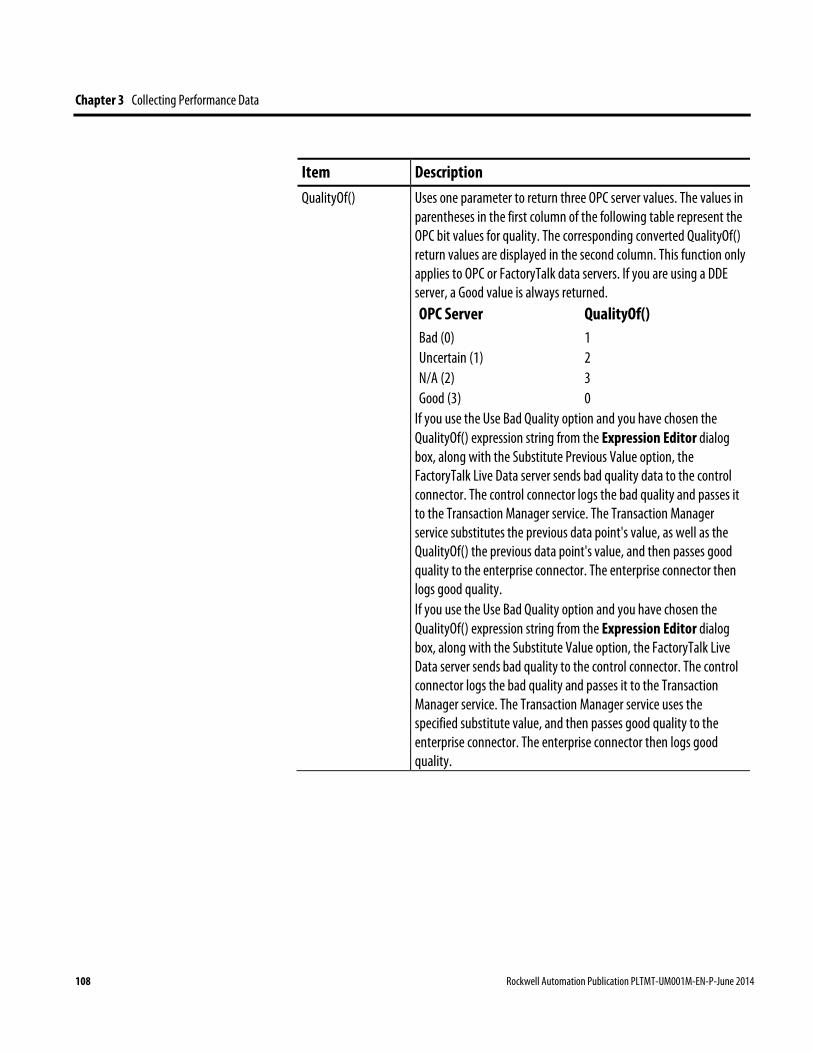
Chapter 3 Collecting Performance Data
Item Description QualityOf() Uses one parameter to return three OPC server values. The values in
parentheses in the first column of the following table represent the OPC bit values for quality. The corresponding converted QualityOf() return values are displayed in the second column. This function only applies to OPC or FactoryTalk data servers. If you are using a DDE server, a Good value is always returned. OPC Server QualityOf() Bad (0) 1 Uncertain (1) 2 N/A (2) 3 Good (3) 0
If you use the Use Bad Quality option and you have chosen the QualityOf() expression string from the Expression Editor dialog box, along with the Substitute Previous Value option, the FactoryTalk Live Data server sends bad quality data to the control connector. The control connector logs the bad quality and passes it to the Transaction Manager service. The Transaction Manager service substitutes the previous data point's value, as well as the QualityOf() the previous data point's value, and then passes good quality to the enterprise connector. The enterprise connector then logs good quality. If you use the Use Bad Quality option and you have chosen the QualityOf() expression string from the Expression Editor dialog box, along with the Substitute Value option, the FactoryTalk Live Data server sends bad quality to the control connector. The control connector logs the bad quality and passes it to the Transaction Manager service. The Transaction Manager service uses the specified substitute value, and then passes good quality to the enterprise connector. The enterprise connector then logs good quality.
108 Rockwell Automation Publication PLTMT-UM001M-EN-P-June 2014
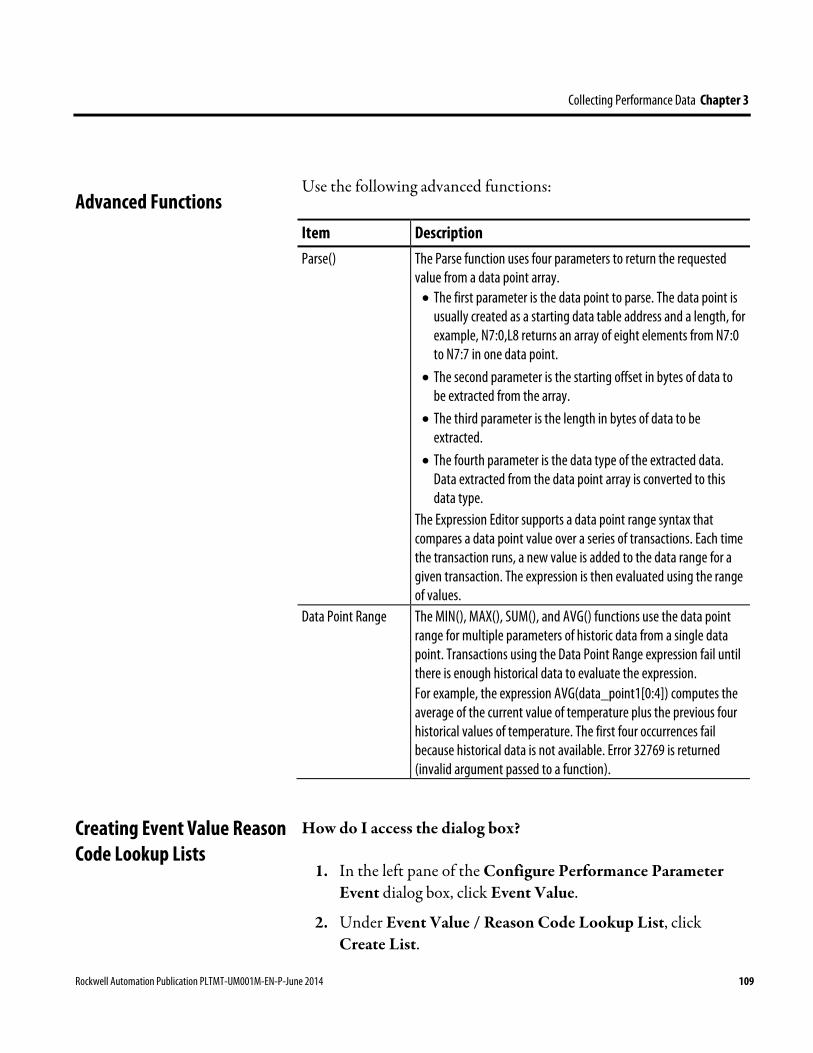
Collecting Performance Data Chapter 3
Use the following advanced functions:
Item Description Parse() The Parse function uses four parameters to return the requested
value from a data point array. • The first parameter is the data point to parse. The data point is
usually created as a starting data table address and a length, for example, N7:0,L8 returns an array of eight elements from N7:0 to N7:7 in one data point.
• The second parameter is the starting offset in bytes of data to be extracted from the array.
• The third parameter is the length in bytes of data to be extracted.
• The fourth parameter is the data type of the extracted data. Data extracted from the data point array is converted to this data type.
The Expression Editor supports a data point range syntax that compares a data point value over a series of transactions. Each time the transaction runs, a new value is added to the data range for a given transaction. The expression is then evaluated using the range of values.
Data Point Range The MIN(), MAX(), SUM(), and AVG() functions use the data point range for multiple parameters of historic data from a single data point. Transactions using the Data Point Range expression fail until there is enough historical data to evaluate the expression. For example, the expression AVG(data_point1[0:4]) computes the average of the current value of temperature plus the previous four historical values of temperature. The first four occurrences fail because historical data is not available. Error 32769 is returned (invalid argument passed to a function).
How do I access the dialog box?
1. In the left pane of the Configure Performance Parameter Event dialog box, click Event Value.
2. Under Event Value / Reason Code Lookup List, click Create List.
Advanced Functions
Creating Event Value Reason Code Lookup Lists
Rockwell Automation Publication PLTMT-UM001M-EN-P-June 2014 109

Chapter 3 Collecting Performance Data
The Lookup Code Configuration dialog box appears.
To configure an Event Value Reason Code lookup list:
1. In the Lookup Code Description box, type a name for the Event Value Reason Code lookup list.
2. Under Lookup Code Values, click Add.
The Lookup Code Value dialog box appears.
3. In the Value box, type a value.
4. In the Description box, type a description of the value.
5. Under Severity Level, select either of the following:
• Do not record a Severity Level for this Lookup Code Value
This is the default setting.
• Specify a Severity Level for this Lookup Code Value
Type a value between 0 (high severity) and 100 (low severity) that will be used to determine how serious the event is when this lookup code value is collected.
6. Select any of the following:
7. Click OK.
The value appears under Lookup Code Values.
Instead of manually configuring a lookup code list, you can import an existing list from a comma-separated values file (.csv).
NOTE If a Shift Description lookup list already contains values, you and intend to import other values to this list, the original values will be replaced with the new ones.
110 Rockwell Automation Publication PLTMT-UM001M-EN-P-June 2014

Collecting Performance Data Chapter 3
To import Shift Description lookup list values:
1. Under Previous Import File Path, click Import.
The Open dialog box appears.
2. Select a file that contains the lookup list, and then click Open.
See "Event Lookup Value CSV Format (page 72)" for the required file format of the Comma Separated Values (.csv) file.
3. Click OK.
How do I access the dialog box?
1. On the Configure menu, click FactoryTalk Metrics > Performance Parameters.
The Manage Performance Parameters dialog box appears.
2. Select the activity area for which you want to associate machine states, and then click Configure.
The Configure Performance Parameters dialog box appears.
3. If necessary, select the FactoryTalk Transaction Manager configuration for the activity area.
4. In the left pane of the dialog box, under Custom, click Events.
In the right pane of the dialog box, a list of available categories and events appears.
5. Click New.
The Configure Performance Parameter Event dialog box appears.
To configure fault metric tracking and machine states:
1. In the left pane of the dialog box, click Machine State/Faults.
2. Under Fault Metric Tracking, select one of the following:
Configuring the Machine State / Faults
Rockwell Automation Publication PLTMT-UM001M-EN-P-June 2014 111
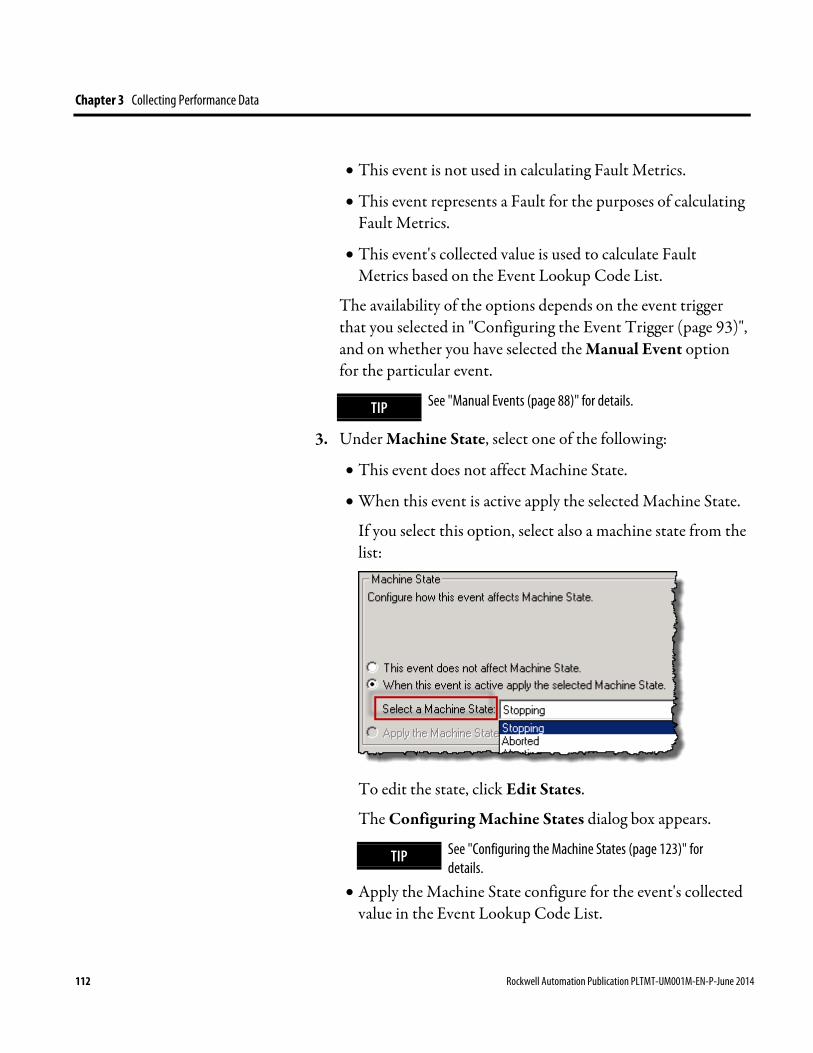
Chapter 3 Collecting Performance Data
• This event is not used in calculating Fault Metrics.
• This event represents a Fault for the purposes of calculating Fault Metrics.
• This event's collected value is used to calculate Fault Metrics based on the Event Lookup Code List.
The availability of the options depends on the event trigger that you selected in "Configuring the Event Trigger (page 93)", and on whether you have selected the Manual Event option for the particular event.
TIP See "Manual Events (page 88)" for details.
3. Under Machine State, select one of the following:
• This event does not affect Machine State.
• When this event is active apply the selected Machine State.
If you select this option, select also a machine state from the list:
To edit the state, click Edit States.
The Configuring Machine States dialog box appears.
TIP See "Configuring the Machine States (page 123)" for details.
• Apply the Machine State configure for the event's collected value in the Event Lookup Code List.
112 Rockwell Automation Publication PLTMT-UM001M-EN-P-June 2014
Collecting Performance Data Chapter 3
The availability of the options depends on the event trigger that you selected in "Configuring the Event Trigger (page 93)", and on whether you have selected the Manual Event option for the particular event.
4. Continue with "Configuring the Reporting (page 113)".
How do I access the dialog box?
1. On the Configure menu, click FactoryTalk Metrics > Performance Parameters.
The Manage Performance Parameters dialog box appears.
2. Select the activity area for which you want to associate machine states, and then click Configure.
The Configure Performance Parameters dialog box appears.
3. If necessary, select the FactoryTalk Transaction Manager configuration for the activity area.
4. In the left pane of the dialog box, under Custom, click Events.
In the right pane of the dialog box, a list of available categories and events appears.
5. Click New.
The Configure Performance Parameter Event dialog box appears.
To configure the reporting:
1. In the left pane of the dialog box, click Reporting.
2. Under Reporting Value, you may need to choose the value that will be used for the reporting purposes for the event.
Configuring the Reporting
Rockwell Automation Publication PLTMT-UM001M-EN-P-June 2014 113
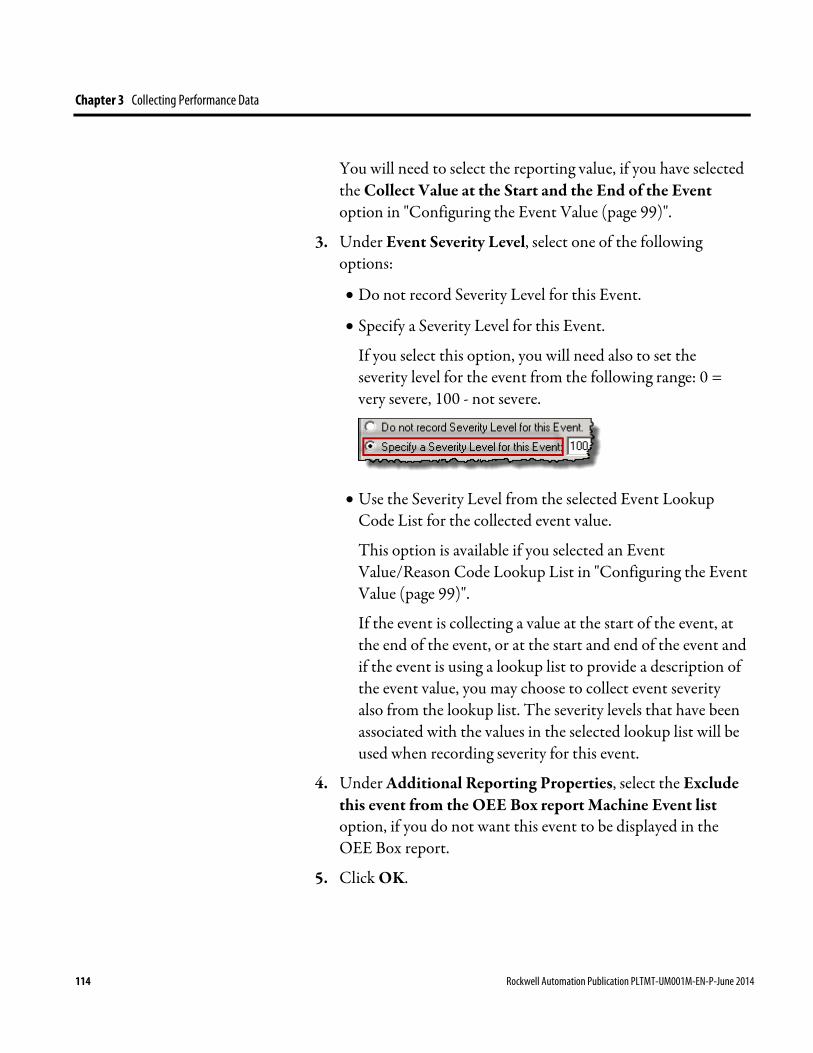
Chapter 3 Collecting Performance Data
You will need to select the reporting value, if you have selected the Collect Value at the Start and the End of the Event option in "Configuring the Event Value (page 99)".
3. Under Event Severity Level, select one of the following options:
• Do not record Severity Level for this Event.
• Specify a Severity Level for this Event.
If you select this option, you will need also to set the severity level for the event from the following range: 0 = very severe, 100 - not severe.
• Use the Severity Level from the selected Event Lookup
Code List for the collected event value.
This option is available if you selected an Event Value/Reason Code Lookup List in "Configuring the Event Value (page 99)".
If the event is collecting a value at the start of the event, at the end of the event, or at the start and end of the event and if the event is using a lookup list to provide a description of the event value, you may choose to collect event severity also from the lookup list. The severity levels that have been associated with the values in the selected lookup list will be used when recording severity for this event.
4. Under Additional Reporting Properties, select the Exclude this event from the OEE Box report Machine Event list option, if you do not want this event to be displayed in the OEE Box report.
5. Click OK.
114 Rockwell Automation Publication PLTMT-UM001M-EN-P-June 2014
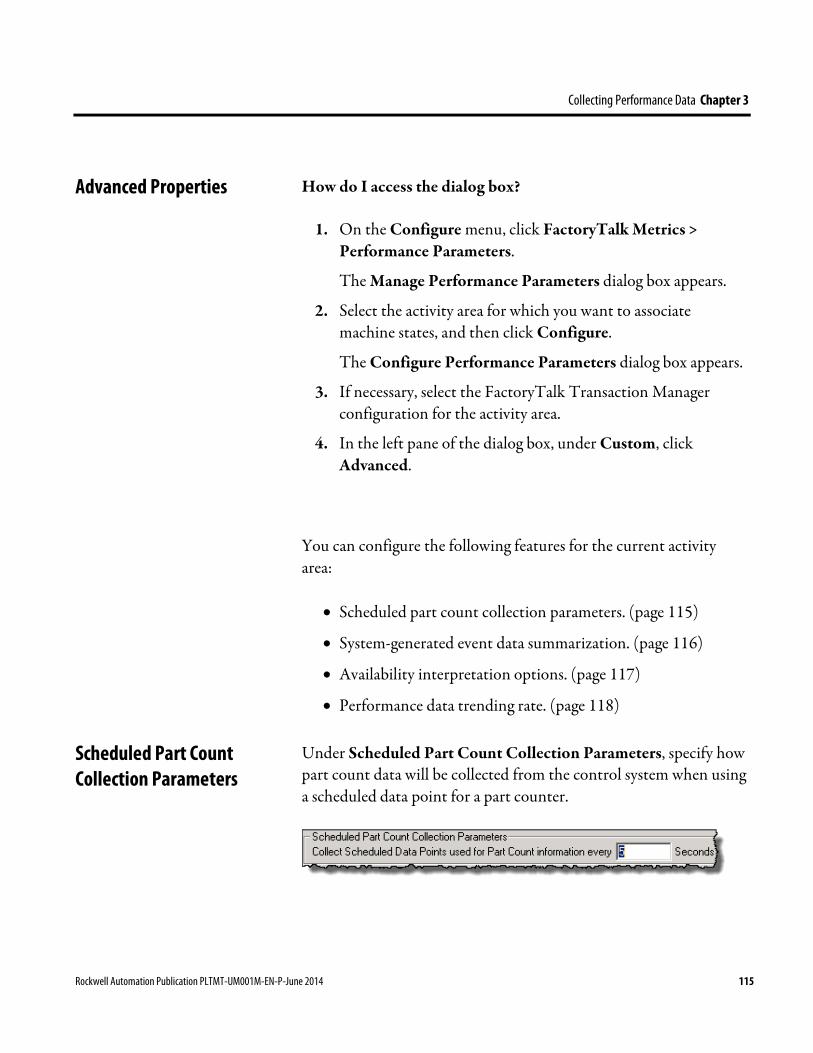
Collecting Performance Data Chapter 3
How do I access the dialog box?
1. On the Configure menu, click FactoryTalk Metrics > Performance Parameters.
The Manage Performance Parameters dialog box appears.
2. Select the activity area for which you want to associate machine states, and then click Configure.
The Configure Performance Parameters dialog box appears.
3. If necessary, select the FactoryTalk Transaction Manager configuration for the activity area.
4. In the left pane of the dialog box, under Custom, click Advanced.
You can configure the following features for the current activity area:
• Scheduled part count collection parameters. (page 115)
• System-generated event data summarization. (page 116)
• Availability interpretation options. (page 117)
• Performance data trending rate. (page 118)
Under Scheduled Part Count Collection Parameters, specify how part count data will be collected from the control system when using a scheduled data point for a part counter.
Advanced Properties
Scheduled Part Count Collection Parameters
Rockwell Automation Publication PLTMT-UM001M-EN-P-June 2014 115
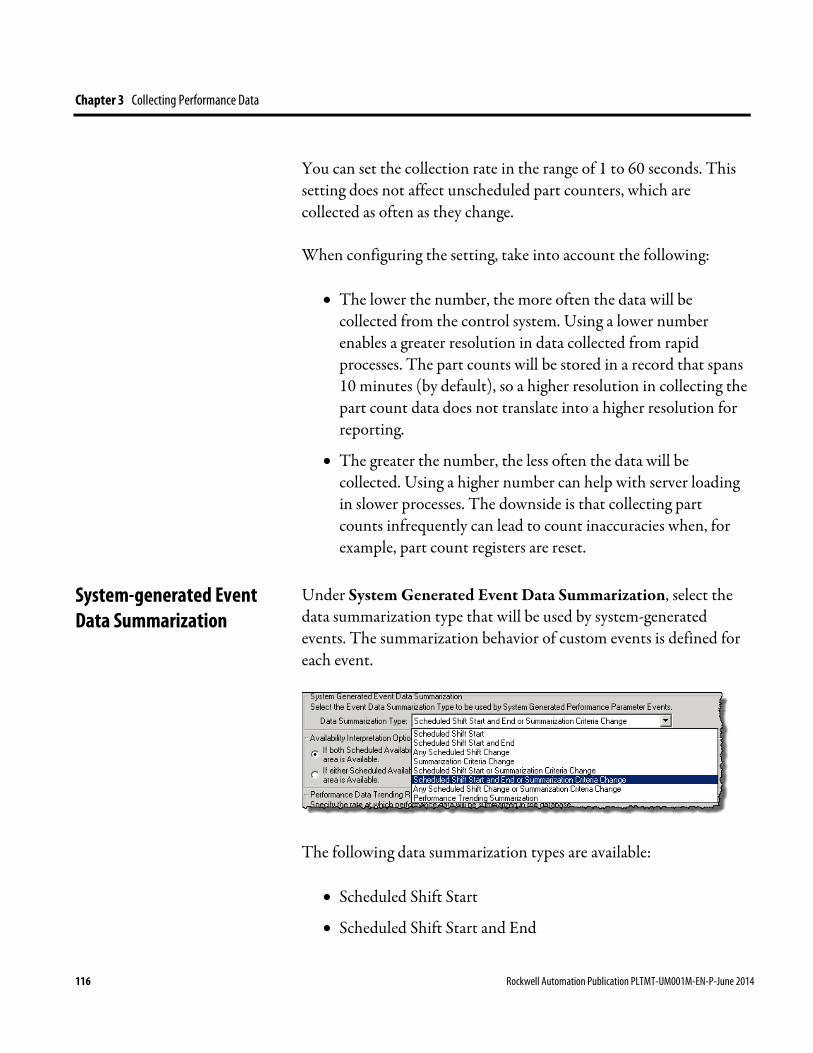
Chapter 3 Collecting Performance Data
You can set the collection rate in the range of 1 to 60 seconds. This setting does not affect unscheduled part counters, which are collected as often as they change.
When configuring the setting, take into account the following:
• The lower the number, the more often the data will be collected from the control system. Using a lower number enables a greater resolution in data collected from rapid processes. The part counts will be stored in a record that spans 10 minutes (by default), so a higher resolution in collecting the part count data does not translate into a higher resolution for reporting.
• The greater the number, the less often the data will be collected. Using a higher number can help with server loading in slower processes. The downside is that collecting part counts infrequently can lead to count inaccuracies when, for example, part count registers are reset.
Under System Generated Event Data Summarization, select the data summarization type that will be used by system-generated events. The summarization behavior of custom events is defined for each event.
The following data summarization types are available:
• Scheduled Shift Start
• Scheduled Shift Start and End
System-generated Event Data Summarization
116 Rockwell Automation Publication PLTMT-UM001M-EN-P-June 2014
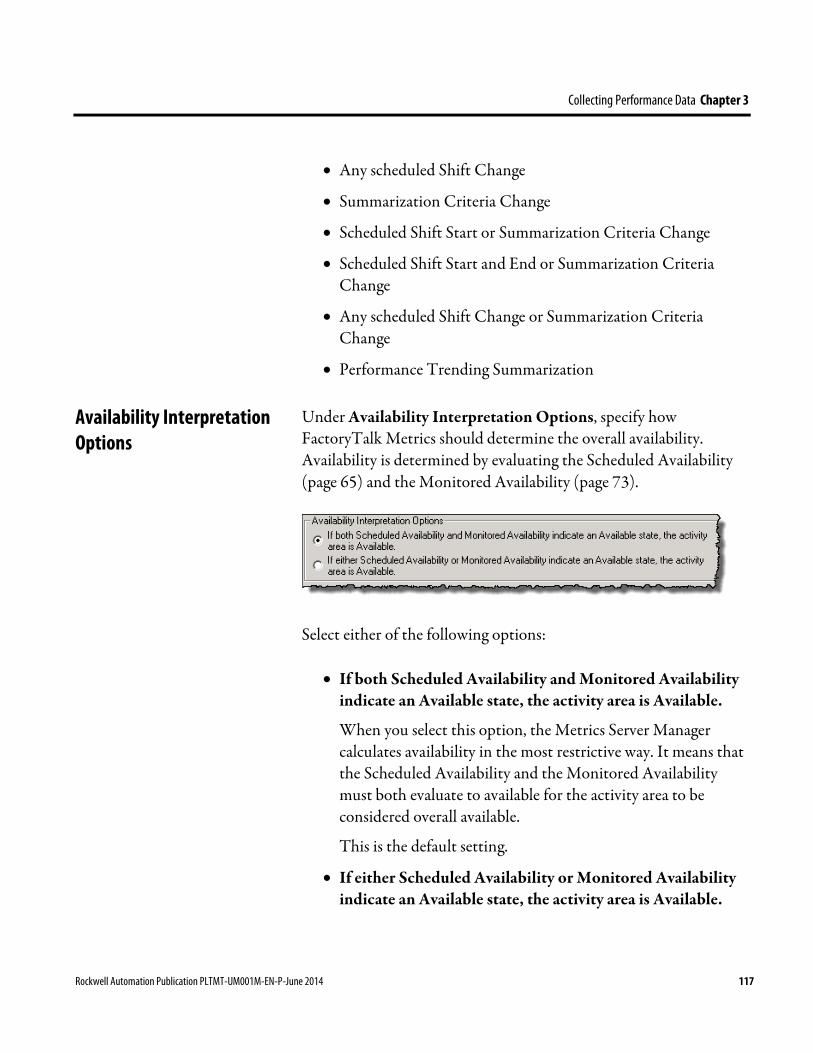
Collecting Performance Data Chapter 3
• Any scheduled Shift Change
• Summarization Criteria Change
• Scheduled Shift Start or Summarization Criteria Change
• Scheduled Shift Start and End or Summarization Criteria Change
• Any scheduled Shift Change or Summarization Criteria Change
• Performance Trending Summarization
Under Availability Interpretation Options, specify how FactoryTalk Metrics should determine the overall availability. Availability is determined by evaluating the Scheduled Availability (page 65) and the Monitored Availability (page 73).
Select either of the following options:
• If both Scheduled Availability and Monitored Availability indicate an Available state, the activity area is Available.
When you select this option, the Metrics Server Manager calculates availability in the most restrictive way. It means that the Scheduled Availability and the Monitored Availability must both evaluate to available for the activity area to be considered overall available.
This is the default setting.
• If either Scheduled Availability or Monitored Availability indicate an Available state, the activity area is Available.
Availability Interpretation Options
Rockwell Automation Publication PLTMT-UM001M-EN-P-June 2014 117
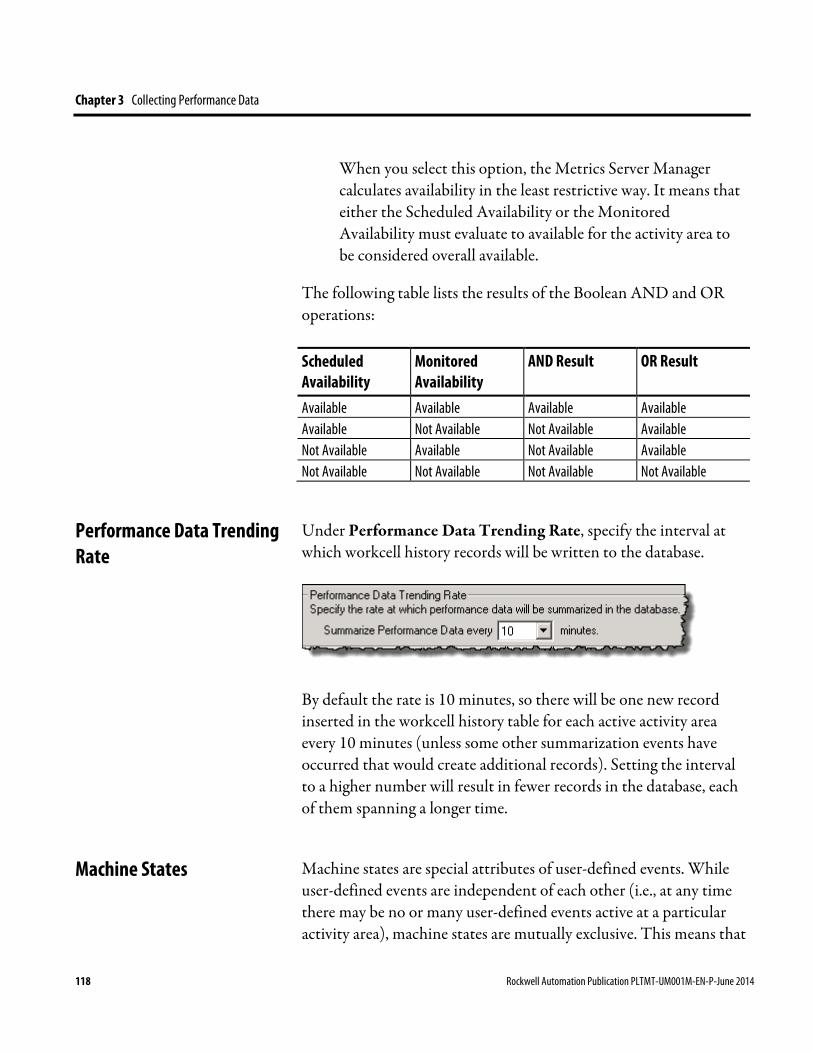
Chapter 3 Collecting Performance Data
When you select this option, the Metrics Server Manager calculates availability in the least restrictive way. It means that either the Scheduled Availability or the Monitored Availability must evaluate to available for the activity area to be considered overall available.
The following table lists the results of the Boolean AND and OR operations:
Scheduled Availability
Monitored Availability
AND Result OR Result
Available Available Available Available Available Not Available Not Available Available Not Available Available Not Available Available Not Available Not Available Not Available Not Available
Under Performance Data Trending Rate, specify the interval at which workcell history records will be written to the database.
By default the rate is 10 minutes, so there will be one new record inserted in the workcell history table for each active activity area every 10 minutes (unless some other summarization events have occurred that would create additional records). Setting the interval to a higher number will result in fewer records in the database, each of them spanning a longer time.
Machine states are special attributes of user-defined events. While user-defined events are independent of each other (i.e., at any time there may be no or many user-defined events active at a particular activity area), machine states are mutually exclusive. This means that
Performance Data Trending Rate
Machine States
118 Rockwell Automation Publication PLTMT-UM001M-EN-P-June 2014
Collecting Performance Data Chapter 3
an activity area can be in one and only one machine state at a time, and each activity area that has machine states configured is always in the machine state at all times.
The advantage of using machine states is that it is possible to account for all the time in the activity area by means of the defined machine states, without gaps and without double counting the time. If you do not use machine states, you need to implement a similar machine-state logic in the control system, if you want to collect the machine state information.
Machine states are defined for the FactoryTalk Metrics application as a whole (not for individual activity areas). Up to 99 unique machine states can be defined for a FactoryTalk Metrics application.
When you configure the performance parameters for an activity area, you can also configure the appropriate machine states for the activity area. Each activity area can be in only one machine state at a time, so all machine states should be mutually exclusive. All, some, or none of the defined machine states can be configured in a particular activity area.
Each machine state has a priority, so if multiple machine states could be active simultaneously, only the machine state with the highest priority would actually be active. If at any time the activity area is not in a defined machine state, the machine state will be logged as Undefined.
The following examples illustrate a possible approach to defining machine states, and how they can be configured for one sample activity area. The data used in the examples is not available in the sample databases.
Rockwell Automation Publication PLTMT-UM001M-EN-P-June 2014 119
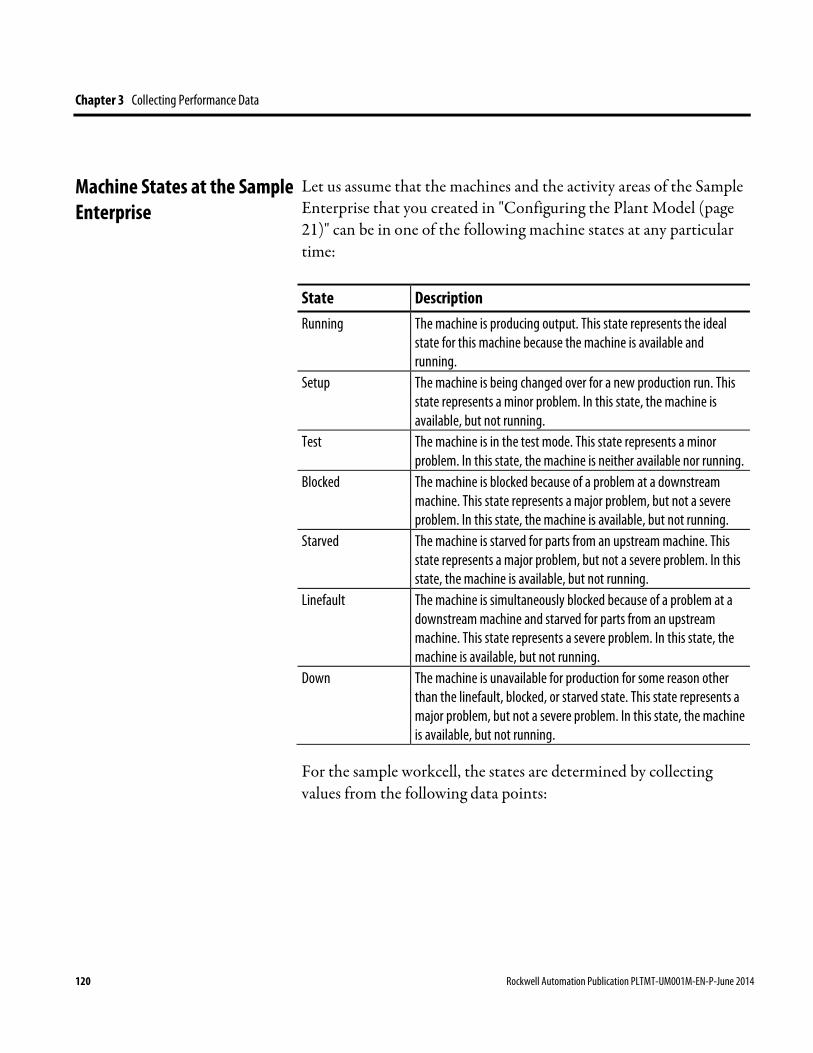
Chapter 3 Collecting Performance Data
Let us assume that the machines and the activity areas of the Sample Enterprise that you created in "Configuring the Plant Model (page 21)" can be in one of the following machine states at any particular time:
State Description Running The machine is producing output. This state represents the ideal
state for this machine because the machine is available and running.
Setup The machine is being changed over for a new production run. This state represents a minor problem. In this state, the machine is available, but not running.
Test The machine is in the test mode. This state represents a minor problem. In this state, the machine is neither available nor running.
Blocked The machine is blocked because of a problem at a downstream machine. This state represents a major problem, but not a severe problem. In this state, the machine is available, but not running.
Starved The machine is starved for parts from an upstream machine. This state represents a major problem, but not a severe problem. In this state, the machine is available, but not running.
Linefault The machine is simultaneously blocked because of a problem at a downstream machine and starved for parts from an upstream machine. This state represents a severe problem. In this state, the machine is available, but not running.
Down The machine is unavailable for production for some reason other than the linefault, blocked, or starved state. This state represents a major problem, but not a severe problem. In this state, the machine is available, but not running.
For the sample workcell, the states are determined by collecting values from the following data points:
Machine States at the Sample Enterprise
120 Rockwell Automation Publication PLTMT-UM001M-EN-P-June 2014
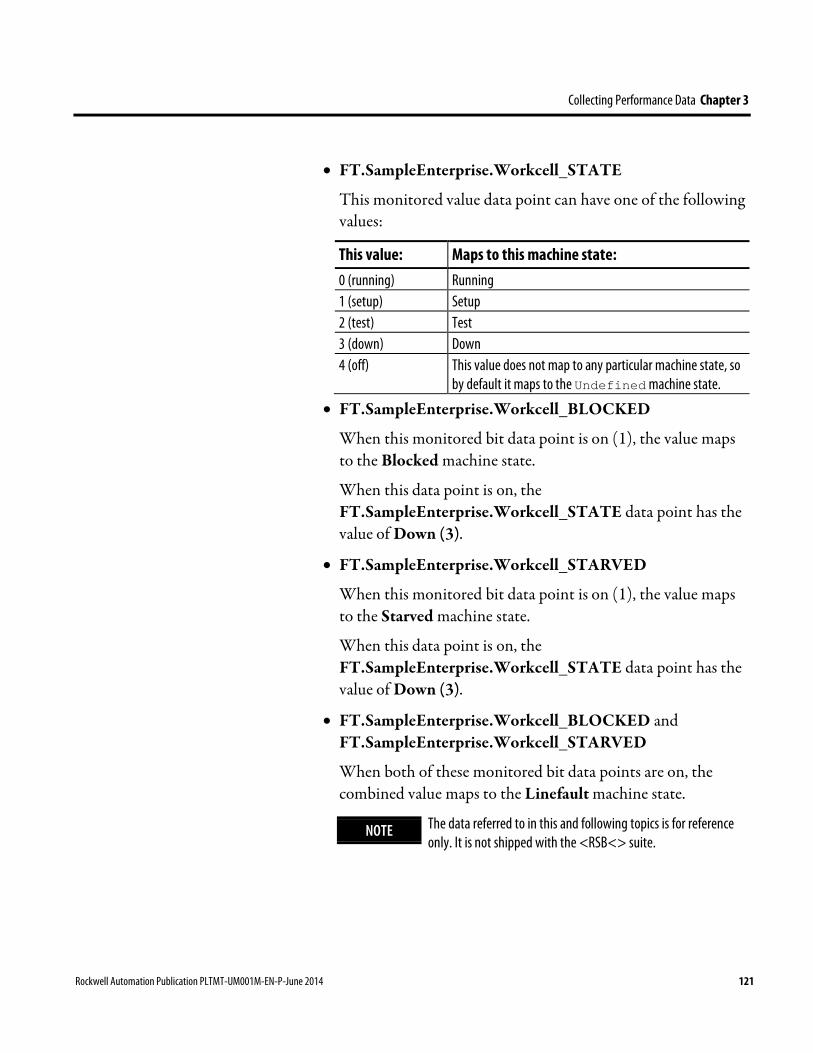
Collecting Performance Data Chapter 3
• FT.SampleEnterprise.Workcell_STATE
This monitored value data point can have one of the following values:
This value: Maps to this machine state: 0 (running) Running 1 (setup) Setup 2 (test) Test 3 (down) Down 4 (off) This value does not map to any particular machine state, so
by default it maps to the Undefined machine state.
• FT.SampleEnterprise.Workcell_BLOCKED
When this monitored bit data point is on (1), the value maps to the Blocked machine state.
When this data point is on, the FT.SampleEnterprise.Workcell_STATE data point has the value of Down (3).
• FT.SampleEnterprise.Workcell_STARVED
When this monitored bit data point is on (1), the value maps to the Starved machine state.
When this data point is on, the FT.SampleEnterprise.Workcell_STATE data point has the value of Down (3).
• FT.SampleEnterprise.Workcell_BLOCKED and FT.SampleEnterprise.Workcell_STARVED
When both of these monitored bit data points are on, the combined value maps to the Linefault machine state.
NOTE The data referred to in this and following topics is for reference only. It is not shipped with the <RSB<> suite.
Rockwell Automation Publication PLTMT-UM001M-EN-P-June 2014 121
Chapter 3 Collecting Performance Data
After you have defined your machine states, you need to configure and prioritize them.
The priority of a machine state is used by FactoryTalk Metrics to select one machine state, if the values collected from one or more user-defined events would otherwise indicate that two or more machine states should be active. If there is a situation where the values of one or more user-defined events can map to more than one machine state simultaneously, the priority is used to determine which machine state becomes active. In such a situation, the machine state with the highest priority (i.e., the lowest priority number) is selected. If there is no overlap possible between machine states, their relative priority is unimportant.
In the Sample Enterprise, we would prioritize the machine states in the following order (from the highest priority to the lowest one):
1. Linefault
This state occurs when data points for Blocked and Starved are on, so this state must have a higher priority than either of the other two states. If either Blocked or Starved had a higher priority than Linefault, the Linefault state would never occur.
2. Blocked
This state must have a higher priority than the Down state, because when a machine is blocked, it is also down, but when a machine is down, it is not necessarily blocked (it could be in the Linefault state, the Starved state, or some down condition that maps to the Down state).
The relative priority of Blocked and Starved to each other is unimportant, because when they are both active, the machine is in the Linefault machine state.
3. Starved
Prioritizing Machine States
122 Rockwell Automation Publication PLTMT-UM001M-EN-P-June 2014

Collecting Performance Data Chapter 3
This state must have a higher priority than the Down state, because when a machine is starved, it is also down, but when a machine is down, it is not necessarily starved (it could be in the Linefault state, the Blocked state, or some down condition that maps to the Down state).
The relative priority of Blocked and Starved to each other is unimportant because when they are both active, the machine is in the Linefault machine state.
4. Down
The data point that maps to this state can indicate any type of down condition (including the Linefault state, the Blocked state, the Starved state, or any other generic down condition), so it must have the lowest priority of all of the down states.
The relative priority of the Test, Setup, and Running states is unimportant, because the values of the data points used to determine the states are mutually exclusive with each other and with the down states.
In this tutorial, you will configure machine states for the Sample Enterprise.
To configure machine states:
1. On the Configure menu, click FactoryTalk Metrics > Machine States.
The Configure Machine States dialog box appears.
2. Click Add.
The Configure State dialog box appears. The dialog box is used to define the properties of an individual machine state.
Configuring Machine States
Rockwell Automation Publication PLTMT-UM001M-EN-P-June 2014 123
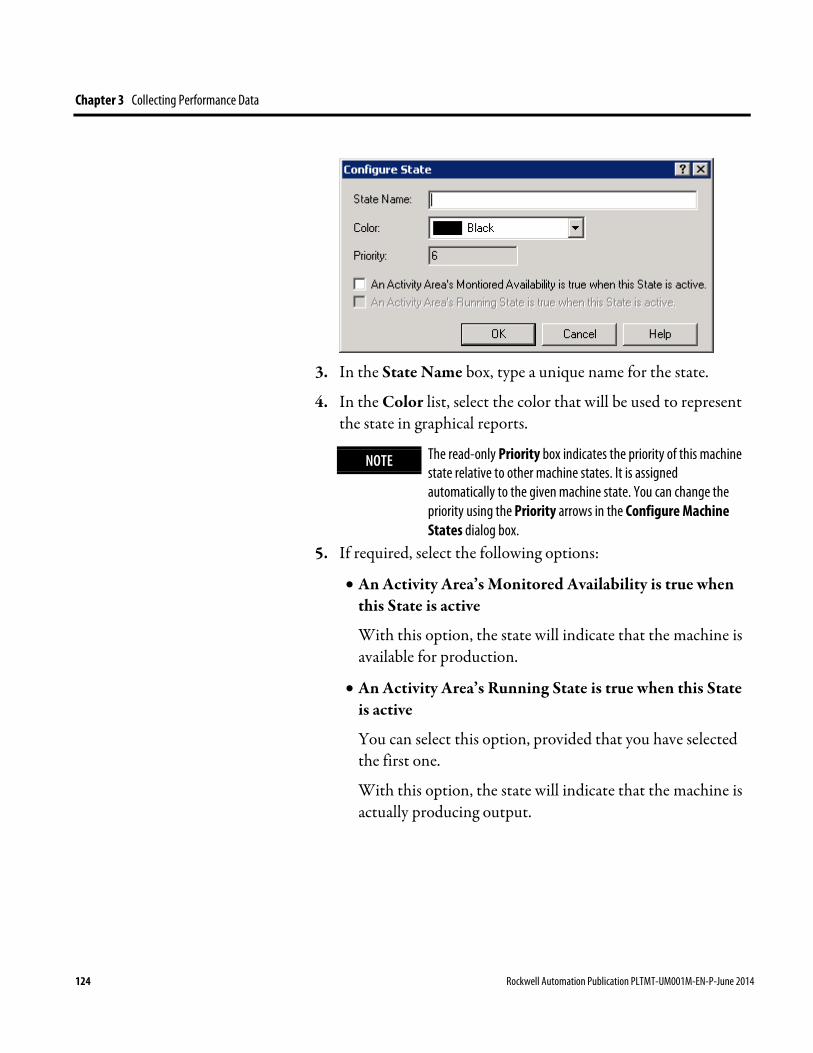
Chapter 3 Collecting Performance Data
3. In the State Name box, type a unique name for the state.
4. In the Color list, select the color that will be used to represent the state in graphical reports.
NOTE The read-only Priority box indicates the priority of this machine state relative to other machine states. It is assigned automatically to the given machine state. You can change the priority using the Priority arrows in the Configure Machine States dialog box.
5. If required, select the following options:
• An Activity Area’s Monitored Availability is true when this State is active
With this option, the state will indicate that the machine is available for production.
• An Activity Area’s Running State is true when this State is active
You can select this option, provided that you have selected the first one.
With this option, the state will indicate that the machine is actually producing output.
124 Rockwell Automation Publication PLTMT-UM001M-EN-P-June 2014
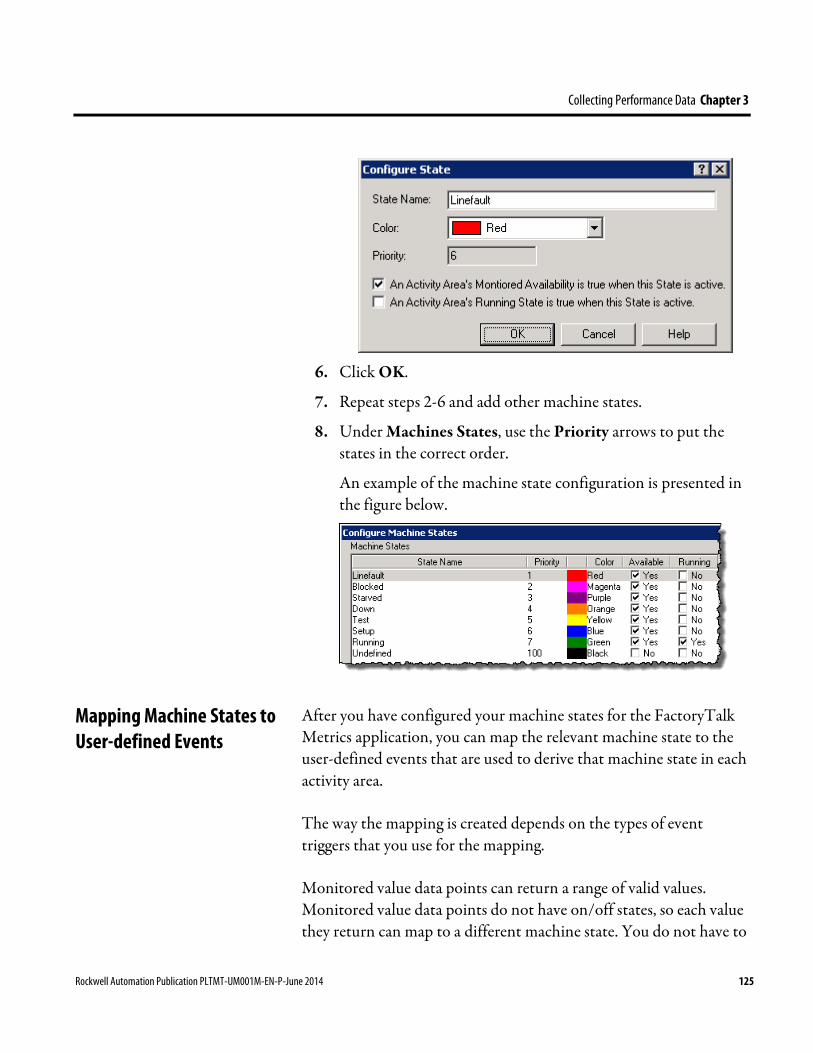
Collecting Performance Data Chapter 3
6. Click OK.
7. Repeat steps 2-6 and add other machine states.
8. Under Machines States, use the Priority arrows to put the states in the correct order.
An example of the machine state configuration is presented in the figure below.
After you have configured your machine states for the FactoryTalk Metrics application, you can map the relevant machine state to the user-defined events that are used to derive that machine state in each activity area.
The way the mapping is created depends on the types of event triggers that you use for the mapping.
Monitored value data points can return a range of valid values. Monitored value data points do not have on/off states, so each value they return can map to a different machine state. You do not have to
Mapping Machine States to User-defined Events
Rockwell Automation Publication PLTMT-UM001M-EN-P-June 2014 125
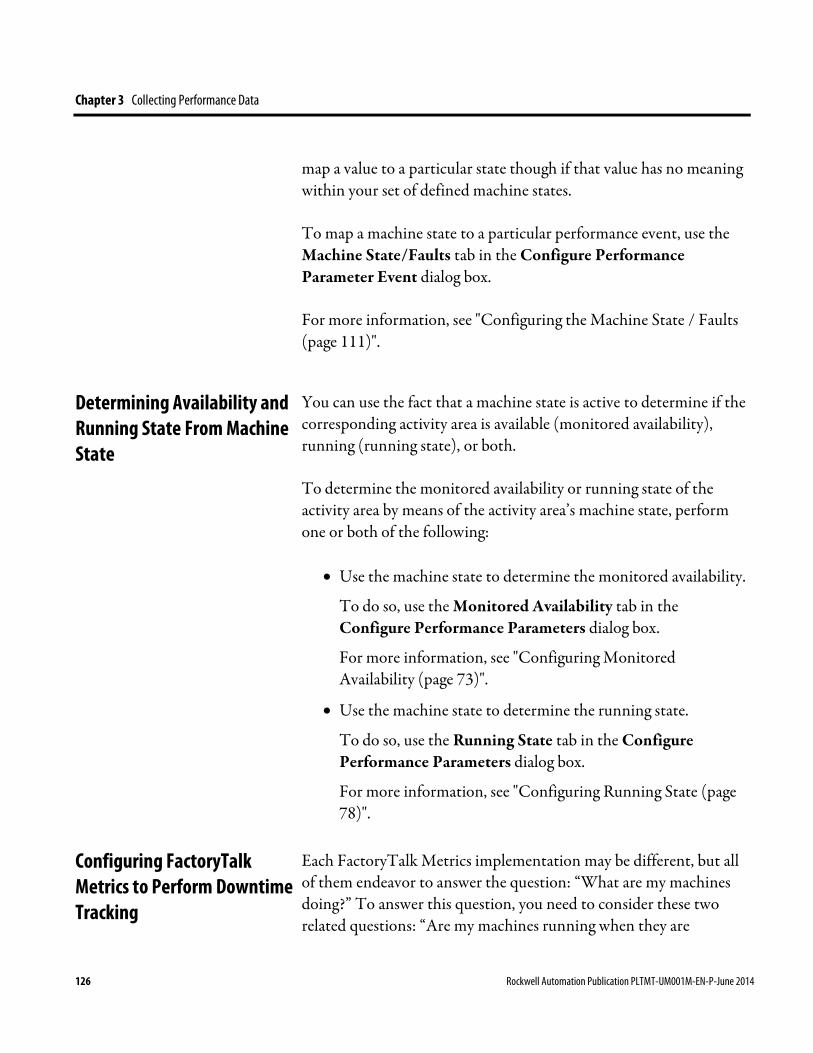
Chapter 3 Collecting Performance Data
map a value to a particular state though if that value has no meaning within your set of defined machine states.
To map a machine state to a particular performance event, use the Machine State/Faults tab in the Configure Performance Parameter Event dialog box.
For more information, see "Configuring the Machine State / Faults (page 111)".
You can use the fact that a machine state is active to determine if the corresponding activity area is available (monitored availability), running (running state), or both.
To determine the monitored availability or running state of the activity area by means of the activity area’s machine state, perform one or both of the following:
• Use the machine state to determine the monitored availability.
To do so, use the Monitored Availability tab in the Configure Performance Parameters dialog box.
For more information, see "Configuring Monitored Availability (page 73)".
• Use the machine state to determine the running state.
To do so, use the Running State tab in the Configure Performance Parameters dialog box.
For more information, see "Configuring Running State (page 78)".
Each FactoryTalk Metrics implementation may be different, but all of them endeavor to answer the question: “What are my machines doing?” To answer this question, you need to consider these two related questions: “Are my machines running when they are
Determining Availability and Running State From Machine State
Configuring FactoryTalk Metrics to Perform Downtime Tracking
126 Rockwell Automation Publication PLTMT-UM001M-EN-P-June 2014
Collecting Performance Data Chapter 3
supposed to?” and “What are they doing when they are not running?” Downtime tracking can answer these questions for you.
The word “downtime” is frequently used, but may mean different things to different people. All of the following are possible definitions of downtime:
• Any time the machine is not running.
• Any on-shift time the machine is not running.
• Any on-shift time when predefined conditions cause the machine to stop (this excludes other conditions from downtime).
• Any on-shift time, except certain conditions (like blocked or starved) when predefined conditions cause the machine to stop.
• Any time the machine is in a predefined fault condition.
Further, when someone says they want to see downtime reports, they may want to see:
• All the time, divided into categories like running and downtime.
• All the downtime.
• The downtime divided into predefined categories.
• The downtime divided into predefined categories with reason codes entered by the operator.
• The downtime by machine, shift, part, operator, etc.
It is important that you carefully consider the definition of downtime and the reporting requirements of your organization, before you start a downtime tracking project. In addition, there are three distinct approaches to downtime tracking with FactoryTalk
Rockwell Automation Publication PLTMT-UM001M-EN-P-June 2014 127
Chapter 3 Collecting Performance Data
Metrics that you should evaluate for your organization. Each approach has its own advantages and considerations:
• Running versus downtime. (page 128)
• User-defined downtime events. (page 129)
• Machine state. (page 130)
This measure of downtime is suitable for the organizations that consider downtime to be "any time a machine is available to produce parts, but is not actually running".
By default, an activity area is assumed to be always available and always running; however, this default configuration does not allow you to collect downtime for the activity area. To collect downtime, you need to provide a method to determine the machine availability and a running indicator from the control system.
To define the monitored availability of an activity area, use the Monitored Availability tab in the Configure Performance Parameters dialog box.
You can set there the available time to be collected from the control system, or to be defined by a time pattern (or a shift schedule), and modified by the Monitored Availability setting. You can also define a data point or a formula from the control system that indicates when the monitored machine is running.
For more information, see "Configuring Monitored Availability (page 73)".
To report on the difference between the available time and running time (i.e., the time when the machine was available but not running), use the Downtime Seconds column in the PlantMetrics Workcell History report data source.
Running Versus Downtime
128 Rockwell Automation Publication PLTMT-UM001M-EN-P-June 2014

Collecting Performance Data Chapter 3
To report on running versus downtime data, use the Running Percent and Downtime Percent columns in the PlantMetrics Workcell Detail report data source.
For more information, see "Report Data Sources (page 261)".
The advantage of using the method of downtime tracking is that very little configuration or control system data is required. The disadvantage of this method is that all the non-running time is lumped together, making it impossible to determine the downtime causes.
The ability to configure user-defined events in FactoryTalk Metrics allows you to collect and report on virtually any event that happens on the factory floor, provided that the event can be detected by the control system. This is the most powerful capability of the product, and through it FactoryTalk Metrics can illuminate all sorts of conditions (e.g., machine component behavior, setups and changeovers, quality checks).
With user-defined events, downtime can be tracked to the lowest level of detail that is implemented in the control system. To effectively track downtime, control system indicators of a downtime condition, as well as reason indicators, should be implemented as separate user-defined events, and be collected in a category called “Downtime”. Create as many different events as should be useful. The more distinct events are logged, the better picture of downtime causes can be created.
You should also identify any conditions that may impact the machine output that are not caused by machine failure (if that is your definition of downtime) and configure user-defined events for them. Examples might be setups, changeovers, or material delays. Again, the more granular you can make the events, the better.
User-defined Downtime Events
Rockwell Automation Publication PLTMT-UM001M-EN-P-June 2014 129
Chapter 3 Collecting Performance Data
User-defined events can also be configured as Faults, for the purposes of calculating Mean Time Between Failure (MTBF) and other metrics. Considering only the Fault events as downtime is another option for downtime reporting.
Reports of user-defined events can be created using the PlantMetrics Event History report data source, with specific filters applied so that only the data associated with the desired events or event categories is displayed.
For more information, see "Report Data Sources (page 261)".
The disadvantage of this method of downtime tracking is the possibility that at any point in time an activity area may not be experiencing any user-defined event, or may be experiencing more than one user-defined event. For example, a downtime event often causes other events to occur, resulting in multiple events being active at one time. This makes it difficult to account for all the time accurately without implementing the non-overlapping event logic in the control system.
Using machine states to track downtime allows you to configure a state model for each activity area so that the whole time will be attributed to a defined machine state. This will ensure that all the time is accounted for in defined machine states, and no time is double counted. The Machine State capability allows you to prioritize the states in such a way that if there is more than one state which theoretically could occur at the same time, then the state with the highest priority becomes active. This prevents the problems associated with a downtime event causing other events to occur.
To use machine states to track downtime:
1. Configure the machine states relevant to your activity areas.
Machine State
130 Rockwell Automation Publication PLTMT-UM001M-EN-P-June 2014
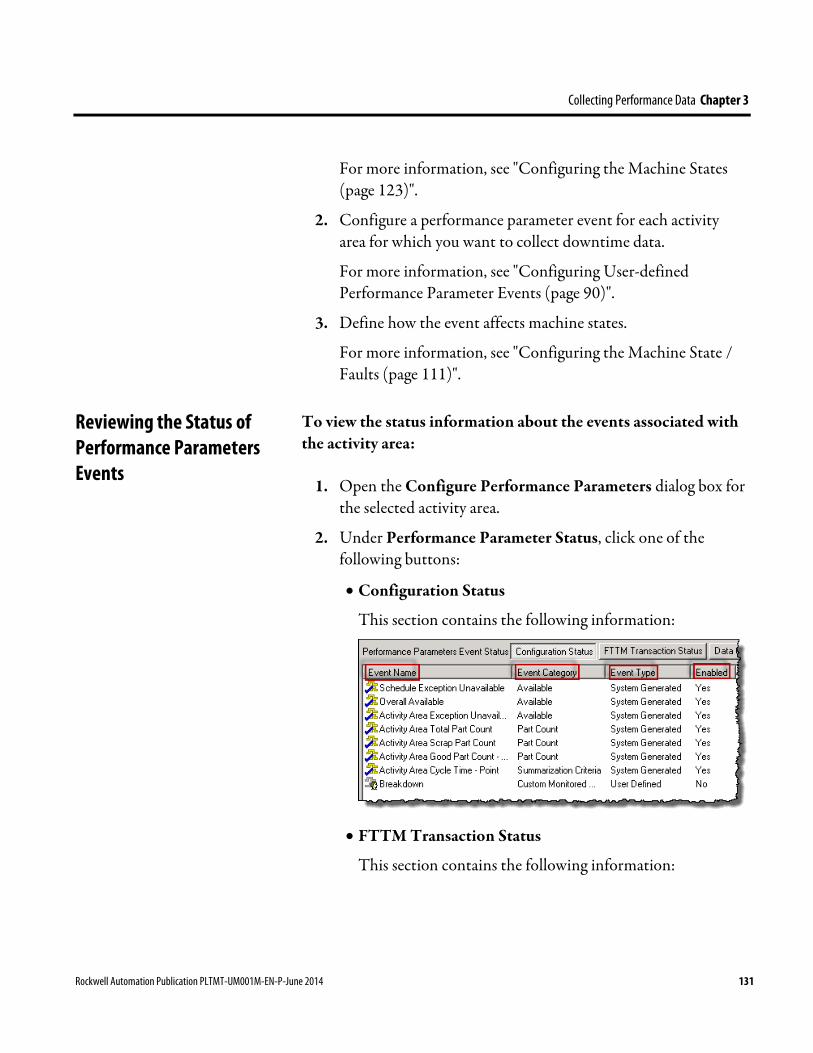
Collecting Performance Data Chapter 3
For more information, see "Configuring the Machine States (page 123)".
2. Configure a performance parameter event for each activity area for which you want to collect downtime data.
For more information, see "Configuring User-defined Performance Parameter Events (page 90)".
3. Define how the event affects machine states.
For more information, see "Configuring the Machine State / Faults (page 111)".
To view the status information about the events associated with the activity area:
1. Open the Configure Performance Parameters dialog box for the selected activity area.
2. Under Performance Parameter Status, click one of the following buttons:
• Configuration Status
This section contains the following information:
• FTTM Transaction Status
This section contains the following information:
Reviewing the Status of Performance Parameters Events
Rockwell Automation Publication PLTMT-UM001M-EN-P-June 2014 131

Chapter 3 Collecting Performance Data
Review the following for additional information.
This column: Indicates whether or not: Created The transaction was created when you enabled data collection for the activity area. The Not Applicable value
means that the event does not require input from the control system, therefore, the transaction has not been created. Manual events whose trigger type is Manual active/inactive event or Manual monitored continuous event have the Not Applicable value.
Valid The transaction is valid in FactoryTalk Transaction Manager. Up To Date The transaction bindings are up-to-date and match the configured event. If the transaction is invalid and/or the
bindings are not up-to-date, you may want to regenerate the transactions.
• Data Collection Status
This section contains the following information:
The information is displayed after the FactoryTalk Transaction Manager configuration has been started and the system is collecting data for the activity area.
3. You may want to do either of the following:
• To regenerate the transactions, under Data Collection, click Generate Transactions.
The following message appears:
132 Rockwell Automation Publication PLTMT-UM001M-EN-P-June 2014
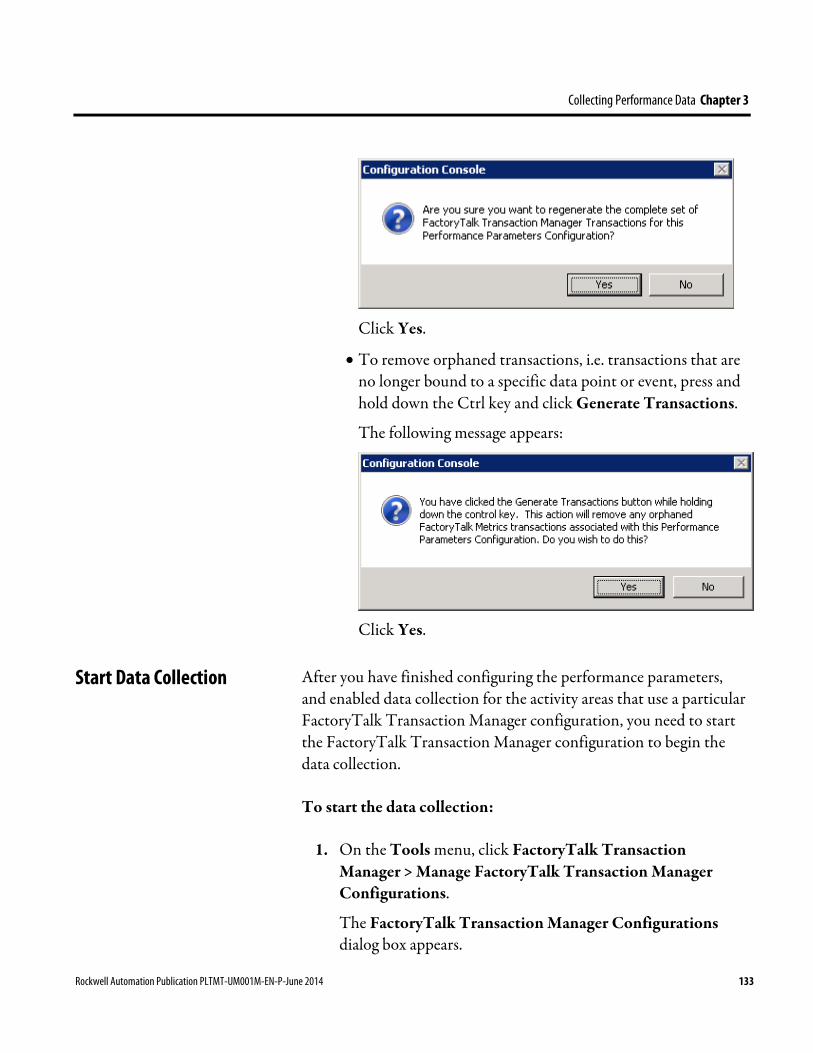
Collecting Performance Data Chapter 3
Click Yes.
• To remove orphaned transactions, i.e. transactions that are no longer bound to a specific data point or event, press and hold down the Ctrl key and click Generate Transactions.
The following message appears:
Click Yes.
After you have finished configuring the performance parameters, and enabled data collection for the activity areas that use a particular FactoryTalk Transaction Manager configuration, you need to start the FactoryTalk Transaction Manager configuration to begin the data collection.
To start the data collection:
1. On the Tools menu, click FactoryTalk Transaction Manager > Manage FactoryTalk Transaction Manager Configurations.
The FactoryTalk Transaction Manager Configurations dialog box appears.
Start Data Collection
Rockwell Automation Publication PLTMT-UM001M-EN-P-June 2014 133
Chapter 3 Collecting Performance Data
It lists the FactoryTalk Transaction Manager configurations that have been imported, and the applications to which they apply. In the dialog box, you can evaluate the running status of FactoryTalk Transaction Manager configurations that are collecting data from the control system, as well as start, stop, or restart the configurations.
2. Select a FactoryTalk Transaction Manager configuration, and then click Start.
The configuration is started. The green traffic light icon ( ) indicates that the configuration is running and collecting data from the control system.
To stop the data collection:
1. In the FactoryTalk Transaction Manager Configurations dialog box, select a FactoryTalk Transaction Manager configuration, and then click Stop.
The red traffic light icon ( ) indicates that the configuration is not running.
FactoryTalk Metrics allows you to manually enter information that cannot be collected from the control system in real time. With the manual data collection, you can perform the following tasks:
• Add reason codes and comments to user-defined events.
• Adjust total, good, and scrap part counts.
• Add reason codes and comments to scrap events.
• Change the amount of available time.
This functionality along with other functions is also available in Report Expert. For a complete list of the functions related to the manual data collection, refer to the Report Expert Release Notes.
Stop Data Collection
Manual Data Collection
134 Rockwell Automation Publication PLTMT-UM001M-EN-P-June 2014

Collecting Performance Data Chapter 3
NOTE: To perform the manual data collection, you must be granted the Manage FactoryTalk Metrics Manual Data Collection privilege by your RSBizWare administrator.
To manually edit collected data:
1. On the Tools menu, click FactoryTalk Metrics > Manual Data Collection.
The FactoryTalk Metrics Detail / Manual Data Collection dialog box appears.
2. Expand the tree items under PlantMetrics Demo Area, until you get to PlantMetrics Demo Workcell - Simple Collection:
TIP: If you do not see the PlantMetrics Demo Area items, you probably have not loaded the FactoryTalk Metrics sample data to your RSBizWare database. See "Loading Sample Activity Areas (page 23)" for details.
When you click each item under the selected activity area, a set of values is displayed in the right pane of the dialog box:
When you click: These values are displayed: Counts The count values that were collected during the specified
period of time for the selected activity area. In this table, you can modify the good parts, scrap parts, and total part values for the activity area.
Rockwell Automation Publication PLTMT-UM001M-EN-P-June 2014 135

Chapter 3 Collecting Performance Data
When you click: These values are displayed: Event The user-defined events that occurred during the specified
period of time for the selected activity area. In this table, you can type reason codes and comments for each user-defined event.
OEE The OEE and other performance values calculated from the values collected during a specified period of time for the selected activity area. In this table, you cannot edit any records.
Schedule The shift-related time values that were collected during the specified period of time for the selected activity area. In this table, you can modify the scheduled available and actual available values for the activity area.
Scrap The scrap events that occurred during the specified period of time for the selected activity area. In this table, you can type comments for the scrap event. If the scrap event has a lookup list associated with it, you may also type a reason code for the scrap event.
3. Click Schedule.
In the right pane of the dialog box, a set of toolbars and a table appear.
The time selection toolbar (marked with the red frame in the figure above) controls the time period for which the data will be displayed in the table. By default, the past two hours are displayed. If you want to modify a record that was collected more than two hours ago, use the tools on the toolbar to change the time period:
136 Rockwell Automation Publication PLTMT-UM001M-EN-P-June 2014

Collecting Performance Data Chapter 3
Click: To:
Update the table with the data range that you have chosen.
Show data without any time filters applied.
Show data between a start and end date. For example:
Show data for the past X time units. For example:
Show data for the past X time units before the end date that you have specified. For example:
Show data for the next X time units after the start date that you have specified. For example:
Click , and then , if the data is not loaded automatically.
The table is populated with all data that has been collected for this activity area.
4. Right-click a record that you want to edit, and then click
Manual Data Collection Properties.
The FactoryTalk Metrics Manual Data Collection dialog box appears.
The content of the dialog box differs depending on what record type (Count, Event, Schedule, OEE, Schedule, or Scrap) you want to change.
Rockwell Automation Publication PLTMT-UM001M-EN-P-June 2014 137
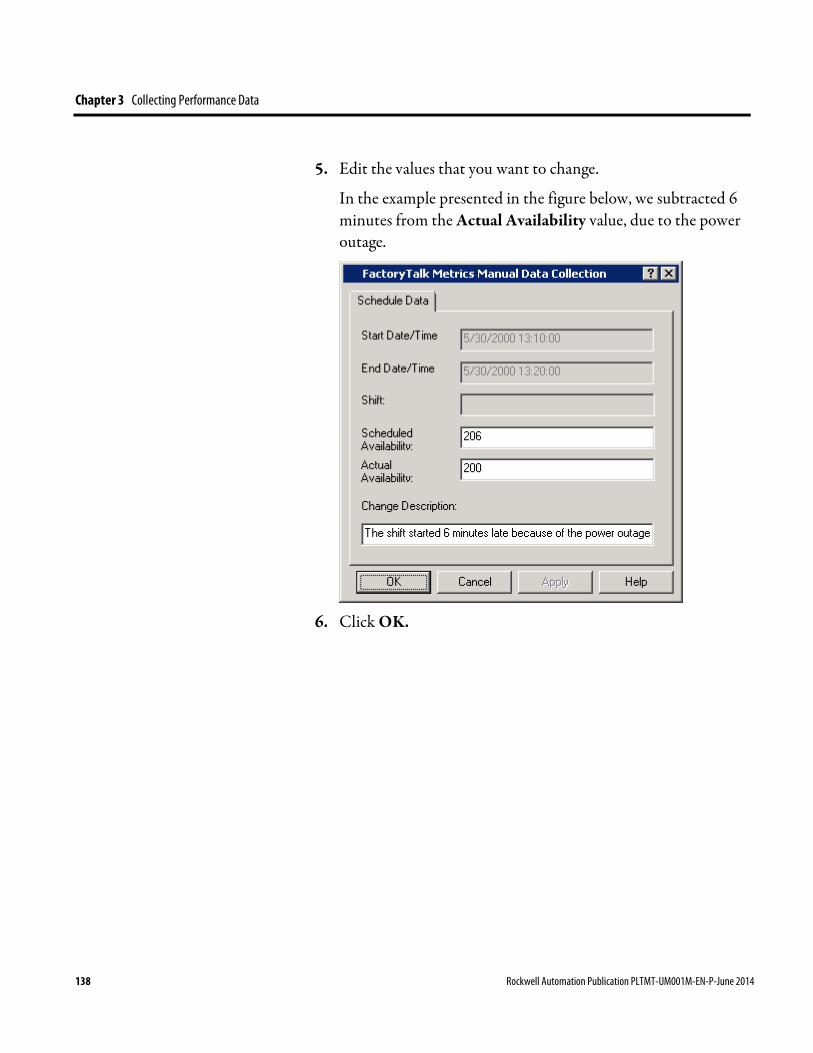
Chapter 3 Collecting Performance Data
5. Edit the values that you want to change.
In the example presented in the figure below, we subtracted 6 minutes from the Actual Availability value, due to the power outage.
6. Click OK.
138 Rockwell Automation Publication PLTMT-UM001M-EN-P-June 2014
Chapter 4
Automated Configuration
FactoryTalk Metrics contains additional software and content which is designed to reduce the time it takes to implement a FactoryTalk Metrics system. This content automates the configuration of FactoryTalk Metrics, if you have Rockwell Automation ControlLogix controllers that can utilize a user-defined type (UDT).
The additional content provided with FactoryTalk Metrics includes:
• FactoryTalk Metrics UDT (page 139).
• FactoryTalk Metrics Configuration Tool (page 154).
If you collect data with a ControlLogix controller and you wish to incorporate them in the FactoryTalk Metrics data collection, use the user-defined data type (UDT) named FTM_Workcell. It is a workcell template that contains a comprehensive set of tags that are typically used with FactoryTalk Metrics.
The FTM_ UDT is used by the FactoryTalk Metrics Configuration Tool to automatically configure performance parameters of selected FactoryTalk Metrics workcells. Each tag from the FTM_Workcell UDT is used for a particular performance parameter. Each workcell in the plant model uses a different instance of the UDT in the control system, while all of workcells are identically configured.
Once the UDT tags are imported to FactoryTalk Metrics, you can modify the performance parameters manually in the Configuration Console.
FactoryTalk Metrics UDT
Rockwell Automation Publication PLTMT-UM001M-EN-P-June 2014 139

Chapter 4 Automated Configuration
The following table lists the UDT tags from a ControlLogix controller and their corresponding performance parameters in FactoryTalk Metrics. You may need to modify the UDT tags in the controller to ensure that they contain valid data for FactoryTalk Metrics to collect.
All the items listed in the table are unscheduled, unless otherwise stated.
These items of the UDT workcell template: Are mapped to these performance parameters in FactoryTalk Metrics:
Item Data type Item Description PartId STRING Part Id Identifies the product being produced at the workcell.
Its value changes when the workcell produces a different part. You must coordinate this value with the part count values by associating the part counts with the correct Part Id.
IdealCT REAL Ideal Cycle Time The time required for one part to pass through the workcell under ideal conditions. It is a real value, represented in seconds. Usually, the Ideal Cycle Time value changes only if the Part Id changes.
GoodParts INT Good Part Count The number of the first quality parts produced by the workcell. It acts like an accumulator and increases in value. The value never decreases unless it is reset.
ScrapParts INT Scrap Part Count The number of parts produced by a workcell that cannot be categorized as Good Parts. From the machine-efficiency perspective, the parts have no value, and the cycle time taken to produce them at the current workcell has been wasted. It acts like an accumulator and increases in value. The value never decreases unless it is reset.
UDT Tags and FactoryTalk Metrics Performance Parameters
140 Rockwell Automation Publication PLTMT-UM001M-EN-P-June 2014
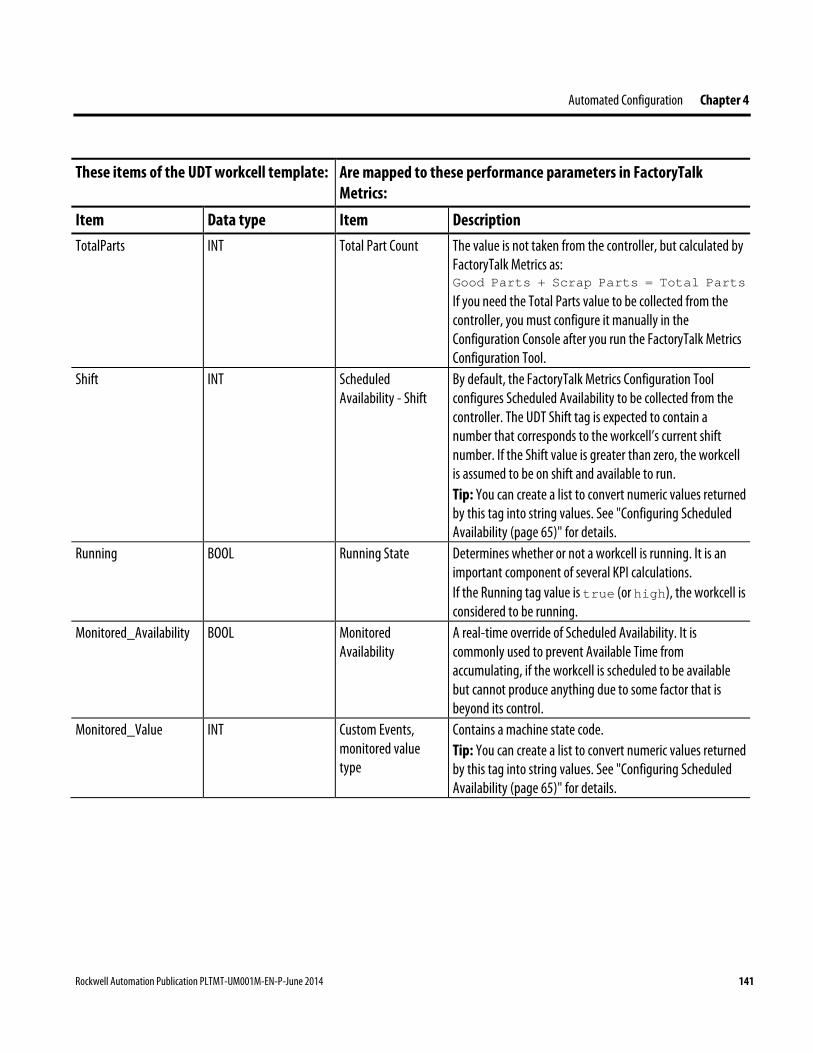
Automated Configuration Chapter 4
These items of the UDT workcell template: Are mapped to these performance parameters in FactoryTalk Metrics:
Item Data type Item Description TotalParts INT Total Part Count The value is not taken from the controller, but calculated by
FactoryTalk Metrics as: Good Parts + Scrap Parts = Total Parts If you need the Total Parts value to be collected from the controller, you must configure it manually in the Configuration Console after you run the FactoryTalk Metrics Configuration Tool.
Shift INT Scheduled Availability - Shift
By default, the FactoryTalk Metrics Configuration Tool configures Scheduled Availability to be collected from the controller. The UDT Shift tag is expected to contain a number that corresponds to the workcell’s current shift number. If the Shift value is greater than zero, the workcell is assumed to be on shift and available to run. Tip: You can create a list to convert numeric values returned by this tag into string values. See "Configuring Scheduled Availability (page 65)" for details.
Running BOOL Running State Determines whether or not a workcell is running. It is an important component of several KPI calculations. If the Running tag value is true (or high), the workcell is considered to be running.
Monitored_Availability BOOL Monitored Availability
A real-time override of Scheduled Availability. It is commonly used to prevent Available Time from accumulating, if the workcell is scheduled to be available but cannot produce anything due to some factor that is beyond its control.
Monitored_Value INT Custom Events, monitored value type
Contains a machine state code. Tip: You can create a list to convert numeric values returned by this tag into string values. See "Configuring Scheduled Availability (page 65)" for details.
Rockwell Automation Publication PLTMT-UM001M-EN-P-June 2014 141

Chapter 4 Automated Configuration
These items of the UDT workcell template: Are mapped to these performance parameters in FactoryTalk Metrics:
Item Data type Item Description Events_Digital BOOL[32] Custom Events (with
no event values) An array of Boolean values interpreted by FactoryTalk Metrics as triggers for 10 user-defined digital events. Each of the values in the array should represent a single important event that FactoryTalk Metrics will capture (such as downtime, light curtain break, product changeover, etc.). The start of an event is indicated by a change in the trigger value from 0 to 1 (or low to high). The end of an event is indicated by a change in the trigger value from 1 to 0 (or high to low). Once the events are imported to FactoryTalk Metrics, edit the performance parameters and give the events meaningful names for reporting purposes. See "Modifying Performance Parameters (page 168)" for details.
Events_Analog FTM_AnalogEvent[5] Custom Events (with event values)
An array of 5 occurrences of the FTM_AnalogEvent UDT. The FTM_AnalogEvent UDT is an array of one Boolean value and one integer value. The Boolean values represent triggers. The 5 triggers are interpreted by FactoryTalk Metrics as triggers for 5 analog events. The 5 integer values are interpreted as event values, usually reason codes for events. The event values are scheduled. Each of the trigger/value pairs is independent, and indicates that an important workcell event occurs. The trigger value changes from 0 to 1 (or low to high) when the event to track occurs, and changes back to 0 (or low) when the event ends. The controller copies the event value to the Value tag before the event ends and the trigger returns to low. Each trigger/value pair indicates only one distinct event that may have multiple causes (e.g., downtime, operator stop, etc.). Once the events are imported to FactoryTalk Metrics, edit the performance parameters and give the events meaningful names for reporting purposes. Assign also lookup lists to translate the integer values returned in the Value tag to string values. See "Modifying Performance Parameters (page 168)" for details.
Trigger BOOL Event Trigger Value INT Event Value
142 Rockwell Automation Publication PLTMT-UM001M-EN-P-June 2014

Automated Configuration Chapter 4
These items of the UDT workcell template: Are mapped to these performance parameters in FactoryTalk Metrics:
Item Data type Item Description Flex_Integer INT[5] Flex Fields (Integer
type) An array of 5 integer flex fields. This type of flex fields is not used by the FactoryTalk Metrics Configuration Tool. If you want to use it, you need to configure the performance parameters manually, and change the flex field tag from Flex_String to Flex_Integer.
Flex_Bool BOOL[32] Flex Fields (Boolean type)
An array of 32 boolean flex fields. This type of flex fields is not used by the FactoryTalk Metrics Configuration Tool. If you want to use it, you need to configure the performance parameters manually, and change the flex field tag from Flex_String to Flex_Integer.
Flex_String STRING[5] Flex Fields (String type)
An array of 5 string flex fields. A FactoryTalk Metrics application can have 5 flex fields, or user-defined summarization criteria. The fields can be an integer, boolean, or string. Flex fields are defined system-wide for all workcells. They usually contain values necessary for providing context for performance reporting. The FactoryTalk Metrics Configuration Tool chooses the string tag for each flex field.
In the following steps you will learn how to set up communication between a ControlLogix controller and FactoryTalk Metrics in your RSBizWare environment.
We assume that you have already performed the following actions:
• Configured your RSBizWare environment, including:
• The installation of RSLinx Enterprise
• The configuration of user-define summarization fields (flex-fields) with string value data types.
• Created a plant model for your facility.
You should create entries in the plant model for at least the site, area, line, and workcell levels shown, because this is the
Setting up Communication Between a ControlLogix Controller and FactoryTalk Metrics
Rockwell Automation Publication PLTMT-UM001M-EN-P-June 2014 143
Chapter 4 Automated Configuration
plant model structure that is used in the Report Expert report templates. Typically, machines that are to be monitored by FactoryTalk Metrics are defined at the workcell level. The FactoryTalk Metrics Configuration Tool only configures plant model entries at the workcell level.
If you want to create the RSBizWare environment from scratch, refer to the following documents:
• RSBizWare Administration Guide, section "Performing a clean installation of RSBizWare".
You will find here information on installing and configuring your RSBizWare environment.
• This document, section "The Plant Model (page 20)".
You will find here information on creating a plant model.
Once you configured your RSBizWare environment, follow these steps to configure the communication between your ControlLogix controller and FactoryTalk Metrics:
1. Configure RSLinx Enterprise. (page 144).
2. Import the FactoryTalk Metrics UDT to the ControlLogix controller (page 148).
3. Create tags based on the FactoryTalk Metrics UDT (page 150).
4. Create FactoryTalk Transaction Manager and FactoryTalk Metrics configurations (page 154).
TIP Perform the following steps on the computer on which you have installed RSLinx Enterprise.
Configure RSLinx Enterprise as an OPC server so that you can use the FactoryTalk Metrics UDT in ControlLogix controllers to establish communication with FactoryTalk Metrics. Other OPC
Configuring RSLinx Enterprise
144 Rockwell Automation Publication PLTMT-UM001M-EN-P-June 2014
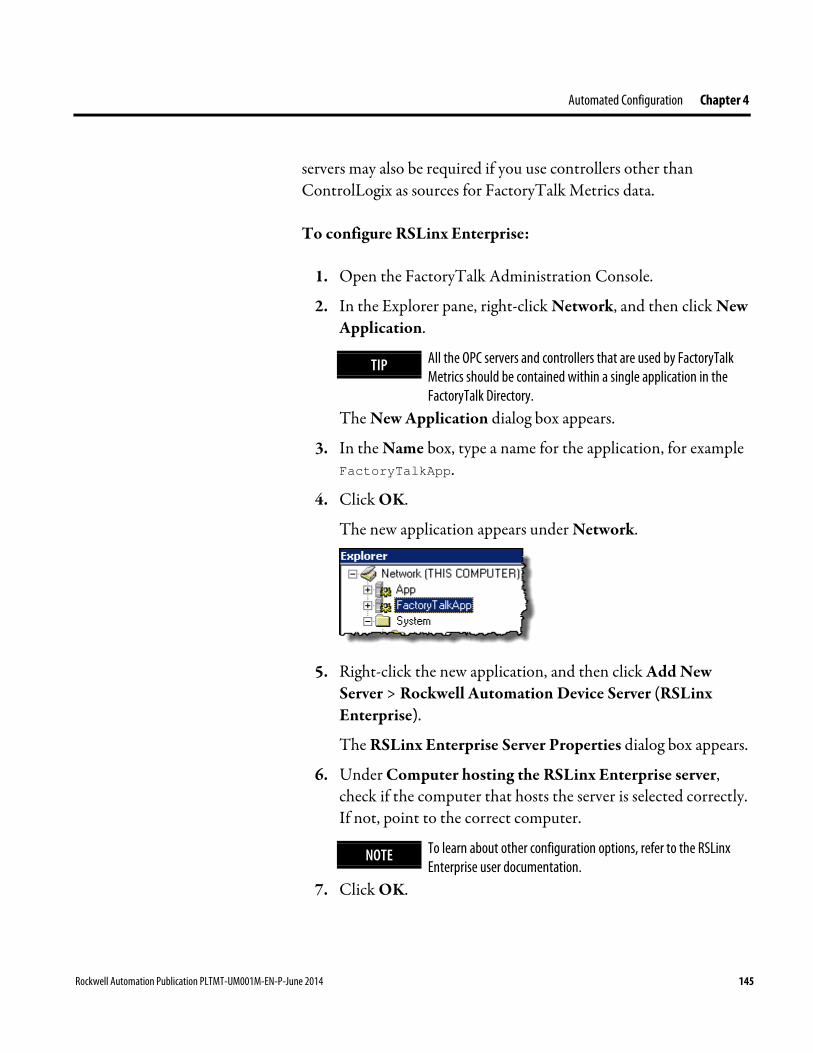
Automated Configuration Chapter 4
servers may also be required if you use controllers other than ControlLogix as sources for FactoryTalk Metrics data.
To configure RSLinx Enterprise:
1. Open the FactoryTalk Administration Console.
2. In the Explorer pane, right-click Network, and then click New Application.
TIP All the OPC servers and controllers that are used by FactoryTalk Metrics should be contained within a single application in the FactoryTalk Directory.
The New Application dialog box appears.
3. In the Name box, type a name for the application, for example FactoryTalkApp.
4. Click OK.
The new application appears under Network.
5. Right-click the new application, and then click Add New
Server > Rockwell Automation Device Server (RSLinx Enterprise).
The RSLinx Enterprise Server Properties dialog box appears.
6. Under Computer hosting the RSLinx Enterprise server, check if the computer that hosts the server is selected correctly. If not, point to the correct computer.
NOTE To learn about other configuration options, refer to the RSLinx Enterprise user documentation.
7. Click OK.
Rockwell Automation Publication PLTMT-UM001M-EN-P-June 2014 145

Chapter 4 Automated Configuration
The new server appears under the application.
8. (Optional) Add an area:
TIP Areas organize and subdivide a distributed network application into logical or physical divisions. For example, separate areas may correspond to separate manufacturing lines in a facility, separate plants in different geographical locations, or different manufacturing processes.
1. Right-click the new application, and then click New Area.
The New Area dialog box appears.
2. In the Name box, type a name for the new area, for example FactoryTalkArea1.
3. Click OK.
The new area appears under the application.
9. Expand the RSLinx Enterprise server item, and then
double-click Communication Setup.
10. In the right pane of the window, under Device Shortcuts, click Add.
A new shortcut appears with the default name, available for editing.
11. Type a name for the shortcut, for example Filler, and then press Enter.
146 Rockwell Automation Publication PLTMT-UM001M-EN-P-June 2014
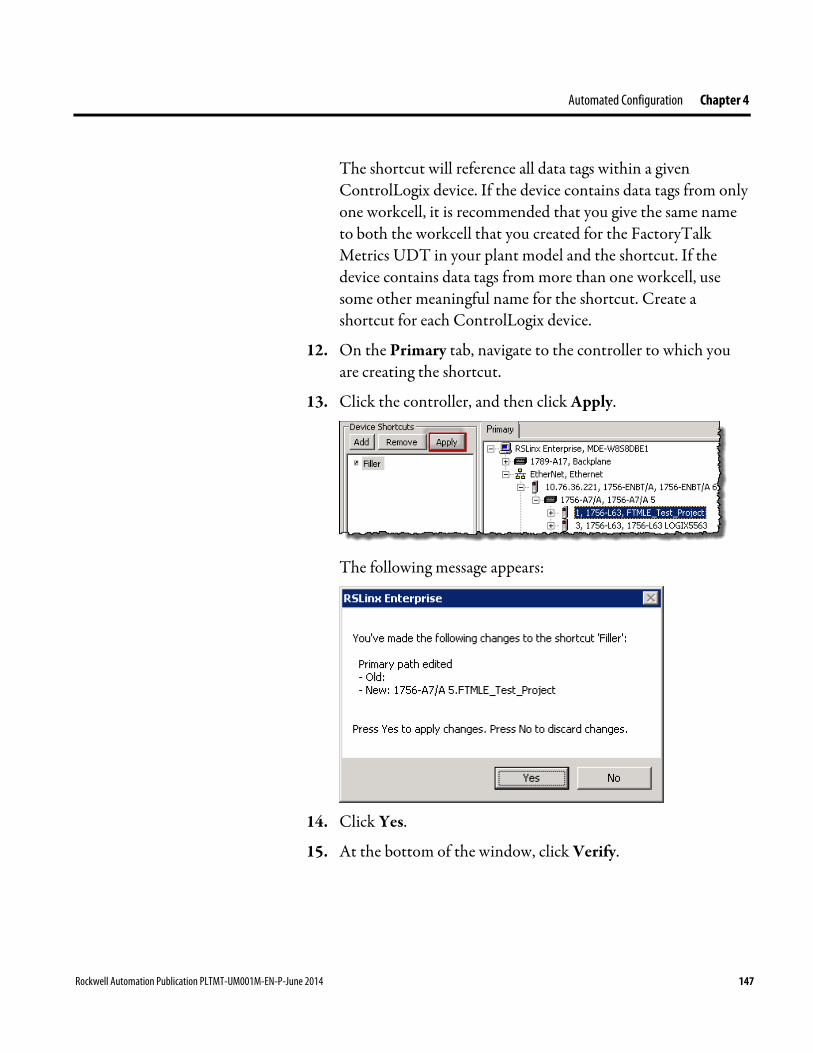
Automated Configuration Chapter 4
The shortcut will reference all data tags within a given ControlLogix device. If the device contains data tags from only one workcell, it is recommended that you give the same name to both the workcell that you created for the FactoryTalk Metrics UDT in your plant model and the shortcut. If the device contains data tags from more than one workcell, use some other meaningful name for the shortcut. Create a shortcut for each ControlLogix device.
12. On the Primary tab, navigate to the controller to which you are creating the shortcut.
13. Click the controller, and then click Apply.
The following message appears:
14. Click Yes.
15. At the bottom of the window, click Verify.
Rockwell Automation Publication PLTMT-UM001M-EN-P-June 2014 147
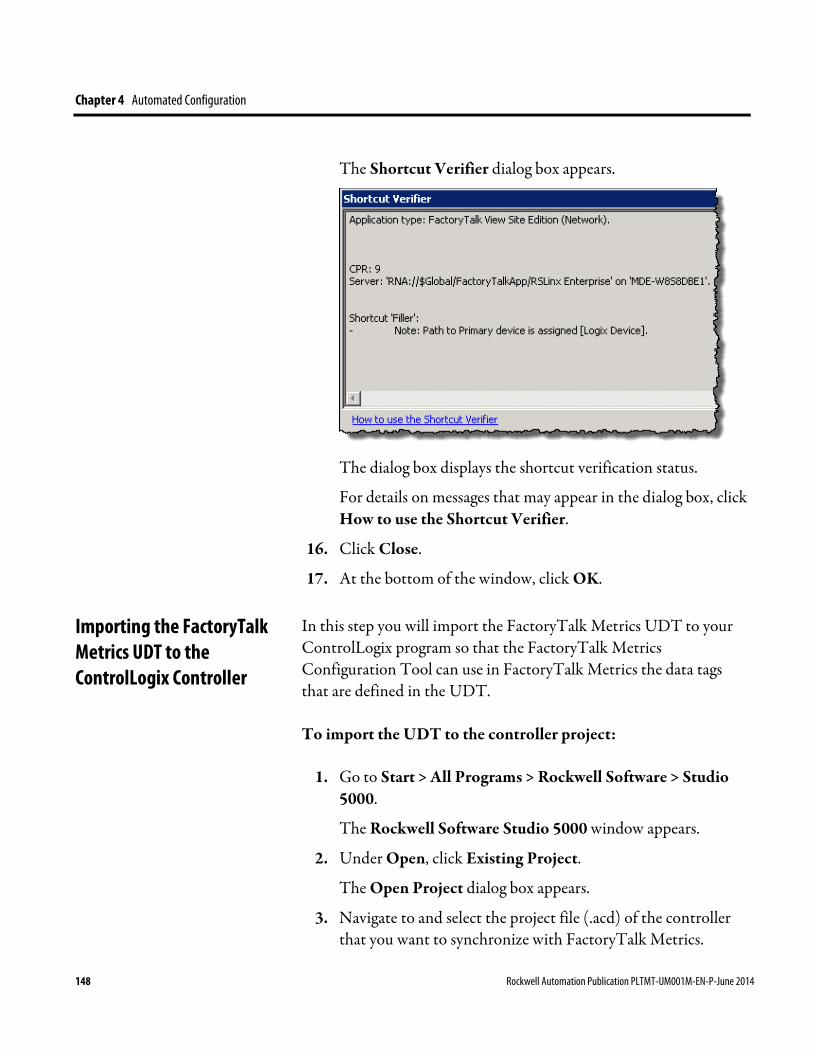
Chapter 4 Automated Configuration
The Shortcut Verifier dialog box appears.
The dialog box displays the shortcut verification status.
For details on messages that may appear in the dialog box, click How to use the Shortcut Verifier.
16. Click Close.
17. At the bottom of the window, click OK.
In this step you will import the FactoryTalk Metrics UDT to your ControlLogix program so that the FactoryTalk Metrics Configuration Tool can use in FactoryTalk Metrics the data tags that are defined in the UDT.
To import the UDT to the controller project:
1. Go to Start > All Programs > Rockwell Software > Studio 5000.
The Rockwell Software Studio 5000 window appears.
2. Under Open, click Existing Project.
The Open Project dialog box appears.
3. Navigate to and select the project file (.acd) of the controller that you want to synchronize with FactoryTalk Metrics.
Importing the FactoryTalk Metrics UDT to the ControlLogix Controller
148 Rockwell Automation Publication PLTMT-UM001M-EN-P-June 2014

Automated Configuration Chapter 4
4. Click Open.
The project is loaded to the Logix Designer window.
In the Controller Organizer, under Data Types, right-click User-Defined, and then Import Data Type.
The Import Data Type dialog box appears.
5. Navigate to <Program Files>\Rockwell Software\RSBizWare, and then select the FTM_Workcell.L5X file.
TIP <Program Files> represents the path to the Program Files folder in which you installed the RSBizWare suite.
6. Click Import.
The Import Configuration dialog box appears.
7. Click OK.
The following user-defined data types appear under the User-Defined folder:
• FTM_AnalogEvent
This UDT collects information for custom events. It is referenced by the FTM_Workcell UDT.
Rockwell Automation Publication PLTMT-UM001M-EN-P-June 2014 149
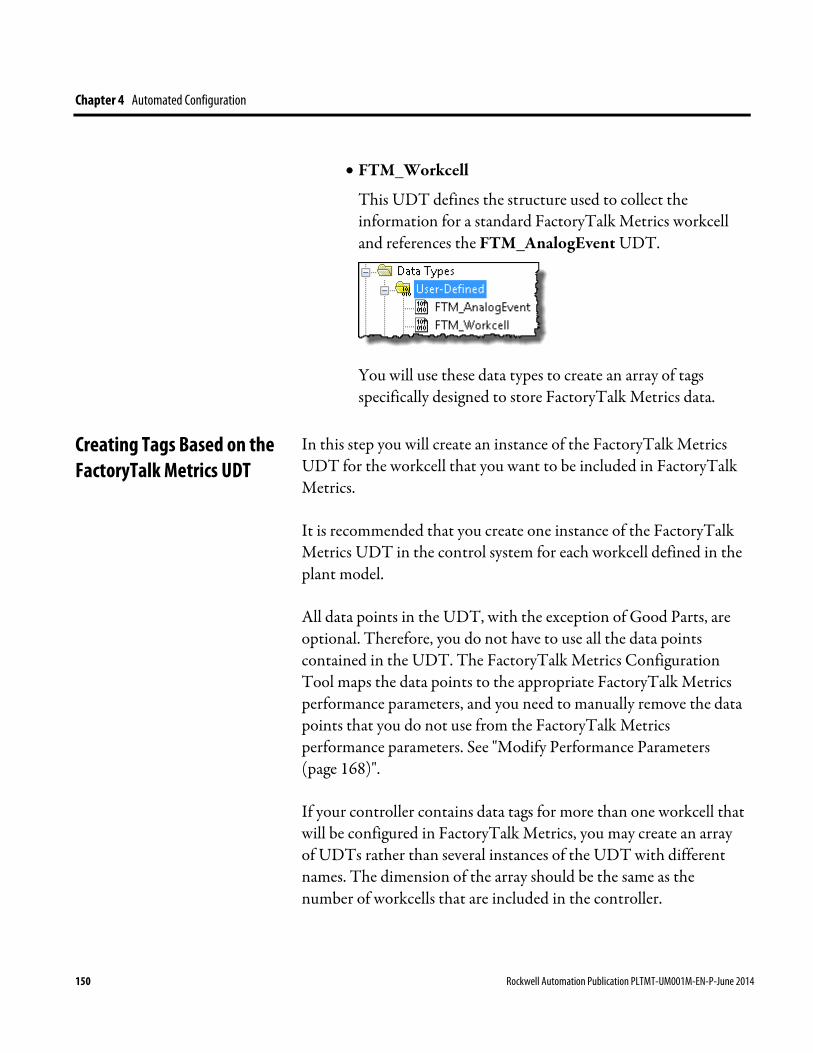
Chapter 4 Automated Configuration
• FTM_Workcell
This UDT defines the structure used to collect the information for a standard FactoryTalk Metrics workcell and references the FTM_AnalogEvent UDT.
You will use these data types to create an array of tags specifically designed to store FactoryTalk Metrics data.
In this step you will create an instance of the FactoryTalk Metrics UDT for the workcell that you want to be included in FactoryTalk Metrics.
It is recommended that you create one instance of the FactoryTalk Metrics UDT in the control system for each workcell defined in the plant model.
All data points in the UDT, with the exception of Good Parts, are optional. Therefore, you do not have to use all the data points contained in the UDT. The FactoryTalk Metrics Configuration Tool maps the data points to the appropriate FactoryTalk Metrics performance parameters, and you need to manually remove the data points that you do not use from the FactoryTalk Metrics performance parameters. See "Modify Performance Parameters (page 168)".
If your controller contains data tags for more than one workcell that will be configured in FactoryTalk Metrics, you may create an array of UDTs rather than several instances of the UDT with different names. The dimension of the array should be the same as the number of workcells that are included in the controller.
Creating Tags Based on the FactoryTalk Metrics UDT
150 Rockwell Automation Publication PLTMT-UM001M-EN-P-June 2014

Automated Configuration Chapter 4
To create an array of the FactoryTalk Metrics UDT instances:
1. In Studio 5000, in the Controller Organizer, double-click FTM_Workcell.
In the right pane of the window, tags that constitute the FTM_Workcell UDT are displayed.
For details on how the tags in the UDT relate to individual performance parameters in FactoryTalk Metrics, see "UDT Tags and FactoryTalk Metrics Performance Parameters (page 140)".
2. Under the Controller item, right-click Controller Tags, and then click New Tag.
The New Tag dialog box appears.
3. In the Name box, type a name for the array of UDTs, for example Workcell.
TIP We suggest that you use "Workcell" as the name of the UDT array, because it is the default name used by the FactoryTalk Metrics Configuration Tool.
Rockwell Automation Publication PLTMT-UM001M-EN-P-June 2014 151
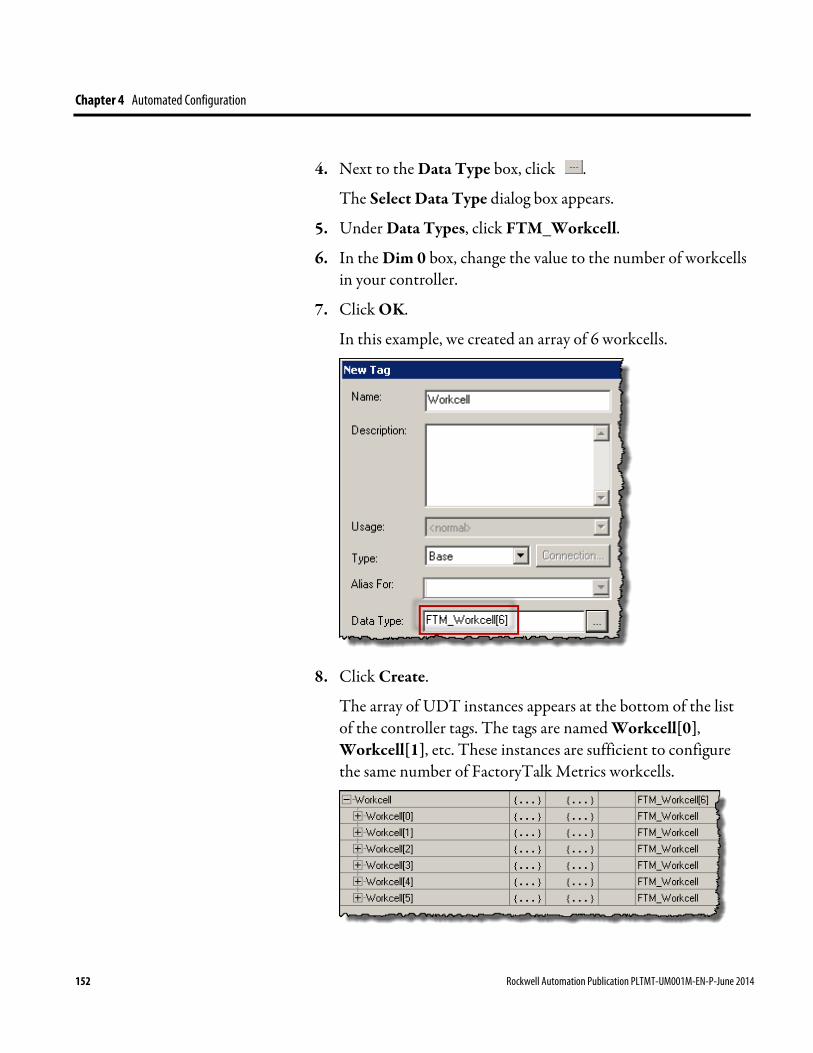
Chapter 4 Automated Configuration
4. Next to the Data Type box, click .
The Select Data Type dialog box appears.
5. Under Data Types, click FTM_Workcell.
6. In the Dim 0 box, change the value to the number of workcells in your controller.
7. Click OK.
In this example, we created an array of 6 workcells.
8. Click Create.
The array of UDT instances appears at the bottom of the list of the controller tags. The tags are named Workcell[0], Workcell[1], etc. These instances are sufficient to configure the same number of FactoryTalk Metrics workcells.
152 Rockwell Automation Publication PLTMT-UM001M-EN-P-June 2014
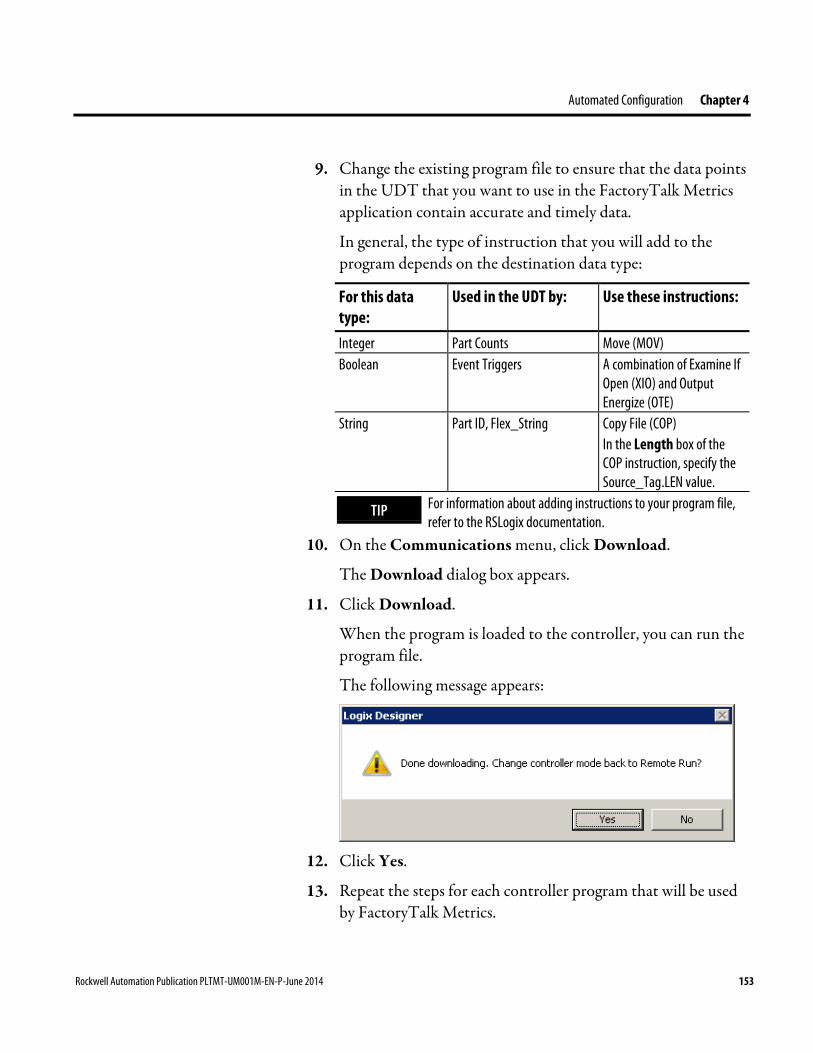
Automated Configuration Chapter 4
9. Change the existing program file to ensure that the data points in the UDT that you want to use in the FactoryTalk Metrics application contain accurate and timely data.
In general, the type of instruction that you will add to the program depends on the destination data type:
For this data type:
Used in the UDT by: Use these instructions:
Integer Part Counts Move (MOV) Boolean Event Triggers A combination of Examine If
Open (XIO) and Output Energize (OTE)
String Part ID, Flex_String Copy File (COP) In the Length box of the COP instruction, specify the Source_Tag.LEN value.
TIP For information about adding instructions to your program file, refer to the RSLogix documentation.
10. On the Communications menu, click Download.
The Download dialog box appears.
11. Click Download.
When the program is loaded to the controller, you can run the program file.
The following message appears:
12. Click Yes.
13. Repeat the steps for each controller program that will be used by FactoryTalk Metrics.
Rockwell Automation Publication PLTMT-UM001M-EN-P-June 2014 153

Chapter 4 Automated Configuration
The FactoryTalk Metrics Configuration Tool lets you enhance the process of creating configurations of multiple work cells for use in FactoryTalk Transaction Manager and FactoryTalk Metrics. Depending on the configuration type selected, certain stages of the process are automated.
With the FactoryTalk Metrics Configuration Tool you can define the following configuration types:
• PackML UDT configuration
Data is loaded from the FactoryTalk Metrics SQL Server database and a controller program with a data structure specific to the PackML user-defined data type (UDT).
Use this configuration to automatically configure certain properties of workcells using data loaded from the controller program with workcell properties from the SQL Server database, and enhance them with additional data.
• FTM UDT configuration
Data is loaded from the FactoryTalk Metrics SQL Server database with properties specific to the FTM UDT.
Use this configuration to manually modify certain properties of the workcell data loaded from the SQL Server database that are related to a given control connector.
To create a configuration, perform the following steps:
1. Select the configuration type and load workcell data (page 155).
Select the type of the configuration you want to create, and load workcells from the FactoryTalk Metrics SQL Server database (or a controller).
2. Define your FactoryTalk Transaction Manager configuration (page 157).
Creating FactoryTalk Transaction Manager and FactoryTalk Metrics Configurations
Configuration Types
Configuration Flow
154 Rockwell Automation Publication PLTMT-UM001M-EN-P-June 2014
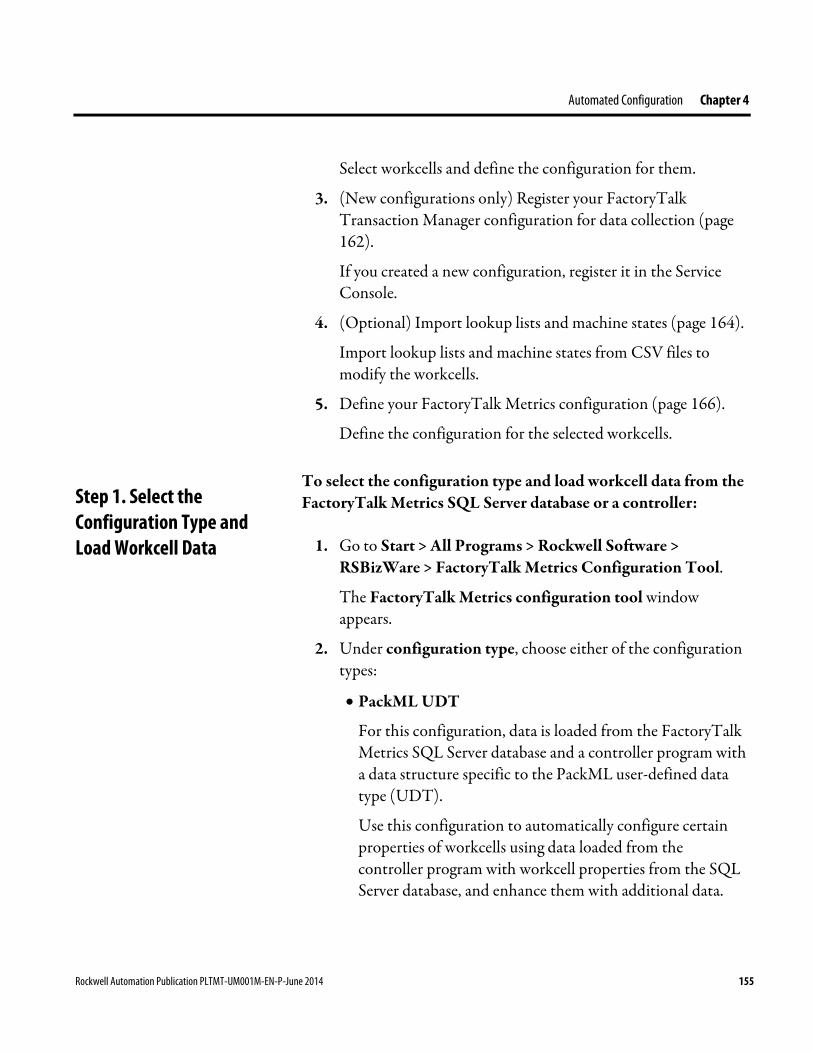
Automated Configuration Chapter 4
Select workcells and define the configuration for them.
3. (New configurations only) Register your FactoryTalk Transaction Manager configuration for data collection (page 162).
If you created a new configuration, register it in the Service Console.
4. (Optional) Import lookup lists and machine states (page 164).
Import lookup lists and machine states from CSV files to modify the workcells.
5. Define your FactoryTalk Metrics configuration (page 166).
Define the configuration for the selected workcells.
To select the configuration type and load workcell data from the FactoryTalk Metrics SQL Server database or a controller:
1. Go to Start > All Programs > Rockwell Software > RSBizWare > FactoryTalk Metrics Configuration Tool.
The FactoryTalk Metrics configuration tool window appears.
2. Under configuration type, choose either of the configuration types:
• PackML UDT
For this configuration, data is loaded from the FactoryTalk Metrics SQL Server database and a controller program with a data structure specific to the PackML user-defined data type (UDT).
Use this configuration to automatically configure certain properties of workcells using data loaded from the controller program with workcell properties from the SQL Server database, and enhance them with additional data.
Step 1. Select the Configuration Type and Load Workcell Data
Rockwell Automation Publication PLTMT-UM001M-EN-P-June 2014 155
Chapter 4 Automated Configuration
• FTM UDT
For this configuration, data is loaded from the FactoryTalk Metrics SQL Server database with properties specific to the FTM UDT.
Use this configuration to manually modify certain properties of the workcell data loaded from the SQL Server database that are related to a given control connector.
3. In the Data Source Name list, select the name of the ODBC data source configured for your RSBizWare SQL Server database.
4. In the DB user name box, type the name of your RSBizWare SQL Server database user.
5. In the DB user password box, type the password of your RSBizWare SQL Server database user.
6. In the Application name list, select the name of the application that you defined in the FactoryTalk Administration Console for your OPC server (RSLinx Classic or RSLinx Enterprise).
7. Do either of the following:
• If you have selected the PackML UDT configuration, click Load from Controller.
IMPORTANT For the PackML UDT configuration, this step is irreversible. You will not be able to change the configuration type after the data has been loaded. To start another configuration, close and then open the configuration tool again.
• If you have selected the FTM UDT configuration, click Load from Database.
The data is loaded and displayed in a list. You will use the data to create configuration files for FactoryTalk Transaction Manager and/or FactoryTalk Metrics.
156 Rockwell Automation Publication PLTMT-UM001M-EN-P-June 2014
Automated Configuration Chapter 4
8. Do any of the following:
• If you are creating a new FactoryTalk Transaction Manager configuration, go to "Step 2. Define a FactoryTalk Transaction Manager Configuration (page 157)".
• If you are creating or updating a FactoryTalk Metrics configuration, go to "Step 5. Define a FactoryTalk Metrics Configuration (page 166)".
• If you want to load additional machine states or lookup lists for your FactoryTalk Metrics configuration, go to "Step 4. Import Lookup Lists and Machine States (page 164)".
In this step you will define a FactoryTalk Transaction Manager configuration for the workcells that you will select, update the selected workcells, if needed, and import the configuration to FactoryTalk Transaction Manager.
To select workcells and define the FactoryTalk Transaction Manager configuration for them:
1. Click the FT Transaction Manager tab.
2. Select the workcells for which you want to create the configuration.
By default, all the workcells are selected.
• To select the workcells individually, click Deselect all, and then select the Generate check box next to the workcell of your choice.
• To select all workcells, click Select all.
3. Modify the selected workcells as needed.
• For details on the PackML UDT configuration items, see "PackML UDT Configuration Items (page 160)".
• For details on the FTM UDT configuration items, see "FTM UDT Configuration Items (page 161)".
Step 2. Define a FactoryTalk Transaction Manager Configuration
Rockwell Automation Publication PLTMT-UM001M-EN-P-June 2014 157
Chapter 4 Automated Configuration
NOTE If you create a configuration for the workcells that have already been configured, the existing workcell information will be overwritten in the database when the configuration is imported and registered.
4. Next to the FTTM XML out file box, click .
The Open dialog box appears.
5. Navigate to the location in which you want to store the FactoryTalk Transaction Manager XML configuration file.
This is a file with the configuration data that you will import to FactoryTalk Transaction Manager.
6. In the File name box, type a name for the file, and then click Open.
The file appears in the FTTM XML out file box.
7. In the FTTM config name box, type the name for the FactoryTalk Transaction Manager configuration you are creating or the name of an existing configuration that you want to update.
In this example, the configuration is named FTTMconfiguration.
8. In the FTTM config path box, type the location of or click to navigate to the location of the FactoryTalk Transaction
Manager configuration files.
In this location all files related to your FactoryTalk Transaction Manager and FactoryTalk Metrics configuration are stored, such as the configuration and log files.
• If you modify an existing configuration, point to its location path.
• If you create a new configuration, the path you provide will be used as the location of the configuration file.
9. In the Connector user name box, type the user name for the FactoryTalk directory as defined in the FactoryTalk
158 Rockwell Automation Publication PLTMT-UM001M-EN-P-June 2014
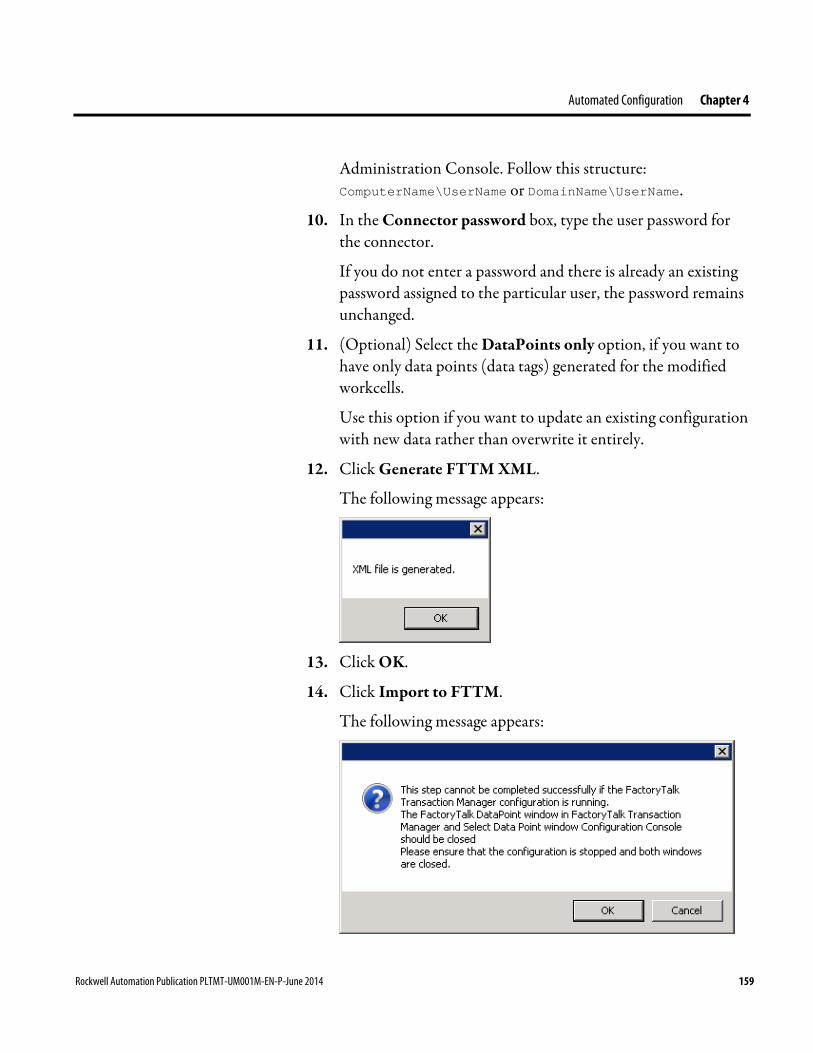
Automated Configuration Chapter 4
Administration Console. Follow this structure: ComputerName\UserName or DomainName\UserName.
10. In the Connector password box, type the user password for the connector.
If you do not enter a password and there is already an existing password assigned to the particular user, the password remains unchanged.
11. (Optional) Select the DataPoints only option, if you want to have only data points (data tags) generated for the modified workcells.
Use this option if you want to update an existing configuration with new data rather than overwrite it entirely.
12. Click Generate FTTM XML.
The following message appears:
13. Click OK.
14. Click Import to FTTM.
The following message appears:
Rockwell Automation Publication PLTMT-UM001M-EN-P-June 2014 159

Chapter 4 Automated Configuration
15. Click OK.
The configuration is imported to FactoryTalk Transaction Manager.
If the configuration was imported with errors, a message listing the number and code of the errors appears.
Check the error log file for details, correct the configuration, and then try again.
The error log file is stored in the FTTM configuration path that you selected in step 8.
The name of the file is structured in the following way: <ConfigurationName>_XML.log.
16. Do any of the following:
• If you created a new configuration, go to "Step 3. Register the FactoryTalk Transaction Manager Configuration for Data Collection (page 162)".
• If you want to load machine states and/or lookup lists to your configuration, go to "Step 4. Import Lookup Lists and Machine States (page 164)".
• If you want to define a FactoryTalk Metrics configuration, go to "Step 5. Define a FactoryTalk Metrics Configuration (page 166)".
The following workcell properties are displayed for the PackML UDT configuration after you click Load from Controller on the Start tab:
Item Description Path The path to the workcell in the PackML data structure.
This box is read-only. Work Cell Name The name of the workcell in the PackML data structure.
This box is read-only.
PackML UDT Configuration Items
160 Rockwell Automation Publication PLTMT-UM001M-EN-P-June 2014
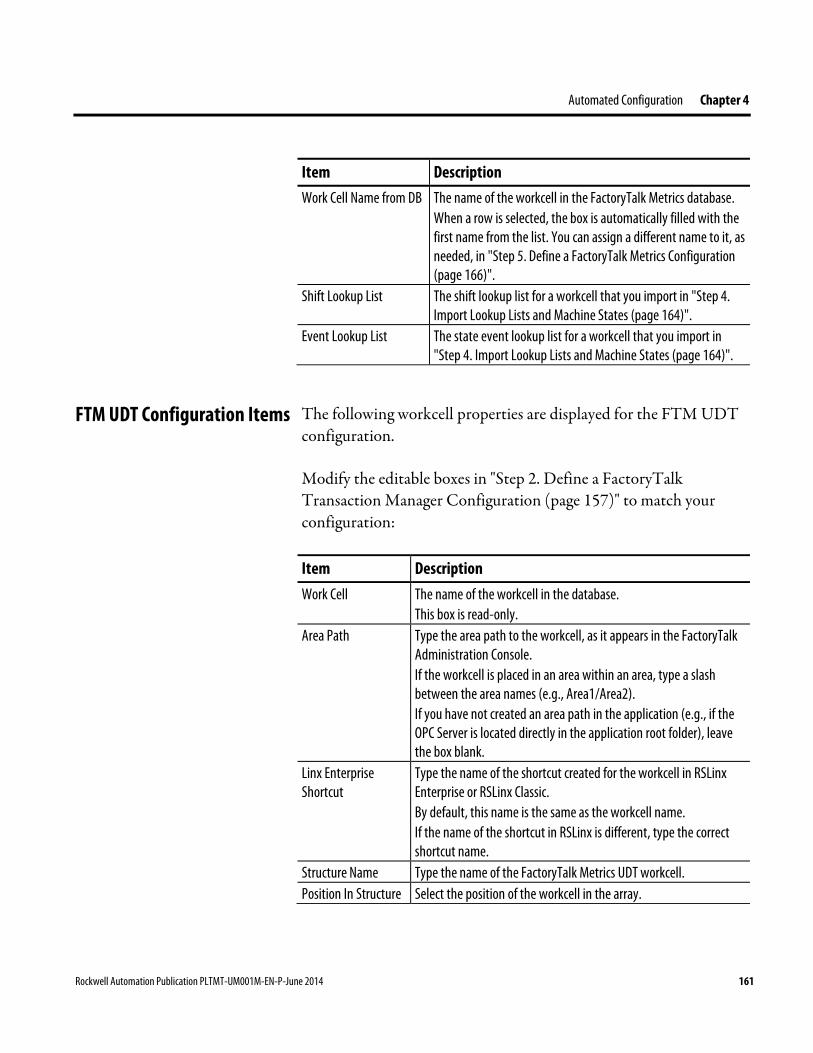
Automated Configuration Chapter 4
Item Description Work Cell Name from DB The name of the workcell in the FactoryTalk Metrics database.
When a row is selected, the box is automatically filled with the first name from the list. You can assign a different name to it, as needed, in "Step 5. Define a FactoryTalk Metrics Configuration (page 166)".
Shift Lookup List The shift lookup list for a workcell that you import in "Step 4. Import Lookup Lists and Machine States (page 164)".
Event Lookup List The state event lookup list for a workcell that you import in "Step 4. Import Lookup Lists and Machine States (page 164)".
The following workcell properties are displayed for the FTM UDT configuration.
Modify the editable boxes in "Step 2. Define a FactoryTalk Transaction Manager Configuration (page 157)" to match your configuration:
Item Description Work Cell The name of the workcell in the database.
This box is read-only. Area Path Type the area path to the workcell, as it appears in the FactoryTalk
Administration Console. If the workcell is placed in an area within an area, type a slash between the area names (e.g., Area1/Area2). If you have not created an area path in the application (e.g., if the OPC Server is located directly in the application root folder), leave the box blank.
Linx Enterprise Shortcut
Type the name of the shortcut created for the workcell in RSLinx Enterprise or RSLinx Classic. By default, this name is the same as the workcell name. If the name of the shortcut in RSLinx is different, type the correct shortcut name.
Structure Name Type the name of the FactoryTalk Metrics UDT workcell. Position In Structure Select the position of the workcell in the array.
FTM UDT Configuration Items
Rockwell Automation Publication PLTMT-UM001M-EN-P-June 2014 161
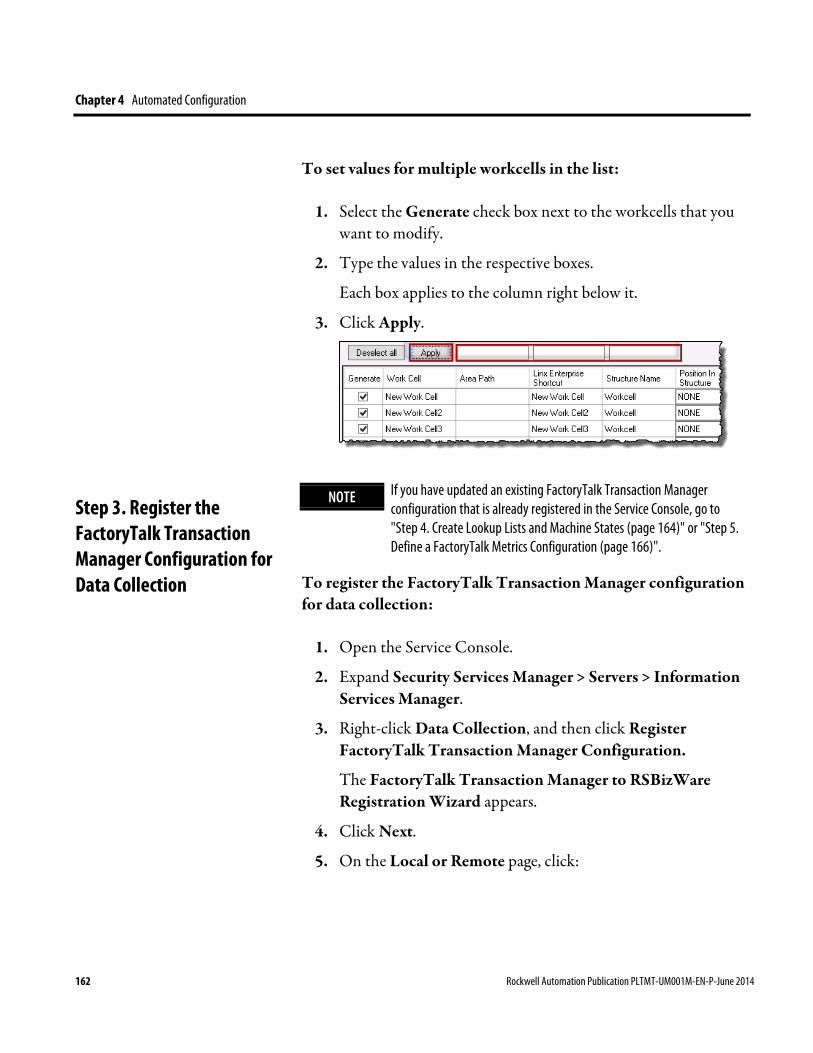
Chapter 4 Automated Configuration
To set values for multiple workcells in the list:
1. Select the Generate check box next to the workcells that you want to modify.
2. Type the values in the respective boxes.
Each box applies to the column right below it.
3. Click Apply.
NOTE If you have updated an existing FactoryTalk Transaction Manager configuration that is already registered in the Service Console, go to "Step 4. Create Lookup Lists and Machine States (page 164)" or "Step 5. Define a FactoryTalk Metrics Configuration (page 166)".
To register the FactoryTalk Transaction Manager configuration for data collection:
1. Open the Service Console.
2. Expand Security Services Manager > Servers > Information Services Manager.
3. Right-click Data Collection, and then click Register FactoryTalk Transaction Manager Configuration.
The FactoryTalk Transaction Manager to RSBizWare Registration Wizard appears.
4. Click Next.
5. On the Local or Remote page, click:
Step 3. Register the FactoryTalk Transaction Manager Configuration for Data Collection
162 Rockwell Automation Publication PLTMT-UM001M-EN-P-June 2014
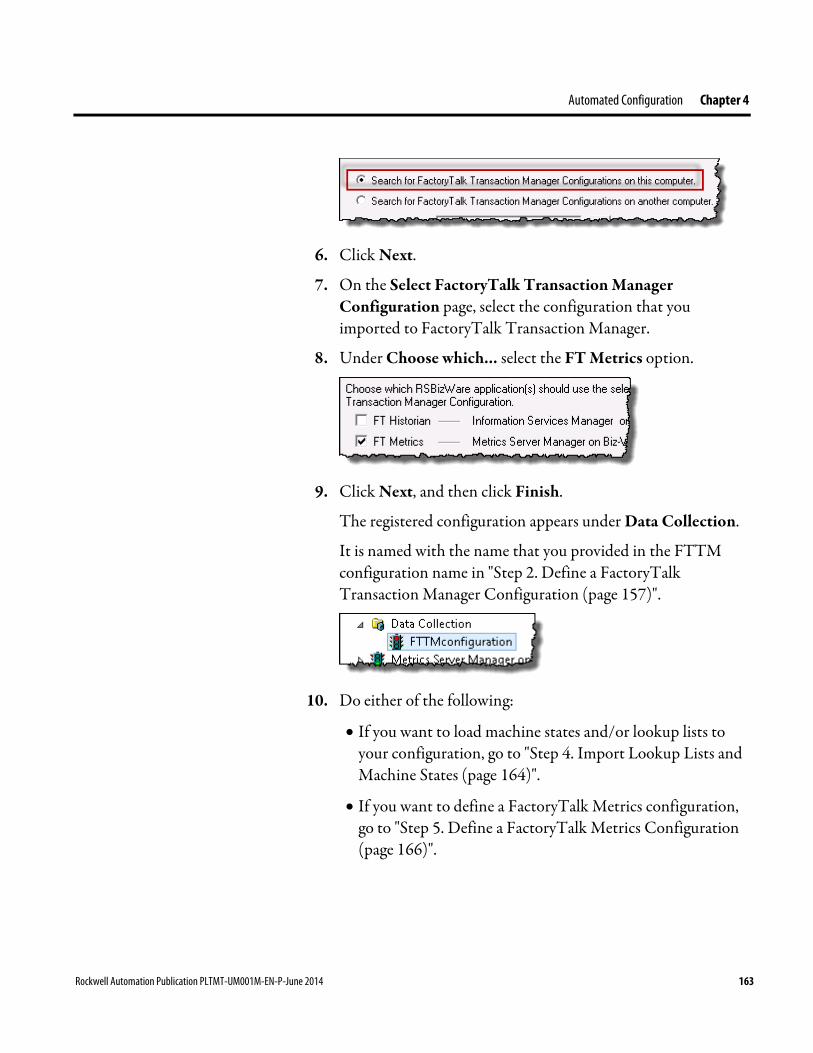
Automated Configuration Chapter 4
6. Click Next.
7. On the Select FactoryTalk Transaction Manager Configuration page, select the configuration that you imported to FactoryTalk Transaction Manager.
8. Under Choose which... select the FT Metrics option.
9. Click Next, and then click Finish.
The registered configuration appears under Data Collection.
It is named with the name that you provided in the FTTM configuration name in "Step 2. Define a FactoryTalk Transaction Manager Configuration (page 157)".
10. Do either of the following:
• If you want to load machine states and/or lookup lists to your configuration, go to "Step 4. Import Lookup Lists and Machine States (page 164)".
• If you want to define a FactoryTalk Metrics configuration, go to "Step 5. Define a FactoryTalk Metrics Configuration (page 166)".
Rockwell Automation Publication PLTMT-UM001M-EN-P-June 2014 163
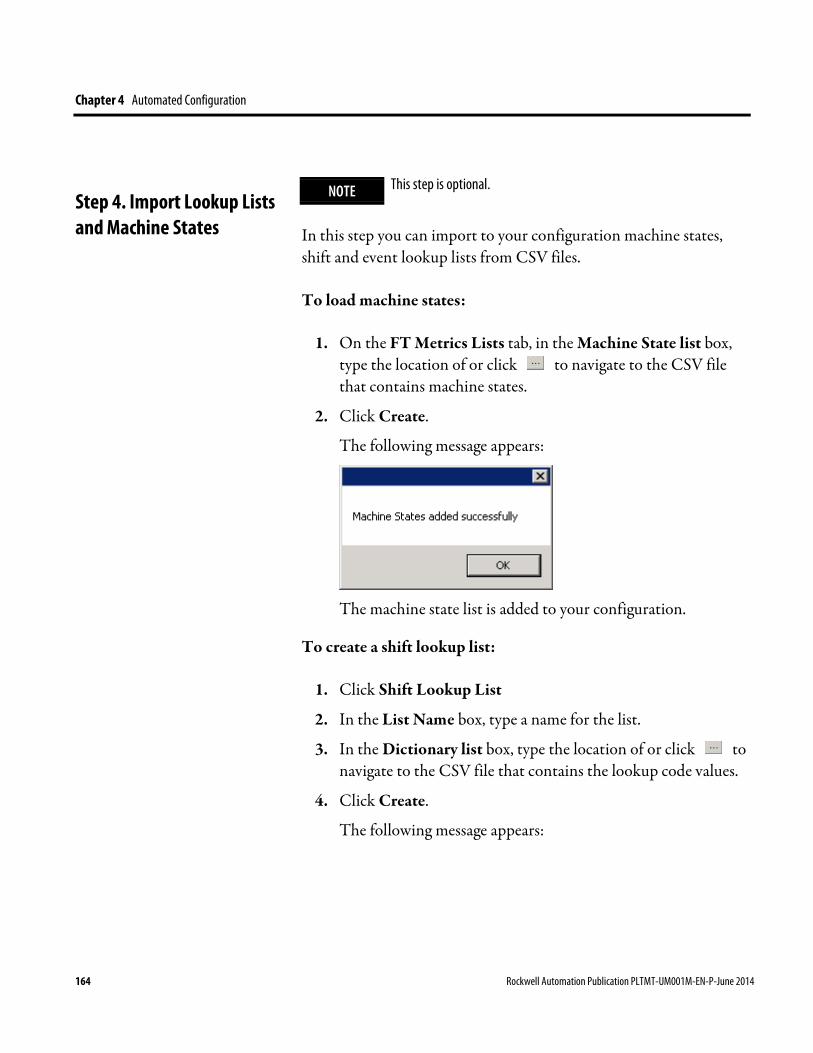
Chapter 4 Automated Configuration
NOTE This step is optional.
In this step you can import to your configuration machine states, shift and event lookup lists from CSV files.
To load machine states:
1. On the FT Metrics Lists tab, in the Machine State list box, type the location of or click to navigate to the CSV file that contains machine states.
2. Click Create.
The following message appears:
The machine state list is added to your configuration.
To create a shift lookup list:
1. Click Shift Lookup List
2. In the List Name box, type a name for the list.
3. In the Dictionary list box, type the location of or click to navigate to the CSV file that contains the lookup code values.
4. Click Create.
The following message appears:
Step 4. Import Lookup Lists and Machine States
164 Rockwell Automation Publication PLTMT-UM001M-EN-P-June 2014
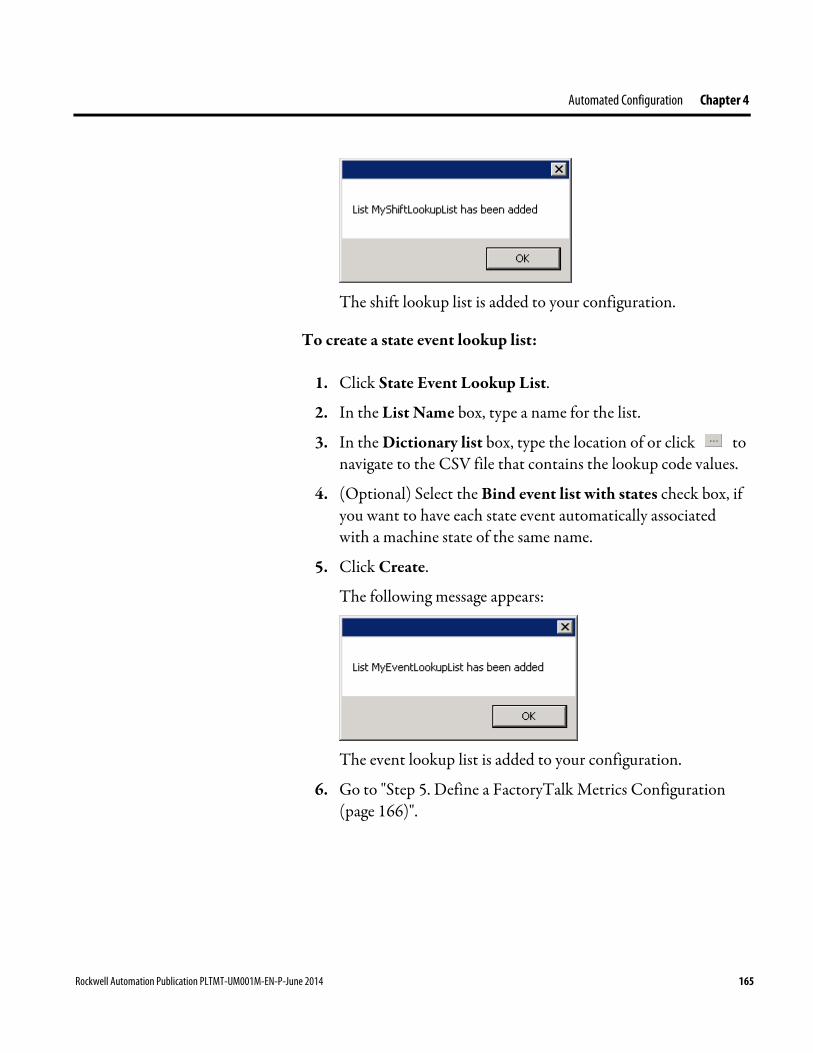
Automated Configuration Chapter 4
The shift lookup list is added to your configuration.
To create a state event lookup list:
1. Click State Event Lookup List.
2. In the List Name box, type a name for the list.
3. In the Dictionary list box, type the location of or click to navigate to the CSV file that contains the lookup code values.
4. (Optional) Select the Bind event list with states check box, if you want to have each state event automatically associated with a machine state of the same name.
5. Click Create.
The following message appears:
The event lookup list is added to your configuration.
6. Go to "Step 5. Define a FactoryTalk Metrics Configuration (page 166)".
Rockwell Automation Publication PLTMT-UM001M-EN-P-June 2014 165

Chapter 4 Automated Configuration
To create and import the FactoryTalk Metrics configuration file:
1. Click the FT Metrics tab.
2. (PackML UDT configuration only) Assign shift and state event lookup lists to the selected workcells, if needed.
For details, see "PackML UDT Configuration Items (page 160)".
NOTE In this step, you can exclude from the configuration some workcells that you selected in "Step 2. Define a FactoryTalk Transaction Manager Configuration (page 157)". However, you cannot select additional workcells. This would cause inconsistencies between configurations for FactoryTalk Transaction Manager and FactoryTalk Metrics, as well as errors when importing the configurations to the database.
3. Next to the FT Metrics XML file box, click .
The Open dialog box appears.
4. Navigate to the location in which you want to store the FactoryTalk Transaction Manager XML configuration file.
This is a file with the configuration data that you will import to FactoryTalk Transaction Manager.
5. In the File name box, type a name for the file, and then click Open.
The file appears in the FT Metrics XML file box.
6. In the BizWare login box, type the login name of the RSBizWare database user.
7. In the BizWare password box, type the password of the RSBizWare database user.
8. Click Update lists from database.
Available FactoryTalk Transaction Manager configurations are loaded to the FTTM configuration list.
Step 5. Define a FactoryTalk Metrics Configuration
166 Rockwell Automation Publication PLTMT-UM001M-EN-P-June 2014
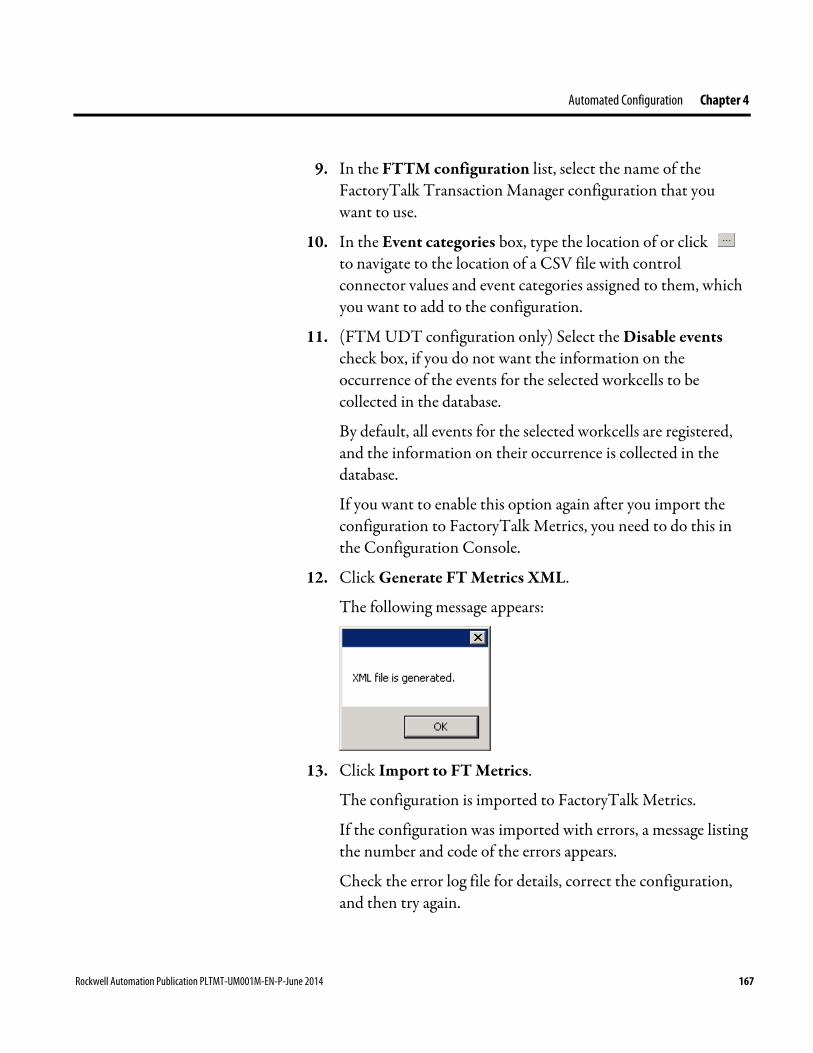
Automated Configuration Chapter 4
9. In the FTTM configuration list, select the name of the FactoryTalk Transaction Manager configuration that you want to use.
10. In the Event categories box, type the location of or click to navigate to the location of a CSV file with control connector values and event categories assigned to them, which you want to add to the configuration.
11. (FTM UDT configuration only) Select the Disable events check box, if you do not want the information on the occurrence of the events for the selected workcells to be collected in the database.
By default, all events for the selected workcells are registered, and the information on their occurrence is collected in the database.
If you want to enable this option again after you import the configuration to FactoryTalk Metrics, you need to do this in the Configuration Console.
12. Click Generate FT Metrics XML.
The following message appears:
13. Click Import to FT Metrics.
The configuration is imported to FactoryTalk Metrics.
If the configuration was imported with errors, a message listing the number and code of the errors appears.
Check the error log file for details, correct the configuration, and then try again.
Rockwell Automation Publication PLTMT-UM001M-EN-P-June 2014 167
Chapter 4 Automated Configuration
The error log file is stored in the FTTM configuration path that you provided in "Step 2. Define a FactoryTalk Transaction Manager Configuration (page 157)".
The name of the log file is WorkcellDeployment.log.
After you imported the FactoryTalk Metrics performance parameters with FactoryTalk Metrics Configuration Tool to FactoryTalk Metrics, you can customize them in the Configuration Console. For details, see "Collecting Performance Data (page 25)".
When customizing the imported performance parameters, keep the following in mind:
• Every data point in the FactoryTalk Metrics UDT is mapped to the appropriate performance parameter for every workcell. You may not have use for all of the data points in the UDT, and you may not have programmed them to contain valid data when you added the UDT to the control program. If the control program is not populating a UDT data point with valid data, you should delete that data point from the performance parameters. In the case of events, you can disable or delete unused events.
• Every workcell is configured identically. In a real application this is rarely the case. You can customize each workcell using the Configuration Console.
• Make sure that the performance parameters are configured as expected, and are programmed in the controller (for example, all event triggers are configured for low to high transition).
• Default names are assigned to events, and events are grouped into categories by event type. You may change the way the events are grouped, and change the event names and categories to be more meaningful.
• No lookup lists are created by the configuration tool. It is useful to make lookup lists to translate integer values for
Guidelines for Modifying Imported Performance Parameters
168 Rockwell Automation Publication PLTMT-UM001M-EN-P-June 2014
Automated Configuration Chapter 4
analog event values and shift numbers into string values. String values are more useful in both reports and in Report Expert parameters. You can also make lookup lists for machine states.
• Each workcell is disabled and you need to enable it manually.
• If you have chosen to disable events in the configuration tool, you need to manually enable all the events that you want FactoryTalk Metrics to use. You need to do this for all workcells, not just the workcells you have selected in the configuration tool.
• You may add performance parameters that use data points which are not contained in the UDT, such as additional events.
The following performance parameters are not configured by the FactoryTalk Metrics Configuration Tool, and must be configured manually:
• Scheduled Availability using Time Patterns - an alternative to collecting shift information from the control system
• Machine States - required to use some of the standard reports provided with Report Expert
• Event severity
• Lookup lists
• Event value - choose the Beginning or Ending value.
• Fault Metrics
NOTE If you run the FactoryTalk Metrics Configuration Tool again, all of your changes made in the Configuration Console to the imported performance parameters will be lost.
Rockwell Automation Publication PLTMT-UM001M-EN-P-June 2014 169

Chapter 4 Automated Configuration
170 Rockwell Automation Publication PLTMT-UM001M-EN-P-June 2014
Chapter 5
Analyzing FactoryTalk Metrics Data
FactoryTalk Metrics provides a graphical environment for analyzing production and process data. In this chapter you will learn how to use FactoryTalk Metrics to create and view RSBizWare reports containing OEE charts (bar, pie, and line) and tables.
In RSBizWare, a report is a complete, formatted document that is made up of one or more report objects that have been placed in an HTML document along with text, graphics, and hyperlinks. A report, saved as an .htm file, is created and edited using the Configuration Console with a FactoryTalk Metrics Author license. RSBizWare reports can also be edited using Web-authoring tools such as Microsoft FrontPage.
An RSBizWare report object shows the data from a database table or view in a meaningful graphic or tabular presentation. The report object defines how the data is to be shown to the user. It defines both the visual representation of the data (e.g., pie chart, bar chart, table) as well as the data sorting and summarization.
The data for the report object comes from an RSBizWare report data source. A report data source is a connection to a table or view within the RSBizWare database or an external database.
The data in the report object may be restricted by a query (a filter), made up of one or more search criteria, that determine which records from the report data source will be shown. The use of a filter is optional.
Create a New RSBizWare Report
Rockwell Automation Publication PLTMT-UM001M-EN-P-June 2014 171
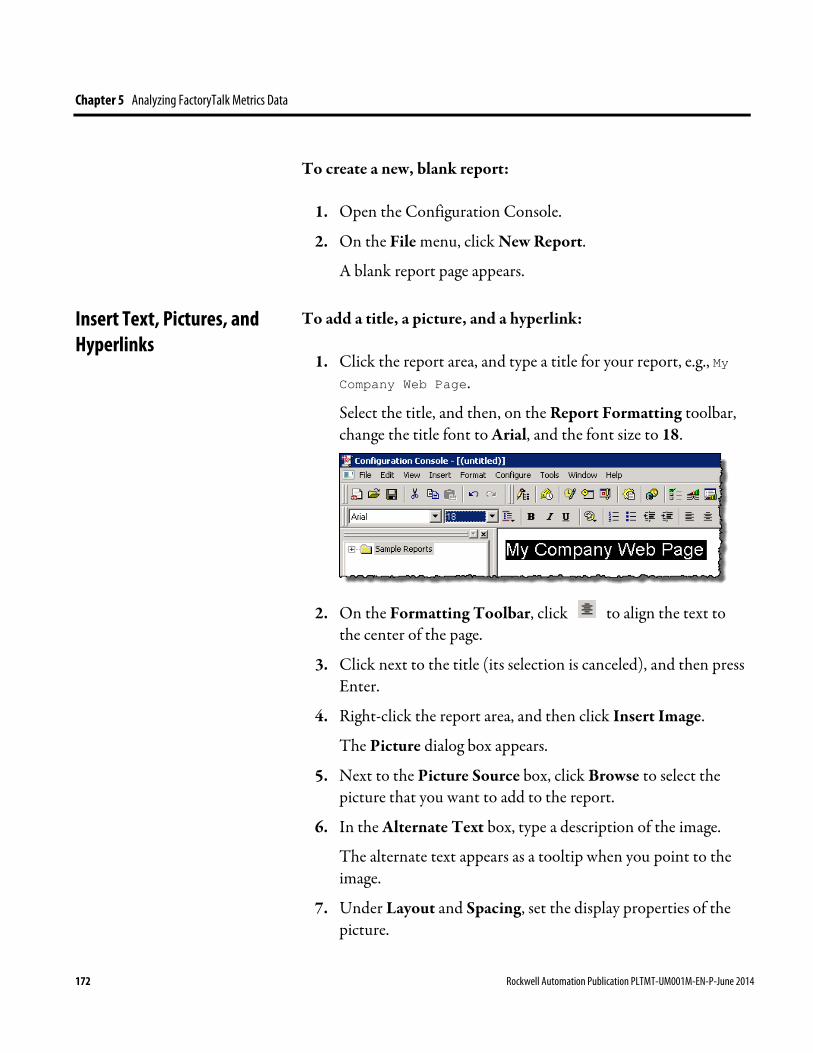
Chapter 5 Analyzing FactoryTalk Metrics Data
To create a new, blank report:
1. Open the Configuration Console.
2. On the File menu, click New Report.
A blank report page appears.
To add a title, a picture, and a hyperlink:
1. Click the report area, and type a title for your report, e.g., My Company Web Page.
Select the title, and then, on the Report Formatting toolbar, change the title font to Arial, and the font size to 18.
2. On the Formatting Toolbar, click to align the text to
the center of the page.
3. Click next to the title (its selection is canceled), and then press Enter.
4. Right-click the report area, and then click Insert Image.
The Picture dialog box appears.
5. Next to the Picture Source box, click Browse to select the picture that you want to add to the report.
6. In the Alternate Text box, type a description of the image.
The alternate text appears as a tooltip when you point to the image.
7. Under Layout and Spacing, set the display properties of the picture.
Insert Text, Pictures, and Hyperlinks
172 Rockwell Automation Publication PLTMT-UM001M-EN-P-June 2014
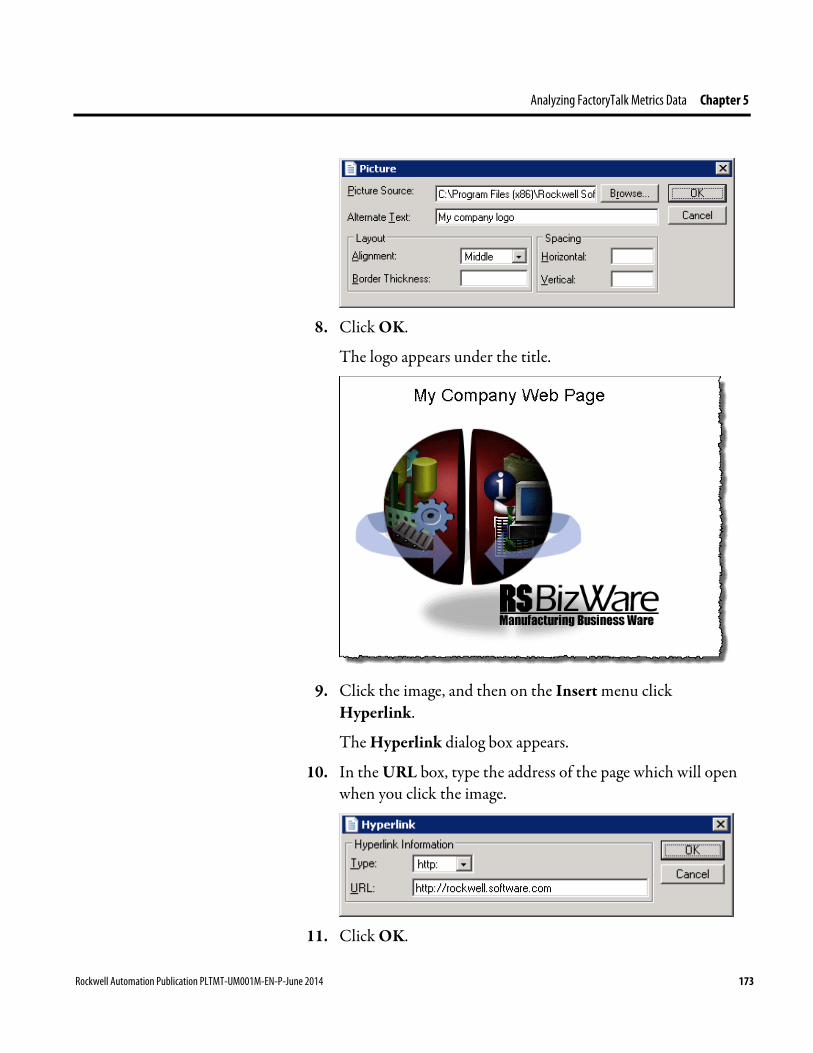
Analyzing FactoryTalk Metrics Data Chapter 5
8. Click OK.
The logo appears under the title.
9. Click the image, and then on the Insert menu click
Hyperlink.
The Hyperlink dialog box appears.
10. In the URL box, type the address of the page which will open when you click the image.
11. Click OK.
Rockwell Automation Publication PLTMT-UM001M-EN-P-June 2014 173
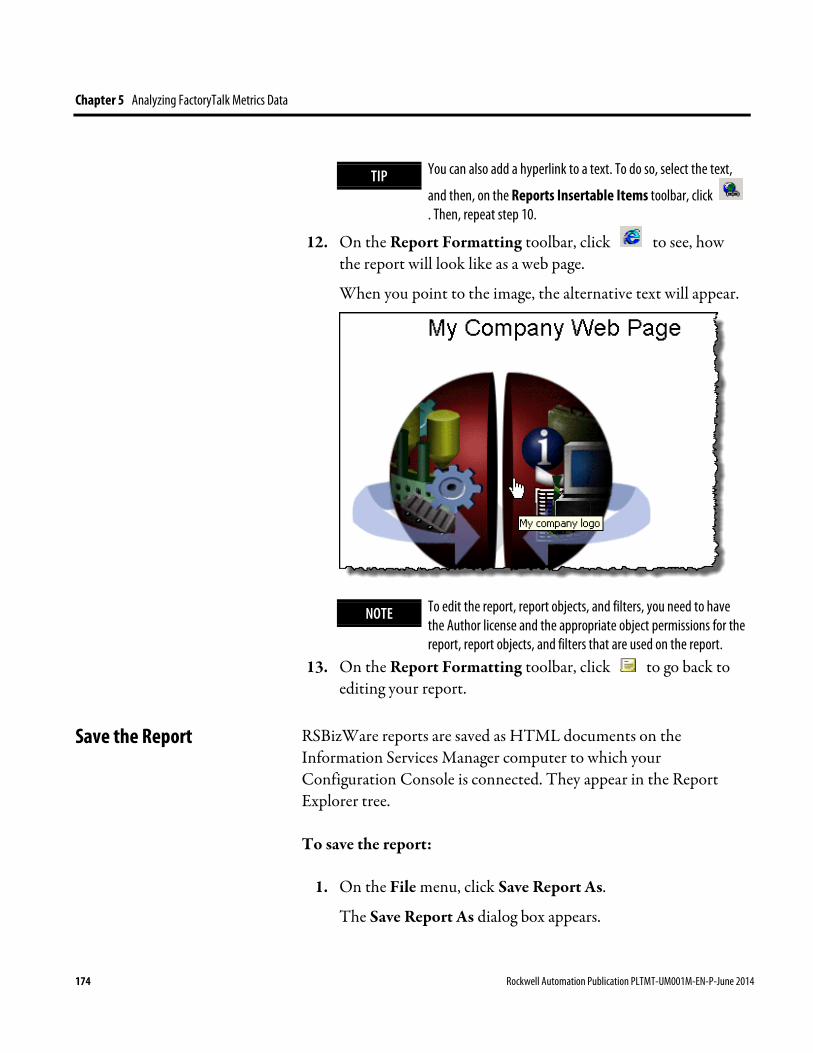
Chapter 5 Analyzing FactoryTalk Metrics Data
TIP You can also add a hyperlink to a text. To do so, select the text,
and then, on the Reports Insertable Items toolbar, click . Then, repeat step 10.
12. On the Report Formatting toolbar, click to see, how the report will look like as a web page.
When you point to the image, the alternative text will appear.
NOTE To edit the report, report objects, and filters, you need to have the Author license and the appropriate object permissions for the report, report objects, and filters that are used on the report.
13. On the Report Formatting toolbar, click to go back to editing your report.
RSBizWare reports are saved as HTML documents on the Information Services Manager computer to which your Configuration Console is connected. They appear in the Report Explorer tree.
To save the report:
1. On the File menu, click Save Report As.
The Save Report As dialog box appears.
Save the Report
174 Rockwell Automation Publication PLTMT-UM001M-EN-P-June 2014
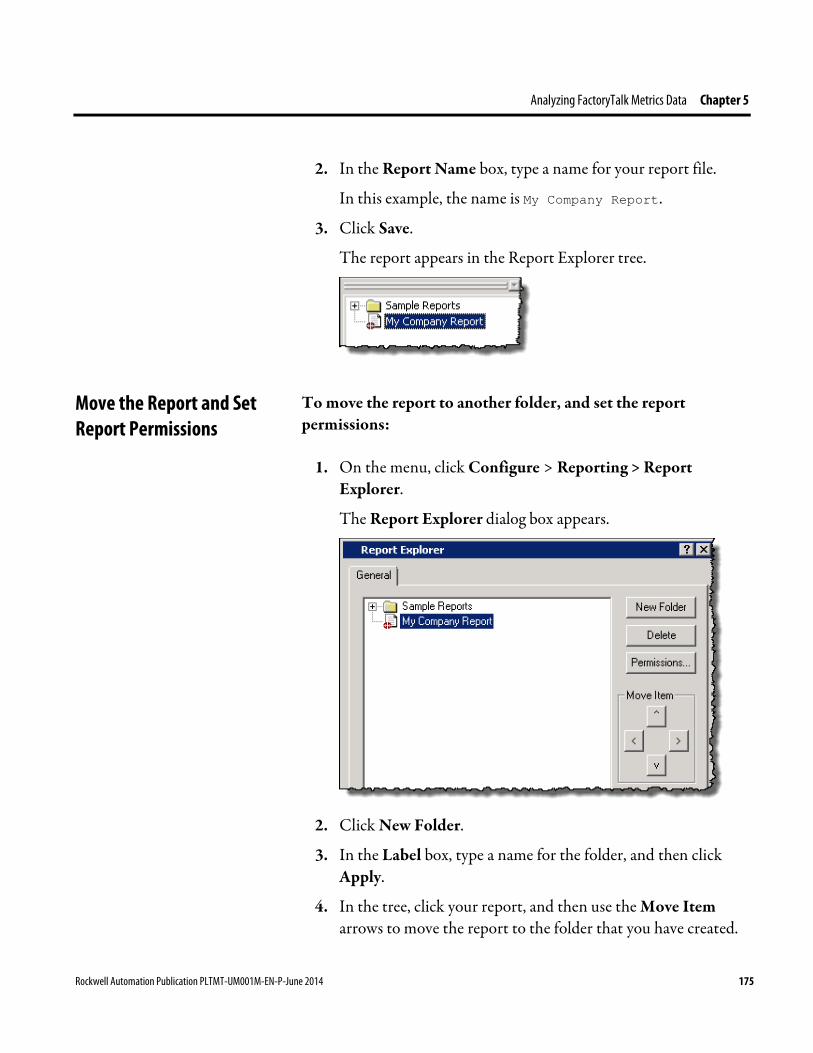
Analyzing FactoryTalk Metrics Data Chapter 5
2. In the Report Name box, type a name for your report file.
In this example, the name is My Company Report.
3. Click Save.
The report appears in the Report Explorer tree.
To move the report to another folder, and set the report permissions:
1. On the menu, click Configure > Reporting > Report Explorer.
The Report Explorer dialog box appears.
2. Click New Folder.
3. In the Label box, type a name for the folder, and then click Apply.
4. In the tree, click your report, and then use the Move Item arrows to move the report to the folder that you have created.
Move the Report and Set Report Permissions
Rockwell Automation Publication PLTMT-UM001M-EN-P-June 2014 175

Chapter 5 Analyzing FactoryTalk Metrics Data
First, move the report under the folder, in which you want to put it. Then, click the right arrow to place the report in the folder.
5. Select your report, and then click Permissions.
The Report Permissions dialog box appears.
Use this dialog box to set permissions for viewing, editing, deleting, and applying security to the report.
6. On the Everyone tab, set permissions that you want to grant for all users that have access to the report.
You can grant permissions to users or groups in the same manner.
NOTE • To edit the report, report objects, and filters, you need to have the Author license.
• Changing the report permissions does not affect the permissions of the report objects that have been added to the report.
7. Click OK.
176 Rockwell Automation Publication PLTMT-UM001M-EN-P-June 2014
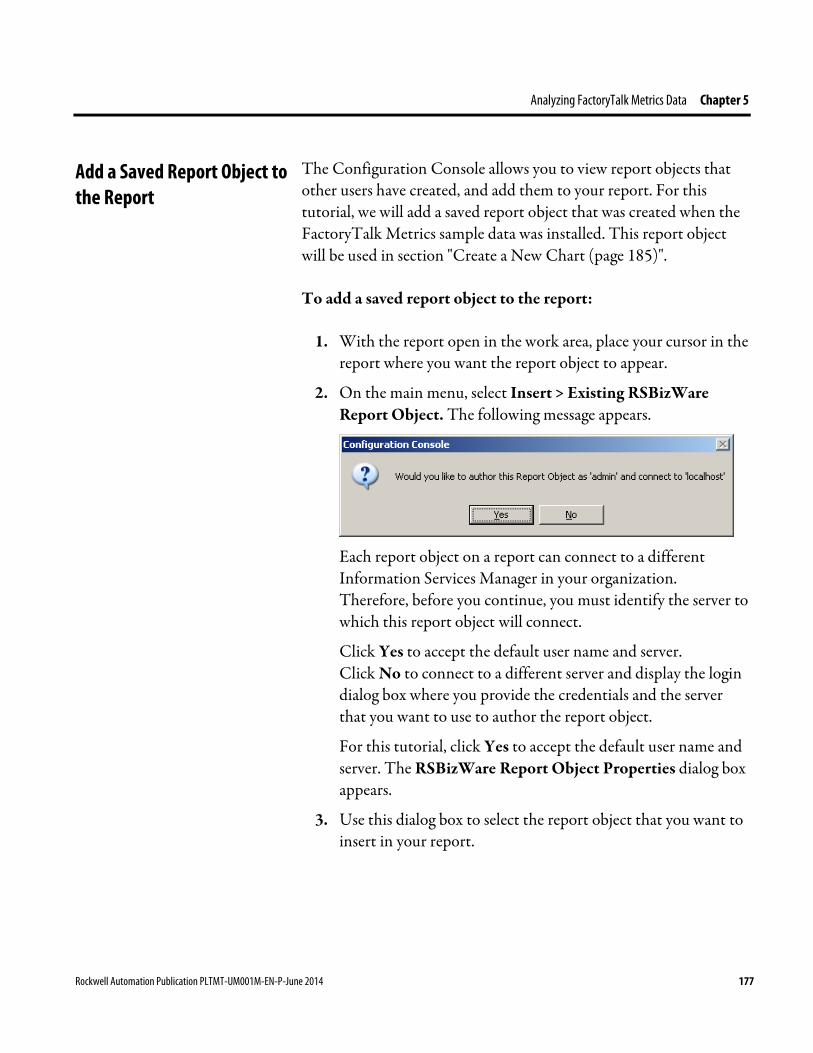
Analyzing FactoryTalk Metrics Data Chapter 5
The Configuration Console allows you to view report objects that other users have created, and add them to your report. For this tutorial, we will add a saved report object that was created when the FactoryTalk Metrics sample data was installed. This report object will be used in section "Create a New Chart (page 185)".
To add a saved report object to the report:
1. With the report open in the work area, place your cursor in the report where you want the report object to appear.
2. On the main menu, select Insert > Existing RSBizWare Report Object. The following message appears.
Each report object on a report can connect to a different Information Services Manager in your organization. Therefore, before you continue, you must identify the server to which this report object will connect.
Click Yes to accept the default user name and server. Click No to connect to a different server and display the login dialog box where you provide the credentials and the server that you want to use to author the report object.
For this tutorial, click Yes to accept the default user name and server. The RSBizWare Report Object Properties dialog box appears.
3. Use this dialog box to select the report object that you want to insert in your report.
Add a Saved Report Object to the Report
Rockwell Automation Publication PLTMT-UM001M-EN-P-June 2014 177

Chapter 5 Analyzing FactoryTalk Metrics Data
Item Description Report Data Source The list of report data sources from which the data will be
shown in the report object and to which you have been granted permissions.
Report Object The list of available report objects, grouped by the report data source from which they get their data. When you select a report data source, the list of report objects is refreshed to show only the report objects that are based on the selected report data source
Filter The list of available filtering criteria. Manage Report Objects
The button for displaying the Configure Report Data Sources, Report Objects and Filters dialog box.
178 Rockwell Automation Publication PLTMT-UM001M-EN-P-June 2014

Analyzing FactoryTalk Metrics Data Chapter 5
Item Description Select Which Toolbars to Show options
Select the check box near the toolbar name which you want to display on the report. The check boxes allow you to add toolbars to the report object. The end users of your report will use these toolbars to adjust the report object to suit their needs. The following toolbars can be selected: • General • Time Selection • Status Bar • Report Data Source • Report Object • Filter
4. From the Report Data Source list, select FactoryTalk Metrics Workcell History. This is the data that will be shown in the report object.
5. From the Report Object list, select Workcell History.
6. For this example, we will not select a filter, so leave the filter list blank.
NOTE Filters are grouped by the report data source for which they have been created.
7. Select the Status Bar check box. This will cause a status bar to display at the bottom of the report object. Because each report object on a report can connect to a different server, the status bar will indicate the user and server to which the report object is connected at run time.
8. Click OK to add the report object to the report. The report object is shown as a simple box outline.
9. Double-click inside the box outline to see the table, and click Refresh. You may not see any data in the table. This is because the default time range for the table is the past 2 hours, but the sample data was collected over several days in May 2000. In the next section of the tutorial, we will learn to control the time range for the data that will be displayed in the table.
Rockwell Automation Publication PLTMT-UM001M-EN-P-June 2014 179
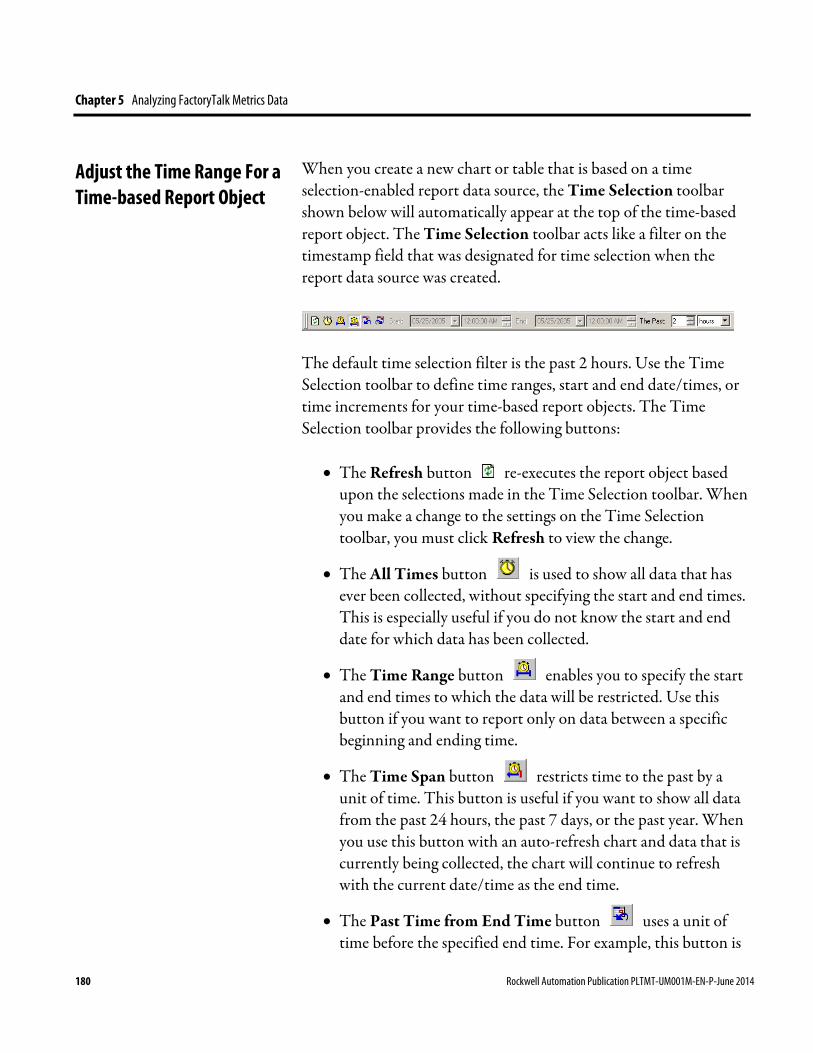
Chapter 5 Analyzing FactoryTalk Metrics Data
When you create a new chart or table that is based on a time selection-enabled report data source, the Time Selection toolbar shown below will automatically appear at the top of the time-based report object. The Time Selection toolbar acts like a filter on the timestamp field that was designated for time selection when the report data source was created.
The default time selection filter is the past 2 hours. Use the Time Selection toolbar to define time ranges, start and end date/times, or time increments for your time-based report objects. The Time Selection toolbar provides the following buttons:
• The Refresh button re-executes the report object based upon the selections made in the Time Selection toolbar. When you make a change to the settings on the Time Selection toolbar, you must click Refresh to view the change.
• The All Times button is used to show all data that has ever been collected, without specifying the start and end times. This is especially useful if you do not know the start and end date for which data has been collected.
• The Time Range button enables you to specify the start and end times to which the data will be restricted. Use this button if you want to report only on data between a specific beginning and ending time.
• The Time Span button restricts time to the past by a unit of time. This button is useful if you want to show all data from the past 24 hours, the past 7 days, or the past year. When you use this button with an auto-refresh chart and data that is currently being collected, the chart will continue to refresh with the current date/time as the end time.
• The Past Time from End Time button uses a unit of time before the specified end time. For example, this button is
Adjust the Time Range For a Time-based Report Object
180 Rockwell Automation Publication PLTMT-UM001M-EN-P-June 2014

Analyzing FactoryTalk Metrics Data Chapter 5
useful if you want to show all data from the week before August 2, 2005.
• The Future Time from Start Time button uses a unit of time after the specified start time. For example, this button is useful if you want to show all data from the week after August 2, 2005.
To change a date or time on the Time Selection toolbar, use the drop-down arrow to the right of the field or type a value directly in the field.
For our tutorial example, click All Times and then click Refresh. Your table should look similar to the following:
When you save your report, the settings that you specified on the Time Selection toolbar during report authoring will be saved with the chart. These become the defaults for runtime users and they are also used when you schedule the report object to be run at a later date. Scheduling report objects and reports is discussed in "Advanced Reporting Topics (page 223)".
Rockwell Automation Publication PLTMT-UM001M-EN-P-June 2014 181
Chapter 5 Analyzing FactoryTalk Metrics Data
NOTE Although the Time Selection toolbar settings are used when you schedule the report object, the scheduled output does not show the Time Selection toolbar. To show the start and end times that are being used in scheduled report objects, add start- and end-time dynamic text fields to your report object. Refer to the Add Dynamic Text Fields To a Report Object topic in the online help for the instructions to perform this task.
At run time, the RSBizWare report objects on your report will attempt to connect to an Information Services Manager to access the production data necessary to draw the chart, bar graph, etc. The connectivity settings for each report object specify how they will connect to the Information Services Manager. When the report user attempts to view an RSBizWare report that contains multiple report objects with different connectivity settings, the report users may be required to log on multiple times before they can see the report.
To avoid repetitive logons on a report, you can set your report objects to use Global Credentials. Global Credentials use a session logon to connect to a report object. With a session logon, the user is prompted for user name and password once for each server that is encountered. After the user’s credentials (user, password) have been specified for a server, those credentials are available to any subsequent report object that is running on that client computer, is using the Use Global Credentials option, and is attempting to connect to the same server. The session logon that is established will remain active until the user specifically logs off, the credentials expire, or the client computer is rebooted.
To enable a report object to make use of a session logon, the report object must be configured to use Global Credentials.
Configure the Report Object To Use Global Credentials
182 Rockwell Automation Publication PLTMT-UM001M-EN-P-June 2014
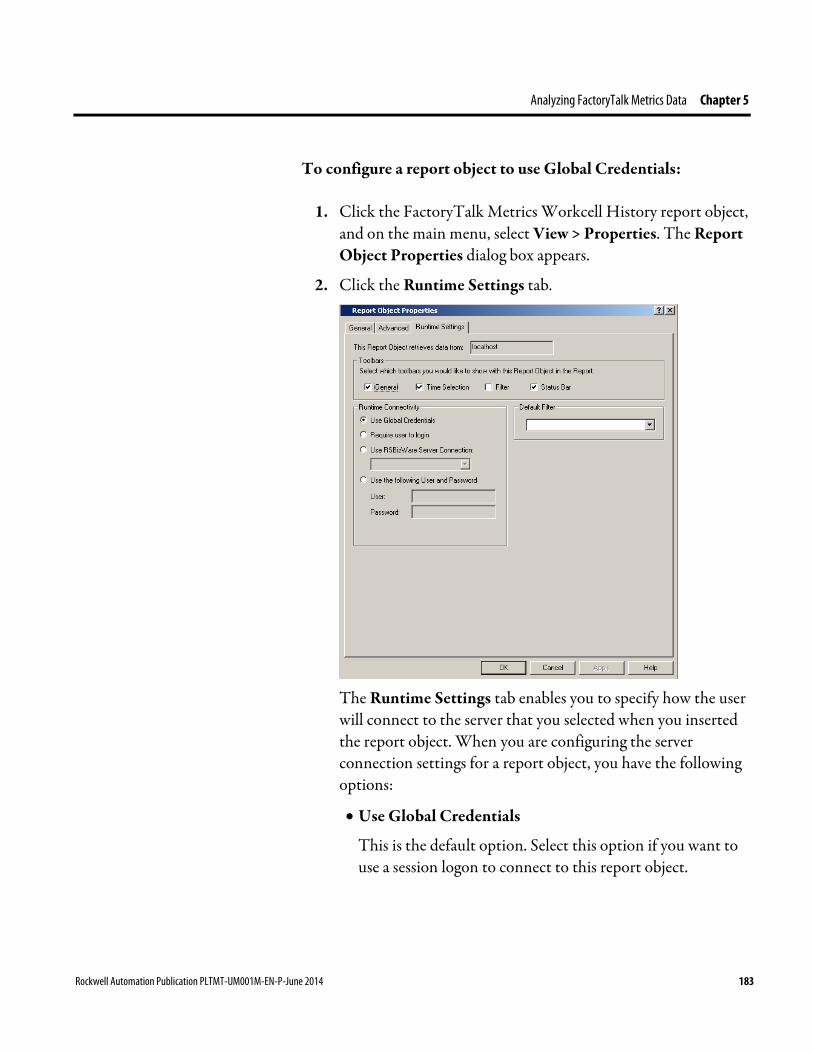
Analyzing FactoryTalk Metrics Data Chapter 5
To configure a report object to use Global Credentials:
1. Click the FactoryTalk Metrics Workcell History report object, and on the main menu, select View > Properties. The Report Object Properties dialog box appears.
2. Click the Runtime Settings tab.
The Runtime Settings tab enables you to specify how the user will connect to the server that you selected when you inserted the report object. When you are configuring the server connection settings for a report object, you have the following options:
• Use Global Credentials
This is the default option. Select this option if you want to use a session logon to connect to this report object.
Rockwell Automation Publication PLTMT-UM001M-EN-P-June 2014 183
Chapter 5 Analyzing FactoryTalk Metrics Data
• Require user to login
Select this option if you want to require the users to provide their user name and password to access this report object. More than one report object on a report with this option selected will require the user to log on multiple times.
NOTE Remember that any users who will be viewing the report must have access to the report data source, report object, and filter or they will not be able to see the report object.
• Use RSBizWare Server Connection
Select this option if you want to specify the RSBizWare Server Connection that this report object will use when the user views the report at run time. You will only be able to select from Server Connection objects that are configured to use the same RSBizWare server that you selected when you added this report object to the report.
NOTE This option is provided for backwards compatibility only. It is recommended that you use Global Credentials in place of RSBizWare Server Connection objects.
• Use the following User and Password
Select this option if you want to specify at design time the user name and password that the report object will use when the user attempts to view the report object at run time. The advantage of choosing this option is that the user will not have to login to view the data.
184 Rockwell Automation Publication PLTMT-UM001M-EN-P-June 2014
Analyzing FactoryTalk Metrics Data Chapter 5
NOTES By selecting this option, you are granting the specified user’s application privileges to the runtime user for this report object. Because the Save Report Object Contents to File, Add Time-Series Comment, and Edit/Delete Time-Series Comment application privileges allow action on report objects, it is important to consider whether the specified user has these privileges and whether you want the runtime user to have these privileges. If you use this option across many report objects and the security policy for the user is very strict (that is, the password must be changed frequently), you will need to change the password setting separately for each report object. Consider using a less strict security policy (such as never requiring the password to be changed) for this user. For more information on security policy, consult the RSAssetSecurity documentation.
For this tutorial, make sure the Use Global Credentials option is selected.
3. Click OK to close the dialog box and save your changes.
You will be adding more report objects to this report. If you want the rest of the report objects on this report to use Global Credentials, you will need to specify this option for each report object when you insert the report object.
An important feature of the Configuration Console is the ability to create bar, pie, and line charts from data stored in a report data source. The purpose of this tutorial is to walk you through the steps that are necessary to create a chart with the New Chart Wizard. For this tutorial, you will use the FactoryTalk Metrics Workcell History report data source to create a chart showing the average running time per hour for work cells. This tutorial will also demonstrate how to create a prompt-at-runtime filter so that the end-user of the report can choose the work cells that will be charted. Your chart will look similar to the one shown below.
Create a New Chart
Rockwell Automation Publication PLTMT-UM001M-EN-P-June 2014 185

Chapter 5 Analyzing FactoryTalk Metrics Data
Take a look at the table report object inserted in "Add a Saved Report Object to Your Report (page 177)". This table shows a representation of the data you will be charting. You will be creating a chart with a bar for each workcell description; therefore, the Workcell Description field is the series. Notice that one column in the table (Workcell Description) contains all of the workcell descriptions and the data for the workcells is organized in rows. Each row contains the Running Seconds values and the Start Time for each workcell (our series). This is important to remember when you use the New Chart Wizard.
NOTE FactoryTalk Metrics exposes two main report data sources—Workcell History and Event History—from which report designers will be creating charts and tables. In order to create charts and tables effectively, it is important that you understand the type of data that these report data sources contain. See "Workcell History, Event History, and Machine State Data (page 261)" for descriptions of these two report data sources.
Step 1: Plan the Chart
186 Rockwell Automation Publication PLTMT-UM001M-EN-P-June 2014
Analyzing FactoryTalk Metrics Data Chapter 5
To insert the chart:
1. Place the mouse pointer where you want the chart to appear in the report and select Insert > Chart to display the authoring user name and server prompt.
2. Click Yes to accept the default user name and server. The New Chart wizard appears. This wizard will lead you through the process of creating a new chart for your RSBizWare report.
The first step in the New Chart Wizard is to select the report data source containing the data that we want to chart. The Report Data Source list contains the report data sources for which you have the appropriate permissions. Select FactoryTalk Metrics Workcell History from the list and click Next to continue.
Next, we you need to specify the type of chart that you want to create. The vertical bar chart is the default. Click Next to accept the default and continue.
In the data configuration step, you need to describe the data to the Chart Wizard. Recall that the data table data is organized in rows for each work cell (series). This corresponds to the example table shown in the Chart Wizard for the Rows option.
Step 2: Select the Data On Which To Report
Step 3: Choose a Chart Type
Step 4: Describe the Data
Rockwell Automation Publication PLTMT-UM001M-EN-P-June 2014 187
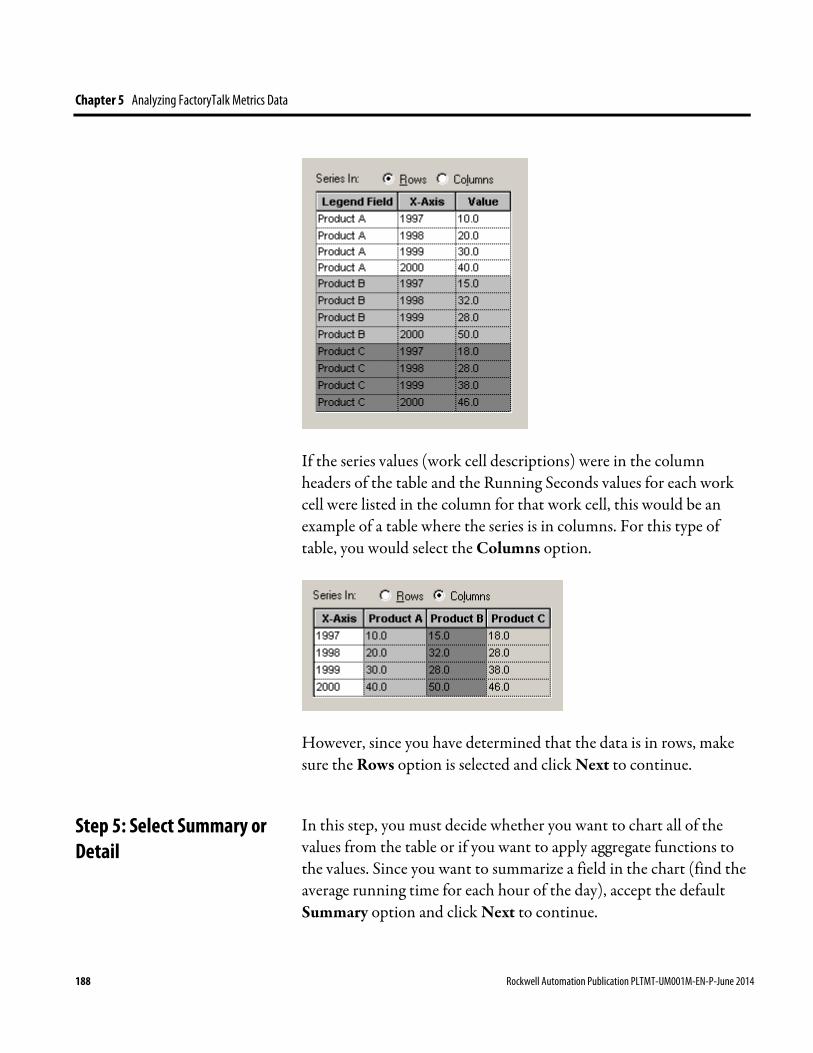
Chapter 5 Analyzing FactoryTalk Metrics Data
If the series values (work cell descriptions) were in the column headers of the table and the Running Seconds values for each work cell were listed in the column for that work cell, this would be an example of a table where the series is in columns. For this type of table, you would select the Columns option.
However, since you have determined that the data is in rows, make sure the Rows option is selected and click Next to continue.
In this step, you must decide whether you want to chart all of the values from the table or if you want to apply aggregate functions to the values. Since you want to summarize a field in the chart (find the average running time for each hour of the day), accept the default Summary option and click Next to continue.
Step 5: Select Summary or Detail
188 Rockwell Automation Publication PLTMT-UM001M-EN-P-June 2014
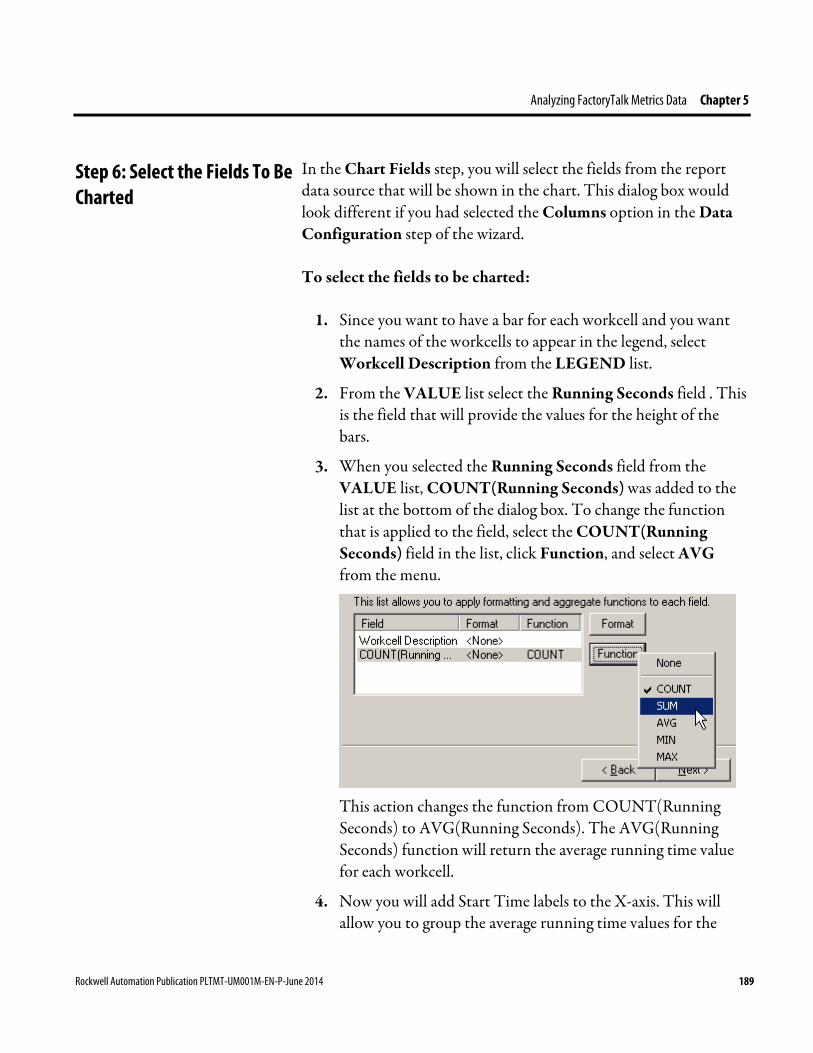
Analyzing FactoryTalk Metrics Data Chapter 5
In the Chart Fields step, you will select the fields from the report data source that will be shown in the chart. This dialog box would look different if you had selected the Columns option in the Data Configuration step of the wizard.
To select the fields to be charted:
1. Since you want to have a bar for each workcell and you want the names of the workcells to appear in the legend, select Workcell Description from the LEGEND list.
2. From the VALUE list select the Running Seconds field . This is the field that will provide the values for the height of the bars.
3. When you selected the Running Seconds field from the VALUE list, COUNT(Running Seconds) was added to the list at the bottom of the dialog box. To change the function that is applied to the field, select the COUNT(Running Seconds) field in the list, click Function, and select AVG from the menu.
This action changes the function from COUNT(Running Seconds) to AVG(Running Seconds). The AVG(Running Seconds) function will return the average running time value for each workcell.
4. Now you will add Start Time labels to the X-axis. This will allow you to group the average running time values for the
Step 6: Select the Fields To Be Charted
Rockwell Automation Publication PLTMT-UM001M-EN-P-June 2014 189
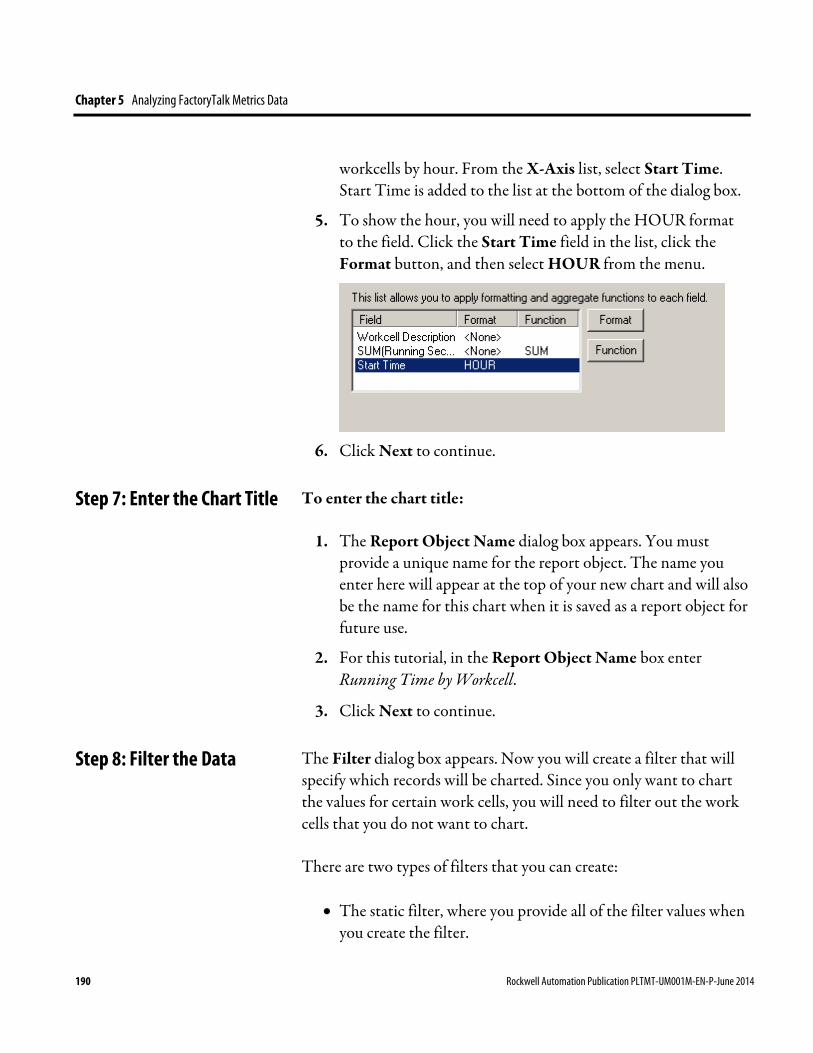
Chapter 5 Analyzing FactoryTalk Metrics Data
workcells by hour. From the X-Axis list, select Start Time. Start Time is added to the list at the bottom of the dialog box.
5. To show the hour, you will need to apply the HOUR format to the field. Click the Start Time field in the list, click the Format button, and then select HOUR from the menu.
6. Click Next to continue.
To enter the chart title:
1. The Report Object Name dialog box appears. You must provide a unique name for the report object. The name you enter here will appear at the top of your new chart and will also be the name for this chart when it is saved as a report object for future use.
2. For this tutorial, in the Report Object Name box enter Running Time by Workcell.
3. Click Next to continue.
The Filter dialog box appears. Now you will create a filter that will specify which records will be charted. Since you only want to chart the values for certain work cells, you will need to filter out the work cells that you do not want to chart.
There are two types of filters that you can create:
• The static filter, where you provide all of the filter values when you create the filter.
Step 7: Enter the Chart Title
Step 8: Filter the Data
190 Rockwell Automation Publication PLTMT-UM001M-EN-P-June 2014
Analyzing FactoryTalk Metrics Data Chapter 5
• The “prompt-at-runtime” filter which allows the user to select the filter values every time the filter is used.
For this tutorial, you are going to create a prompt-at-runtime filter that allows the users to select the work cells that they want to report on when the report is run.
NOTE Prompt-at-runtime filters cannot be used with report objects that will be scheduled.
To create a new filter:
1. Click New Filter. The Configure Filter dialog box appears.
2. Enter the name Workcell Description Filter in the Edit Filter Name box.
3. A filter is made up of one or more search criteria. For this filter, you will create a single criterion. Click Add Criterion. The Search Criterion dialog box appears.
4. Select the Workcell Description field from the Field tree and select the = operator from the Operator list.
5. Select the Select from a list of existing values for this field check box. This creates a list of unique values from which the user can pick report values.
6. Select the By prompting user when filter is run check box. This makes this a prompt-at-runtime filter.
7. Select the Allow multiple selection from list check box. This allows the user to select more than one work cell from the list of values that is created.
8. Select the Required (Must be supplied when filter is run) check box. Doing this will require the user to specify a filter value when the report object is run.
Rockwell Automation Publication PLTMT-UM001M-EN-P-June 2014 191

Chapter 5 Analyzing FactoryTalk Metrics Data
9. Click OK to return to the Configure Filter dialog box.
After you have completed these steps, the Configure Filter dialog box should look like the example below.
10. Click OK to return to the New Chart Wizard.
192 Rockwell Automation Publication PLTMT-UM001M-EN-P-June 2014
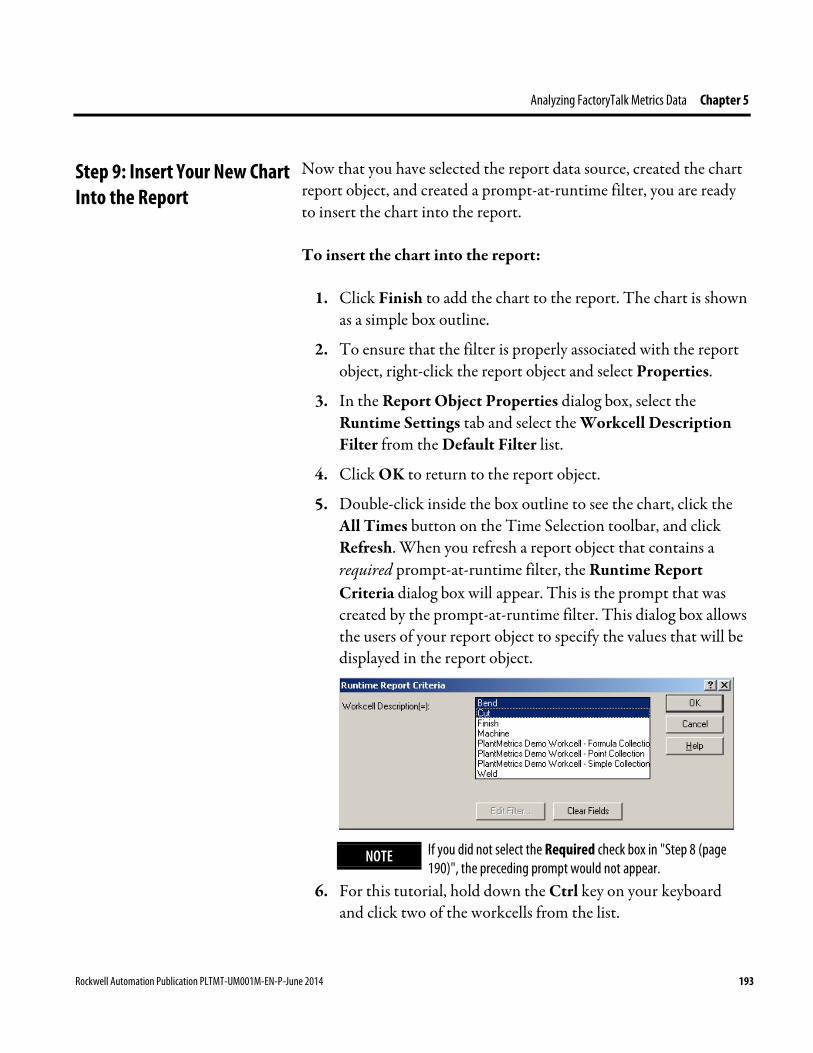
Analyzing FactoryTalk Metrics Data Chapter 5
Now that you have selected the report data source, created the chart report object, and created a prompt-at-runtime filter, you are ready to insert the chart into the report.
To insert the chart into the report:
1. Click Finish to add the chart to the report. The chart is shown as a simple box outline.
2. To ensure that the filter is properly associated with the report object, right-click the report object and select Properties.
3. In the Report Object Properties dialog box, select the Runtime Settings tab and select the Workcell Description Filter from the Default Filter list.
4. Click OK to return to the report object.
5. Double-click inside the box outline to see the chart, click the All Times button on the Time Selection toolbar, and click Refresh. When you refresh a report object that contains a required prompt-at-runtime filter, the Runtime Report Criteria dialog box will appear. This is the prompt that was created by the prompt-at-runtime filter. This dialog box allows the users of your report object to specify the values that will be displayed in the report object.
NOTE If you did not select the Required check box in "Step 8 (page 190)", the preceding prompt would not appear.
6. For this tutorial, hold down the Ctrl key on your keyboard and click two of the workcells from the list.
Step 9: Insert Your New Chart Into the Report
Rockwell Automation Publication PLTMT-UM001M-EN-P-June 2014 193
Chapter 5 Analyzing FactoryTalk Metrics Data
7. Click OK to display the chart with the average running time for the two workcells that you selected.
For information on how to further customize your chart by changing the title or bar/line colors, see "Customizing RSBizWare Charts and Tables (page 213)".
The Configuration Console gives you the ability to create a text report object (or table) on your report that displays the data from a report data source. The purpose of this tutorial is to walk through the steps that are necessary to create a table in your report. For this tutorial, you will use the FactoryTalk Metrics Workcell History report data source to create a table showing the average downtime for workcells by part number.
To start the Text Report Object Wizard:
1. In the Configuration Console, place your cursor where you want the table to appear in the report.
2. On the Insert menu, click Text Report.
3. Click Yes to accept the default user name and server name.
The Report Wizard appears.
4. Click Next.
To select the data that you want to include in the table:
1. On the Report Data Source and Fields page, in the Report Data Source list, select PlantMetrics Workcell History.
The list contains the report data sources for which you have the appropriate permissions.
2. In the Report Data Source Fields list, select the Workcell Description, Downtime Seconds, and Part fields, and then
Create a New Text Report Object
Step 1: Start the Text Report Object Wizard
Step 2: Select the Data On Which To Report
194 Rockwell Automation Publication PLTMT-UM001M-EN-P-June 2014
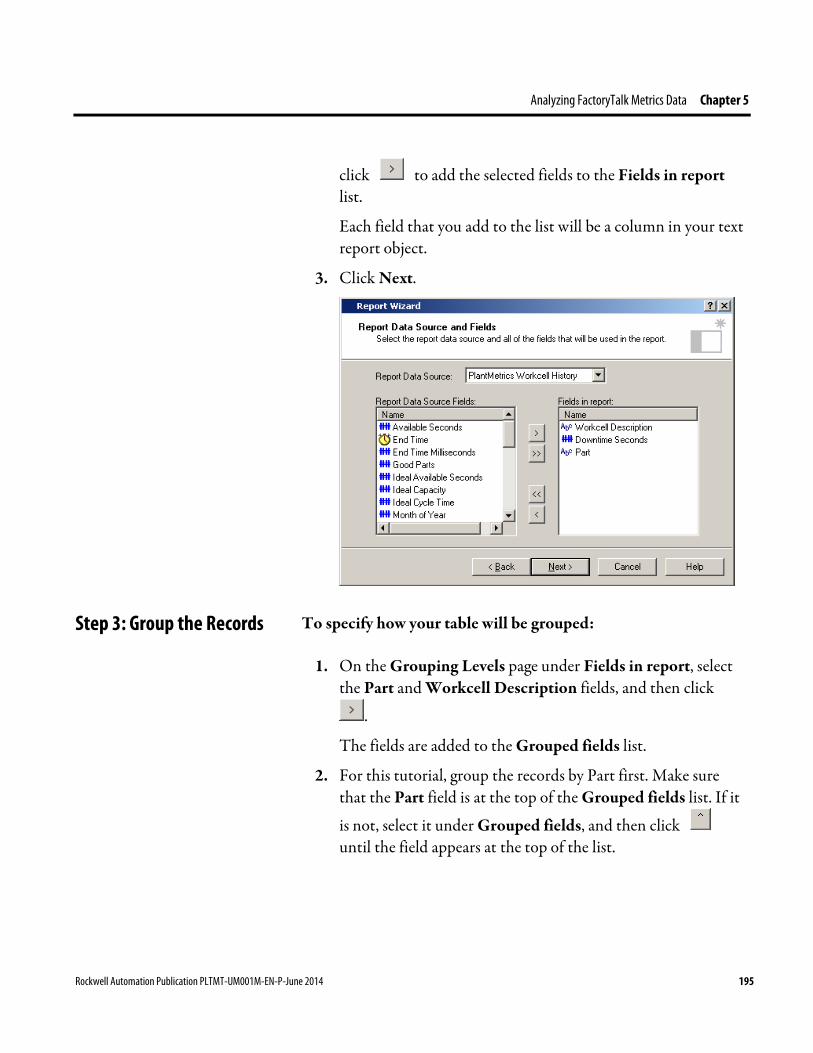
Analyzing FactoryTalk Metrics Data Chapter 5
click to add the selected fields to the Fields in report list.
Each field that you add to the list will be a column in your text report object.
3. Click Next.
To specify how your table will be grouped:
1. On the Grouping Levels page under Fields in report, select the Part and Workcell Description fields, and then click
.
The fields are added to the Grouped fields list.
2. For this tutorial, group the records by Part first. Make sure that the Part field is at the top of the Grouped fields list. If it
is not, select it under Grouped fields, and then click until the field appears at the top of the list.
Step 3: Group the Records
Rockwell Automation Publication PLTMT-UM001M-EN-P-June 2014 195

Chapter 5 Analyzing FactoryTalk Metrics Data
3. Click Next.
The Sort Order page allows you to specify the order in which the columns will be sorted and to calculate totals for columns. Since you chose to group by Part and Workcell Description, those columns automatically have a sort order applied to them.
Step 4: Sort the Records
196 Rockwell Automation Publication PLTMT-UM001M-EN-P-June 2014
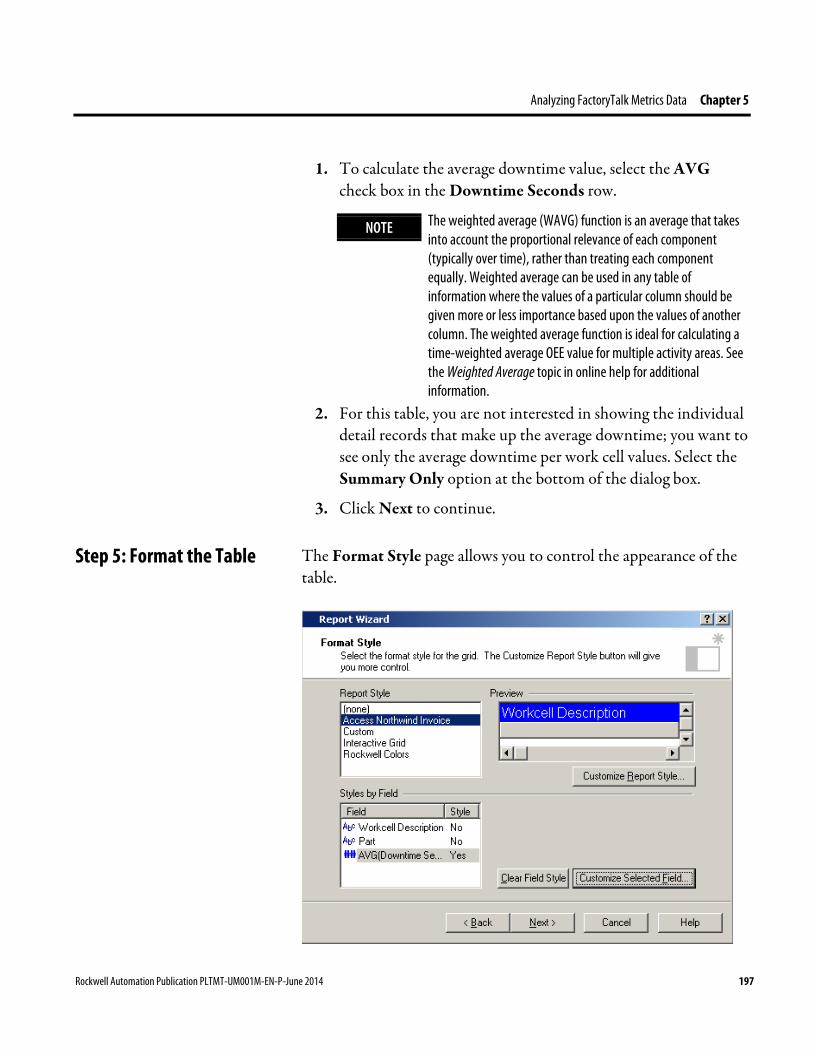
Analyzing FactoryTalk Metrics Data Chapter 5
1. To calculate the average downtime value, select the AVG check box in the Downtime Seconds row.
NOTE The weighted average (WAVG) function is an average that takes into account the proportional relevance of each component (typically over time), rather than treating each component equally. Weighted average can be used in any table of information where the values of a particular column should be given more or less importance based upon the values of another column. The weighted average function is ideal for calculating a time-weighted average OEE value for multiple activity areas. See the Weighted Average topic in online help for additional information.
2. For this table, you are not interested in showing the individual detail records that make up the average downtime; you want to see only the average downtime per work cell values. Select the Summary Only option at the bottom of the dialog box.
3. Click Next to continue.
The Format Style page allows you to control the appearance of the table.
Step 5: Format the Table
Rockwell Automation Publication PLTMT-UM001M-EN-P-June 2014 197
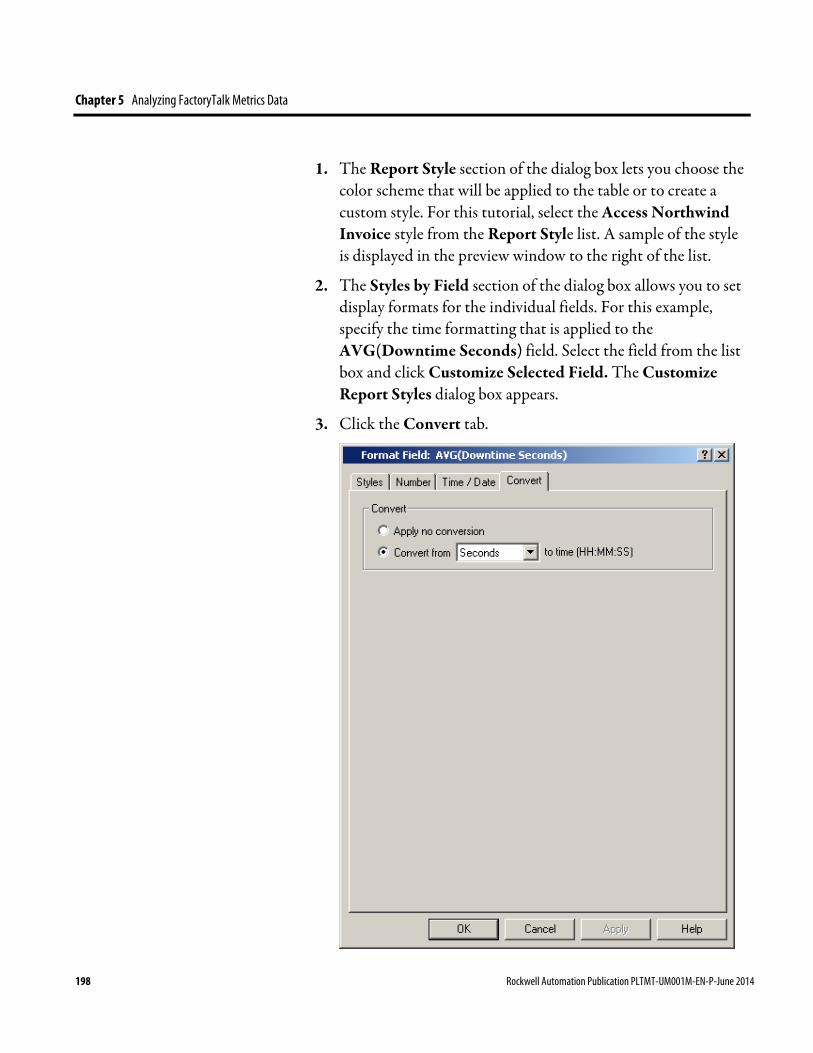
Chapter 5 Analyzing FactoryTalk Metrics Data
1. The Report Style section of the dialog box lets you choose the color scheme that will be applied to the table or to create a custom style. For this tutorial, select the Access Northwind Invoice style from the Report Style list. A sample of the style is displayed in the preview window to the right of the list.
2. The Styles by Field section of the dialog box allows you to set display formats for the individual fields. For this example, specify the time formatting that is applied to the AVG(Downtime Seconds) field. Select the field from the list box and click Customize Selected Field. The Customize Report Styles dialog box appears.
3. Click the Convert tab.
198 Rockwell Automation Publication PLTMT-UM001M-EN-P-June 2014

Analyzing FactoryTalk Metrics Data Chapter 5
4. Select the Convert from option and ensure that Seconds is selected from the list. This action will change the numeric value that represents the number of seconds into a time format.
5. Click OK to accept the values and return to the Report Wizard.
6. Click Next to continue.
On the Report Object Name page, you need to provide a unique name for the report object.
1. For this tutorial, enter Demo Table.
2. Click Next.
On the Filter page, you can use the same filter that you created for the chart, or you can create a new one. For this tutorial, use the one created before.
To filter the data:
1. Click Workcell Description Filter in the Filter list.
2. Click Next.
1. from the Default Filter list.
2. Click OK to return to the report object.
The table is displayed as a simple box in the report.
3. Double-click the box outline to view the table. Properties.
4. In the Report Object Properties dialog box, click the Runtime Settings tab.
5. In the Default Filter list, click Workcell Description Filter.
6. Click OK to return to the report object.
The table is displayed as a simple box in the report.
Step 6: Name the Report Object
Step 7: Filter the Data
Step 8: Insert Your New Table Into the Report
Rockwell Automation Publication PLTMT-UM001M-EN-P-June 2014 199
Chapter 5 Analyzing FactoryTalk Metrics Data
7. Double-click the box outline to view the table.
8. Click OK to return to the report object.
The table is displayed as a simple box in the report.
9. from the Default Filter list.
10. Click OK to return to the report object.
The table is displayed as a simple box in the report.
11. Double-click the box outline to view the table.
12. Set the time selection option and refresh the table as you did in the chart tutorial.
For information on how to further customize your chart by changing the title or bar/line colors, see "Customizing RSBizWare Charts and Tables (page 213)".
An important function of FactoryTalk Metrics is the ability to provide an OEE rating for each activity area that is being monitored. The OEE Box chart is a simple scorecard that provides a rating based on the performance parameters that were configured for the activity area.
In this section you will learn how to create an OEE Box chart.
To add an OEE box chart to the report:
1. Click a place in the report area, where you want to add the chart.
2. On the Insert menu, click OEE Box.
A message similar to the following appears:
Create an OEE Box Chart
Step 1: Add a Chart to the Report
200 Rockwell Automation Publication PLTMT-UM001M-EN-P-June 2014
Analyzing FactoryTalk Metrics Data Chapter 5
3. Click Yes.
A blank OEE Box chart appears on the report.
To select the activity area:
1. Right-click the OEE Box chart, and then click Properties.
The RSBizWare OEE Box Control Properties dialog box appears.
2. On the Activity Area tab, select the area for which you want to create the OEE chart.
Step 2: Select an Activity Area
Rockwell Automation Publication PLTMT-UM001M-EN-P-June 2014 201
Chapter 5 Analyzing FactoryTalk Metrics Data
To specify the layout of the chart:
1. In the RSBizWare OEE Box Control Properties dialog box, click the Layout tab.
On this tab, you can customize the OEE Box chart. You can specify the details that will appear on the report object, specify its layout, and set the auto-refresh rate. This dialog box also allows you to see a preview of the report object. By default, the OEE bar is displayed from left to right at the top of the OEE Box chart.
2. For this tutorial, select the Draw OEE Bar Vertically option.
Step 3: Specify the Layout of the Chart
202 Rockwell Automation Publication PLTMT-UM001M-EN-P-June 2014
Analyzing FactoryTalk Metrics Data Chapter 5
The chart displays the OEE bar from bottom to top on the left side of the OEE Box chart.
Now you will adjust the historical details that will be shown on the OEE Box chart. There are several historical elements that are shown by default in the chart, including Good Part Count, Total Part Count, and Scrap Part Count. In your chart, include also the Mean Time Between Failures (MTBF) and Mean Time to Repair (MTTR).
3. In the Show the following Historical Data list, select the Mean Time Between Failures and the Mean Time to Repair check boxes.
The selected historical elements are added to the OEE Box chart.
You can use a filter that will restrict the data displayed in the OEE Box chart. For example, if you want to report on the OEE for all part numbers produced for all shifts over the last 30 minutes, you will need to create a custom filter
To create a filter:
Step 4: Create a Filter
Rockwell Automation Publication PLTMT-UM001M-EN-P-June 2014 203
Chapter 5 Analyzing FactoryTalk Metrics Data
1. On the Layout tab, select the Apply a Custom Filter check box.
2. Click New....
The OEE Box Filter dialog box appears. You can use this dialog box to specify the shifts and parts that will be included in the OEE rating, and the time range for which the OEE rating will be displayed.
3. In the Filter Name box, type Past 30 Minutes.
4. Clear the All Times check box.
5. Click .
The The Past text box becomes editable.
6. Change the value from 10 to 30, and select minutes in the list.
7. To specify the shift that you want to filter on, under Additional Filtering, select Shifts in the Filter On list.
8. Make sure the default All Shifts option is selected.
204 Rockwell Automation Publication PLTMT-UM001M-EN-P-June 2014
Analyzing FactoryTalk Metrics Data Chapter 5
9. To specify the parts that you want to filter on, under Additional Filtering, select Parts in the Filter On list.
10. Make sure the default All Parts option is selected.
NOTE If you have User-defined Summarization Criteria configured for the activity area that you are reporting on, you can filter also on these criteria.
11. Click OK to save your filter.
A message appears informing that your filter has been saved.
12. Click OK to return to the RSBizWare OEE Box Control Properties dialog box.
To customize the colors of the OEE bar:
1. In the RSBizWare OEE Box Control Properties dialog box, click the OEE Bar tab.
You can use this tab to specify the bar colors in the OEE box report. The default bar colors are red (for OEE values 0 to 50), yellow (for OEE values 50 to 75), and green (for OEE values 75 to 100).
Step 5: Customize the OEE Bar Colors
Rockwell Automation Publication PLTMT-UM001M-EN-P-June 2014 205
Chapter 5 Analyzing FactoryTalk Metrics Data
2. For this tutorial, combine the two lower ranges so that you
have two ranges instead of three. Under OEE Performance Level Configuration, select the 50 to 75 range.
3. Click Delete.
A message appears asking if you want to delete the range.
4. Click Yes to remove the middle range from the list.
The ranges are automatically adjusted to include the missing values.
206 Rockwell Automation Publication PLTMT-UM001M-EN-P-June 2014

Analyzing FactoryTalk Metrics Data Chapter 5
To preview the OEE Box chart:
1. In the RSBizWare OEE Box Control Properties dialog box, click OK.
The OEE Box chart is displayed as a simple box in the report.
2. In order to see the OEE Box chart properly, click .
The report is displayed in preview mode. The filter icon in the upper right corner indicates that the filter you specified is being applied.
3. Click to continue editing your report in design mode.
With FactoryTalk Metrics you can also display more detailed information about an activity area that is being monitored.
Step 6: Preview Your OEE Box Chart
Create a FactoryTalk Metrics Detail Chart
Rockwell Automation Publication PLTMT-UM001M-EN-P-June 2014 207

Chapter 5 Analyzing FactoryTalk Metrics Data
The FactoryTalk Metrics Detail chart allows you to view the following information for an activity area:
• Event
• Counts
• Scrap
• OEE
This is the same chart that is displayed in the Manual Data Collection dialog box (for more information see "Manual Data Collection (page 134)").
To create a FactoryTalk Metrics Detail chart:
1. Click a place in the report area, where you want to add the chart.
2. On the Insert menu, click FactoryTalk Metrics Detail.
A message similar to the following appears:
3. Click Yes.
A blank OEE Box chart appears on the report.
A blank FactoryTalk Metrics Detail chart appears in your report.
208 Rockwell Automation Publication PLTMT-UM001M-EN-P-June 2014

Analyzing FactoryTalk Metrics Data Chapter 5
4. Right-click the chart, and then click Properties.
The FactoryTalk Metrics Detail Control Properties dialog box appears.
Use this dialog box to set the activity area for which you want to display FactoryTalk Metrics details.
5. Do either of the following:
• Leave the Show Plant Model Editor Tree option selected, if you want the user to select the activity area when viewing the report.
• Clear the selection of the option, if you want to choose a specific activity area that will appear in the FactoryTalk Metrics Detail report.
In this example, we will select a specific activity area for the report.
Rockwell Automation Publication PLTMT-UM001M-EN-P-June 2014 209
Chapter 5 Analyzing FactoryTalk Metrics Data
6. In the Report Type list, select the type of the report that you want to generate for the selected activity area.
Choose one of the following:
• Event
• Counts
• Scrap
• OEE
• Schedule
7. Click OK
8. Double-click in the box area.
You can now edit the box.
9. Click , and then click .
All FactoryTalk Metrics detail data collected for the selected activity area is displayed.
When you save your RSBizWare report to the Report Explorer, the report is saved on the Information Services Manager to which you are connected. If you want to open and edit your report in an
Export the Report to HTML
210 Rockwell Automation Publication PLTMT-UM001M-EN-P-June 2014

Analyzing FactoryTalk Metrics Data Chapter 5
HTML editor or make the page part of a website, you need to export the report to an .htm file.
To export the report to HTML:
1. On the File menu, click Export To File.
The Save As dialog box appears.
2. Navigate to the location, in which you want to save the report.
3. In the File name box, type a name for the report file.
In this example, the name is My Company Report.
The name of the file and its location is displayed on the title bar of the Configuration Console.
You now have two copies of the report: one saved as an .htm file, and the other stored in the Information Services Manager.
The .htm file contains text and some RSBizWare ActiveX controls. You can edit it in an HTML editor.
Once you modify your report in an HTML editor, you can import it to the Configuration Console.
To load the report from an HTML file:
1. On the File menu, click Load from File.
The Open dialog box appears.
2. Find you report file, and then click Open.
The report is displayed in the Configuration Console.
3. Save the file as an RSBizWare report (page 174).
4. The report is now available on the Information Services Manager computer.
Load the Report From File
Rockwell Automation Publication PLTMT-UM001M-EN-P-June 2014 211

Chapter 5 Analyzing FactoryTalk Metrics Data
212 Rockwell Automation Publication PLTMT-UM001M-EN-P-June 2014
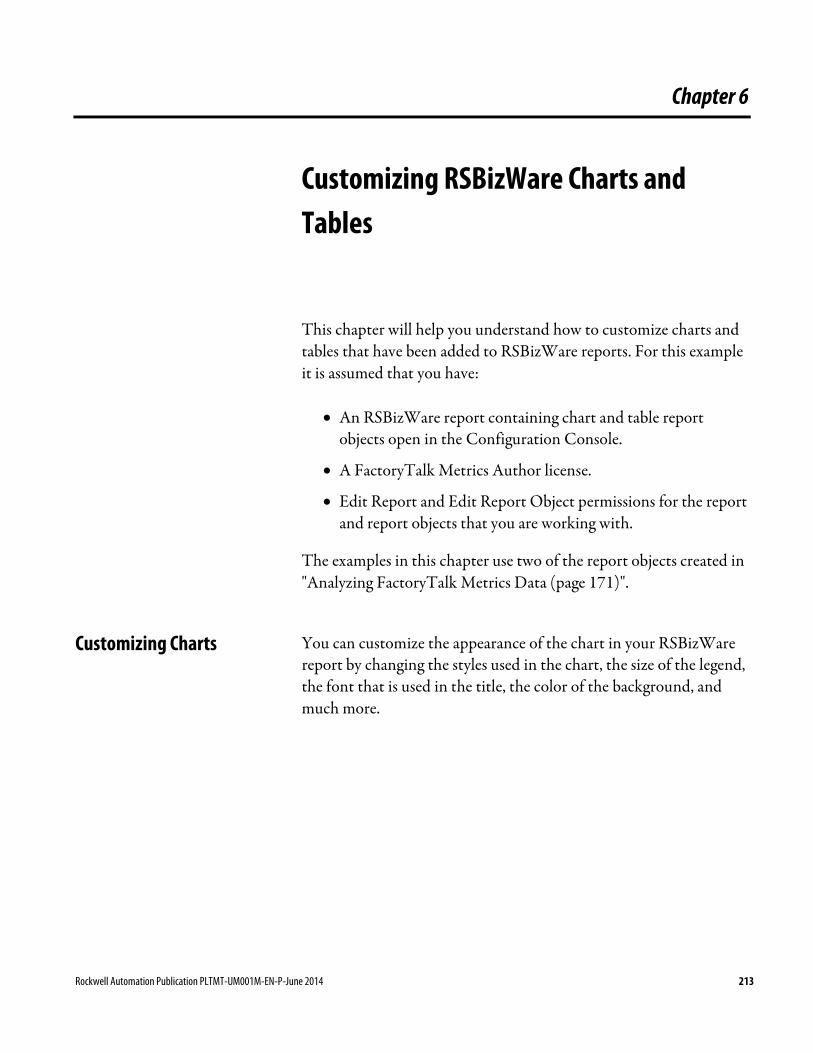
Chapter 6
Customizing RSBizWare Charts and Tables
This chapter will help you understand how to customize charts and tables that have been added to RSBizWare reports. For this example it is assumed that you have:
• An RSBizWare report containing chart and table report objects open in the Configuration Console.
• A FactoryTalk Metrics Author license.
• Edit Report and Edit Report Object permissions for the report and report objects that you are working with.
The examples in this chapter use two of the report objects created in "Analyzing FactoryTalk Metrics Data (page 171)".
You can customize the appearance of the chart in your RSBizWare report by changing the styles used in the chart, the size of the legend, the font that is used in the title, the color of the background, and much more.
Customizing Charts
Rockwell Automation Publication PLTMT-UM001M-EN-P-June 2014 213
Chapter 6 Customizing RSBizWare Charts and Tables
NOTE When you make modifications to a report object, all instances of the report object (such as those on other RSBizWare reports) will reflect the changes you have made.
Charts typically consist of three components: a title at the top, a chart in the middle, and a legend at the bottom. The default layout is fine for most charts, however, you can also change the layout of your chart if needed. Perhaps the legend would fit better in another place on the chart, or the legend should be resized because it is too small to show all of the legend keys.
A chart component must be in edit mode in order to be modified.
To set a chart component in edit mode:
1. Make sure your RSBizWare report is in design mode.
2. Click the chart.
The edit mode on the chart is enabled, and the component will have eight resizing handles and a highlighted border, indicating that it is ready to be modified.
3. Click the individual chart components and put them in edit mode.
Working With the Component Parts of a Chart
214 Rockwell Automation Publication PLTMT-UM001M-EN-P-June 2014
Customizing RSBizWare Charts and Tables Chapter 6
When you finish working with the chart component, click outside the chart to remove the resizing handles and highlighted border.
To resize a component:
1. Make sure that the sizing handles and highlighted border are visible around the component.
2. Point to one of the sizing handles, and when the cursor changes to , drag the handle until the component is the desired size.
To move a component:
1. Make sure that the sizing handles and highlighted border are visible around the component.
2. Point to the highlighted border, and when the cursor changes to , drag the component to the new location.
To delete a component:
1. Make sure that the sizing handles and highlighted border are visible around the component.
2. Right-click the component, and then click Delete or press the Delete key on your keyboard.
To edit a chart title or a text field:
1. Make sure that the sizing handles and highlighted border are visible around the component.
2. Right-click the chart title or text field, and then click Edit Text.
The Set Text dialog box appears.
Resizing a Component
Moving a Component
Deleting a Component
Editing the Chart Title or Text Field
Rockwell Automation Publication PLTMT-UM001M-EN-P-June 2014 215

Chapter 6 Customizing RSBizWare Charts and Tables
3. Modify the text and then click OK to save your changes.
Examples of standard properties that you can change for chart components are border style and font style. In addition to the standard properties, each chart component type has some specific properties that relate only to its type. For example, the chart legend has properties that specify how the keys will be displayed within the legend.
To access the property page for a chart component:
1. Make sure that the sizing handles and highlighted border are visible around the component.
2. Right-click the chart component and then click Chart Object Properties.
When you create a chart, the bars, pie slices, or lines of the chart are drawn with a default style. To make the chart easier to read or more appealing to users, you can change the color, formatting, and size of the data series used. For example, you can change the thickness of the lines in your X-Y chart to make them easier to see.
To customize the chart styles:
1. Make sure that the sizing handles and highlighted border are visible around the component.
2. Right-click the line, bar, or pie slice that you want to modify, and then on the shortcut menu click the desired option. The options available vary depending on what component type (line, bar, or pie slice) your chart uses. If your chart has an authoring legend, you can also use the chart property fields added to the authoring legend to customize colors and styles.
Changing Chart Component Properties
Working With Chart “Pens”
216 Rockwell Automation Publication PLTMT-UM001M-EN-P-June 2014
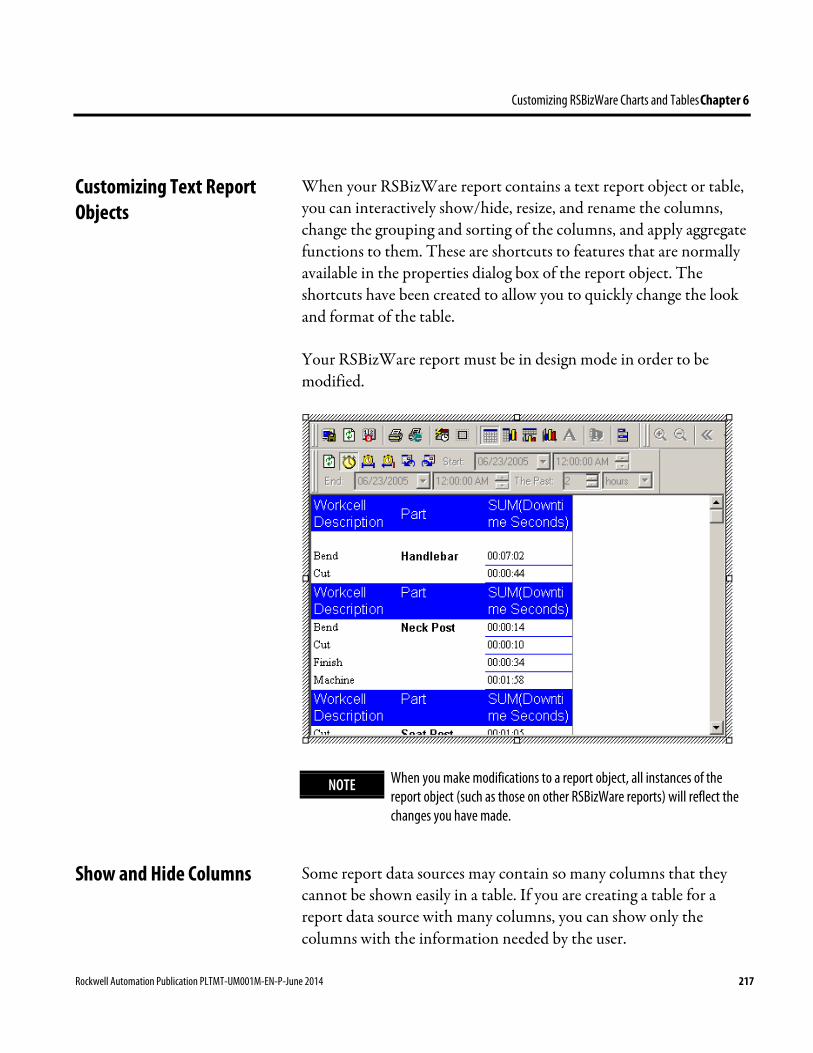
Customizing RSBizWare Charts and Tables Chapter 6
When your RSBizWare report contains a text report object or table, you can interactively show/hide, resize, and rename the columns, change the grouping and sorting of the columns, and apply aggregate functions to them. These are shortcuts to features that are normally available in the properties dialog box of the report object. The shortcuts have been created to allow you to quickly change the look and format of the table.
Your RSBizWare report must be in design mode in order to be modified.
NOTE When you make modifications to a report object, all instances of the report object (such as those on other RSBizWare reports) will reflect the changes you have made.
Some report data sources may contain so many columns that they cannot be shown easily in a table. If you are creating a table for a report data source with many columns, you can show only the columns with the information needed by the user.
Customizing Text Report Objects
Show and Hide Columns
Rockwell Automation Publication PLTMT-UM001M-EN-P-June 2014 217
Chapter 6 Customizing RSBizWare Charts and Tables
To hide a column:
• Right-click the column that you want to remove from the table, and then click Hide Column.
The columns that are removed from the table can be added again later.
To show a column that is not currently included in the table:
• Right-click the table and then click Insert Column > <Column name>.
The column will be inserted to the right of the column that is selected.
When you add a column to a table, it is assigned the default width. Sometimes, the default width is too large, resulting in excess white space, or too small, making the values wrap in the cells. The column-resizing feature allows you to adjust the column size as needed.
To resize a column:
1. Point to the grid line to the right of the column that you want to resize.
2. When the cursor changes to , drag the column to get the desired size.
If you have selected the Interactive Grid style for your table, you can:
• Interactively add an Aggregate function column to the table.
• Change the grouping of the table records.
• Apply a format to the selected column.
Resize Table Columns
Aggregate, Group, Format, Sort, Chart, and Rename Columns
218 Rockwell Automation Publication PLTMT-UM001M-EN-P-June 2014
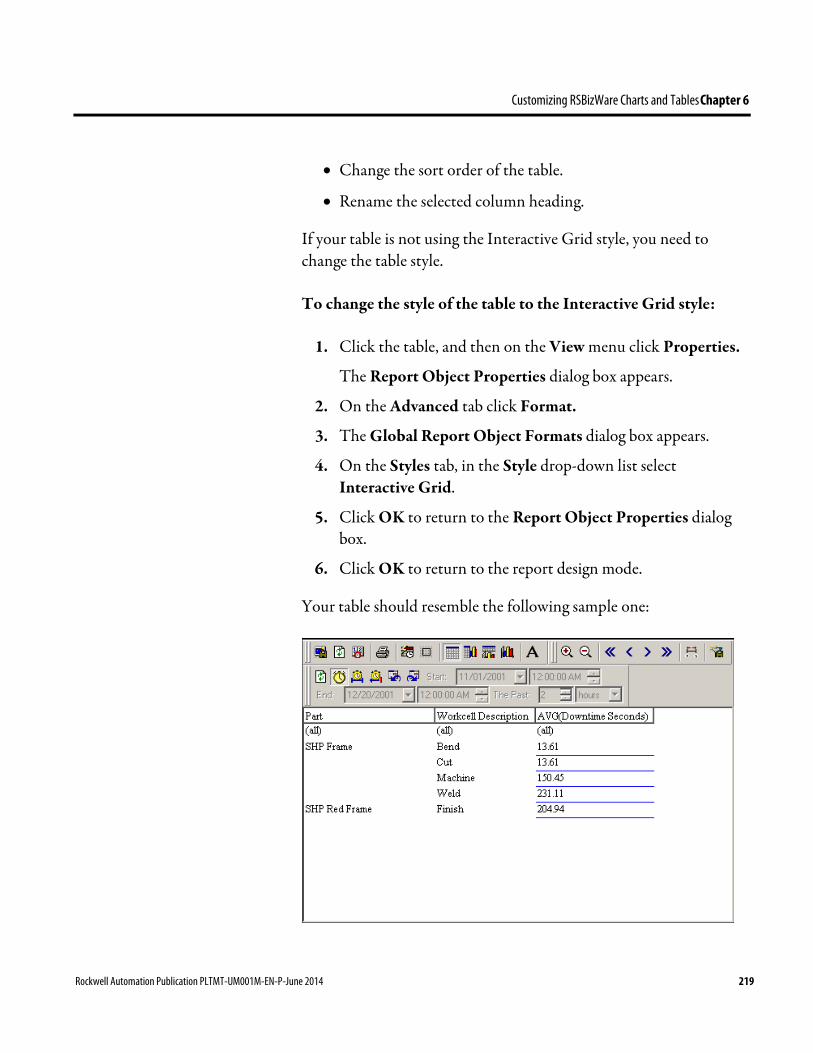
Customizing RSBizWare Charts and Tables Chapter 6
• Change the sort order of the table.
• Rename the selected column heading.
If your table is not using the Interactive Grid style, you need to change the table style.
To change the style of the table to the Interactive Grid style:
1. Click the table, and then on the View menu click Properties.
The Report Object Properties dialog box appears.
2. On the Advanced tab click Format.
3. The Global Report Object Formats dialog box appears.
4. On the Styles tab, in the Style drop-down list select Interactive Grid.
5. Click OK to return to the Report Object Properties dialog box.
6. Click OK to return to the report design mode.
Your table should resemble the following sample one:
Rockwell Automation Publication PLTMT-UM001M-EN-P-June 2014 219
Chapter 6 Customizing RSBizWare Charts and Tables
To apply the SUM aggregate function to a column, right-click the column header, and then click Aggregate > SUM.
The aggregate functions available on the menu vary from column to column. Only the functions that apply to a particular column are displayed. For example, it only makes sense to apply the SUM function to a numeric field.
To remove the aggregate function from a column, right-click the column header, and then click Aggregate > None.
To group by field, right-click the column header, and then click Grouping > Group 1.
The table records are grouped by the selected column. Each time you click Grouping in the shortcut menu for additional columns, additional group numbers are added to the menu. This allows you to group by as many columns as displayed in your table.
To remove a grouping, right-click the column header, and then click Grouping > None.
To apply a format to a column, right-click the column header, and then click Format > format style.
The format styles available on the menu vary from column to column. Only the formats that apply to a particular column are displayed. For example, it only makes sense to apply a month, day, year format to a date field.
To remove a format from a column, right-click the column header, and then click Format > <None>. The column data will use the default format for the data type displayed in the column.
Aggregate
Group
Format
220 Rockwell Automation Publication PLTMT-UM001M-EN-P-June 2014
Customizing RSBizWare Charts and Tables Chapter 6
To apply an ascending (A to Z) order to a column, right-click the column header, and then click Sorting > Sort 1 > Ascending.
The table records are sorted by the selected column. Each time you click Sorting in the shortcut menu for additional columns, the additional sort numbers are added to the menu. This allows you to sort by as many columns as your table displays.
To remove the sorting order, right-click the column header, and then click Sorting > None.
NOTE You can also sort the data by clicking the column header; however, the new sorting order will not be saved when you save your table.
To change the axis on which the chart is graphed, right-click the column header, and then click Chart > X-axis.
To clear the chart axis, right-click the column header, and then click Chart > None.
To rename a column:
1. Right-click the column header, and then click Rename.
The name in the column header is highlighted to indicate that it is ready to be changed.
2. Enter the new name for the column, and press the Enter key on your keyboard.
If you have selected the Interactive Grid style for your table, each column in the table has a built-in quick filter below the column heading. The default quick filter for each column is (All).
Sort
Chart
Rename
Quick Filter
Rockwell Automation Publication PLTMT-UM001M-EN-P-June 2014 221
Chapter 6 Customizing RSBizWare Charts and Tables
To create a quick filter:
1. Click the default quick filter to display a list containing all unique column values.
2. Select the value by which you want to filter.
The table is trimmed using the value as the criterion.
222 Rockwell Automation Publication PLTMT-UM001M-EN-P-June 2014
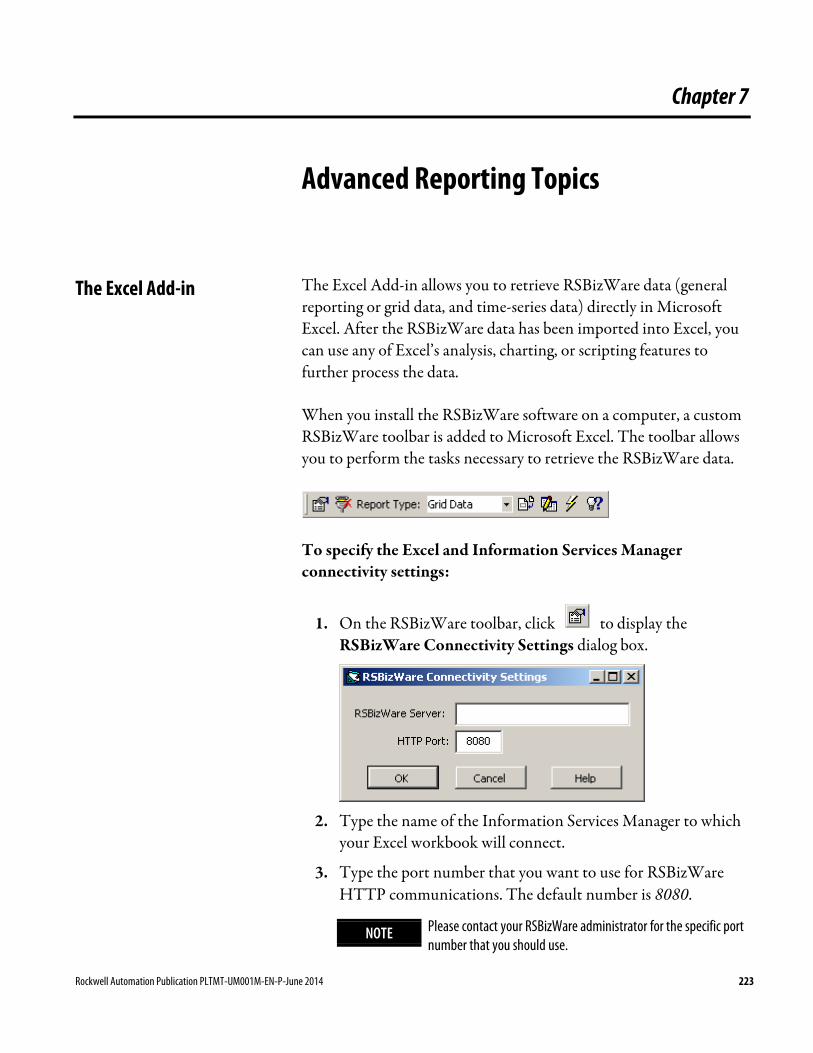
Chapter 7
Advanced Reporting Topics
The Excel Add-in allows you to retrieve RSBizWare data (general reporting or grid data, and time-series data) directly in Microsoft Excel. After the RSBizWare data has been imported into Excel, you can use any of Excel’s analysis, charting, or scripting features to further process the data.
When you install the RSBizWare software on a computer, a custom RSBizWare toolbar is added to Microsoft Excel. The toolbar allows you to perform the tasks necessary to retrieve the RSBizWare data.
To specify the Excel and Information Services Manager connectivity settings:
1. On the RSBizWare toolbar, click to display the RSBizWare Connectivity Settings dialog box.
2. Type the name of the Information Services Manager to which
your Excel workbook will connect.
3. Type the port number that you want to use for RSBizWare HTTP communications. The default number is 8080.
NOTE Please contact your RSBizWare administrator for the specific port number that you should use.
The Excel Add-in
Rockwell Automation Publication PLTMT-UM001M-EN-P-June 2014 223
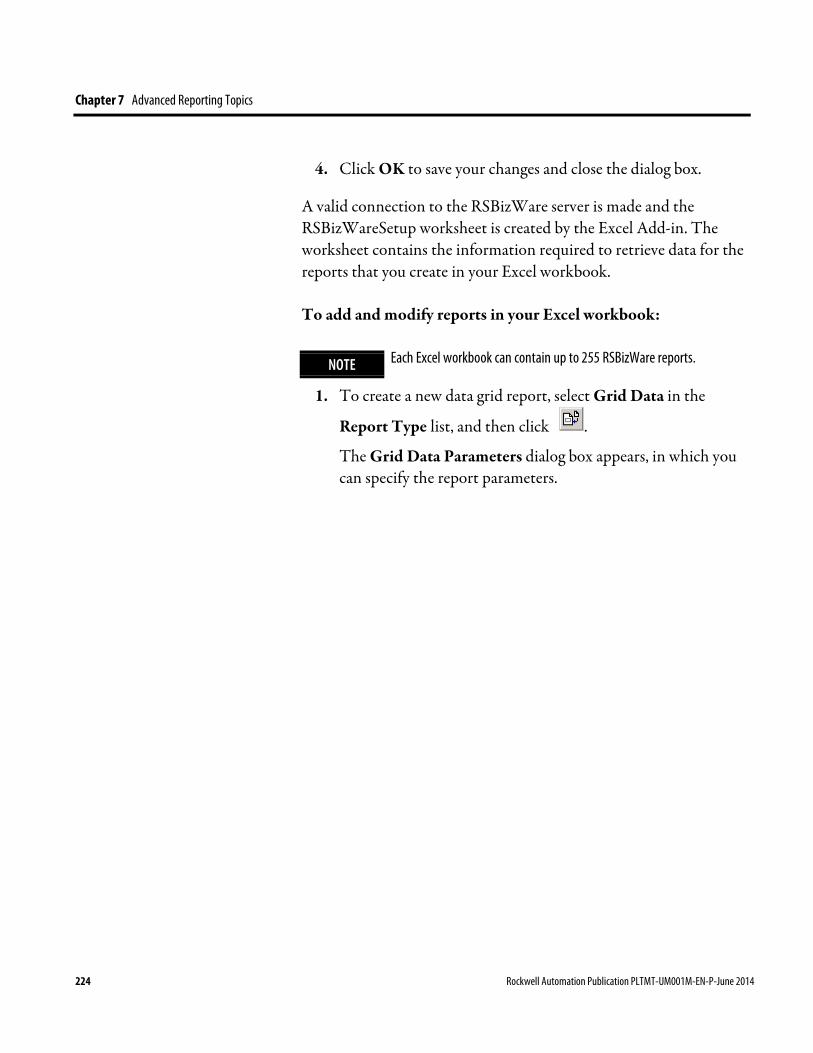
Chapter 7 Advanced Reporting Topics
4. Click OK to save your changes and close the dialog box.
A valid connection to the RSBizWare server is made and the RSBizWareSetup worksheet is created by the Excel Add-in. The worksheet contains the information required to retrieve data for the reports that you create in your Excel workbook.
To add and modify reports in your Excel workbook:
NOTE Each Excel workbook can contain up to 255 RSBizWare reports.
1. To create a new data grid report, select Grid Data in the
Report Type list, and then click .
The Grid Data Parameters dialog box appears, in which you can specify the report parameters.
224 Rockwell Automation Publication PLTMT-UM001M-EN-P-June 2014
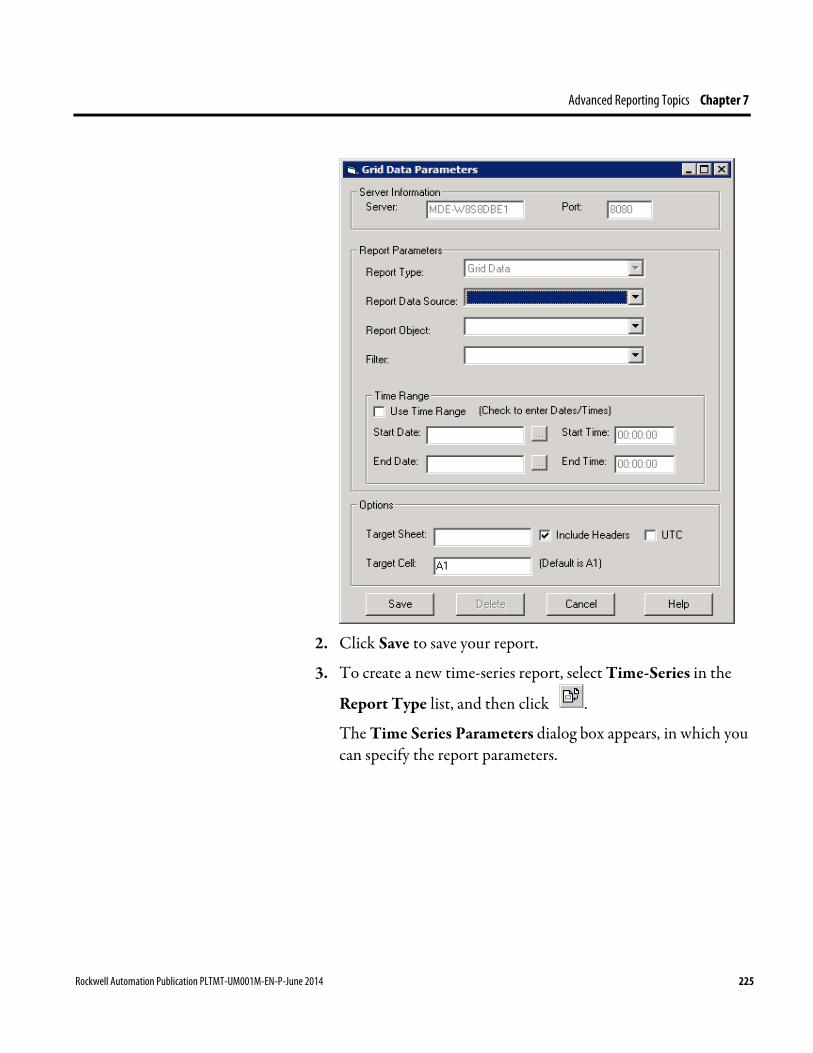
Advanced Reporting Topics Chapter 7
2. Click Save to save your report.
3. To create a new time-series report, select Time-Series in the
Report Type list, and then click .
The Time Series Parameters dialog box appears, in which you can specify the report parameters.
Rockwell Automation Publication PLTMT-UM001M-EN-P-June 2014 225
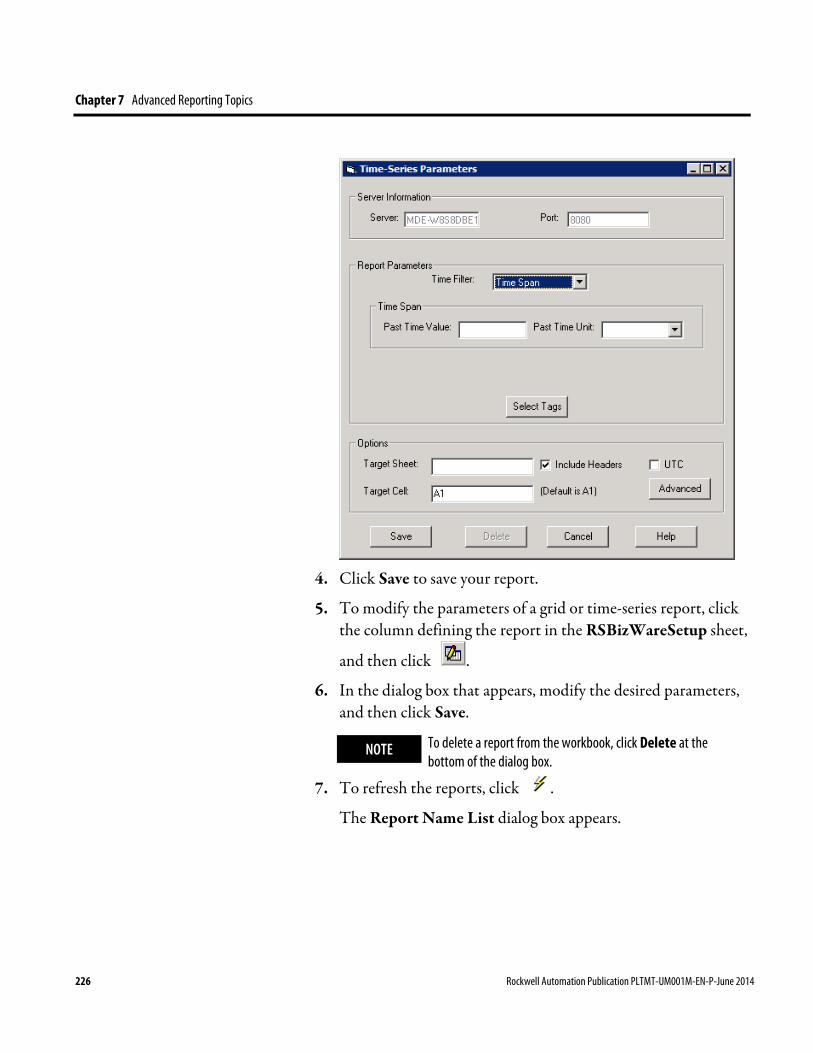
Chapter 7 Advanced Reporting Topics
4. Click Save to save your report.
5. To modify the parameters of a grid or time-series report, click the column defining the report in the RSBizWareSetup sheet,
and then click .
6. In the dialog box that appears, modify the desired parameters, and then click Save.
NOTE To delete a report from the workbook, click Delete at the bottom of the dialog box.
7. To refresh the reports, click .
The Report Name List dialog box appears.
226 Rockwell Automation Publication PLTMT-UM001M-EN-P-June 2014

Advanced Reporting Topics Chapter 7
8. Select the reports that you want to refresh, or select the
Refresh All Reports check box.
9. Click Update to refresh the selected reports and close the dialog box.
10. Click to save your workbook.
The Configuration Console allows you to schedule tasks to be run at some time in the future. The scheduling feature allows the valuable information in the Configuration Console to be used by the entire company without the cost of a runtime user license. Any report in the system can be scheduled as a task. The results of the task can be saved to a file, sent to an e-mail address, or printed. With this capability, you can set the Schedule Manager to e-mail report objects to production supervisors every morning, or update your production statistics in an HTML document that is referenced by your Web server.
Scheduling Report Objects and Reports
Rockwell Automation Publication PLTMT-UM001M-EN-P-June 2014 227
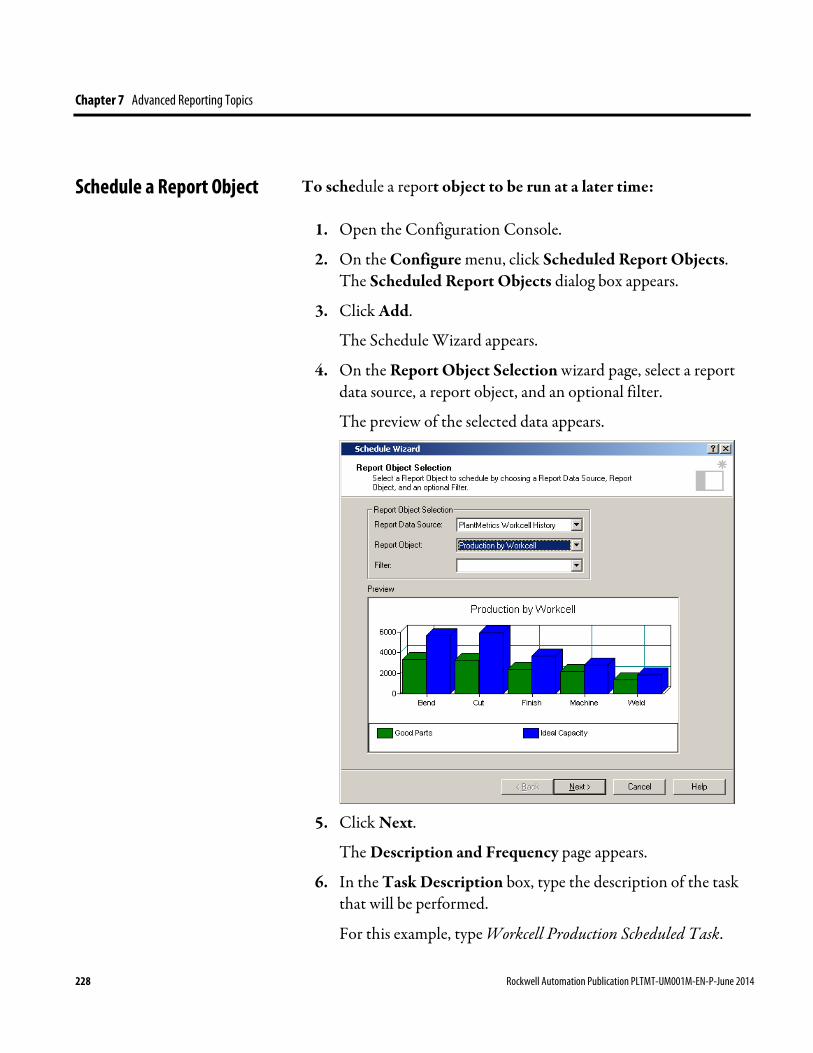
Chapter 7 Advanced Reporting Topics
To schedule a report object to be run at a later time:
1. Open the Configuration Console.
2. On the Configure menu, click Scheduled Report Objects. The Scheduled Report Objects dialog box appears.
3. Click Add.
The Schedule Wizard appears.
4. On the Report Object Selection wizard page, select a report data source, a report object, and an optional filter.
The preview of the selected data appears.
5. Click Next.
The Description and Frequency page appears.
6. In the Task Description box, type the description of the task that will be performed.
For this example, type Workcell Production Scheduled Task.
Schedule a Report Object
228 Rockwell Automation Publication PLTMT-UM001M-EN-P-June 2014
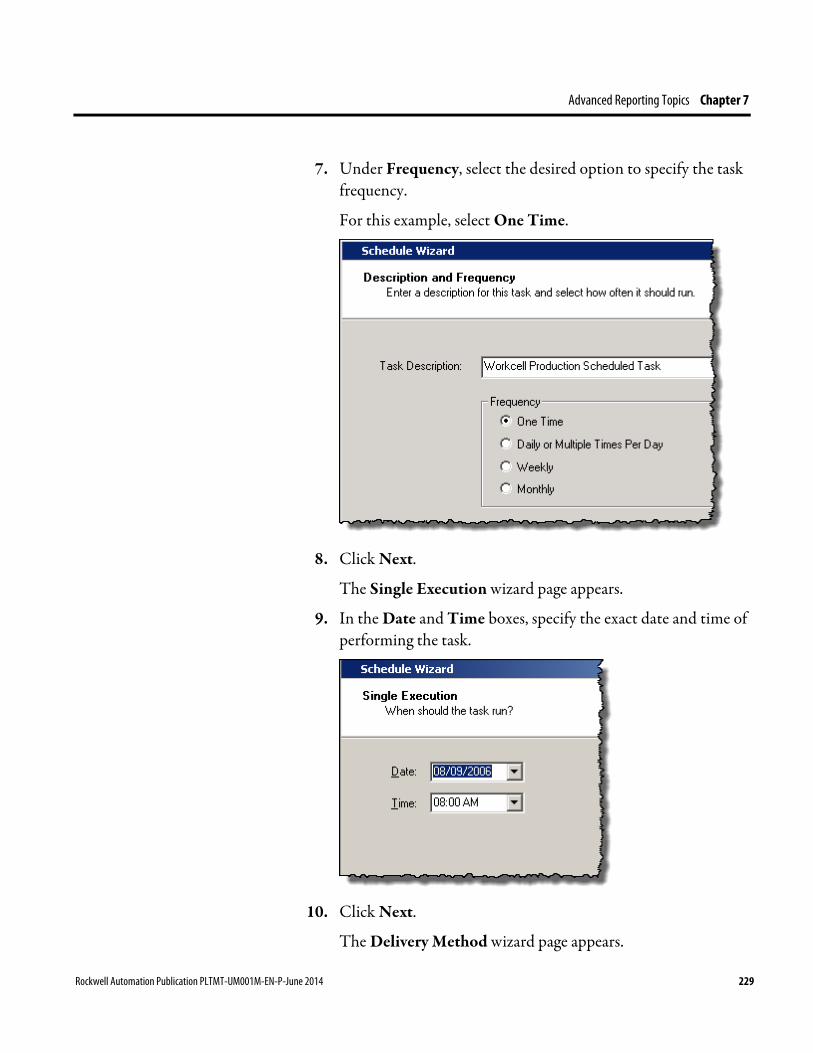
Advanced Reporting Topics Chapter 7
7. Under Frequency, select the desired option to specify the task frequency.
For this example, select One Time.
8. Click Next.
The Single Execution wizard page appears.
9. In the Date and Time boxes, specify the exact date and time of performing the task.
10. Click Next.
The Delivery Method wizard page appears.
Rockwell Automation Publication PLTMT-UM001M-EN-P-June 2014 229
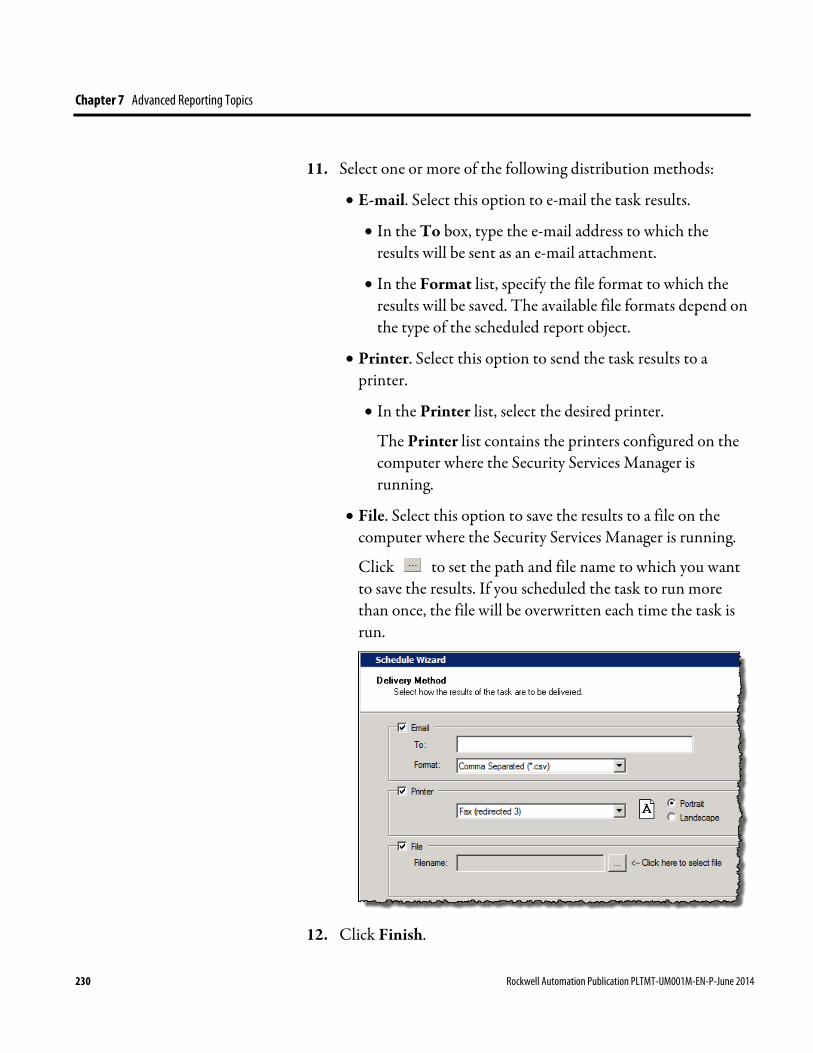
Chapter 7 Advanced Reporting Topics
11. Select one or more of the following distribution methods:
• E-mail. Select this option to e-mail the task results.
• In the To box, type the e-mail address to which the results will be sent as an e-mail attachment.
• In the Format list, specify the file format to which the results will be saved. The available file formats depend on the type of the scheduled report object.
• Printer. Select this option to send the task results to a printer.
• In the Printer list, select the desired printer.
The Printer list contains the printers configured on the computer where the Security Services Manager is running.
• File. Select this option to save the results to a file on the computer where the Security Services Manager is running.
Click to set the path and file name to which you want to save the results. If you scheduled the task to run more than once, the file will be overwritten each time the task is run.
12. Click Finish.
230 Rockwell Automation Publication PLTMT-UM001M-EN-P-June 2014
Advanced Reporting Topics Chapter 7
A message appears informing you that the item has been successfully scheduled. The messages displays also information about the date and time of the next occurrence of the item.
NOTE To ensure that the scheduled task is successfully performed, you need to close the Configuration Console if the Report Schedule Manager and the Configuration Console are running on the same machine. If you do not close the Configuration Console, the Report Schedule Manager will cause the disruption of your current Configuration Console activities and the failure of the scheduled task.
NOTE To schedule a report in the Report Explorer tree, you need to have the report user and password configured in the Service Console. For more information refer to the Administration Guide, section "Step 15: Register the Information Services Manager".
To schedule a report in the Report Explorer tree:
1. Open the Configuration Console.
2. Right-click the desired report in the Report Explorer tree, and select Schedule.
Schedule a Report
Rockwell Automation Publication PLTMT-UM001M-EN-P-June 2014 231
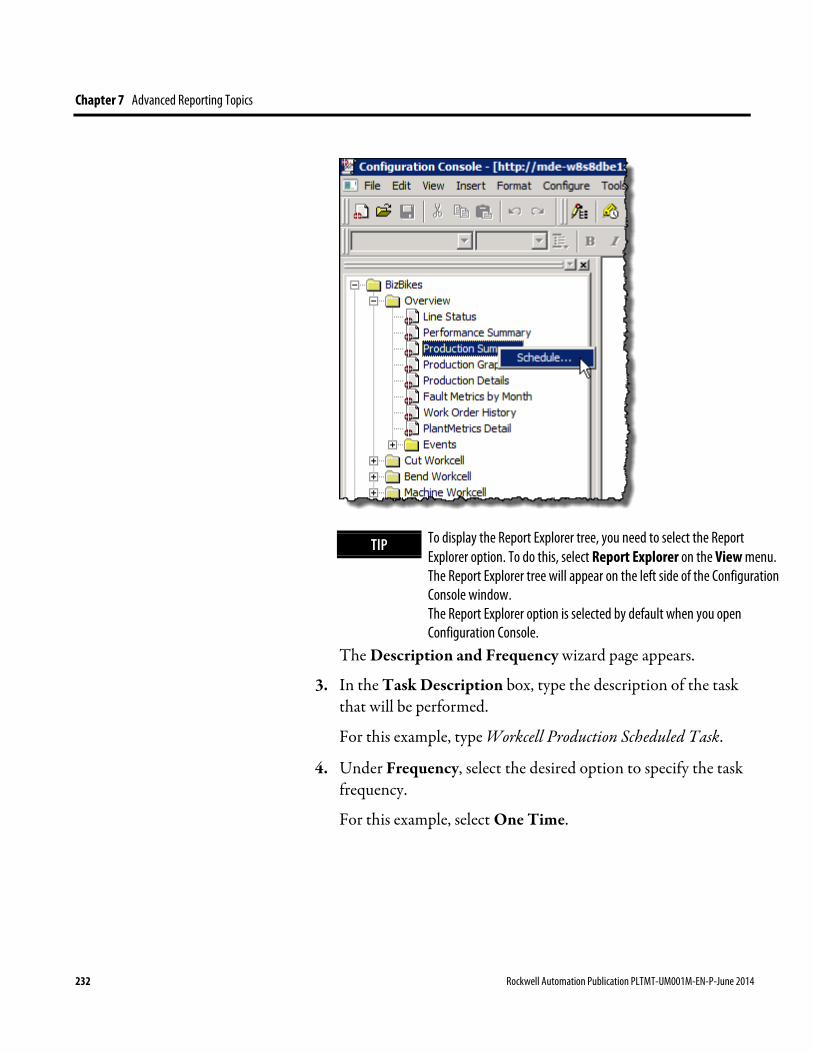
Chapter 7 Advanced Reporting Topics
TIP To display the Report Explorer tree, you need to select the Report Explorer option. To do this, select Report Explorer on the View menu. The Report Explorer tree will appear on the left side of the Configuration Console window. The Report Explorer option is selected by default when you open Configuration Console.
The Description and Frequency wizard page appears.
3. In the Task Description box, type the description of the task that will be performed.
For this example, type Workcell Production Scheduled Task.
4. Under Frequency, select the desired option to specify the task frequency.
For this example, select One Time.
232 Rockwell Automation Publication PLTMT-UM001M-EN-P-June 2014
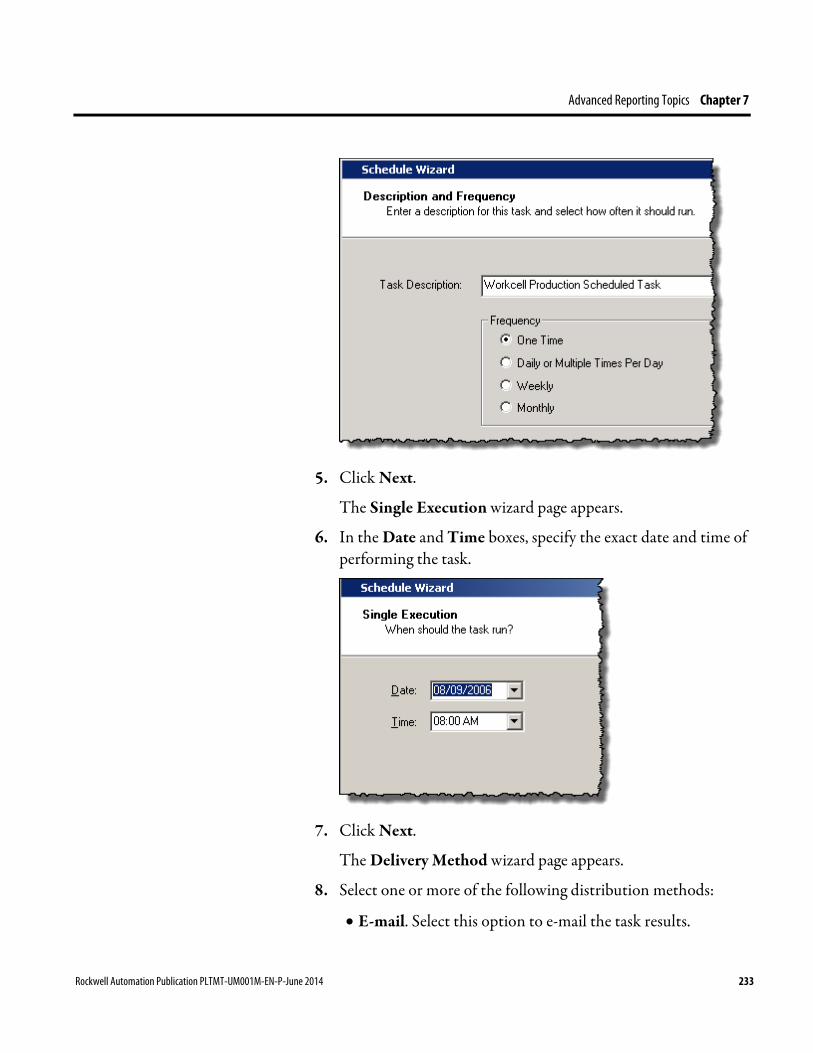
Advanced Reporting Topics Chapter 7
5. Click Next.
The Single Execution wizard page appears.
6. In the Date and Time boxes, specify the exact date and time of performing the task.
7. Click Next.
The Delivery Method wizard page appears.
8. Select one or more of the following distribution methods:
• E-mail. Select this option to e-mail the task results.
Rockwell Automation Publication PLTMT-UM001M-EN-P-June 2014 233
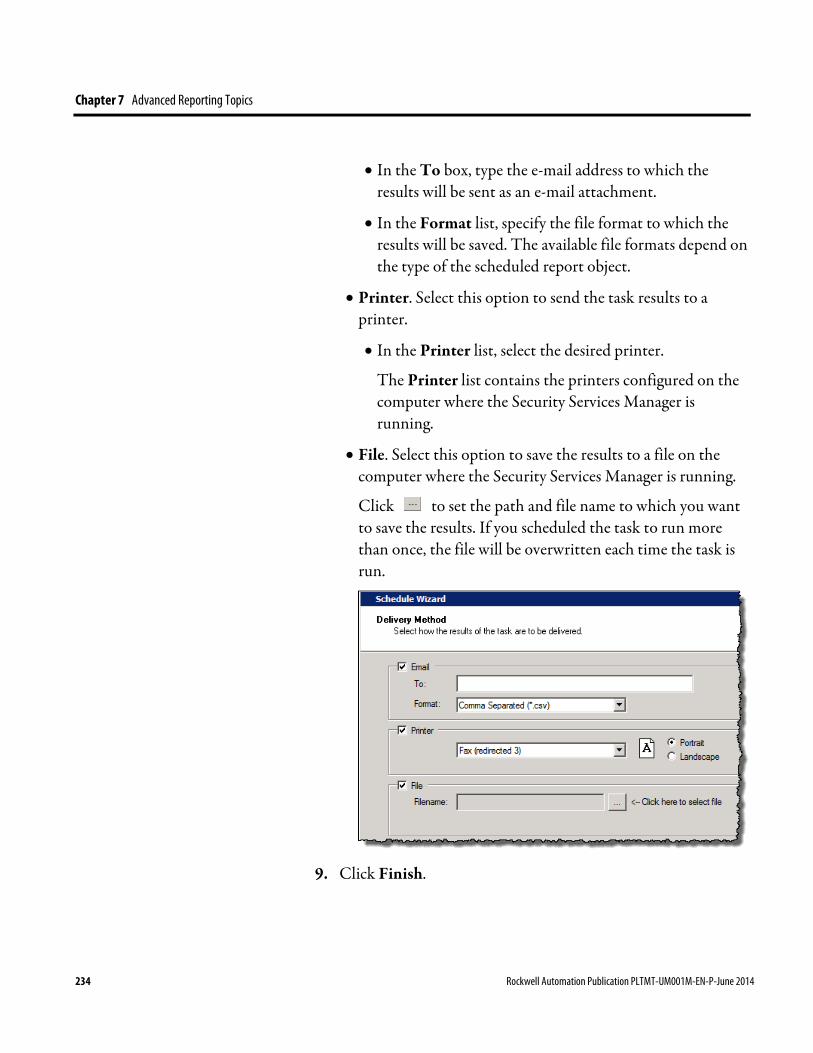
Chapter 7 Advanced Reporting Topics
• In the To box, type the e-mail address to which the results will be sent as an e-mail attachment.
• In the Format list, specify the file format to which the results will be saved. The available file formats depend on the type of the scheduled report object.
• Printer. Select this option to send the task results to a printer.
• In the Printer list, select the desired printer.
The Printer list contains the printers configured on the computer where the Security Services Manager is running.
• File. Select this option to save the results to a file on the computer where the Security Services Manager is running.
Click to set the path and file name to which you want to save the results. If you scheduled the task to run more than once, the file will be overwritten each time the task is run.
9. Click Finish.
234 Rockwell Automation Publication PLTMT-UM001M-EN-P-June 2014

Advanced Reporting Topics Chapter 7
A message appears informing you that the item has been successfully scheduled. The messages displays also information about the date and time of the next occurrence of the item.
NOTE To ensure that the scheduled task is successfully performed, you need to close the Configuration Console if the Report Schedule Manager and the Configuration Console are running on the same machine. If you do not close the Configuration Console, the Report Schedule Manager will cause the disruption of your current Configuration Console activities and the failure of the scheduled task.
Each time the Information Services Manager attempts to perform a scheduled task, a history record documenting the success or failure of the attempt is written to the database. If your task results are not distributed to a specific destination, you can view the schedule history to troubleshoot the problem.
To view the history of the scheduled task:
1. Open the Configuration Console.
2. On the Configure menu, click Scheduled Report Objects.
The Scheduled Report Objects dialog box appears.
3. Select the desired task and click View History.
The Document Schedule History dialog box appears. It contains a read-only table that displays the history of the scheduled task. Each record in the table represents an instance when FactoryTalk Metrics attempted to perform the task. The table displays the following attributes for each attempt to execute the scheduled task:
• Report Title. For scheduled reports only. The tree label that was applied to the RSBizWare report when it was saved in the Report Explorer tree.
View the History of the Scheduled Task
Rockwell Automation Publication PLTMT-UM001M-EN-P-June 2014 235

Chapter 7 Advanced Reporting Topics
• Filter. For scheduled report objects only. The name of the filter that was applied to the RSBizWare report object when it was scheduled.
• Schedule Description. The name that the user gave to the task when it was scheduled.
• Log Message. A message from FactoryTalk Metrics indicating the status of the task (e.g., Scheduled Item Created, Scheduled Item Dispatched, Scheduled Item Failed).
• Run Results. An additional description of the task results. For example, if your task failed, the run results may contain the reason of the task failure.
• Log Date. The date and time when the application attempted to perform the scheduled task.
The reporting features of the Configuration Console can be applied to tables or views that exist in non-RSBizWare databases. This is useful if you have data from other software packages or legacy systems that you want to analyze in the Configuration Console.
To analyze non-RSBizWare data in the Configuration Console, you need to create an external data source describing the external database to the Information Services Manager, and a report data source describing the table or view from the external database to the Configuration Console.
An external data source is the ODBC connection to the SQL Server or Oracle database. The external data source provides a link between the non-RSBizWare database and the Information Services Manager. External data sources are configured in the Service Console. For information on how to create a new external data source, refer to the Administration Guide, section "Administering RSBizWare servers”.
Analyzing Non-RSBizWare Data
Create an External Data Source
236 Rockwell Automation Publication PLTMT-UM001M-EN-P-June 2014
Advanced Reporting Topics Chapter 7
A report data source is a connection to a table or view within an external data source. A report data source describes a table or view to the Configuration Console. After your report data source has been created, you can design reports to analyze the data. For instructions on creating reports, see "Analyzing FactoryTalk Metrics Data (page 171)".
Before you walk through the tutorial, it is assumed that you have been granted the FactoryTalk Metrics Author license and the Create New Report Data Sources privilege by your RSBizWare administrator.
To create a report data source:
1. On the Configure menu in the Configuration Console, click Reporting > Report Data Sources, Objects, and Filters.
The Configure Report Data Sources, Report Objects, and Filters dialog box appears.
2. Under Report Data Sources, click Add.
The Report Data Source Configuration wizard appears.
3. Click Next.
The Report Data Source Name page appears.
4. In the Report Data Source Name box, type the name of the report data source.
5. (Optional) To define specific permissions for the report data source, click Permissions. If you do not define them, default permissions are automatically associated with the report data source.
NOTE For more information about the default permissions, refer to the Administration Guide, section "Administering RSBizWare servers".
6. Click Next.
Report Data Sources
Step 1: Start the Report Data Source Wizard
Rockwell Automation Publication PLTMT-UM001M-EN-P-June 2014 237
Chapter 7 Advanced Reporting Topics
The Choose a Database Table or View page appears.
7. Select the desired database.
The table at the bottom of the dialog box is filled with the tables and views that exist in the database.
8. Under Name, select the table or view to which you want to create a connection.
9. Click Next.
The Column Selection page appears.
10. Select the column names that you want to add to the report data source:
• Under Columns in Table or View, click a column name,
and then click .
The column is moved under Columns in Report Data Source.
• To move several columns, press and hold Ctrl, click the
columns, and then click .
• To move all the columns, click .
11. (Optional). Under Columns in Report Data Source, rename the columns:
1. Click the desired column, and then click Rename.
The name becomes highlighted for editing.
2. Change the name, and then press Enter.
12. (Optional). Click Derived Field, and then click Add Derived Field.
The Add Derived Field dialog box appears.
A derived field is a new field that is a combination or calculation of existing fields. For example, if your table has the A, B, and C fields, you can create a D derived field containing the value calculated from the expression ((A-B)/C * 100).
238 Rockwell Automation Publication PLTMT-UM001M-EN-P-June 2014
Advanced Reporting Topics Chapter 7
1. Under Field Name, type a name for the new field.
2. Under Data Type, select the data type for the field.
3. Under SQL Expression..., do either of the following:
• Type the expression that will be evaluated to produce the derived field.
• Choose one of available expressions:
Under Columns, click a column name.
Click Add Column to Expression.
The expression from the column appears under SQL Expression....
If you do not select any expression in the Column list, and then click Add Column to Expression, the first expression in the list is added to the SQL Expression box.
13. Click Validate to check for errors.
If there are no errors, the Validate button becomes inactive.
14. Click Add.
The Column Selection page appears.
The derived field is displayed under Columns in Report Data Source.
15. Click Next.
The Time Selection Toolbar page appears.
16. Under Timestamp Column for Time Selection Toolbar, select a timestamp field.
17. Click Next.
The Time-series Format page appears.
Rockwell Automation Publication PLTMT-UM001M-EN-P-June 2014 239
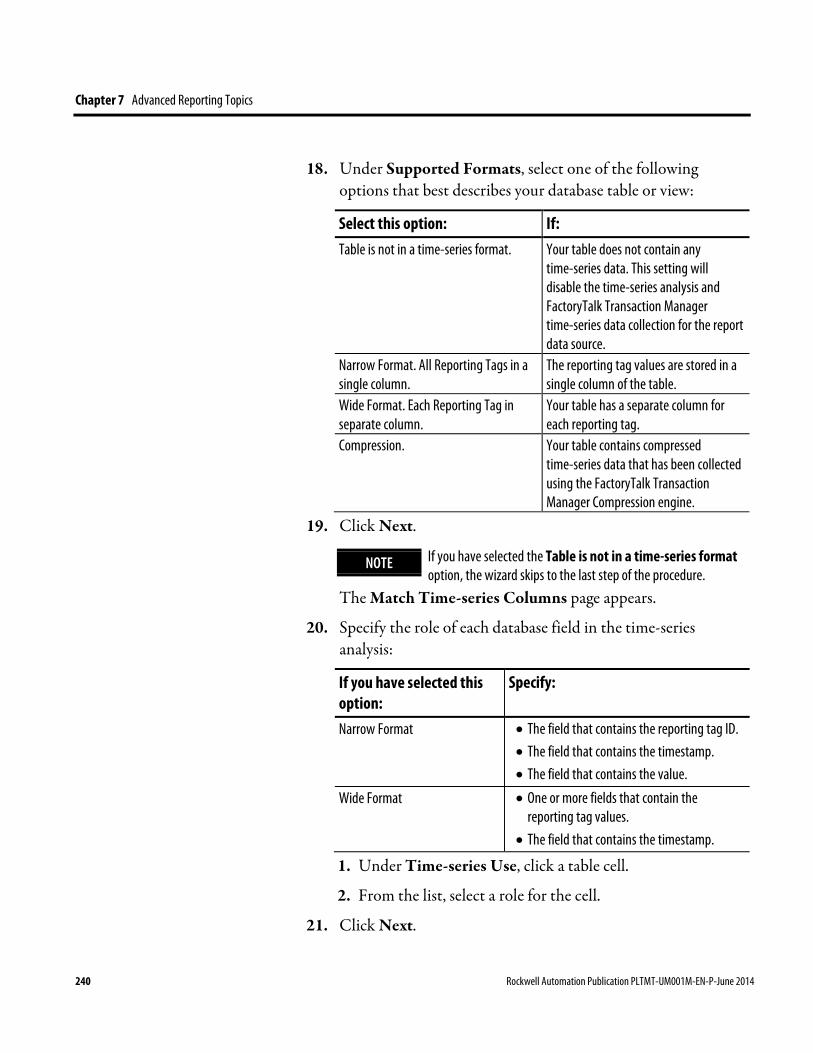
Chapter 7 Advanced Reporting Topics
18. Under Supported Formats, select one of the following options that best describes your database table or view:
Select this option: If: Table is not in a time-series format. Your table does not contain any
time-series data. This setting will disable the time-series analysis and FactoryTalk Transaction Manager time-series data collection for the report data source.
Narrow Format. All Reporting Tags in a single column.
The reporting tag values are stored in a single column of the table.
Wide Format. Each Reporting Tag in separate column.
Your table has a separate column for each reporting tag.
Compression. Your table contains compressed time-series data that has been collected using the FactoryTalk Transaction Manager Compression engine.
19. Click Next.
NOTE If you have selected the Table is not in a time-series format option, the wizard skips to the last step of the procedure.
The Match Time-series Columns page appears.
20. Specify the role of each database field in the time-series analysis:
If you have selected this option:
Specify:
Narrow Format • The field that contains the reporting tag ID. • The field that contains the timestamp. • The field that contains the value.
Wide Format • One or more fields that contain the reporting tag values.
• The field that contains the timestamp.
1. Under Time-series Use, click a table cell.
2. From the list, select a role for the cell.
21. Click Next.
240 Rockwell Automation Publication PLTMT-UM001M-EN-P-June 2014

Advanced Reporting Topics Chapter 7
The Data Point Configuration Table page appears.
22. Do either of the following:
• Under Select the Data Point configuration table, select a table that holds information about the data points.
• Under Or create a new table, click Create Configuration Table to have a new table created for you.
The table fields are displayed under Match the configuration...
23. If you have selected an existing table, for each database field under Column assign a value from the Time-series Use column.
24. Click Next.
The Completing the Report Data Source Configuration page appears.
25. Review the summary of the report data source configuration, and then click Finish.
NOTE If the underlying database table or view changes after you have created your report data source, you need to recreate the report data source.
User-derived fields are derived by using the values of other fields. You can create two types of derived fields:
• Detailed derived fields
The fields contain values that are derived from one or more detail fields within a single record.
For example, you can create a detailed derived field by dividing a field of your choice by 60 seconds.
For details, see "Create Detailed Derived Fields (page 243)".
• Summary derived fields
User-derived Fields
Rockwell Automation Publication PLTMT-UM001M-EN-P-June 2014 241

Chapter 7 Advanced Reporting Topics
The fields contain values that are derived from more than one record from one or more detail fields. Summary values are typically obtained either by grouping multiple records or by applying a summarization function (like SUM or AVG) to the records being summarized.
For example, you can create a summary derived field by summing up two fields of your choice, dividing one by the other, and then multiplying the result by 60 seconds.
For details, see "Create Summary Derived Fields (page 247)".
You can add a user-derived field to an existing report data source, however, it is recommended that you create a new report data source when creating user-derived fields.
For more information on creating a report data source, see "Create a Report Data Source (page 237)".
After you create a user-derived field, you can include it in a report. Detailed text reports cannot contain summary derived fields. However, both summary and detailed text reports can contain detailed derived fields.
When creating a report, a detailed derived field can be treated like any actual field. The rule for summary reports is that every column in the report must be either a grouped column or have a column function applied to it. A grouped column is used to determine which records are grouped together to be summarized, and each of the columns that are not grouped must have a way (a function) to take multiple values (from multiple records), and calculate a single value to display on the report.
Derived fields are derived from other data in the database, so it is useful to know what other data is available for use when you build the fields. For more information on the most widely used database tables, see "Workcell History, Event History, and Machine State Data (page 261)".
242 Rockwell Automation Publication PLTMT-UM001M-EN-P-June 2014
Advanced Reporting Topics Chapter 7
To create detailed derived fields:
1. On the Configure menu in the Configuration Console, click Reporting > Report Data Sources, Objects, and Filters.
The Configure Report Data Sources, Report Objects, and Filters dialog box appears.
2. Under Report Data Sources, click Add.
The Report Data Source Configuration wizard appears.
3. Click Next.
The Report Data Source Name page appears.
4. In the Report Data Source Name box, type Workcell Detailed Derived Fields Example.
5. Click Next.
The Choose a Database Table or View page appears.
6. Select (Local Server Database) in the list.
7. Clear the Show Tables check box to display only the database views.
8. Select the OEEQWorkcell view.
The selected database view is the view used by the standard FactoryTalk Metrics Workcell History report data source.
9. Click Next.
The Column Selection page appears.
10. Under Columns in Table or View, press and hold Ctrl, and click the sDescription, tStart, sPartId, dTotalParts, and dIdealCycleTime columns.
11. Click .
The selected columns are moved under Columns in Report Data Source.
Create Detailed Derived Fields
Rockwell Automation Publication PLTMT-UM001M-EN-P-June 2014 243
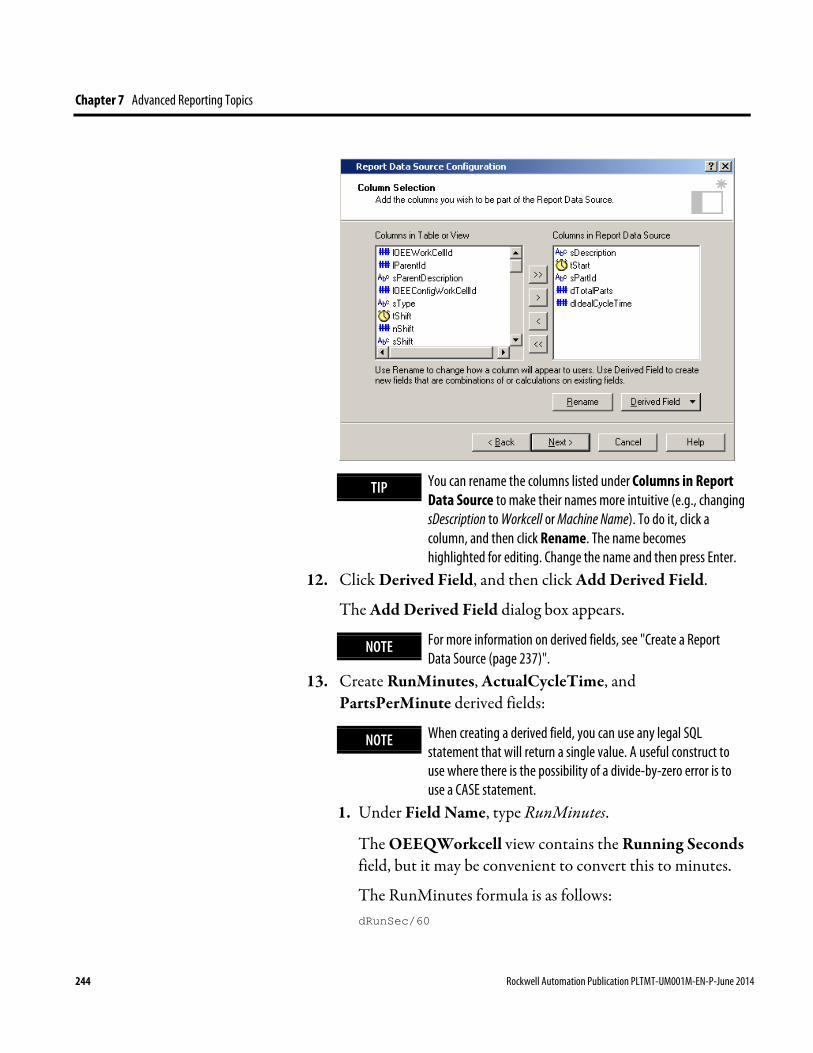
Chapter 7 Advanced Reporting Topics
TIP You can rename the columns listed under Columns in Report Data Source to make their names more intuitive (e.g., changing sDescription to Workcell or Machine Name). To do it, click a column, and then click Rename. The name becomes highlighted for editing. Change the name and then press Enter.
12. Click Derived Field, and then click Add Derived Field.
The Add Derived Field dialog box appears.
NOTE For more information on derived fields, see "Create a Report Data Source (page 237)".
13. Create RunMinutes, ActualCycleTime, and PartsPerMinute derived fields:
NOTE When creating a derived field, you can use any legal SQL statement that will return a single value. A useful construct to use where there is the possibility of a divide-by-zero error is to use a CASE statement.
1. Under Field Name, type RunMinutes.
The OEEQWorkcell view contains the Running Seconds field, but it may be convenient to convert this to minutes.
The RunMinutes formula is as follows: dRunSec/60
244 Rockwell Automation Publication PLTMT-UM001M-EN-P-June 2014
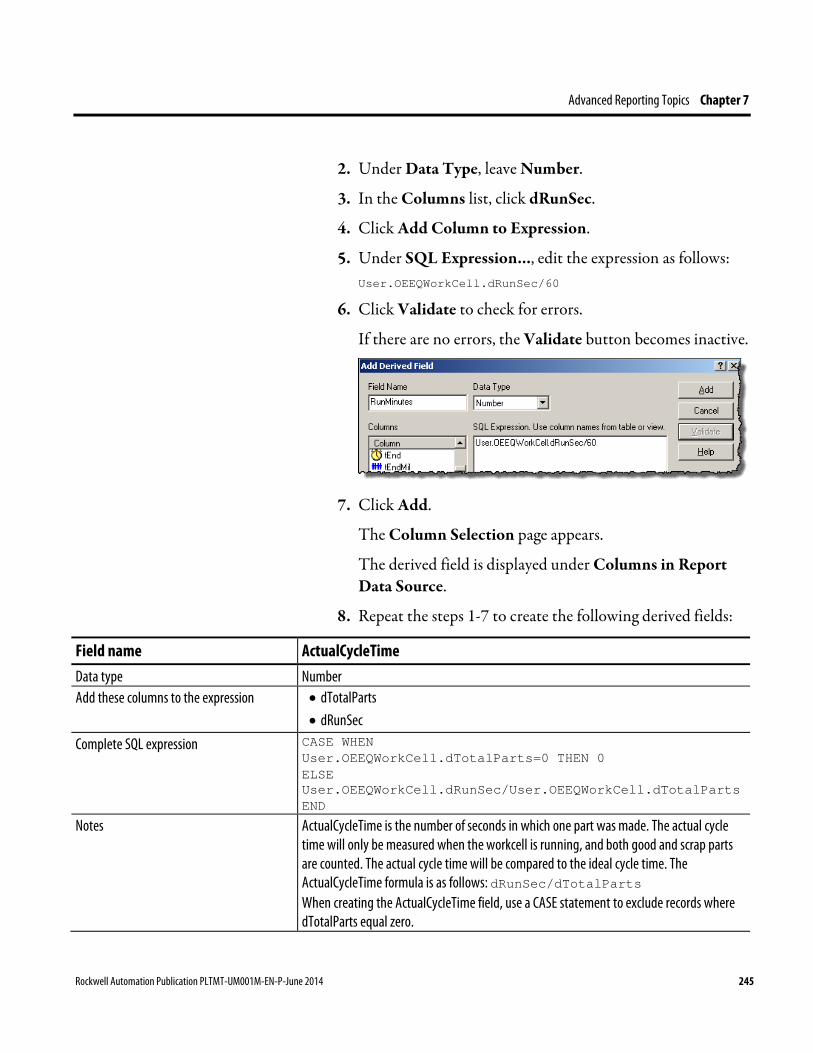
Advanced Reporting Topics Chapter 7
2. Under Data Type, leave Number.
3. In the Columns list, click dRunSec.
4. Click Add Column to Expression.
5. Under SQL Expression..., edit the expression as follows: User.OEEQWorkCell.dRunSec/60
6. Click Validate to check for errors.
If there are no errors, the Validate button becomes inactive.
7. Click Add.
The Column Selection page appears.
The derived field is displayed under Columns in Report Data Source.
8. Repeat the steps 1-7 to create the following derived fields:
Field name ActualCycleTime Data type Number Add these columns to the expression • dTotalParts
• dRunSec
Complete SQL expression CASE WHEN User.OEEQWorkCell.dTotalParts=0 THEN 0 ELSE User.OEEQWorkCell.dRunSec/User.OEEQWorkCell.dTotalParts END
Notes ActualCycleTime is the number of seconds in which one part was made. The actual cycle time will only be measured when the workcell is running, and both good and scrap parts are counted. The actual cycle time will be compared to the ideal cycle time. The ActualCycleTime formula is as follows: dRunSec/dTotalParts When creating the ActualCycleTime field, use a CASE statement to exclude records where dTotalParts equal zero.
Rockwell Automation Publication PLTMT-UM001M-EN-P-June 2014 245
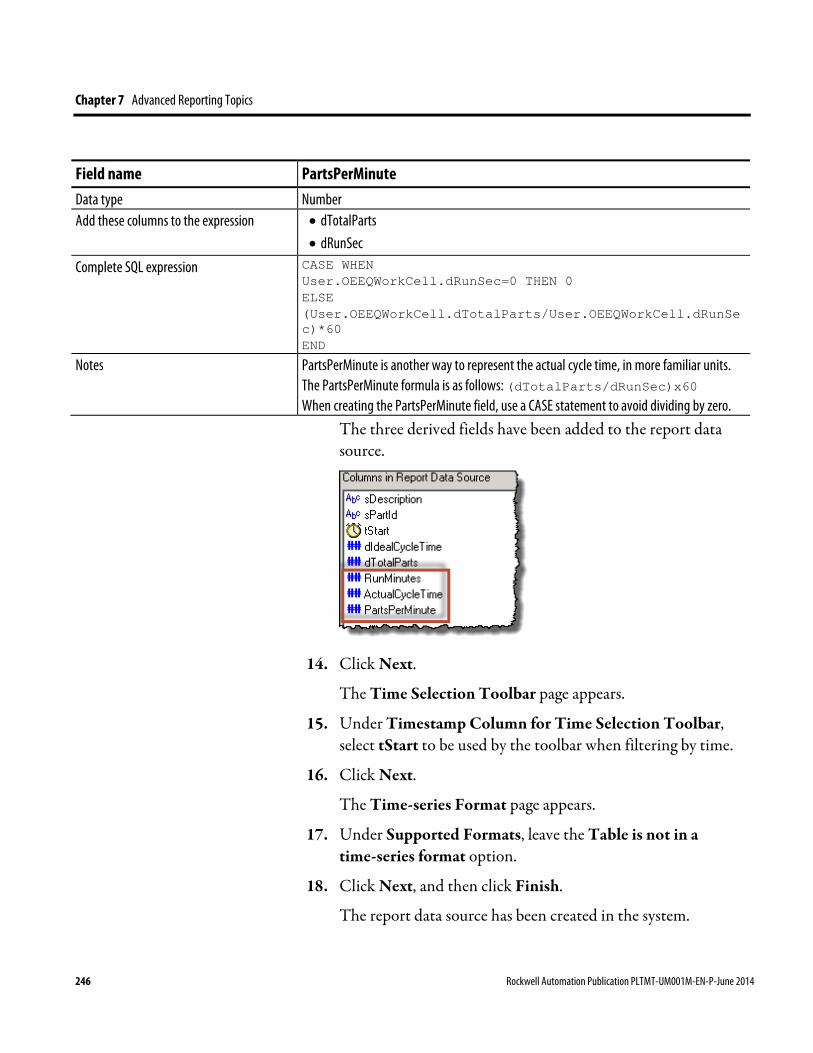
Chapter 7 Advanced Reporting Topics
Field name PartsPerMinute Data type Number Add these columns to the expression • dTotalParts
• dRunSec
Complete SQL expression CASE WHEN User.OEEQWorkCell.dRunSec=0 THEN 0 ELSE (User.OEEQWorkCell.dTotalParts/User.OEEQWorkCell.dRunSec)*60 END
Notes PartsPerMinute is another way to represent the actual cycle time, in more familiar units. The PartsPerMinute formula is as follows: (dTotalParts/dRunSec)x60 When creating the PartsPerMinute field, use a CASE statement to avoid dividing by zero.
The three derived fields have been added to the report data source.
14. Click Next.
The Time Selection Toolbar page appears.
15. Under Timestamp Column for Time Selection Toolbar, select tStart to be used by the toolbar when filtering by time.
16. Click Next.
The Time-series Format page appears.
17. Under Supported Formats, leave the Table is not in a time-series format option.
18. Click Next, and then click Finish.
The report data source has been created in the system.
246 Rockwell Automation Publication PLTMT-UM001M-EN-P-June 2014
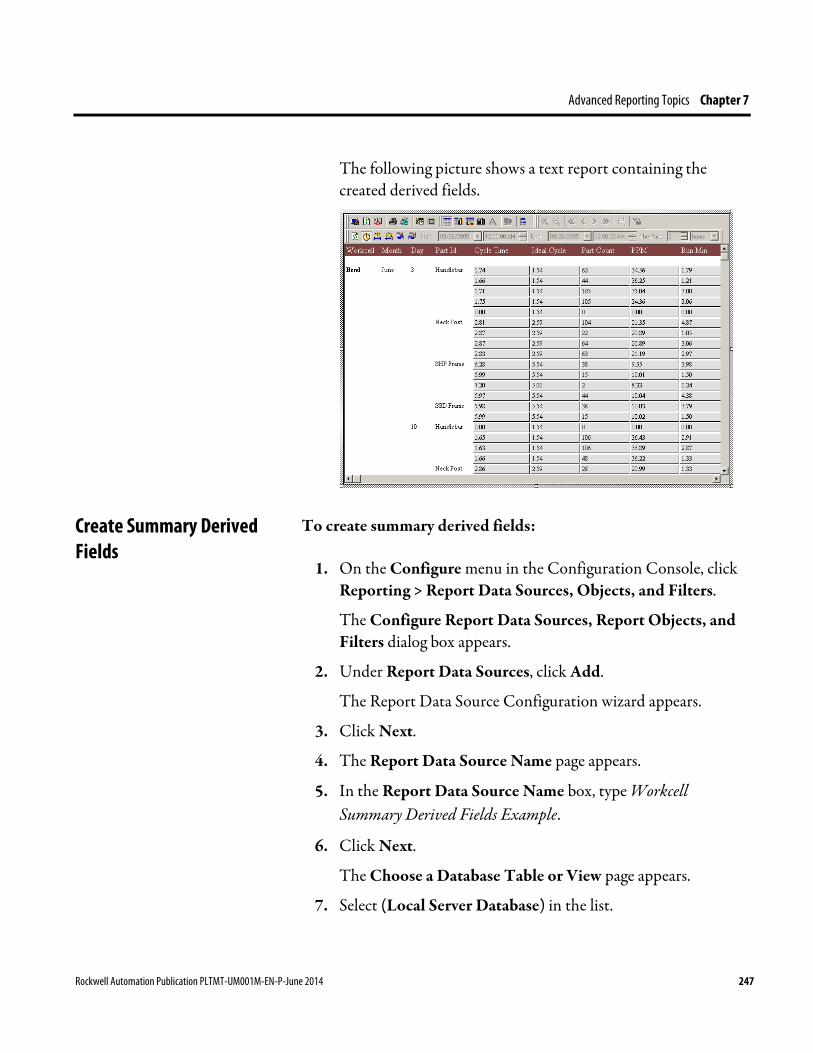
Advanced Reporting Topics Chapter 7
The following picture shows a text report containing the created derived fields.
To create summary derived fields:
1. On the Configure menu in the Configuration Console, click Reporting > Report Data Sources, Objects, and Filters.
The Configure Report Data Sources, Report Objects, and Filters dialog box appears.
2. Under Report Data Sources, click Add.
The Report Data Source Configuration wizard appears.
3. Click Next.
4. The Report Data Source Name page appears.
5. In the Report Data Source Name box, type Workcell Summary Derived Fields Example.
6. Click Next.
The Choose a Database Table or View page appears.
7. Select (Local Server Database) in the list.
Create Summary Derived Fields
Rockwell Automation Publication PLTMT-UM001M-EN-P-June 2014 247
Chapter 7 Advanced Reporting Topics
8. Clear the Show Tables check box to display only the database views.
9. Select the OEEQWorkcell view.
The selected database view is the view used by the standard FactoryTalk Metrics Workcell History report data source.
10. Click Next.
The Column Selection page appears.
11. Click Derived Field, and then click Add Derived Field.
The Add Derived Field dialog box appears.
12. Create a derived field called ActualCycleTimeTotals:
1. Under Field Name, type ActualCycleTimeTotals.
2. Under Data Type, leave Number.
3. Under SQL Expression..., type the following expression: CASE WHEN SUM(User.OEEQWorkCell.dTotalParts)=0 THEN 0 ELSE SUM(User.OEEQWorkCell.dRunSec)/SUM(User.OEEQWorkCell.dTotalParts) END
4. Click Validate to check for errors.
5. If there are no errors, the Validate button becomes inactive.
6. Click Add.
The Column Selection page appears.
The derived field is displayed under Columns in Report Data Source.
248 Rockwell Automation Publication PLTMT-UM001M-EN-P-June 2014
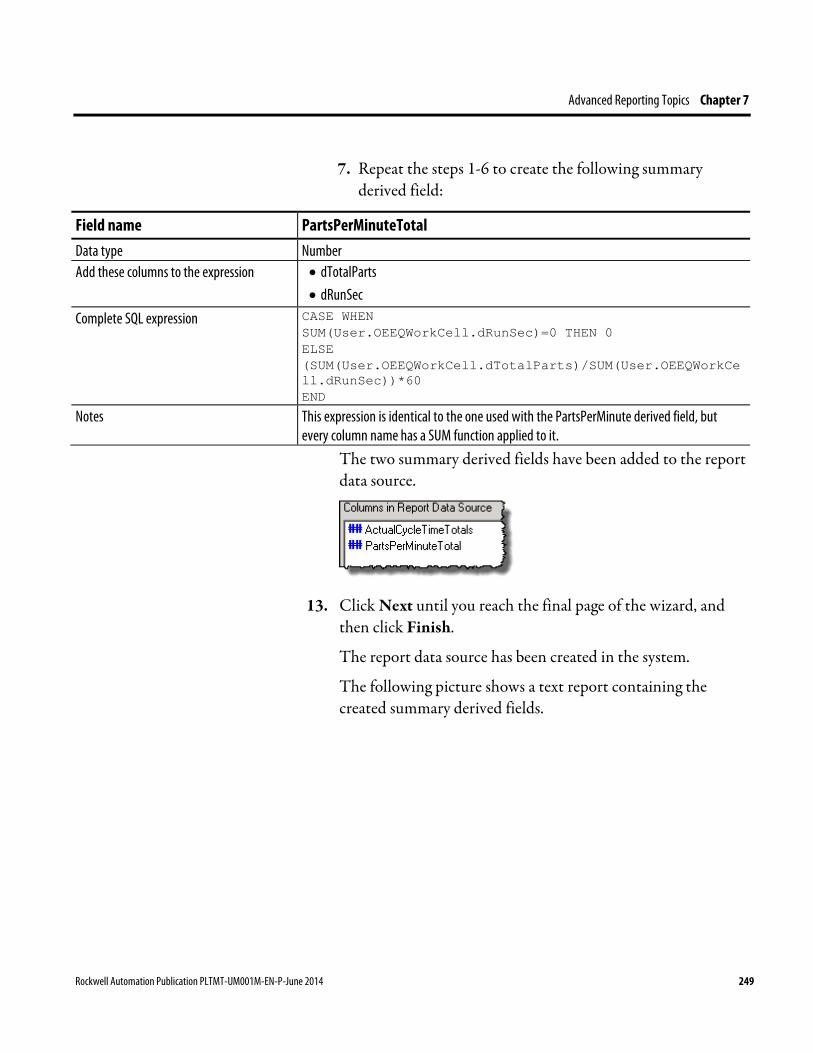
Advanced Reporting Topics Chapter 7
7. Repeat the steps 1-6 to create the following summary derived field:
Field name PartsPerMinuteTotal Data type Number Add these columns to the expression • dTotalParts
• dRunSec
Complete SQL expression CASE WHEN SUM(User.OEEQWorkCell.dRunSec)=0 THEN 0 ELSE (SUM(User.OEEQWorkCell.dTotalParts)/SUM(User.OEEQWorkCell.dRunSec))*60 END
Notes This expression is identical to the one used with the PartsPerMinute derived field, but every column name has a SUM function applied to it.
The two summary derived fields have been added to the report data source.
13. Click Next until you reach the final page of the wizard, and
then click Finish.
The report data source has been created in the system.
The following picture shows a text report containing the created summary derived fields.
Rockwell Automation Publication PLTMT-UM001M-EN-P-June 2014 249
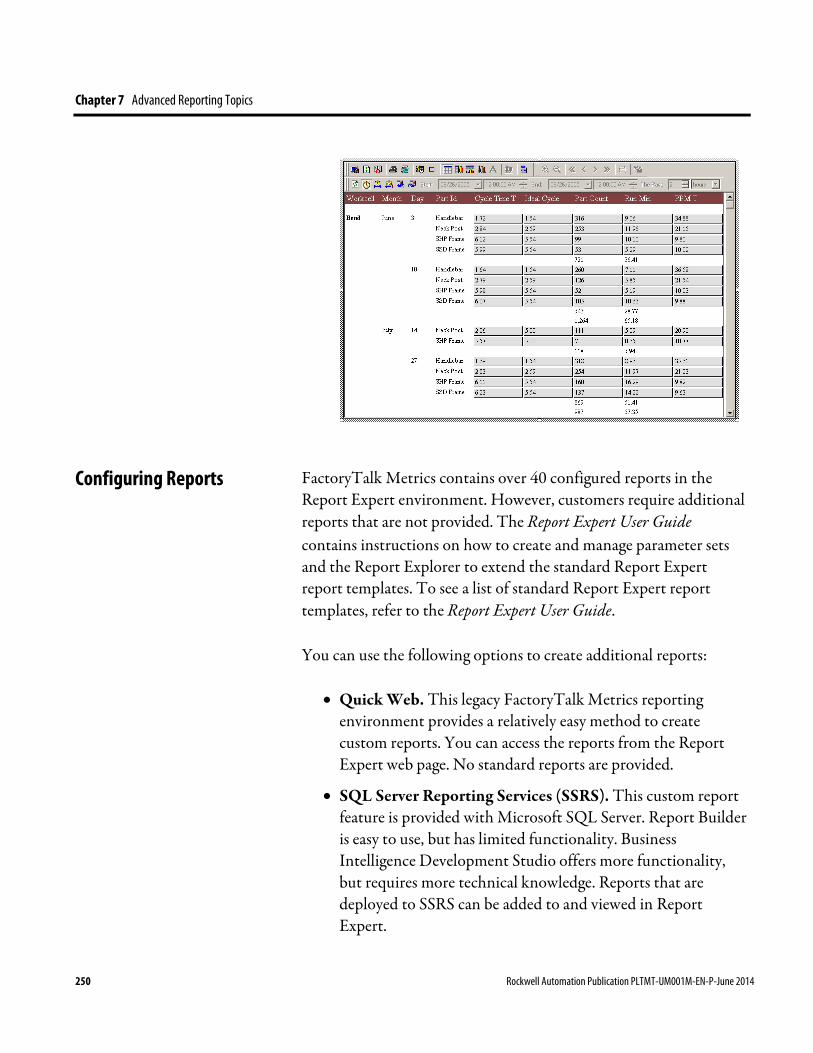
Chapter 7 Advanced Reporting Topics
FactoryTalk Metrics contains over 40 configured reports in the Report Expert environment. However, customers require additional reports that are not provided. The Report Expert User Guide contains instructions on how to create and manage parameter sets and the Report Explorer to extend the standard Report Expert report templates. To see a list of standard Report Expert report templates, refer to the Report Expert User Guide.
You can use the following options to create additional reports:
• Quick Web. This legacy FactoryTalk Metrics reporting environment provides a relatively easy method to create custom reports. You can access the reports from the Report Expert web page. No standard reports are provided.
• SQL Server Reporting Services (SSRS). This custom report feature is provided with Microsoft SQL Server. Report Builder is easy to use, but has limited functionality. Business Intelligence Development Studio offers more functionality, but requires more technical knowledge. Reports that are deployed to SSRS can be added to and viewed in Report Expert.
Configuring Reports
250 Rockwell Automation Publication PLTMT-UM001M-EN-P-June 2014

Advanced Reporting Topics Chapter 7
• Third-Party Reporting Tools. You can use third-party reporting tools to report on data in the FactoryTalk Metrics database.
Rockwell Automation Publication PLTMT-UM001M-EN-P-June 2014 251

Chapter 7 Advanced Reporting Topics
252 Rockwell Automation Publication PLTMT-UM001M-EN-P-June 2014
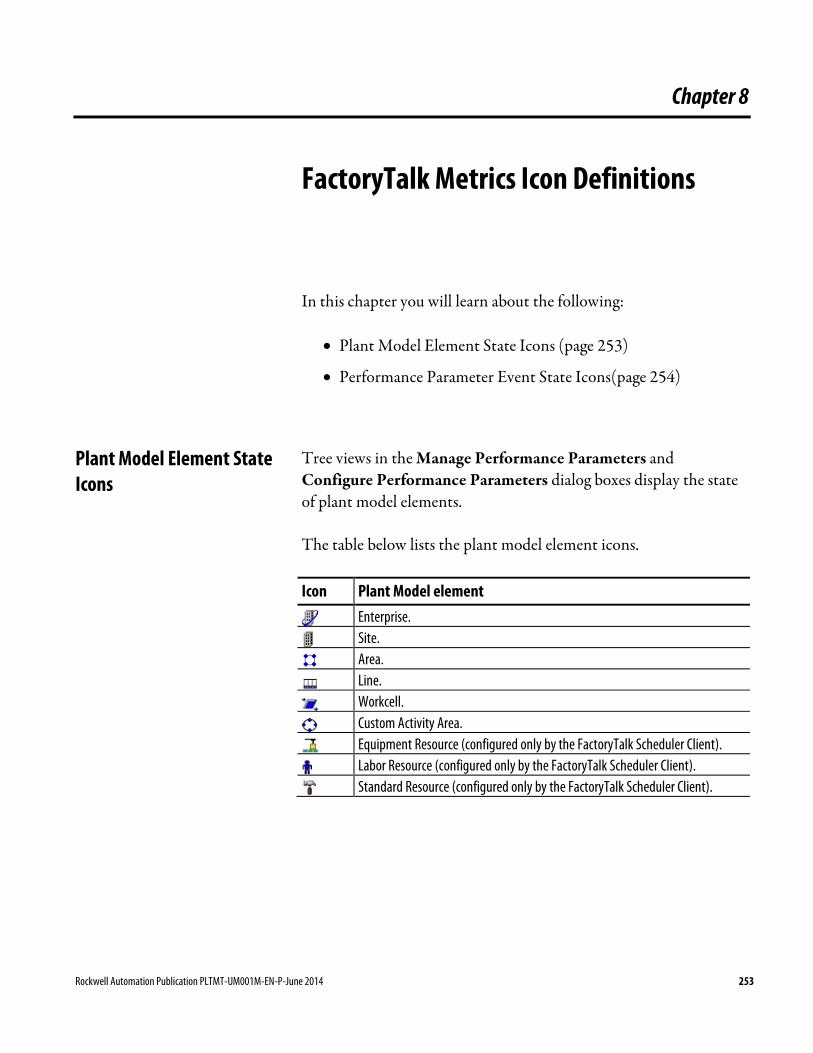
Chapter 8
FactoryTalk Metrics Icon Definitions
In this chapter you will learn about the following:
• Plant Model Element State Icons (page 253)
• Performance Parameter Event State Icons(page 254)
Tree views in the Manage Performance Parameters and Configure Performance Parameters dialog boxes display the state of plant model elements.
The table below lists the plant model element icons.
Icon Plant Model element
Enterprise.
Site.
Area.
Line.
Workcell.
Custom Activity Area.
Equipment Resource (configured only by the FactoryTalk Scheduler Client).
Labor Resource (configured only by the FactoryTalk Scheduler Client).
Standard Resource (configured only by the FactoryTalk Scheduler Client).
Plant Model Element State Icons
Rockwell Automation Publication PLTMT-UM001M-EN-P-June 2014 253
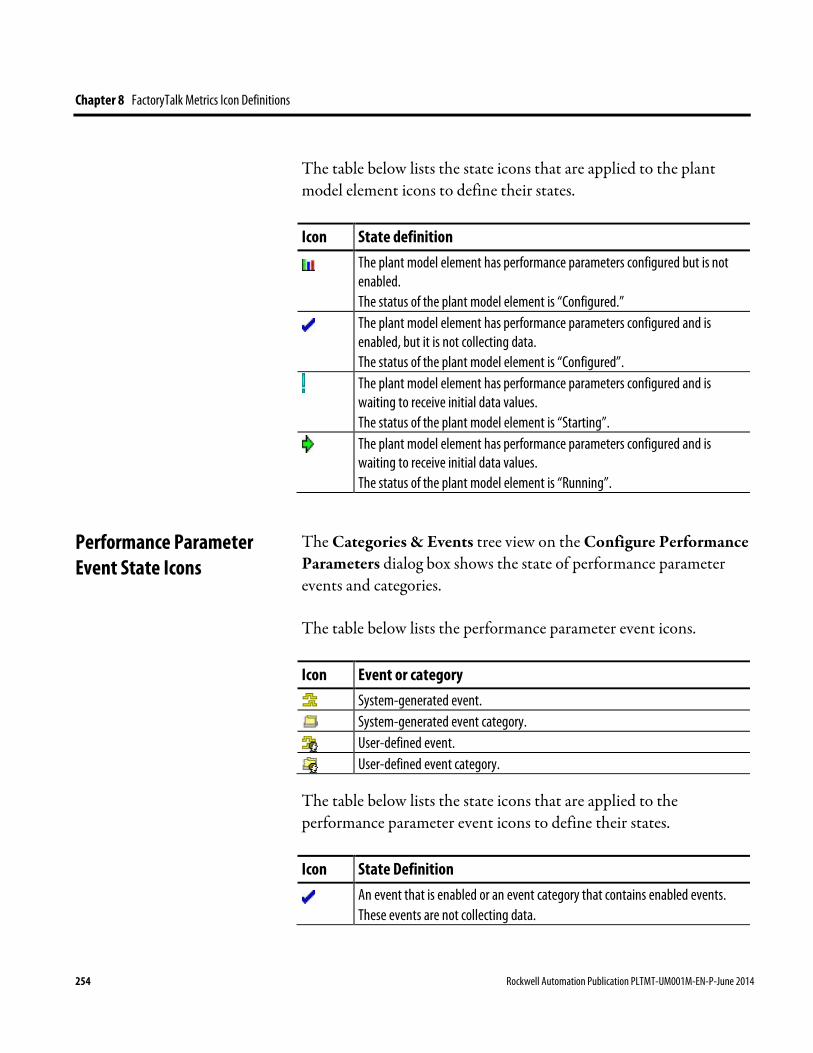
Chapter 8 FactoryTalk Metrics Icon Definitions
The table below lists the state icons that are applied to the plant model element icons to define their states.
Icon State definition
The plant model element has performance parameters configured but is not enabled. The status of the plant model element is “Configured.”
The plant model element has performance parameters configured and is enabled, but it is not collecting data. The status of the plant model element is “Configured”.
The plant model element has performance parameters configured and is waiting to receive initial data values. The status of the plant model element is “Starting”.
The plant model element has performance parameters configured and is waiting to receive initial data values. The status of the plant model element is “Running”.
The Categories & Events tree view on the Configure Performance Parameters dialog box shows the state of performance parameter events and categories.
The table below lists the performance parameter event icons.
Icon Event or category
System-generated event.
System-generated event category.
User-defined event.
User-defined event category.
The table below lists the state icons that are applied to the performance parameter event icons to define their states.
Icon State Definition
An event that is enabled or an event category that contains enabled events. These events are not collecting data.
Performance Parameter Event State Icons
254 Rockwell Automation Publication PLTMT-UM001M-EN-P-June 2014
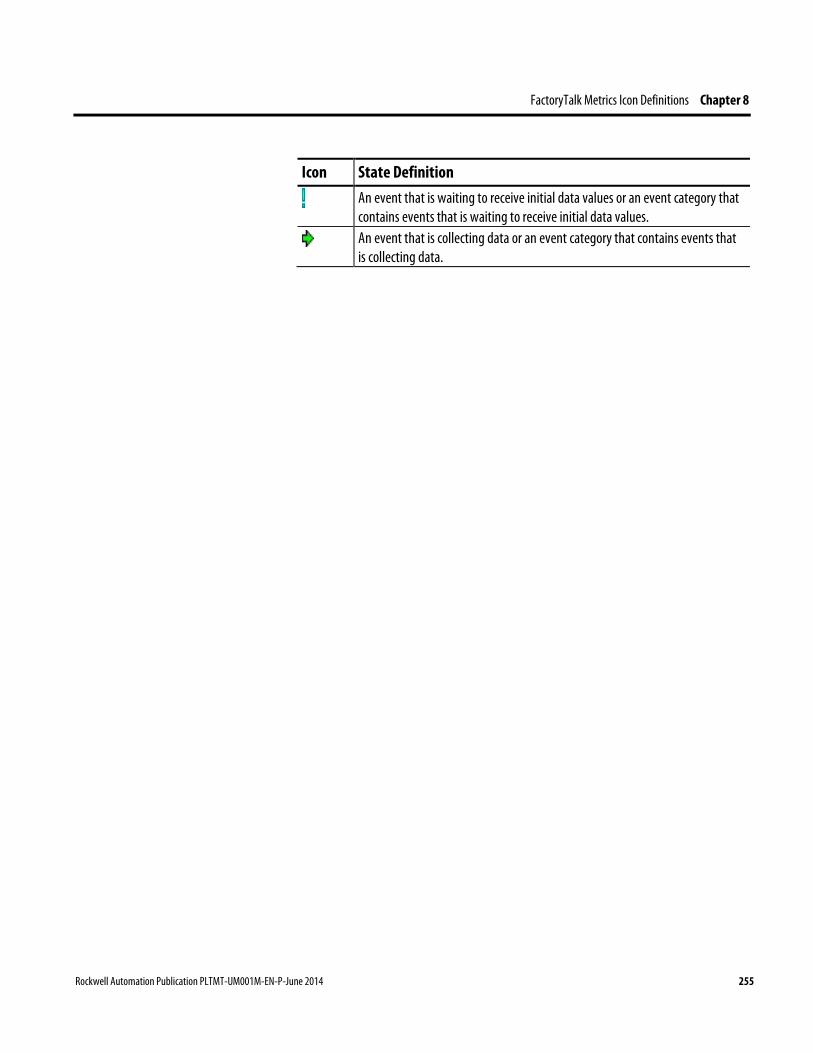
FactoryTalk Metrics Icon Definitions Chapter 8
Icon State Definition
An event that is waiting to receive initial data values or an event category that contains events that is waiting to receive initial data values.
An event that is collecting data or an event category that contains events that is collecting data.
Rockwell Automation Publication PLTMT-UM001M-EN-P-June 2014 255

Chapter 8 FactoryTalk Metrics Icon Definitions
256 Rockwell Automation Publication PLTMT-UM001M-EN-P-June 2014
Chapter 9
Object Permissions
An object permission is a privilege that is granted to security groups or individual users that allows access to a specific object within the client application. An example of an object permission for which users and groups can be given privileges is the ability to edit a particular report object. For example, if a user is granted the Edit Report Object permission for the report object called Test Report Object, then they will be able to make and save changes to that report object.
Individual users can have object permissions granted to them, and they can inherit object permissions from the security groups to which they belong. For example, if a group has been granted the Edit Report Object permission for the Test Report Object, users assigned to that group are also able to edit the report object.
Object permissions are granted through the Configuration Console. For more information, refer to the Configuration Console online help.
You may also set the baseline permissions that will be given to a certain group or user for every instance of an object type that is created in the Configuration Console. For example, if you want a user to have permission to edit every report object that is ever created in the client application, you need to set the Edit Report Object default security permission on the Report Object type for the particular use . After you have assigned default permissions to a type of object, the creator of a new object of that type may choose to revoke an individual user’s permissions to his newly created object.
NOTE Revoking permissions is performed in the Configuration Console. For more information, refer to the Configuration Console online help.
Rockwell Automation Publication PLTMT-UM001M-EN-P-June 2014 257
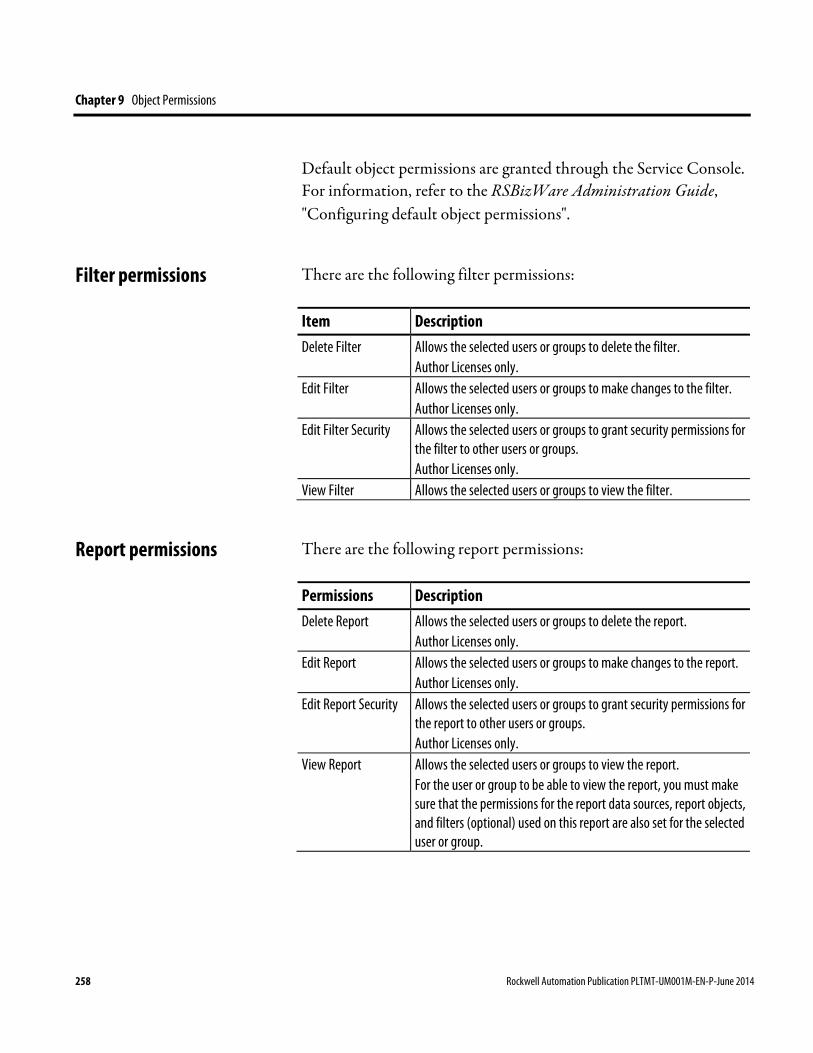
Chapter 9 Object Permissions
Default object permissions are granted through the Service Console. For information, refer to the RSBizWare Administration Guide, "Configuring default object permissions".
There are the following filter permissions:
Item Description Delete Filter Allows the selected users or groups to delete the filter.
Author Licenses only. Edit Filter Allows the selected users or groups to make changes to the filter.
Author Licenses only. Edit Filter Security Allows the selected users or groups to grant security permissions for
the filter to other users or groups. Author Licenses only.
View Filter Allows the selected users or groups to view the filter.
There are the following report permissions:
Permissions Description Delete Report Allows the selected users or groups to delete the report.
Author Licenses only. Edit Report Allows the selected users or groups to make changes to the report.
Author Licenses only. Edit Report Security Allows the selected users or groups to grant security permissions for
the report to other users or groups. Author Licenses only.
View Report Allows the selected users or groups to view the report. For the user or group to be able to view the report, you must make sure that the permissions for the report data sources, report objects, and filters (optional) used on this report are also set for the selected user or group.
Filter permissions
Report permissions
258 Rockwell Automation Publication PLTMT-UM001M-EN-P-June 2014
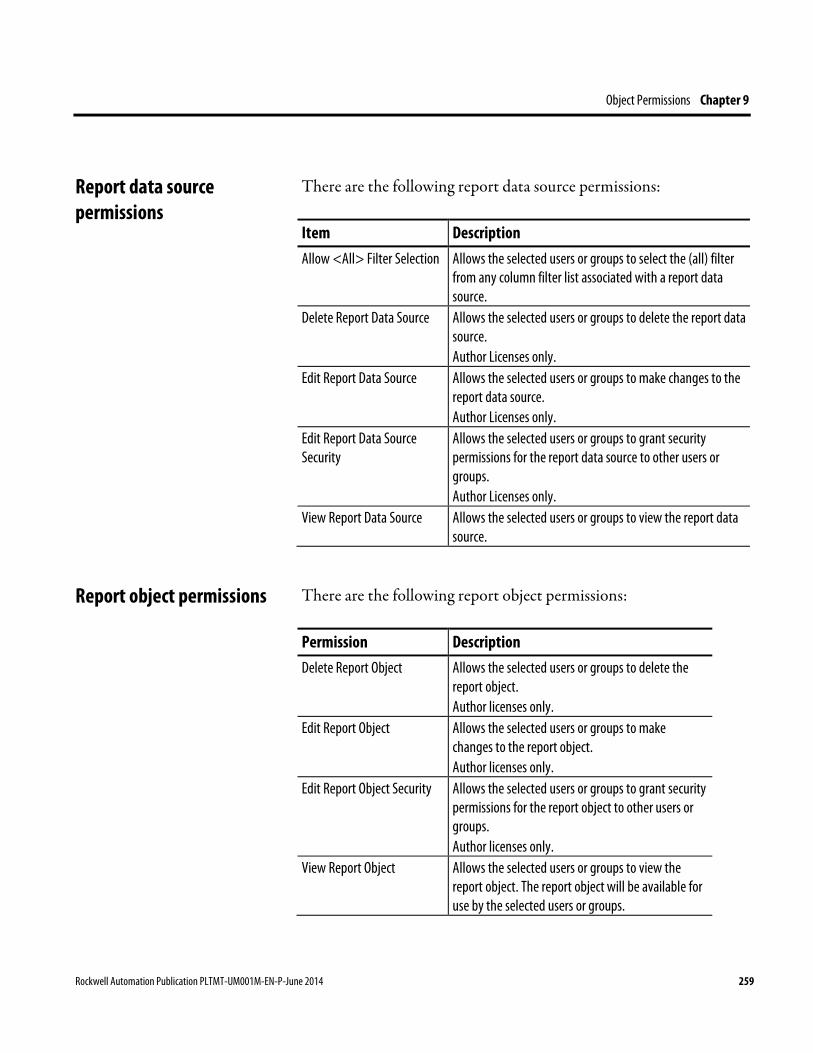
Object Permissions Chapter 9
There are the following report data source permissions:
Item Description Allow <All> Filter Selection Allows the selected users or groups to select the (all) filter
from any column filter list associated with a report data source.
Delete Report Data Source Allows the selected users or groups to delete the report data source. Author Licenses only.
Edit Report Data Source Allows the selected users or groups to make changes to the report data source. Author Licenses only.
Edit Report Data Source Security
Allows the selected users or groups to grant security permissions for the report data source to other users or groups. Author Licenses only.
View Report Data Source Allows the selected users or groups to view the report data source.
There are the following report object permissions:
Permission Description Delete Report Object Allows the selected users or groups to delete the
report object. Author licenses only.
Edit Report Object Allows the selected users or groups to make changes to the report object. Author licenses only.
Edit Report Object Security Allows the selected users or groups to grant security permissions for the report object to other users or groups. Author licenses only.
View Report Object Allows the selected users or groups to view the report object. The report object will be available for use by the selected users or groups.
Report data source permissions
Report object permissions
Rockwell Automation Publication PLTMT-UM001M-EN-P-June 2014 259

Chapter 9 Object Permissions
260 Rockwell Automation Publication PLTMT-UM001M-EN-P-June 2014

Appendix A
Report Data Sources
FactoryTalk Metrics exposes the following important report data sources from which report designers can create charts and tables:
• Workcell history (page 261).
• Event history (page 263).
• Machine state data (page 264).
In order to create charts and tables effectively, you need to understand first the types of data included in these report data sources.
The FactoryTalk Metrics Workcell History report data source is based on the OEEQWorkcell view in the RSBizWare database. This report data source contains the historical performance data for activity areas, including OEE performance and the data that is used to calculate OEE performance. Each record contains summarized information for a single enabled activity area collected within a specified period of time. Each record includes:
• The start and end times for the record.
• The number of parts built (good parts, scrap parts, and total parts).
• The amount of time the activity area was available, scheduled available, and running.
• The number of the part being built and the ideal cycle time for that part number.
• The number of parts that could have been built under ideal conditions.
Workcell History
Rockwell Automation Publication PLTMT-UM001M-EN-P-June 2014 261
Appendix A Report Data Sources
• Shift information.
• The OEE calculation for that period of time.
• The value for each configured user-defined summarization criterion.
Records will be created as long as FactoryTalk Metrics is collecting data—24 hours a day, 7 days a week, whether the monitored equipment is running or not. The Performance Data Trending Rate interval selected for an activity area specifies the duration of the Workcell History record. The current record is updated every 10 seconds with new performance information. When the Performance Data Trending Rate interval has passed, the current record is closed and a new record is created. The current Workcell History record will also be closed and a new one will be created if any of the following occurs:
• The scheduled shift changes.
• The Scheduled Availability status for the activity area changes.
• The number of the part that the activity area is building changes.
• The value of a configured user-defined summarization criterion changes.
• The ideal cycle time changes.
• Data collection stops (a new record is not created).
Since there is one record in the database for each activity area for each Performance Data Trending Rate interval, it is not possible to report on periods of time less than the specified rate. For example, if the Performance Data Trending Rate for the activity area is set to 10 minutes and you try to report on Workcell History data between 12:00 and 12:05, you will get data between 12:00 and 12:10.
262 Rockwell Automation Publication PLTMT-UM001M-EN-P-June 2014
Report Data Sources Appendix A
The Event History report data source is based on the OEEQEvent view in the RSBizWare database. This report data source contains the historical data of individual events that have occurred at the activity areas that are being monitored by FactoryTalk Metrics. An Event History record is created when an event occurs, and is closed when that event ends. FactoryTalk Metrics uses Event History records to compute the performance information that is stored in the FactoryTalk Metrics Workcell History report data source. Each record may include:
• Activity area information.
• Shift information.
• The number of the part being built.
• Start and end times for the record, along with duration of the record.
• Event description and event folder information.
• Start and/or end values collected along with the event. (This may include the difference between start and end values. If the event value has a lookup list, the appropriate text from the list will be stored in the record.).
• Whether the event is user-defined or system-defined.
• A fault indicator, which indicates the first record of a new event. This is useful if multiple records are created for a single event.
• Severity level.
• The value for each configured user-defined summarization criterion.
All Event History records are subject to event data summarization, which is a process in which a single event can be split into multiple Event History records according to various summarization criteria. Event data summarization preserves the ability to generate event
Event History
Rockwell Automation Publication PLTMT-UM001M-EN-P-June 2014 263
Appendix A Report Data Sources
reports by shift or by part number. System-generated events are summarized (the current Event History record is closed and a new record is created in the database) based on the event data summarization type that is specified.
Unlike Workcell History records, Event History records are not created on a regular, predictable basis and can span any amount of time. An Event History record is created when an event occurs and is closed when that event ends, which in some cases may be hours later. Even though the time span of an Event History record can be quite long, its contents are updated every 10 seconds. Because Event records can have very different time spans, reporting on Event records can bring some unexpected results. Remember that reports always include entire records, and cannot be run on portions of records. You can mitigate this effect by ensuring that user-defined events have similar data summarization types. Refer to the Configuration Console online help for detailed information on events and event data summarization types.
NOTE In FactoryTalk Metrics you can disable event data summarization for a user-defined event. Use this features with caution though, because it could result in creating event records that are difficult to report on.
The FactoryTalk Metrics Machine State Data report data source is based on the OEEQStateData view in the RSBizWare database. This report data source contains historical machine state data. Each record contains the following summarized information for a single occurrence of a machine state for a configured workcell:
• Activity area information.
• Machine state ID and description.
• Start and end times for the record, along with duration of the record.
Machine State Data
264 Rockwell Automation Publication PLTMT-UM001M-EN-P-June 2014
Report Data Sources Appendix A
• Shift information.
• The number of the part being built and the ideal cycle time for that part number.
• The number of parts built (good parts, scrap parts, and total parts).
• The value for each configured user-defined summarization criterion.
Rockwell Automation Publication PLTMT-UM001M-EN-P-June 2014 265

Appendix A Report Data Sources
266 Rockwell Automation Publication PLTMT-UM001M-EN-P-June 2014
Index
A Add a Saved Report Object to the Report 177 Adjust the Time Range For a Time-based Report Object 180 Advanced Functions 109 Advanced Properties 115 Advanced Reporting Topics 223 Aggregate 220 Aggregate, Group, Format, Sort, Chart, and Rename Columns 218 Analyzing FactoryTalk Metrics Data 171 Analyzing Non-RSBizWare Data 235 Automated Configuration 139 Availability 63 Availability Interpretation Options 117
C Changing Chart Component Properties 216 Chart 221 Collecting Part Count Data When the Metrics Server Manager Is Stopped 25 Collecting Performance Data 25 Composites and Schedule Exceptions 38 Configuration Flow 154 Configuration Types 154 Configure Reports 258 Configure the Report Object To Use Global Credentials 182 Configuring a Formula 60 Configuring a Part ID/Cycle Time Lookup List 47 Configuring Activity Area Schedules 29 Configuring Composites and Schedule Exceptions 39 Configuring Cycle Time 44 Configuring Data Collection 44 Configuring FactoryTalk Metrics to Perform Downtime Tracking 126
Configuring Ideal Cycle Time Values for Individual Part Ids 48 Configuring Machine States 123 Configuring Monitored Availability 73 Configuring OEE Performance Parameters For Activity Areas 41 Configuring Part Count 55 Configuring Part Count Using a FTTM Expression On a Scheduled Basis 59 Configuring Part Count Using an Unscheduled Data Point 58 Configuring Part Count Using an Unscheduled Data Point and a FTTM Expression 58 Configuring Part Id 50 Configuring RSLinx Enterprise 144 Configuring Running State 78 Configuring Scheduled Availability 65 Configuring Summarization Criteria 52 Configuring the Default Cycle Time for Total Parts 48 Configuring the Event Data Summary 90 Configuring the Event Trigger 93 Configuring the Event Value 99 Configuring the Machine State / Faults 111 Configuring the Plant Model 21 Configuring the Reporting 113 Configuring Time Patterns 30 Configuring User-defined Performance Parameter Events 90 Configuring Work Day Time Patterns 34 Configuring Work Week Time Patterns 36 Connecting to the Information Services Manager 17 Contact Us 13 Create a FactoryTalk Metrics Detail Chart 207 Create a New Chart 185 Create a New RSBizWare Report 171 Create a New Text Report Object 193 Create an External Data Source 236 Create an OEE Box Chart 200
Rockwell Automation Publication PLTMT-UM001M-EN-P-June 2014 267

Index
Create Detailed Derived Fields 242 Create Summary Derived Fields 246 Creating Event Value Reason Code Lookup Lists 109 Creating FactoryTalk Transaction Manager and FactoryTalk Metrics Configurations 154 Creating Shift Description Lookup Lists 71 Creating Tags Based on the FactoryTalk Metrics UDT 150 Customizing Charts 213 Customizing RSBizWare Charts and Tables 213 Customizing Text Report Objects 216
D Data Point Functions 106 Deleting a Component 215 Determining Availability and Running State From Machine State 125 Documentation Feedback 270
E Editing the Chart Title or Text Field 215 Event Data Summarization Types 92 Event History 261 Event Lookup Value CSV Format 72 Event Trigger Types 96 Event Trigger Types for Manual Events 99 Event Trigger Types for System-generated and User-defined Events 97 Event Trigger Types for System-generated Events 96 Event Value Types 101 Export the Report to HTML 210
F FactoryTalk Metrics Icon Definitions 251 FactoryTalk Metrics UDT 139
Fault Metrics Ratings 28 Features and Benefits 10 Filter permissions 256 Format 220 FTM UDT Configuration Items 161
G Generating Performance Parameter Events 81 Get Consulting Services 13 Get Phone Support 13 Get Web Support 12 Getting Started 15 Getting Started with the Configuration Console 19 Group 220 Guidelines for Modifying Imported Performance Parameters 168
I Importing Cycle Time Values for Individual Part Ids 49 Importing Sample Data to the RSBizWare Database 16 Importing the FactoryTalk Metrics UDT to the ControlLogix Controller 148 Insert Text, Pictures, and Hyperlinks 172 Installation Assistance 270 Intended Audience 10
L Load the Report From File 211 Loading Sample Activity Areas 23 Logical and Mathematical Operations 104
M Machine State 130
268 Rockwell Automation Publication PLTMT-UM001M-EN-P-June 2014
Index
Machine State Data 262 Machine States 118 Machine States at the Sample Enterprise 119 Managing Part Id Configurations 49 Manual Data Collection 134 Manual Events 87 Mapping Machine States to User-defined Events 125 Mean Time Between Failure 28 Mean Time To Repair 29 Move the Report and Set Report Permissions 175 Moving a Component 215
N New Product Satisfaction Return 270
O Object Permissions 255 OEE Rating 27
P PackML UDT Configuration Items 160 Performance Data Trending Rate 118 Performance Parameter Event State Icons 252 Plant Model Element State Icons 251 Prioritizing Machine States 121
Q Quick Filter 221
R Rename 221 Report data source permissions 257 Report Data Sources 236, 259
Report object permissions 257 Report permissions 256 Resize Table Columns 218 Resizing a Component 215 Reviewing the Status of Performance Parameters Events 131 Rockwell Automation Support 270 Running Versus Downtime 127
S Save the Report 174 Schedule a Report 231 Schedule a Report Object 227 Scheduled Part Count Collection Parameters 115 Scheduling Report Objects and Reports 227 Setting up Communication Between a ControlLogix Controller and FactoryTalk Metrics 143 Show and Hide Columns 217 Sort 221 Start Data Collection 133 Step 1
Add a Chart to the Report 200 Plan the Chart 186 Start the Report Data Source Wizard 236 Start the Text Report Object Wizard 193
Step 1. Select the Configuration Type and Load Workcell Data 155 Step 2
Select an Activity Area 201 Select the Data On Which To Report 186, 194
Step 2. Define a FactoryTalk Transaction Manager Configuration 157 Step 3
Choose a Chart Type 186 Group the Records 195 Specify the Layout of the Chart 201
Rockwell Automation Publication PLTMT-UM001M-EN-P-June 2014 269
Index
Step 3. Register the FactoryTalk Transaction Manager Configuration for Data Collection 162 Step 4
Create a Filter 203 Describe the Data 187 Sort the Records 195
Step 4. Import Lookup Lists and Machine States 164 Step 5
Customize the OEE Bar Colors 205 Format the Table 196 Select Summary or Detail 188
Step 5. Define a FactoryTalk Metrics Configuration 166 Step 6
Name the Report Object 198 Preview Your OEE Box Chart 206 Select the Fields To Be Charted 188
Step 7 Enter the Chart Title 189 Filter the Data 199
Step 8 Filter the Data 190 Insert Your New Table Into the Report 199
Step 9 Insert Your New Chart Into the Report 192
Stop Data Collection 134 System-generated Event Data Summarization 116 System-generated Events 83
T The Excel Add-in 223
The Plant Model 20 The Recycle Bin 89 The RSBizWare Architecture 15 Time Format and Processing Functions 105 Time Patterns 29
U UDT Tags and FactoryTalk Metrics Performance Parameters 140 User-defined Downtime Events 129 User-defined Events 85 User-derived Fields 241 Using the Expression Editor 104 Using the Information Services Manager in Internet Explorer 17 Using the Information Services Manager in the Configuration Console 18
V View the History of the Scheduled Task 234 Viewing Performance Parameter Events for an Activity Area 81
W Welcome to FactoryTalk Metrics 9 What Is FactoryTalk Metrics? 9 Where Can I Go for Help? 12 Workcell History 259 Working With Chart 216 Working With the Component Parts of a Chart 214
270 Rockwell Automation Publication PLTMT-UM001M-EN-P-June 2014

Index
Rockwell Automation Publication PLTMT-UM001M-EN-P-June 2014 271
Rockwell Automation Support
Rockwell Automation provides technical information on the Web to assist you in using its products. At http://www.rockwellautomation.com/support/ you can find technical and application notes, sample code, and links to software service packs. You can also visit our Support Center at https://rockwellautomation.custhelp.com/ for software updates, support chats and forums, technical information, FAQs, and to sign up for product notification updates.
In addition, we offer multiple support programs for installation, configuration, and troubleshooting. For more information, contact your local distributor or Rockwell Automation representative, or visit http://www.rockwellautomation.com/services/online-phone.
Installation Assistance
If you experience a problem within the first 24 hours of installation, review the information that is contained in this manual. You can contact Customer Support for initial help in getting your product up and running.
United States or Canada 1.440.646.3434
Outside United States or Canada Use the Worldwide Locator at http://www.rockwellautomation.com/rockwellautomation/support/overview.page, or contact your local Rockwell Automation representative.
New Product Satisfaction Return
Rockwell Automation tests all of its products to help ensure that they are fully operational when shipped from the manufacturing facility. However, if your product is not functioning and needs to be returned, follow these procedures.
United States Contact your distributor. You must provide a Customer Support case number (call the phone number above to obtain one) to your distributor to complete the return process.
Outside United States Please contact your local Rockwell Automation representative for the return procedure.
Documentation Feedback
Your comments will help us serve your documentation needs better. If you have any suggestions on how to improve this document, complete this form, publication RA-DU002, available at http://www.rockwellautomation.com/literature/.
Rockwell Automation maintains current product environmental information on its website at http://www.rockwellautomation.com/rockwellautomation/about-us/sustainability-ethics/product-environmental-compliance.page.
Rockwell Automation Publication PLTMT-UM001M-EN-P-June 2014 Supersedes Publication PLTMT-UM001L-EN-P-June 2013 Copyright © 2014 Rockwell Automation Technologies, Inc. All Rights Reserved.