facts concerning dust and air - martin eng · 1. introduction dust has been an issue of concern and...
TRANSCRIPT

Facts Concerning Dust and Air
By: Daniel Marshall (Martin Engineering)
and Greg Boggio (Dynegy Midwest Generation)
Table of Contents
1. Introduction
2. Background
3. Theory
4. Correlating Data
5. Discussion
6. Conclusion
7. References
8. About The Authors
1. Introduction
Dust has been an issue of concern and research ever since bulk solids were first
transported by conveyor belt. Airborne dust travels in the air currents that are created by
the handling of bulk solids. Extensive research has been conducted to determine the
quantity of air created at a transfer point. The Industrial Ventilation Guide, the Dust
Control Handbook and Foundations all have slightly different methodologies developed
to predict the amount of air generated. While close, each of these approaches has certain
variations from the reality of an actual coal application. The use of actual measured
airflows is the most accurate way to size a dust control system. These airflows can be
minimized by mechanically altering the construction of the transfer point. A full
understanding of the airflows involved will allow a user to specify a dust collection
system large enough to be effective, but not so large as to waste capacity and capital.

2. Background
A great deal of research has been conducted on the effects of dust. This research has
concentrated on issues such as combustion, health impacts, environmental impacts, safety
impacts and maintenance aspects. All research has illustrated how dust is undesirable and
often dangerous.
Though much research has been conducted on the effects of dust, the elusive and difficult
behavior of dust has prevented as much research into the origin of said dust in a transfer
point setting. A transfer point is defined as the point where one belt conveyor dumps
material onto another.
Any time material is moved it may be fractured mechanically. This fracturing creates
pieces of the material that are much smaller than the original pieces. Once these small
particles become airborne, they become airborne dust. Experience has shown that,
generally, if this dust had a diameter greater than 500 microns, the particle will fall fairly
quickly and reenter the material stream. If the particle is smaller in diameter than 500
microns, that particle will remain airborne.
Once this particle remains airborne, the question of where it travels becomes critical.
Logic would dictate that the particle will be influenced by and follow the currents of
moving air in the environment. The greater the airflow, the farther the dust particles will
be dispersed.
Given this knowledge, it becomes vitally important to understand the nature of the
airflows and velocities within a transfer point to predict the behavior of the dust created.
Several methods are used in industry to compute airflows in a transfer point. These
methods include the method described in the Industrial Ventilation Manual, the technique
described in the Dust Control Handbook, and the approach described in the Martin
Engineering Foundations book.
This paper will attempt to find a correlation between these methods and the reality of an
application.

3. Theory
There are several methods used in industry to calculate airflows. All calculation methods
use similar inputs to determine the air generated in a transfer point.
A basic transfer point is broken into several geometric sections.
A. Entry Area
B. Head Pulley Drop-off
C. Free-fall Region
D. Impact Region
E. Settling Zone
F. Exit Area
These zones are shown below in Figure 1.
Figure 1 -- Basic Regions of a Conveyor Transfer
Generally, the air enters at the entry area (A) and exits at the exit area (F). Air will move
through the transfer point, while the direction and speed will change. This basic trend is
greatly influenced by the fact that the material conveyed also moves from A to F. The
material itself will pull the air through the transfer point due to the “no-slip” condition
between the air and the material. This condition means that where the air is touching the
material, the air velocity will be identical to the velocity of the material. The viscosity of
the air will force the rest of the air body to move in that direction, as well.
The mechanical event of impact between material and belt occurs at the Impact Region
(D), which produces a localized airflow generation. This air will travel through the
transfer point enclosure toward the exit (F). Since dust travels with air, it becomes vitally
important to quantify this airflow.

Industrial Ventilation Manual Methodology
The Industrial Ventilation Manual states that air is created at a rate proportional to the
belt width of the conveyor belt. There is an additional airflow added if the drop height is
greater than 3'. This additional air is also dependent on the belt width. The equations for
this methodology are shown below.
Exhaust Air (cubic feet per minute CFM)
Exhaust Air (1)
Inputs
Belt Width (ft.) = BW
Additional Air Generated from Drop =
If material drop is less than 3', = 0
If material drop is more than 3' and BW is < 3, = 700
If material drop is more than 3' and BW is > 3, = 1000
Dust Control Handbook Methodology
The Dust Control Handbook states that air is created at a rate equal to the amount of air
induced. Induced air is the quantification of all the air that the material stream pulls into
itself as it travels through the transfer point. As the material is traveling on the loading
belt, it remains in the same shape. As it passes over the head pulley drop off (Region B
in Figure 1), it begins to separate. As the material falls in the free-fall region (Region C
in Figure 1), it continues to spread and creates small pockets of vacuum between the
material particles. Nature abhors a vacuum, so the stream will fill these small voids with
any air it can. This phenomenon is illustrated below in figure 2.

Figure 2 Illustration of Induced Air
This figure shows that for every second the material is in free-fall, it is pulling more and
more air into itself. This pulled air (Qp) is drawn from the easiest place that it can come
from, usually the entry area (Region A in Figure 1). When the stream contacts the
receiving belt at the impact zone (Region D in Figure 1), all the air that the material
stream has accumulated is instantly expelled.
The equation used to quantify the induced air is shown below.
Induced Air (cubic feet per minute CFM)
Induced air (2)

Inputs
Open area that air can enter system (cubic feet) = Au
Material Load (tons per hour TPH) = R
Height of material free-fall (feet) = S
Average material diameter (ft) = D
Conversion Factor (10) = k
Foundations Methodology
The Foundations book employs a method that begins with the induced air from the Dust
Control Handbook methodology and adds additional factors for displaced air and
generated air.
The displaced air (Qdis) is the volume of the material stream over time. This value is
calculated in cubic feet per minute, as that is the industry standard. Displaced air is
shown below in figure 3.

Figure 3 Illustration of Displaced Air
The equation for displaced air is as follows.
Displaced Air (cubic feet per minute CFM)
Displaced air
(3)
Inputs
Material Load (tons per hour TPH) = L
Material Bulk Density (pounds per cubic feet) = ρ
Conversion Factor (33.3) = k
There may be another device that is generating air. This is usually in the form of a
crusher, a foam dust suppression system or some type of mill. The actual airflows for
these items can typically be supplied by the manufacturer, measured or calculated. A dust
collection system can also impact the amount of air in a transfer point, but it will subtract
from the flow, as it is pulling air. These external airflows are designated as Qgen, or the
air generated by other means.
The air flow that is created or introduced by a transfer point is called the Total Air (Qtot).
It is the sum of the displaced air, the induced air and the generated air. This will be the
driving factor in the speed of the air through the settling zone (Region E in Figure 1), and
this is the air that exits the transfer point at the exit zone (Region F in Figure 1). This is
the air that carries dust, so this is the air that must be minimized with engineering
controls.
The equation for total air is shown as follows.
Total Air (cubic feet per minute CFM)
Total air (4)
Inputs
Induced Air (CFM) = Qind
Displaced Air (CFM) = Qdis
Generated Air (CFM) = Qgen
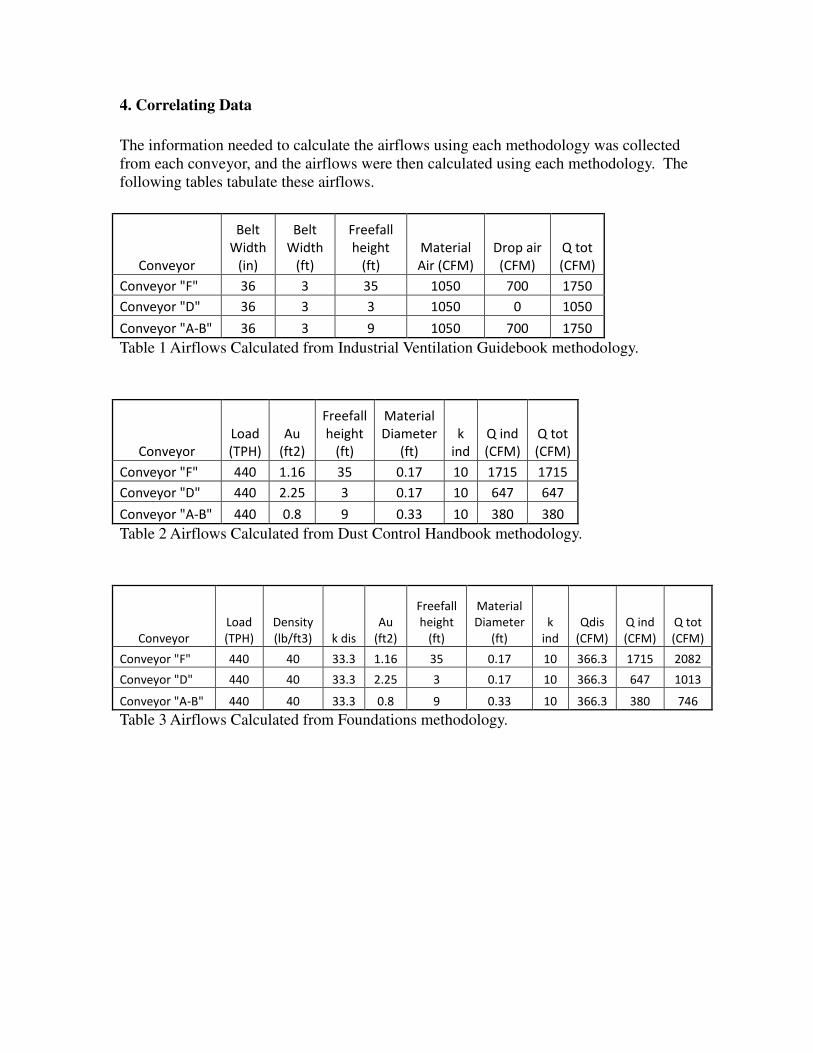
4. Correlating Data
The information needed to calculate the airflows using each methodology was collected
from each conveyor, and the airflows were then calculated using each methodology. The
following tables tabulate these airflows.
Conveyor
Belt
Width
(in)
Belt
Width
(ft)
Freefall
height
(ft)
Material
Air (CFM)
Drop air
(CFM)
Q tot
(CFM)
Conveyor "F" 36 3 35 1050 700 1750
Conveyor "D" 36 3 3 1050 0 1050
Conveyor "A-B" 36 3 9 1050 700 1750
Table 1 Airflows Calculated from Industrial Ventilation Guidebook methodology.
Conveyor
Load
(TPH)
Au
(ft2)
Freefall
height
(ft)
Material
Diameter
(ft)
k
ind
Q ind
(CFM)
Q tot
(CFM)
Conveyor "F" 440 1.16 35 0.17 10 1715 1715
Conveyor "D" 440 2.25 3 0.17 10 647 647
Conveyor "A-B" 440 0.8 9 0.33 10 380 380
Table 2 Airflows Calculated from Dust Control Handbook methodology.
Conveyor
Load
(TPH)
Density
(lb/ft3) k dis
Au
(ft2)
Freefall
height
(ft)
Material
Diameter
(ft)
k
ind
Qdis
(CFM)
Q ind
(CFM)
Q tot
(CFM)
Conveyor "F" 440 40 33.3 1.16 35 0.17 10 366.3 1715 2082
Conveyor "D" 440 40 33.3 2.25 3 0.17 10 366.3 647 1013
Conveyor "A-B" 440 40 33.3 0.8 9 0.33 10 366.3 380 746
Table 3 Airflows Calculated from Foundations methodology.

Each methodology had to be compared using the same application. This was
accomplished at Hennepin Power Station in Hennepin, IL.
The actual air velocity was measured at each transfer point using a pitot tube manometer.
The pitot tube was placed into the exit area of the chute (Region F in Figure 1), and the
velocity was measured. This velocity was multiplied by the cross sectional area of the
chute to find the total air flow. This data is tabulated below.
Conveyor
Measured
Air
Velocity
(FPM)
Exit
length
(in)
Exit
height
(in)
Exit
length
(ft)
Exit
height
(ft)
Exit
Area
(ft2)
Measured
Flow (CFM)
Conveyor "F" 550 24 10 2 0.833 2 1100
Conveyor "D" 588 36 9 3 0.75 2.25 1323
Conveyor "A-B" 550 36 5 3 0.416 1.25 687.5
Table 4.1 Collected Velocity Data and Calculated Air Flows

5. Discussion
The total quantity of air flow produced in a transfer point has been calculated in Section 3
and correlated in Section 4 for each methodology. These varied from reality by a certain
percentage, as shown below.
Conveyor
Industrial
Ventilation
Percent
Difference
(%)
Dust
Control
Handbook
Percent
Difference
(%)
Foundations
Percent
Difference
(%)
Conveyor "F" 59.1% 55.9% 89.2%
Conveyor "D" -20.6% -51.1% -23.4%
Conveyor "A-B" 154.5% -44.8% 8.5%
Average 64.3% -13.3% 24.8%
Table 5.1 Comparison of Calculated and Measured Air Flows for all Methodologies
It is of note that each method used to predict the airflow produced average values that
deviated greater than 10% from the actual airflow. A method had to be determined to
better represent the airflow generated by a transfer point.
Conveyor F included a drop height of 35'. This was not a continuous drop, but rather a
series of smaller drops. It is reasonable to assume that the induced air from the first drop
would be drawn from the entry area (Region A in Figure 1). When the material stream
came in contact with the first impact, all of this air would be expelled. Rather than
traveling through the transfer point, this air would be drawn and induced by the next fall.
The first fall would limit the amount of air in the material stream. The method described
in the Dust Control Handbook was altered to reflect this. The first drop height was used
in the calculation, and subsequent drops were ignored.
Conveyor
Measured Air
Flow (CFM)
Modified Dust Control
Handbook Calculated
Air flow (CFM)
Modified Dust Control
Handbook Percent
Difference (%)
Conveyor "F" 1100 641 -41.7%
Conveyor "D" 1323 647 -51.1%
Conveyor "A-B" 688 380 -44.8%
Average -45.9%
Table 5.2 Comparisons of Airflows Using Dust Control Handbook Methodology,
Mathematically Neglecting All Drops but the First
Table 5.2 shows that the assumption about drops does bring all of the induced air
computations together, but they are lower than actual by a factor of 45%. The Dust
Control Handbook did not take into account the displaced air. When this displaced air
factor was included per the Foundations methodology, the differences clustered around
0%, as shown in Table 5.3.

Conveyor
Calculated
Air Flow
(CFM)
Measured
Air Flow
(CFM)
Percent
Difference
(%)
Conveyor "F" 1008 1100 -8.4%
Conveyor "D" 1013 1323 -23.4%
Conveyor "A-B" 746 688 8.5%
Average -7.8%
Table 5.3 Comparisons of Airflows Using Foundations Methodology, Neglecting All
Drops but the First
Each methodology produces a mean and a standard deviation of the airflows relative to
the measured flow. These deviations were used to generate and compare standard
distribution curves for each methodology, shown below in Figure 5.1.
Figure 5.1 Statistical Breakdowns of Airflow Calculation Methodologies
This breakdown shows that each methodology can give a statistical representation of the
airflow, but none are exactly accurate.
The various methodologies can provide much insight into methods for reducing airflows.
Since dust travels in air, it makes sense that to minimize dust, airflow must be minimized.
Each part of the air generation equations should be analyzed to determine the greatest
impact on air produced.

Displaced Air
The two factors that are drivers of the displaced air are bulk density and material flow,
neither of which can be changed. The density is a property of the material, and the flow
is set by the design considerations of the bulk handling system. Because neither can be
altered, the displaced air is considered the baseline.
Generated Air
The generated air is caused by another piece of equipment that is necessary to the process
and therefore cannot be removed.
Induced Air
Like displaced air, there are factors of induced air that cannot be changed. These factors
are the material load and the diameter of the material. All other factors, aside from the
constant, can be changed through design. Of these factors, each has a unique impact on
the air created. If the open area through which air can enter system (Au) = is increased or
lowered, the air flow is increased or lowered in direct proportion. If the free-fall distance
(S) is changed, the airflow is altered by a factor of the cube root of the change squared.
If the process of the material stream expanding happens regardless of the conditions, a
vacuum will be created between the particles. This vacuum must be filled with air, and
the source of this air is irrelevant. If the area through which air can enter the chute is so
small that the vacuum cannot be fed entirely by this source, the vacuum will draw air
from other sources. The vacuum can draw all the air from the induced air that has just
been released. If the open area is reduced to zero, the entire induced air factor reduces to
zero.
If the material free-fall is lowered, the material stream cannot draw as much air, as the
stream does not have a chance to spread and create voids that result in vacuums. This
factor can also be reduced by not allowing the material to spread and create vacuums in
the first place. Reducing the free-fall distance to zero will also reduce the induced air to
zero.
While the open area and the drop height can both impact the air induced, the cost and
difficulty of altering the drop height makes changing the open area a far more desirable
proposition.
This is the very reason that much research has been done in the area of sealing the
transfer point. Technologies exist to seal the transfer chute, ranging from flat supports
under the belt, to rubber seals between the chute wall and the belt, to rubber curtains on
the exits and entrance. The supports, combined with the sealing technology, create a very
tight seal against the belt. The rubber curtains can be used to create a seal around the
entry and exit that can conform to the material stream. Openings in the chute can be
closed with cut steel or rubber. Rubber is a desirable solution, as it is very flexible and
much easier to work with than steel, but it is nonporous and can be used to restrict air. It
can also be cut to fit around odd moving geometries.

These technologies are shown below.
Figure 5.2 Belt Support
Figure 5.3 Rubber Chute-wall Seal

Figure 5.4 Entry and Exit Curtains

6. Conclusion
When considering the types of coal the industry is handling today, dust will always be
present. This dust will be contained in the transfer chutes or escape at the exit areas.
There are many methods to predict and improve the size and effectiveness of a dust
control system. A “best practice” was developed for predicting and minimizing airflow.
Begin by reviewing all the different methods for computing the air flows within a transfer
point. Calculate potential air flow using each industry-accepted method accepted and
compare those numbers to the actual air flow at the exit area. The methodologies
outlined in the Dust Control Handbook, the Industrial Ventilation Guidebook and
Foundations all give statistical representations of the airflow, but a measured airflow is
always accurate.
Then observe the configuration of the problem area and identify where the dust is being
generated. Address the obvious problems, starting at the entry area working to the exit,
sealing up the entire transfer area. When addressing each area, remember one simple
phrase, “TIGHT IS RIGHT”. Sealing the transfer point will help reduce the airflow,
contain the dust and be the most economical solution. After everything is sealed, again
check the exit area airflow to compare the results of your efforts.
Finally, if the problem area still does not meet expectations, then investigate suppression
and collection. When specifying a system for suppressing or collecting the dust,
remember to size the system to meet the measured airflows rather than the calculated
airflows. This will generate a solution that is sized to the reality of the application.
Quantifying and reducing the airflow will allow a user to specify a dust collection system
large enough to be effective, but not so large as to waste capacity.

7. References
American Council of Government Industrial Hygienists, Inc. 10.50 Material Transport.
Industrial Ventilation 25. Cincinnati, OH: ACGIH, 2004. 10-70 – 10-73.
Jakhete, Raj & Mody, Vinit. Dust Control Systems. Dust Control Handbook. Park Ridge,
New Jersey: Noyes Data Corporation, 1988. 39-40.
Marshall, Daniel. Air Control. Foundations 4. Ed. Andy Marti. Neponset, IL: Martin
Engineering, 2009. 90-99.
8. About the Authors
Daniel Marshall
Product Engineer
Martin Engineering
USA Business Unit
A self-described “numbers guy,” Daniel Marshall holds a B.S. in Mechanical Engineering
from Northern Arizona University. He joined Martin Engineering in 2000 as a Research
and Development Engineer, and has moved to Product Development and Application
Engineering. Marshall is instrumental in the design and application of dust suppression
systems and other components to improve the conveying of bulk materials.
Greg Boggio
Fuels Supervisor
Dynegy Midwest Generation
Hennepin Power Station
Greg began his career in 1979, when a strong back was the only qualification for a coal
handling position. Physically digging his way through the fuel department, he earned a
degree in hard labor. Over the years, he has developed and supported multiple system
design changes that have resulted in a clean, efficient and safe fuel handling system.