facts from nlts2 july 2009 - ed
TRANSCRIPT
U.S. Department of Education Institute of Education Sciences National Center for Special
Education Research
NCSER 2009-3020
Authors: Jennifer Yu Lynn Newman Mary Wagner SRI International
Contact: Jacquelyn A. Buckley
Facts From NLTS2 July 2009
Secondary School Experiences and Academic Performance of Students With
Mental Retardation
Introduction
Since the passage of the Education for All Handicapped Children Act (P.L. 94-142) in 1975, children with mental retardation have had increasing educational opportunities (Williamson et al. 2006). In more recent years, the move toward greater inclusion of students with mental retardation has fueled interest in the academic and social outcomes for these students, as researchers, educators, and advocates consider the implications of educating students with mental retardation in general versus special education settings (Freeman and Alkin 2000; Hughes et al. 2002; Lipsky and Gartner 1997; Sandler 1999). In addition, concerns have been raised as to whether curricula and instruction provided in various instructional settings are effective, appropriate, and properly implemented (Bouck 2004; Conderman and Katsiyannis 2002).
To address these issues and support successful outcomes for students with mental retardation, it is important to understand their educational environment. For instance, what courses are students with mental retardation taking and in which instructional settings? What are the characteristics of classroom instruction, and what types of accommodations are provided? Do students with mental retardation actively participate in their classes, and how does this participation vary by instructional setting? Ultimately, what are the academic outcomes of students with mental retardation?
The purpose of this fact sheet is to explore the secondary school experiences of students with mental retardation. Topics include the instructional practices in general, vocational, and nonvocational special education classrooms; the participation of students in various classroom settings; accommodations and support services provided to students; how their experiences compare with those of their classmates; and how students with mental retardation perform academically.

Findings are based on data collected from school staff during Wave 1 of the National Longitudinal Transition Study-2 (NLTS2)1 and from direct assessments of the academic achievement of youth with mental retardation. Mail surveys were conducted with staff in the schools attended by NLTS2 sample members in the spring of the 2001-02 school year; students were 14 through 18 years old at the time.2 School staff who were knowledgeable about the students’ overall school programs and about their special and vocational education courses were surveyed.3 For NLTS2 sample members who were reported by school staff to be enrolled in at least one general education academic class, teachers of the first such class in each student’s school week were surveyed.4
In addition, direct assessments of youths’ academic achievements were conducted in 2002 and 2004, when youth were 16 through 18 years old, using six subtests from the research edition of the Woodcock-Johnson III Tests of Achievement (WJ III) (Woodcock, McGrew, and Mather 2001). 1 The National Longitudinal Transition Study-2 (NLTS2),
being conducted by SRI International for the U.S. Department of Education, has a nationally representative sample of more than 11,000 students who were in at least seventh grade and receiving special education services in the 2000–01 school year. NLTS2 students were chosen from rosters of students receiving special education from or through public school districts. Districts were instructed to include all students for whom they were responsible, regardless of where they went to school or the type of school attended (e.g., a residential school in another state). Approximately 1,000 youth with mental retardation are included in the sample. This sample is designed to represent a total of 1,838,848 youth with disabilities and 213,552 youth with mental retardation, according to federal child count figures (U.S. Department of Education 2002). See http://www.nlts2.org for more information about the study.
2 Much of the information presented in this fact sheet also is included in Wagner, Newman, et al. (2003); Levine, Marder, and Wagner (2004); and Wagner et al. (2006).
3 This survey is referred to in this fact sheet as the student’s school program survey.
4 This survey is referred to in this fact sheet as the general education teacher survey.
If the direct assessment was reported to be inappropriate because youths’ disabilities made them unable to follow instructions or answer questions reliably, an adult-reported functional assessment was completed to measure adaptive and problem behaviors related to functional independence and adaptive functioning in school, home, employment, and community settings.
These data offer a national perspective on the secondary school experiences of students with mental retardation who received special education services from or through their school districts when they were sampled in 2000. Students in the NLTS2 sample upon whom this fact sheet is based were identified by their school districts as having mental retardation as a primary disability.5 States classified students as having mental retardation in accordance with federal regulations for the implementation of the Individuals With Disabilities Education Act Amendments of 1997 (P.L. 105-17) (Knoblauch and Sorenson 1998). However, states differed in the specific criteria they used for identifying students with mental retardation. Moreover, most states did not distinguish degrees of severity of mental retardation, resulting in a category with a wide range of functional levels.
One measure of the degree of severity of mental retardation available to NLTS2 is a parent-reported rating of the child’s ability on four functional cognitive skills—reading common signs (e.g., exit, danger), telling time on an analog clock, counting change, and looking up phone numbers and using 5 Studies conducted by Gresham and colleagues (1995),
which investigated the accuracy of school district evaluations of students with disabilities, revealed that schools often served students under inappropriate disability labels. Therefore, the identification of mental retardation on the basis of staff-reported data should be interpreted with caution due to the potential limitations involved in this method of data collection.
2
the phone.6 For the students with mental retardation, a summative scale of these ratings ranged from 4 (all skills done “not at all well”) to 16 (all skills done “very well”). Twenty percent of students with mental retardation scored in the high range (15 or 16), 57 percent in the moderate range (9 to 14), and 23 percent in the low range (4 to 8). These findings suggest that students with mental retardation represented in NLTS2 ranged from mild to severe in degree of mental retardation.
Organization of the Fact Sheet
This fact sheet reports on students with mental retardation as an overall group and stratified by high, moderate, and low levels of functioning, as determined by parents’ assessments of their children’s functional cognitive skills.7 The fact sheet begins by providing a description of the educational experiences of students with mental retardation in terms of the types of schools they attended, grade levels, and course taking by educational setting. The fact sheet then describes their experiences in three types of classes—general education academic, vocational education, and nonvocational special education classes. Each of these sections provides information about aspects of their educational experience within that type of educational setting, such as curriculum modification, types of instruction, students’ active participation, and teachers’ perceptions and expectations of student performance. Findings related to their receipt of accommodations and
6 See Wagner, Marder, et al. (2003) for the full report. 7 Despite efforts to ensure a study population that is
representative of the full population of youth with mental retardation, systematic differences may exist between those who participated in this study and those who did not. Consequently, the current results from this study may not be fully representative of the entire population of secondary students with mental retardation in the United States.
supports are presented next. The fact sheet closes with a focus on the academic achievement of students with mental retardation.
Students’ Course Taking
In the population of students with district-identified mental retardation represented by NLTS2, almost all secondary school students attended public schools; 94 percent attended regular schools serving a wide variety of students, and 4 percent attended special schools serving only students with disabilities (table 1). The other 2 percent attended charter, magnet, alternative, hospital, or home schools. When considering their levels of functioning, a statistically significant8 difference in school type was noted, as 96 percent of students with mental retardation that had parent-reported high or moderate cognitive functioning attended regular schools, compared with 84 percent of students with mental retardation exhibiting low cognitive functioning (p < .05 for both comparisons). Also, 15 percent of low-functioning students attended special schools, a significantly higher percentage than the 2 percent of moderate-functioning and 1 percent of high-functioning students (p < .05 for both comparisons).
In the overall cohort of students with mental retardation, 7 percent were in schools or programs that did not distinguish students by grade-level (i.e., ungraded programs), 16 percent attended middle or junior high schools, and 76 percent attended high schools. Across the different levels of cognitive functioning, 68 to 81 percent of 8 Statistical comparisons are based on F tests (ANOVA,
student’s t test), with only statistical significance at an alpha level of .05 reported. No special adjustments were made to account for multiple comparisons. Given the number of comparisons made in this fact sheet, readers are cautioned to consider the possibility of false positives in interpreting the data.
3

Table 1. Types and grade levels of schools attended by students with mental retardation, overall and by parent-reported levels of cognitive functioning
Overall High Moderate Low
Percentage who attended a: Regular school serving general population 94 96 96 84 Special school serving only students with disabilities 4 1 2 15 Charter, magnet, alternative hospital, or homeschooling 2 3 2 1
Percentage who attended school with grade level: Ungraded 7 3 7 13 Middle or junior high school 16 16 14 19 High school 76 81 79 68
NOTE: Percentages are population estimates based on weighted samples that range from approximately 90 to 550 across variables.
SOURCE: U.S. Department of Education, Institute of Education Sciences, National Center for Special Education Research, National Longitudinal Transition Study-2 (NLTS2), Wave 1 student’s school program survey, 2002.
students with mental retardation attended high school. Thus, the findings in this fact sheet primarily represent the experiences of students with mental retardation in high schools.
In a given semester, academic classes accounted for, on average, 49 percent of the courses taken by students with mental retardation (table 2). Vocational education courses accounted for 18 percent of the courses and the remaining 33 percent of classes taken by students with mental retardation included other nonacademic courses, such as fine arts classes and physical education.
When comparing the different levels of cognitive functioning, academic classes accounted for, on average, 55 percent of courses taken by high-functioning students, which was significantly higher than the proportion for academic courses taken by moderate- (46 percent, p < .01) and low-functioning (40 percent, p < .001) students with mental retardation. The average percentage of courses taken in a
vocational education setting was 21 percent for low-functioning students, a significantly higher proportion than the 14 percent of courses taken in a vocational setting by high-functioning students (p < .01). Vocational education accounted for, on average, 19 percent of the courses taken by moderate-functioning students, which also was significantly higher than the proportion of vocational courses taken by high-functioning students (p < .01). Finally, other nonacademic courses accounted for, on average, 39 percent of the courses taken by low-functioning students with mental retardation, which was significantly higher than the average percentage of nonacademic courses taken by high-functioning students (31 percent, p < .05).
Academic course taking. Ninety-six percent of the overall group of students with mental retardation took at least one academic subject9 (table 3). Among the
9 One purpose of the student’s school program survey was to obtain a snapshot of each student’s school program in terms of the range of courses taken at the time and the setting for each of these courses. Data reported here are for students’ spring 2002 courses.
4

Table 2. Average percentage of courses taken in a semester by students with mental retardation, overall and by parent-reported levels of cognitive functioning
Overall High Moderate Low
Academics 49 55 46 40 Vocational education 18 14 19 21 Other nonacademics 33 31 34 39
NOTE: Percentages are population estimates based on weighted samples that range from approximately 70 to 550 across variables.
SOURCE: U.S. Department of Education, Institute of Education Sciences, National Center for Special Education Research, National Longitudinal Transition Study-2 (NLTS2), Wave 1 student’s school program survey, 2002.
Table 3. Academic courses taken in any type of educational setting by students with mental retardation, overall and by parent-reported levels of cognitive functioning
Overall High Moderate Low
Percentage who took: At least one academic course 96 98 96 90 Language arts 94 97 94 85 Mathematics 92 95 93 84 Science 74 83 72 59 Social studies 75 87 73 55 Foreign language 9 6 9 16
NOTE: Percentages are population estimates based on weighted samples that range from approximately 70 to 550 across variables.
SOURCE: U.S. Department of Education, Institute of Education Sciences, National Center for Special Education Research, National Longitudinal Transition Study-2 (NLTS2), Wave 1 student’s school program survey, 2002.
group of students who were taking academic classes, most students took language arts (94 percent) and mathematics classes (92 percent). About three-quarters were enrolled in social studies (75 percent) and science (74 percent). Many fewer took foreign language classes (9 percent). When comparing the different levels of parent-reported cognitive functioning, 90 to 98 percent of students with mental retardation exhibiting high, moderate, or low levels of cognitive functioning took at least one academic subject. Compared with low-functioning students with mental retardation, a higher percentage of high-functioning students took language arts (97 percent vs.
85 percent, p < .05), science (83 percent vs. 59 percent, p < .05), and social studies (87 percent vs. 55 percent, p < .001). In addition, a higher proportion of moderate-functioning students with mental retardation took social studies courses compared with low-functioning students (73 percent vs. 55 percent, p < .05).
Vocational course taking. Seventy-eight percent of the overall group of students with mental retardation were enrolled in at least one vocational course in a given semester, with 52 percent enrolled in prevocational educational courses and 62 percent taking occupationally specific
5

Table 4. Vocational courses taken by students with mental retardation, overall and by parent-reported levels of cognitive functioning
Overall High Moderate Low
Percentage who took: At least one vocational education course 78 71 79 86 Prevocational education 52 43 68 71 Occupationally specific vocational education 62 55 66 61
NOTE: Percentages are population estimates based on weighted samples that range from approximately 70 to 550 across variables.
SOURCE: U.S. Department of Education, Institute of Education Sciences, National Center for Special Education Research, National Longitudinal Transition Study-2 (NLTS2), Wave 1 student’s school program survey, 2002.
vocational education courses (table 4). When stratified by parent-reported levels of functioning, 71 percent of low-functioning students and 68 percent of moderate-functioning students with mental retardation enrolled in prevocational education courses, which were significantly higher proportions than the 43 percent of high-functioning students enrolled in prevocational education courses (p < .001 and p < .01, respectively).
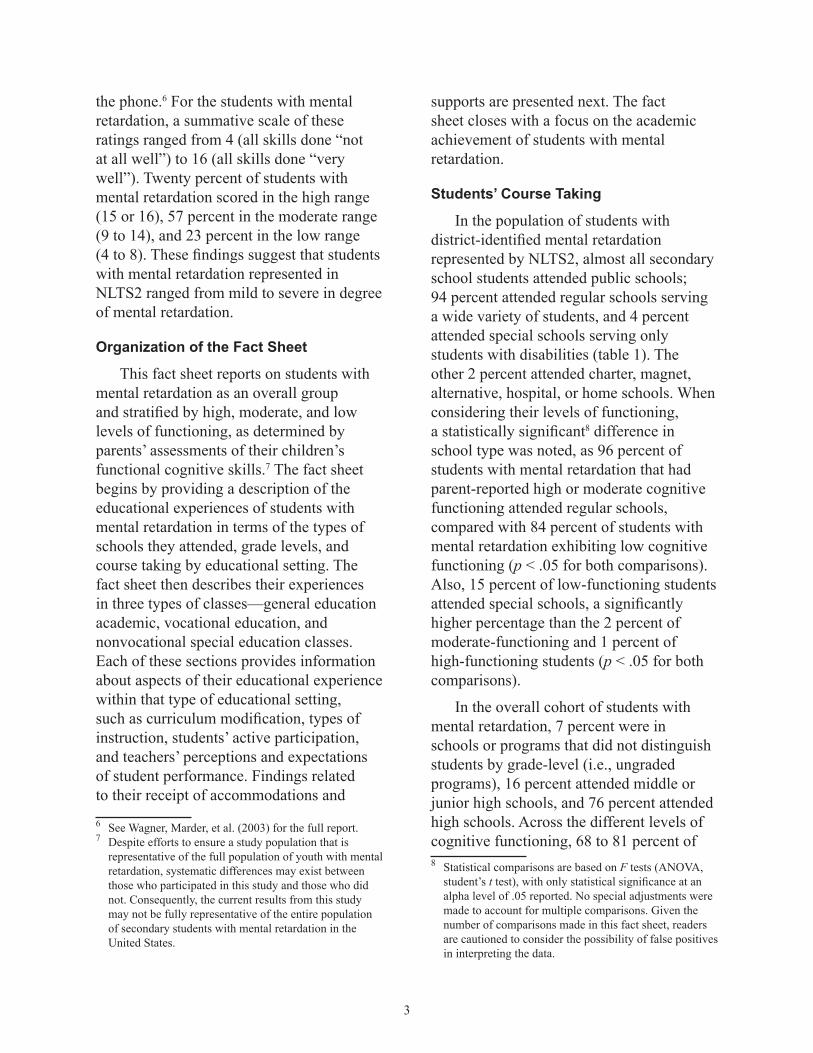
Other nonacademic course taking. Overall, 93 percent of students with mental retardation took nonacademic courses other than vocational education (table 5). Of those students enrolled in nonacademic courses, 78 percent were enrolled in physical education, 73 percent in life-skills/social-skills classes, 51 percent in fine arts courses, and 34 percent in study skills courses. Among the different levels of parent-reported cognitive functioning, 88 percent of low-functioning students and 79 percent of moderate-functioning students were enrolled in life-skills/social-skills classes, significantly higher percentages than the 61 percent of high-functioning students with mental retardation (p < .001 and p < .05, respectively).
Instructional Settings
Students with mental retardation took courses in both general and special education settings, though a significantly larger percentage took at least one course in a special education setting (92 percent) than in a general education setting (69 percent, p < .001) (table 6).10 On average, general education courses made up 31 percent of the kinds of courses taken by students with mental retardation, whereas special education courses made up 65 percent. Sixty-one percent of the overall group of students with mental retardation took nonacademic courses other than vocational education (i.e., classes in fine arts, physical education, life skills/social skills,
10 Testing for the significance of differences in responses to two survey items for the same individuals involves identifying for each youth the response to the two items. Responses to each item (e.g., taking at least one course in a special education setting compared with taking at least one course in a general education setting) are scored as 0 or 1. The difference between these scores produces values for individual students of +1 (responded affirmatively to the first item but not the second), 0 (responded affirmatively to both items or neither item), or -1 (responded affirmatively to the second item but not the first). The test statistic for the null hypothesis of a mean of zero for the difference score is the square of a ratio, where the numerator of the ratio is the weighted mean change score and the denominator is an estimate of the standard error of that mean. Since the ratio approaches a normal distribution by the Central Limit Theorem and sample sizes are at least 30, this test statistic approximately follows a chi-square distribution with one degree of freedom [i.e., an F(1, infinity) distribution].
6
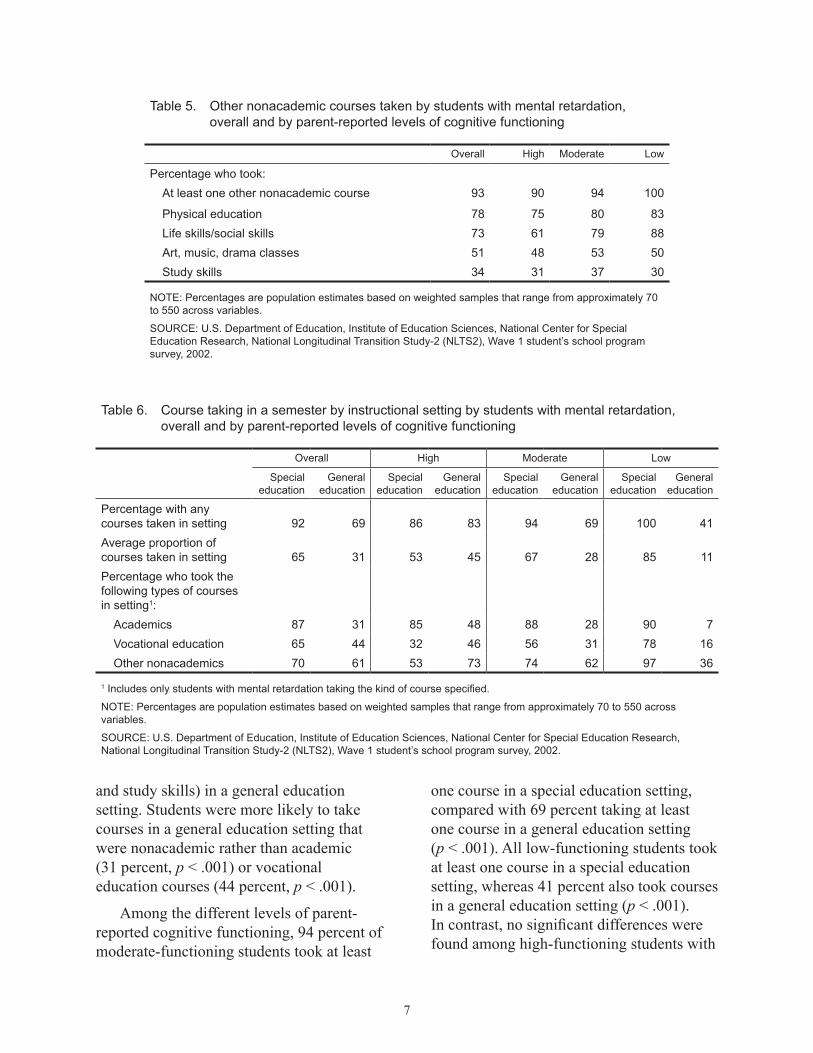
Table 5. Other nonacademic courses taken by students with mental retardation, overall and by parent-reported levels of cognitive functioning
Overall High Moderate Low
Percentage who took: At least one other nonacademic course 93 90 94 100
Physical education 78 75 80 83 Life skills/social skills 73 61 79 88 Art, music, drama classes 51 48 53 50 Study skills 34 31 37 30
NOTE: Percentages are population estimates based on weighted samples that range from approximately 70 to 550 across variables.
SOURCE: U.S. Department of Education, Institute of Education Sciences, National Center for Special Education Research, National Longitudinal Transition Study-2 (NLTS2), Wave 1 student’s school program survey, 2002.
Table 6. Course taking in a semester by instructional setting by students with mental retardation, overall and by parent-reported levels of cognitive functioning
Overall High Moderate Low
Special General Special General Special General Special General education education education education education education education education
Percentage with any courses taken in setting 92 69 86 83 94 69 100 41 Average proportion of courses taken in setting 65 31 53 45 67 28 85 11 Percentage who took the following types of courses in setting1:
Academics 87 31 85 48 88 28 90 7 Vocational education 65 44 32 46 56 31 78 16 Other nonacademics 70 61 53 73 74 62 97 36
1 Includes only students with mental retardation taking the kind of course specified.
NOTE: Percentages are population estimates based on weighted samples that range from approximately 70 to 550 across variables.
SOURCE: U.S. Department of Education, Institute of Education Sciences, National Center for Special Education Research, National Longitudinal Transition Study-2 (NLTS2), Wave 1 student’s school program survey, 2002.
and study skills) in a general education one course in a special education setting, setting. Students were more likely to take compared with 69 percent taking at least courses in a general education setting that one course in a general education setting were nonacademic rather than academic (p < .001). All low-functioning students took (31 percent, p < .001) or vocational at least one course in a special education education courses (44 percent, p < .001). setting, whereas 41 percent also took courses
in a general education setting (p < .001). Among the different levels of parent-In contrast, no significant differences were reported cognitive functioning, 94 percent of found among high-functioning students withmoderate-functioning students took at least
7

mental retardation. Similarly, the average proportion of courses taken in a special education setting was significantly higher than in a general education setting for moderate- (67 percent special education vs. 28 percent general education, p < .001) and low-functioning students (85 percent special education vs. 11 percent general education, p < .001), whereas the percentage of course-taking in special education or general education settings were similar for high-functioning students with mental retardation.
Regardless of the different levels of parent-reported cognitive functioning, students with mental retardation were more likely to take academic classes in a special education rather than a general education setting: 85 percent vs. 48 percent for high-functioning students (p < .001), 88 percent vs. 28 percent for moderate-functioning students (p < .001), and 90 percent vs. 7 percent for low-functioning students (p < .001). For vocational education, moderate-functioning students had a higher percentage of course-taking in special education than general education settings (56 percent vs. 31 percent, p < .001);
78 percent of low-functioning students took vocational education classes in a special education setting, compared with 16 percent in a general education setting (p < .001). For other nonacademic classes, an inverse relationship was found between the high-and low-functioning students with mental retardation; high-functioning students were more likely to take these courses in a general education than a special education setting (73 percent vs. 53 percent, p < .01), whereas low-functioning students were less likely to take these classes in a general education setting (36 percent vs. 97 percent, p < .001).
Experiences in General Education Academic Classes
Secondary students with mental retardation studied a variety of academic subjects in general education settings. As indicated earlier, 94 percent of the overall group of students with mental retardation had taken at least one language arts class. Among those who had taken language arts, 16 percent had done so in a general education setting (table 7). Among the 92 percent of students who
Table 7. Academic courses taken in a general education setting by students with mental retardation, overall and by parent-reported levels of cognitive functioning
Overall High Moderate Low
Percentage who took general education: Language arts 16 28 13 2 Mathematics 15 27 12 0 Science 30 45 27 3 Social studies 29 41 27 5 Foreign language 44 ‡ ‡ ‡
‡ Responses for items with fewer than 30 respondents are not reported.
NOTE: Percentages are of those students with mental retardation who took that type of course in any setting (see table 3). Percentages are population estimates based on weighted samples that range from approximately 40 to 200 across variables.
SOURCE: U.S. Department of Education, Institute of Education Sciences, National Center for Special Education Research, National Longitudinal Transition Study-2 (NLTS2), Wave 1 general education teacher survey, 2002.
8

taken mathematics, 15 percent had done so in a general education setting. Among the 74 percent of students who had taken science and the 75 percent who had taken social studies courses, 30 percent and 29 percent, respectively, had done so in a general education setting; and among the 9 percent of students who had taken foreign language courses, 44 percent had done so in a general education setting.
Across the different levels of parent-reported cognitive functioning, 28 percent of high-functioning students took language arts in a general education setting, a significantly higher proportion than the 13 percent of moderate- and 2 percent of low-functioning students (p < .05 and p < .001, respectively). Mathematics was taken in a general education setting by 27 percent of high-functioning students, compared with 12 percent of moderate- and 0 percent of low-functioning students (p < .05 and p < .001, respectively). General education science was taken by 45 percent of high-functioning students, compared with 27 percent of moderate- and 3 percent of low-functioning students (p < .05 and p < .001, respectively). Finally, social studies in the general education setting was taken by 41 percent of high-functioning students, whereas 5 percent of low-functioning students took this course in a general education setting (p < .001). Compared with low-functioning students, moderate-functioning students also were more likely to take language arts (p < .05), mathematics (p < .001), science (p < .001), and social studies (27 percent vs. 5 percent, p < .01) in a general education setting.11
11 Items with fewer than 30 respondents are not reported in this fact sheet. Consequently, foreign language course-taking in a general education setting was not analyzed for the three levels of cognitive functioning. In addition, low-functioning students with mental retardation were not considered in subsequent analyses on general education academic or vocational course taking.
To understand the instructional experiences of students with mental retardation in general education academic classes, the study asked teachers to report the frequency with which they used various practices with a specific student with mental retardation and with their class as a whole.12
Access to the general education curriculum. Teachers were asked to indicate the extent of modifications they made to the general education curriculum to accommodate specific individual students with mental retardation in their classes. Although 29 percent of the overall group of students with mental retardation had teachers who reported using the same unmodified general education grade-level curriculum used for all students in general education academic classes, teachers also reported that 52 percent of students with mental retardation were provided with a general education curriculum with “some modifications” and 15 percent received a curriculum with “substantial modifications” (table 8). An additional 5 percent of students with mental retardation received a “specialized curriculum.” Among the different levels of parent-reported cognitive functioning, 30 percent and 34 percent of high- and moderate-functioning students with mental retardation, respectively, received an unmodified general education curriculum, 52 and 50 percent, respectively, received a curriculum with “some modifications,” 11 and 16 percent, respectively, received a curriculum with “substantial modifications,” and 7 and 1 percent, respectively, received a “specialized curriculum.” 12 A typical general education academic class includes 19
general education students and 5 students who receive special education services. Thus, the comparisons made in this section should not be construed as between students with and without disabilities. Rather, teachers reported on the classroom experiences of specific students with disabilities and compared them with those of the students in the class as a whole, including all students with disabilities.
9

Table 8. Extent of curriculum modification for students with mental retardation, overall and by parent-reported levels of cognitive functioning
Overall High Moderate Low
Percentage who received curriculum with: No modifications 29 30 34 ‡ Some modifications 52 52 50 ‡ Substantial modifications 15 11 16 ‡ Specialized curriculum 5 7 1 ‡
‡ Responses for items with fewer than 30 respondents are not reported.
NOTE: Percentages are population estimates based on weighted samples that range from approximately 40 to 140 across variables.
SOURCE: U.S. Department of Education, Institute of Education Sciences, National Center for Special Education Research, National Longitudinal Transition Study-2 (NLTS2), Wave 1 general education teacher survey, 2002.
Table 9. Instructional groupings of students in general education academic classes for the whole class and for students with mental retardation, overall and by parent-reported levels of cognitive functioning
Overall students
with mental Whole class retardation High Moderate Low
Percentage who received: Whole-class instruction
Rarely or never 1 12 12 13 ‡ Sometimes 27 35 35 29 ‡ Often 72 53 53 58 ‡
Small-group instruction Rarely or never 12 17 15 22 ‡ Sometimes 64 53 61 47 ‡ Often 24 30 24 31 ‡
Individual instruction from a teacher
Rarely or never 14 11 15 5 ‡ Sometimes 60 57 62 53 ‡ Often 26 32 23 42 ‡
Individual instruction from another adult
Rarely or never 65 53 47 59 ‡ Sometimes 25 27 30 26 ‡ Often 10 20 23 15 ‡
‡ Responses for items with fewer than 30 respondents are not reported.
NOTE: Percentages are population estimates based on weighted samples that range from approximately 40 to 140 across variables.
SOURCE: U.S. Department of Education, Institute of Education Sciences, National Center for Special Education Research, National Longitudinal Transition Study-2 (NLTS2), Wave 1 general education teacher survey, 2002.
10

Instructional groupings. When asked about the types of instructional groupings used, teachers reported that 53 percent of students with mental retardation “often” experienced whole-class instruction in general education academic classes, which was significantly fewer than the 72 percent of the class as a whole who “often” received this form of instruction (p < .001) (table 9). In addition, teachers were significantly less likely to report that students with mental retardation “rarely” or “never” received individual instruction from another adult, compared with the class as a whole (53 percent vs. 65 percent, p < .05). There were no significant differences in instructional groupings between high- and moderate-functioning students with mental retardation.
Instructional activities outside the classroom. Instruction does not occur only within the confines of a classroom; teachers can offer students opportunities to extend their learning through the use of libraries, computer labs, or other types of resources at the school, as well as through field trips off campus and through community-based instruction or experiences, such as service-learning projects. As a whole, students with mental retardation did not differ from classmates in their participation in activities outside the classroom. When stratified by different levels of parent-reported cognitive functioning, 21 percent of high-functioning students “often” went on field trips, compared with 0 percent of moderate-functioning students (p < .05) (table 10). Similarly, 19 percent of high-functioning students “often” experienced community-based instruction, whereas no moderate-functioning students engaged in such activities (p < .05).
Students’ Active Participation in General Education Classroom Activities
Although many teacher-directed activities, such as instructional grouping and activities outside the classroom, did not significantly differ between the overall group of students with mental retardation and their class as a whole, there did appear to be notable differences with regard to classroom participation (table 11). Teachers reported that students with mental retardation participated less than their peers in general education classes, with significantly fewer students with mental retardation “often” responding orally to questions (21 percent vs. 71 percent, p < .001). Other examples of the disparity in classroom participation between students with mental retardation and students in the general education class as a whole were noted in the significant difference in percentages of student presentations to the class or group, with almost two-thirds (64 percent) of students with mental retardation, compared with one-third (33 percent) of their peers, “rarely” or “never” presenting to the class or group (p < .001). In addition, teachers reported that 19 percent of students with mental retardation “rarely” or “never” worked with a peer or group, compared with 5 percent of their general education classmates (p < .01). The frequency of participation in general education classrooms activities did not differ significantly between parent-reported high-and moderate-functioning students with mental retardation.
General Education Academic Teachers’ Perceptions and Expectations
Teachers were asked their perceptions of the appropriateness of placement for students with mental retardation in their general education classes. Almost half
11

Table 10. Instructional activities outside the general education academic classroom for the whole class and for students with mental retardation, overall and by parent-reported levels of cognitive functioning
Overall students
with mental Whole class retardation High Moderate Low
Percentage who participated in: Field trips
Rarely or never 65 66 55 79 ‡ Sometimes 27 22 24 21 ‡ Often 8 12 21 0 ‡
Community-based instructional experiences
Rarely or never 74 79 71 90 ‡ Sometimes 23 10 10 10 ‡ Often 3 11 19 0 ‡
‡ Responses for items with fewer than 30 respondents are not reported.
NOTE: Percentages are population estimates based on weighted samples that range from approximately 40 to 140 across variables.
SOURCE: U.S. Department of Education, Institute of Education Sciences, National Center for Special Education Research, National Longitudinal Transition Study-2 (NLTS2), Wave 1 general education teacher survey, 2002.
(45 percent) of students with mental retardation who took general education academic classes had teachers who considered their placement in those classes to be “very appropriate,” and 38 percent were considered to have “somewhat appropriate” placements (table 12). However, placement in a general education academic class was considered “not at all appropriate” or “not very appropriate” for 16 percent of students with mental retardation. In terms of teacher expectations, 84 percent of students with mental retardation were expected to keep up with other students in the class; however, teachers reported that significantly fewer students with mental retardation (54 percent) who were expected to keep up, were able to do so (p < .001).
Considering differences in parent-reported cognitive functioning, general education teachers perceived the placement of high-functioning students with mental retardation to be “very appropriate” for 46 percent of these students, “somewhat appropriate” for 33 percent, and “not at all” or “not very appropriate” for 21 percent of high-functioning students. Among moderate-functioning students with mental retardation, 54 percent were considered by their general education teachers to have “very appropriate” placement, 41 percent were considered to have “somewhat appropriate” placement, and 5 percent were considered to have “not at all” or “not very appropriate” placement. Further, 80 to 91 percent of high- and moderate-functioning students with mental retardation were expected to keep up with other students in the class, whereas 48 to 69 percent of students were actually reported to do so.
12
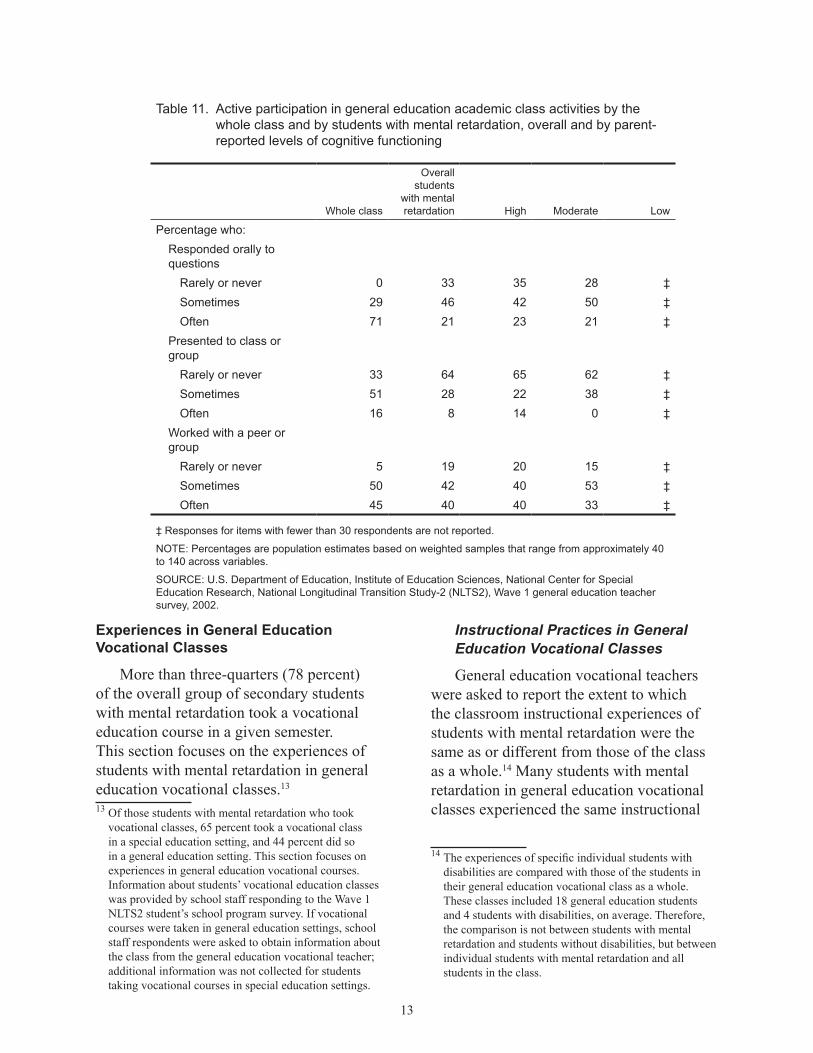
Table 11. Active participation in general education academic class activities by the whole class and by students with mental retardation, overall and by parent-reported levels of cognitive functioning
Whole class
Overall students
with mental retardation High Moderate Low
Percentage who: Responded orally to questions
Rarely or never Sometimes
0 29
33 46
35 42
28 50
‡ ‡
Often 71 21 23 21 ‡ Presented to class or group
Rarely or never Sometimes
33 51
64 28
65 22
62 38
‡ ‡
Often 16 8 14 0 ‡ Worked with a peer or group
Rarely or never Sometimes
5 50
19 42
20 40
15 53
‡ ‡
Often 45 40 40 33 ‡
‡ Responses for items with fewer than 30 respondents are not reported.
NOTE: Percentages are population estimates based on weighted samples that range from approximately 40 to 140 across variables.
SOURCE: U.S. Department of Education, Institute of Education Sciences, National Center for Special Education Research, National Longitudinal Transition Study-2 (NLTS2), Wave 1 general education teacher survey, 2002.
Experiences in General Education Vocational Classes
More than three-quarters (78 percent) of the overall group of secondary students with mental retardation took a vocational education course in a given semester. This section focuses on the experiences of students with mental retardation in general education vocational classes.13
13 Of those students with mental retardation who took vocational classes, 65 percent took a vocational class in a special education setting, and 44 percent did so in a general education setting. This section focuses on experiences in general education vocational courses. Information about students’ vocational education classes was provided by school staff responding to the Wave 1 NLTS2 student’s school program survey. If vocational courses were taken in general education settings, school staff respondents were asked to obtain information about the class from the general education vocational teacher; additional information was not collected for students taking vocational courses in special education settings.
Instructional Practices in General Education Vocational Classes
General education vocational teachers were asked to report the extent to which the classroom instructional experiences of students with mental retardation were the same as or different from those of the class as a whole.14 Many students with mental retardation in general education vocational classes experienced the same instructional
14 The experiences of specific individual students with disabilities are compared with those of the students in their general education vocational class as a whole. These classes included 18 general education students and 4 students with disabilities, on average. Therefore, the comparison is not between students with mental retardation and students without disabilities, but between individual students with mental retardation and all students in the class.
13

Table 12. General education academic teachers’ perceptions and expectations for students with mental retardation, overall and by parent-reported levels of cognitive functioning
Overall High Moderate Low
Percentage of students whose teachers reported:
Perceiving the appropriateness of student’s placement as:
Not at all/not very appropriate 16 21 5 ‡ Somewhat appropriate 38 33 41 ‡ Very appropriate 45 46 54 ‡
Expecting student to keep up with others in class 84 80 91 ‡ Perceiving student as keeping up with others in class 54 48 69 ‡
‡ Responses for items with fewer than 30 respondents are not reported.
NOTE: Percentages are population estimates based on weighted samples that range from approximately 60 to 140 across variables.
SOURCE: U.S. Department of Education, Institute of Education Sciences, National Center for Special Education Research, National Longitudinal Transition Study-2 (NLTS2), Wave 1 general education teacher survey, 2002.
practices as the class as a whole. Sixty-two percent were exposed to the same curriculum, and 60 percent received their education in the same instructional groupings (i.e., whole-class, in small groups, with partners, or individually) as their classmates (table 13). Seventy-four percent used the same instructional materials, such as textbooks, computers, and tools, and 70 percent participated in the same class activities, such as hands-on work, projects, and field trips, as their vocational education classmates. The instructional experiences for 20 to 34 percent of students with mental retardation were reported to be “somewhat different” than the experiences of the class as a whole. For 7 percent or fewer of students with mental retardation, curriculum, instructional groupings, instructional materials, and class activities were “very different” from those of their general vocational education classroom peers.
When stratified by parent-reported levels of cognitive functioning, no significant differences were found between high- and moderate-functioning students with mental retardation with regards to instructional practices in general education vocational settings. Approximately two-thirds of students who were high-functioning (65 percent) or moderate-functioning (62 percent) received the “same” curriculum as the class as a whole. Instructional groupings were the “same” for 61 percent of high- and moderate-functioning students with mental retardation as the class as a whole. More than three-quarters of high-functioning (78 percent) and moderate-functioning (79 percent) students with mental retardation received “same” instructional materials as the class as a whole, and 80 percent of high-functioning students and 65 percent of moderate-functioning students with mental retardation received “same” class activities as the class as a whole.
14

Table 13. Similarity of instructional experiences with those of the class as a whole in general education vocational classes of students with mental retardation, overall and by parent-reported levels of cognitive functioning
Overall High Moderate Low
Percentage of students
Curriculum Same 62 65 62 ‡
Somewhat different 31 31 31 ‡ Very different 7 4 7 ‡
Instructional groupings Same 60 61 61 ‡ Somewhat different 34 29 36 ‡ Very different 6 10 3 ‡
Instructional materials Same 74 78 79 ‡ Somewhat different 20 17 17 ‡ Very different 6 5 4 ‡
Class activities Same 70 80 65 ‡ Somewhat different 26 18 33 ‡ Very different 4 3 2 ‡
‡ Responses for items with fewer than 30 respondents are not reported.
NOTE: Percentages are population estimates based on weighted samples that range from approximately 60 to 160 across variables.
SOURCE: U.S. Department of Education, Institute of Education Sciences, National Center for Special Education Research, National Longitudinal Transition Study-2 (NLTS2), Wave 1 student’s school program survey, 2002.
General Education Vocational Teachers’ Perceptions and Expectations
Sixty-three percent of students with mental retardation who took general education vocational classes had teachers who considered their placement in those classes to be “very appropriate” (table 14). Thirty-three percent were considered by their teachers to have “somewhat appropriate” and 4 percent to have “not very appropriate” or “not at all appropriate” placements. Seventy-two percent of students with mental retardation in general education vocational classes were expected by their
teacher to keep up with others in their class; 71 percent were reported by their teachers to do so.
When considering the different levels of parent-reported cognitive functioning, 71 percent of high-functioning and 58 percent of moderate-functioning students with mental retardation who took general education vocational classes had teachers who considered their placement in those classes to be “very appropriate.” Twenty-six to 38 percent were considered by their teachers to have “somewhat appropriate,” and 3 to 5 percent to have “not very appropriate” or “not at all appropriate”
15

Table 14. General education vocational teachers’ perceptions and expectations for students with mental retardation, overall and by parent-reported levels of cognitive functioning
Overall High Moderate Low
Percentage of students whose teachers reported:
Perceiving the appropriateness of student‘s placement as:
Not at all/not very appropriate 4 3 5 ‡ Somewhat appropriate 33 26 38 ‡ Very appropriate 63 71 58 ‡
Expecting student to keep up with others in class 72 79 64 ‡ Perceiving student as keeping up with others in class 71 72 71 ‡
‡ Responses for items with fewer than 30 respondents are not reported.
NOTE: Percentages are population estimates based on weighted samples that range from approximately 60 to 160 across variables.
SOURCE: U.S. Department of Education, Institute of Education Sciences, National Center for Special Education Research, National Longitudinal Transition Study-2 (NLTS2), Wave 1 student’s school program survey, 2002
placements. Seventy-nine percent of high-functioning students and 64 percent of moderate-functioning students with mental retardation in general education vocational classes were expected by their teacher to keep up with others in their class. Seventy-two percent of high-functioning and 71 percent of moderate-functioning students were reported by their teachers to do so.
Experiences in Nonvocational Special Education Classes
Ninety-two percent of the overall group of secondary students with mental retardation took at least one course in a special education setting in a semester. Information presented in this section focuses on nonvocational special education classes, that is, classes that involved academic subjects (e.g., math, science, language arts); study skills, in which students received help with homework and learned successful studying and test-taking strategies; and functional life skills that facilitated independent living.
Instructional Practices in Nonvocational Special Education Classes
The use of a general education curriculum without modification was rare in a nonvocational special education class, with 2 percent of secondary students with mental retardation in such classes reported to be receiving an unmodified curriculum (table 15). Nine percent had a general education curriculum with “some modifications,” and 24 percent had a substantially modified curriculum in their special education class. Sixty-two percent received a specialized or individualized curriculum, whereas 3 percent had no curriculum.
High-functioning students with mental retardation were significantly more likely to have “some modifications” than were low-functioning students (14 percent vs. 3 percent, p < .05). Significant differences were noted with regard to “substantial
16

Table 15. Extent of curriculum modification in nonvocational special education classes for students with mental retardation, overall and by parent-reported levels of cognitive functioning
Overall High Moderate Low
Percentage who received curriculum with: No modifications 2 3 1 0 Some modifications 9 14 8 3 Substantial modifications 24 38 24 3 Specialized curriculum 62 41 64 90 No curriculum 3 3 2 4
NOTE: Percentages are population estimates based on weighted samples that range from approximately 70 to 480 across variables.
SOURCE: U.S. Department of Education, Institute of Education Sciences, National Center for Special Education Research, National Longitudinal Transition Study-2 (NLTS2), Wave 1 student’s school program survey, 2002
Table 16. Instructional groupings in nonvocational special education classes for students with mental retardation, overall and by parent-reported levels of cognitive functioning
Overall High Moderate Low
Percentage who received: Whole-class instruction
Rarely or never 23 18 16 51 Sometimes 43 47 46 25 Often 35 35 38 23
Small-group instruction Rarely or never 4 6 1 8 Sometimes 47 53 45 41 Often 49 41 54 51
Individual instruction from a teacher Rarely or never 4 5 4 2 Sometimes 46 50 49 27 Often 50 45 47 71
Individual instruction from another adult Rarely or never 32 40 34 18 Sometimes 41 37 45 34 Often 27 23 21 49
NOTE: Percentages are population estimates based on weighted samples that range from approximately 70 to 190 across variables.
SOURCE: U.S. Department of Education, Institute of Education Sciences, National Center for Special Education Research, National Longitudinal Transition Study-2 (NLTS2), Wave 1 student’s school program survey, 2002
17

modifications,” with 38 percent of high-functioning and 24 percent of moderate-functioning students receiving this type of curriculum, compared with 3 percent of low-functioning students (p < .001 for both comparisons). Finally, 90 percent of low-functioning students received a “specialized curriculum,” compared with 64 percent of moderate-functioning students (p < .001) and 41 percent of high-functioning students (p < .001).
Instructional groupings. When teachers were asked about the types of instructional groupings used in a nonvocational special education setting, they reported that 50 percent of students with mental retardation “often” received individual instruction from a teacher, and 49 percent “often” received small-group instruction (table 16). Thirty-five percent “often” received whole-class instruction, and 27 percent “often” received individual instruction from another adult.
There were a few notable differences in instructional groupings between general education classes and nonvocational special education classes for students with mental retardation. Nonvocational special education classes tended to have low student/adult ratios; on average, there were 4 students per adult, compared with 21 students per adult in general education academic classes (p < .001). Small-group instruction was significantly more likely to be used “often” in special education than in general education courses (49 percent vs. 30 percent, p < .001). In addition, 50 percent of students with mental retardation “often” received individual instruction from a teacher in special education classes, compared with 32 percent in general education classes (p < .05).
Differences in instructional groupings were apparent across the three levels of parent-reported cognitive functioning. Fifty-one percent of low-functioning students with mental retardation were reported by teachers as “rarely” or “never” receiving whole-class instruction, compared with 18 percent of high-functioning students (p < .01) and 16 percent of moderate-functioning students (p < .001). Additionally, a quarter of low-functioning students “sometimes” received whole-class instruction, compared with 47 percent of high-functioning and 46 percent of moderate-functioning students (p < .05 for both comparisons). The percentage receiving individual instruction from a teacher was significantly higher in the low-functioning group of students with mental retardation, 71 percent of whom received this type of special education instruction “often,” compared with 45 percent of high-functioning students (p < .01) and 47 percent of moderate-functioning students (p < .05). Twenty-seven percent of low-functioning students “sometimes” received this form of instruction, compared with half of high- and 49 percent of moderate-functioning students (p < .05 for both comparisons). Finally, 49 percent of low-functioning students “often” received individual instruction from another adult, compared with 23 percent of high-functioning students (p < .05) and 21 percent of moderate-functioning students (p < .01). In contrast, 18 percent of low-functioning students “rarely” or “never” received this kind of instruction, compared with 40 percent of high-functioning students (p < .05).
Instructional activities outside the classroom. In addition to classroom instruction, 44 percent of the overall group of students with mental retardation in nonvocational special education classes were reported as “often” experiencing
18

Table 17. Instructional activities outside the nonvocational special education classroom of students with mental retardation, overall and by parent-reported levels of cognitive functioning
Overall High Moderate Low
Percentage who participated in: Field trips
Rarely or never 29 38 27 19 Sometimes 51 43 54 58 Often 20 19 19 24
Community-based instructional experiences Rarely or never 39 46 39 23 Sometimes 29 22 33 34 Often 32 32 28 43
‡ Responses for items with fewer than 30 respondents are not reported.
NOTE: Percentages are population estimates based on weighted samples that range from approximately 40 to 140 across variables.
SOURCE: U.S. Department of Education, Institute of Education Sciences, National Center for Special Education Research, National Longitudinal Transition Study-2 (NLTS2), Wave 1 general education teacher survey, 2002.
school-based activities beyond the classroom, such as going to the library or working on a project in the school media center. Thirty-two percent of students with mental retardation “often” took part in community-based activities, such as taking public transportation, and 20 percent were in special education classes that “often” went on field trips (table 17). Each of these activities was significantly more common in special education than in general education classes, where 27 percent of students with mental retardation “often” experienced out-of-classroom activities (p < .001), 11 percent “often” took part in community-based activities (p < .001), and 12 percent “often” went on field trips (p < .05).
When comparing the differences in nonvocational special education activities outside the classroom by parent-reported levels of cognitive functioning, 38 percent of high-functioning students “rarely or never” participated in field trips compared with 19 percent of low-functioning students (p < .05). Similarly, 46 percent of high-
functioning students “rarely or never” experienced community-based instruction compared with 23 percent of low-functioning students (p < .05). Comparisons between nonvocational special education and general education settings by levels of cognitive functioning revealed that moderate-functioning students with mental retardation in special education classes were more likely “often” to experience field trips (19 percent) and community-based activities (28 percent) than were students in general education settings, none of whom did so (p < .001 for both comparisons).
Students’ Participation in Nonvocational Special Education Classroom Activities
Teachers of nonvocational special education classes were asked to report the frequency with which students with mental retardation participated in class discussions, responded orally to questions, presented to a class or group, and worked with a peer or group. Of students with mental retardation
19

Table 18. Participation in nonvocational special education classes of students with mental retardation, overall and by parent-reported levels of cognitive functioning
Overall High Moderate Low
Percentage who: Responded orally to questions
Rarely or never 13 8 5 42 Sometimes 41 43 40 36 Often 47 49 55 22
Participated in class discussion Rarely or never 16 11 11 40 Sometimes 39 41 40 32 Often 45 48 50 28
Worked with a peer or group Rarely or never 12 13 9 21 Sometimes 63 65 64 58 Often 25 22 27 22
Presented to class or group Rarely or never 59 57 56 76 Sometimes 32 29 36 20 Often 9 14 8 4
NOTE: Percentages are population estimates based on weighted samples that range from approximately 70 to 200 across variables.
SOURCE: U.S. Department of Education, Institute of Education Sciences, National Center for Special Education Research, National Longitudinal Transition Study-2 (NLTS2), Wave 1 student’s school program survey, 2002
taking nonvocational special education classes, 84 to 88 percent were reported to participate at least “sometimes” in each of these activities, with the exception of presenting to a class or group; 41 percent presented “sometimes” or “often” (table 18). Forty-seven percent of students with mental retardation “often” responded orally to questions in special education classes, whereas 45 percent participated in class discussion “often,” and 25 percent worked with a peer or group “often.” Participation in nonvocational special and general education were similar with the exception that students with mental retardation were more likely to respond orally to questions “often” when they were in nonvocational special education classes than when they were in general education academic classes (47 percent vs. 21 percent, p < .001).
Regarding parent-reported cognitive functioning, 42 percent of low-functioning students with mental retardation “rarely” or “never” responded orally to questions, a significantly higher proportion than the reported 8 percent of high-functioning (p < .001) and 5 percent of moderate-functioning (p < .001) students with mental retardation. Conversely, a higher percentage of moderate-functioning (55 percent) and high-functioning (49 percent) students were more likely to respond orally to questions “often” when compared with the 22 percent of low-functioning students (p < .001 and p < .01, respectively). Four out of 10 low-functioning students with mental retardation “rarely” or “never” participated in class discussion, a significantly higher proportion than the 11 percent of high- and moderate-functioning students with mental retardation
20

Table 19. Types of accommodations and supports received by students with mental retardation, overall and by parent-reported levels of cognitive functioning
Overall High Moderate Low
Percentage who received: Any type of accommodation or support1 97 94 97 97 More time in taking tests 69 89 68 29 Additional time to complete assignments 64 65 67 48 Tests read to students 56 71 54 31 Slower-paced instruction 54 47 60 59 Shorter or different assignments 53 49 56 49 Modified tests 47 50 52 30 Modified grading standards 46 49 47 37 Alternative tests or assessments 43 29 48 59 Modifications to physical aspects of the classroom 10 6 9 30
1 Support includes receipt of any of the accommodations and other learning assistance listed here and in table 18. Students may have received more than one type of accommodation or support.
NOTE: Percentages are population estimates based on weighted samples that range from approximately 70 to 220 across variables.
SOURCE: U.S. Department of Education, Institute of Education Sciences, National Center for Special Education Research, National Longitudinal Transition Study-2 (NLTS2), Wave 1 student’s school program survey, 2002.
(p < .01 for both levels). Conversely, 50 percent of moderate- and 48 percent of high-functioning students “often” participated in class discussion, significantly more than the 28 percent of low-functioning students (p < .05 for both comparisons). Finally, 76 percent of low-functioning students with mental retardation “rarely” or “never” presented to the class or group, a significantly higher percentage than the 56 percent of moderate-functioning students with mental retardation (p < .05).
Accommodations, Services, and Supports Provided to Students with Mental Retardation
Some youth, particularly those with disabilities, need supports and interventions beyond the traditional classroom experiences to be successful at
school (Tindal and Fuchs 2000). Among the overall group of secondary-school students with mental retardation, 97 percent were reported to receive some type of accommodation or support (table 19).15
Providing additional time was a frequently reported form of accommodation; 69 percent of students with mental retardation were provided with more time to take tests, and 64 percent received additional time to complete assignments. More than half of students with mental retardation had tests read to them (56 percent), received slower-paced instruction (54 percent), or were given shorter or different assignments than the rest of the class (53 percent). Forty-seven percent received modified tests, 46 percent were assessed on the basis of
15 Support includes receipt of any of the accommodations and other learning assistance listed here and in table 20. Students may have received more than one kind of accommodation or support.
21

modified grading standards, and 43 percent received alternative tests or assessments. Physical aspects of the classroom were modified for 10 percent of students with mental retardation.
High- and moderate-functioning students with mental retardation were more likely to receive certain accommodations and supports than were low-functioning students. Eighty-nine percent of high-functioning and 68 percent of moderate-functioning students received more time to take tests, compared with 29 percent of low-functioning students (p < .001 for both comparisons). More than two-thirds (67 percent) of moderate-functioning students received additional time for assignments, whereas less than half of low-functioning students (48 percent) received this accommodation (p < .05). Seventy-one percent of high-functioning and 54 percent of moderate-functioning students had tests read to them, compared with 31 percent of low-functioning students
(p < .001 and p < .05, respectively). Fifty-two percent of moderate-functioning students and half of high-functioning students received modified tests, compared with 30 percent of low-functioning students (p < .05 for both comparisons). In two instances, the low-functioning group of students with mental retardation was more likely to receive accommodations than students with higher levels of cognitive functioning. Fifty-nine percent of low-functioning students received alternative tests or assessments, compared with 48 percent of moderate-functioning students and 29 percent of high-functioning students (p < .05 and p < .01, respectively). Finally, 30 percent of low-functioning students had modifications to the physical aspects of their classroom, many more than the 9 percent of moderate-functioning and 6 percent of high-functioning students who had those kinds of modifications (p < .01 for both comparisons).
Table 20. Types of learning supports received by students with mental retardation, overall and by parent-reported levels of cognitive functioning
Overall High Moderate Low
Percentage who received: Some type of learning support 80 79 79 83 Monitoring of progress by special education teacher 58 58 59 54 A teacher’s aide, instructional assistant, or other personal aide 39 27 42 56 More frequent feedback 36 35 36 31 Learning strategies/study skills assistance 26 28 27 16 A peer tutor 23 23 24 20 Self-advocacy training 14 8 17 17 A reader or interpreter 11 16 12 3 Tutoring by an adult 7 5 8 6
NOTE: Percentages are population estimates based on weighted samples that range from approximately 70 to 560 across variables.
SOURCE: U.S. Department of Education, Institute of Education Sciences, National Center for Special Education Research, National Longitudinal Transition Study-2 (NLTS2), Wave 1 student’s school program survey, 2002
22
Other types of supports or assistance that enhance classroom participation also were provided to 80 percent of students with mental retardation (table 20). Special education teachers monitored the progress of 58 percent of these students, and 39 percent of students with mental retardation were reported to be supported by a teacher’s aide, instructional assistant, or other personal aide. Thirty-six percent received more frequent feedback, 26 percent received learning strategies or study skills assistance, and 23 percent were assisted by a peer tutor. Less than 15 percent of students with mental retardation received self-advocacy training, a reader or interpreter, or tutoring by an adult.
Across the different levels of parent-reported cognitive functioning, 56 percent of low-functioning students were supported
by a teacher’s aide, instructional assistant, or other personal aide, which was significantly higher than the 42 percent of moderate- and 27 percent of high-functioning students who received this form of learning support (p < .05 and p < .01, respectively). Sixteen percent of high-functioning students and 12 percent of moderate-functioning students had the support of a reader or interpreter, compared with only 3 percent of the low-functioning group (p < .05 for both comparisons).
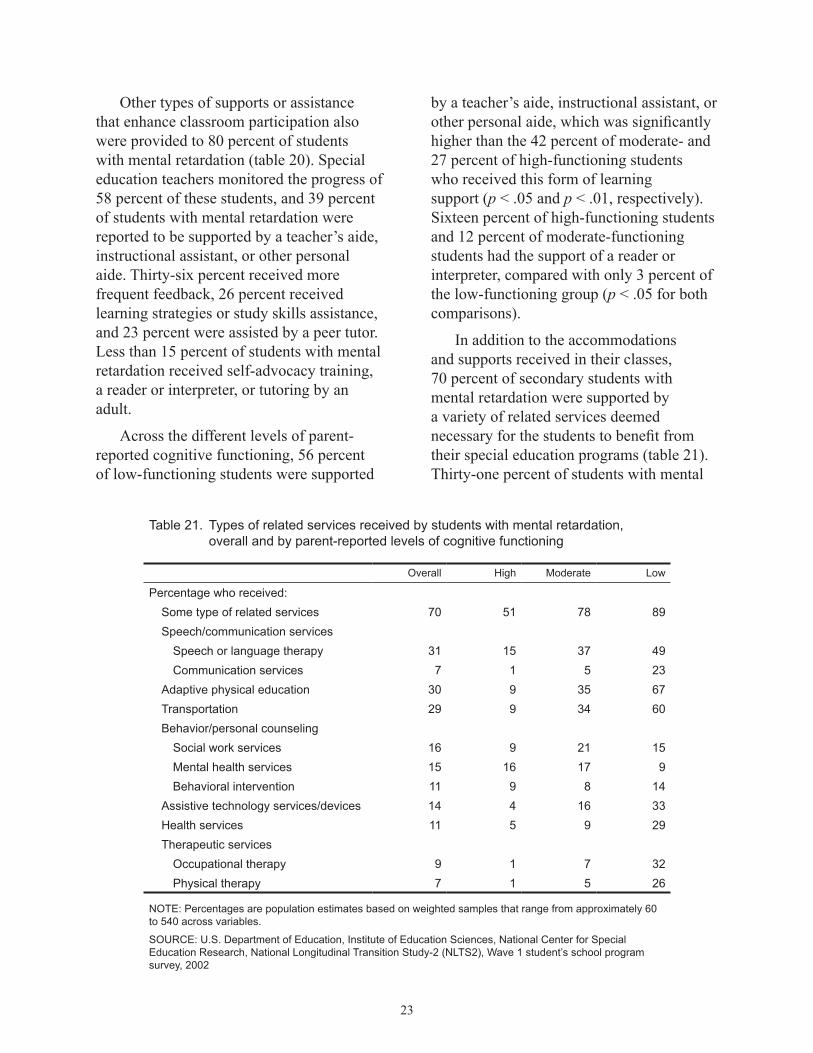
In addition to the accommodations and supports received in their classes, 70 percent of secondary students with mental retardation were supported by a variety of related services deemed necessary for the students to benefit from their special education programs (table 21). Thirty-one percent of students with mental
Table 21. Types of related services received by students with mental retardation, overall and by parent-reported levels of cognitive functioning
Overall High Moderate Low
Percentage who received: Some type of related services 70 51 78 89 Speech/communication services
Speech or language therapy 31 15 37 49 Communication services 7 1 5 23
Adaptive physical education 30 9 35 67 Transportation 29 9 34 60 Behavior/personal counseling
Social work services 16 9 21 15 Mental health services 15 16 17 9 Behavioral intervention 11 9 8 14
Assistive technology services/devices 14 4 16 33 Health services 11 5 9 29 Therapeutic services
Occupational therapy 9 1 7 32 Physical therapy 7 1 5 26
NOTE: Percentages are population estimates based on weighted samples that range from approximately 60 to 540 across variables.
SOURCE: U.S. Department of Education, Institute of Education Sciences, National Center for Special Education Research, National Longitudinal Transition Study-2 (NLTS2), Wave 1 student’s school program survey, 2002
23

retardation received speech or language therapy, 30 percent participated in adaptive physical education, and 29 percent received special transportation because of their disability. Social work services were provided to 16 percent of students with mental retardation, 15 percent received psychological or mental health services, and 14 percent were provided with assistive technology services or devices. Both behavioral intervention services and health services were received by 11 percent of students with mental retardation, whereas less than 10 percent received therapeutic services or communication services.
Students with the three levels of parent-reported cognitive functioning differed significantly with regard to many of the related services and accommodations. Eighty-nine percent of low-functioning students and 78 percent of moderate-functioning students with mental retardation received some type of related service, compared with 51 percent of high-functioning students (p < .001 for both comparisons). Forty-nine percent of low-functioning students and 37 percent of moderate-functioning students received speech or language therapy, whereas 15 percent of high-functioning students received this service (p < .001 and p < .01, respectively). Nearly one quarter (23 percent) of low-functioning students received communication services, significantly more than the 5 percent of moderate-functioning students and 1 percent of high-functioning students who received these services (p < .05 and p < .01, respectively). Two thirds (67 percent) of low-functioning students received adaptive physical education, compared with 35 percent of moderate- and 9 percent of high-functioning students (p < .001 for both comparisons). The percentage of moderate-functioning students also was
significantly higher than the percentage of high-functioning students receiving adaptive physical education (p < .001). A total of 60 percent of low-functioning students received special transportation, whereas 34 percent of moderate-functioning students and 9 percent of high-functioning students received this service (p < .05 and p < .001, respectively). The percentage of moderate-functioning students also was significantly higher than the percentage of high-functioning students receiving special transportation (p < .001). One third of low-functioning students received assistive technology services or devices, a significantly higher proportion compared with the 16 percent of moderate-functioning students and 4 percent of high-functioning students (p < .05 and p < .01, respectively). Twenty-nine percent of low-functioning students received health services, compared with 9 percent of moderate- and 5 percent of high-functioning students (p < .05 and p < .01, respectively). About one-third (32 percent) of low-functioning students received occupational therapy, compared with 7 percent of moderate-functioning students and 1 percent of high-functioning students (p < .01 and p < .001, respectively). Finally, 26 percent of low-functioning students received physical therapy, which was a significantly higher percentage than the 5 percent of moderate-functioning and 1 percent of high-functioning students (p < .05 and p < .01, respectively).
The related services and supports provided to students with mental retardation were meant to be coordinated and integrated into students’ overall educational programs. To facilitate this coordination and integration of services, a case manager was assigned to some students by their schools. A case manager “coordinates and oversees services on behalf of the student. In some schools, this person might be
24

the child’s special education teacher. In other schools, supervisory school district personnel may assume this responsibility” (Mattson 2001, p. 14). Thirty-three percent of the overall group of secondary students with mental retardation had a case manager provided from or through their school. Twenty-four percent of high-, 38 percent of moderate- and 36 percent of low-functioning students were reported to be supported by a case manager.
Students’ Academic Course Grades and Achievement on Academic Assessments
One measure of academic performance is teacher-given grades.16 Although 12 percent of the overall group of students with mental retardation received grades of “mostly As and Bs” in their general education academic classes, and 18 percent received “mostly Bs and Cs,” the majority received grades of C or below; 45 percent received “mostly Cs and Ds,” and one in four (25 percent) received “mostly Ds and Fs” (table 22). No significant differences were found when comparing parent-reported high-, moderate-, and low-functioning levels of students with mental retardation.
Performance on individual assessments is another measure of achievement. One assessment was attempted for each NLTS2 sample member during the biennial data collection cycle in which he or she was in the 16- through 18-year-old age range.17
The NLTS2 direct assessment used research editions of subtests of the Woodcock-Johnson III Tests of Achievement (WJ III) (Woodcock, McGrew, and Mather 2001) that test language arts skills, mathematics abilities, and content knowledge in science and social studies.18 NLTS2 also included a functional rating to provide information on 16 Grades reported by teachers in the NLTS2 Wave 1
(2002) general education teacher survey. 17 Assessments were conducted in 2002 and 2004. 18 See Wagner et al. (2006) for more information about
the direct assessment subtests and the data collection
youth for whom the direct assessment was reported to be inappropriate. The functional rating was the Scales of Independent Behavior-Revised (SIB-R) (Bruininks et al. 1996), a comprehensive measure of adaptive functioning in school, home, employment, and community settings. To determine the form of assessment for which youth qualified, assessors interviewed the school staff person who was most familiar with a youth and his or her school program; information was sought from parents if youth were no longer in school, including any accommodations that a youth required. Among the overall group of students with mental retardation who participated in the assessments, 79 percent took part in the direct assessments and 21 percent had a functional rating.
Direct assessment results are reported as standard scores, which for the general population of youth in the test norming sample have a mean of 100 and a standard deviation of 15. Thus, in the general population, 50 percent of youth scored at the mean of 100 or above and 50 percent scored below. The performance of the majority of youth in the general population (95 percent) falls within two standard deviations around the mean; that is, scores between 70 and 130. Two percent of youth in the general population receive scores that are more than two standard deviations below the mean—i.e., less than 70—a standard score range classified by the WJ III as being “very low” (Woodcock and Mather 1990). Compared with the 2 percent of youth in the general population who scored in this “very low” range on the subtests, 73 percent of youth with mental retardation scored “very low” on the passage comprehension subtest, as did 65 percent on the mathematics calculation subtest, 59 percent on the synonyms/antonyms subtest, 57 percent on the applied problems subtest, 56 percent on
process. 25
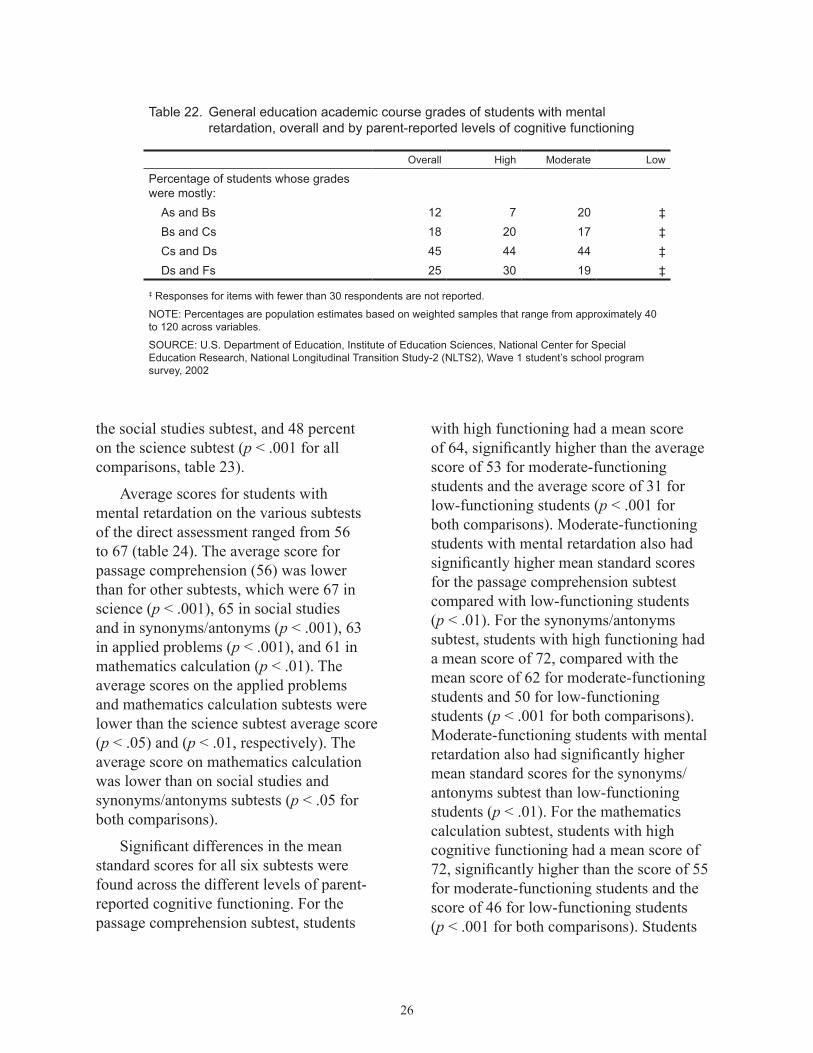
Table 22. General education academic course grades of students with mental retardation, overall and by parent-reported levels of cognitive functioning
Overall High Moderate Low
Percentage of students whose grades were mostly:
As and Bs 12 7 20 ‡ Bs and Cs 18 20 17 ‡ Cs and Ds 45 44 44 ‡ Ds and Fs 25 30 19 ‡
‡ Responses for items with fewer than 30 respondents are not reported.
NOTE: Percentages are population estimates based on weighted samples that range from approximately 40 to 120 across variables.
SOURCE: U.S. Department of Education, Institute of Education Sciences, National Center for Special Education Research, National Longitudinal Transition Study-2 (NLTS2), Wave 1 student’s school program survey, 2002
the social studies subtest, and 48 percent on the science subtest (p < .001 for all comparisons, table 23).
Average scores for students with mental retardation on the various subtests of the direct assessment ranged from 56 to 67 (table 24). The average score for passage comprehension (56) was lower than for other subtests, which were 67 in science (p < .001), 65 in social studies and in synonyms/antonyms (p < .001), 63 in applied problems (p < .001), and 61 in mathematics calculation (p < .01). The average scores on the applied problems and mathematics calculation subtests were lower than the science subtest average score (p < .05) and (p < .01, respectively). The average score on mathematics calculation was lower than on social studies and synonyms/antonyms subtests (p < .05 for both comparisons).
Significant differences in the mean standard scores for all six subtests were found across the different levels of parent-reported cognitive functioning. For the passage comprehension subtest, students
with high functioning had a mean score of 64, significantly higher than the average score of 53 for moderate-functioning students and the average score of 31 for low-functioning students (p < .001 for both comparisons). Moderate-functioning students with mental retardation also had significantly higher mean standard scores for the passage comprehension subtest compared with low-functioning students (p < .01). For the synonyms/antonyms subtest, students with high functioning had a mean score of 72, compared with the mean score of 62 for moderate-functioning students and 50 for low-functioning students (p < .001 for both comparisons). Moderate-functioning students with mental retardation also had significantly higher mean standard scores for the synonyms/ antonyms subtest than low-functioning students (p < .01). For the mathematics calculation subtest, students with high cognitive functioning had a mean score of 72, significantly higher than the score of 55 for moderate-functioning students and the score of 46 for low-functioning students (p < .001 for both comparisons). Students
26

Table 23. Performance of youth with mental retardation compared with performance of youth in the general population based on standard scores from the Woodcock-Johnson III research version direct assessment subtests
< 70 70-84.9 85-100 > 100
Percentage with standard score
Youth in the general population1
All subtests 2 14 34 50 Youth with mental retardation
Passage comprehension 73 24 3 1 Synonyms/antonyms 59 30 11 0.3 Mathematics calculation 65 26 7 1 Applied problems 57 30 13 1 Social studies 56 39 5 0.3 Science 48 38 14 1
1 Youth in the general population refers to the Woodcock-Johnson norming sample.
NOTE: Percentages are population estimates based on weighted samples that range from approximately 460 to 480 youth across variables.
SOURCE: Woodock-Johnson, Test of Cognitive Ability: Standard and Supplemental Batteries. Norm Tables, 1989; U.S. Department of Education, Institute of Education Sciences, National Center for Special Education Research, National Longitudinal Transition Study-2 (NLTS2), Wave 1 student’s school program survey, 2002
Table 24. Mean standard scores on Woodcock-Johnson III research version direct assessment subtests for students with mental retardation, overall and by parent-reported levels of cognitive functioning
Overall High Moderate Low
Passage comprehension 56 64 53 31 Synonyms/antonyms 65 72 62 50 Mathematics calculation 61 72 55 46 Applied problems 63 74 58 45 Social studies 65 70 62 57 Science 67 73 64 58
NOTE: Percentages are population estimates based on weighted samples that range from approximately 30 to 480 across variables.
SOURCE: U.S. Department of Education, Institute of Education Sciences, National Center for Special Education Research, National Longitudinal Transition Study-2 (NLTS2), student assessments, 2002 and 2004
27

with high functioning had a mean score of 74 on the applied problems subtest, a significantly higher score than the 58 for moderate-functioning students or 45 for low-functioning students (p < .001 for both comparisons). Moderate-functioning students with mental retardation also had a significantly higher mean standard score for the applied problems subtest than low-functioning students (p < .05). For the social studies subtest, the mean standard score of 70 for students with high functioning was significantly higher than the 62 for moderate-functioning students (p < .001) or 57 for low-functioning students (p < .01). Finally, students with high functioning had a mean score of 73 on the science subtest, significantly higher than the mean standard scores of 64 and 58 for moderate-functioning and low-functioning students, respectively (p < .001 for both comparisons).
If a youth did not meet the requirements for the direct assessment, even with accommodations, he or she was eligible for the functional rating, and a rating form was completed by a teacher if a youth was in school or by a parent if he or she was not. The four clusters of the functional rating scale measured motor skills, social interaction and communication skills, personal living skills, and community living skills. These four clusters also were combined into an overall scale referred to as “broad independence.” Functional rating results are reported as standard scores, which for the general population of youth have a mean of 100 and a standard deviation of 15.
In the general population, the distribution of test scores on each cluster is equally divided above and below the mean (Bruininks et al. 1996). Therefore, as seen in table 25, 50 percent of youth in the general
population scored above the mean, and 50 percent of youth in the general population scored below the mean. Of those students who scored below the mean, 2 percent scored more than 2 standard deviations below the mean on the measure of “broad independence.” In contrast, 89 percent of the overall group of youth with mental retardation who received the functional rating were reported to have scores more than two standard deviations below the mean on “broad independence,” with a mean standard score of 23. In addition, more than three-quarters of students were reported to have scores more than two standard deviations below the mean on each of the four functional behavior measures. The mean standard scores on each of the scale’s clusters for students with mental retardation who received the functional rating are found in table 26.
Among students with parent-reported moderate and low functioning,19 significant differences were found in the mean standard scores for the four clusters of the functional rating scale. For broad independence, moderate-functioning students had a mean standard score of 30, significantly higher than the mean standard score of 11 for low-functioning students with mental retardation (p < .01). Both moderate- and low-functioning students scored highest on the “personal living” cluster, yet moderate-functioning students’ mean score of 55 was significantly higher than low-functioning students’ mean score of 27 (p < .001). Moderate-functioning students with mental retardation also scored significantly higher on the “motor skills” cluster (53 percent vs. 25 percent, p < .001) and the “social interaction and communication” cluster (38 percent vs. 16 percent, p < .001). Both 19 Items with fewer than 30 respondents are not reported in
this fact sheet. Consequently, high-functioning students with mental retardation were not considered in the analysis of the functional rating scales.
28
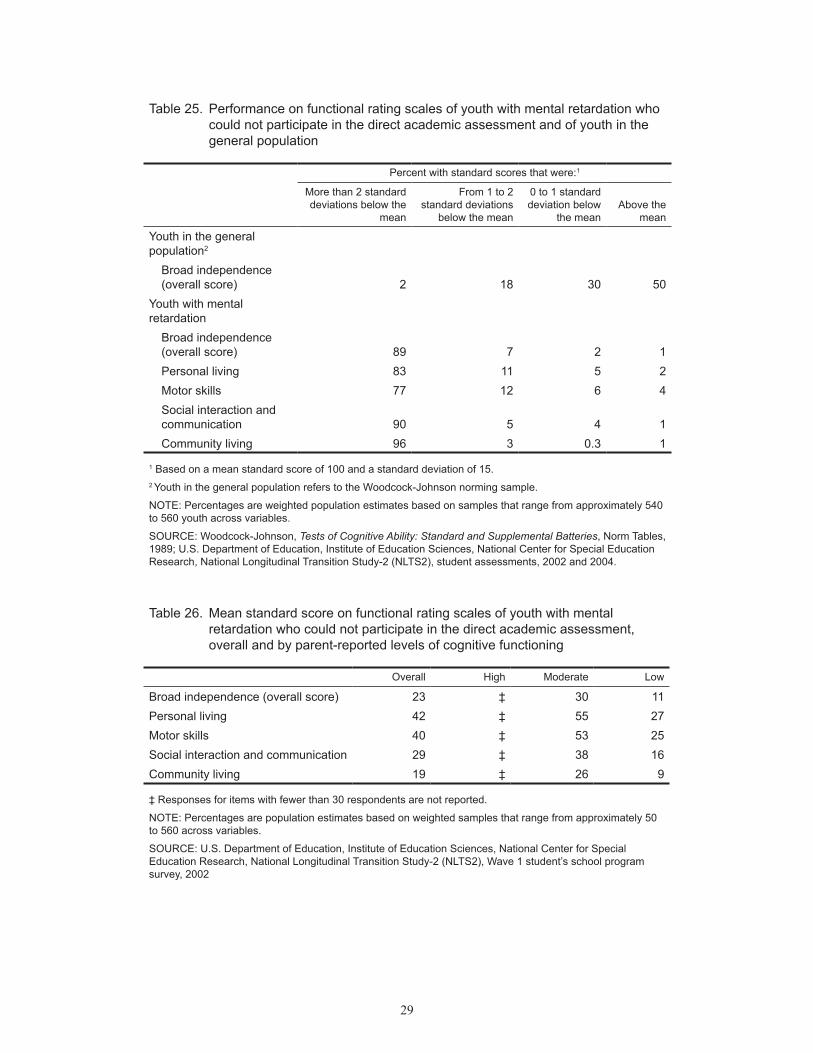
Table 25. Performance on functional rating scales of youth with mental retardation who could not participate in the direct academic assessment and of youth in the general population
Percent with standard scores that were:1
More than 2 standard deviations below the
mean
From 1 to 2 standard deviations
below the mean
0 to 1 standard deviation below
the mean Above the
mean
Youth in the general population2
Broad independence (overall score) 2 18 30 50
Youth with mental retardation
Broad independence (overall score) 89 7 2 1 Personal living 83 11 5 2 Motor skills 77 12 6 4 Social interaction and communication 90 5 4 1 Community living 96 3 0.3 1
1 Based on a mean standard score of 100 and a standard deviation of 15. 2 Youth in the general population refers to the Woodcock-Johnson norming sample.
NOTE: Percentages are weighted population estimates based on samples that range from approximately 540 to 560 youth across variables.
SOURCE: Woodcock-Johnson, Tests of Cognitive Ability: Standard and Supplemental Batteries, Norm Tables, 1989; U.S. Department of Education, Institute of Education Sciences, National Center for Special Education Research, National Longitudinal Transition Study-2 (NLTS2), student assessments, 2002 and 2004.
Table 26. Mean standard score on functional rating scales of youth with mental retardation who could not participate in the direct academic assessment, overall and by parent-reported levels of cognitive functioning
Overall High Moderate Low
Broad independence (overall score) 23 ‡ 30 11 Personal living 42 ‡ 55 27 Motor skills 40 ‡ 53 25 Social interaction and communication 29 ‡ 38 16 Community living 19 ‡ 26 9
‡ Responses for items with fewer than 30 respondents are not reported.
NOTE: Percentages are population estimates based on weighted samples that range from approximately 50 to 560 across variables.
SOURCE: U.S. Department of Education, Institute of Education Sciences, National Center for Special Education Research, National Longitudinal Transition Study-2 (NLTS2), Wave 1 student’s school program survey, 2002
29

moderate and low-functioning students scored highest on the “community living” cluster. Again, the moderate-functioning students’ mean score was significantly higher than the low-functioning students’ mean score (26 percent vs. 9 percent, p < .01).
Summing Up
This fact sheet provides a national picture of the secondary school experiences and academic achievements of students with mental retardation who received special education services under the auspices of school districts at the time they were initially sampled for the study. In addition to the information provided for the overall group of students with mental retardation, this fact sheet uses parent-reported ratings of their child’s cognitive function skills to stratify this information by high, moderate, and low levels of cognitive functioning.
Secondary school students with mental retardation took a range of courses in a given semester, including academic, vocational, and other nonacademic courses, such as study skills. Although courses were taken in both general and special education settings, the overall group of students with mental retardation were significantly more likely to take courses in special education settings than in general education settings. A breakdown by level of functioning revealed that moderate- and low-functioning students were significantly more likely to take at least one class in special education settings compared with high-functioning students with mental retardation.
In general education academic courses, students with mental retardation often experienced a curriculum that was modified to some degree. Compared with their classmates in general education academic classes, students with mental retardation also
experienced differences in the frequency of whole-class instruction and of receiving individual instruction from an adult who was not the teacher. Significant differences also were reported in student participation in general education classroom activities. In particular, students with mental retardation were significantly less likely than their classmates to respond orally to questions or present to the class or group.
When considering differences in the experiences in the general education setting across the parent-reported levels of cognitive functioning, low-functioning students with mental retardation numbered less than 30 and could not be analyzed. However, significant differences were found among moderate- and high-functioning students with mental retardation, with moderate-functioning students being more likely than high-functioning students to take courses in special education settings. Curriculum modification in some form did occur for the majority of moderate-functioning and high-functioning students, though there was no significant difference between the two groups. Furthermore, instructional groupings and participation in general education settings were not significantly different between moderate- and high-functioning students.
In addition to academic subjects in general education settings, students with mental retardation took general education vocational classes. Findings indicated that the majority of students with mental retardation in general education vocational classes experienced the same instructional practices as the class as a whole. Comparisons by level of cognitive functioning revealed no significant difference in instructional experience between moderate- and high-functioning students.
30
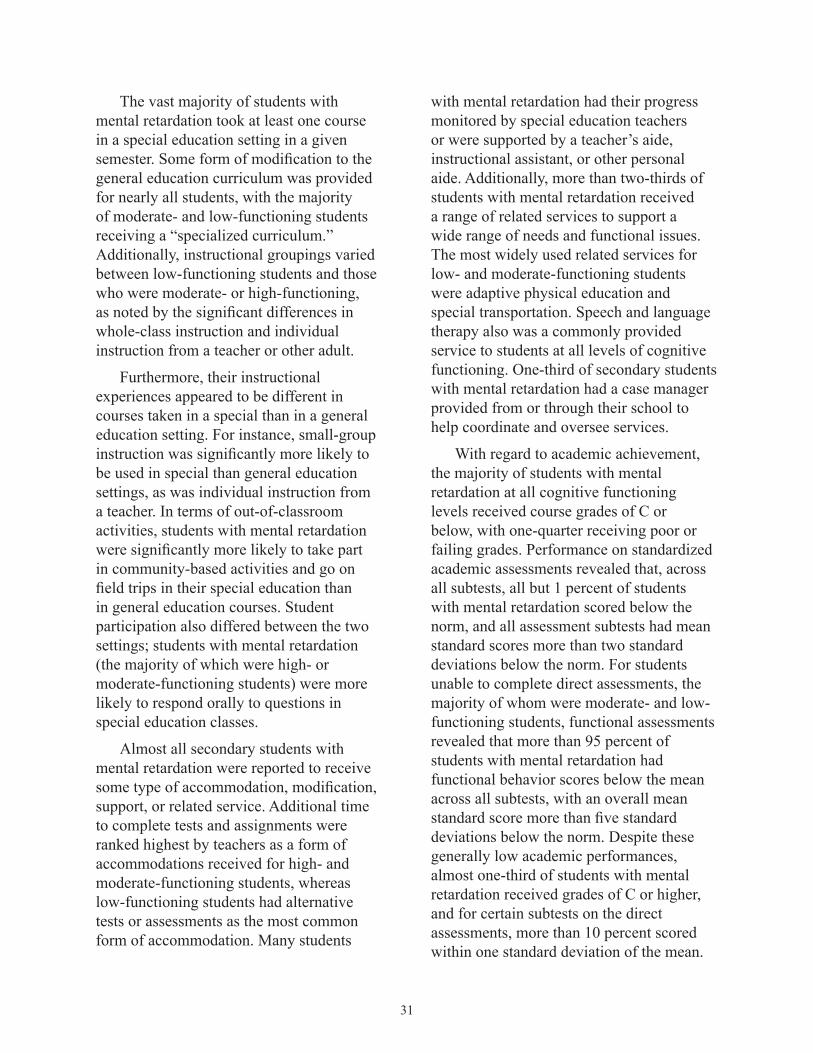
The vast majority of students with mental retardation took at least one course in a special education setting in a given semester. Some form of modification to the general education curriculum was provided for nearly all students, with the majority of moderate- and low-functioning students receiving a “specialized curriculum.” Additionally, instructional groupings varied between low-functioning students and those who were moderate- or high-functioning, as noted by the significant differences in whole-class instruction and individual instruction from a teacher or other adult.
Furthermore, their instructional experiences appeared to be different in courses taken in a special than in a general education setting. For instance, small-group instruction was significantly more likely to be used in special than general education settings, as was individual instruction from a teacher. In terms of out-of-classroom activities, students with mental retardation were significantly more likely to take part in community-based activities and go on field trips in their special education than in general education courses. Student participation also differed between the two settings; students with mental retardation (the majority of which were high- or moderate-functioning students) were more likely to respond orally to questions in special education classes.
Almost all secondary students with mental retardation were reported to receive some type of accommodation, modification, support, or related service. Additional time to complete tests and assignments were ranked highest by teachers as a form of accommodations received for high- and moderate-functioning students, whereas low-functioning students had alternative tests or assessments as the most common form of accommodation. Many students
with mental retardation had their progress monitored by special education teachers or were supported by a teacher’s aide, instructional assistant, or other personal aide. Additionally, more than two-thirds of students with mental retardation received a range of related services to support a wide range of needs and functional issues. The most widely used related services for low- and moderate-functioning students were adaptive physical education and special transportation. Speech and language therapy also was a commonly provided service to students at all levels of cognitive functioning. One-third of secondary students with mental retardation had a case manager provided from or through their school to help coordinate and oversee services.
With regard to academic achievement, the majority of students with mental retardation at all cognitive functioning levels received course grades of C or below, with one-quarter receiving poor or failing grades. Performance on standardized academic assessments revealed that, across all subtests, all but 1 percent of students with mental retardation scored below the norm, and all assessment subtests had mean standard scores more than two standard deviations below the norm. For students unable to complete direct assessments, the majority of whom were moderate- and low-functioning students, functional assessments revealed that more than 95 percent of students with mental retardation had functional behavior scores below the mean across all subtests, with an overall mean standard score more than five standard deviations below the norm. Despite these generally low academic performances, almost one-third of students with mental retardation received grades of C or higher, and for certain subtests on the direct assessments, more than 10 percent scored within one standard deviation of the mean.
31

This is the fourth in a series of NLTS2 fact sheets that focus on the experiences and outcomes of youth in a specific disability category. Previous briefs focused on students with ADHD, learning disabilities, and autism. These and other products from NLTS2 are available at http://www.nlts2.org.
References Bouck, E.C. (2004). State of Curriculum for
Secondary Students With Mild Mental Retardation. Education and Training in Developmental Disabilities, 39:169–176.
Bruininks, R.H., Woodcock, R.W., Weatherman, R.F., and Hill, B.K. (1996). Scales of Independent Behavior–Revised. Chicago: Riverside Publishing.
Conderman, G.J., and Katsiyannis, A. (2002). Instructional Issues and Practices in Secondary Special Education. Remedial and Special Education, 23:169–179.
Freeman, S.F.N., and Alkin, M.C. (2000). Academic and Social Attainments of Children With Mental Retardation in General Education and Special Education Settings. Remedial and Special Education, 21:2–18.
Gresham, F.M., MacMillan, F.M., and Siperstein, G.N. (1995). Critical Analysis of the 1992 AAMR Definition: Implications for School Psychology. School Psychology Quarterly, 10(1): 1–19.
Hughes, C., Copeland, S.R., Wehmeyer, M.L., Agran, M., Cai, X., and Bogseon, H. (2002). Increasing Social Interaction Between General Education High School Students and Their Peers With Mental Retardation. Journal of Developmental and Physical Disabilities, 14:387–402.
Knoblauch, B., and Sorenson, B. (1998). IDEA’s Definition of Disabilities. Arlington, VA: The Council for Exceptional Children (ERIC EC Digest #E560). Retrieved January 20, 2008, from http://www.ericdigests.org/199-4/ideas.htm.
Levine, P., Marder, C., and Wagner, M. (2004). Services and Supports for Secondary School Students With Disabilities. Menlo Park, CA: SRI International. Available at http://www.nlts2.org/ reports/2004_05/index.html.
Lipsky, D.K., and Gartner, A. (1997). Inclusion and School Reform: Transforming America’s Classrooms. Baltimore: Brookes.
Mattson, B. (2001). Related Services. NICHCY News Digest, 16 (2nd ed.). Washington, DC: National Dissemination Center for Children With Disabilities.
Sandler, A.G. (1999). Short-Changed in the Name of Socialization? Acquisition of Functional Skills by Students With Severe Disabilities. Mental Retardation, 37:148–150.
Tindal, G., and Fuchs, L. (2000). A Summary of Research on Test Accommodations: What We Know So Far. Lexington, KY: University of Kentucky, Mid-South Regional Resource Center.
U.S. Department of Education. (2002). Twenty-Fourth Annual Report to Congress on the Implementation of the Individuals With Disabilities Education Act. Washington, DC: Author.
Wagner, M., Marder, C., Levine, P., Cameto, R., Cadwallader, T. W., and Blackorby, J. (with Newman, L., and Cardoso, D.). (2003). The Individual and Household Characteristics of Youth With Disabilities. A Report From the National Longitudinal Transition Study-2 (NLTS2). Menlo Park, CA: SRI International. Available at http://www.nlts2.org/ reports/2003_08/index.html.
Wagner, M., Newman, L., Cameto, R., and Levine, P. (2006). The Academic Achievement and Functional Performance of Youth With Disabilities. A Report From the National Longitudinal Transition Study-2 (NLTS2) (NCSER 2006-3000). Menlo Park, CA: SRI International. Available at http://www.nlts2.org/ reports/2003_07/index/html.
32

Wagner, M., Newman, L., Cameto, R., Levine, P., and Marder, C. (2003). Going to School: Instructional Contexts, Programs, and Participation of Secondary School Students With Disabilities. A Report From the National Longitudinal Transition Study-2 (NLTS2). Menlo Park, CA: SRI International. Available at http://nlts2.org/ reports/2003_12/index.html.
Williamson, P., McLeskey, J., Hoppey, D., and Rentz, T. (2006). Educating Students With Mental Retardation in General Education Classrooms. Exceptional Children, 72:347–361.
Woodcock, R.W., and Mather, N. (1990). WJ-R Tests of Achievement: Examiner’s Manual. In R.W. Woodcock and M.B. Johnson, Woodcock-Johnson Psycho-Educational Battery - Revised. Itasca, IL: Riverside Publishing.
Woodcock, R.W., McGrew, K.S., and Mather, N. (2001). Woodcock-Johnson III Tests of Achievement – Research Edition. Itasca, IL: Riverside Publishing.
www.ed.gov ies.ed.gov
The National Longitudinal Study-2 (NLTS2) has been funded with federal funds from the U.S. Department of Education, Institute of Education Sciences, under contract number ED-01-CO-0003. The content of this publication does not necessarily reflect the views or policies of the U.S. Department of Education nor does mention of trade names, commercial products, or organizations imply endorsement by the U.S. government.
This fact sheet was prepared for the Institute of Education Sciences under Contract No. ED-01-CO-0003. The project officer is Jackie Buckley in the National Center for Special Education Research.
The NLTS2 website—www.nlts2.org—provides access to all NLTS2 reports and data tables.
33