faculty of chemical & energy engineering fluid mechanics...
TRANSCRIPT

LABORATORY MANUAL & INSTRUCTION
1
FACULTY OF CHEMICAL & ENERGY
ENGINEERING
FLUID MECHANICS LABORATORY
TITLE OF EXPERIMENT: MAJOR LOSSES IN
PIPE (E3)
1.0 Objective
LABORATORY MANUAL & INSTRUCTION
2
The objective of this experiment is to determine pipe friction factors and resistance
coefficients.
2.0 Introduction
In these experiments, the pressure loss, or the head loss, for a flow subject to
friction will be determined experimentally. With turbulent pipe flow, where the flow is
considered steady at Reynolds’ numbers of Re > 2320, pressure loss is proportional to the
1. Length, of the pipe
2. Coefficient of pipe friction,
3. Density, of flowing medium,
4. Square of the flow speed .
3.0 Theory
It is important to note that the pressure loss increases as the pipe diameter reduces. It is
calculated as follows
(Eq. 1)
The associated head loss is calculated as follows
(Eq. 2)
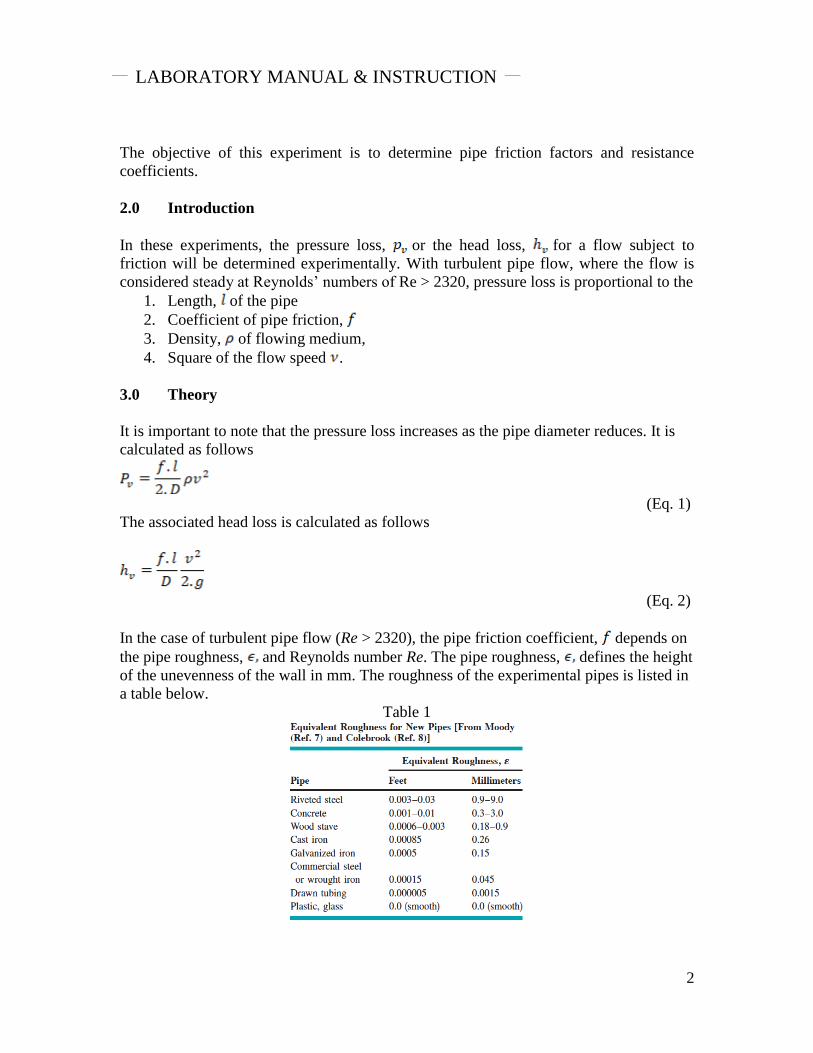
In the case of turbulent pipe flow (Re > 2320), the pipe friction coefficient, depends on
the pipe roughness, and Reynolds number Re. The pipe roughness, defines the height
of the unevenness of the wall in mm. The roughness of the experimental pipes is listed in
a table below.
Table 1
LABORATORY MANUAL & INSTRUCTION
3
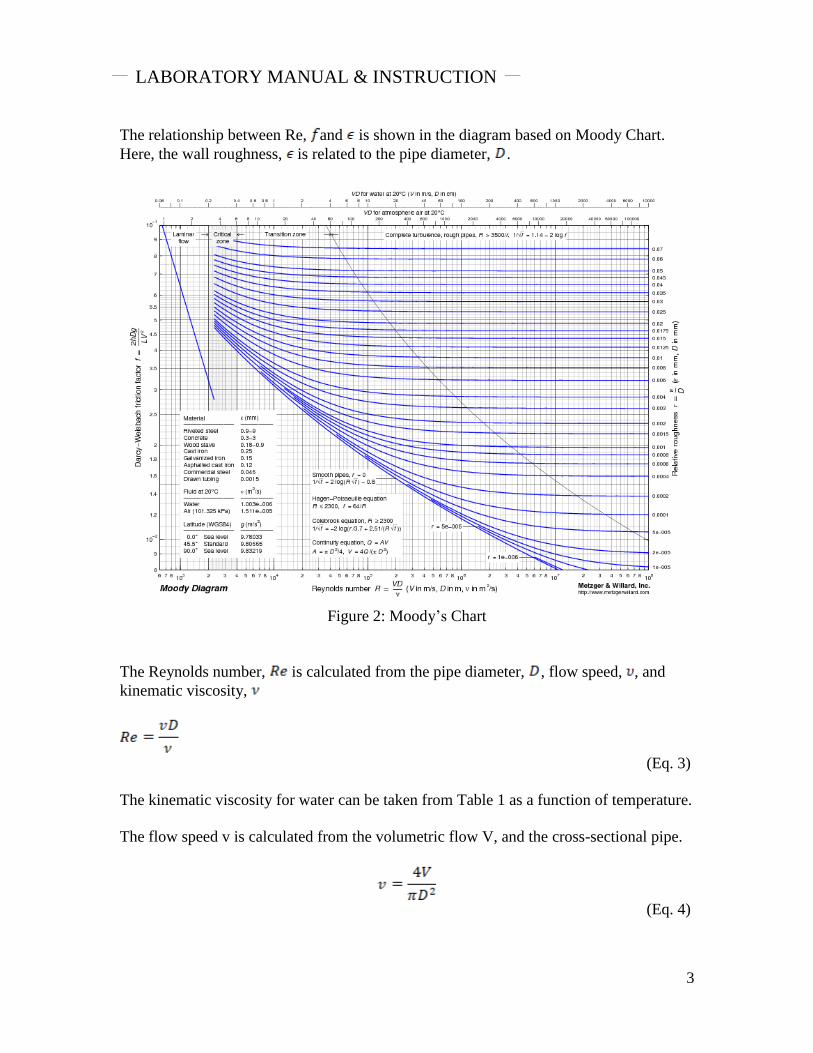
The relationship between Re, and is shown in the diagram based on Moody Chart.
Here, the wall roughness, is related to the pipe diameter, .
Figure 2: Moody’s Chart
The Reynolds number, is calculated from the pipe diameter, , flow speed, , and
kinematic viscosity,
(Eq. 3)
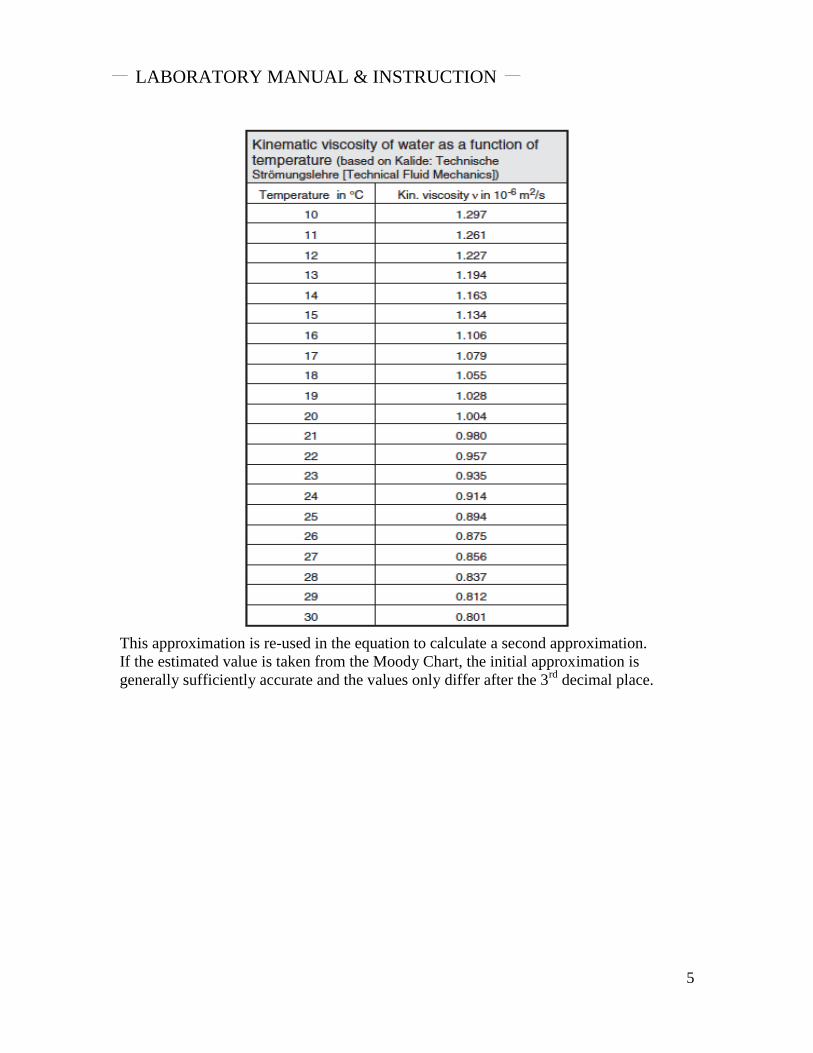
The kinematic viscosity for water can be taken from Table 1 as a function of temperature.
The flow speed v is calculated from the volumetric flow V, and the cross-sectional pipe.
(Eq. 4)
LABORATORY MANUAL & INSTRUCTION
4
For hydraulically smooth pipes (Re<65 ) and a Reynolds number in the range of
2320<Re<100,000 the pipe friction coefficient is calculated using the Blassius formula
(Eq. 5)
For pipes in the transition range to rough pipes (65 d/k < Re < 1300 d/k), the range below
the limit curve in the diagram) the pipe friction coefficient is calculated according to
Colebrook
(Eq. 6)
or Moody’s formula
(Eq. 7)
It is an implicit formula that has to be iteratively resolved. First of all estimate , place it
in the formula and calculate an initial approximation.
Table 1: Kinematic viscosity of water as a function of temperature.
LABORATORY MANUAL & INSTRUCTION
5
This approximation is re-used in the equation to calculate a second approximation.
If the estimated value is taken from the Moody Chart, the initial approximation is
generally sufficiently accurate and the values only differ after the 3rd
decimal place.
LABORATORY MANUAL & INSTRUCTION
6
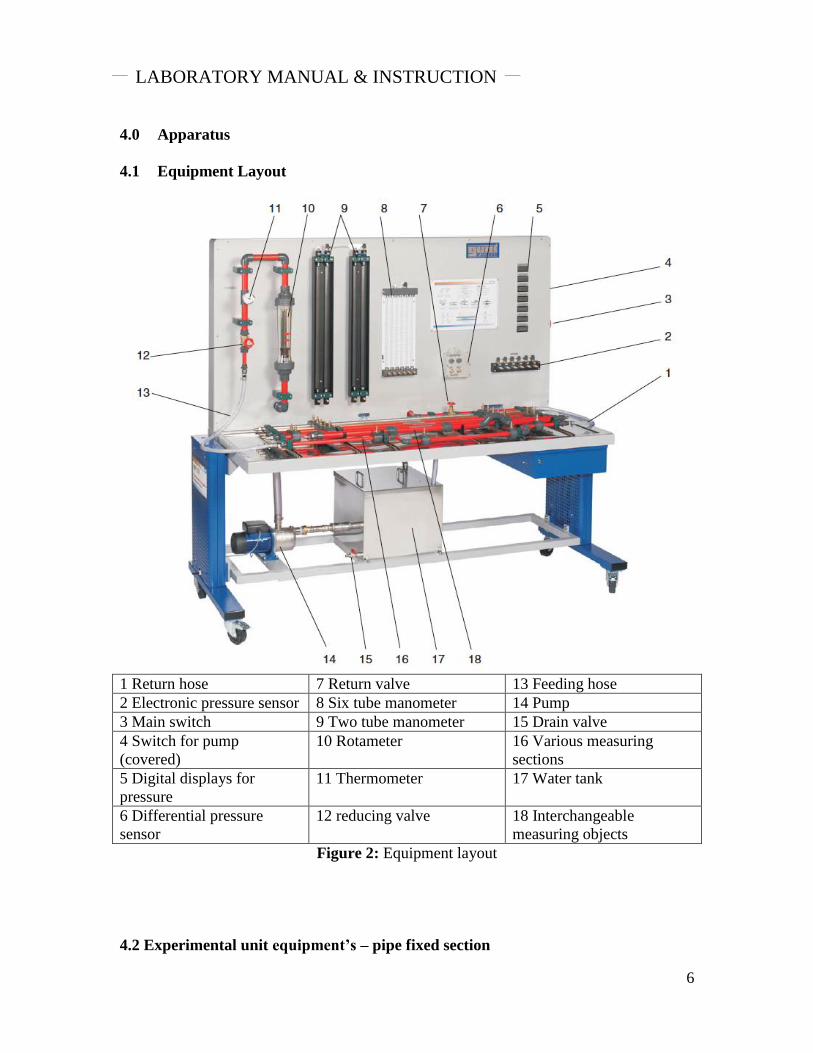
4.0 Apparatus
4.1 Equipment Layout
1 Return hose 7 Return valve 13 Feeding hose
2 Electronic pressure sensor 8 Six tube manometer 14 Pump
3 Main switch 9 Two tube manometer 15 Drain valve
4 Switch for pump
(covered)
10 Rotameter 16 Various measuring
sections
5 Digital displays for
pressure
11 Thermometer 17 Water tank
6 Differential pressure
sensor
12 reducing valve 18 Interchangeable
measuring objects
Figure 2: Equipment layout
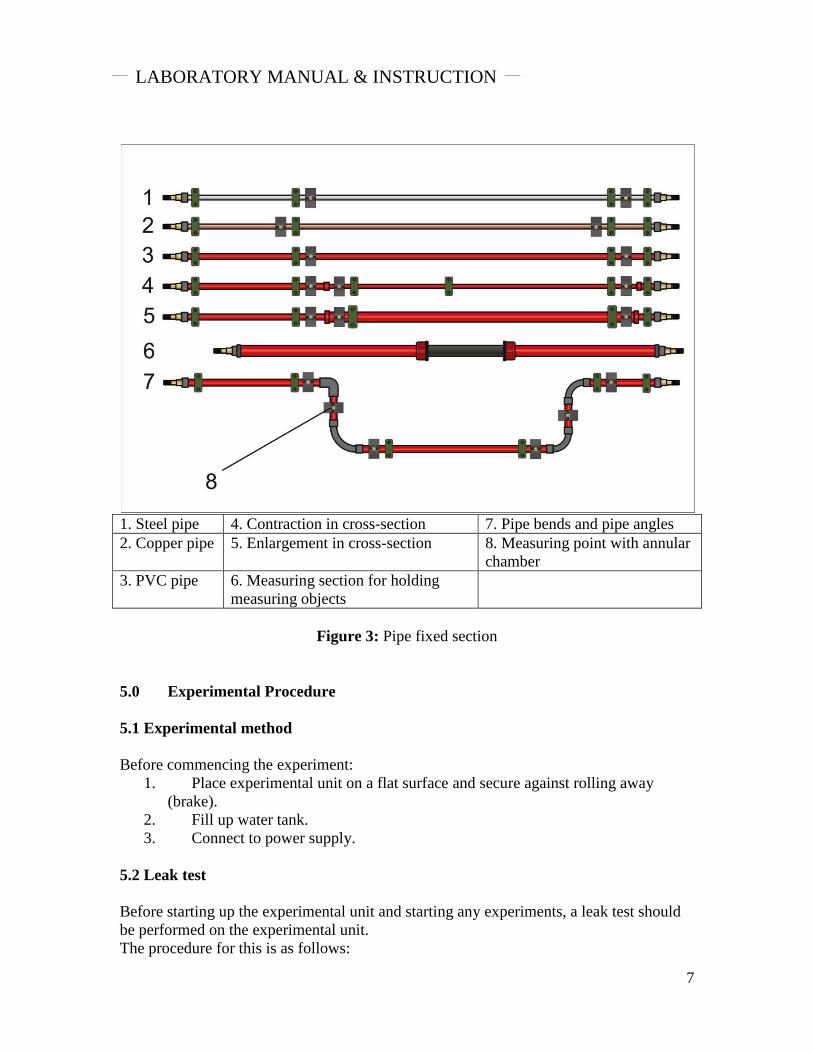
4.2 Experimental unit equipment’s – pipe fixed section
LABORATORY MANUAL & INSTRUCTION
7
1. Steel pipe 4. Contraction in cross-section 7. Pipe bends and pipe angles
2. Copper pipe 5. Enlargement in cross-section 8. Measuring point with annular
chamber
3. PVC pipe 6. Measuring section for holding
measuring objects
Figure 3: Pipe fixed section
5.0 Experimental Procedure
5.1 Experimental method
Before commencing the experiment:
1. Place experimental unit on a flat surface and secure against rolling away
(brake).
2. Fill up water tank.
3. Connect to power supply.
5.2 Leak test
Before starting up the experimental unit and starting any experiments, a leak test should
be performed on the experimental unit.
The procedure for this is as follows:
LABORATORY MANUAL & INSTRUCTION
8
1. Check tightness of self-closing measuring glands and remove possible particles
2. Connect pipe section to feeding and return hose.
3. Open return valve.
4. Switch on pump.
5. Slowly open reducing valve and bleed pipe section.
6. Slowly increase pressure by closing the return valve.
7. Check all lines, hoses and connections for leaks.
8. Repeat procedure for all pipe sections.
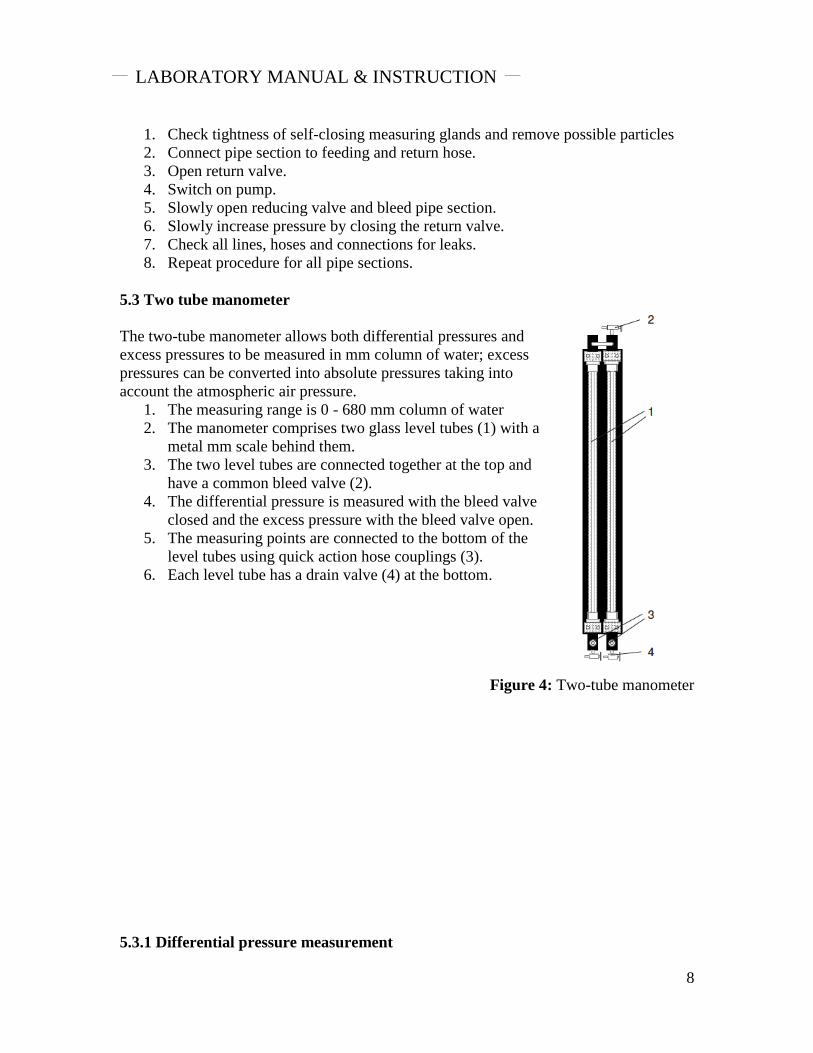
5.3 Two tube manometer
The two-tube manometer allows both differential pressures and
excess pressures to be measured in mm column of water; excess
pressures can be converted into absolute pressures taking into
account the atmospheric air pressure.
1. The measuring range is 0 - 680 mm column of water
2. The manometer comprises two glass level tubes (1) with a
metal mm scale behind them.
3. The two level tubes are connected together at the top and
have a common bleed valve (2).
4. The differential pressure is measured with the bleed valve
closed and the excess pressure with the bleed valve open.
5. The measuring points are connected to the bottom of the
level tubes using quick action hose couplings (3).
6. Each level tube has a drain valve (4) at the bottom.
Figure 4: Two-tube manometer
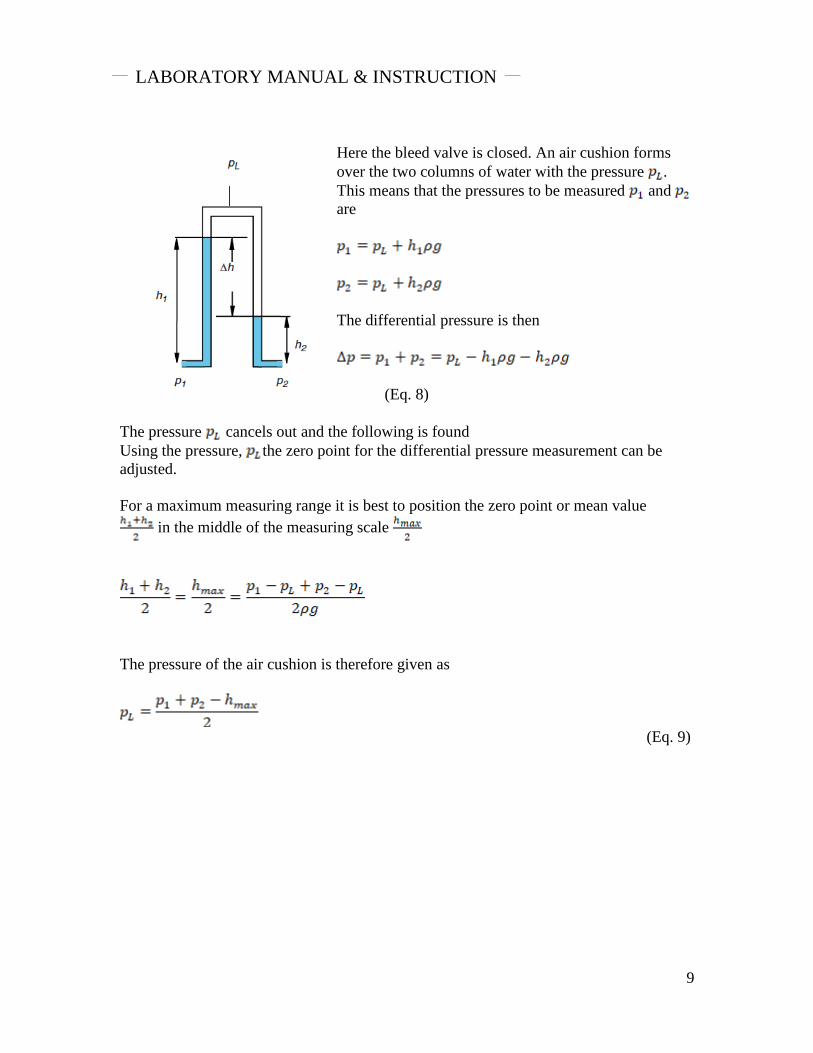
5.3.1 Differential pressure measurement
LABORATORY MANUAL & INSTRUCTION
9
Here the bleed valve is closed. An air cushion forms
over the two columns of water with the pressure .
This means that the pressures to be measured and
are
The differential pressure is then
(Eq. 8)
The pressure cancels out and the following is found
Using the pressure, the zero point for the differential pressure measurement can be
adjusted.
For a maximum measuring range it is best to position the zero point or mean value
in the middle of the measuring scale
The pressure of the air cushion is therefore given as
(Eq. 9)
LABORATORY MANUAL & INSTRUCTION
10
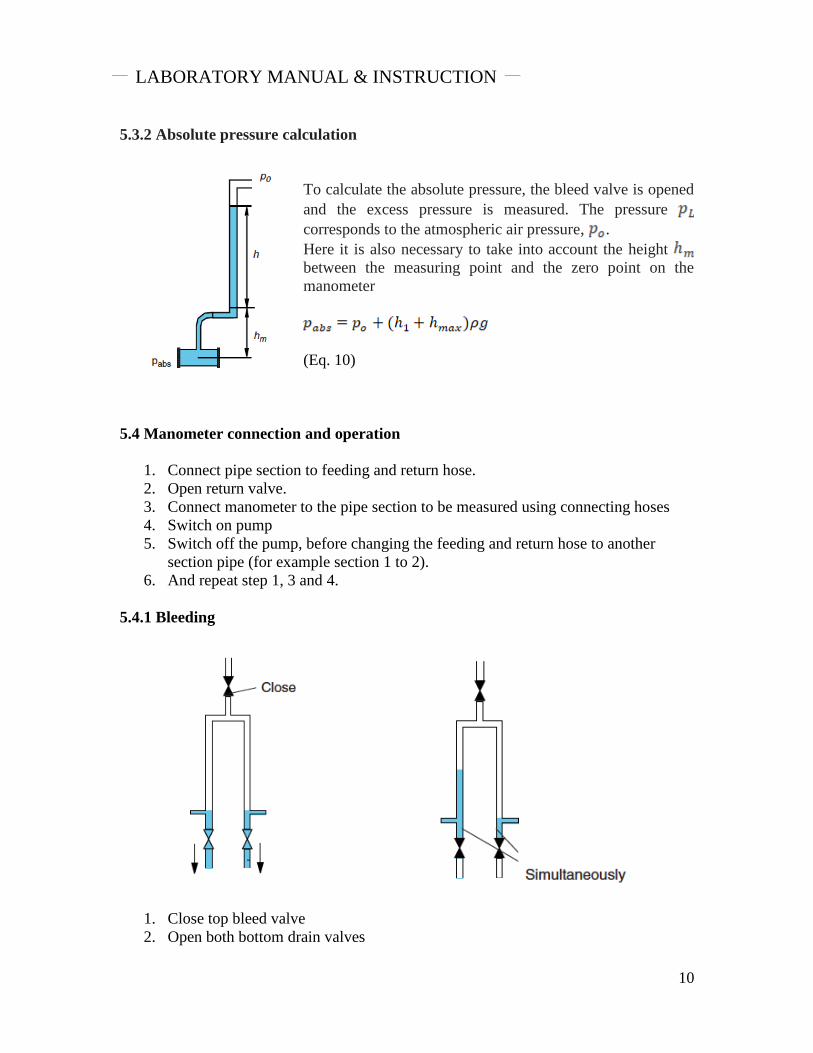
5.3.2 Absolute pressure calculation
To calculate the absolute pressure, the bleed valve is opened
and the excess pressure is measured. The pressure
corresponds to the atmospheric air pressure, .
Here it is also necessary to take into account the height
between the measuring point and the zero point on the
manometer
(Eq. 10)
5.4 Manometer connection and operation
1. Connect pipe section to feeding and return hose.
2. Open return valve.
3. Connect manometer to the pipe section to be measured using connecting hoses
4. Switch on pump
5. Switch off the pump, before changing the feeding and return hose to another
section pipe (for example section 1 to 2).
6. And repeat step 1, 3 and 4.
5.4.1 Bleeding
1. Close top bleed valve
2. Open both bottom drain valves
LABORATORY MANUAL & INSTRUCTION
11
3. Slowly open the reducing valve in the inlet of the pipe section to be measured
Pipe section and connecting hoses are bled by the powerful flow of water.
When no more air bubbles are visible in the connecting hoses:
1. Close return valve
2. Slowly close both bottom drain valves simultaneously. Ensure that both columns
of water rise evenly and that there is no overflow between the level tubes.
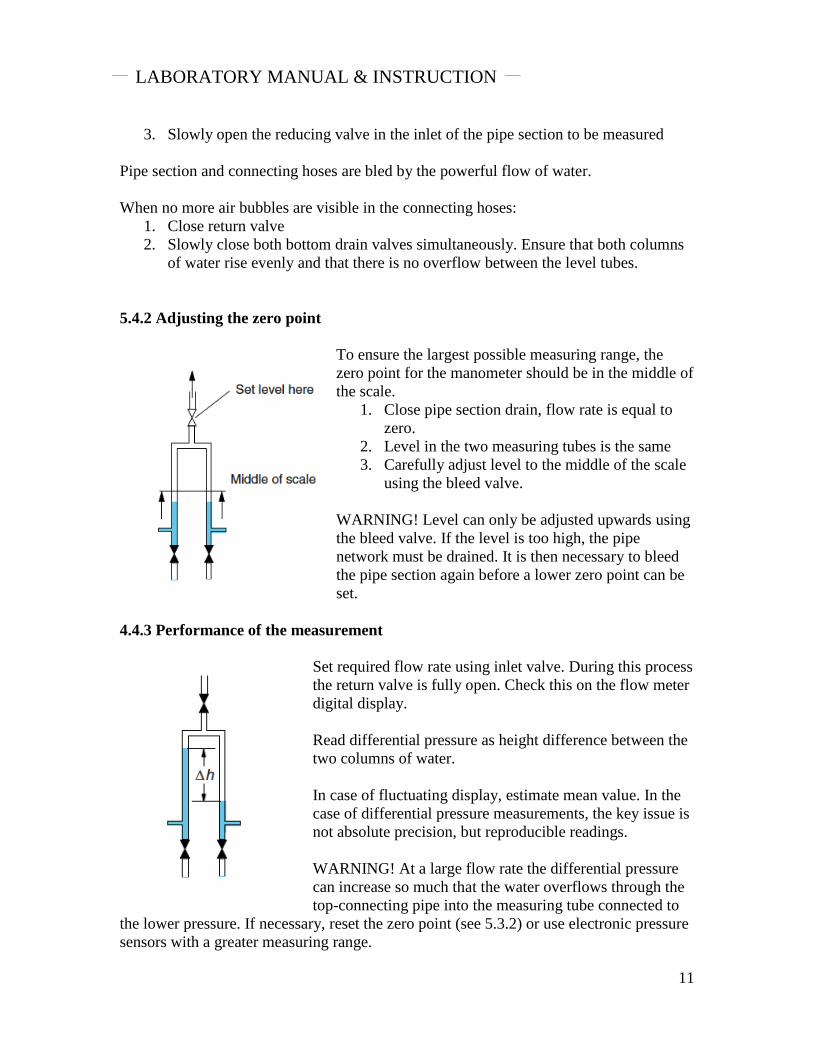
5.4.2 Adjusting the zero point
To ensure the largest possible measuring range, the
zero point for the manometer should be in the middle of
the scale.
1. Close pipe section drain, flow rate is equal to
zero.
2. Level in the two measuring tubes is the same
3. Carefully adjust level to the middle of the scale
using the bleed valve.
WARNING! Level can only be adjusted upwards using
the bleed valve. If the level is too high, the pipe
network must be drained. It is then necessary to bleed
the pipe section again before a lower zero point can be
set.
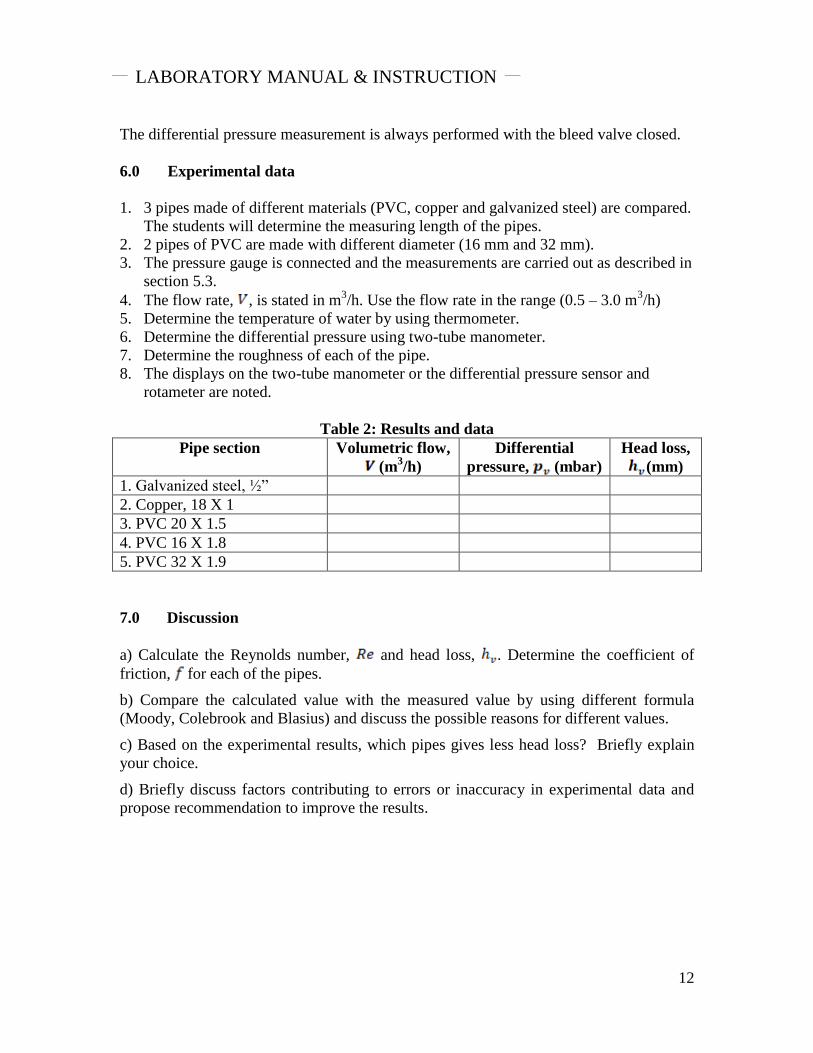
4.4.3 Performance of the measurement
Set required flow rate using inlet valve. During this process
the return valve is fully open. Check this on the flow meter
digital display.
Read differential pressure as height difference between the
two columns of water.
In case of fluctuating display, estimate mean value. In the
case of differential pressure measurements, the key issue is
not absolute precision, but reproducible readings.
WARNING! At a large flow rate the differential pressure
can increase so much that the water overflows through the
top-connecting pipe into the measuring tube connected to
the lower pressure. If necessary, reset the zero point (see 5.3.2) or use electronic pressure
sensors with a greater measuring range.
LABORATORY MANUAL & INSTRUCTION
12
The differential pressure measurement is always performed with the bleed valve closed.
6.0 Experimental data
1. 3 pipes made of different materials (PVC, copper and galvanized steel) are compared.
The students will determine the measuring length of the pipes.
2. 2 pipes of PVC are made with different diameter (16 mm and 32 mm).
3. The pressure gauge is connected and the measurements are carried out as described in
section 5.3.
4. The flow rate, , is stated in m3/h. Use the flow rate in the range (0.5 – 3.0 m
3/h)
5. Determine the temperature of water by using thermometer.
6. Determine the differential pressure using two-tube manometer.
7. Determine the roughness of each of the pipe.
8. The displays on the two-tube manometer or the differential pressure sensor and
rotameter are noted.
Table 2: Results and data
Pipe section Volumetric flow,
(m3/h)
Differential
pressure, (mbar)
Head loss,
(mm)
1. Galvanized steel, ½”
2. Copper, 18 X 1
3. PVC 20 X 1.5
4. PVC 16 X 1.8
5. PVC 32 X 1.9
7.0 Discussion
a) Calculate the Reynolds number, and head loss, . Determine the coefficient of
friction, for each of the pipes.
b) Compare the calculated value with the measured value by using different formula
(Moody, Colebrook and Blasius) and discuss the possible reasons for different values.
c) Based on the experimental results, which pipes gives less head loss? Briefly explain
your choice.
d) Briefly discuss factors contributing to errors or inaccuracy in experimental data and
propose recommendation to improve the results.