faculty of economics & management, kanazawa university
TRANSCRIPT
1
Faculty of Economics & Management, Kanazawa University
Discussion Paper Series 19
Two Monetary Unions in West Africa observed
from a viewpoint of Real Effective Exchange Rates:
1999-2008
Toyomu MASAKI
February, 2013
(This paper was completed in October 2010)
2
Two Monetary Unions in West Africa observed from a viewpoint of Real Effective
Exchange Rates:1999-2008†
Toyomu MASAKI‡
Abstract
West Africa has two economic integrations—West African Economic and
Monetary Union (WAEMU) and Economic Community of West African Countries
(ECOWAS). WAEMU is composed of eight countries and has issued a unique legal
tender, the CFA franc, while ECOWAS is a wider economic integration of 15
countries, including all WAEMU member countries. It aims to develop itself into a
monetary integration and custom union.
In this paper, we begin by calculating the monthly real effective exchange rate
(REER), nominal effective exchange rate (NEER), and effective relative price index
(ERPI) for 13 West African countries for the period 1999–2008, using consumer
prices and trade weights to reflect their trade partners’ shift over time. We then
analyse the fluctuations of these series and find that WAEMU members tend to be
more stable than non-WAEMU members. Against our expectations, the REER of
WAEMU member countries did not appreciate, even though the euro, to which the
CFA franc was pegged, appreciated against the US dollar by around 40% during the
same period. Finally, we test whether the PPP theory holds in this context and find
that it tends to hold for WAEMU members rather than for other countries with
more flexible exchange rate systems.
JEL Classification :F31, F33,O11,O55
Keywaords: West Africa, Real Effective Exchange Rates, Monetary Union
† The author owe debts of gratitude for help and support to Ms. Makiko ANEZAKI
(Kanazawa University) for the calculation of several indices used in this article ‡ School of Economics, Kanazawa University, Kakuma, Kanazawa, Japan,
Email:[email protected]
3
1. Introduction
In West Africa, there are two economic integrations—West African Economic
and Monetary Union i (WAEMU) and Economic Community of West African
Countries (ECOWAS). Established in January 1994, WAEMU is composed of the
following eight countries: Burkina Faso, Benin, Cote d’Ivoire, Niger, Mali, Senegal,
Togo, and Guinea-Bissau. All of these countries are also members of the West
African Monetary Union (WAMUii), which was formed in 1962 and revised in 1974,
and was responsible for issuing a unique legal tender, the CFA franc (Communauté
Financière Africaine franc)iii. The CFA franc was issued by WAMU through the
regional central bank BCEAO (Banque Centrale d’États d’Afrique de l’Ouest). When
WAEMU was created, it was designed to be a body that would eventually subsume
and replace WAMUiv. Despite this, both bodies still exist; WAMU has yet to be
entirely replaced by WAEMU. In this paper, for the purpose of avoiding confusion,
we use WAEMU when we refer to the economic integration comprised of these eight
countries, except in contexts related to the monetary union.
[Figure 1 here]
4
ECOWAS is a wider economic integration composed of 15 countries, including all
the members of WAEMU. ECOWAS aims to develop itself into a monetary
integration as well as a custom union. As part of this plan, in 2000, ECOWAS
proposed to establish a new common currency named ‘ECO’, which would be used
across all ECOWAS countries, including those in WAEMU. In concrete terms, the
plan was to be rolled out in two phases: first, the establishment of a second
monetary zone among non-WAEMU countries, and second, the merging of WAMZ
and WAMU. In April 2000, seven countries (Cape Verde, the Gambia, Ghana,
Guinea, Liberia, Nigeria, and Sierra Leone) signed the Accra Declaration seeking to
establish the Second Monetary Zone in West Africa. However, Liberia and Cape
Verde decided to become observers and only the remaining five countries signed the
Bamako Accord in December 2000, which indicated the concrete institutional and
legal framework of the West African Monetary Zone (WAMZ) and the West African
Monetary Institute (WAMI).
WAMZ aimed to launch a unique currency as well as a central bank by the end of
2003 and merge with WAMU by 2004. However, the members are facing difficulties
in clearing the required convergence criteria, and the Authority of Heads of State

5
and the government of the WAMZ thrice decided to postpone its introduction. In
recent years, a new push has been witnessed. On 16 February 2010, Liberia acceded
to the membership of WAMZ, and the ECO is scheduled to be launched by 2015 and
to replace the CFA Franc of WAMU by 2020. However, this proposed merger also
faces obstacles because of the particularity of the institution of WAMU, which is
detailed below.
Despite the introduction of the euro in 1999, the WAMU treaty is based around
the following four principles: First, the parity of the CFA franc to the French franc
(the euro after 1 January 1999) is fixed. Second, the unlimited convertibility of the
CFA franc to the French franc/euro is guaranteed by the French government. Third,
in return for this guarantee, the BCEAO must pool 50% (the rate was 65% until
September 2005) of its external reserves in a special operation account called
compte d’opération, which has been opened at the French Treasury. Fourth, in
principle, no capital control between France and WAMU countries is guaranteed,
while CFA franc notes outside the region have not been repurchased by the Central
Bank since 1993. In other words, the institution of WAMU is viable only because of
the intervention of the French Treasury. After the proposed mergers, African
countries will have to choose between two courses: establish real economic

6
independence of WAMU members from the former colonial power France or admit
WAMZ countries to participate in this special operation account opened at the
French Treasury.
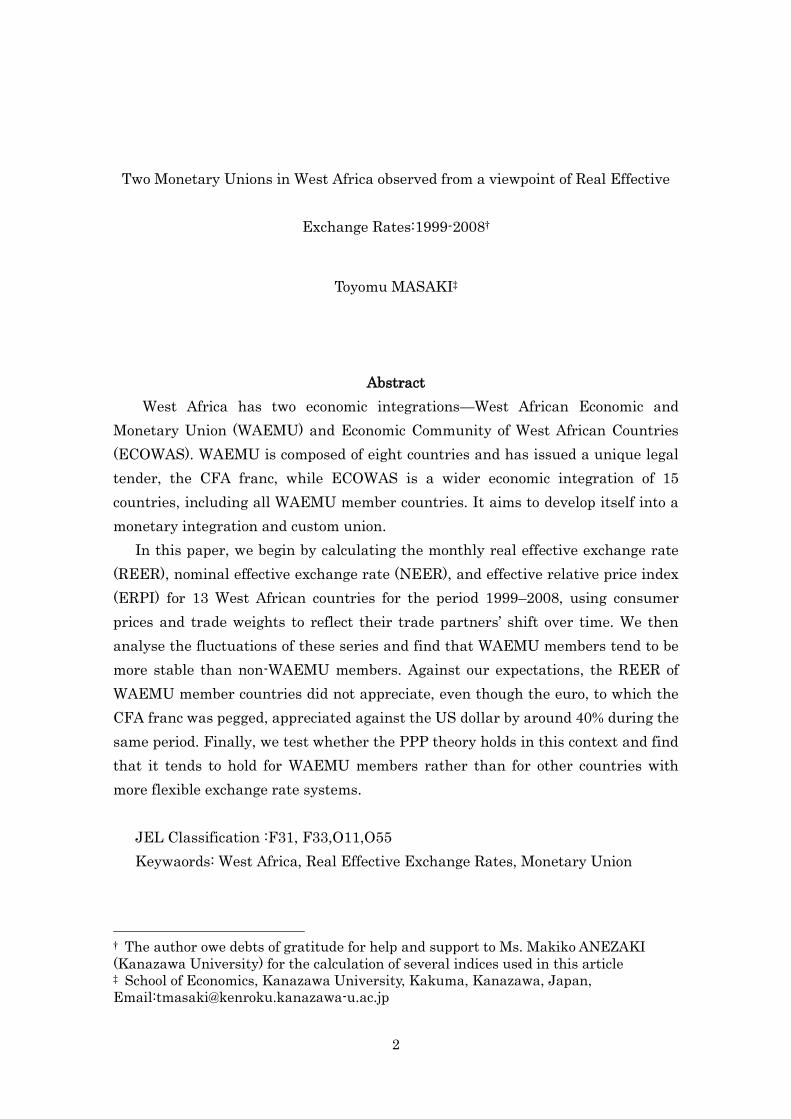
[Figure 2 here]
Under this uncommon system, the value of the CFA franc has been relatively
stable compared to other African currencies. Over a period of 60 years, from 1948 to
2010, it has been devaluated only once, by 50%, on 11 January 1994. Since then, the
parity of the CFA Franc has been adjusted to 100 CFAF/FF, and, since the
introduction of the euro in January 1999, the CFA franc has been fixed at the rate of
655.957CFAF/euro, because the French franc was pegged at a rate of 6.55957
FF/euro. However, the value of the euro appreciated between July 2001 and August
2008, and the reduced price competitiveness of WAEMU members in the world
market has been a concern.
Figure 2 shows how the value of the US dollar has been related to the value of
each of the currencies of West African countries between 1999 and 2008. As the
West African currencies appreciate, the line moves higher up the figure. The figure
7
clearly shows that over the period of 1999–2008, the CFA franc and the Cape Verde
escudo, which are both pegged to the euro, appreciated against the US dollar, while
the other currencies depreciated on a grand scale.
In this study, we first calculate the real effective exchange rate (REER) from
1999 to 2008 for the following 13 countries in West Africa: Benin (BE), Burkina
Faso (BF), Côte d’Ivoire (CI), Guinea Bissau (GB), Mali (ML), Niger (NI), Senegal
(SE), Togo (TO), Nigeria (NI), Ghana (GH), Guinea (GU), the Gambia (GA), and
Cape Verde (CV). We exclude Liberia and Sierra Leone from our data set because of
their economic instability in the period leading up to the early 2000s, due to their
civil conflicts. The REER indicates transitions in the competitiveness of a country. A
trend appreciation of the REER is considered to represent an unfavourable trend for
export growth, while it indicates that imports are promoted. Both incur the risk of
restraining the development of their industrial sectors. The REER is obtained by
adjusting the nominal effective exchange rate (NEER) for relative prices between
the home country and its trade partners. The NEER is a weighted average of major
bilateral nominal exchange rates, with weights based on trade shares.
Next, we break down the REER into two factors—the NEER and the effective
relative price index (ERPI)—in order to examine the factors of each REER transition.

8
In the third stage of our investigation, we test whether the purchasing power
parity (PPP) theory holds for the above West African countries and examine whether
the result varies between countries with a fixed exchange rate and those without.
2. Some discussions concerning the calculation of the REER
The REER is used to measure international price and cost competitiveness. The
International Monetary Fund (IMF) periodically releases the REERs of most of its
members through the International Financial Statistics (IFS), which are based on
the IMF’s Information Notice System. This system came into existence in 1983 to
facilitate surveillance of the exchange rate policy of Fund members (see Zanello and
Desruelle, 1997). The REER is obtained by adjusting the NEER for inflation
differentials with important trade partners. The NEER is a weighted average of
major bilateral nominal exchange rates, with weights based on the trade shares
reflecting the relative importance of each country. Therefore, the choice of trade
weights and price series is critical when calculating the REER as well as the NEER.
With regard to weights, Golub and Ceglowski (2002) propose the following six
weighting schemes: total export plus imports, manufactured exports plus imports,
total exports, total imports, manufactured exports, and manufactured imports. In
9
this study, we focus on West African countries, which are among the less
industrialised countries. Therefore, our alternatives are restricted to the following
three: total export plus imports, total exports, or total imports.
In general, the export partners of developing countries are not identical to their
import partners, which accounts for the difference of transition between
export-based and import-based REERs. South African REERs, which were
calculated by Golub and Ceglowski (2002) using six alternative weights, show that
there is surprisingly little variation in REERs when weights vary. Edwards (1989)
also concludes that the choice of countries as trading partners may have little
impact on the REER of a country (p.126). However, as we calculated in a previous
work with regard to the REERs of eight WAEMU countries, import-based REERs
exhibited significantly different trends from those of export-weighted REERs.
On this subject, research undertaken by prominent specialists for West African
countries, Jeanneney and Parire (1991), indicates that the validity of using export
data as a basis for trade weights is questionable; this is because most developing
countries export mainly primary products to large international markets, using a
few large international companies as intermediaries. Therefore, Jeanneney et al.
support the use of total import data for calculating trade weights. On the other
10
hand, Opoku (2002) finds that export-based REERs are advantageous for
developing countries whose export products are dominated by primary commodities
because, in this situation, prices are determined by the international market.
In reality the destinations of exported goods from West African countries are
very diverse, as Appendix I indicates. Moreover, to garner an understanding of the
competition among the studied countries in the foreign market, we should consider
the impact of not only a country’s import partners but also its export partners on the
country’s REER. Indeed, despite the fact that their weighting scheme is laborious,
the IMF’s REER indices are treated as standard import and export weights (see
Zanello and Desruelle, 1997).
Second, the use of fixed weights or changing weights has also been argued as an
effective means of calculating the REER. In general, when calculating the REER,
the trade weight is fixed over a period of time—for example, one year or an average
of a few sample years. However, in today’s globalised reality, trade partners are not
fixed but rather shift drastically. Therefore, we try to obtain a REER that reflects
this shift in trade partners by calculating it under some restricted condition.
In terms of price indices, Golub and Ceglowski (2002) also suggest the following
six alternatives: the consumer price index (CPI), the wholesale price index (WPI),
11
GDP deflators, export unit value, import unit value, and unit labour costs in
manufacturing. In general, the CPI is not considered to be a very suitable index for
calculating the REER because it is affected by the prices of non-traded goods. Golub
and Ceglowski (2002) explain this disadvantage in more detail as follows. First,
CPIs may be distorted by price controls and excise taxes. Second, CPIs may not
accurately reflect the prices of intermediate goods, which have become an
increasingly important part of manufacturing trades. Third, a relative decline in
the CPI associated with ‘pricing to market’ may not signify an improvement in
competitiveness but rather a temporary reduction in profit margins. Fourth, CPIs
are endogenous to the exchange rate because currency depreciation raises import
prices and pushes up the CPI. However, CPIs are considered to have some
advantages over WPIs and GDP deflators, particularly the fact that they are
available on a timely basis.
Golub and Ceglowski (2002) also indicate relative export and/or import unit
values excluding non-traded goods instead of the CPI. However, according to them,
this method has the following disadvantages: first, they may be heavily influenced
by short-run pricing to market and they are not exogenous to the exchange rate;
second, they may be heavily weighted by the prices of primary products and thus
12
fail to reflect the endogenous effects of international competitiveness on the
composition of goods that are exported and imported; third, for many countries, unit
value data are not available on a timely basis.
Since the 1990s, REERs based on unit labour costs in manufacturing
(REER-ULCs) have become recognized as the best single indicator, especially for
developed countries (Turner and Van’t Dack, 1993). These weights are computed for
trade in manufactured goods, taking into account competition between imports and
locally-produced import-substitution goods, competition between a country’s own
exports and locally produced foreign goods, and competition between local exports
and the exports of other countries in third markets (Zanello and Desruelle, 1997). In
the manufacturing sector, unit labour costs are calculated by dividing labour costs
by output per worker. The IMF regularly calculates the REER-ULC for 21
industrial countries and 23 newly industrialized, developing, and transition
countries (Turner and Golub, 1997). However, not only do these weights not have
important significance for non-industrial countries, there is also the challenge that
REER- ULCs are not available on as timely a basis as CPIs.
As mentioned above, several types of REER exist, and this means that there is
some difficulty in choosing which indices are most appropriate. Each set of indices

13
has some shortcomings, and those indices that are less deviated cannot be obtained
by simple calculation. There is an overwhelming difficulty with investigating this
issue for developing countries because the research is limited by insufficient data
availability and accuracy. Therefore, the appropriate method should be selected
bearing in mind the purpose of the research and by acknowledging and addressing
each shortcoming. The REER-CPIs of the following West African countries are
obtained from the IFS: Côte d’Ivoire, Togo, Nigeria, Ghana, the Gambia, and Sierra
Leone. However, the IMF does not publish the REER of other West African
countries.
Our main investigation focuses on comparing the REERs of different West
African countries, each of which is derived using an identical method. We then use
this data to assess whether or not the planned monetary union is appropriate. For
instance, if the REERs of those WAEMU members that share a unique currency are
found to be divergent, then it follows that this monetary union might burden the
members. On the other hand, the comparisons between the REERs of WAEMU
members and those of their neighbours whose exchange rates are depreciating could
indicate whether or not the new monetary integration under consideration since
2000 is realizable.
14
3. Methodological overview
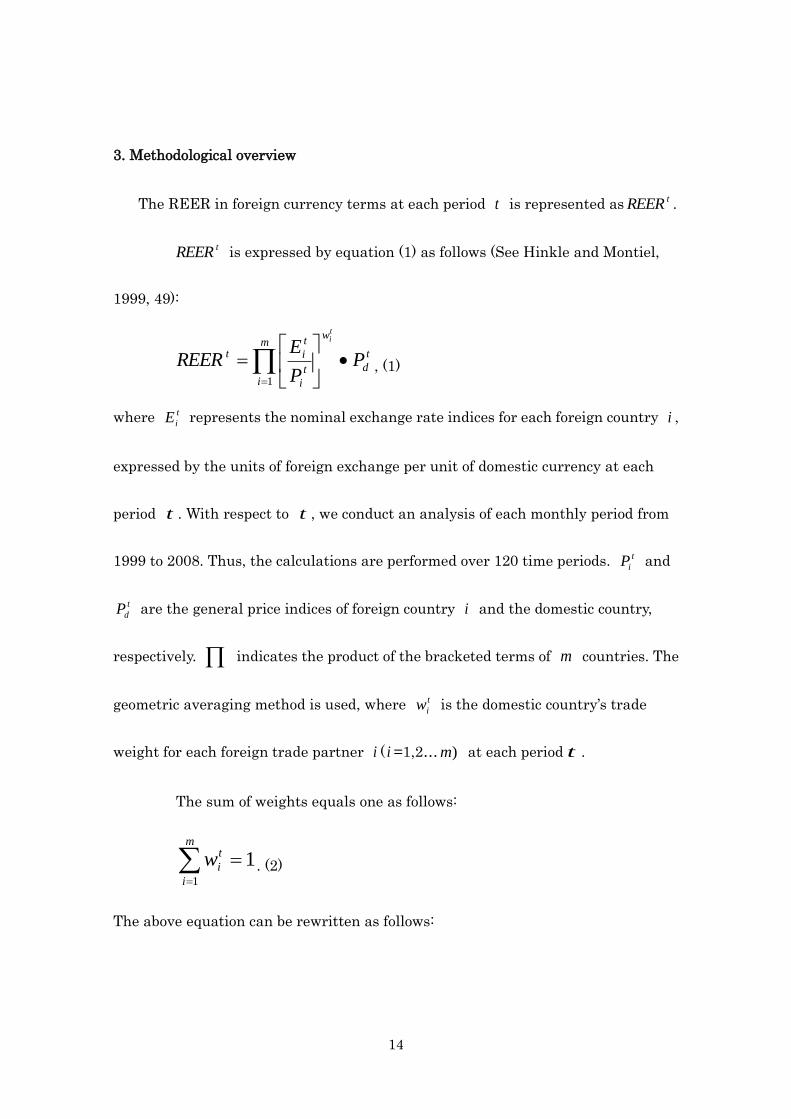
The REER in foreign currency terms at each period t is represented astREER .
tREER is expressed by equation (1) as follows (See Hinkle and Montiel,
1999, 49):
t
d
wm
it
i
t
it PP
EREER
ti
1
, (1)
where t
iE represents the nominal exchange rate indices for each foreign country i ,
expressed by the units of foreign exchange per unit of domestic currency at each
period t . With respect to t , we conduct an analysis of each monthly period from
1999 to 2008. Thus, the calculations are performed over 120 time periods. t
iP and
t
dP are the general price indices of foreign country i and the domestic country,
respectively. indicates the product of the bracketed terms of m countries. The
geometric averaging method is used, where t
iw is the domestic country’s trade
weight for each foreign trade partner i ( i =1,2… )m at each period t .
The sum of weights equals one as follows:
11
m
i
t
iw . (2)
The above equation can be rewritten as follows:
15
t
dP
m
i
wt
d
ti
P1
. (3)
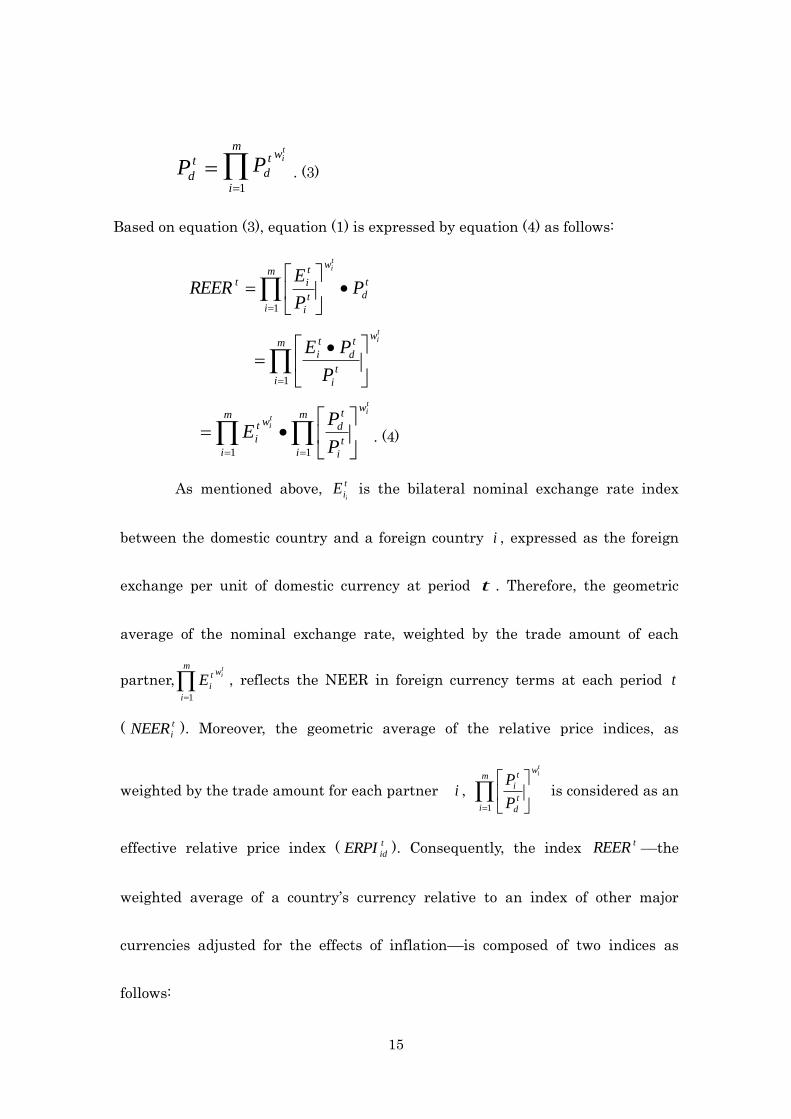
Based on equation (3), equation (1) is expressed by equation (4) as follows:
t
d
wm
it
i
t
it PP
EREER
ti
1
tiw
m
it
i
t
d
t
i
P
PE
1
ti
ti
wm
it
i
t
dm
i
wt
iP
PE
11
. (4)
As mentioned above, t
iiE is the bilateral nominal exchange rate index
between the domestic country and a foreign country i , expressed as the foreign
exchange per unit of domestic currency at period t . Therefore, the geometric
average of the nominal exchange rate, weighted by the trade amount of each
partner,
m
i
wt
i
ti
E1
, reflects the NEER in foreign currency terms at each period t
( t
iNEER ). Moreover, the geometric average of the relative price indices, as
weighted by the trade amount for each partner i ,
tiw
m
it
d
t
i
P
P
1
is considered as an
effective relative price index (t
idERPI ). Consequently, the index tREER ––the
weighted average of a country’s currency relative to an index of other major
currencies adjusted for the effects of inflation––is composed of two indices as
follows:

16
ttt ERPINEERREER /. (5)
Equation (5) indicates the price increase of the trade partners relative to domestic
prices; in sum, a rise in the value of t
idERPI decreases the value oftREER . This
equation represents the depreciation of the domestic currency.
4 Dataset
4.1 Trade weights
Trade weights are simply calculated by dividing the sum of the import and
export values with each trade partner by each home country’s total trade value. The
data for the calculation are obtained from the IMF’s Direction of Trade. The unique
aspect of this study is its investigation of the monthly changing weight for those
countries, beside the countries of three euro/CFA regions, whose trade values are
important throughout the period 1999–2008. The euro/CFA zone is composed of
twenty-six countries and is divided into three groups: euro (twelve), WAEMU (eight),
and CEMAC (six) (see Table 1).
[Table 1 here]
17
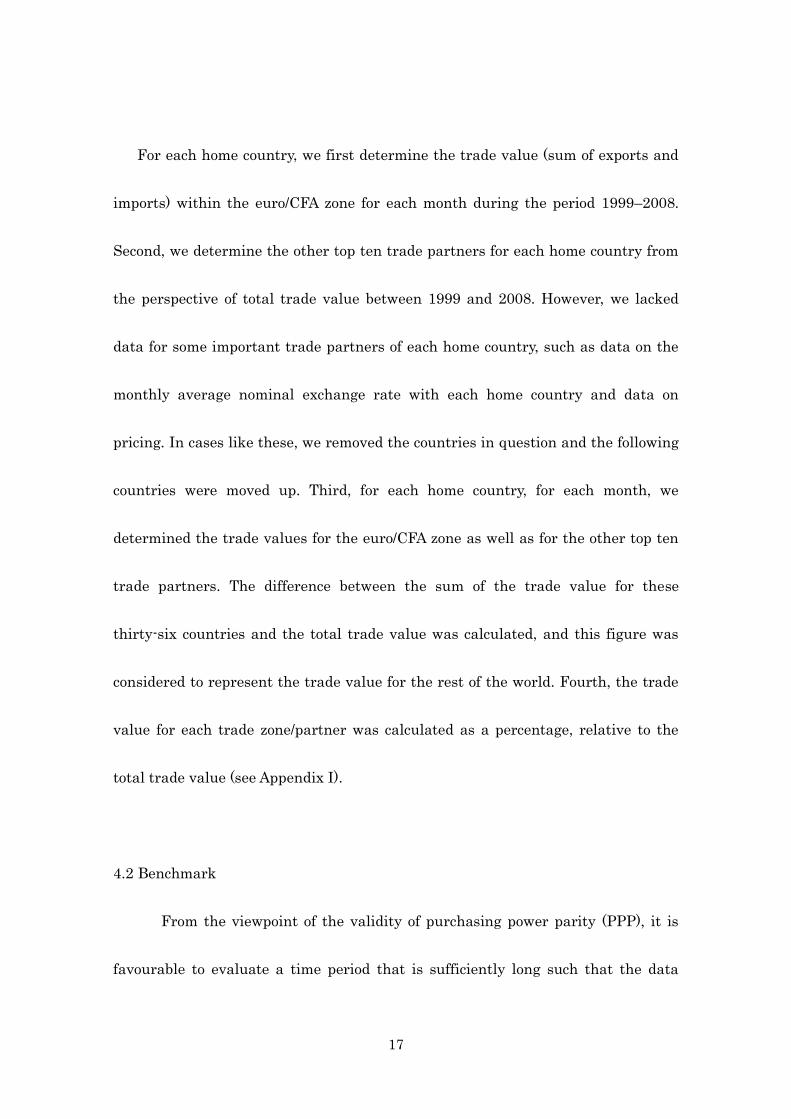
For each home country, we first determine the trade value (sum of exports and
imports) within the euro/CFA zone for each month during the period 1999–2008.
Second, we determine the other top ten trade partners for each home country from
the perspective of total trade value between 1999 and 2008. However, we lacked
data for some important trade partners of each home country, such as data on the
monthly average nominal exchange rate with each home country and data on
pricing. In cases like these, we removed the countries in question and the following
countries were moved up. Third, for each home country, for each month, we
determined the trade values for the euro/CFA zone as well as for the other top ten
trade partners. The difference between the sum of the trade value for these
thirty-six countries and the total trade value was calculated, and this figure was
considered to represent the trade value for the rest of the world. Fourth, the trade
value for each trade zone/partner was calculated as a percentage, relative to the
total trade value (see Appendix I).
4.2 Benchmark
From the viewpoint of the validity of purchasing power parity (PPP), it is
favourable to evaluate a time period that is sufficiently long such that the data
18
series does not become nonstational. However, longer periods themselves often
involve a larger risk of structural change. Notably, the economies of developing
countries tend to be less diversified and can be easily affected by external shocks. In
fact, countries in the CFA franc zone were affected by the devaluation of the CFA in
1994. On the other hand, in 1997, the Asian financial crisis disturbed the exchange
rates in the global markets. Therefore, we chose January 1999 as the benchmark
period; at this point, the effects of the 1997 collapse of Asian currencies as well as
the 1994 devaluation of the CFA franc were relatively insignificant. This period was
also suitable as it coincides with the euro’s introduction.
4.3 Currency rate
The bilateral historical exchange rates between each country and their trade
partners are available on the OANDA website v . We downloaded the monthly
average rates (interbank rates) for each country’s currency for the period between
January 1999 and December 2008, as expressed by the units of each trade partner’s
exchange. In January 1999, the value is indexed at 1. With respect to the rest of the
world, we use the conversion rates expressed by the units of the Special Drawing
Rights (SDR) per currency.
19
4.4 Price indices
For price indices, we decided to use CPIs due to the issue of data availability,
despite the shortcomings discussed in the previous section. The price indices of the
entire euro area and for each country (with the exception of Cuba) are obtained from
the IFSvi. The database includes annual price data from 160 countries; hence, there
is no more appropriate database. On the other hand, the annual price growth rates
of the WAEMU area were obtained from Annuaire Statistique 2007, which lists
price growth rates until the year 2007, and from the Bulletin Mensuel Conjoncture
de la BCEAO, Janvier 2009, which lists the data for the year 2008. The price growth
rates of the CEMAC are obtained from the website of the Banques des Etats de
l’Afrique Centrale (BEAC)vii. However, most of these data are not monthly but
rather reflect annual price growth rates. Therefore, we transformed the data into
monthly price indices with the assumption that the inflation rate within the year
was constant; this calculation was constructed as follows:
1)1( 12
1
am
nm gg , ( 12.....3,2,1n ),
where nmg is the n th month’s growth rate for consumer prices in year m
and a
mg is the annual growth rate for consumer prices in year m . When the price
index of January 1999 is fixed at 1—that is, 11
1999 Q —the price index for January
20
in year m is obtained as 12
11
1 )1( mnmm QgQ , and n monthly consumer price
index in year m is described as 1)1( n
mnm
nm QgQ ( 1n ).
5. Results
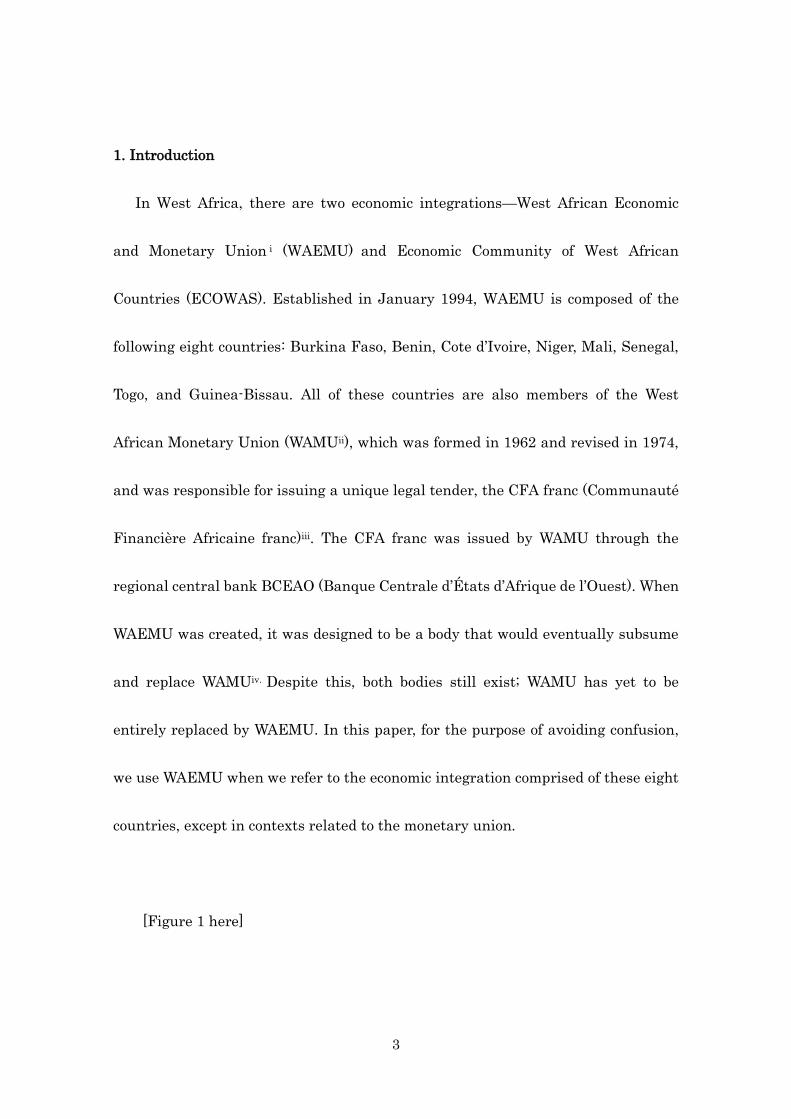
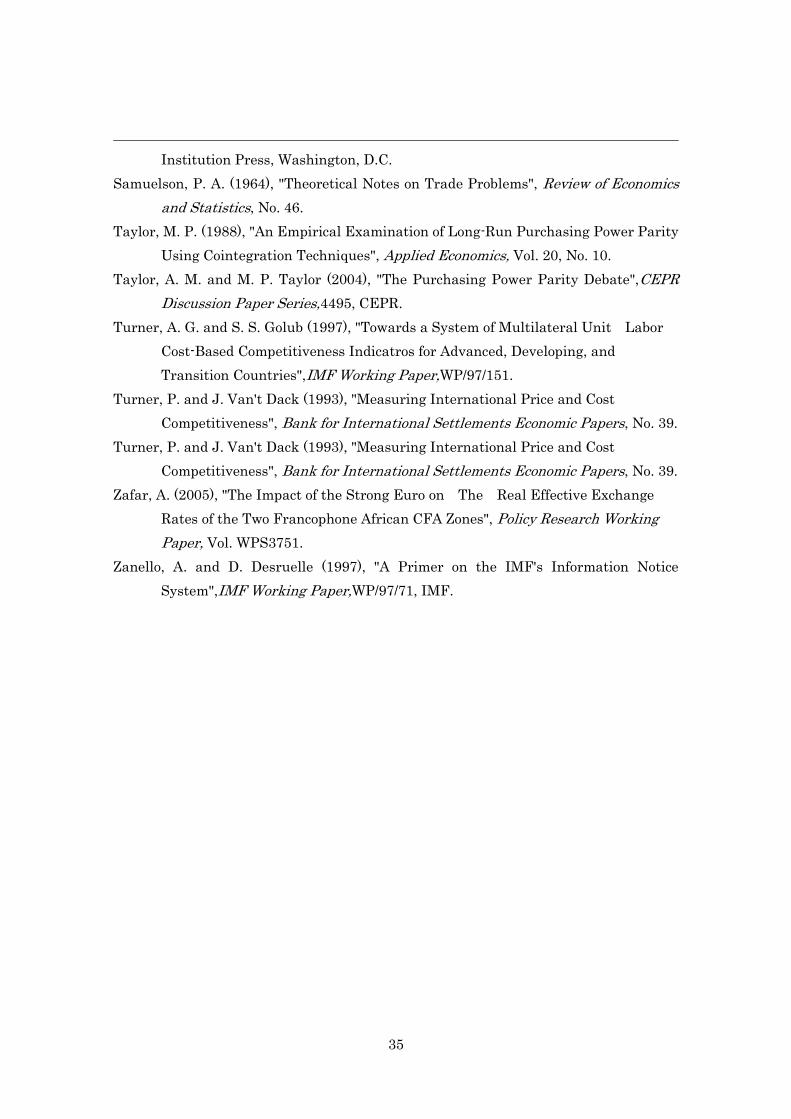
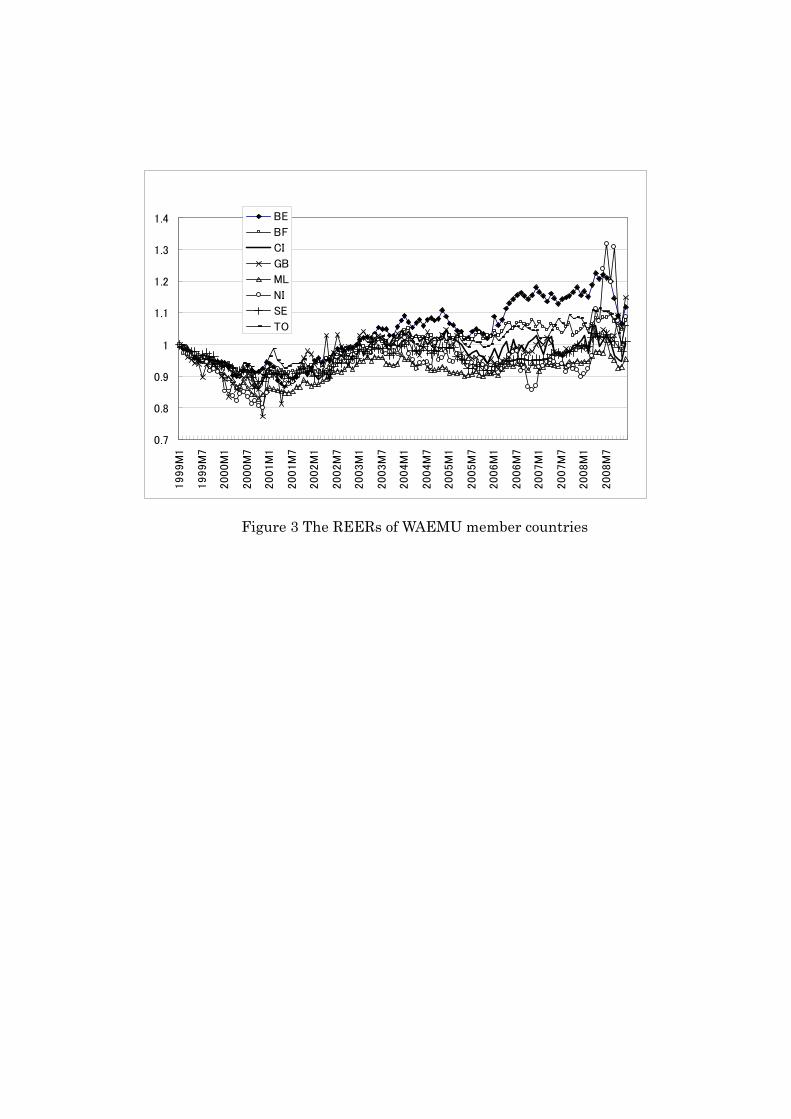
Figures 3 and 4 depict the evolution of the REER for each member country of
WAEMU and WAMZ respectively. Shifts to the upper or lower side respectively
imply appreciation or depreciation of each REER. According to Figure 3, overall, the
external competitiveness of each country improved until around mid-2000. The
REERs continued to appreciate until the first half of 2004, due to the rise of the
euro against the US dollar. Thereafter, excluding the REERs of Burkina Faso and
Niger, all of the REERs remained stable and did not experience any fluctuation over
10% compared to the initial value, while the euro, to which their currencies are
pegged, continued to appreciate up to mid-2008. This implies that, contrary to our
initial expectation, the REERs of WAEMU members (with the exception of Burkina
Faso and Niger) have succeeded in avoiding strong appreciation. Furthermore, the
REERs of these six WAEMU members do not diverge widely. The REER of Cape
Verde, whose currency is also pegged to the euro, is less divergent, as shown in
Figure 4.
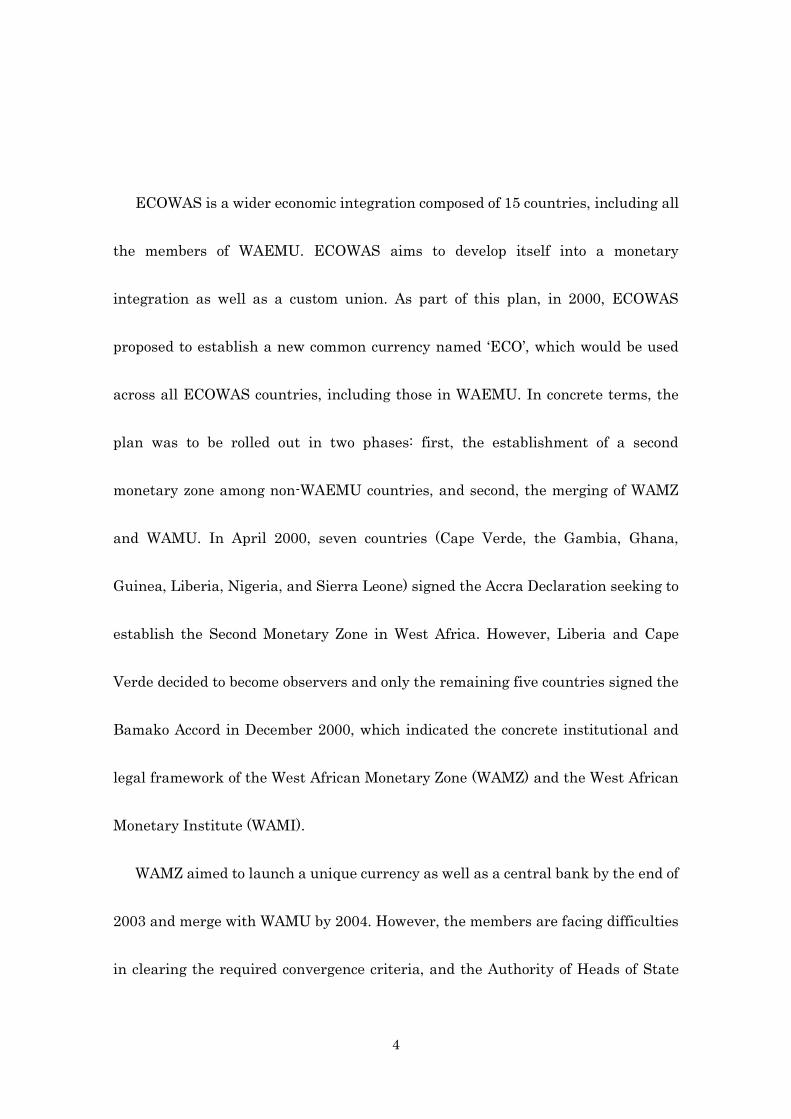
21
As Figure 4 makes clear, the REERs of the WAMZ countries are much more
divergent. For example, in general, Nigeria’s REER is seen to appreciate after
January 2004, while Ghana’s REER also shows a fluctuation similar to that of
Nigeria in the period after 2001; the sharp depreciation of the REER at an early
date absorbed the effects of this appreciation. As Figure 2 makes clear, the nominal
exchange rate of the Nigerian naira to the US dollar also depreciated. However, the
Nigerian REER appreciated far more than those of WAEMU member countries.
After the creation of WAMZ, its unification with WAEMU is planned. But as our
research makes clear, sustaining a common currency among these countries, even if
it can be successfully introduced, might prove to be a challenging task.
[Figure 3 here]
As for the WAEMU countries where a single currency had been introduced,
their different REERs seemed to reflect only the difference in their respective
combination of trade partners (see Appendix I). The strong depreciation in’ Niger’s
REER in the second half of 2006 was caused by the considerable rise in the amount
of transactions with Russia, where inflation continued to increase. In contrast, the
22
sharp appreciation of Niger’s REER since mid-2008 was a result of the sudden
increase in the amount of uranium being exported to Japan, which has suffered
from persistent deflation. In July 2008, Japan accounted for 58% of Niger’s total
trade, a figure that rose to 72% in September of the same year.
Furthermore, the strength of the REER of Benin since mid-2003, in
comparison with the other WAEMU members, seems to be a result of an
appreciation of the NEER and a reduction in the value of the ERPI (see Figure 5).
The appreciation of the NEER was caused by the increase in the trade share of
China, whose currency, the yuan, was pegged to the US dollar until mid-2005. The
yuan has remained undervalued—from the perspective of its trade surplus and the
amount of its accumulated exchange reserves––even after the introduction of the
adjustable peg system. By the end of 1999, about 40% of Benin’s trade was
conducted with the European Union (EU), while its trade transactions with China
had been a very small percentage. Subsequently, by the second half of 2008, only
12–18% of Benin’s trade was conducted with the EU, and the share of exports to
China increased to 37–43%. In contrast, the reduction in the ERPI was induced by
the price increases in Benin. In comparison to the initial value, prices in Benin
increased more than 30% in the second half of 2008.
23
[Figure 4 here]
[Figure 5 here]
[Table 2 here]
We next determine the effects of the NEER and the ERPI on the REER.
Figure 5 shows each index’s fluctuation for each country. By using this together
with Table 2, it is clear that the REERs of WAEMU member countries fell below the
NEERs, due to the effect of the offset prompted by rises in ERPIs, with the
exception of the case of Benin since 2006. This means that the consumer price
growth rates of WAEMU members became much lower than those of their trade
partners in the period under consideration. Cape Verde and Guinea also
demonstrate the same tendency. In contrast, in the other WAMZ countries, the
REER values tended to be higher than their NEER values. This implies that their
ERPI tended to be smaller than 1; in other words, their prices tended to rise
compared to those of their trade partners. This is especially true in the case of
Nigeria, where the ERPI decreased so rapidly that it remained lower than the
NEER since mid-2001. Consequently, the Nigerian REER appreciated regardless of
24
the depreciation of the NEER.
[Table 3 here]
We examine the REERs from the perspective of variability. In this paper,
variability is simply defined as the standard deviation of the natural log
differenceviii, and it indicates the magnitude of fluctuation. The coefficients of
variation (CV) show the dispersion of the data during the surveyed periodix. Figure
6 shows the relationship between the variability and the CV of both the REER and
the NEER. On the diagonal line of the figure on the left, the value of the variability
of the REER converges with that of the NEER. As evident from Table 2 and Figure 6,
in most of the countries, both the variability and the CV of the NEER are larger
than those of the REER. This means that both the magnitude of fluctuation and the
dispersion of the NEER were set off by those of the ERPI.
Second, Figure 6 indicates that the fluctuations of the NEERs and REERs of
Mali, Burkina Faso, Benin, and Senegal are relatively stable, while those of Guinea
and the Gambia are not. Table 3 organizes the characteristics of the REER variation
for the 13 West African countries from the viewpoint of both variability and the CV.

25
The table shows that the real effective exchange rates of countries that are
members of WAEMU were more stable than those that are members of WAMZ.
[Figure 6 here]
6. Test of PPP of West African countries
The PPP theory holds that the nominal exchange rate between two currencies
should be equal to the ratio of aggregate price levels between those two countries, so
that a unit of currency of one country will have the same purchasing power in a
foreign country (Taylor and Taylor, 2004). Although this theory has attracted
significant attention over several centuries of scholarship, the PPP definition that is
now the most familiar was first introduced by Cassel (1922), who was a significant
contributor to the international policy debates concerning the appropriate level for
nominal exchange rates that were held after World War I. His definition was later
developed by Balassa (1964) and Samuelson (1964).
The PPP theory holds that the variance of the rate of change in an exchange
rate will correspond to the variance of international inflation differentials. However,

26
several studies have found evidence showing persistent deviation from the PPP
theory (Frenkel, 1981; Edwards, 1989b; Taylor, 1988).
The PPP theory is founded on three assumptions: (1) the law of one price, (2) the
implementation of arbitrage transactions, and (3) the absence of friction such as
tariff barriers, quantitative restrictions, transportation costs, and inflation
differentials in traded and non-traded goods (the Balassa-Samuelson effect). In
general, it has been found that the PPP theory does not hold true in the short run.
However, in the long run, the evidence suggests that the PPP theory might hold.
The evidence seems to imply that the real exchange rate attains an equilibrium
level in the long run even if it has deviated in the short run. We test this PPP theory
on West African currencies using the derived NEER, ERPI, and REER data.
From equation (5), we have the following equation :
ttt pnr , (6)
where tr , tn , and tp are the natural logarithms of the REER, NEER, and REER
series, respectively. For the relative PPP to hold, tr must be stationary or the
relationship between tn and tp must be stationary. Although the PPP theory can
be tested in multiple ways, in this paper, we investigate the following: (1) whether
27
tr is stationary (using the unit root test under the augmented Dickey-Fuller (ADF)
regression assumption) and (2) whether Engel-Granger’s cointegration analysis can
be used between the nominal exchange rate tn , relative prices, and tp .
6.1 Unit root test (test for whether tr is stationary)
We test whether tr is stationary on data from thirteen West African countries.
If the ADF test rejects the null hypothesis of unit root ( 0 ) in the following
models, then series tr must be considered stationary.
First, the unit root test was tested with the following p-th order autoregressive
model with intercept and trend (equation (7)). The lag difference was determined
according to the Schwarz Info Criterion
tit
p
iitt rrtaar
1
1
110 , (7)
0:0 H .
In the case that the null hypothesis of the unit root was not been rejected in the
above model, the unit root test was repeated in the model with the intercept
. (8)
tit
p
iitt rrar
1
1
10
28
Finally, in the case that the null hypothesis of the unit root was not rejected in the
model with the intercept only, the unit root test was repeated in the model without
intercept and trend.
[Table 4 here]
Table 4 presents the results of the ADF test on the REER series of West African
currencies; the results indicate that those of Togo and Burkina Faso are stationary
at the 5% critical level. As for Mali and Benin, the null hypothesis was not rejected
at the 5% critical level but it is rejected at the 10% critical level. Therefore, for Togo
and Burkina Faso, the PPP theory could hold, while it is very unlikely that the PPP
theory holds for Mali and Benin.
6.2 Cointegration Analysis
[Table 5 here]
In the previous section, the ADF test for tr series was used to demonstrate
that the PPP theory does hold for some member countries of the WAEMU. For other
countries, we tested the PPP theory from the perspective of the cointegration
29
between tn and tp . The cointegration test can be used to assess whether tn and
tp maintain a stable long-term relationship (Johansen, 1988; Engle and Granger,
1987). The Engle-Granger procedure is effective for testing cointegration in a single
equation, while Johansen’s multivariate cointegration methodology should be used
when there are more than two variables.
In this research, we estimated the cointegration regression using fully modified
ordinary least squares (FMOLS) and tested the residuals from the viewpoint of
stationarity (tau-statistic) as well as the autocorrelation coefficient (z-statistic); the
residuals, tu , were considered to be a p-th order autoregressive process (AR (p)) as
follows:
tit
p
iitt uuu
ˆˆ)1(ˆ1
1 . (9)
Table 5 presents the integrated order of both tn and tp , and the
Engle–Granger tau-statistic and normalized autocorrelation coefficient (z-statistic)
for the residuals were obtained from each series as dependant variables in a
cointegrating regression. Côte d’Ivoire, Cape Verde, and Ghana were excluded from
this cointegration analysis because tn and/or tp ~ )0(I . Lag length was
determined based on the Schwarz Info Criterion. The null hypothesis is that the
series are not cointegrated. The results show that both the statistics for Nigeria
30
reject this null hypothesis of no cointegration at the 15% level. As for Benin, the
z-statistic rejects the null hypothesis at the 10.6% level, while the tau-statistics is
slightly larger and rejects it at the 15.0% level.
7. Conclusion
We calculated the monthly REER, NEER, and ERPI for 13 West African
countries for the period 1999–2008, using consumer prices and changing trade
weights over time. Due to insufficient data availability and accuracy for these
countries, we employed a method that is much simpler than the ones mentioned in
section 2. We concentrated on calculating the above using an identical method and
then comparing the results.
Contrary to our expectations, first, the values of the REER of WAEMU
countries during the period 1999–2008 were found to have not appreciated
substantially compared to the initial value, and they remained comparatively stable,
albeit with some variation. It is somewhat surprising that the REER of WAEMU
countries appreciated less than that of Nigeria, despite the strong appreciation of
the euro in this period. This is a result of the fact that inflation in the WAEMU
region has been fairly well controlled, although their NEERs grew stronger with the

31
appreciation of the euro. However, the REERs of WAEMU countries remained much
stronger than those of the non-WAEMU countries, such as Ghana, the Gambia, and
Guinea, whose NEERs continued to degrade substantially. This implies that the
competitiveness of the exports of WAEMU countries has weakened in comparison to
their neighbours who export similar products. At the same time, it indicates that
WAEMU member countries can import foreign products more easily than their
neighbouring countries. However, this fact also makes import-substitution
production more difficult.
Second, from the viewpoint of variability as well as the coefficients of variation,
the REERs of the countries whose currencies are pegged to the euro were more
stable than those of their neighbouring countries. The NEERs of the latter group
were devaluated to a greater extent, and the changes in their ERPIs were not
sufficiently large to offset the changes in their NEERs (with the exception of
Nigeria).
Third, the PPP theory tends to hold in those countries where the currencies
are pegged to the euro rather than other countries that operate under a more
flexible exchange rate regime. Exchange regimes in developing countries are
increasingly attracting the attention of scholars and policy-makers, particularly
32
since the 1997–1998 Asian financial crisis. Furthermore, there is a plan for many
African countries to cooperate to build a unique currency, the Afro, in the future.
One of the concerns over this kind of currency union is that member countries will
lose their access to an adjustment tool that can be used to offset external shocks.
However, our research suggests that, in fact, countries that are members of the
WAEMU seemed to respond better to external shocks than their non-WAEMU
neighbouring countries, even though they cannot adjust their exchange rate.
Moreover, this study implies that the establishment of WAMZ and its proposed
integration with WAEMU will prove to be a challenging task predominantly
because of the divergent movements of the member countries’ REERs.
[Appendix here]
i In French, the title is Union Economique Monétaire Ouest Africaine.
ii In French, the title is UMOA (Union Monétaire Ouest Africaine).
iii There is another CFA franc (Coopération Financière en Afrique Centrale), which is used
in countries that were formally part of French Equatoriale Africa (Afrique-Équatoriale
Française). In fact, this legal tender is managed by the Banques des Etats de l’Afrique
Centrale (BEAC), and it is an entity distinct from the CFA franc issued by BCEAO, although
they have been pegged to the French franc at an equal rate.
iv WAEMU was designed to help integrate the monetary union WAMU with an economic
community named CEAO. CEAO was dissolved on 15 May 1994, immediately after the

33
creation of WAEMU, when it was hoped that WAMU might be integrated into WAEMU.
v http://www.oanda.com/convert/fxaverage.
vi For Cuba, we use the data of the indices of consumer prices (1999–2001) from Pauel Vidal
Alejandro and Yaima Doimeadios, Publicado en la Revista Economia y Dessarrollo,
Universidad de Habena, Edicion Especial 2003, and the data for 2002–2008 from the CIA
World Fact Book.
vii CEMAC: Principal economic, financial and social indicators 1993–2006.
http://www.beac.int/stateco/depiefcemac.pdf. However, the data for 2005 has been estimated
and that of 2006 is strictly a prevision.
viii With regard to exchange rate variability, there exist several types of measures: the
effective variation as well as the variability of nominal and real effective exchange rates. See
Lanyu, A. and E. C. Suss (1982) and Guillaumont Jeanneney, S. and J.-L. Parire (1991).
ix The CV is defined as the ratio of the standard deviation, σ, to the mean, μ, as follows:
2
CV
.
34
References
Balassa, B. (1964), "The purchasing-Power Parity Doctrine: A Reapparaisal." Journal of
Political Economy, No. 72.
Banque de France(2002). “La Zone Franc”, Note d’information No.127, Avril 2002 :1-20.
Bénassy-Quéré, A. and M. Coupet (2005). “On the Adequacy of Monetary Arrangements
in Sub-Saharan Africa”, The World Economy, 28(3):349-373.
Cassel, G. (1922), "Money and Foreign Exchange after 1914", Macmillan, New York.
Edwards, S. (1989a), "Real Exchange Rates, Devaluation, and Adjustment, Exchange
Rates Policy in Developing Countries", MIT Press, Cambridge, Massachusetts.
Edwards, S. (1989b), "Real Exchange Rates in the Developing Countries: Concepts and
Measurement",NBER Working Paper,2950.
Frenkel, J. A. (1981), "The Collapse of Purchasing Power Parities During the 1970's",
European Economic Review, No. 16.
Golub, S. S. and J. Ceglowski (2002), "South African Real Exchange Rates and
Manufacturing Competitiveness", The South African Journal of Economics, Vol.
70, No. 6.
Guillaumont Jeanneney, S. and J.-L. Parire (1991), "La variabilité es taux de change et
le rattachement optimal des monnaies des pays en voie de développement",
Revue d'Economie Politique, Vol. 101, No. 3.
Gulde, A.-M. and C. Tsangarides (Eds.) (2008), "The CFA Franc Zone, Common
Currency, Uncommon Challenges", International Monetary Fund, Washington
D.C.
Hinkle, L. E. and P. J. Montiel (1999), "Exchange Rate Misalignment: Concepts and
Measurement for Developing Countries", A World Bank Research Publication.
Hammouda, H. B. and M. Kassé (Eds.) (2001), "L'avenir de la zone franc: Perspectives
africaines", CODESRIA-Karthala.
Johansen, S. (1988), "Statistical Analysis of Cointegrating Vectors", Journal of
Economic Dynamics and Control, Vol. 125.
Johansen, S. (1991), "Estimation and Hypothesis Testing of Cointegrating Vectors in
Gaussian Vector Autoregressive Models", Econometrica, Vol. 59.
Lanyu, A. and E. C. Suss (1982), "Exchange Rate Variability: Alternative Measures and
Interpretation", IMF Staff Papers, Vol. 29, No. 4.
Masson, P. and C. Pattillo (2003), "Monetary Union in West Africa: An Agency of
Restraint for Fiscal Policies", Journal of African Economies, Vol. 11, No. 3.
Masson, P. R. and C. Pattillo (2005), "The Monetary Geography of Africa", Brookings
35
Institution Press, Washington, D.C.
Samuelson, P. A. (1964), "Theoretical Notes on Trade Problems", Review of Economics
and Statistics, No. 46.
Taylor, M. P. (1988), "An Empirical Examination of Long-Run Purchasing Power Parity
Using Cointegration Techniques", Applied Economics, Vol. 20, No. 10.
Taylor, A. M. and M. P. Taylor (2004), "The Purchasing Power Parity Debate",CEPR
Discussion Paper Series,4495, CEPR.
Turner, A. G. and S. S. Golub (1997), "Towards a System of Multilateral Unit Labor
Cost-Based Competitiveness Indicatros for Advanced, Developing, and
Transition Countries",IMF Working Paper,WP/97/151.
Turner, P. and J. Van't Dack (1993), "Measuring International Price and Cost
Competitiveness", Bank for International Settlements Economic Papers, No. 39.
Turner, P. and J. Van't Dack (1993), "Measuring International Price and Cost
Competitiveness", Bank for International Settlements Economic Papers, No. 39.
Zafar, A. (2005), "The Impact of the Strong Euro on The Real Effective Exchange
Rates of the Two Francophone African CFA Zones", Policy Research Working
Paper, Vol. WPS3751.
Zanello, A. and D. Desruelle (1997), "A Primer on the IMF's Information Notice
System",IMF Working Paper,WP/97/71, IMF.
Figures
Nigeria, Ghana, Guinea, the Gambia, Sierra Leone, Liberia,
WAMZ
Cape Verde
Benin, Burkina Faso, Côte d’Ivoire, Guinea Bissau, Mali, Niger, Senegal, Togo
WAEMU/WAMU
ECOWAS
Figure 1: Two economic integrations and two monetary unions in West Africa (2010)

0
0.2
0.4
0.6
0.8
1
1.2
1.4
1.6
1999M
1
1999M
6
1999M
1
2000M
4
2000M
9
2001M
2
2001M
7
2001M
1
2002M
5
2002M
1
2003M
3
2003M
8
2004M
1
2004M
6
2004M
1
2005M
4
2005M
9
2006M
2
2006M
7
2006M
1
2007M
5
2007M
1
2008M
3
2008M
8
CFA Franc
Nigeria Nira
CV Escudo
Ghana Cedi
Guinea Franc
Gambia Dalasi
Figure 2. Value of the US dollar against each West African currency 1999–2008
(1999M1=1)
0.7
0.8
0.9
1
1.1
1.2
1.3
1.4
1999M
1
1999M
7
2000M
1
2000M
7
2001M
1
2001M
7
2002M
1
2002M
7
2003M
1
2003M
7
2004M
1
2004M
7
2005M
1
2005M
7
2006M
1
2006M
7
2007M
1
2007M
7
2008M
1
2008M
7
BE
BF
CI
GB
ML
NI
SE
TO
Figure 3 The REERs of WAEMU member countries

0.2
0.4
0.6
0.8
1
1.2
1.4
1.6
1.8
1999M
1
1999M
7
2000M
1
2000M
7
2001M
1
2001M
7
2002M
1
2002M
7
2003M
1
2003M
7
2004M
1
2004M
7
2005M
1
2005M
7
2006M
1
2006M
7
2007M
1
2007M
7
2008M
1
2008M
7
CV
GA
GH
GU
NG
Figure 4 The REERs of WAMZ member countries
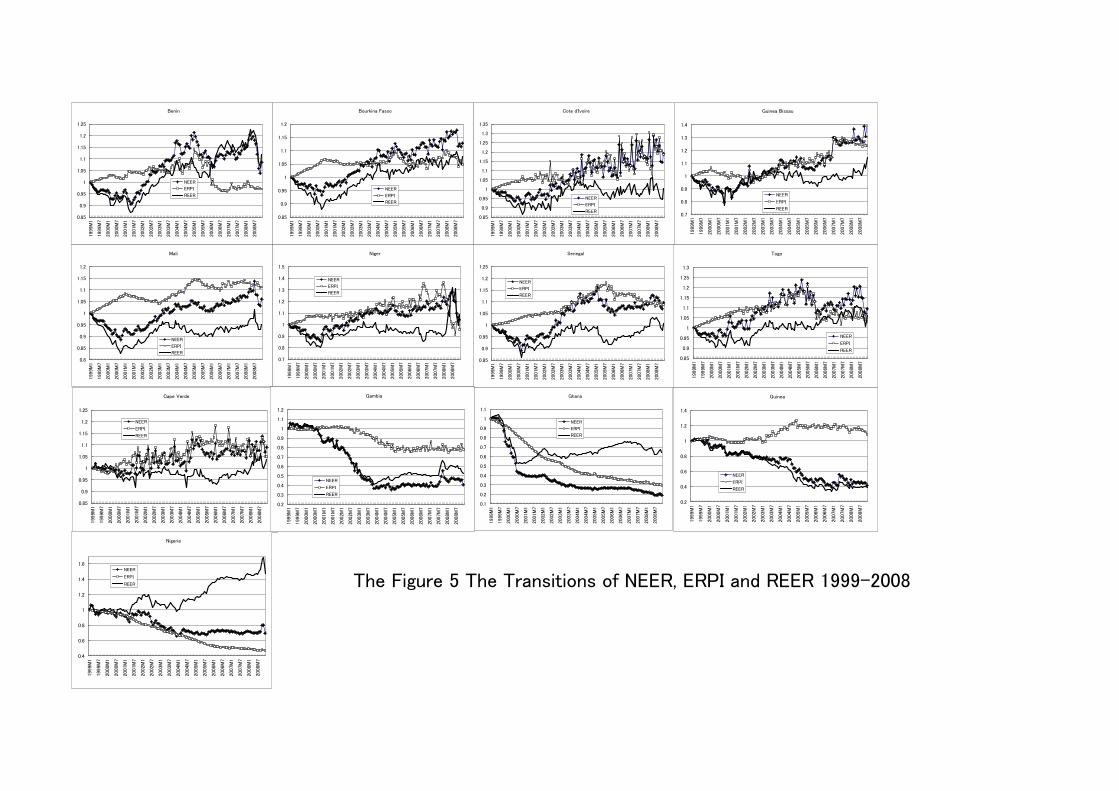
The Figure 5 The Transitions of NEER, ERPI and REER 1999-2008
0.85
0.9
0.95
1
1.05
1.1
1.15
1.2
199
9M1
199
9M7
200
0M1
200
0M7
200
1M1
200
1M7
200
2M1
200
2M7
200
3M1
200
3M7
200
4M1
200
4M7
200
5M1
200
5M7
200
6M1
200
6M7
200
7M1
200
7M7
200
8M1
200
8M7
Bourkina Fasso
NEER
ERPI
REER
0.85
0.9
0.95
1
1.05
1.1
1.15
1.2
1.25
199
9M1
199
9M7
200
0M1
200
0M7
200
1M1
200
1M7
200
2M1
200
2M7
200
3M1
200
3M7
200
4M1
200
4M7
200
5M1
200
5M7
200
6M1
200
6M7
200
7M1
200
7M7
200
8M1
200
8M7
Benin
NEER
ERPI
REER
0.85
0.9
0.95
1
1.05
1.1
1.15
1.2
1.25
1.3
1.35
199
9M1
199
9M7
200
0M1
200
0M7
200
1M1
200
1M7
200
2M1
200
2M7
200
3M1
200
3M7
200
4M1
200
4M7
200
5M1
200
5M7
200
6M1
200
6M7
200
7M1
200
7M7
200
8M1
200
8M7
Cote d'Ivoire
NEER
ERPI
REER0.7
0.8
0.9
1
1.1
1.2
1.3
1.4
199
9M1
199
9M7
200
0M1
200
0M7
200
1M1
200
1M7
200
2M1
200
2M7
200
3M1
200
3M7
200
4M1
200
4M7
200
5M1
200
5M7
200
6M1
200
6M7
200
7M1
200
7M7
200
8M1
200
8M7
Guinea Bissau
NEER
ERPI
REER
0.8
0.85
0.9
0.95
1
1.05
1.1
1.15
1.2
199
9M1
199
9M7
200
0M1
200
0M7
200
1M1
200
1M7
200
2M1
200
2M7
200
3M1
200
3M7
200
4M1
200
4M7
200
5M1
200
5M7
200
6M1
200
6M7
200
7M1
200
7M7
200
8M1
200
8M7
Mali
NEER
ERPI
REER
0.85
0.9
0.95
1
1.05
1.1
1.15
1.2
1.25
199
9M1
199
9M7
200
0M1
200
0M7
200
1M1
200
1M7
200
2M1
200
2M7
200
3M1
200
3M7
200
4M1
200
4M7
200
5M1
200
5M7
200
6M1
200
6M7
200
7M1
200
7M7
200
8M1
200
8M7
Senegal
NEER
ERPI
REER
0.85
0.9
0.95
1
1.05
1.1
1.15
1.2
1.25
1.3
199
9M1
199
9M7
200
0M1
200
0M7
200
1M1
200
1M7
200
2M1
200
2M7
200
3M1
200
3M7
200
4M1
200
4M7
200
5M1
200
5M7
200
6M1
200
6M7
200
7M1
200
7M7
200
8M1
200
8M7
Togo
NEER
ERPI
REER
0.85
0.9
0.95
1
1.05
1.1
1.15
1.2
1.25
199
9M1
199
9M7
200
0M1
200
0M7
200
1M1
200
1M7
200
2M1
200
2M7
200
3M1
200
3M7
200
4M1
200
4M7
200
5M1
200
5M7
200
6M1
200
6M7
200
7M1
200
7M7
200
8M1
200
8M7
Cape Verde
NEER
ERPI
REER
0.7
0.8
0.9
1
1.1
1.2
1.3
1.4
1.5
199
9M1
199
9M7
200
0M1
200
0M7
200
1M1
200
1M7
200
2M1
200
2M7
200
3M1
200
3M7
200
4M1
200
4M7
200
5M1
200
5M7
200
6M1
200
6M7
200
7M1
200
7M7
200
8M1
200
8M7
Niger
NEER
ERPI
REER
0.2
0.3
0.4
0.5
0.6
0.7
0.8
0.9
1
1.1
1.2
199
9M1
199
9M7
200
0M1
200
0M7
200
1M1
200
1M7
200
2M1
200
2M7
200
3M1
200
3M7
200
4M1
200
4M7
200
5M1
200
5M7
200
6M1
200
6M7
200
7M1
200
7M7
200
8M1
200
8M7
Gambia
NEER
ERPI
REER
0.1
0.2
0.3
0.4
0.5
0.6
0.7
0.8
0.9
1
1.1
199
9M1
199
9M7
200
0M1
200
0M7
200
1M1
200
1M7
200
2M1
200
2M7
200
3M1
200
3M7
200
4M1
200
4M7
200
5M1
200
5M7
200
6M1
200
6M7
200
7M1
200
7M7
200
8M1
200
8M7
Ghana
NEER
ERPI
REER
0.2
0.4
0.6
0.8
1
1.2
1.4
199
9M1
199
9M7
200
0M1
200
0M7
200
1M1
200
1M7
200
2M1
200
2M7
200
3M1
200
3M7
200
4M1
200
4M7
200
5M1
200
5M7
200
6M1
200
6M7
200
7M1
200
7M7
200
8M1
200
8M7
Guinea
NEER
ERPI
REER
0.4
0.6
0.8
1
1.2
1.4
1.6
199
9M1
199
9M7
200
0M1
200
0M7
200
1M1
200
1M7
200
2M1
200
2M7
200
3M1
200
3M7
200
4M1
200
4M7
200
5M1
200
5M7
200
6M1
200
6M7
200
7M1
200
7M7
200
8M1
200
8M7
Nigeria
NEER
ERPI
REER

SEBF
TO
CI
BE
ML
CV
NI
GB
NG
GU
GA
GH
0
0.01
0.02
0.03
0.04
0.05
0.06
0 0.01 0.02 0.03 0.04 0.05 0.06
Variability(NEER)
Var
iabi
lity(
REER)
SEBFTO
CI
BE
MLCV
NI
GB
NG
GU
GA
GH
0
0.1
0.2
0.3
0.4
0.5
0.6
0 0.1 0.2 0.3 0.4 0.5 0.6
Coefficient of Variation (NEER)C
oeff
icie
nt
of
Var
iation (
RE
ER
)
Figure 6 The relationship between the REER and the NEER of both the variability and the CV.
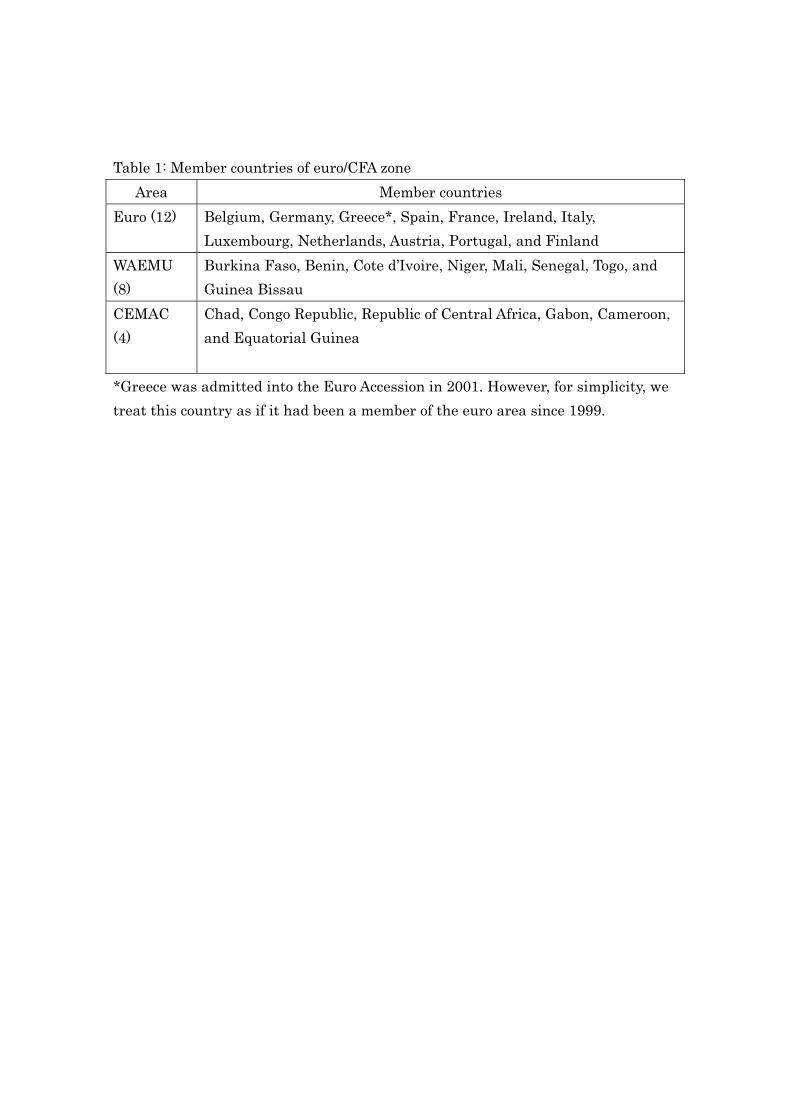
Table 1: Member countries of euro/CFA zone
Area Member countries Euro (12) Belgium, Germany, Greece*, Spain, France, Ireland, Italy,
Luxembourg, Netherlands, Austria, Portugal, and Finland WAEMU (8)
Burkina Faso, Benin, Cote d’Ivoire, Niger, Mali, Senegal, Togo, and Guinea Bissau
CEMAC (4)
Chad, Congo Republic, Republic of Central Africa, Gabon, Cameroon, and Equatorial Guinea
*Greece was admitted into the Euro Accession in 2001. However, for simplicity, we treat this country as if it had been a member of the euro area since 1999.
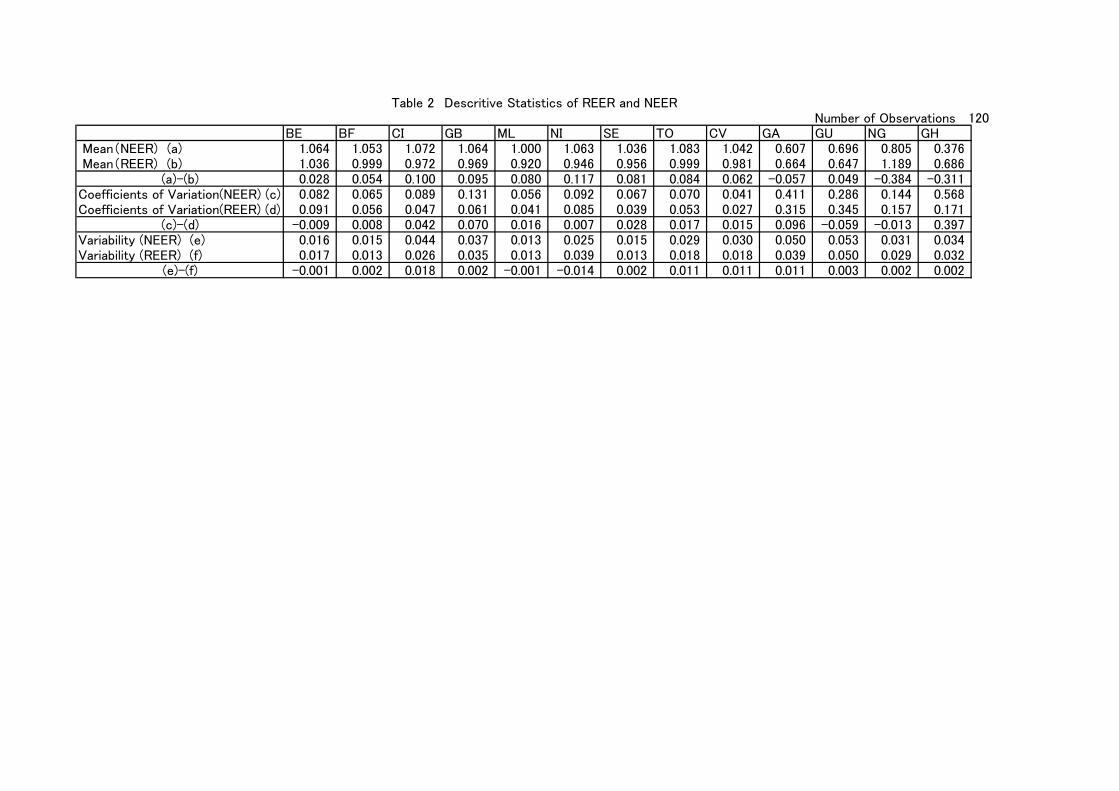
Table 2 Descritive Statistics of REER and NEERNumber of Observations 120
BE BF CI GB ML NI SE TO CV GA GU NG GH Mean(NEER) (a) 1.064 1.053 1.072 1.064 1.000 1.063 1.036 1.083 1.042 0.607 0.696 0.805 0.376 Mean(REER) (b) 1.036 0.999 0.972 0.969 0.920 0.946 0.956 0.999 0.981 0.664 0.647 1.189 0.686
(a)-(b) 0.028 0.054 0.100 0.095 0.080 0.117 0.081 0.084 0.062 -0.057 0.049 -0.384 -0.311Coefficients of Variation(NEER) (c) 0.082 0.065 0.089 0.131 0.056 0.092 0.067 0.070 0.041 0.411 0.286 0.144 0.568Coefficients of Variation(REER) (d) 0.091 0.056 0.047 0.061 0.041 0.085 0.039 0.053 0.027 0.315 0.345 0.157 0.171
(c)-(d) -0.009 0.008 0.042 0.070 0.016 0.007 0.028 0.017 0.015 0.096 -0.059 -0.013 0.397Variability (NEER) (e) 0.016 0.015 0.044 0.037 0.013 0.025 0.015 0.029 0.030 0.050 0.053 0.031 0.034Variability (REER) (f) 0.017 0.013 0.026 0.035 0.013 0.039 0.013 0.018 0.018 0.039 0.050 0.029 0.032
(e)-(f) -0.001 0.002 0.018 0.002 -0.001 -0.014 0.002 0.011 0.011 0.011 0.003 0.002 0.002
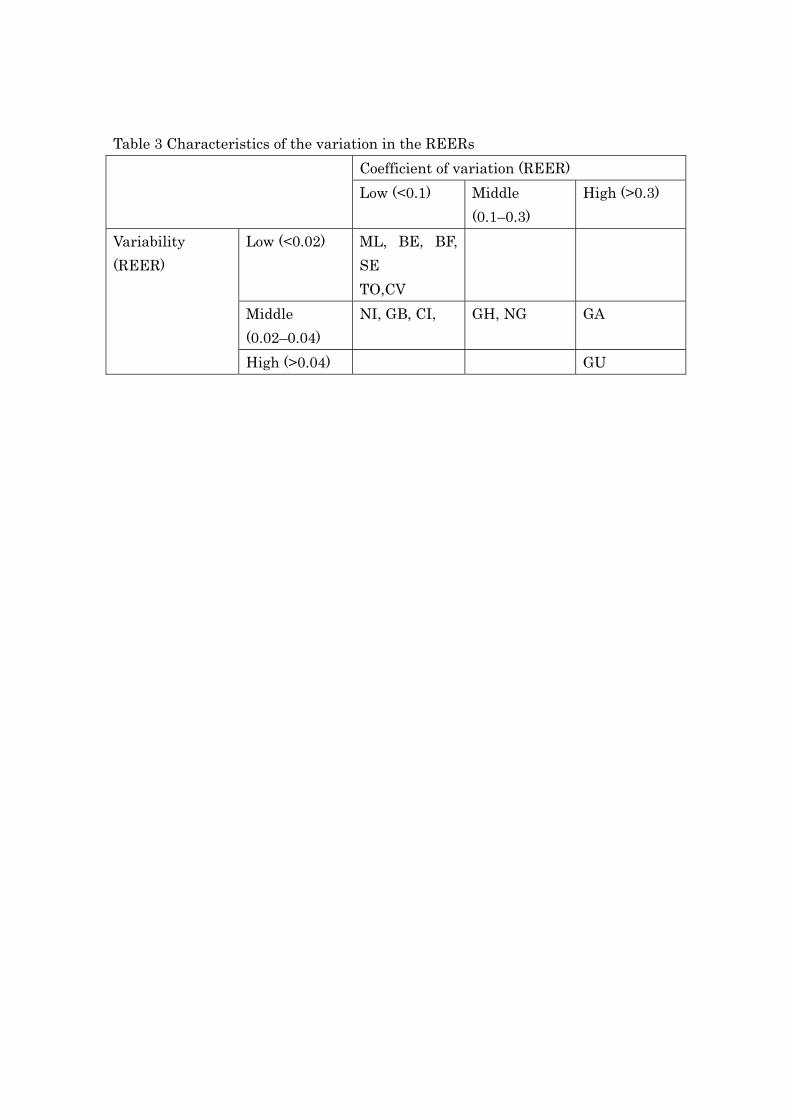
Table 3 Characteristics of the variation in the REERs Coefficient of variation (REER) Low (<0.1) Middle
(0.1–0.3) High (>0.3)
Low (<0.02) ML, BE, BF, SE TO,CV
Middle (0.02–0.04)
NI, GB, CI, GH, NG GA
Variability (REER)
High (>0.04) GU
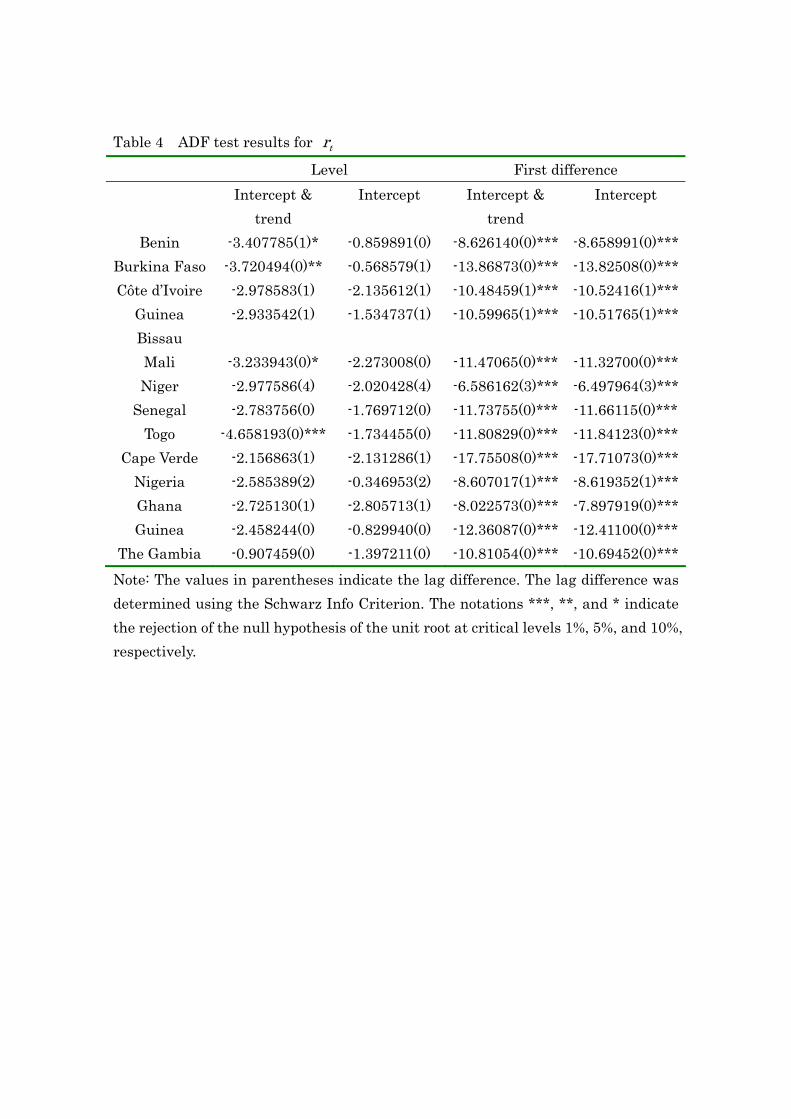
Table 4 ADF test results for tr Level First difference Intercept &
trend Intercept Intercept &
trend Intercept
Benin -3.407785(1)* -0.859891(0) -8.626140(0)*** -8.658991(0)***Burkina Faso -3.720494(0)** -0.568579(1) -13.86873(0)*** -13.82508(0)***Côte d’Ivoire -2.978583(1) -2.135612(1) -10.48459(1)*** -10.52416(1)***
Guinea Bissau
-2.933542(1) -1.534737(1) -10.59965(1)*** -10.51765(1)***
Mali -3.233943(0)* -2.273008(0) -11.47065(0)*** -11.32700(0)***Niger -2.977586(4) -2.020428(4) -6.586162(3)*** -6.497964(3)***
Senegal -2.783756(0) -1.769712(0) -11.73755(0)*** -11.66115(0)***Togo -4.658193(0)*** -1.734455(0) -11.80829(0)*** -11.84123(0)***
Cape Verde -2.156863(1) -2.131286(1) -17.75508(0)*** -17.71073(0)***Nigeria -2.585389(2) -0.346953(2) -8.607017(1)*** -8.619352(1)***Ghana -2.725130(1) -2.805713(1) -8.022573(0)*** -7.897919(0)***Guinea -2.458244(0) -0.829940(0) -12.36087(0)*** -12.41100(0)***
The Gambia -0.907459(0) -1.397211(0) -10.81054(0)*** -10.69452(0)***Note: The values in parentheses indicate the lag difference. The lag difference was determined using the Schwarz Info Criterion. The notations ***, **, and * indicate the rejection of the null hypothesis of the unit root at critical levels 1%, 5%, and 10%, respectively.
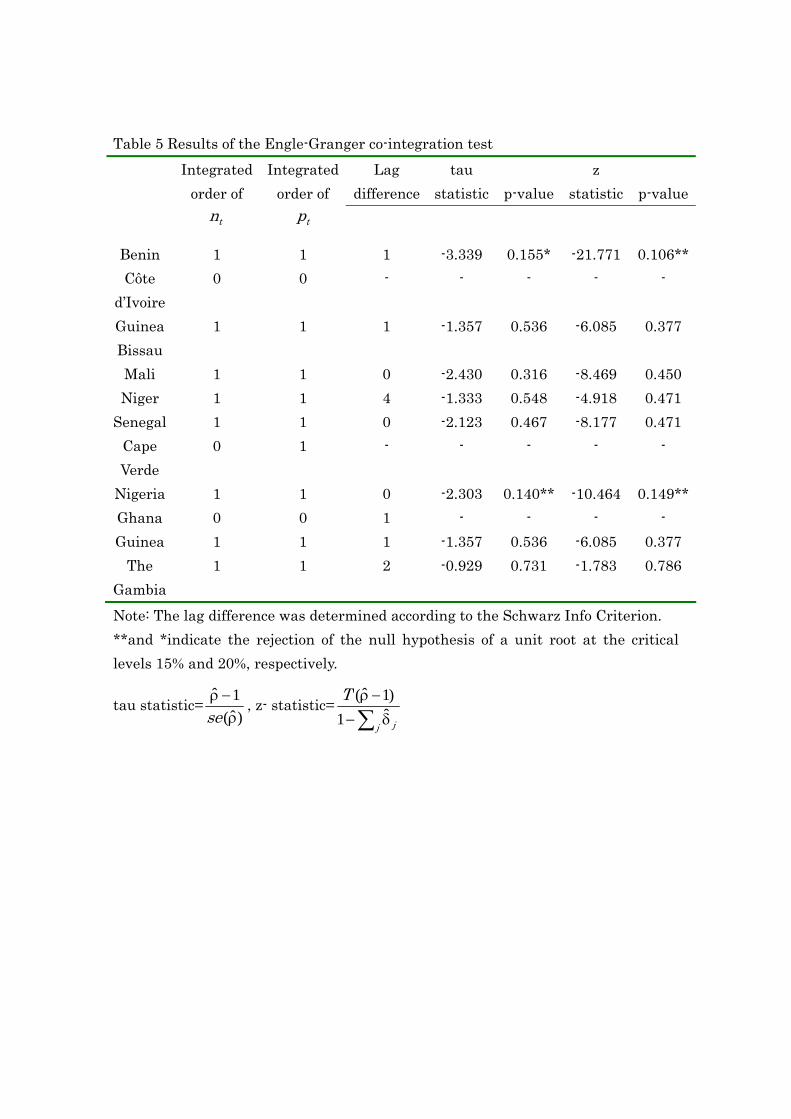
Table 5 Results of the Engle-Granger co-integration test Lag
differencetau
statistic
p-valuez
statistic
p-value Integrated
order of tn
Integrated order of
tp
Benin 1 1 1 -3.339 0.155* -21.771 0.106**Côte
d’Ivoire 0 0 - - - - -
Guinea Bissau
1 1 1 -1.357 0.536 -6.085 0.377
Mali 1 1 0 -2.430 0.316 -8.469 0.450 Niger 1 1 4 -1.333 0.548 -4.918 0.471
Senegal 1 1 0 -2.123 0.467 -8.177 0.471 Cape Verde
0 1 - - - - -
Nigeria 1 1 0 -2.303 0.140** -10.464 0.149**Ghana 0 0 1 - - - - Guinea 1 1 1 -1.357 0.536 -6.085 0.377
The Gambia
1 1 2 -0.929 0.731 -1.783 0.786
Note: The lag difference was determined according to the Schwarz Info Criterion. **and *indicate the rejection of the null hypothesis of a unit root at the critical levels 15% and 20%, respectively.
tau statistic=)ˆ(
1ˆρ−ρ
se, z- statistic=
∑ δ−−ρ
j j
Tˆ1)1ˆ(

Appendix I: Trade Share (1999-2008 Average) EURO WAEMU CEMAC 1 2 3 4 5 6 7 8 9 10 TOTAL ROW
BE China USA Thailand Malaysia Ghana UK Nigeria India Indonesia Singapore
21.03% 7.69% 0.62% 30.87% 6.68% 5.45% 2.80% 2.73% 2.20% 2.14% 2.07% 1.68% 1.16% 87.10% 12.90%
BF China Singapore Ghana Libya India USA Thailand Japan Morocco Indonesia
31.76% 27.17% 0.02% 6.88% 3.63% 2.48% 2.47% 2.15% 1.71% 1.71% 1.34% 1.24% 0.85% 83.40% 16.60%
CI Nigeria USA UK China India Ghana Russia Thailand Brazil Poland
38.58% 7.41% 1.97% 14.04% 6.73% 2.49% 2.31% 1.67% 1.62% 1.53% 1.23% 1.04% 0.84% 81.47% 18.53%
GB India Brazil Nigeria Uruguay Thailand China USA Cuba Pakistan UK
21.80% 11.18% 0.05% 24.10% 14.05% 4.45% 3.46% 3.20% 2.15% 1.70% 1.67% 1.58% 0.50% 89.91% 10.09%
ML China SA India USA Thailand UK Morocco China Czech Brazil
24.59% 20.96% 0.02% 5.16% 2.41% 1.93% 1.90% 1.44% 1.16% 0.93% 0.88% 0.72% 0.64% 62.73% 37.27%
NI Japan Nigeria USA China Pakistan India Ghana UK Switzerland Russia
28.37% 9.91% 0.11% 14.09% 11.63% 6.74% 4.70% 4.22% 3.64% 1.71% 1.69% 1.54% 0.94% 89.29% 10.71%
SE Nigeria India UK Thailand China USA Brazil Japan Gambia, Morocco
39.12% 8.93% 1.90% 5.11% 4.68% 4.52% 3.90% 3.74% 2.67% 2.08% 1.68% 1.32% 1.12% 80.77% 19.23%
TO China Ghana USA Estonia UK Thailand Malaysia India Indonesia Brazil
25.60% 12.31% 0.73% 22.58% 4.48% 3.76% 3.02% 2.90% 2.32% 2.11% 1.57% 1.42% 1.32% 84.11% 15.89%
CV Brazil USA UK Algeria China Japan Turkey T&T Thailand Vietnam
71.25% 3.54% 0.46% 3.76% 3.35% 2.99% 2.68% 1.25% 1.19% 1.15% 0.54% 0.45% 0.40% 93.01% 6.99%
GA Brazil UK India USA Malaysia China Thailand Turkey Morocco Japan
18.52% 16.11% 0.32% 6.36% 5.72% 4.56% 3.46% 2.51% 2.17% 1.87% 1.73% 1.41% 1.29% 66.05% 33.95%
GH Nigeria China UK USA India SA Brazil Japan Thailand Malaysia
26.56% 5.17% 0.72% 10.64% 8.84% 7.26% 6.45% 3.08% 2.78% 2.30% 2.17% 1.54% 1.43% 78.93% 21.07%
GU China USA Russia Ukraine Korea UK India Swiss SA Canada
31.29% 4.91% 0.91% 6.01% 5.81% 4.21% 3.31% 2.98% 2.57% 2.26% 1.21% 1.20% 1.19% 67.87% 32.13%
NG USA Brazil China India UK Korea SA Japan Indonesia Ghana
23.19% 3.18% 0.86% 32.36% 6.15% 4.20% 3.58% 3.15% 2.15% 2.12% 1.93% 1.35% 1.29% 85.49% 14.51%
SA: South Africa , T&T: Trinidad &Tobago, Swiss : Switzerland