faculty of information technolog y - …mypctbc.co.za/het2016/mict/diploma in information technology...
TRANSCRIPT

FACULTY OF INFORMATION TECHNOLOGY
YEAR 3 SEMESTER 1
IT PROJECT MANAGEMENT 600

2
Registered with the Department of Higher Education as a Private Higher Education Institution under the Higher Education Act, 1997.
Registration Certificate No. 2000/HE07/008
FACULTY OF INFORMATION TECHNOLOGY
LEARNER GUIDE
MODULE: IT PROJECT MANAGEMENT (1ST SEMESTER)
AUTHOR: Miss. Nkosikhona Msweli
EDITOR: Mr. Sahil Sahue
FACULTY HEAD: Isaka Reddy
Copyright © 2016
RICHFIELD GRADUATE INSTITUTE OF TECHNOLOGY (Pty) Ltd
Registration Number: 2000/000757/07
All rights reserved; no part of this publication may be reproduced in any form or by any means,
including photocopying machines, without the written permission of the Institution.
3
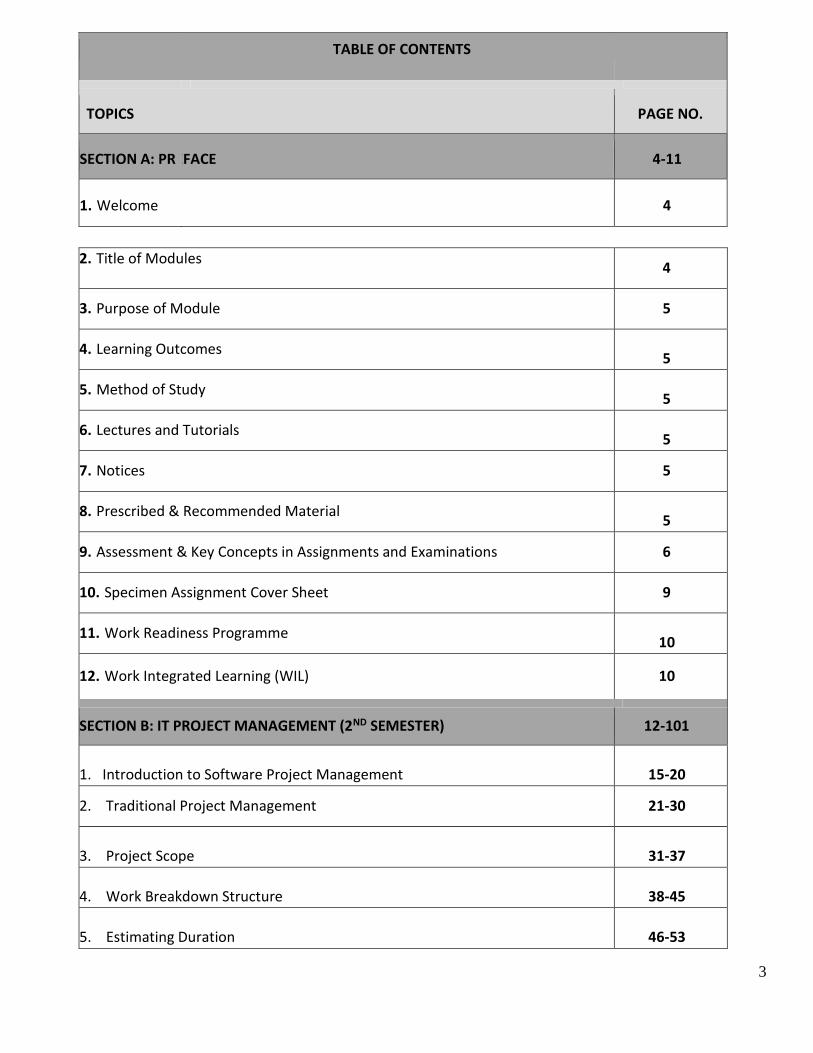
TABLE OF CONTENTS
TOPICS PAGE NO.
SECTION A: PR EFACE 4-11
1. Welcome
4
2. Title of Modules 4
3. Purpose of Module 5
4. Learning Outcomes 5
5. Method of Study 5
6. Lectures and Tutorials 5
7. Notices 5
8. Prescribed & Recommended Material 5
9. Assessment & Key Concepts in Assignments and Examinations 6
10. Specimen Assignment Cover Sheet 9
11. Work Readiness Programme 10
12. Work Integrated Learning (WIL) 10
SECTION B: IT PROJECT MANAGEMENT (2ND SEMESTER) 12-101
1. Introduction to Software Project Management 15-20
2. Traditional Project Management 21-30
3. Project Scope 31-37
4. Work Breakdown Structure 38-45
5. Estimating Duration 46-53

4
6. Project Network Diagram 54-66
7. Resource Availability 67-72
8. Joint Project Planning 73-76
9. The Project Team 77-84
10. Resource Availability 85-91
11. Critical Chain Project Management 92-98
12. Project Closure 99-101
SECTION A: PREFACE
1. WELCOME
Welcome to the Faculty of Information Technology at Richfield Graduate Institute of Technology. We trust you
will find the contents and learning outcomes of this module both interesting and insightful as you begin your
academic journey and eventually your career in the Information Technology realm.
This section of the study guide is intended to orientate you to the module before the commencement of formal
lectures. The following lectures will focus on the common study units described:
SECTION A: WELCOME & ORIENTATION
Study unit 1: Orientation Programme
Introducing academic staff to the students by Academic Programme Manager.
Introduction of Institution Policies.
Lecture 1
Study unit 2: Orientation of Students to Library and Students Facilities
Introducing students to Physical Infrastructure
Lecture 2

5
Study unit 3: Distribution and Orientation of IT Project Management Learner
Guide, Textbooks and Prescribed Materials
Lecture 3
Study unit 4: Discussion on the Objectives and Outcomes of IT Project
Management
Lecture 4
Study unit 5: Orientation and guidelines to completing Assignments
Review and Recap of Study units 1-4 and special guideline to late registrations
Lecture 5
2. TITLE OF MODULES, COURSE, CODE, NQF LEVEL, CREDITS & MODE OF DELIVERY
1ST SEMESTER INFORMATION
TECHNOLOGY
Title Of Module:
Code:
NQF Level:
Credits:
Mode of Delivery:
IT Project Management
ITPM 6
10
Contact
3. PURPOSE OF MODULE
3.1 IT Project Management
Students will be guided through the process of being able to manage IT projects in an Information technology (IT)
environment.
4. LEARNING OUTCOMES
On completion of these modules, students should be able to:
• Identify typical problems encountered during a major project
• Define a project and recall its characteristics
• List the types of project teams and name the advantages and disadvantages of each

6
• Identify factors that contribute to cooperation between members of a project team Ability to use Project
Procurement Management Strategies
5. METHOD OF STUDY
Only the key sections that have to be studied are indicated under each topic in this study guide are expected to
have a thorough working knowledge of the prescribed text book. These form the basis for tests, assignments and
examinations. To be able to do the activities and assignments for this module, and to achieve the learning
outcomes and ultimately to be successful in the tests and examination, you will need an in-depth understanding
of the content of these sections in the learning guide and the prescribed books. In order to master the learning
material, you must accept responsibility for your own studies. Learning is not the same as memorising. You are
expected to show that you understand and are able to apply the information. Use will also be made of lectures,
tutorials, case studies and group discussions to present this module.
6. LECTURES AND TUTORIALS
Students must refer to the notice boards on their respective campuses for details of the lecture and tutorial time
tables. The lecturer assigned to the module will also inform you of the number of lecture periods and tutorials
allocated to a particular module. Prior preparation is required for each lecture and tutorial. Students are
encouraged to actively participate in lectures and tutorials in order to ensure success in tests, assignments and
examinations.
7. NOTICES
All information pertaining to these modules such as tests dates, lecture and tutorial time tables, assignments,
examinations etc will be displayed on the notice board located on your campus. Students must check the notice
board on a daily basis. Should you require any clarity, please consult your lecturer, or programme manager, or
administrator on your respective campus.
8. PRESCRIBED & RECOMMENDED MATERIAL
8.1 . Prescribed Material
8.1.1. Schwalbe K: (2007) Information Technology Project Management, 4th Edition. Thomson
The purchasing of prescribed books is for the students own account and is compulsory for all students. This guide
will have limited value if not accompanied by the prescribed text books.
8.2. Recommended Materials
8.2.1. Meredith J.R, Mantel S.J: (2009) Project Management- A Managerial Approach, 7th
Edition.
8.2.2. Phillips J: (2002) Project Management- On Track from Start to Finish. Hill Osborne Media

7
NB: Students please note that there will be a limited number of copies of the recommended texts and reference
material that will be made available at your campus library. Students are advised to make copies or take notes of
the relevant information, as the content matter is examinable.
8.3. Independent Research
The student is encouraged to undertake independent research.
8.4. Library Infrastructure
The following services are available to you:
8.4.1. Each campus keeps a limited quantity of the recommended reading titles and a larger variety of similar
titles which you may borrow. Please note that students are required to purchase the prescribed materials.
8.4.2. Arrangements have been made with municipal, state and other libraries to stock our recommended
reading and similar titles. You may use these on their premises or borrow them if available. It is your
responsibility to safe keeps all library books.
8.4.3. PCT&BC has also allocated one library period per week as to assist you with your formal research under
professional supervision.
8.4.4. The computers laboratories, when not in use for academic purposes, may also be used for research
purposes. Booking is essential for all electronic library usage.
9. ASSESSMENT
Final Assessment for this module will comprise two Continuous Assessment tests, an assignment and an
examination. Your lecturer will inform you of the dates, times and the venues for each of these. You may also
refer to the notice board on your campus or the Academic Calendar which is displayed in all lecture rooms.
9.1. Continuous Assessment Tests
There is one compulsory test for the module (in the semester).
9.2. Assignment
There is one compulsory assignment for the module in the semester. Your lecturer will inform you of the
Assessment questions at the commencement of this module.
9.3. Examination
There is one two hour examination for the module. Make sure that you diarize the correct date, time and
venue. The examinations department will notify you of your results once all administrative matters are cleared
and fees are paid up.
The examination may consist of multiple choice questions, short questions and essay type questions. This
requires you to be thoroughly prepared as all the content matter of lectures, tutorials, all references to the
prescribed text and any other additional documentation/reference materials is examinable in both your tests
and the examinations.

8
The examination department will make available to you the details of the examination (date, time and venue) in
due course. You must be seated in the examination room 15 minutes before the commencement of the
examination. If you arrive late, you will not be allowed any extra time. Your learner registration card must be in
your possession at all times.
9.4. Final Assessment
The final assessment for this module will be weighted as follows:
Continuous Assessment Test 1
Continuous Assessment Test 2 40 %
Assignment 1
Total Continuous Assessment 40%
Semester Examinations 60%
Total 100%
9.5. Key Concepts in Assignments and Examinations
In assignment and examination questions you will
notice certain key concepts (i.e. words/verbs) which tell you what is expected of you. For example, you may be
asked in a question to list, describe, illustrate, demonstrate, compare, construct, relate, criticize, recommend or
design particular information / aspects / factors /situations. To help you to know exactly what these key concepts
or verbs mean so that you will know exactly what is expected of you, we present the following taxonomy by
Bloom, explaining the concepts and stating the level of cognitive thinking that theses refer to.
COMPETENCE SKILLS DEMONSTRATED
Knowledge
Observation and recall of information
Knowledge of dates, events, places
Knowledge of major ideas
Mastery of subject matter
Question Cues list, define, tell, describe, identify, show, label, collect, examine,
tabulate, quote, name, who, when, where, etc.

9
Comprehension
Understanding information
Grasp meaning
Translate knowledge into new context
Interpret facts, compare, contrast Order, group,
infer causes predict
consequences Question Cues summarize, describe, interpret, contrast, predict, associate, distinguish,
estimate, differentiate, discuss, extend
Application
Use information
Use methods, concepts, theories in new situations
Solve problems using required skills or knowledge Questions Cues
apply, demonstrate, calculate, complete, illustrate, show, solve, examine,
modify, relate, change, classify, experiment, discover
Analysis
Seeing patterns
Organization of parts
Recognition of hidden meanings
Identification of components Question Cues
analyze, separate, order, explain, connect, classify, arrange, divide, compare, select, explain, infer
Synthesis
Use old ideas to create new ones
Generalize from given facts
Relate knowledge from several areas
Predict, draw conclusions Question Cues
combine, integrate, modify, rearrange, substitute, plan, create, design, invent, what if?, compose, formulate, prepare, generalize, rewrite

10
Evaluation
Compare and discriminate between ideas
Assess value of theories, presentations
Make choices based on reasoned argument
Verify value of evidence recognize subjectivity Question Cues
assess, decide, rank, grade, test, measure, recommend, convince, select, judge, explain, discriminate, support, conclude, compare, summarize

11
10. SPECIMEN ASSIGNMENT COVER SHEET
RICHFIELD GRADUATE INSTITUTE OF TECHNOLOGY IT Project Management 600 (1st Semester)
Assignment Cover Sheet(To be attached to all Assignments – hand written or typed)
Name of Learner:………………………… Student No: …………………………..
Module:…………………………………… Date: …………………………………. ICAS
Number ………………………… ID Number …………………………..
The purpose of an assignment is to ensure that one is able to: • Interpret, convert and evaluate text. • Have sound understanding of key fields viz principles and theories, rules, concepts and awareness
of how to cognate areas.
• Solve unfamiliar problems using correct procedures and corrective actions. • Investigate and critically analyze information and report thereof. • Present information using Information Technology. • Present and communicate information reliably and coherently. • Develop information retrieval skills. • Use methods of enquiry and research in a disciplined field.
ASSESSMENT CRITERIA (NB: The allocation of marks below may not apply to certain modules like EUC and Accounting)
A. Content- Relevance.
Question Number Mark
Allocation Examiner’s
Mark Moderator’s
Marks Remarks
1
2
3
4
5
6
7
8
9
10
Sub Total 70 Marks
B. Research (A minimum of “TEN SOURCES” is recommended)
Library, EBSCO, Emerald Journals, Internet, Newspapers, Journals, Text Books, Harvard method of
referencing
Sub Total 15 Marks
C. Presentation

12
Introduction, Body, Conclusion, Paragraphs, Neatness, Integration, Grammar / Spelling, Margins on
every page, Page Numbering, Diagrams, Tables, Graphs, Bibliography
Sub Total 15 Marks
Grand Total 100Marks
NB: All Assignments are compulsory as it forms part of continuous assessment that goes towards the final mark.
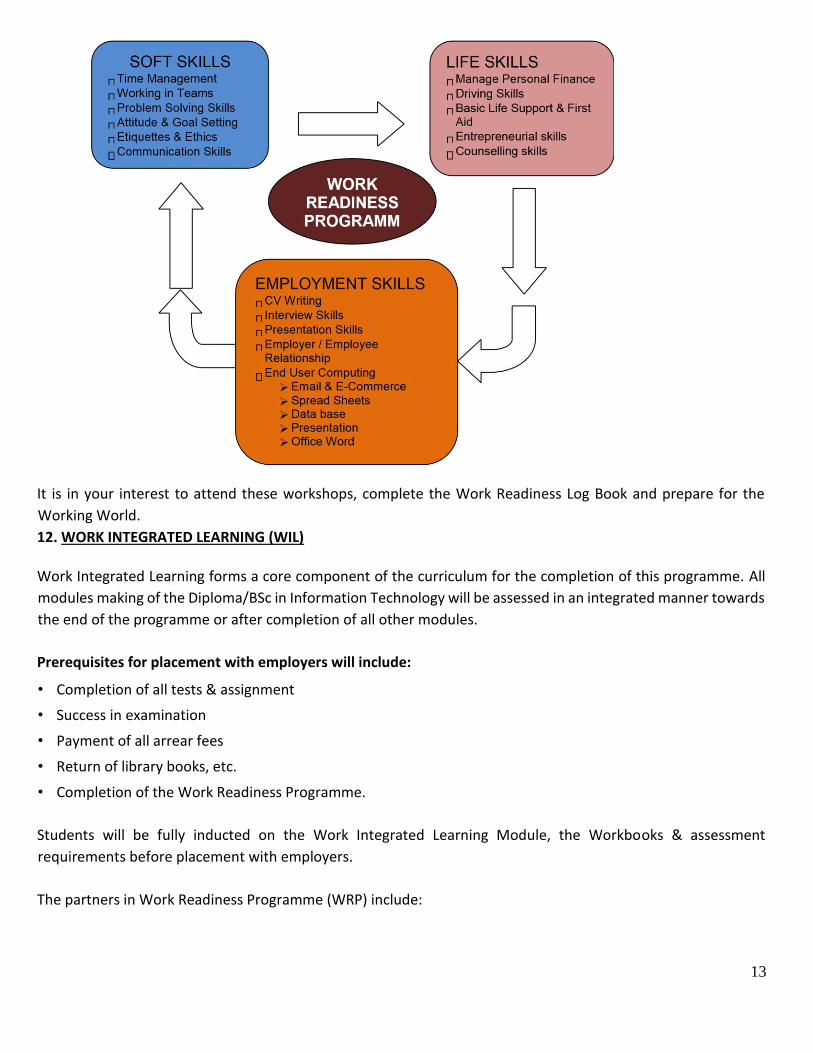
11. WORK READINESS PROGRAMME (WRP)
In order to prepare students for the world of work, a series of interventions over and above the formal curriculum,
are concurrently implemented to prepare students.
These include:
• Soft skills
• Employment skills
• Life skills
• End –User Computing (if not included in your curriculum)
The illustration below outlines some of the key concepts for Work Readiness that will be included in your
timetable.
13
It is in your interest to attend these workshops, complete the Work Readiness Log Book and prepare for the
Working World.
12. WORK INTEGRATED LEARNING (WIL)
Work Integrated Learning forms a core component of the curriculum for the completion of this programme. All
modules making of the Diploma/BSc in Information Technology will be assessed in an integrated manner towards
the end of the programme or after completion of all other modules.
Prerequisites for placement with employers will include:
• Completion of all tests & assignment
• Success in examination
• Payment of all arrear fees
• Return of library books, etc.
• Completion of the Work Readiness Programme.
Students will be fully inducted on the Work Integrated Learning Module, the Workbooks & assessment
requirements before placement with employers.
The partners in Work Readiness Programme (WRP) include:

14
Good luck with your studies…
Isaka Reddy Dean: Faculty of Information Technology
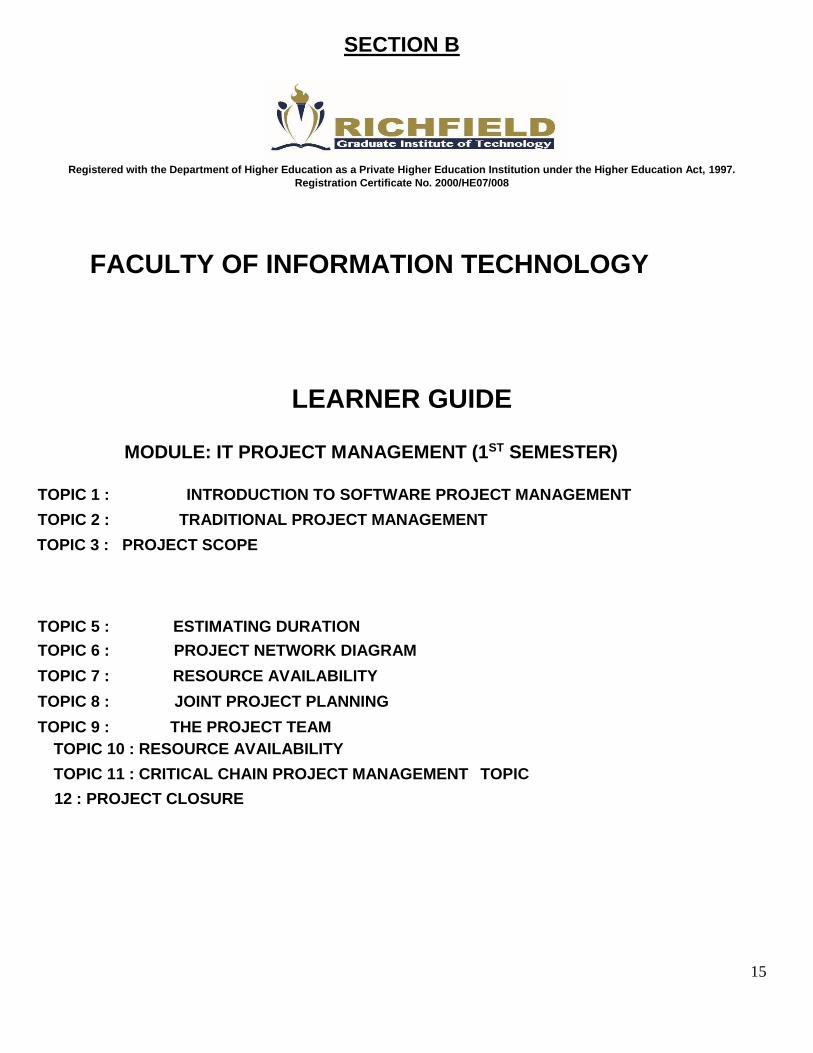
15
SECTION B
Registered with the Department of Higher Education as a Private Higher Education Institution under the Higher Education Act, 1997.
Registration Certificate No. 2000/HE07/008
FACULTY OF INFORMATION TECHNOLOGY
LEARNER GUIDE
MODULE: IT PROJECT MANAGEMENT (1ST SEMESTER)
TOPIC 1 : INTRODUCTION TO SOFTWARE PROJECT MANAGEMENT
TOPIC 2 : TRADITIONAL PROJECT MANAGEMENT
TOPIC 3 : PROJECT SCOPE
TOPIC 5 : ESTIMATING DURATION
TOPIC 6 : PROJECT NETWORK DIAGRAM
TOPIC 7 : RESOURCE AVAILABILITY
TOPIC 8 : JOINT PROJECT PLANNING
TOPIC 9 : THE PROJECT TEAM
TOPIC 10 : RESOURCE AVAILABILITY
TOPIC 11 : CRITICAL CHAIN PROJECT MANAGEMENT TOPIC
12 : PROJECT CLOSURE

16
TOPIC 1 : INTRODUCTION TO SOFTWARE PROJECT
MANAGEMENT
INFORMATION
TECHNOLOGY
1.1 Sequence of activities Lecture 6
1.2 Project Parameters
1.3 Scope Triangle
Lecture7 1.4 Project Classification
TOPIC 2 : TRADITIONAL PROJECT MANAGEMENT
2.1 Principles of traditional project management
Lecture 8
2.2 Life Cycle of traditional project management
2.3 Levels of traditional project management Lecture 9
2.4 Quality Management
2.5 Risk Management
Lecture 10 2.6 Procurement Management
2.7 Pin Curve
TOPIC 3 : PROJECT SCOPE
3.1 Reasons for a project’s success Lecture11
3.2 Conditions of satisfaction
Lecture 12 3.3 Creating the project overview statement
3.4 Submitting a project for approval Lecture 13

17
3.5 Project definition statement
TOPIC 4 : WORK BREAKDOWN STRUCTURE
4.1 Work breakdown structure
Lecture14
4.2 Uses for the WBS
4.3 Generating WBS
4.4 Criteria to test for completeness in the WBS
Lecture 15 4.5 Using a joint project planning session to build the WBS
4.6 Approaches to building the WBS
4.7 Representing the WBS
TOPIC 5: ESTIMATING DURATION
5.1. Estimating Duration Lecture 16
5.2 Estimating resource management
5.3 Estimating duration as a function of resource availability
Lecture 17 5.4 Estimating cost
TOPIC 6: PROJECT NETWORK DIAGRAM
6.1 A project network diagram
Lecture 18
6.2 Network diagram
6.3 Building the network diagram using the precedence method
6.4 Analysing the initial project network diagram Lecture 19

18
6.5 Management reserve
TOPIC 7: RESOURCE AVAILABILITY
7.1 Considering resource availability
Lecture 20
7.2 Levelling resource
7.3 Acceptably levelled schedule
7.4 Resource levelling strategies
7.5 Cost impact of resource levelling
Lecture 21 7.6 Implementing Micro level project planning
7.7 Work packages
TOPIC: 8 JOINT PROJECT PLANNING
8.1 Purpose of JPP session
Lecture 22
8.2 Planning the JPP session
8.3 Attendees
8.4 The complete planning agenda
Lecture 23 8.5 Project proposal
TOPIC 9: THE PROJECT TEAM
9.1 Project manager vs functional manager
Lecture 24
9.2 Project as motivational development tools
9.3 Recruiting the project team

19
9.4 Organising the project team
Lecture 25
9.5 Establishing team operating rules
9.6 Managing team communication
TOPIC 10: RESOURSE AVAILABILITY
10.1 Purpose of controls
Lecture 26
10.2 Balancing the control systems
10.3 Progress reporting system
10.4 Graphical reporting tools
Lecture 27 10.5 Managing project status meetings
TOPIC 11: CRITICAL CHAIN PROJECT MANAGEMENT
11.1 Understanding PERT/ CPM for project scheduling &
management
Lecture 28 11.2 CCPM vs traditional project management
11.3 Critical chain project management approach
TOPIC 12: PROJECT CLOSURE
12.1 Steps in closing a project
Lecture 29 12.2 Formal acceptance
12.3 Post implementation Audit
Lecture 30 12.4 Final Report

20
TOPIC 1
___________________________________________________________________________________________
1. INTRODUCTION TO SOFTWARE PROJECT MANAGEMENT
_____________________________________________________________________________________
_ LEARNING OUTCOMES
After studying this topic you should be able to:
• Define a project
• List a project’s characteristics
• Understand the three parameters that constrain a project
• Understand the issues around scope creep, hope creep, effort creep, and feature creep Classification of
projects
INTRODUCTION
A project is a sequence of unique, complex, and connected activities having one goal or purpose and that must
be completed by a specific time, within budget, and according to specification.
This definition tells us quite a bit about a project. To appreciate just what constitutes a project let’s look at each
part of the definition.
1.1 SEQUENCE OF ACTIVITIES
A project comprises a number of activities that must be completed in some specified order, or sequence. An
activity is a defined chunk of work. The sequence of the activities is based on technical requirements, not on
management considerations. To determine the sequence, it is helpful to think in terms of inputs and outputs as
follows:
• What is needed as input in order to begin working on this activity?
• What activities produce those as output?
The output of one activity or set of activities becomes the input to another activity or set of activities.
Unique Activities
The activities in a project must be unique. A project has never happened before, and it will never happen again
under the same conditions. Something is always different each time the activities of a project are repeated.
Usually the variations are random in nature—for example, a part is delayed, someone is sick, a power failure
occurs. These are random events that can happen, but we never are sure of when, how, and with what impact
on the schedule. These random variations are the challenge for the project manager.
Complex Activities
The activities that make up the project are not simple, repetitive acts, such as mowing the lawn, painting the
house, washing the car, or loading the delivery truck. They are complex. For example, designing an intuitive user
interface to an application system is a complex activity.

21
Connected Activities
Connectedness implies that there is a logical or technical relationship between pairs of activities. There is an order
to the sequence in which the activities that make up the project must be completed. They are considered
connected because the output from one activity is the input to another. For example, we must design the
computer program before we can program it.
Unconnected Activities
You could have a list of unconnected activities that must all be complete in order to complete the project. For
example, consider of developing a payroll system. With some exceptions, the different modules of payroll system
like, data entry module, updation module, calculation module etc. can be developed separately in any order.
1.2 PROJECT PARAMETERS
Five constraints operate on every project:
• Scope
• Quality
• Cost
• Time
• Resources
These constraints are an interdependent set; a change in one can cause a change in another constraint to restore
the equilibrium of the project. In this context, the set of five parameters form a system that must remain in
balance for the project to be in balance.
Scope
Scope is a statement that defines the boundaries of the project. It tells not only what will be done but also what
will not be done. Scope may also be referred to as a document of understanding, a scoping statement, a project
initiation document, and a project request form. It is critical that scope be correct.
Quality
Two types of quality are part of every project:
• The first is product quality. This refers to the quality of the deliverable from the project.
• The second type of quality is process quality, which is the quality of the project management process
itself. The focus is on how well the project management process works and how can it be improved.
A sound quality management program with processes in place that monitor the work in a project is a good
investment. Not only does it contribute to customer satisfaction, it helps organizations use their resources more
effectively and efficiently by reducing waste and rework. Quality management is one area that should not be
compromised. The payoff is a higher probability of successfully completing the project and satisfying the
customer.
22
Cost
The money required for doing the project is another variable that defines the project. It is best thought of as the
budget that has been established for the project. This is particularly important for projects that create
deliverables that are sold either commercially or to an external customer. Cost is a major consideration
throughout the project management life cycle. There may be three considerations:
a) The first consideration occurs at an early and informal stage in the life of a project where, the customer can
simply offer a figure about equal to what he or she had in mind for the project. This number could be fairly
close to or wide of the actual cost for the project.
b) In the second consideration, the consultants often encounter situations in which the customer is willing to
spend only a certain amount for the work. In these situations, you do what at most you can do with in your
limits.
c) In more formal situations, the project manager prepares a proposal for the projected work. That proposal
includes an estimation of the total cost of the project. The proposal allows the customer to base his or her
decision to start the project or to go on for better estimates.
Time
The customer specifies a timeframe or deadline date within which the project must be completed. To a certain
extent, cost and time are inversely related to one another. The time a project takes to be completed can be
reduced, but cost increases as a result.
Resources are assets, such as people, equipment, physical facilities, or inventory that have limited availabilities,
can be scheduled, or can be leased from an outside party. Some are fixed; others are variable only in the long
term. In any case, they are central to the scheduling of project activities and the orderly completion of the project.
1.3 SCOPE TRIANGLE
The triangle in figure 1.1 is called the "Scope Triangle" or the "Quality Triangle". The triangle illustrates the
relationship among three primary forces in a project. The geographic area inside the triangle represents the scope
and quality of the project. Lines representing time, cost, and resource availability bound scope and quality. Time
is the window of time within which the project must be completed. Cost is the budget available to complete the
project. Resources are any consumables used on the project. People, equipment availability, and facilities are
examples. The normal situation is that one of these factors is fixed and the other two will vary in inverse
proportion to each other. For example time is often fixed and the quality of the end product will depend on the
cost or resources available. Similarly if you are working to a fixed level of quality then the cost of the project will
largely be dependent upon the time available (if you have longer you can do it with fewer people).

23
Figure 1.1: The Scope Triangle
Scope Creep
Scope creep is the term that has come to mean any change in the project that was not in the original plan. This
phenomenon can occur when the scope of a project is not properly defined, documented, or controlled. It is
generally considered a negative occurrence that is to be avoided.
Typically, the scope increase consists of either new products or new features of already approved product designs,
without corresponding increases in resources, schedule, or budget. As a result, the project team risks drifting
away from its original purpose and scope into unplanned additions. As the scope of a project grows, more tasks
must be completed within the budget and schedule originally designed for a smaller set of tasks. Thus, scope
creep can result in a project team overrunning its original budget and schedule. Scope creep can be a result of:
• poor change control
• lack of proper initial identification of what is required to bring about the project objective
• weak project manager or executive sponsor
• poor communication between parties
Scope creep is a risk in most projects. Scope creep often results in cost overrun.
Your job as project manager is to figure out how these changes can be accommodated.
Hope Creep
Hope creep is the result of a project team member’s getting behind schedule, reporting that he or she is on
schedule, but hoping to get back on schedule by the next report date.
24
Hope creep is a real problem for the project manager. The project manager must be able to verify the accuracy
of the status reports received from the team members. This does not mean that the project manager has to check
into the details of every status report. Random checks can be used effectively.
Effort Creep
Effort creep is the result of the team member’s working but not making progress proportionate to the work
expended. Every member has worked on a project that always seems to be 95 percent complete no matter how
much effort is expended to complete it. Each week the status report records progress, but the amount of work
remaining doesn’t seem to decrease proportionately. Other than random checks, the only effective thing that the
project manager can do is to increase the frequency of status reporting by those team members who seem to
suffer from effort creep.
Feature Creep
Closely related to scope creep is feature creep. Feature creep results when the team members arbitrarily add
features and functions to the deliverable that they think the customer would want to have. The problem is that
the customer didn’t specify the feature, probably for good reason. If the team member has strong feelings about
the need for this new feature, formal change management procedures can be employed.
1.4 PROJECT CLASSIFICATIONS
Projects can be characterized in terms of a detailed set of variables. The value of these variables is used to
determine which parts of the project management methodology must be used and which parts are left to the
discretion of the project manager to use as he or she sees fit.
Classification by Project Characteristics
Many organizations have chosen to define a classification of projects based on such project characteristics as
these:
• Risk: Establish levels of risk (high, medium, low)
• Business value: Establish levels (high, medium, low)
• Length: Establish several categories (i.e., 3 months, 3 to 6 months, 6 to 12 months, etc.) Complexity:
Establish categories (high, medium, low)
• Technology used: Establish several categories (well-established, used somewhat, basic familiarity,
unknown, etc.)
• Number of departments affected: Establish some categories (one, few, several, all)
• Cost
The project profile determines the classification of the project. The classification defines the extent to which the
project management methodology is to be used.
Project types are as follows:
1. Type A projects: Projects of Type A are the high-business-value, high-complexity and the most challenging
projects the organization undertakes.

25
Type A projects use the latest technology, which, when coupled with high complexity, causes risk to be high also. To maximize the probability of success, the organization requires that these projects utilize all the methods and tools available in their project management methodology. 2. Type B projects: Projects of Type B are shorter in length, yet they still are significant projects for the
organization. All of the methods and tools in the project management process are probably required. The
projects generally have good business value and are technologically challenging.
3. Type C projects: Projects of Type C are the projects occurring most frequently in an organization. They are
short by comparison and use established technology. Many are projects that deal with the infrastructure of
the organization. A typical project team consists of five people, the project lasts six months, and the project
is based on a less-than-adequate scope statement. Many of the methods and tools are not required for these
projects. The project manager uses those tools, which are optional, if he or she sees value in their use.
4. Type D projects: Projects of Type D just meet the definition of a project and may require only a scope
statement and a few scheduling pieces of information. A typical Type D project involves making a minor
change in an existing process or procedure or revising a course in the training curriculum.
Table 1.1: A Hypothetical Example of a Classification Rule
Class Duration Risk Complexity Technology Likelihood of
Type > 18 High High Breakthrough problemsCertain
Type B 9–18 Medium Medium Current Likely
Type C 3–9 months Low Low Best of breed Some
Type D < 3 months Very low Very low Practical None
Classification by Project Type
There are many situations where an organization repeats projects that are of the same type. Following are some
examples of project types:
• Installing software
• Recruiting and hiring
• Setting up hardware in a field office
• Soliciting, evaluating, and selecting vendors l Updating a corporate procedure
• Developing application systems
These projects may be repeated several times each year and probably will follow a similar set of steps each time
they are done. It is important to note then that we can classify project by type of project. The value in doing this
is that each type of project utilizes a specific subset of the project management methodology. For example,
projects that involve updating a corporate procedure are far less risky than application systems development
projects. Therefore, the risk management aspects of each are very different.

26
Risk management processes will be less important in the corporate procedure project; conversely, they will be
very important in the applications development project.
REVIEW QUESTIONS
1. Define a project. Also explain about each major constituent of your definition.
2. What do you understand by connected and unconnected activities in a project? Explain with the help of
examples.
3. What are the major constraints of a project? Explain them also.
4. What is a scope triangle? Draw a scope triangle and explain its importance.
5. Write short note on the following:
a) Scope creep
b) Hope creep
c) Effort creep
d) Feature creep
6. What causes scope creep?
7. List the various characteristics that you can use for the classification of projects.
8. What do you understand by Class A, Class B, Class C and Class D projects?
27
TOPIC 2
______________________________________________________________________________________
2. TRADITIONAL PROJECT MANAGEMENT
__________________________________________________________________________________
___ LEARNING OUTCOMES
After studying this topic you should be able to:
• Understand the relationship between people management and project management
• Explain the principles of Traditional Project Management
• Know the phases of the traditional project management life cycle
• Appreciate the significance of the project pain curve
INTRODUCTION
When we talk about the principles of management, usually it means by the management of people. The
management of people includes defining what the business unit will do, planning and organizing the staff who
will do it, monitoring their performance of the tasks assigned them, and finally bringing a close to their efforts.
Those same principles also apply to projects.
2.1 PRINCIPLES OF TRADITIONAL PROJECT MANAGEMENT
Project management is a method and a set of techniques based on the accepted principles of management
used for defining, planning, executing, and controlling work activities to reach a desired end result on time
and within budget and according to specification.
Defining the Task
In Traditional Project Management (TPM) the first tasks for project managers is to define the work that needs
to be done in their area of responsibility. For the project manager, defining the tasks to do is a preliminary
and important phase of the project life cycle. In this phase, the customer and the project manager come to
an agreement about several important aspects of the project. Regardless of the format used, every good
defining phase answers five basic questions:
• What is the problem or opportunity to be addressed?
• What is the goal of the project?
• What objectives must be met to accomplish the goal?
• How will we determine if the project has been successful?
• Are there any assumptions, risks, or obstacles that may affect project success? The defining phase sets
the scope of the project.
Planning
In TPM the project plan is a roadmap to how the work will be performed. It is also a tool for decision making.
The plan suggests alternative approaches, schedules, and resource requirements from which the project
manager can select the best alternative.
There are three benefits to developing a project plan:

28
1. Planning reduces uncertainty: Generally, the project work does not occur exactly as planned, but planning
the work allows the project manager to consider the likely outcomes and to put the necessary corrective
measures in place.
2. Planning increases understanding: The act of planning gives a better understanding of the goals and
objectives of the project.
3. Planning improves efficiency: Once we have defined the project plan and the necessary resources to carry
out the plan, we can schedule the work to take advantage of resource availability. We also can schedule
work in parallel; that is, we can do tasks concurrently, rather than in series. By doing tasks concurrently,
we can shorten the total duration of the project. We can maximize our use of resources and complete the
project work in less time than by taking other approaches.
Executing
Executing the project plan is equivalent to authorizing the staff to perform the tasks that define their
respective jobs.
Executing the project plan involves four steps:
1. Identify the specific resources (person power, materials, and money) that will be required to accomplish
the work defined in the plan.
2. Assign workers to activities.
3. Schedule activities with specific start and end dates.
4. Launch the plan.
The final specification of the project schedule brings together all the variables associated with the project.
Controlling
The purpose of project monitoring and control is to keep the team and management up to date on the
project's progress. If the project deviates from the plan, then the project manager can take action to correct
the problem.
Closing
Closing a project is a formal means of signaling the completion of the project work and the delivery of the
results to the customer. The closing phase evaluates what occurred during the project and provides historical
information for use in planning and executing later projects. This historical information is best kept in a
document called a project notebook. To be useful, the notebook should be in an electronic form so that it is
easy to retrieve and summarize project information for use in projects currently being planned.
Every good closing provides answers to the following questions:
• Do the project deliverables meet the expectations of the requestor?
• Do the project deliverables meet the expectations of the project manager?
• Did the project team complete the project according to plan?
• What information was collected that will help with later projects?
• How well did the project management methodology work and how well did the project team follow
it?
• What lessons have we learned from this project?

29
The closing phase is very important to TPM, but unfortunately it is the part that is most often neglected or
omitted by management.
2.2 LIFE CYCLE OF TRADITIONAL PROJECT MANAGEMENT
The traditional project management is a successful methodology to manage software projects. The following
section describes about the life cycle of traditional project management.
Phases of Traditional Project Management
There are five phases to the TPM life cycle, (Each phase is discussed in detail in later lessons) each of which
contains five steps:
1. Scope the project
• State the problem/opportunity.
• Establish the project goal.
• Define the project objectives.
• Identify the success criteria.
• List assumptions, risks, and obstacles.
2. Develop the project plan • Identify project activities.
• Estimate activity duration.
• Determine resource requirements.
• Construct/analyze the project network.
• Prepare the project proposal.
3. Launch the plan
• Recruit and organize the project team. Establish team operating rules Level project resources.
• Schedule work packages.
• Document work packages.
4. Monitor/control project progress
• Establish progress reporting system. Install change control tools/process.
• Define problem-escalation process.
• Monitor project progress versus plan.
• Revise project plans.
5. Close out the project
• Obtain client acceptance.
• Install project deliverables.
• Complete project documentation.

30
• Complete post-implementation audit.
• Issue final project report.
The five phases are performed in sequence, with one feedback loop from the monitor/control progress phase
to develop detailed plan phase. Figure 2.1 shows the TPM life cycle
Figure 2.1: The TPM Life Cycle
Scope the Project
The first phase of the TPM life cycle is the scoping phase. The scoping phase plans the project. The good and
proper planning decreases the time required to complete a project, reduces risk and can increase productivity
by as much as 50 percent. Every project has one goal. The goal is an agreement between the requestor and
the project manager about the deliverable i.e., what is to be accomplished in the project. In TPM life cycle,
the goal is bounded by a number of objective statements. Taken as a pair, the goal and objective statements
scope the project.
Once the scope is complete, it is documented in the form of the Project Overview Statement (POS). The POS
is a brief document (usually one page) that describes, in the language of the business, the following:
• What problem or opportunity is addressed by the project? l What are the project’s goal and
objectives?
• How will success be measured?
• What assumptions, risks, and obstacles may affect the project that you wish to call to the attention of
senior management?

31
The POS is also referred to as a document of understanding, scope statement, initial project definition, and
statement of work. POS is used to decide whether the project should go forward to the detailed planning
phase. If the project, as described in the POS, is approved, it moves to the detailed plan phase.
Develop the Detailed Plan
The second phase of the TPM life cycle is to develop the project plan. In this phase, the details about the
project are determined. This document includes the following:
• A detailed description of each work activity
• The resources required to complete the activity
• The scheduled start and end date of each activity
• The estimated cost and completion date of the project
Once the project proposal is approved, the project enters the next phase of the TPM life cycle, in which the
final details of the work schedule are completed and project work begins.
Launch the Plan
The third phase of the TPM life cycle is to launch the plan. In this phase, the project team is specified. In
addition to identifying the team at this time: • The exact work schedules are determined.
• Detailed descriptions of the tasks in the project are developed.
• Team operating rules, reporting requirements, and project status meetings are established.
The completion of this final planning activity signals the beginning of the monitoring phase.
Monitor/Control Project Progress
As soon as project work commences, the project enters the monitoring phase. A number of project status
reports will have been defined in the previous phase and are used to monitor the project’s progress.
Close Out the Project
The final phase of the TPM life cycle begins when the customer says the project is finished. The completeness
of the project will have been specified and agreed to by the customer as part of the project plan.
2.3 LEVELS OF TRADITIONAL PROJECT MANAGEMENT
There are three variations to the TPM life cycle. Which cycle you use in a given project depends on what
management needs you are trying to meet. Defining, planning, and organizing. The first and simplest of the
three cycles is concerned with getting the project going on without any follow-up on performance against
plan. Usually, one person (project manager and client are often the same person) is solely responsible for
completing all project activities. In such cases there is value in planning the project, but limited value in
implementing the control and close phases. Here the interest is only in laying out a strategy for doing the
work. Often the project following this cycle will have to be planned in conjunction with one or more other
projects. The intent is to set a time line for completing the project in conjunction with others underway. This
cycle is closely related to good time-management practices.

32
Defining, planning, organizing, controlling. The second cycle is most often thought of as project
management. Getting the project started is only half (or actually much less than half) of the effort. The more
people, the more activities, and the more resources. Defining, planning, organizing, controlling, closing. The
astute project manager will want to learn from the project that follows this cycle. Several questions can be
answered from an audit of the records from completed projects.
2.4 QUALITY MANAGEMENT
In order to meet customer requirements, and do so on time and within budget, the project manager must
incorporate sound quality management practices.
Continuous Quality Management
Continuous Quality Management is a procedure that a company can use to improve its business processes.
Organizations use this procedure to attain and sustain a competitive position in fast-paced information age
industries. The phases of continuous quality management are definition of vision, mission-critical success
factors, and business processes.
The Continuous Quality Management Model has cyclical feedback loops. These feedback loops are used for
the new improvement ideas to be incorporated in the project which may have arisen while the current project
was being conducted. Therefore, the TPM phase of the model is adaptive. Scope changes will often result
from lessons learned during project execution.
Process Quality Management
A second tool is integrated with the continuous quality management module, after the definition steps. This
tool, process quality management, is used to relate critical success factors to business processes. This
establishes the foundation on which the Continuous Quality Management Model proceeds to conduct a gap
analysis that identifies processes and steps within processes where improvement opportunities might be
made. Any number of improvement projects can be undertaken, and the resulting improvements are checked
against targeted improvements and further projects commissioned.
2.5 RISK MANAGEMENT
In project management a risk is some future happening that results in a change, either positive or negative,
to the project. For the most part, risk is associated with loss, at least in the traditional sense. Loss can be
estimated. The estimate is a combination of two factors:
• The probability that the event will occur
• The severity of the loss if the event occurs
This estimate forces a choice on the project manager’s part regarding what to do, if anything, to mitigate the
risk and reduce the loss that will occur. The risk analysis and management process answers the following
questions:
• What are the risks?
• What is the probability of loss that results from them?
• How much are the losses likely to cost?
• What might the losses be if the worst happens?

33
• What are the alternatives?
• How can the losses be reduced or eliminated? Will the alternatives produce other risks?
The business decision is to assess how the expected loss compares to the cost of defraying all or some of the
loss and then taking the appropriate action.
Processes for Risk Management
To establish the risk management for the project, the project manager and project team must go through
several processes. The first is identifying risk.
Identifying Risk
In this part of the process the entire team is brought together to discuss and identify the risks that are specific
to the current project.
Assessing Risk
There are two major factors in assessing risk.
1. The first one is the probability that the risk event will occur. When the team puts together the risk
identification list, nothing should be ruled out at first. Let the team brainstorm risk without being
judgmental. The team will put up some risks with small probabilities. Those risks are so small that you can
ignore them. For instance, the risk that a meteor will destroy the building in which you work is miniscule.
2. The second part of risk assessment is the impact the risk will have on the project. If a risk has a probability
of 50 percent that it will occur, you need to assess what the impact will be, because a 50-50 chance of
something happening is fairly high. If, however, the risk event has a low impact rating, you won’t need to
manage it. This information should also be discussed at the first risk meeting.
Planning Risk Response
The next step in risk management is to plan, as much as possible, the responses that will be used in the event
that the identified risks occur. For instance, you may want to include a clause in your hardware contract with
the vendor that if the servers don’t get to you by a certain date, they will pay a penalty. This penalty gives the
vendor an incentive to perform and mitigate the risks involved in late delivery of key equipment. For all the
risks listed in the risk identification that you choose to act upon, you should have some type of action in mind.
It’s not enough simply to list the risks; you need to plan to do something about the risk events if they occur.
Risk Monitoring and Control
In this process you need to monitor and control the project risks. The process of writing down the risks and
assessing them makes everyone on the project team aware of their existence and is a good place to start. You
need to put together a risk log. This document lists all risks that you want to manage, identifies who is
supposed to manage the risk, and specifies what should be done to manage the risk event. A risk log is a
simple template that can be done in MS Word. Table 2.1 gives an example, and the following bulleted list
explains each column. Table 2.1: Risk Log Example
ID Number
Risk Description
Risk Owner
Action to Be Taken

34
Outcome
• The ID Number always remains the same, even if the risk event has occurred and been managed. If
you take the risk off of the list and file it elsewhere, don’t assign the old number to a new risk. Leave
the number the same or there will be a great deal of confusion.
• The Risk Description is a short statement of the risk event.
• The Risk Owner is the person who has to manage the listed risk.
• The Action to Be Taken lists what the owner is going to do to deal with the risk event.
• The Outcome tells you what happened.
Use this form to keep track of risk in the project and you’ll have control over it.
2.6 PROCUREMENT MANAGEMENT
As a project manager, you will always have projects for which you must procure hardware, software, or
services from outside sources. This process is procurement, and the professional project manager must have
a basic understanding of the procedure so that he or she can make sure that the organization is getting the
right materials at the best cost. To manage procurement, you need to go through a few processes, which are
discussed in the next few sections.
Planning Procurement
Planning procurement involves both what you’re going to procure and the time that you’re going to procure
it. For this you have to gather requirements for the items/software to purchase.
Soliciting Requests for Proposals
Once you’ve done your requirements gathering, you can begin to prepare procurement documents for
solicitation. These documents, called Requests for Proposals (RFPs), are what the vendors use to determine
how they should respond to your needs. The clearer the RFP, the better off you and the vendor are, because
you will be giving basic information on what you want. The more specific you are, the better the chance that
the vendor will be able to respond to you quickly and efficiently. You need to state the time conditions for
response, which means that you state how many days you will give people to respond, as well as how long
you will review the responses before making a choice. By putting a time line on both the vendor and your
organization, the process goes faster, and expectations are clear at the beginning of the process.
Managing RFP Questions and Responses
You need to have some mechanism where you can answer questions concerning the RFP. There are a couple
key ways to do this.
• You can call a vendor meeting at which you answer all questions posed by the vendors that are
present.
• A more modern approach is to put your RFP online and to respond to questions online. This
arrangement gives everyone interested in responding to your RFP a chance to see other organization’s
questions and to have a permanent record of your responses to questions posed.

35
Selecting Vendors
Before you even start reading the responses to your proposal, set the standards for choosing a given vendor.
These criteria may be technically based, experience based, or cost based, but whatever basis you use for
choosing a vendor, it must remain the same for all of the vendors.
Managing Contracts
Specifically, in the case where the application is to be written solely by the vendor, the project manager’s
primary job is contract management. Contract management involves the following:
• The vendor must supply you with deliverable dates so that you can tell if the project is on time.
• The vendor should also supply a Work Breakdown Structure detailing how the vendor decomposes
the scope of the project and showing the tasks that make up the completion of a deliverable.
• You need to have regular status meetings to track progress. This meeting should be formal and should
occur on specified dates.
In your contract, state who the contract manager will be for your organization.
Closing out the Contract
Closing out the contract is often an overlooked function of the project manager. It both certifies what has
been done and gives all parties a chance to deal with open issues and final payments. The professional project
manager will be aware of all of the steps that must be followed in the procurement process even though he
or she may not be the person directly responsible for managing them. Consider the following as you bring a
contract to a close:
• When you write your RFP, state clearly how the project finishes and what the final deliverable is.
Failure to do this will almost always lead to cost overruns in the form of maintenance activities under
the heading of project work.
• After the contract is closed, make sure you file all of the materials used during the project. These
materials include the original RFP, the project baseline, the scope statement, the WBS, the various
plans used to manage the project, and all changes, including those that were requested but turned
down. You also need to show all payments and make sure that any subcontractors on the project were
paid.
• Put all this information into a large file and keep it permanently.
2.7 PAIN CURVE
The planning is very essential for the success of a project. The pain curve (see Figure 2.2) tells us that proper
planning is painful but pays off in less pain later in the project. To not plan is to expose yourself to significant
pain as the project commences. In fact, that pain usually continues to increase. It would continue to increase
indefinitely except that someone usually pulls the plug on the project once the pain reaches unbearable levels.
The next lessons give you the skills you need to make project planning less painful.

36
Figure 2.2: The Project Management Life Cycle Pain Curve
REVIEW QUESTIONS
1. What is the principle of Traditional Project Management?
2. Write down the basic questions asked for defining a task for TPM.
3. Why planning is necessary for a project? Write down the benefits to develop a project plan.
4. Write down the steps to execute the project plan.
5. What do you do to close a project?
6. Name the phases of a traditional project management life cycle.
7. What is POS?
8. What are the contents of the document required for developing the detailed plan?
9. Explain the three variations of TPM life cycle.
10. Write short notes on the followings for TPM:
a) Quality Management
b) Risk Management
c) Procurement Management
11. What are the processes to establish the risk management for the project?
12. Write down the purpose of pain curve.
37
TOPIC 3
__________________________________________________________________________
3. THE PROJECT SCOPE
LEARNING OUTCOMES
After studying this topic you should be able to:
• Explain the Conditions of Satisfaction development process
• Develop the Conditions of Satisfaction document
• Define the basic parts and function of the Project Overview Statement
• Understand the role of the Project Overview Statement in the project management life cycle
• Write clear goal and objective statements
• Establish measurable criteria for project success
• Identify relevant assumptions, risks, and obstacles
• Discuss attachments to the Project Overview Statement and their role in project approval Create a
Project Definition Statement.
INTRODUCTION
This topic is about the series of activities that lead to a clearly defined and understood definition of what the
project is all about.
3.1 REASONS FOR A PROJECT’S SUCCESS
According to one survey, the top 10 reasons for a project’s success are as follows:
1. Executive management support
2. User involvement
3. Experienced project manager
4. Clear business objectives
5. Minimized scope
6. Standard infrastructure
7. Firm basic requirements
8. Formal methodology
9. Reliable estimates
10. Skilled staff
Obviously, the lack of any of these reasons would be a reason for projects to fail.
3.2 CONDITIONS OF SATISFACTION
If you look behind the list of the top 10 reasons why projects succeed, you will find that communications is a
key to that success in seven of the 10 reasons. The assurance of effective communications is the Conditions
of Satisfaction (COS).

38
The deliverable from the Conditions of Satisfaction will be a one-page document (with attachments) called
the Project Overview Statement (POS). The Project Overview Statement clearly states what is to be done. It is
signed by the parties who completed the Conditions of Satisfaction exercise. Once the POS is approved, the
scoping phase is complete.
Developing the COS
The process of developing the COS involves four parts:
1. Request: A request is made.
2. Clarification: The provider explains what he or she heard as the request. This conversation continues until
the requestor is satisfied that the provider clearly understands the request. Both parties have now
established a clear understanding of the request.
3. Response: The provider states what he or she is capable of doing to satisfy the request.
4. Agreement: The requestor restates what he or she understands that the provider will provide. The
conversation continues until the provider is satisfied that the requestor clearly understands what is being
provided.
Establishing Clarity of Purpose
The next step in the COS process is to negotiate to closure on exactly what will be done to meet the request.
This process repeats itself, as shown in Figure 3.1, until there is an agreed-to request that is satisfied by an
agreed-to response. Obviously, some type of compromise will be negotiated. The final agreement is
documented in the POS.
Figure 3.1: Establishing the Conditions of Satisfaction
This early step of establishing and agreeing to what will be done is very important to the success of the project.
Review COS
The COS is a dynamic agreement that becomes part of the continual project monitoring process. Situations
change throughout the project life cycle and so will the needs of the customer.

39
That means that COS will change. At every major project status review and project milestone, review the COS.
If there is any change in COS, adjust the project plan accordingly.
3.3 CREATING THE PROJECT OVERVIEW STATEMENT (POS)
The Conditions of Satisfaction statement provides the input you need to generate the POS. The POS is a short
document (ideally one page) that concisely states what is to be done in the project, why it is to be done, and
what business value it will provide to the enterprise when completed. The main purpose of the POS is to
secure senior management approval and the resources needed to develop a detailed project plan.
Once approved, the POS becomes the foundation for future planning and execution of the project. It becomes
the reference document for questions or conflicts regarding project scope and purpose.
Parts of the POS
The POS has five component parts:
• Problem/opportunity
• Project goal
• Project objectives
• Success criteria
• Assumptions, risks, obstacles
Stating the Problem/Opportunity
The first part of the POS is a statement of the problem or opportunity that the project addresses. This is critical
because it provides a basis for the rest of the document. A problem or opportunity statement that is known
and accepted by the organization is the foundation on which to build a rationale for the project. It also sets
the priority with which management will view what follows.
Establishing the Project Goal
The second section of the POS states the goal of the project. It means, what you intend to do to address the
problem or opportunity identified in the problem/opportunity section. The purpose of the goal statement is
to get senior management to value the idea enough to read on. Every project has one goal. The goal gives
purpose and direction to the project. It defines the final deliverable or outcome of the project so that
everyone understands what is to be accomplished in clear terms. The goal statement will be used as a
continual point of reference for any questions that arise regarding scope or purpose.
Just like the problem or opportunity statement, the goal statement is short and to the point. Keep in mind
that the more you write, the more you increase the risk that someone will find fault with something you have
said.
Defining the Project Objectives
The third section of the POS is the project objectives. Think of objective statements as a more detailed version
of the goal statements. The purpose of objective statements is to clarify the exact boundaries of the goal
statement and define the boundaries or the scope of your project. In fact, the objective statements you write
for a specific goal statement are nothing more than a decomposition of the goal statement into a set of
40
necessary and sufficient objective statements. That is, every objective must be accomplished in order to reach
the goal, and no objective is superfluous.
An objective statement should contain four parts:
1. An outcome: A statement of what is to be accomplished
2. A time frame: The expected completion date
3. A measure: Metrics that will measure success
4. An action: How the objective will be met
Identifying Success Criteria
The fourth section of the POS answers the question, “Why do we want to do this project?” It is the measurable
business value that will result from doing this project. It sells the project to senior management. The
Conditions of Satisfaction will contain the beginnings of a statement of success criteria. It is also a statement
of the business value to be achieved, and therefore, it provides a basis for senior management to authorize
the resources to do detailed planning. It is essential that the criteria be quantifiable and measurable, and if
possible, expressed in terms of business value. Remember that you are trying to sell your idea to the decision
makers.
No matter how you define success criteria, they all reduce to one of three types:
1. Increased revenue: As a part of the success criteria, that increase should be measured in hard money or
as a percentage of a specific revenue number.
2. Reduced costs: Again, this criterion can be stated as a hard-dollar amount or a percentage of some specific
cost. Be careful here because oftentimes a cost reduction means staff reductions. Staff reductions do not
mean the shifting of resources to other places in the organization. Moving staff from one area to another
is not a cost reduction.
3. Improved service: Here the metric is more difficult to define. It usually is some percentage improvement
in customer satisfaction or a reduction in the frequency or type of customer complaints.
Listing Assumptions, Risks and Obstacles
The fifth section of the POS identifies any factors that can affect the outcome of the project and that you want
to bring to the attention of senior management. These factors can affect deliverables, the realization of the
success criteria, the ability of the project team to complete the project as planned, or any other environmental
or organizational conditions that are relevant to the project. You want to record anything that can go wrong.
Attachment
Even though we strongly recommend a one-page POS, there will be instances in which a longer document is
necessary. As part of their initial approval of the resources to do detailed project planning, senior
management may want some measure of the economic value of the proposed project. They recognize that
many of the estimates are little more than a guess, but they will nevertheless ask for this information. In our
experience, we have seen two types of analyses requested frequently:
• Risk analysis
• Financial analysis

41
1. Risk Analysis: Risk analysis is the most frequently used attachment to the POS. Many business-decision
models depend on quantifying risks, expected loss if the risk materializes, and the probability that the risk
will occur. All of these are quantified, and the resulting analysis guides management in its project approval
decisions.
2. Financial Analysis: Some organizations require a preliminary financial analysis of the project before
granting approval to perform the detailed planning. Although such analyses are very rough because not
enough information is known about the project at this time, they will offer a tripwire for projectplanning
approval. Some of the possible analyses are as follows:
Feasibility Studies
The methodology to conduct a feasibility study is remarkably similar to the problem-solving method:
1. Clearly define the problem.
2. Describe the boundary of the problem—that is, what is in the problem scope and what is outside the
problem scope.
3. Define the features and functions of a good solution.
4. Identify alternative solutions.
5. Rank alternative solutions.
6. State the recommendations along with the rationale for the choice.
7. Provide a rough estimate of the timetable and expected costs.
The project manager will be asked to provide the feasibility study when senior management wants to review
the thinking that led to the proposed solution. A thoroughly researched solution can help build credibility
for the project manager.
Cost/Benefit Analysis
These analyses are always difficult to do because you need to include intangible benefits in the decision
situation. Opt for the direct and measurable benefits to compare against the cost of doing the project and the
cost of operating the new process. If the benefits outweigh the costs over the expected life of the project
deliverables, senior management may be willing to support the project.
Break-even Analysis
This is a time line that shows the cumulative cost of the project against the cumulative revenue or savings
from the project.
Return on Investment
This section analyzes the total costs as compared with the increased revenue that will accrue over the life of
the project deliverables.
3.4 SUBMITTING A PROJECT FOR APPROVAL
Once the POS is complete, it is submitted to management for approval. The approval process is far from a
formality. It is a deliberate decision on the part of senior management that the project as presented does
indeed have business value and that it is worth proceeding to the detailed planning phase. As part of the
approval process, senior management asks several questions regarding the information presented.
42
The approved POS serves three audiences:
1. Senior Management: Their approval is their statement that the project makes enough business sense to
move to the detailed planning stage.
2. Customer: The customer’s approval is his or her concurrence that the project has been correctly described
and he or she is in agreement with the solution being offered.
3. Team: The approved POS is their message from senior management and the customer that the project has
been clearly defined at this high level of detail.
Approval of the POS commits the resources required to complete a detailed plan for the project. It is not the
approval to do the project. Approval to proceed with the project is the result of an approval of the detailed
plan.
Gaining management approval of the POS is a significant event in the life of a project. The approving manager
questions the project manager, and the answers are scrutinized very carefully. While the POS does not have
a lot of detailed analysis supporting it, it is still valuable to test the thinking of the proposer and the validity
of the proposed project. It is not unusual to have the project manager return to the drawing board several
times for more analysis and thought as a prerequisite to management approval. As senior managers review
the POS, you can anticipate the following review questions:
• How important is the problem or opportunity to the enterprise?
• How the project is related to our critical success factors (CSFs)?
• Does the goal statement relate directly to the problem or opportunity?
• Are the objectives clear representations of the goal statement?
• Is there sufficient business value as measured by the success criteria to warrant further expenditures
on this project?
• Is the relationship between the project objectives and the success criteria clearly established?
• Are the risks too high and the business value too low?
• Can senior management mitigate the identified risks?
Participants in the Approval Process
Several managers and professionals participate in the approval process:
1. Core project team: These will be the managers, professionals, and perhaps the customer who will remain
on the project team from the beginning to the very end of the project. They may participate in developing
the POS and reach consensus on what it contains.
2. Project team: Some potential members of the project team are usually known beforehand. Their subject
matter expertise and ideas should be considered as the POS is developed. At least, you should have them
review the POS before submission.
3. Project manager: Ideally, the project manager will have been identified at the start and can participate in
drafting the POS. Because he or she will manage the project, he or she should have a major role to play in
its definition and its approval.
43
4. Resource managers: Those who will be asked to provide the skills needed at the times when they will be
needed are certainly important in the initial definition of the project and later its detailed planning. There
is little point in proposing a project if the resources are not or cannot be made available to the project.
5. Function/Process managers: Project deliverables don’t exist in a vacuum. Several units will provide input
to or receive output from the project products or services. Their advice should be sought. Give them an
early chance to buy into your project.
6. Customer: Our project management methodology includes a significant role for the customer. We have
discussed the COS as a prerequisite to, or a concurrent exercise in developing, the POS. Many
professionals are not skilled in interpersonal communications. Developing the COS is a difficult task.
7. Senior management: Senior management support is a critical factor in successful projects and successful
implementation of the deliverables. Their approval says, “Go and do detailed planning; we are authorizing
the needed resources.”
Approval Criteria
The approval criteria at this stage of the project life cycle are not as demanding as they will be when it’s time
to approve the project for execution or addition to the organization’s project portfolio. All that senior
management is looking for at this point is a rough estimate of the value of the project to the organization.
Their approval at this stage extends only to an approval to plan the project. That detailed project plan will
give them a more specific estimate of the cost of the project. Knowing the actual costs, senior management
can calculate the return that they can expect from this project.
Project Approval Status
In the absence of approval to plan the project, senior management might take one of several courses of
action:
• They may reject the proposal out of hand. That decision will often be based on a comparison of
expected benefits versus total cost coupled with a timeframe as to when the benefits will be realized.
• They may request a recalibration of the goal and scope of the project followed by a resubmission to
seek approval to plan the project.
• They might decide that a later resubmission is in order. In other words, they are not ready to commit
to the project at this time.
Finally, the approval may be associated with a consideration to add the project to the organization’s project
portfolio.
3.5 PROJECT DEFINITION STATEMENT
Just as the customer and the project manager benefit from the POS, the project manager and the project
team can benefit from a closely related document, which we call the Project Definition Statement (PDS). The
PDS uses the same form as the POS but incorporates considerably more detail. The project manager and the
project team use the detailed information provided in the PDS for the following: As a basis for planning
• To capture an idea
• To obtain an agreement from the customer to move forward
• To clarify the project for management
• As a reference that keeps the team focused in the right direction
• As an orientation for new team members

44
• As a method for discovery by the team
Most cases the PDS expands on two sections of the POS:
Project Objectives
In the POS, the project objectives are written so that they can be understood by anyone who might have
reason to read them. In the PDS, the situation is somewhat different. The PDS is not circulated outside the
project team; therefore, the language can be technical and the development more detailed. Project objectives
take on more of the look of a functional requirements or functional specification document. The purpose is
to provide a description that the project team can relate to.
Assumptions, risks and obstacles
The POS contains statements of assumptions, risks, and obstacles that will be of interest to senior
management. For the PDS, the list will be of interest to the project team. For that reason, it will be much
longer and more detailed. In our experience, this list is built during the Joint Project Planning session, whereas
the POS list is built as part of the scoping activity of the project.
REVIEW QUESTIONS
1. List out any five reasons for the projects success.
2. What is COS and how is it developed?
3. Why a COS is reviewed?
4. What is POS? Name all the components of a POS.
5. How do you define project objectives?
6. What is the purpose of listing assumptions, risks and obstacles?
7. What is the purpose of attachments in POS?
8. Discuss the procedure to submit a project for approval.
9. Who are the participants in the approval process of the project?
10. What is PDS?
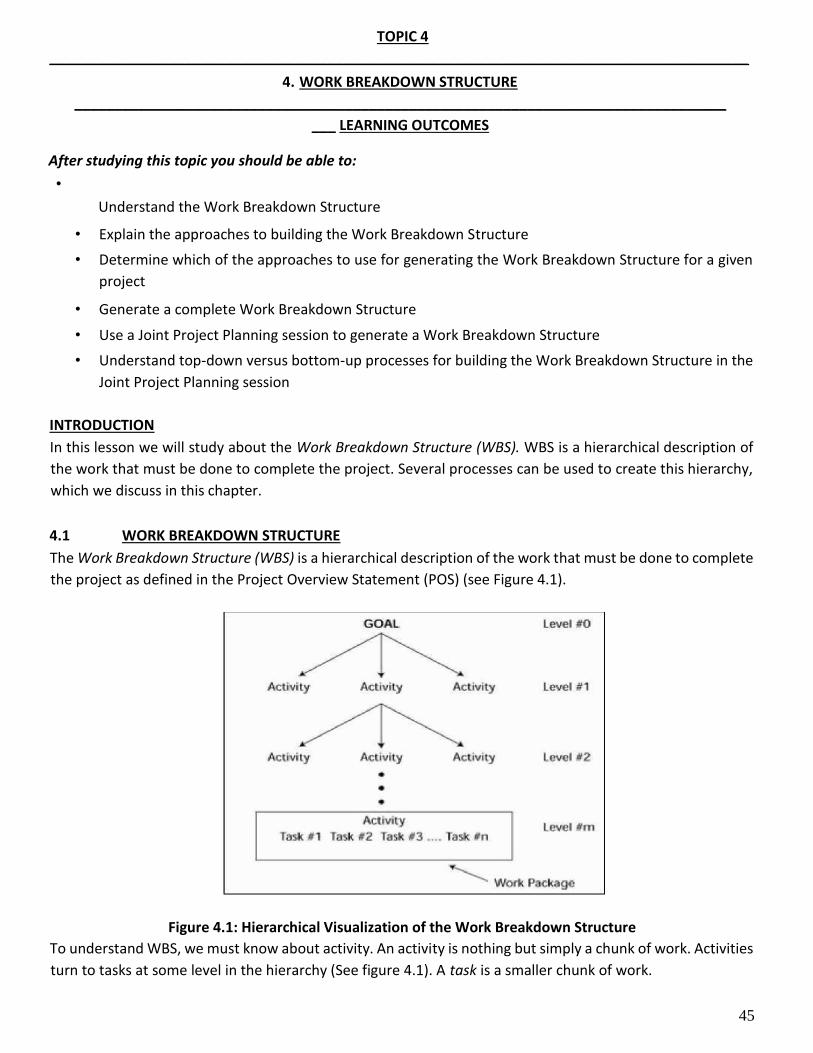
45
TOPIC 4
________________________________________________________________________________________
4. WORK BREAKDOWN STRUCTURE
__________________________________________________________________________________
___ LEARNING OUTCOMES
After studying this topic you should be able to:
•
Understand the Work Breakdown Structure
• Explain the approaches to building the Work Breakdown Structure
• Determine which of the approaches to use for generating the Work Breakdown Structure for a given
project
• Generate a complete Work Breakdown Structure
• Use a Joint Project Planning session to generate a Work Breakdown Structure
• Understand top-down versus bottom-up processes for building the Work Breakdown Structure in the
Joint Project Planning session
INTRODUCTION
In this lesson we will study about the Work Breakdown Structure (WBS). WBS is a hierarchical description of
the work that must be done to complete the project. Several processes can be used to create this hierarchy,
which we discuss in this chapter.
4.1 WORK BREAKDOWN STRUCTURE
The Work Breakdown Structure (WBS) is a hierarchical description of the work that must be done to complete
the project as defined in the Project Overview Statement (POS) (see Figure 4.1).
Figure 4.1: Hierarchical Visualization of the Work Breakdown Structure
To understand WBS, we must know about activity. An activity is nothing but simply a chunk of work. Activities
turn to tasks at some level in the hierarchy (See figure 4.1). A task is a smaller chunk of work.

46
The terms activity and task have been used interchangeably among project managers and project
management software packages.
Work Package
A work package is a complete description of how the tasks that make up an activity will actually be done. It
includes a description of the what, who, when, and how of the work.
Decomposition
Breaking down work into a hierarchy of activities, tasks, and work packages is called decomposition. For
example, take a look at the top of the WBS in Figure 4.1. Notice that:
• The goal statement from the POS is defined as a Level 0 activity in the WBS.
• The next level, Level 1, is a decomposition of the Level 0 activity into a set of activities defined as Level
1 activities. These Level 1 activities are major chunks of work. When the work associated with each
Level 1 activity is complete, the Level 0 activity is complete. For this example, that means that the
project is complete. As a general rule, when an activity at Level n is decomposed into a set of activities
at Level n+ 1 and the work associated with those activities is complete, the activity at Level n, from
which they were defined, is complete.
Importance of decomposition
Decomposition is important to the overall project plan because it allows you to estimate the duration of the
project, determine the required resources, and schedule the work. The complete decomposition will be
developed by using the completeness criteria discussed later in this lesson. By following those criteria, the
activities at the lowest levels of decomposition will possess known properties that allow us to meet planning
and scheduling needs.
4.2 USES FOR THE WBS
The WBS has four uses:
1. Thought process tool: The manager and the project team use WBS as a thought process tool that helps
them to visualize exactly how the work of the project can be defined and managed effectively.
2. Architectural design tool: WBS can be used as a design tool as it is a picture of the work of the project
that shows how the items of work are related to one another.
3. Planning tool: In the planning phase, the WBS gives the project team a detailed representation of the
project as a collection of activities that must be completed in order for the project to be completed. It is
at the lowest activity level of WBS that we will estimate effort, elapsed time, and resource requirements;
build a schedule of when the work will be completed; and estimate deliverable dates and project
completion.
4. Project status reporting tool: The WBS is used as a structure for reporting project status. The project
activities are consolidated (that is, rolled up) from the bottom as lower-level activities are completed. As
work is completed, activities will be completed. Completion of lower-level activities causes higher-level
activities to be partially complete. Some of these higher-level activities may represent significant progress
whose completion will be milestone events in the course of the project. Thus, the WBS defines milestone
events that can be reported to senior management and to the customer.

47
WBS and the Project Manager
It is the project manager who decides on the architecture of the WBS and the level of detail required. This
detail is important because the project manager is accountable for the success of the project. The WBS must
be defined so that the project manager can manage the project. Apart from any senior management
requirements for reporting or organizational requirements for documentation or process, the project
manager is free to develop the WBS according to his or her needs and those of management.
4.3 GENERATING THE WBS
The best way to generate the WBS is as part of the Joint Project Planning (JPP) session. One of two simple
decomposition processes is used to identify the activities that must be performed from the beginning to the
completion of the project. These activities are the lowest level of managed work for the project manager. At
this point in the planning process, you should have completed the Project Overview Statement. You may have
to go back and reconsider the POS as a result of further planning activities, but for now let’s assume the POS
is complete. Our technique for generating the WBS will reduce even the most complex project to a set of
clearly defined activities. The WBS will be the document that guides the remainder of the planning activities.
Two approaches can be used to identify the project activities:
• The first is the top-down approach.
• The second is the bottom-up approach.
Top-down Approach
The top-down approach begins at the goal level and successively partitions work down to lower levels of
definition until the participants are satisfied that the work has been sufficiently defined. Once the project
activities have been defined using the top-down approach, they will be defined at a sufficient level of detail
to allow you to estimate time, cost, and resource requirements first at the activity level and then aggregate
to the project level. Because the activities are defined to this level of detail, project time, cost, and resource
requirements are estimated much more accurately. Once the activities are described, you can sequence the
project work so that as many activities as possible are performed in parallel, rather than in sequence. There
are two variations of the top-down approach:
• Team approach
• Sub-team approach
Team Approach
In this approach the entire team works on all parts of the WBS. For each Level 1 activity, appoint the most
knowledgeable member of the planning team to facilitate the further decomposition of that part of the WBS.
Continue with similar appointments until the WBS is complete. This approach allows all members of the
planning team to pay particular attention to the WBS as it is developed, noting discrepancies and commenting
on them in real time.
The team approach is better than the sub-team approach but it requires more time to complete.
48
Sub-team Approach
When time is at a premium, the planning facilitator will prefer the sub-team approach. The first step is to
divide the planning team into as many sub-teams as there are activities at Level 1 of the WBS. Then follow
these steps:
1. The planning team agrees on the approach to building the first level of the Work Breakdown Structure.
2. The planning team creates the Level 1 activities.
3. A subject matter expert leads the team in further decomposition of the WBS for his or her area of
expertise.
4. The team suggests decomposition ideas for the expert until each activity within the Level 1 activities meets
the WBS completion criteria.
Bottom-up Approach
Bottom-up approach is more like an organized brainstorming session used to build the WBS. It works as
follows. The first steps are the same as those for the top-down approach. Namely, the entire planning team
agrees to the first-level breakdown. The planning team is then divided into as many groups as there are
firstlevel activities. Each group then makes a list of the activities that must be completed in order to complete
the first-level activity. To do this, they proceed as follows:
1. Someone in the group identifies an activity and announces it to the group. If the group agrees, then the
activity is written on a slip of paper and put in the middle of the table. The process repeats itself until no
new ideas are forthcoming.
2. The group then sorts the slips into activities that seem to be related to one another. This grouping activity
should help the planning team add missing activities or remove redundant ones.
3. Once the team is satisfied it has completed the activity list for the first-level breakdown, the members are
finished. Each group then reports to the entire planning team the results of its work.
4. Final critiques
4.4 CRITERIA TO TEST FOR COMPLETENESS IN THE WBS
Developing the WBS is the most critical part of the JPP. If we do this part right, the rest is comparatively
easy. How do you know that you’ve done this right? Each activity must possess six characteristics to be
considered complete—that is, completely decomposed. The six characteristics are as follows:
• Status/completion is measurable.
• Start/end events are clearly defined.
• Activity has a deliverable.
• Time/cost is easily estimated.
• Activity duration is within acceptable limits.
• Work assignments are independent.
If the activity does not possess these six characteristics, decompose the activity and ask the questions again.
As soon as an activity possesses the six characteristics, there is no need to further decompose it. As soon as
every activity in the WBS possesses these six characteristics, the WBS is defined as complete. The following
unit look at each of these characteristics in more detail.

49
Measurable Status
The project manager can ask for the status of an activity at any point in time during the project. If the activity
has been defined properly, that question is answered easily. For example, if a system’s documentation is
estimated to be about 300 pages long and requires approximately four months of fulltime work to write, here
are some possible reports that your activity manager could provide regarding the status:
1. Let’s see, the activity is supposed to take four months of full-time work. I’ve been working on it for two
months full-time. I guess I must be 50 per cent complete. 2. I’ve written 150 pages, so I guess I am 50 per
cent complete.
3. I’ve written, and had approved, 150 pages and estimate that the remaining work will require two more
months. I am 50 per cent complete.
The answer (1) is not acceptable, as it does not indicate that after working for two-months full time, the half
work is completed. The answer (2) is a little better but it doesn’t say anything about the quality of the 150
pages that have been written, nor does it say anything about the re-estimate of the remaining work. And so
we see that an acceptable answer must state what has been actually completed (approved, not just written,
in our example) and what remains to be done, along with an estimate to completion. Therefore, after working
through about half of the activity, the activity manager should be able to give a very accurate estimate of the
time required to complete the remaining work.
A simple metric that has met with some success is to compute the proportion of tasks completed as a
percentage of all the tasks that make up the activity. For example, suppose the activity has six tasks associated
with it and four of the tasks are complete; the ratio of tasks complete to total tasks is 4/6, that is, the activity
is 66 per cent complete. Even if work had been done on the fifth task in this activity, because the task is not
complete on the report date, it cannot be counted in the ratio. This metric certainly represents a very
objective measure. Although it may seem somewhat inaccurate, it is a good technique. Best of all, it is quick.
Project manager and activity manager do not have to sit around mired in detail about the percentage
complete. This same approach can be used to measure the earned value of an activity.
Bounded
Each activity should have a clearly defined start and end event. For example, using the systems documentation
example, the start event might be notification to the team member who will manage the creation of the
systems documentation that the final acceptance tests of the system are complete. The end event would be
notification to the project manager that the customer has approved the system documentation.
Deliverable
The result of completing the work that makes up the activity is the production of a deliverable. The deliverable
is a visible sign that the activity is complete. This sign could be an approving manager’s signature, a physical
product or document, the authorization to proceed to the next activity, or some other sign of completion.
Cost/Time Estimate
Each activity should have an estimated time and cost of completion. Being able to do this at the lowest level
of decomposition in the WBS allows you to aggregate to higher levels and estimate the total project cost and
the completion date.

50
By successively decomposing activities to finer levels of granularity, you are likely to encounter primitive
activities that you have performed before. This experience at lower levels of definition gives you a stronger
base on which to estimate activity cost and duration for similar activities.
Acceptable Duration Limits
While there is no fixed rule for the duration of an activity, it is recommended that activities should have
duration of less than two calendar weeks. This seems to be a common practice in many organizations. Even
for long projects where contractors may be responsible for major pieces of work, they will generate plans
that decompose their work to activities having this activity duration.
Activity Independence
It is important that each activity be independent. Once work has begun on the activity, it can continue
reasonably without interruption and without the need of additional input or information until the activity is
complete. The work effort could be contiguous, but it can be scheduled otherwise for a variety of reasons.
You can choose to schedule it in parts because of resource availability, but you could have scheduled it as one
continuous stream of work.
4.5 USING A JOINT PROJECT PLANNING SESSION TO BUILD THE WBS
The best way to build a WBS is as a group activity. To create the WBS, assemble a facilitator, the project
manager, the core members of the project team, and all other managers who might be affected by the project
or who will affect the project. The important thing is to have the expertise and the decision makers present
in this part of the planning session who can give input into the WBS. This exercise should be continuous. The
steps to build WBS are as follows:
• The first step is for the whole planning team to decide on the first-level decomposition of the goal
statement. One obvious approach would be to use the objective statements from the POS as the
firstlevel decomposition.
• Once the first-level decomposition is developed, the team has two choices on how to proceed:
• Without a doubt, the best way (from a WBS completion point of view) is to have the entire planning
team remain intact and complete the WBS together. Often that will not work simply from the
standpoint of it taking more of everybody’s time and also tying up the time of several high-level
managers more than in the second choice.
• The second choice is to divide the planning team into groups and let each group take one or more of
the first-level activities and complete the WBS for that part only.
• Whichever approach is used, it is essential that the entire group have the opportunity to review the
final WBS and offer critiques of it. It is important that these efforts be made, because the WBS must
be complete, and all the members of the team will see the final result of the JPP.
4.6 APPROACHES TO BUILDING THE WBS
There are many ways to build the WBS but none can be said as the correct one. Hypothetically, if we put each
member of the JPP session in a different room and ask that person to develop the project WBS, they might
all come back with different renditions, as there is no single best answer. The choice is subjective and based
more on the project manager’s preference than on any other requirements.

51
There are three general approaches to building the WBS:
• Noun-type approaches: Noun-type approaches define the deliverable of the project work in terms of
the components (physical or functional) that make up the deliverable.
• Verb-type approaches: Verb-type approaches define the deliverable of the project work in terms of
the actions that must be done to produce the deliverable. Verb-type approaches include the
designbuild-test-implement and project objectives approaches.
• Organizational approaches: Organizational approaches define the deliverable of the project work in
terms of the organizational units that will work on the project. This type of approach includes the
department, process, and geographic location approaches.
Noun-type Approaches There are two noun-type approaches:
a) Physical Decomposition: In projects that involve building products, it is tempting to follow the physical
decomposition approach. Take a mountain bike, for example. Its physical components include a frame,
wheels, suspension, gears, and brakes. If each component is to be manufactured, this approach might
produce a simple WBS. As mentioned previously, though, you have to keep in mind the concern of
summary reporting.
b) Functional Decomposition: Using the bicycle example, we can build the WBS using the functional
components of the bicycle. The functional components include the steering system, gear-shifting system,
braking system, and pedaling system. The same cautions that apply to the physical decomposition
approach apply here as well.
Verb-type Approaches There are two verb-type approaches:
a) Design-build-test-implement: The design-build-test-implement approach is commonly used in those
projects that involve a methodology. Application systems development is an obvious situation. Using our
bicycle example again, a variation on the classic waterfall categories could be used. The categories are
design, build, test, and implement.
Remember, the WBS activities at the lowest levels of granularity must always be expressed in verb form.
After all, we are talking about work, and that implies action, which, in turn, implies verbs.
b) Objectives: The objectives approach is similar to the design-build-test-implement approach and is used
when progress reports at various stages of project completion are prepared for senior management.
Reporting project completion by objectives gives a good indication of the deliverables that have been
produced by the project team. Objectives will almost always relate to business value and will be well
received by senior management and the customer as well. There is a caveat, however. This approach can
cause some difficulty because objectives often overlap. Their boundaries can be fuzzy. You’ll have to give
more attention to eliminating redundancies and discovering gaps in the defined work.
Organizational Approaches
The deployment of project work across geographic or organizational boundaries often suggests a WBS that
parallels the organization. The project manager would not choose to use this approach but rather would use
it out of necessity. In other words, the project manager had no other reasonable choice. These approaches
offer no real advantages and tend to create more problems than they solve. We list them here only because
they are additional approaches to building the WBS.

52
1. Geographic: If project work is geographically dispersed (our space program, for example), it may make
sense from a coordination and communications perspective to partition the project work first by
geographic location and then by some other approach at each location.
2. Departmental: On the other hand, departmental boundaries and politics being what they are, we may
benefit from partitioning the project first by department and then within department by whatever
approach makes sense. We benefit from this structure in that a major portion of the project work is under
the organizational control of a single manager. Resource allocation is simplified this way. On the other
hand, we add increased needs for communication and coordination across organizational boundaries in
this approach.
3. Business Process: The final approach involves breaking the project down first by business process, then
by some other method for each process may make sense. This has the same advantages and disadvantages
as the departmental approach but the added complication that integration of the deliverables from each
process can be more difficult than in the former case.
4.7 REPRESENTING THE WBS
Whatever approach you use, the WBS can be generically represented, as shown in Figure 4.2. The goal
statement represents the reason for doing the project.
Figure 4.2: WBS for a House
The Level 1 partitioning into some number of activities (also known as chunks of work) is a necessary and
sufficient set of activities. That is, when all of these first-level activities are complete, the project is complete.
For any activity that does not possess the six characteristics, we partition it into a set of necessary and
sufficient activities at Level 2. The process continues until all activities have met the six criteria. The lowest
level of decomposition in the WBS defines a set of activities that will each have an activity manager, someone
who is responsible for completing the activity. The lowest-level activities are defined by a work package. A
work package is simply the list of things to do to complete the activity. The work package may be very simple,
such as getting management to sign off on a deliverable. On the other hand, a work package may be a mini
project and may consist of all the properties of any other project, except that the activity defining this project
possesses the six criteria and need not be further partitioned.

53
REVIEW QUESTIONS
1. What is WBS? Explain with the help of example.
2. Differentiate between a task and an activity.
3. What is work package?
4. Why it is important to decompose a WBS?
5. Write down the uses for the WBS.
6. How do you generate WBS? Discuss the different approaches to generate WBS.
7. What are the differences between the top-down approach and bottom-up approach to generate
WBS?
8. What are the six criteria to test for completeness in the WBS?
9. What do you mean by activity independence?
10. Write a short note on “Using a Joint Project Planning Session to Build the WBS”.
11. Discuss the general approaches to build the WBS.
12. How do you represent a WBS?

54
TOPIC 5
___________________________________________________________________________________
_ 5. ESTIMATING DURATION
___________________________________________________________________________________
_ LEARNING OUTCOMES
After studying this topic you should be able to:
• Understand the difference between effort and duration
• Explain the relationship between resource loading and activity duration
• List and explain the causes of variation in activity duration
• Use any one of six activity duration estimation methods
• Use a particular estimation technique
• Assign resources to meet project schedules
• Understand the process of creating cost estimates at the activity level
INTRODUCTION
After preparing the WBS, the project manager knows about all the activities that have to be done in the
project. Now it is the time to find out the duration, resource requirement and the cost estimation of the
project. In this lesson we will discuss about these issues.
5.1 ESTIMATING DURATION
Before we can estimate duration, we need to make sure everyone is working from a common definition.
The duration of a project is the elapsed time in business working days. It does not include weekends,
holidays, or other non-working days. Work effort is labor required to complete an activity. That labor can
be consecutive or non-consecutive hours.
Difference between Duration and Work Effort
Duration and work effort are not the same thing. For example, if you give a person a week to do a task, that
would be five days duration or 40 hours. If they need only work half time on the task, then their work effort
hours would be 20 hours. If the person were to work on the task full time then the duration and effort would
be the same.
Difference between Labor and Time Clock
It is important to understand the difference between labor time and clock time, as they are not the same.
Let’s say that an estimate has been provided that a certain task requires 10 hours of focused and
uninterrupted labor to complete. Under normal working conditions, this is not possible. It would take
something more than 10 hours for sure.
For example, if a person could be focused 100 per cent of the time on an activity, he or she could accomplish
10 hours of work in 10 hours. Such a person would be unique, for what is more likely is that his or her work
will be interrupted by email, beepers, meetings, coffee breaks, and socializing. Several estimates for the per
cent of a person’s day that he or she can devote to project activity work have been made. Past data that we
have collected from information technology professionals indicates a range of 66 to 75 per cent. It means that
to do 10 hours work, the person actually needs approximately 13 hours. Therefore, it is this elapsed time that
55
we are interested in estimating for each activity in the project. It is the true duration of the activity. For costing
purposes, we are interested in the labor time (work) actually spent on an activity. Note: When estimating
activity duration, you have a choice to make. Do you want to estimate hours of billable labor to complete the
activity, or do you want to estimate the clock time required to complete the activity? Probably both. The labor
hours are needed in order to bill the client. The elapsed clock time is needed in order to estimate the project
completion date.
Resource Loading versus Activity Duration
Resource loading means that number of persons assigned to a task. The duration of an activity is influenced
by the amount of resources scheduled to work on it. We say influenced because there is not necessarily a
direct linear relationship between the amount of resource assigned to an activity and its duration. For
example, let there are two tables and those tables have to be taken out of the room. If there is one person,
he has to effort twice to get the tables out of the room. But if there are two persons, they will get the tables
out in half of the time previously used. In this case, doubling the resources sounds like a technology
breakthrough in shortening duration. But suppose there are four persons and one chair has to be taken out
of the room. Each person would like to get equal credit, so each one grabs a leg of the chair and tries to go
through the door, but they all get stuck in the door. The point of this silly example is to show that there are
diminishing returns for adding more resources. You would probably agree that there is a maximum loading
of resources on a task to minimize the activity duration, and that by adding another resource you will actually
begin to increase the duration. You have reached the crash point of the activity. The crash point is that point
where adding more resources will increase activity duration. There will be many occasions when the project
manager will have to consider the optimum loading of a resource on a task.
Variation in Activity Duration
Activity duration is a random variable because we cannot know exactly how long it will take. There will, of
course, be varying estimates with varying precision for each activity. One of your goals in estimating activity
duration is to define the activity to a level of granularity so that your estimates have a narrow variance— that
is, the estimate is as good as you can get it at the planning stages of the project. As project work is completed,
you will be able to improve the earlier estimates of activities scheduled later in the project.
There are several causes of variation in the actual activity duration:
1. Varying skill levels: Activity duration is estimated based on using people of average skills. In actuality, you
may get a higher- or lower-skilled person assigned to the activity, causing the actual duration to vary from
planned duration. These varying skill levels will be both a helpful and a hindrance to us.
2. Unexpected events: Random acts of nature, vendor delays, and incorrect shipments of materials, traffic
jams, power failures, and sabotage are but a few of the possibilities of unexpected events that may cause
hindrance in the project.
3. Efficiency of work time: Every time a worker is interrupted, it takes more time to get up to the level of
productivity prior to the time of the interruption. You cannot control the frequency or time of
interruptions, but you do know that they will happen. As to their effect on staff productivity, you can only
guess. Some will be more affected than others.
4. Mistakes and misunderstandings: Despite all of your efforts to be complete and clear in describing the
work to be performed, you simply will miss a few times.

56
5. Common cause variation: Apart from all of these factors that can influence activity duration, the reality
is that durations will vary for no reason other than the statistical variation that arises because the duration
is in fact a random variable. It has a natural variation, and nothing you do can really decrease that
variation. It is there, and it must be accepted.
Methods for Estimating Activity Duration
Estimating activity duration is challenging. You can be on familiar ground for some activities and on totally
unfamiliar ground for others. Whatever the case, you must produce an estimate. It is important that senior
management understand that the estimate can be little more than a wild a guess. In consulting practice six
techniques are found to be quite suitable for initial planning estimates as follows: Similarity to other
activities
• Historical data
• Expert advice
• Delphi technique
• Three-point technique
• Wide-band Delphi technique
Extrapolating Based on Similarity to Other Activities
Some of the activities in your WBS may be similar to activities completed in other projects. Recollections of
those activities and their duration can be used to estimate the present activity’s duration.
Studying Historical Data
Every good project management methodology contains a project notebook that records the estimated and
actual activity duration. This historical record can be used on other projects. The recorded data becomes your
knowledge base for estimating activity duration. This technique differs from the previous technique in that it
uses a record, rather than depending on memory.
Seeking Expert Advice
When the project involves a breakthrough technology or a technology that is being used for the first time in
the organization, there may not be any local experience or even professionals skilled in the technology within
the organization. In these cases, you will have to appeal to outside authorities.
Applying the Delphi Technique
The Delphi technique can produce good estimates in the absence of expert advice. This is a group technique
that extracts and summarizes the knowledge of the group to arrive at an estimate. After the group is briefed
on the project and the nature of the activity, each individual in the group is asked to make his or her best
guess of the activity duration. The results are tabulated and presented, as shown in Figure 5.1, to the group
in a histogram labeled First Pass. Those participants whose estimates fall in the outer quartiles are asked to
share the reason for their guess. After listening to the arguments, each group member is asked to guess again.
The results are presented as a histogram labeled Second Pass, and again the outer quartile estimates are
defended. A third guess is made, and the histogram plotted is labeled Third Pass. Final adjustments are
allowed. The average of the third guess is used as the group’s estimate. Even though the technique seems
rather simplistic, it has been shown to be effective in the absence of expert advice.

57
Figure 5.1: The Delphi Technique
Applying the Three-Point Technique
Activity duration is a random variable. If it were possible to repeat the activity several times under identical
circumstances, duration times would vary. That variation may be tightly grouped around a central value, or it
might be widely dispersed. In any given instance of the activity, you would not know at which extreme the
duration would likely fall, but you could make probabilistic statements about their likelihood in any case.
1. Optimistic Time: It is defined as the shortest duration one has had or might expect to experience given
that everything happens as expected.
2. Pessimistic Time: It is that duration that would be experienced (or has been experienced) if everything
that could go wrong did go wrong, yet the activity was completed.
3. Most likely Time: It is that time usually experienced.
For this method you are calling on the collective memory of professionals who have worked on similar
activities but for which there is no recorded history.
Applying the Wide-Band Delphi Technique
The combination of the Delphi and the three-point methods results in the wide-band Delphi technique. This
technique involves a panel, as in the Delphi technique. In place of a single estimate, the panel members are
asked at each iteration; to give their optimistic, pessimistic, and most likely estimates for the duration of the
chosen activity. The results are compiled, and any extreme estimates are removed. Averages are computed
for each of the three estimates, and the averages are used as the optimistic, pessimistic, and most likely
estimates of activity duration.
Estimation Precision
Early estimates of activity duration will not be as good as later estimates. Estimates will always be subject to
the vagaries of nature and other unforeseen events. We can only hope that we have gained some knowledge
through the project to improve our estimates. In top-down project planning model, we start out with “roughly
right” estimates, with the intention of improving the precision of these estimates later in the project.

58
5.2 ESTIMATING RESOURCE REQUIREMENTS
The importance of resources varies from project to project. The six estimation techniques used in the previous
unit can be used to estimate the resource requirements also, for any project. Types of resources include the
following:
1 People: In most cases the resources you will have to schedule are people resources. This is also the most
difficult type of resource to schedule.
2. Facilities: Planning rooms, conference rooms, presentation rooms, and auditoriums are but a few
examples of facilities that projects require. The exact specifications as well as the precise time at which
they are needed are some of the variables that must be taken into account. The project plan can provide
the detail required. The facility specification will also drive the project schedule based on availability.
3. Equipment: Equipment is treated exactly the same as facilities. What is needed and when drive the activity
schedule based on availability.
4. Money: It is the essential resource required for any project. Project expenses typically include travel, room
and meals, and supplies all need money.
5. Materials: Parts to be used in the fabrication of products and other physical deliverables are often part of
the project work, too. For example, the materials needed to build a bicycle might include nuts, bolts,
washers, and spacers.
People as Resources
People are the most difficult type of resource to schedule because we plan the project by specifying the types
of skills we need, when we need them, and in what amounts. There are a few tools you can use to help you
schedule people.
Skills Matrices
The two matrices are used to assign staff to activities. The assignment could be based on activity
characteristics such as risk, business value, criticality, or skill development.
This process involves gathering inventory data for two inventories (see figure 5.2).
• An inventory of the demand for skills needed to perform the tasks associated with specific activities.
This is represented as a matrix whose rows are the activities and whose columns are the skills. These
are both current and long-term needs.
• An inventory of the current skills among the professional staff. This is represented as a matrix whose
rows identify the staff and whose columns are the skills.
Figure 5.2: Assigning Staff to Activities
The columns of both matrices define the same set of skills. This gives us a way to link the two matrices
and assign staff to activities.

59
Skill Categories
This part of the skill matrix is developed by looking at each activity that the unit must perform and describing
the skills needed to perform the activity.
Skill Levels
Skills must be qualified with a statement of how much of the skill the person possesses. Various methods are
available, and companies often develop their own skill-level system.
Resource Breakdown Structure
The Resource Breakdown Structure is used to assist in not only resource estimation but also cost estimation.
The Resource Breakdown Structure is determined by the job families, which are defined by the human
resource department. That definition is simply put into this hierarchical framework and used as the basis for
identifying the positions and levels that are needed to staff the project and from that constructing the staffing
budget. Figure 5.3 shows an example for a resource breakdown structure.
Figure 5.3: An example of a Resource Breakdown Structure
5.3 ESTIMATING DURATION AS A FUNCTION OF RESOURCE AVAILABILITY
Three variables influence the duration estimate of an activity, and all of them influence each other. They are
as follows:
• The duration itself.
• The total amount of work, as in person hours/days, that will be done on the activity by a resource.
• The per cent per day of his or her time that the resource can devote to working on it.
Many project management software products today allow you to enter any two of these three variables and
calculate the third for you. There is no one right way; it’s a matter of what works best and is most consistent
with the way you mentally approach estimating. There are four ways to approach the calculation of duration,
total effort, and per cent/day. Remember that two of them are specified and the third is calculated. The
methods are listed here and described in the units that follow:
• Assign as a total work and constant per cent/day
• Assign as a duration and total work effort
• Assign as a duration and per cent/day
• Assign as a profile

60
Assign as a Total Work and a Constant Per cent/Day
If we know that the total “head down, focused” work effort required to do the activity is 40 hours but that
the resource can devote only 50 per cent of his or her typical day to doing project activity work, then the
resulting duration is going to be 80 hours, or 10 business days. The formula is simply this: 40 hours/0.50 = 80
hours
The duration becomes a calculated value based on the per cent per day and the work. This method is the one
that most software products use as their default method. We can be a bit squeamish about telling it like it
really is. If that is done, the duration is shortened accordingly. The project completion date is then invalid
because it is calculated using an overly optimistic duration.
Assign as a Duration and Total Work Effort
Alternatively, you could use your or someone else’s experience and estimate the duration based on history.
Then the total work could be averaged over that duration, yielding the per cent per day value. Using the same
values as above, the formula would look like this:
5 person days/10 days = 0.5
Here again we’re making the assumption of an eight-hour day. In this case, the per cent is calculated.
Approaching the estimate from this direction (we’re just running the numbers a different way) seems in
practice to avoid the problem of squeamishness. You still need to do a sanity check on the resulting value;
don’t just blindly accept it.
Assign as a Duration and Per cent/Day
The third method is to estimate the duration as previously described and assign the per cent per day. This
method will calculate the total work effort. The formula works like this:
10 days × 0.50 = 5 person days Of the three methods, this is the least used.
Assign as a Profile
The three duration estimating and resource assignment methods discussed here all presume that the
resource is going to work at about the same per cent per day for each day of the activity. In other words, they
are flat-loaded at a constant rate. There will be cases where the person cannot work at a constant rate
because of other commitments. In such cases, the duration is estimated first and then the work is assigned at
different per cents over the 40-hour window. For example, we might assign the worker 75 per cent for 20
hours and 50 per cent for 20 hours. If you find yourself having to use this profiling of resource assignments
capability on activities more than two or three times in a project, you may need to take your WBS to a lower
level of detail. In doing that, the duration will be shorter and the resources can work in a contiguous manner
for the entire activity.
5.4 ESTIMATING COST
Now after that we have estimated activity duration and resource requirements, we know the resources that
will be required and the number of hours or volume of resources needed. These are the data we need to
establish the cost of the project. Unit cost data can be applied to the amount of resource required to estimate
cost.

61
Resource Planning
There are several factors you need to consider concerning the resources for your project.
• Resource loading versus activity duration. (It is not necessary that more people will complete the
project in lesser time.)
• Another factor to consider deals with the skill level of the resources. It means that when you are
planning resources, you have to know the skill level of the potential resources. For example, you may
be able to get a lower cost by using a junior developer, but it’s likely that you will also find the process
takes longer. Knowing the skill sets of the available people and taking that into account when doing
scheduling is a major part of resource planning.
• Another issue to consider is that of using part-time people. Part time people may not give you
extremely efficient use of their time particularly if the part-time people are coders. Development is a
mental task; you’re working with knowledge workers. You can’t turn on and off a mental process at
will.
• Similarly, scheduling people on two projects the same day won’t be efficient use of resources. It takes
some time for the developer to get up to writing speed. So when you’re scheduling, don’t think you
can schedule different projects for the same knowledge worker on the same day.
Cost Estimating
Remember that no matter how well you estimate cost, it is always an estimate. Anytime you are forecasting
the future, as you are when you plan a project, you are dealing with some amount of uncertainty. Because
projects are unique by definition, you are doing an estimate. Projects are so often over budget because the
budget is an estimate, not an exact mathematical calculation. Even experienced cost estimators miss the
mark. Estimating can be done several ways. One is to find an analogous project and using it as a guideline;
you’ll have a reference point on the costs. Another good practice in estimating is to invite Subject Matter
Experts (SMEs) to help you prepare your estimate.
Cost Budgeting
Once you’ve done an estimate, you want to go into the cost budgeting phase. This phase is the time when
you assign costs to tasks on the WBS. Cost budgeting is actually very formulaic. You take the needed resources
and multiply the costs times the number of hours they are to be used. In the case of a one-time cost, such as
hardware, you simply state that cost. Cost budgeting gives the sponsor a final check on the costs of the
project. Cost budgeting is different than estimating in that it is more detailed. However, the final output is
still a best effort at expressing the cost of the project.
Cost Control
Cost control represents two major issues for the project manager:
• The first is how often you need to get reports of the costs. Certainly, it would be good if you could
account for everything occurring on the project in real time. However, that is generally way too
expensive and time-intensive. Getting cost status figures once a week gives you a good snapshot of
the costs that are occurring. If you wait longer than a week to get cost figures, you may find that the
project has spun out of control.
• The second issue deals with how you look at the numbers you’re receiving. If you’ve done a cost
baseline, then you’ll have some figures against which you can measure your costs.

62
• What you’re looking for is a variance from the original costs. The two costs you have at this point are
your baseline and the actual costs that have occurred on the project. The baseline was the final
estimate of the costs on the project. Your job is to look at the two and determine if management
action must be taken.
REVIEW QUESTIONS
1. Define activity duration and work effort. Also differentiate between them.
2. Differentiate between time clock and labor clock with the help of an example.
3. What do you mean by resource loading and crashpoint?
4. Name the six methods for estimating activity duration.
5. Explain the historical data technique to estimate the activity duration.
6. Write a short note on Delphi technique.
7. What are resources in a project?
8. How do you estimate resources? Explain any method to estimate resources.
9. What is resource break down structure?
10. How do you estimate costs in a project?
11. Write down the factors that you need to consider concerning the resources foryour project

63
TOPIC 6
______________________________________________________________________________
6. ESTIMATING DURATION
________________________________________________________________________
____ LEARNING OUTCOMES
After studying this topic you should be able to:
• Determine task relationships
• Construct a network representation of the project activities
• Understand the types of activity dependencies
• Recognize the types of constraints that create activity sequences
• Compute the Earliest Start (ES), Earliest Finish (EF), Latest Start (LS), and Latest Finish (LF)
• Understand lag variables and their uses
• Identify the critical path in the project
• Define free slack and total slack and know their significance
• Analyze the network for possible schedule compression
• Use advanced network dependency relationships for improving the project schedule
• Understand and apply management reserve
INTRODUCTION
In this lesson, we think about what needs to be done first and what can be done at the same time.
We want to capture the logical relationships that exist between the tasks in our WBS. The
traditional technique used to capture these relationships is the network diagram.
6.1 A PROJECT NETWORK DIAGRAM
A Project Network Diagram is a pictorial representation of the sequence in which the project work
can be done. The whole idea here is look at your work visually and think about in what order
(sequence) the work needs to occur. This is an exercise in logic. In many cases, this step is an
excellent team activity. At this time, you don't want to concern yourself with resource constraints:
just focus on logical sequence of the work. When you complete this task, you want to be clear on
three things:
• For each task, what others tasks must be completed first?
• For the project, what tasks could be done at the same time (concurrently, in parallel)? For
the project, where are your external dependencies? What tasks need an external event or
task to complete, before it can start?

64
Benefits to Network-based Scheduling
There are two ways to build a project schedule:
• Gantt chart
• Network diagram
Figure 6.1: Example of a Gantt Bar Chart
Gantt chart
The Gantt chart is the older of the two and is used effectively in simple, short-duration types of
projects. To build a Gantt chart (see figure 6.1), the project manager begins by associating a
rectangular bar with every activity. The length of the bar corresponds to the duration of the
activity. He or she then places the bars horizontally along a time line in the order in which the
activities should be completed. There can be instances in which activities are located on the time
line so that they are worked on concurrently with other activities. The sequencing is often driven
more by resource availability than any other consideration. There are two drawbacks to using the
Gantt chart:
• Because of its simplicity, the Gantt chart does not contain detailed information. It reflects
only the order imposed by the manager and, in fact, hides much of that information. Unless
you are intimately familiar with the project activities, you cannot tell from the Gantt chart
what must come before and after what.
• Second, the Gantt chart does not tell the project manager whether the schedule that
results from the Gantt chart completes the project in the shortest possible time or even
uses the resources most effectively. The Gantt chart reflects only when the manager would
like to have the work done.
65
6.2. NETWORK DIAGRAM
The network diagram provides a visual layout of the sequence in which project work flows. It
includes detailed information and serves as an analytical tool for project scheduling and resource
management problems as they arise during the life of the project. In addition, the network diagram
allows you to compute the earliest time at which the project can be completed. That information
does not follow from a Gantt chart.
Network diagrams can be used for detailed project planning, during implementation as a tool for
analyzing scheduling alternatives, and as a control tool:
Planning: Even for large projects, the project network diagram gives a clear graphical picture of
the relationship between project activities. It is, at the same time, a high-level and detailedlevel
view of the project.
Implementation: For those project managers who use automated project management software
tools, you will update the project file with activity status and estimate-to completion data. The
network diagram is then automatically updated and can be printed or viewed.
Control: While the updated network diagram retains the status of all activities, the best graphical
report for monitoring and controlling project work will be the Gantt chart view of the network
diagram. This Gantt chart cannot be used for control purposes unless you have done network
scheduling or incorporated the logic into the Gantt chart. Comparing the planned schedule with
the actual schedule, the project manager will discover variances and, depending on their severity,
will be able to put a get-well plan in place.
6.3 BUILDING THE NETWORK DIAGRAM USING THE PRECEDENCE DIAGRAMMING METHOD
It is also called as the Activity-on-the-Arrow (AOA) method (See figure 6.2). An arrow represents
each activity. The node at the left edge of the arrow is the “begin the activity,” while the node at
the right edge of the arrow is the “end the activity.” Every activity is represented by this
configuration. Nodes are numbered sequentially, and the sequential ordering had to be preserved,
at least in the early versions. Because of the limitations of the AOA method, ghost activities had
to be added to preserve network integrity.

66
Figure 6.2: The Activity-on-the-Arrow Method
Later on, the AOA method lost its appeal, and a new method known as the Activityon-the-Node
(AON) method replaced it. The term more commonly used to describe this approach is Precedence
Diagramming Method (PDM) (see figure 6.3).
Figure 6.3: PDM Format of a Project Network Diagram
Each activity in the network diagram is represented by a rectangle that is called an activity node
(see Figure 6.4). The entries in the activity node describe the time-related properties of the
activity. Some of the entries describe characteristics of the activity, such as its expected duration
(E), while others describe calculated values (ES, EF, LS, LF) associated with that activity. These
terms will be defined later on in this chapter.

67
Figure 6.4: Activity Node
In order to create the network diagram using the PDM, you need to determine the predecessors
and successors for each activity. Here, you are looking for the technical dependencies between
activities. Once an activity is complete, it will have produced an output, a deliverable, which
becomes input to its successor activities. Work on the successor activities requires only the output
from its predecessor activities.
Reading the Network Diagram
The network diagram is logically sequenced (see figure 6.3). It is read from left to right. Every
activity in the network, except the ‘start’ must have at least one activity that comes before it (its
immediate predecessor). Similarly, every activity in the network, except the ‘end’ must have at
least one activity that comes after it (its immediate successor). An activity begins when its
predecessors have been completed. The start activity has no predecessor, and the end activity has
no successor.
Dependencies
A dependency is simply a relationship that exists between pairs of activities. To say that activity
B depends on activity A means that activity A produces a deliverable that is needed in order to
do the work associated with activity B. There are four types of activity dependencies, illustrated
in Figure 6.5:

68
Figure 6.5: Dependency Relationships
Finish-to-start: The finish-to-start (FS) dependency is displayed with an arrow emanating from the
right edge of the predecessor activity and leading to the left edge of the successor activity. It says
that activity A must be completed before activity B can begin. For example, activity A can represent
the collection of data, and activity B can represent entry of the data into the computer. It means
that once we have finished collecting the data (Activity A), we may begin entering the data (Activity
B).
Start-to-start: The start-to-start (SS) dependency is displayed with an arrow emanating from the
left edge of the predecessor (A) and leading to the left edge of the successor (B). It says that activity
B may begin once activity A has begun. It means both the activity A and B could start at the same
time. For example, we could alter the data collection and data entry dependency: As soon as we
begin collecting data (activity A), we may begin entering data (activity B).
Start-to-finish: The start-to-finish (SF) dependency is displayed with an arrow emanating from the
left edge of activity A to the right edge of activity B. It is little more complex than the FS and SS
dependencies. Here activity B cannot be finished sooner than activity A has started. For example,
suppose you have built a new information system. You don’t want to eliminate the legacy system
until the new system is operable. When the new system starts to work (activity
A) the old system can be discontinued (activity B). SF dependencies can be used for just-in-time
scheduling between two tasks, but they rarely occur in practice.
Finish-to-finish: The finish-to-finish (FF) dependency is displayed with an arrow emanating from
the right edge of activity A to the right edge of activity B. It states that activity B cannot finish
sooner than activity A. For example, let’s refer back to our data collection and entry example. Data
entry (activity B) cannot finish until data collection (activity A) has finished. To preserve the

69
connectedness property of the network diagram, the SS dependency on the front end of two
activities should have an accompanying FF dependency on the back end.
Constraints
The type of dependency that describes the relationship between activities is determined as the
result of constraints that exist between those activities. Each type of constraint can generate any
one of the four dependency relationships. There are four types of constraints:
• Technical constraints
• Management constraints
• Interproject Constraints
• Date constraints
Technical Constraints
Technical dependencies between activities arise when one activity (the successor) requires
output from another (the predecessor) before work can begin on it. In the simplest case, the
predecessor must be completed before the successor can begin.
Management Constraints
A second type of dependency arises as the result of a management-imposed constraint. For
example, suppose the product manager on a software development project is aware that a
competitor is soon to introduce a new product with similar features to theirs. Rather than
following the concurrent design-build strategy, the product manager wants to ensure that the
design of the new software will yield a product that can compete with the competitor’s new
product. He or she expects design changes in response to the competitor’s new product and,
rather than risk wasting the programmers’ time, imposes the FS dependency between the design
and build activities.
Interproject Constraints
Interproject constraints result when deliverables from one project are needed by another project.
Such constraints result in dependencies between the activities that produce the deliverable in one
project and the activities in the other project that require the use of those deliverables. For
example, suppose the new piece of test equipment is being manufactured by the same company
that is developing the software that will use the test equipment. In this case, the start of the testing
activities in the software development project depends on the delivery of the manufactured test
equipment from the other project. The dependencies that result are technical but exist between
activities in two or more projects, rather than within a single project.
70
Date Constraints
Date constraints impose start or finish dates on an activity that force it to occur according to a
particular schedule. In our date-driven world, it is tempting to use the requested date as the
required delivery date. These constraints generally conflict with the schedule that is calculated and
driven by the dependency relationships between activities.
Using the Lag Variable
Pauses or delays between activities are indicated in the network diagram through the use of lag
variables. Lag variables are best defined by way of an example. Suppose that the data is being
collected by mailing out a survey and is entered as the surveys are returned. Imposing an SS
dependency between mailing out the surveys and entering the data would not be correct unless
we introduced some delay between mailing surveys and getting back the responses that could be
entered.
Creating an Initial Project Network Schedule
To establish the project schedule, you need to compute two schedules:
• The early schedule, which we calculate using the forward pass (This schedule consists of the
earliest times at which an activity can start and finish. These are calculated numbers that are
derived from the dependencies between all the activities in the project).
• The late schedule, which we calculate using the backward pass (The late schedule consists
of the latest times at which an activity can start and finish without delaying the completion
date of the project. These are also calculated numbers that are derived from the
dependencies between all of the activities in the project).
The combination of these two schedules gives us some additional pieces of information about the
project schedule:
• The window of time within which each activity must be started and finished in order for the
project to complete on schedule.
• The sequence of activities that determine the project completion date.
• The sequence of activities that determine the project completion date is called the critical
path. The critical path can be defined in several ways:
• The longest duration path in the network diagram
• The sequence of activities whose early schedule and late schedule are the same
• The sequence of activities with zero slack or float.
The activities that define the critical path are called critical path activities. Any delay in a critical
path activity will delay the completion of the project by the amount of delay in that activity.

71
Critical path activities represent sequences of activities that warrant the project manager’s special
attention.
Earliest Start Time (ES) and Early Finish Time (EF)
The earliest start (ES) time for an activity is the earliest time at which all of its predecessor activities
have been completed and the subject activity can begin. The ES time can be set as follows:
• The ES time of an activity with no predecessor activities is arbitrarily set to 1, the first day on
which the project is open for work.
• The ES time of activities with one predecessor activity is determined from the earliest finish
(EF) time of the predecessor activity.
• The ES time of activities having two or more predecessor activities is determined from the
latest of the EF times of the predecessor activities.
• The ES can also be used to calculate the earliest finish time of an activity. The earliest finish
(EF) of an activity is calculated as [(ES + Duration) – One time unit]. The reason for subtracting
the one time unit is to account for the fact that an activity starts at the beginning of a time
unit (hour, day, and so forth) and finishes at the end of a time unit. In other words, a one-
day activity, starting at the beginning of a day, begins and ends on the same day.
Example to Understand the Dependencies and Network Schedule
Look at Figure 6.6 and note that:
• Activity E has only one predecessor, activity C. The EF for activity C is the end of day 3.
Because it is the only predecessor of activity E, the ES of activity E is the beginning of day
4.
• Activity D has two predecessors, activity B and activity C. When there are two or more
predecessors, the ES of the successor, activity D in this case, is calculated based on the
maximum of the EF dates of the predecessor activities. The EF dates of the predecessors are
the end of day 4 and the end of day 3. The maximum of these is 4, and therefore, the ES of
activity D is the morning of day 5.
• Similarly, the EF and ES for other activities may also be calculated.

72
Figure 6.6: Forward Pass Calculations
Latest Start Time (LS) and Latest Finish Time (LF)
The latest start (LS) and latest finish (LF) times of an activity are the latest times at which the
activity can start or finish without causing a delay in the completion of the project. Knowing these
times is valuable for the project manager, who must make decisions on resource scheduling that
can affect completion dates. The steps are as follows:
• The window of time between the ES and LF of an activity is the window within which the
resource for the work must be scheduled or the project completion date will be delayed.
• To calculate these times, you work backward in the network diagram. First set the LF time
of the last activity on the network to its calculated EF time. Its LS is calculated as [(LF –
Duration) + One time unit]. Again, you add the one time unit to adjust for the start and finish
of an activity within the same day.
• The LF time of all immediate predecessor activities is determined by the minimum of the LS,
minus one time unit, times of all activities for which it is the predecessor.
For example, let’s calculate the late schedule for activity E in Figure 6.7. Its only successor, activity
F, has an LS date of day 10. The LF date for its only predecessor, activity E, will therefore be the
end of day 9. In other words, activity E must finish no later than the end of day 9 or it will delay
the start of activity F and hence delay the completion date of the project. The LS date for activity
E will be, using the formula, 9 – 2 + 1, or the beginning of day 7. On the other hand, consider
activity C. It has two successor activities, activity D and activity E. The LS dates for them are day 5
and day 7, respectively. The minimum of those dates, day 5, is used to calculate the LF of activity
C, namely, the end of day 4.

73
Figure 6.7: Backward Pass Calculations
Calculating Critical Path
As mentioned, the critical path is the longest path or sequence of activities (in terms of activity
duration) through the network diagram. The critical path for the example problem we used to
calculate the early schedule and the late schedule is shown in Figure 6.8.
Figure 6.8: Critical Path
One way to identify the critical path in the network diagram is to identify all possible paths through
the network diagram and add up the durations of the activities that lie along those paths. The path
with the longest duration time is the critical path. For projects of any size, this method is not
feasible, and we have to resort to the second method of finding the critical path— computing the
slack time of an activity.
Computing Slack
The second method of finding the critical path requires us to compute a quantity known as the
activity slack time. Slack time (also called float) is the amount of delay expressed in units of time
that could be tolerated in the starting time or completion time of an activity without causing a
delay in the completion of the project. Slack time is a calculated number. It is the difference
between the late finish and the early finish (LF – EF). If the result is greater than zero, the activity
has a range of time in which it can start and finish without delaying the project completion date,
as shown in Figure 6.9.

74
Figure 6.9: ES to LF Window of An Activity
Because weekends, holidays, and other non working periods are not conventionally considered part
of the slack, these must be subtracted from the period of slack. There are two types of slack:
1. Free slack: This is the range of dates in which an activity can finish without causing a delay in
the early schedule of any activities that are its immediate successors. Notice in (Figure 6.8) that
activity C has an ES of the beginning of day 2 and a LF of the end of day 4. Its duration is two
days, and it has a day 3 window within which it must be completed without affecting the ES of
any of its successor activities (activity D and activity E). Therefore, it has free slack of one day.
Free slack can be equal to but never greater than total slack. When you choose to delay the
start of an activity, possibly for resource scheduling reasons, first consider activities that have
free slack associated with them. By definition, if an activity’s completion stays within the free
slack range, it can never delay the early start date of any other activity in the project.
2. Total slack: This is the range of dates in which an activity can finish without delaying the project
completion date. Look at activity E in Figure 6.8. Activity E has a free slack (or float) of four
days, as well as a total slack (or float) of four days. In other words, if activity E were to be
completed more than three days later than its EF date, it would delay completion of the
project. We know that if an activity has zero slack, it determines the project completion date.
If an activity with total slack greater than zero were to be delayed beyond its late finish date,
it would become a critical path activity and cause the completion date to be delayed.
Based on the method you used to compute the early and late schedules, the sequence of activities
having zero slack is defined as the critical path. If an activity has been dateconstrained using the
on-this-date type of constraint, it will also have zero slack. However, this constraint usually gives
a false indicator that an activity is on the critical path. Finally, in the general case, the critical path
is the path that has minimum slack.

75
6.4 ANALYZING THE INITIAL PROJECT NETWORK DIAGRAM
After you have created the initial project network diagram, one of two situations will be present:
• The initial project completion date meets the requested completion date. Usually this is
not the case, but it does sometimes happen.
• The more likely situation is that the initial project completion date is later than the
requested completion date. In other words, we have to find a way to squeeze some time
out of the project schedule.
Compressing the Schedule
In situation where, the initial project completion date is later than the requested completion
date, you must find ways to reduce the total duration of the project to meet the required date.
What you will now have to do is adjust and readjust the critical path. This is known as schedule
compression. By making adjustments to when tasks begin or by adding additional resources, you
can complete the same work in less time.
There are four processes you can do to affect the flow of project schedule:
• Fast tracking: This method allows activities to be done in parallel that would normally be
done in sequence. For example, you may allow two phases of the project to overlap slightly
where normally you’d have quality control events, walkthroughs, or other events scheduled
before the second phase of the project would be allowed to begin. This approach usually
increases project risk.
• Crashing: Crashing allow the project manager to add more resources to effort-driven
activities in an attempt to shorten their duration. For example, if you have to physically
install 1,000 workstations and you’ve only eight people assigned to the task, it may take
them months to complete. If you crash the project, you might assign 16 more people to this
task to complete it in a matter of weeks. Crashing doesn’t always work because some
activities are a fixed duration and additional labor won’t ensure the activities will finish
faster. Crashing usually increases project costs because of the expense of the labor.
• Lead time: Lead time is negative time because it brings activities closer together–even
allowing them to overlap. For example, you may have to install a new network cable
throughout a campus. Your schedule calls for all of the network cables to run before any
PCs plug into the new network. To speed up the schedule, you elect to allow the activity to
connect the PCs to the new network as soon as half of the new cables are ready. The first
activity, to run the network cables, does not have to be complete for the second activity,
connecting to the new network, to begin.
• Lag time: Lag time is waiting time. It’s often applied to activities where there must be an
added duration between the tasks.

76
• For example, after installing a database, you have to wait four hours for all of the records
from other databases in the network to recognize the database and synch with this
database server. Lag time adds time to the project schedule.
To begin schedule compression, do the following:
• Analyze the critical path to move tasks earlier in the workflow—where possible.
• Consider relationships between tasks to change FS to SS.
• Identify tasks that require lag time and evaluate the predecessor task to move it earlier in
the workflow.
• Consider any tasks and the level of acceptable risks by changing relationship types.
• Consider adding additional resources to tasks to shorten the duration required to complete
tasks. (Not all tasks can be shortened with additional resources.)
6.5 MANAGEMENT RESERVE
You and your project team will no doubt be tempted during the creation of each task to overstate
the estimated amount of time for it to be completed. Don’t yield to this temptation. Always reflect
the accurate amount of time it should take to complete a task.
The reason is explained in Parkinson’s Law. Parkinson’s Law states that work will expand to the fill
amount of time allotted to it. In other words, if your project team says an activity will take those
24 hours to complete, but they know the work will probably only take 16 hours to complete, it’ll
magically take 24 hours. Really, it’s no magic. When people overestimate their time to account for
expected troubles, just-incase scenarios, and other time-munching issues, they rarely take
advantage of the time they’ve created for themselves. They’ll find other work to complete or
simply wait until the time they’ve reserved for issues has passed and then hop into the work and
hope for perfection.
Think of your own experiences. How many times have you had some small task to complete but
spent hours cleaning your desk, organizing your materials, and researching the best mode of
attack rather than just hopping in and completing the assignment? But how do you work on the
day before your vacation? You are able to complete considerably more work on that particular
day because the tasks must be completed before you’re able to escape.
The same experience will be transferred to your team if you allow them two generous weeks
for a task that should typically only require one. Your team will quickly discover that it will take
every moment of the two weeks to complete the task you’ve assigned them.
77
Instead, what you should do is use management reserve. Management reserve is an artificial
task that is added at the end of the project. The time allotted to the reserve is typically 10 to 15
per cent of the total amount of time to complete all the tasks in a project. When a task runs
over its allotted time, the overrun is applied to the management reserve at the end of the critical
path rather than on each lagging task.
Management reserve allows a project manager to use per centages to see how the overall
project is coming along. For example, if the project is only 40 per cent complete but the
management reserve is 65 per cent used, then the project is in trouble if the remaining tasks
follow the trend of the project thus far.
REVIEW QUESTIONS
1. What is a Project Network Diagram?
2. Why do we create a Gantt chart and a network diagram?
3. What are the drawbacks in using the Gantt chart?
4. Explain how a network diagram can be used as a tool for analyzing scheduling alternatives.
5. How do you build a Network Diagram using the Precedence Diagramming Method?
6. What do you understand by dependencies? Explain the different types of activity dependencies.
7. What is the relation between a dependency and a constraint?
8. What is Lag Variable?
9. How do you create an initial project schedule?
10. What is a critical path? How do you calculate it?
11. What is the difference between a free slack and total slack?
12. Explain the following terms:
a) Fast tracking
b) Crashing
c) Lead time
d) Lag time
13. How do you compress a schedule?
14. What is the purpose of management reserve?

78
TOPIC 7
______________________________________________________________________________________
7. RESOURCE AVAILABILITY
__________________________________________________________________________________
___ LEARNING OUTCOMES
After studying this topic you should be able to:
•
Understand why sources should be leveled
• Utilize various approaches to leveling resources
• Determine the appropriate use of substitute resources
• Define a work package and its purposes
• Describe the format and explain the contents of a work package
• Know when to require a work package description
INTRODUCTION
Up to this point, we have identified the activities in the project and developed a schedule that meets the
expected end date of the project. We have also estimated the resources to be used in the project and cost of
the project. Now, this lesson discusses the final step of assigning the resources according to the schedule
developed (by leveling resources) and to determine if you can accomplish this schedule with the resources
available. The impact on the cost of the project is also considered on the basis of leveled resources.
7.1 CONSIDERING RESOURCE AVAILABILITY
Once the project schedule is ready, it is found that the resources are not available according to the project
schedule. In those situations, the project manager has to revert to the original project definition, budget,
time, and resource allocations to resolve the scheduling problem. This may require additional time, budget,
and resource allocation in order to comply with the requested deliverables and deliverable schedule.
7.2 LEVELING RESOURCES
Resource leveling is part of the resource management. This is an area that has always created problems for
organizations due to the following reasons:
• People commits more than that they can reasonably handle in the given timeframe.
• Project priorities are changed without considering the impact on existing resource schedules.
• The absence of a resource management function that can measure and monitor the capacity of the
resource pool and the extent to which it is already committed to projects.
• Employee turnover is not reflected in the resource schedule.
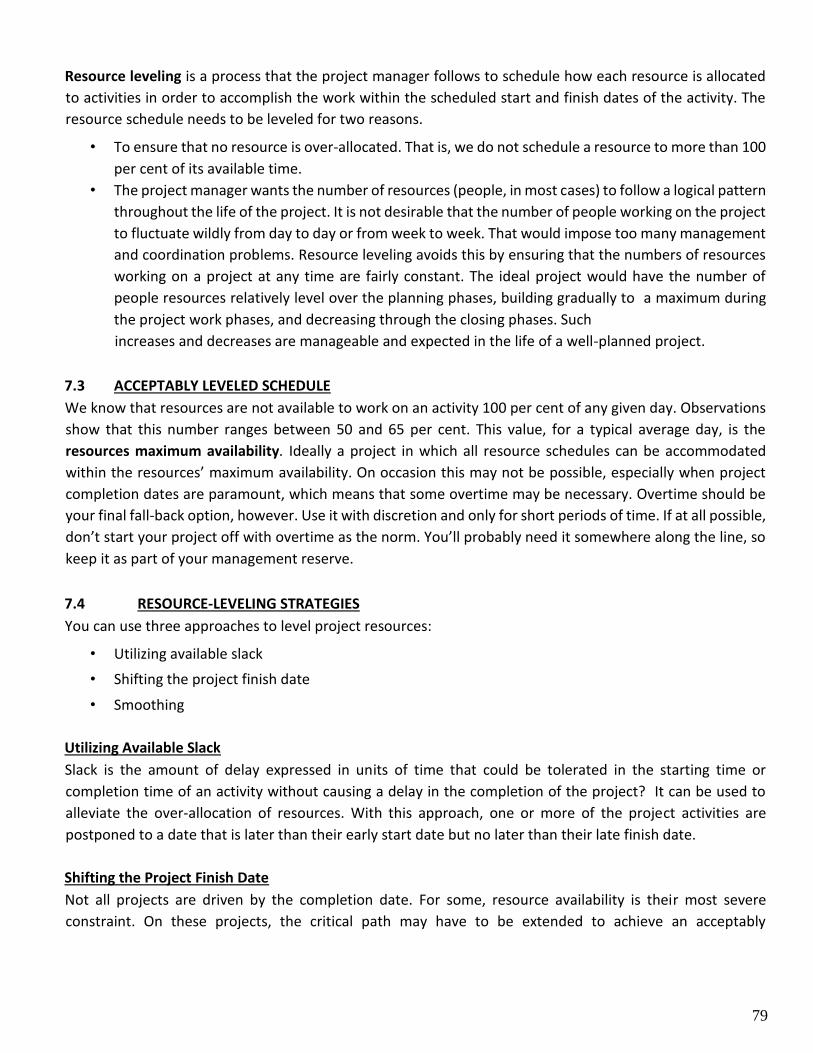
79
Resource leveling is a process that the project manager follows to schedule how each resource is allocated
to activities in order to accomplish the work within the scheduled start and finish dates of the activity. The
resource schedule needs to be leveled for two reasons.
• To ensure that no resource is over-allocated. That is, we do not schedule a resource to more than 100
per cent of its available time.
• The project manager wants the number of resources (people, in most cases) to follow a logical pattern
throughout the life of the project. It is not desirable that the number of people working on the project
to fluctuate wildly from day to day or from week to week. That would impose too many management
and coordination problems. Resource leveling avoids this by ensuring that the numbers of resources
working on a project at any time are fairly constant. The ideal project would have the number of
people resources relatively level over the planning phases, building gradually to a maximum during
the project work phases, and decreasing through the closing phases. Such
increases and decreases are manageable and expected in the life of a well-planned project.
7.3 ACCEPTABLY LEVELED SCHEDULE
We know that resources are not available to work on an activity 100 per cent of any given day. Observations
show that this number ranges between 50 and 65 per cent. This value, for a typical average day, is the
resources maximum availability. Ideally a project in which all resource schedules can be accommodated
within the resources’ maximum availability. On occasion this may not be possible, especially when project
completion dates are paramount, which means that some overtime may be necessary. Overtime should be
your final fall-back option, however. Use it with discretion and only for short periods of time. If at all possible,
don’t start your project off with overtime as the norm. You’ll probably need it somewhere along the line, so
keep it as part of your management reserve.
7.4 RESOURCE-LEVELING STRATEGIES
You can use three approaches to level project resources:
• Utilizing available slack
• Shifting the project finish date
• Smoothing
Utilizing Available Slack
Slack is the amount of delay expressed in units of time that could be tolerated in the starting time or
completion time of an activity without causing a delay in the completion of the project? It can be used to
alleviate the over-allocation of resources. With this approach, one or more of the project activities are
postponed to a date that is later than their early start date but no later than their late finish date.
Shifting the Project Finish Date
Not all projects are driven by the completion date. For some, resource availability is their most severe
constraint. On these projects, the critical path may have to be extended to achieve an acceptably

80
resourceleveled schedule. This case could very well mean that the parallel scheduling on the activity network
diagram that moved the original finish date to an earlier one needs to be reversed. The start-to-start and
finish -to-finish dependencies might need to be set back to the linear finish-to-start type.
In some cases, a project is of a low enough priority within the organization that it is used mostly for fill-in
work. In that case, the completion date is not significant and doesn’t have the urgency that it does in a
timetomarket project. For most projects, however, moving the finish date to beyond a desired date is the
least attractive alternative.
Smoothing
Occasionally, limited overtime is required to accomplish the work within the scheduled start and finish dates
of the activity. Overtime can help alleviate some resource over-allocation because it allows more
work to be done within the same scheduled start and finish dates. We call this smoothing, and through its
use, we eliminate resource over-allocations, which appear as spikes in the resource loading graphs.
7.5 COST IMPACT OF RESOURCE LEVELING
It should be obvious to you that resource leveling almost always stretches the schedule. The case where it
doesn’t stretch the schedule may occur if slack is available in the right places in the schedule. Scheduling the
work of a resource over a longer period of time not only removes scheduling conflicts, but it also removes
any over-allocations of that resource. To do all that, the project completion date is moved out in time, which
can have the following results:
• If the resources are billable based on the labor expended, project costs do not increase.
• If there are resources that are charged on a calendar basis, project costs will increase. Such expenses
would be attributable to equipment and space that is on a rental agreement. In some cases, there
may be increased people costs as well.
• If there are incentives for early completion and penalties for late completion of a project, a cost
impact will be felt as well.
7.6 IMPLEMENTING MICRO-LEVEL PROJECT PLANNING
Micro-level planning is another step in the decomposition of the tasks that are assigned to an individual. It
involves a decomposition to what we will call subtasks. Remember that we are dealing with tasks that have
met the six WBS completion criteria and are therefore relatively simple tasks or short duration.
Micro-level project planning begins with the lowest-level activity that is defined in the WBS. Because it
appears in the WBS, it will have management oversight by the project manager. The responsibility for
completing this activity within a defined window of time will be assigned to an activity manager. The activity
may be simple enough so that all of the work of completing is done by the activity manager. In more complex
situations, a small team assigned to the activity manager will actually complete the work of the activity. The
first thing the subteam must do is to continue the decomposition that was done in building the WBS. But this
decomposition will be at the task level. The tasks might be nothing more than a simple to-do list that is
executed in a linear fashion. More complex activities will actually generate an activity network diagram

81
composed of tasks and their dependency relationships. These activities will each be less than two weeks’
duration, so the tasks that make them up will be of lesser duration. The decomposition should be fairly simple
and result in tasks of one to three days’ duration.
7.7 WORK PACKAGES
Let us assume that at this point all JPP session activities are completed. It means that: l the project work has
been defined as a list of activities,
• activity duration and resource requirements are specified,
• the project network is built,
• the activity schedule is done, resources have been scheduled.
At this stage, the JPP session attendees have reached a consensus. Still there is one more step to go before
project work can commence that is, to define the work to be done in each activity but at the task level. You
know that activities are made up of tasks. The work to be done within an activity is called a work package.
We can say that a work package is:
• This is really the final test of the feasibility of the schedule and resource- leveling decisions.
• It is a statement from each activity manager that tells how he or she has planned to complete the
activity within the scheduled start and finish dates.
• For the project manager, the work package is a document that describes the work at a level of detail
so that if the activity manager or anyone working on the activity were not available (temporarily or
permanently) due to any reason, someone else could use the work package to figure out how to
continue the work of the activity with minimal lost time. This safeguard is especially important for
critical path activities for which schedule delays are to be avoided.
A work package can consist of one or several tasks. In case of several tasks, the tasks can be completed in any
order.
A work package can also consist of tasks that take the form of a mini-project, with a network diagram that
describes it. In this case, work packages are assigned to a single individual, called an activity manager or work
package manager. This manager (just like a project manager) is responsible for completing the activity on
time, within budget, and according to specification.
Purpose of a Work Package
The work package becomes the base for all project work. It describes in detail the tasks that need to be done
to complete the work for an activity. In addition to the task descriptions, the package includes start and end
dates for the activity. The work package also can be adapted to status reporting. Tasks constitute the work
to be done. Checking off completed tasks measures what per cent of the activity is complete.

82
Format of a Work Package
We recommend two work package documents.
Work package assignment sheet
This is a very special type of report used as a ready reference for the project manager. It contains some basic
information about each work package and its manager (see Figure 7.1). It includes the earliest start and latest
finish times for each activity.
This sheet is one of the few resources available to the project manager and should not be made available to
anyone other than the project manager. The project manager is unlikely to tell an activity manager that the
activity is scheduled for completion on July 15, for example, but the activity manager really has until August
15 because of slack. Activity managers should be given only the scheduled start and end dates for their
activities.
The work package assignment sheet has limited value in smaller projects but can be invaluable in larger ones.
For example, our business was once involved in a project that consisted of more than 4000 activities. Over
the seven-year life of the project, more than 10,000 activity managers were involved. This report became a
phone directory that needed constant updating as team members came and went. Because of the complexity
and personnel changes that accompany these large projects, the project manager needs an effective and
efficient way of keeping up with the project team membership, who is assigned to what, and how they will
accomplish their work.

Figure 7.1: Work Package Assignment Sheet
Work package description report
This is a detailed description of the activity plan. It contains much of the same information that is found in a
project plan, but it focuses on activities, not projects. It is therefore a much simpler document than a project
plan, even though it contains the same type of information as the project plan.
A work package description report is a document prepared by the activity manager in which he or she describes
the details of how he or she will accomplish the work of the activity.
Once the project plan has been approved, it is the activity manager’s responsibility to generate the work
package documentation. Not all activities will require or should require work package documentation. The
documentation can be limited to critical path activities, near-critical path activities, high-risk activities, and
activities that use very scarce or highly skilled staff. It is the project managers who will decide which activities
need a work package description report.
The descriptions must be complete so that anyone could pick them up, read them, and understand what has
to be done to complete the activity. Each task must be described so that the status of the work package can
be determined easily. Ideally, the task list is a check-off list. Once all the tasks have been checked off as
being completed, the activity is completed. Each task will also have a duration estimate attached to it.
Work Package Completion Per cent
Work package completion per cent is the ratio of completed packages to those still incomplete, including
those not yet started. Since a typical work package for an individual or very small team (two or three people)
is usually four weeks or less, on a project of a dozen people or so, you may have one or more packages being
completed each week. This allows very detailed insight into project control effectiveness as a function of the
changing status of work packages, which is reported during weekly status meetings.
71

REVIEW QUESTIONS
1. Define resource leveling.
2. Why does the resource leveling create problem for organizations?
3. Why the resource schedule needs to be leveled? 4. What do you understand by acceptably leveled
schedule?
5. Discuss the various resource-leveling strategies.
6. Write a short note on “Cost Impact of Resource Leveling”.
7. What is a work package?
72
TOPIC 8
____________________________________________________________________________________
8. JOINT PROJECT PLANNING
____________________________________________________________________________________
LEARNING OUTCOMES
After studying this topic you should be able to:
• Understand the purpose of the Joint Project Planning session
• Know how to plan a Joint Project Planning session
• Decide who should attend the Joint Project Planning session
• Understand all of the deliverables from the Joint Project Planning session
• Explain the purpose of the project proposal
• Know the contents of the project proposal
INTRODUCTION
This lesson deals with the JPP session. The lesson describes about the purpose and the treatment of the
logistics of planning projects using the Joint Project Planning session.
8.1 PURPOSE OF JPP SESSION
The objective of a JPP session is to develop a project plan that meets the Conditions of Satisfaction (COS) as
negotiated between the requestor and the provider, and as described in the Project Overview Statement.
Some important points regarding to the JPP sessions are as follows:
• All of the planning activities take place in the Joint Project Planning session (JPP) in order to create
the detailed project plan.
• The JPP is a group session in which all of the people who are involved in the project meet to develop
the detailed plan.
• The session can last from one to three days, and it can be work-intensive.
• The final result of the JPP session is an agreement about how the project can be accomplished within
a specified time frame, budget, resource availabilities, and customer specification.
• The objective of a JPP session is to develop a project plan that meets the Conditions of Satisfaction as
negotiated between the Customer and the project manager (Product Line Manager), and as described
in the Project Overview Statement.
8.2 PLANNING THE JPP SESSION
Planning is essential to good project management. The plan that you generate is a dynamic document. It
changes as the project commences. It will be a reference work for you and the team members when
questions of scope and change arise. Team planning has always been viewed as advantageous over other
forms of project planning. The synergy of the group provides far more accurate activity duration estimates
and more complete information input to the planning process itself.

Perhaps the best advantage of all is that it creates a much stronger commitment to the project for all those
who lived through the pain of generating and agreeing to the complete project plan.
The first document considered in the JPP session is the Project Overview Statement (POS).
The POS can be developed in a number of ways as follows:
77
• If it is an idea for consideration, it will probably be developed by one individual, typically the person
who will be the project manager.
• It can be departmentally based or cross-departmentally based.

87
The broader the impact on the enterprise, the more likely it will be developed as the first phase of a
JPP session.
Finally, the POS may have been developed through a COS exercise. In any case, the JPP session begins by
discussing and clarifying exactly what is intended by the POS. The project team might also use this
opportunity to write the Project Definition Statement (PDS)—their understanding of the project.
The JPP session must be planned down to the last detail if it is to be successful. Time is a scarce resource for
all and no one want to waste it. Recognize before you start that the JPP session will be very intense. Before
we discuss how the session is planned and conducted, let’s talk about who should attend.
8.3 ATTENDEES
In general, the attendees are one of the followings:
• The JPP participants are invited from among those who might be affected by or have input into the
project. If the project involves deliverables or is a new process or procedure, anyone who has input
to the process, receives output from the process, or handles the deliverables should be invited to
participate in the JPP.
• The customer falls into one or more of these categories and must be present at the JPP.
• Any manager of resources that may be required by the project team also will attend the JPP session.
• In many organizations, the project has a project champion (not necessarily the project manager or
customer manager) who may wish to participate at least at the start.
Being specific, the attendees are as follows:
1. Facilitator: A successful JPP session requires an experienced facilitator. This person is responsible for
conducting the JPP. It is important that the facilitators not have a vested interest or bring biases to the
session, because that would diminish the effectiveness of the plan. Therefore, it is suggested that the
project manager should not facilitate the session. If using an outside consultant is not possible, we
recommend a neutral party for facilitator, such as another project manager.
2 Project managers: The project manager is not the leader of the planning session. He or she is only in charge
of planning the project. Because the project manager is not leading the planning session, he or she can
concentrate on the plan itself; that is the project manager’s major role in the JPP.
3. Another project manager: Skilled JPP facilitators are hard to find. If the project manager is not a good
choice for facilitator, then maybe another project manager—presumably unbiased would be a good
choice, especially if he or she has JPP experience.
4. JPP consultant: Project management consultants will often serve as another source of qualified JPP
facilitators. Their broad experience in project management and project management consulting will be
invaluable.
5. Technograp her: The JPP facilitator is supported by a technographer, a professional who not only knows
project management but also is an expert in the software tools used to support the project. While the
JPP facilitator is coordinating the planning activities, the JPP technographer is recording planning
decisions on the computer as they occur in real time.

88
6. Core project team: The core project team is made up of those individuals who will stay with the project
from first day to last day. The presence of these experts in planning session will ease in estimating activity
duration and resource requirements.
7. Customer representative: The customer must be involved in the planning session. Not having the
customer’s buy-in is to court disaster. Changes to the project plan will occur, and problems will arise. If
the customer is involved in preparing the plan, he or she can contribute to resolution of change requests
and problem situations.
8. Resource managers: These managers control resources that the project will require. Putting a schedule
together without input and participation from these managers would be a waste of time.
9. Project champion: The project champion drives the project and sells it to senior management. A
champion may be a customer, the senior managers of the division, department, or process that will be
the beneficiary of the project deliverables.
10. Functional managers: Because functional managers manage areas that can either provide input to or
receive output from the project deliverables, they or a representative should participate in the planning
session. They will ensure that the project deliverables can be smoothly integrated into existing functions
or that the functions will have to be modified as part of the project plan.
11. Process owner: Functional managers manage areas that can either provide input to or receive output
from the project deliverables and they will be responsible for the success/failure of tasks/activities.
Facilities
Because the planning team may spend as many as three consecutive days in planning, it is important that
the physical facility is comfortable and away from the daily interruptions.
Equipment
You will need an ample supply of Post-It notes, tape, scissors, and colored marking pens. For more hightech
equipment, an LCD projector and a PC are all you need for everyone in the room to see the details as they
come together.
8.4 THE COMPLETE PLANNING AGENDA
The agenda for the JPP session is straightforward. It can be completed in one, two, or three sessions as
follows:
Session 1
1. Negotiate the Conditions of Satisfaction (COS).
Session 2
1. Write the Project Overview Statement (POS).
Session 3 (JPP session)
1. The entire planning team creates the first-level WBS.
2. Subject matter experts develop further decomposition with the entire planning team observing and
commenting.

89
3. Estimate activity durations and resource requirements.
4. Construct a project network diagram.
5. Determine the critical path.
6. Revise and approve the project completion date.
7. Finalize the resource schedule. 8. Gain consensus on the project plan.
Deliverables
The deliverables from the JPP session are:
Work Breakdown Structure.
• Activity duration estimates
• Resource requirements
• Project network schedule
• Activity schedule
• Resource assignments
• Project notebook
You are already familiar with the above deliverables except “Project notebook”. A project notebook is a
documentation of any type is always a chore to produce. Project documentation happens as a natural
byproduct of the project work. All that is needed is to appoint a project team member to be responsible. His
or her responsibilities include gathering information that is already available, putting it in a standard format,
and electronically archiving it. This responsibility begins with the project planning session and ends when the
project is formally closed.
8.5 PROJECT PROPOSAL
The finale of all the planning is the project proposal. The project proposal is the deliverable from the JPP
session and is forwarded to the senior management team for approval to do the project. It states the
complete business case for the project. This includes expected business value, as well as cost and time
estimates. In addition to this information, the proposal details what is to be done, who is going to do it, when
it is going to be done, and how it is going to be done. It is the roadmap for the project.
Contents of the Project Proposal
Each organization will have a prescribed format for its project proposal, but most proposals will have units
similar to the ones in the list that follows:
1. Background: This brief description details the situation that led to the project proposal. It often states
the business conditions, opportunities, and any problems giving rise to the project. It sets the stage for
later units and puts the project in the context of the business.
2. Objective: This is another short unit that gives a very general statement of what you hope to accomplish
through this project.
3. Overview of approach to be taken: For those who might not be interested in the details of how you are
going to reach your objective, this unit provides a high-level outline of your approach.

90
4. Detailed statement of work: Here is where you give the details of your approach. Include what will be
done, when it will be done, who will do it, how much time will be required of them, and what criteria
will be used to measure completeness. This is the roadmap of all the project work.
5. Time and cost summary: It is our practice to include a summary page of time and cost data. Often the
data will have been stated over several pages and is brought together here for easy review and comment
by the customer.
6. Appendices: Appendix is reserved for all supporting data and details that are not germane to the body
of the proposal. Anticipate questions your customer might have, and include answers here. Remember
that this is detail beyond the basic description of the project work. Supporting information is generally
found here.
REVIEW QUESTIONS
1. What is JPP session?
2. What is the objective of a JPP session?
3. What do you mean by planning the JPP session?
4. What is the role of POS in JPP session?
5. Discuss the role of followings in JPP session:
• Facilitator
• Project Manager
• JPP Consultant
• Technographer
• Functional managers
6. What is the agenda of JPP session?
7. What are the deliverables from JPP session?
8. What are the contents of the project proposal?

91
TOPIC 9
____________________________________________________________________________________
9. PROJECT TEAM
_______________________________________________________________________________
__ LEARNING OUTCOMES
After studying this topic you should be able to:
• Explain the relationship between the project manager and the functional manager
• Use projects for motivation and development
• Understand the concept of job design and how it relates to project management
• Know the components of a project team
• Help contracted team members become part of the team
• Understand the tools of an effective team
• Organize the project team
INTRODUCTION
After the approval of project plan, the team selection process starts. This lesson discusses the recruiting,
organizing and managing the team. The lesson also describes the characteristics of various team
members of the project including project manager.
9.1 PROJECT MANAGER VS FUNCTIONAL MANAGER
The objective of the project manager is to complete the project on time, within budget, and according to
the customer’s Conditions of Satisfaction, in other words, according to specification. On the other hand,
the objective of the functional (or resource) manager’s includes development of staff skills to meet
project requirements and deployment of staff to projects. These objectives pertain regardless of the
organizational structure. The project manager’s objectives and the functional (or resource) manager’s
objectives will often conflict. Functional managers look for opportunities to deploy staff to project
assignments that provide opportunities to learn new skills. On the other hand, the project manager would
like to have experienced staff.
9.2 PROJECTS AS MOTIVATION AND DEVELOPMENT TOOLS
A project manager must create a working environment that encourages development of the team
member and leave it up to the team member to respond positively. Motivators are those behaviors or
situations that have a positive impact on the worker i.e. they motivate the worker to better performance.
There are certain expectations that the worker has, and to not have them is to demotivate him or her.
These are hygiene factors. For example, workers expect a reasonable vacation policy; to not have one
act as a demotivator. On the other hand, having a good vacation policy does not motivate the worker.
The following list is a result of survey conducted by Herzberg in 1935 (The survey has become a classic
study and still applies today).
Motivators
Herzberg identified the following motivators:

92
• Achievement
• Recognition
• Advancement and growth
• Responsibility
• Work itself
Hygiene Factors
Herzberg identified the following hygiene factors:
• Company policy
• Administrative practices
• Working conditions
• Technical supervision
• Interpersonal relations
• Job security
• Salary
Note that the motivators are related to the job where as the hygiene factors are related to the
environment in which the job is performed. The manager has some amount of control over the
motivators relating to the job but the hygiene factors, being environmental, are usually beyond the
control of the manager. Managers can bring them to the attention of their senior management but are
otherwise powerless to change them. Several of the motivators are directly controlled or influenced by
actions and behaviors of the project manager regarding the work itself that the team member will be
asked to do.
They are as follows:
Challenge
• Recognition
• Job design
• Skill variety
• Task identity
• Task significance
• Autonomy
• Feedback
9.3 RECRUITING THE PROJECT TEAM
To ensure successful completion of a project, the project manager have to recruit and build an effective
team. As a team member, the technical skills of a person are not sufficient. The person must be capable
of having critical roles and chemistry that must exist between and among the project manager and the
team members.

93
A project team has three separate components:
• Project manager
• Core team
• Contracted team
The following sections describe the responsibilities of each of the three components to a project team.
Project Manager
Project managers are the leaders of the projects. They are responsible for completing the project on time,
within budget, and according to specification. They have the authority to get the job done. The project
manager represents the project to the organization and to external groups. In many cases, the project
manager has responsibility for more than one project simultaneously.
Selection Criteria
A project manager must be experienced, capable, and competent in getting the project done on time,
within budget, and according to specifications. The potential project manager should have the following
general skills:
• Background and experience
• Leadership and strategic expertise
• Technical expertise
• Interpersonal competence
• Managerial ability
Core Team Members
Core team members typically have a major role to play in the project and bring a skill set that has broad
applicability across the range of work undertaken in the project. They might also have responsibility for
key activities or sets of activities in the project.
Selection Criteria
The characteristics that we consider important for the core team members are as follows:
1. Commitment: The project manager must know that each core team member places a high priority on
fulfilling his or her roles and responsibilities in the project.
2. Shared responsibility: Shared responsibility means that success and failure are equally the reward and
blame of each team member.
3. Flexibility: Team members must be willing to adapt to the situation.
4. Task-orientedness: Team members must be results-oriented.
5. Ability to work within schedule and constraints.
6. Willingness to give trust and mutual support.
7. Team-orientedness: To be team-oriented means to put the welfare of the team ahead of your own.

94
8. Open-mindedness: The open-minded team member will welcome and encourage other points of view
and other solutions to problem situations.
9. Ability to work across structure and authorities: In the contemporary organization, projects tend to
cross organizational lines. Cross-departmental teams are common. Projects such as these require
the team member to work with people from a variety of business disciplines. Many of these people
will have a different value system and a different approach than the team member might be used to
working with. Their adaptability, flexibility, and openness will be good assets.
10. Ability to use project management tools: The team member must be able to leverage technology in
carrying out his or her project responsibilities. Projects are planned using a variety of software tools,
and the team member must have some familiarity with these tools.
Contracted Team Members
The business-to-business environment is changing, and those changes are permanent. Organizations are
routinely outsourcing processes that are not part of their core business or core expertise. There are two
reasons for choosing to use contract team members instead of the company’s own employees:
Shortage of staff
Shortage of skills
Those shortages have made it possible for a whole new type of business to grow.
Implications of Adding Contract Team Members
People will join the project team only for the period of time during which their particular expertise is
needed. The project manager must be aware of the implications to the project when contracted
professionals are used, which may include the following:
• There may be little or no variance in the time contracted team members are available, so the
activities on which they work must remain on schedule.
• They must be briefed on their role in the project and how their activity relates to other activities in
the project.
• Commitment of contracted members is always a problem because their priorities probably lie
elsewhere.
• Quality of work may be an issue because of poor levels of commitment. They just want to get the
job done and get on with their next assignment. Often anything will do.
• Contracted team members will often require more supervision than core team members.

95
Selection Criteria
The steps the project manager follows to engage the services of a contracted team member might look
something like the following:
1. Identify the types of skills needed, the number of personnel, and the timeframe within which they will
be needed.
2. Identify a list of companies that will be invited to submit a proposal.
3. Write the request for proposal.
4. Establish the criteria for evaluating responses and selecting the vendor(s).
5. Distribute the request for proposal.
6. Evaluate the responses.
7. Reduce the list of vendors to a few who will be invited on site to make a formal presentation.
8. Conduct the onsite presentations.
9. Choose the final vendor(s), and write and sign the contract.
Types of
Proposals
A project manager might consider three types of proposals as he or she looks for a vendor or agency to
provide contracted team members: Request for Information, Request for Proposal, Request for Quote.
• Request for Information: A Request for Information (RFI) is used when an organization is looking
for information relevant to a particular process or product. It usually does not have a written
specification. The purpose of an RFI is to discover vendors and products that the organization will
investigate further with one of the other two types of proposals.
• Request for Proposal: A Request for Proposal (RFP) is used to find the vendor or vendors that can
provide the best solution and price. The RFP always includes a specification that identifies the
features, functions, physical specifications, performance requirements, and environment in
which the requested deliverable must operate. Generally, descriptions of steps to be followed to
select the vendor and the method of evaluation are included. In some cases, more than one
vendor will be chosen. Each vendor will provide a piece of the final solution. Using several vendors
presents special challenges to the project manager.
• Request for Quote: The Request for Quote (RFQ) is used to find the best price-to performance
ratio for a given solution. In this case, the company knows exactly what it wants; it is only a matter
of finding the vendor that best meets the Conditions of Satisfaction. The definition of what the
company wants will often include the exact hardware, software, and more. This approach offers
the PM an easier-to-manage situation than the multivendor alternative.
9.4 ORGANIZING THE PROJECT TEAM
After identifying the individuals who will become the project team, it is time to make them function as a
team. First, we’ll briefly look at authority and responsibility, then several procedural matters that the
team will have to discuss and agree on.

96
Authority
To be effective, the project manager must have authority over the project. It is his or her job to get the
project done on time, within budget, and according to specification. That authority is often delegated,
but it is the project manager who is ultimately responsible.
The major difficulty that project managers have is that the project team is not their line responsibility.
Team members are assigned based on their expertise but report to other managers, which means that
the project manager will have to exercise the best leadership skills and diplomacy to get the job done.
Responsibility
The project manager assigns activity management responsibility to team members. They are then
responsible for completing their assigned activity within its scheduled window of time and for producing
the activity deliverables on time according to specification. It is the project manager, though, who is
ultimately responsible for completing the project as expected. In conveying this sense of responsibility
to each team member, the project manager must exercise sound leadership and management skills. The
responsibility of anyone cannot be delegated.
Balancing a Team
Balance on the team is a critical success factor for any team that hopes to successfully complete its
project. There are several ways to measure balance and several characteristics of the team like learning
style, thinking style, conflict resolution style, skills and competencies that have been used to define
balance.
Developing a Team Deployment Strategy
Before you balance your team, it is important that it should be developed. Once a team is developed you
can balance it depending on the skills and the way of working of your team members, For example,
suppose a confrontation has arisen with the client. We would much rather send an accommodator than
a converge to resolve the confrontation. However, there might not be an accommodator on the team.
Teams are most likely to be formed without knowledge of this kind of information. It is only after the fact
that these imbalances are discovered. On a larger scale, the project manager needs to determine which
team members have a greater likelihood of success on which types of work assignments. Therefore, it is
important that you first select your team as per your need and use the team members as and when
required.
9.5 ESTABLISHING TEAM OPERATING RULES
Team operating rules define how the team works together, makes decisions, resolves conflicts, reports
progress, and deals with a host of other administrative chores. Even before the work of the project
begins, the team should agree on how it will work together.

97
Situations Requiring Team Operating Rules
The following is a fairly complete list of general situations that may arise during the course of a project and
that will require some action on the part of the team.
• Problem solving l Decision making
• Conflict resolution
• Consensus building
• Brainstorming
• Team meetings
Now, consider the following questions that must be answered at some point in the project life cycle:
• What has to be done and where? (Scope)
• Why should it be done? (Justification)
• How well must it be done? (Quality)
• When is it required and in what sequence? (Schedule)
• How much will it cost? (Budget/Cost)
• What are the uncertainties? (Risk)
• Who would do the job? (Human resources)
• How should people be organized into teams? (Communication/ Interpersonal skills)
• How will we know if we have done the job? (Information dissemination/ Communication)
Each one of these questions will engage one or more of the six action areas listed previously. The team
needs to decide ahead of time how it will carry out each of the action areas and that is, what the rules of
engagement are.
Problem Solving
There will be many situations during the course of the project work where the team will be challenged
to figure out how to satisfactorily meet the client’s needs while maintaining the schedule and the budget
within the assigned resources. Some situations may be easily resolved, while others may challenge even
the most creative of minds. A good problem solver will think over the problem and will conceive of
approaches that may have been overlooked. Here, the learning style of the team member is the
important characteristic that will help him or her to find out the solutions. It means that the team must
have all learning styles represented in order to solve problems effectively.
Decision-Making
Team members make decisions all of the time as they engage in the work of the project. Some of those
decisions are obvious and straightforward and may not require the involvement of others while other
decisions are more complex and may require the involvement and active participation of the team, the
client, and even people outside of the project.

98
Conflict Resolution
The next area for which operating rules are needed deals with how the team resolves conflicts. Conflicts
arise when two or more team members have a difference of opinion, when the customer takes issue with
an action to be taken by the project team, or in a variety of other situations involving two parties with
different points of view. In all of these examples, the difference must be resolved. Clearly, conflict
resolution is a much more sensitive situation than the decision-making rule because it is confrontational
and situational, whereas the decision-making rule is procedural and structured. Depending on the
particular conflict situation, the team might adopt different conflict resolution styles.
Consensus Building
Consensus building is an excellent tool to have in the project team tool kit. In all but a few cases, there
will be a legitimate difference of opinion as to how a problem or issue should be addressed. There will
be no clear-cut action on which all can agree. In such situations the team must fashion an action or
decision with which no team members have serious disagreement even though they may not agree in
total with the chosen action. To use the method successfully, make sure that everyone on the team gets
to speak. Talk through the issue until an acceptable action is identified.
Brainstorming
Brainstorming is an essential part of the team operating rules because, at several points in the life of the
project, the creativity of the team will be tested. Brainstorming is techniques that can focus that creativity
and help the team discover solutions. There will be situations where acceptable ideas and alternatives
have not come forth from the normal team deliberations. In such cases the project manager might
suggest a brainstorming session. A brainstorming session is one in which the team contributes ideas in a
stream-of-consciousness mode.
Team Meetings
The project manager needs to define team meetings in terms of frequency, length, meeting dates,
submission/preparation/distribution of the agenda, who calls the meeting, and who is responsible for
recording and distributing the minutes. The entire team needs to participate in and understand the rules
and structure of the meetings that will take place over the life of the project. Different types of team
meetings, perhaps with different rules governing their conduct and format, may occur.
9.6 MANAGING TEAM COMMUNICATIONS
Communicating among and between technical team members does not come naturally. Technical people
often not good communicators. However, for the team members to be truly effective, they have to
openly communicate with one another. For some, that will be difficult; for others, it simply is a matter of
practice.
Managing Communications Timing, Content and Channels
Getting information to the correct team members at the right time in the project usually determines the
success or failure of the project. The project manager must manage the communication process as much
as the technical process or risk failure. Let’s look at those ideas.

99
Timing
First, the timing of information can be critical. Problems can arise if the information comes too soon or
too late. If the information comes too far in advance of the action needed, it will be forgotten. It’s almost
impossible to remember information given one year in advance of its use. So the project manager has to
understand what the various team members need to know to carry out their assignments. You can do
this by looking through the tasks in the WBS. You require to see that team members have to be alerted
to upcoming tasks and need to be in communication with the team members whose tasks have
precedence to their own. The project manager can make this happen.
A second problem in timing is getting the information needed to the project team member after they
need it. Remember that project team members may need a few days to assimilate the information you’re
passing, particularly if you’re speaking about a new technology. This requires that you, as the project
manager, manage the timing carefully so that everyone has as much information as possible and that
you give them sufficient time to absorb it and process it so as to get the job done.
Content
The next communications management issue you need to be concerned about is communicating the
correct information. This means you must understand what the project team members need to know to
be successful. If you don’t know what information the team members need, ask them. If the team
members don’t know, you need to sit down with other of their colleagues and find out what sort of
information needs to be passed in order to make the project run smoothly. Whichever the case, you need
to be in charge of getting the information to your team members at the right time and with the right
content.
Choosing Effective Channels
Once you know when the communication needs to occur for the project team to be successful and you
have identified the basic communication content, the choice of how to get the information to the team
members becomes important. You have a choice among various channels through which communication
can flow. The channels may be any one of the followings:
• Face-to-face, in-person meeting.
• Videoconferencing.
• E-mail.
• Written materials. Phone.
The professional project manager is aware of the communication patterns he or she needs to manage to
make it possible for the project team to have success as a unit. The areas to manage include timing,
content, and channel.
Managing Communication beyond the Team
To be successful as a project manager, you need to communicate not only within the team but also to
various stakeholders outside of the team.
100
Your project may seem a success to you, but unless that is conveyed to the right people outside of the
team, it won’t matter. The outside people may be the sponsor or the stakeholder of the project.
REVIEW QUESTIONS
1. What is the difference between project manager and functional manager?
2. List the motivators identified by Herzberg.
3. What are hygiene factors?
4. Discuss the components of project team.
5. What are the selection criteria for project manager?
6. What are the selection criteria for core team members?
7. Why do we need contracted team members? Discuss the different types of proposals that project
manager looks for a vendor or agency to provide contracted team members. 8. Write a short note on
“Organizing the project team.” 9. Write short notes on the followings:
a) Establishing Team Operating Rules
b) Managing Team Communications
101
TOPIC 10
___________________________________________________________________________________
10. RESOURCE AVAILABILITY
___________________________________________________________________________________
LEARNING OUTCOMES
After studying this lesson, you should be able to:
• Understand the reasons for implementing controls on the project
• Track the progress of a project
• Determine an appropriate reporting plan
• Measure and analyze variances from the project plan
• Report project status with graphical tools
INTRODUCTION
At this point, you have put considerable effort into building and getting approval for a project plan that
describes in great detail how you will accomplish the goal of the project. The project work has begun, and you
want to make sure that it is progressing as planned. To do this, you will institute a number of reports that are
designed to tell exactly how well the project is doing with respect to the plan and how to correct variances
from this plan. The question to consider is the extent to which you want to maintain control through the
reports you require. In this lesson we will study about the monitoring and controlling progress of the project.
10.1 PURPOSE OF CONTROLS
Controls are actions taken as a result of reports. When implemented, controls are designed to bring actual
project status back into conformance with the project plan. These reports are designed to support control
activities by drawing attention to certain aspects or characteristics of the project, such as planned versus
actual schedule, trends in the schedule, and actual versus planned resource use. We typically track
performance levels, costs, and time schedules. There are three reasons to use reports in your project.
1. To track progress: The project manager will want to use a periodic (at least biweekly, but weekly is best)
reporting system that identifies the status of every activity scheduled for work since the last progress
report. These reports summarize progress for the current period as well as the cumulative progress for
the entire project.
2. To detect variance from plan: Variance reports are of particular importance to management. They are
simple and intuitive, and they give managers an excellent tool by which to quickly assess the health of a
project. To detect variance, the project manager needs to compare planned performance to actual
performance.
3. To take corrective action: To take corrective action, it is necessary to know where the problem is and to
have that information in time to do something about it. Once there is a significant variance from plan, the
next step is to determine whether corrective action is needed and then act appropriately.

102
10.2 BALANCING THE CONTROL SYSTEM
Figure 10.1: The Total Cost of Control and Risk
It is very easy to get carried away with controls and reports. The more controls that are put in place, the lower
the project risk, and the less likely it will be for the project to get in trouble. As figure 10.1 shows, however,
there is a point of diminishing returns. Cost aside, there is another impact to consider. To comply with the
project controls, project team members will have to spend time preparing and defending progress reports.
This subtracts from the time spent doing project work.
The project manager needs to strike a balance between the extent of the control system and the risk of
unfavorable outcomes. Figure 10.1 shows the relationship between risk and control. Conceptually, there is a
balance point that minimizes the total cost exposure for having chosen a particular level of control.
Control versus Quality
Control and quality are positively correlated with one another. If we do not take steps to control the product and
the process, we will not enjoy the benefits that quality brings to the equation.
10.3 PROGRESS REPORTING SYSTEM
To make sure that the project proceeds according to plan, you need to establish a reporting system that keeps
you informed of the many variables that describe how the project is proceeding as compared to the plan. A
reporting system has the following characteristics:

103
• Provides timely, complete, and accurate status information
• Doesn’t add so much overhead time as to be counterproductive
• Is readily acceptable to the project team and senior management
• Warns of pending problems in time to take action
• Is easily understood by those who have a need to know
Most project management software tools allow you to customize their standard reports to meet even the most
specific needs.
Types of Project Status Reports
There are five types of project status reports:
1. Current period reports: These reports cover only the most recently completed period. They report progress
on those activities that were open or scheduled for work during the period. Reports might highlight activities
completed and variance between scheduled and actual completion dates.
2. Cumulative reports: These reports contain the history of the project from the beginning to the end of the
current report period. They are more informative than the current period reports because they show trends
in project progress.
3. Exception reports: Exception reports report variances from plan. These reports are typically designed for
senior management to read and interpret quickly.
4. Stoplight reports: Stoplight reports are a variation that can be used on any of the previous report types.
Here stickers of the different colors are put on the top right of the first page of the project status report. The
purpose of the different color of stickers are as follows:
a. Green sticker: It means the project is on schedule and everything seems to be moving as planned. This
sticker will signal to senior managers that everything is progressing according to plan, and they need
not even read the attached report.
b. Yellow sticker: It means that the project has encountered a problem or there is a schedule slippage.
That is a signal to upper management that the project is not moving along as scheduled but that you
have a get-well plan in place.
c. Red stickers: It means that a project is out of control. Red reports are to be avoided at all costs because
they mean that the project has encountered a problem, and you don’t have a get-well plan or even a
recommendation for upper management.
5. Variance reports: Variance reports do exactly what their name suggests—they report differences between
what was planned and what actually happened. The report has three columns:
• The planned number
• The actual number
Typical variance reports are snapshots in time (the current period) of the status of an entity being tracked.
Most variance reports do not include data points that report how the project reached that status. Project
variance reports can be used to report project as well as activity variances.
104
How and What Information to Update
As input to each of these report types, activity managers and the project manager must report the progress
made on all of those activities that were open for work during the period of time covered by the status report.
Recall that your planning estimates of activity duration and cost were based on little or no information. Now
that you have completed some work on the activity, you should be able to provide a better estimate of the
duration and cost exposure. This reflects itself in a re-estimate of the work remaining to complete the activity.
That update information should also be provided.
The following is a list of what should actually be reported:
1. Determine a set period of time and day of week by which by which all updated information is to be submitted.
2. Report actual work accomplished during this period.
3. Record historical and re-estimate remaining (in-progress work only).
4. Actual start and finish dates of activities started or completed during the report period.
5. Record days of duration accomplished of so far working re-estimated duration as reflected in the
timetocompletion number.
6. Report resource effort (hours/day) spent and remaining (in-progress work only).
Frequency of Gathering and Reporting Project Progress
A logical frequency for reporting project progress is once a week, usually on Friday afternoon. There are some
projects, such as refurbishing a large jet airliner, where progress is recorded after each shift, three times a
day.
Variances
Variances are deviations from plan. Think of a variance as the difference between what was planned and what
actually occurred. There are two types of variances:
Positive Variances
Positive variances are deviations from plan that indicate that an ahead-of-schedule situation has occurred or
that an actual cost was less than a planned cost. This type of variance is good news to the project manager.
Positive variances bring their own set of problems, which can be as serious as negative variances. Positive
variances can allow for rescheduling to bring the project to completion early, under budget, or both.
Resources can be reallocated from ahead of-schedule projects to behind-schedule projects.
Negative Variances
Negative variances are deviations from plan that indicate that a behind-schedule situation has occurred or that
an actual cost was greater than a planned cost.
Negative variances, just like positive variances, are not necessarily bad news. For example, you might have
overspent because you accomplished more work during the report period than was planned. But in
overspending during this period, you could have accomplished the work at less cost than was originally
planned. You can’t tell by looking at the variance report.

105
In most cases, negative time variances affect project completion only if they are associated with critical path
activities or if the schedule slippage on noncritical path activities exceeds the activity’s total float. Variances
use up the float time for that activity; more serious ones will cause a change in the critical path.
Negative cost variances can result from uncontrollable factors such as cost increases from suppliers or unexpected
equipment malfunctions. Some negative variances can result from inefficiencies or error.
10.4 GRAPHICAL REPORTING TOOLS
Usually senior managers have only a few minutes of uninterrupted time to digest your report. Having to read
several pages only to find out that the project is on schedule is frustrating and a waste of valuable time. For
this it is better to present them the report in the form of graphics. You can use the Gantt charts (See Figure
10.2) and Milestone Trend Charts (See Figure 10.3) for this purpose.

106
Figure 10.2: A Typical Gantt Chart
Figure 10.3: A Typical
Milestone Trend Chart
Using the WBS to Report Project Status
Because the Work Breakdown Structure (WBS) shows the hierarchical structure of the work to be done, it can
be used for status reporting, too. In its simplest form, each activity box can be shaded to reflect completion
percentages. As lower-level activities are completed, the summary activities above them can be shaded to
represent percent complete data. Senior managers will appreciate knowing that major parts of the project
are complete. Unfortunately, the WBS does not contain scheduling or sequencing information. To the extent
that this adds to the value of the report, narrative data or brief tabular data might be added to the report.
Figure 10.4 shows an example status report using the WBS.
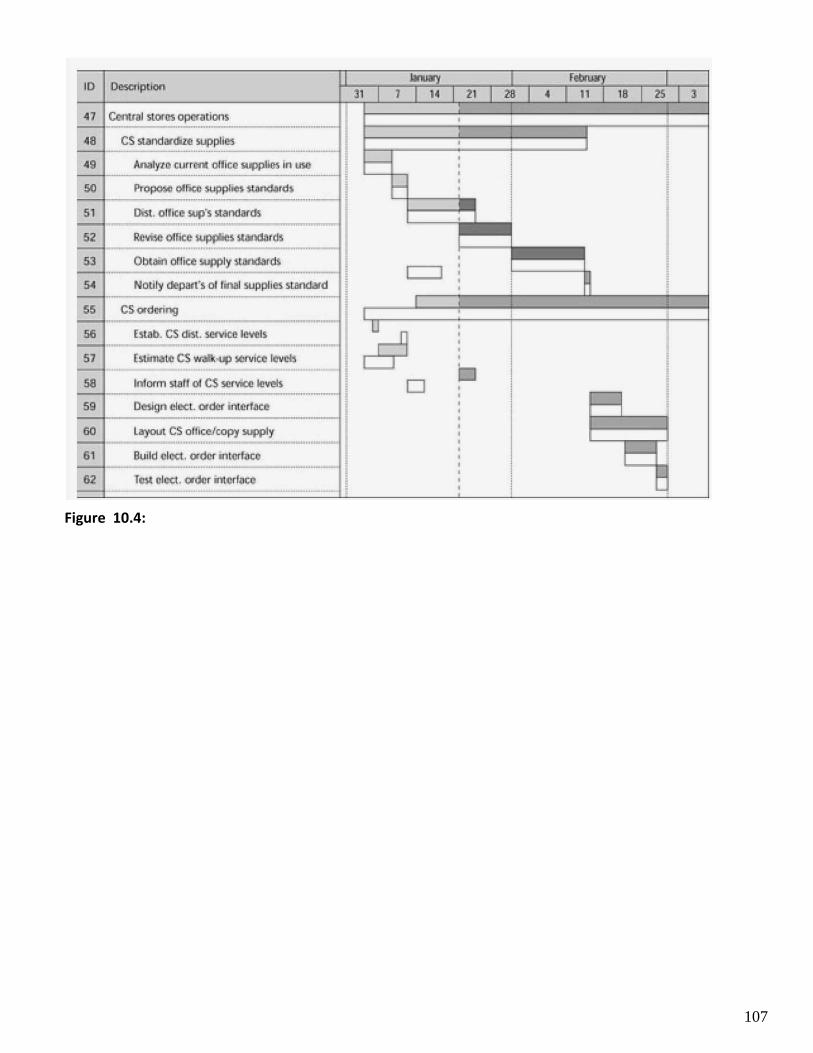
107
Figure 10.4:

108
Status Reporting with the WBS
Although this report is rather intuitive, it does not contain much detail. It would have to be accompanied by
an explanatory note with schedule and cost detail.
10.5 MANAGING PROJECT STATUS MEETINGS
To keep close track of progress on the project, the project manager needs to have information from his or her
team on a timely basis. This information will be given during a project status meeting. At a minimum, you
need to have a status meeting at least once a week. On some of the major projects on which we’ve worked,
daily status meetings were the norm for the first few weeks, and then as the need for daily information wasn’t
as critical, we switched to twice a week and finally to weekly status.
What is their Format?
While the format of the status review meetings should be flexible, as project needs dictate, certain items are part
of every status meeting. We recommend that you proceed in a top-down fashion:
1. The project champion reports any changes that may have a bearing on the future of the project.
2. The customer reports any changes that may have a bearing on the future of the project.
3. The project manager reports on the overall health of the project and the impact of earlier problems, changes,
and corrective actions as they impact at the project level.
4. Activity managers report on the health of activities open or scheduled open for work since the last status
meeting.
5. Activity managers of future activities report on any changes since the last meeting that might impact project
status.

109
6. The project manager reviews the status of open problems from the last status meeting.
7. Attendees identify new problems and assign responsibility for their resolution (the only discussion allowed
here is for clarification purposes).
8. The project champion, customer, or project manager, as appropriate, offers closing comments.
9. The project manager announces the time and place of the next meeting and adjourns the meeting. Minutes
are part of the formal project documentation and are taken at each meeting, circulated for comment, revised
as appropriate, distributed, and filed in the project notebook. Because there is little discussion, the minutes
contain any handouts from the meeting and list the items assigned for the next meeting. The minutes should
also contain the list of attendees a summary of comments made, and assigned responsibilities.
Problem Management Meetings
Problem management meetings provide an oversight function to identify, monitor, and resolve problems that
arise during the life of a project. This is an important function in the management of
REVIEW QUESTIONS
1. What are controls in project management?
2. What are the reasons to use reports in your project?
3. Write a short note on “balancing the control system.” 4. What are the characteristics of a reporting system?
5. Discuss the various types of project status reports.
6. What is the purpose of different colors of stickers in spotlight reports?
7. What are variance reports?
8. What should be the frequency of gathering and reporting project progress?
9. Differentiate between the positive and negative variances.
10. Why do we need Graphical Reporting Tools for reporting system?
11. How can WBS be used to report project status?

110
TOPIC 11
11. CRITICAL CHAIN PROJECT MANAGEMENT (CCPM)
___________________________________________________________________________________
LEARNING OUTCOMES
After studying this topic you should be able to:
• Explain the difference between the critical path and the critical chain
• Identify resource constraints and know how to resolve them
• Use the critical chain approach to project management for single projects
INTRODUCTION
In this chapter we will study about the Critical Chain Project Management (CCPM) which is method is planning
and managing a project that puts more emphasis on the resources required to execute project tasks
developed by Eliyahu M. Goldratt.
11.1 UNDERSTANDING PERT/CPM FOR PROJECTSCHEDULING AND MANAGEMENT
Basically, CPM (Critical Path Method) and PERT (Programme Evaluation Review Technique) are project
management techniques, which have been created out of the need of Western industrial and military
establishments to plan, schedule and control complex projects.
There are many variations of CPM/PERT which have been useful in planning costs, scheduling manpower and
machine time. CPM/PERT can answer the following important questions:
• How long will the entire project take to be completed? What are the risks involved?
• Which are the critical activities or tasks in the project which could delay the entire project if they were
not completed on time?
• Is the project on schedule, behind schedule or ahead of schedule?
• If the project has to be finished earlier than planned, what is the best way to do this at the least cost?
Framework for PERT and CPM
Essentially, there are six steps which are common to both the techniques. The procedure is listed below:
1. Define the Project and all of it’s significant activities or tasks. The Project (made up of several tasks) should
have only a single start activity and a single finish activity.
2. Develop the relationships among the activities. Decide which activities must precede and which must follow
others.
3. Draw the "Network" connecting all the activities. Each Activity should have unique event numbers. Dummy
arrows are used where required to avoid giving the same numbering to two activities.
4. Assign time and/or cost estimates to each activity
111
5. Compute the longest time path through the network. This is called the critical path.
6. Use the Network to help plan, schedule, monitor and control the project.
The Key Concept used by CPM/PERT is that a small set of activities, which make up the longest path through
the activity network control the entire project. If these "critical" activities could be identified and assigned to
responsible persons, management resources could be optimally used by concentrating on the few activities
which determine the fate of the entire project. Non-critical activities can be re-planned, rescheduled and
resources for them can be reallocated flexibly, without affecting the whole project.
Five useful questions to ask when preparing an activity network are:
• Is this a Start Activity?
• Is this a Finish Activity?
• What Activity Precedes this?
• What Activity Follows this?
• What Activity is Concurrent with this?
Some activities are serially linked. The second activity can begin only after the first activity is completed. In
certain cases, the activities are concurrent, because they are independent of each other and can start
simultaneously. This is especially the case in organisations which have supervisory resources so that work can
be delegated to various departments which will be responsible for the activities and their completion as
planned. When work is delegated like this, the need for constant feedback and co-ordination becomes an
important senior management pre-occupation.
Drawing the CPM/PERT Network
Each activity (or sub-project) in a PERT/CPM Network (see figure 11.1) is represented by an arrow symbol. Each
activity is preceded and succeeded by an event, represented as a circle and numbered.

112
Figure 11.1: CPM Network
At Event 3, we have to evaluate two predecessor activities - Activity 1-3 and Activity 2-3, both of which are
predecessor activities. Activity 1-3 gives us an Earliest Start of 3 weeks at Event 3. However, Activity 2-3 also
has to be completed before Event 3 can begin. Along this route, the Earliest Start would be 4+0=4. The rule is
to take the longer (bigger) of the two Earliest Starts. So the Earliest Start at event 3 is 4.
Similarly, at Event 4, we find we have to evaluate two predecessor activities - Activity 2-4 and Activity 3-4. Along
Activity 2-4, the Earliest Start at Event 4 would be 10 wks, but along Activity 3-4, the Earliest Start at
Event 4 would be 11 wks. Since 11 wks is larger than 10 wks, we select it as the Earliest Start at Event 4.We has
now found the longest path through the network. It will take 11 weeks along activities 1-2, 2-3 and 3-4. This is
the Critical Path.
1 1 . 2 C C P M V S T R A D I T I O N A L P R O J E C T M A N A G E M E N T
CCPM puts more emphasis on the resources required to execute project tasks in contrast to the more
traditional Critical Path and PERT methods, which emphasize task order and rigid scheduling. Secondly, using
the Critical Chain Method, projects can be completed more quickly and with greater scheduling reliability. The
difference between traditional and Critical Chain scheduling is in how uncertainty is managed. In traditional
project scheduling, uncertainty is managed by padding task durations, starting work as early as possible,
multitasking, and focusing on meeting commitment dates. The following points illustrate some of the
problems associated with traditional project scheduling:
• Padding task durations (providing worst-case estimates) is done to ensure a high probability of task
completion. The knowledge that there is so much safety time built into tasks results in various time
wasting practices, e.g., waiting until the last moment to complete a task. As a result, all the safety time
can be wasted at the start of the task so that, if problems are encountered, the task over-runs.

113
• Starting work as early as possible, even when not scheduled, is a response to worstcase estimates.
When workers give worst-case estimates, they don’t expect to stay busy with just one task – so they
multi-task, working on several tasks at once by switching between them. The result is that everything
takes a long time to complete and very little completes early.
• With the focus on meeting commitment dates (start and finish), output from a task completed early
will rarely be accepted early by the next person needing this output. So, any effort spent in finishing
early will be wasted.
Given the above issues, the most projects are always late. In critical
chain scheduling, uncertainty is primarily managed by: a) using average
task duration estimates
b) scheduling backwards from the date a project is needed (to ensure work that needs to be done is done,
and it is done only when needed)
c) placing aggregate buffers in the project plan to protect the entire project and the key tasks and using
buffer management to control the plan. The key tasks are those on which the ultimate duration of the project
depends, also known as the Critical Chain.
Critical Chain approach is perhaps the most important new development in project scheduling in the last 30
years. Used properly, the Critical Chain approach is an extremely powerful means of gaining more
predictability, productivity and speed from your project plans. It has been found to be an effective tool to
protect projects from uncertainty.
11.3 CRITICAL CHAIN PROJECT MANAGEMENT APPROACH
The CCPM approach is identical to the TPM approach up to the point where the project network diagram is
defined and the critical path is identified. The traditional project manager would next conduct a resource
leveling exercise targeting resource usage on the critical path. At this point, the critical chain project manager
develops the critical chain plan. In the discussion that follows, we describe each of the CCPM planning steps
for you by way of a simple example. W e will use as an example the project shown in Figure 11.2.
Step 1: Creating the Early Schedule Project Network Diagram
Figure 12.2 shows the early schedule for a simple seven-task project same as TPM might make. Note that the
project duration is estimated at 16 days using the original task duration estimates, which include contingency
for each task. Figure 11.2 shows the critical path (C1-C2-C3) for a project manager using TPM, and it is the
starting point for resolving any resource contention problems.

114
Figure 11.2: The Early Schedule
Step 2: Converting the Early Schedule to the Late Schedule and Adding Resources
The first thing that a project manager using CCPM does is convert the task schedule to the late schedule. This
is shown in Figure 11.3. Note that this conversion removes the slack associated with the sequence defined by
tasks A1–A2 and B1–B2. In fact, it removes all of the free slack and total slack associated with any task or task
sequence in the project. Note also that the 50 percent duration estimates have replaced the original
estimates, which included contingency. In doing that, the project duration has been reduced from the original
16 days to 8 days. W e have also added the three resources (Amit, Mukesh, and Santa) to the tasks to which
they have been assigned. Note that there is a resource conflict with Mukesh on tasks A2 and B2. Also note
that the project duration reduces to eight days when the contingencies are removed.
Figure 11.3: The Late Schedule with Resource Assignments
Step 3: Resolving Resource Conflicts
In general, resource conflicts are removed by beginning with the task sequence that has the least slack. After
resolving that conflict, move to the task path that now has the least slack. Continue in this fashion until all
resource conflicts have been resolved. In our example, the critical chain (C1-C2-C3) does not have any resource
conflicts. The next task path to consider is A1-A2. In this case, Mukesh would be scheduled to work on A2, and
that means pushing his work on B 1 to an earlier date. This resolution is illustrated in Figure 11.4.

115
Figure 11.4: One way to Resolve the Resource Conflict
The other way to resolve the resource conflict is to have Ernie work on B2; then after Amit has completed A1,
Mukesh can work on A2. This resolution is illustrated in Figure 11.5. The second choice extends the duration
of the project.
Figure 11.5: Another way to Resolve the Resource Conflict
This simple example illustrates the major difference between TPM and CCPM. TPM uses the early schedule as
the base for all management decisions. CCPM uses the late schedule. TPM focuses only on the critical path
and manages in accordance with that. CCPM focuses on the paths with resource constraints and manages in
accordance with the best use of the resources. It does so by using the critical path but only to identify the
chains with the least slack and prioritizes resource use based on the minimum slack paths. To protect the
scarce resources, CCPM uses the concept of buffers.
Defining Buffers
Bufers are segments of time that are placed at the end of a sequence of tasks for the purpose of protecting
the schedule of those tasks. Buffers can also be used to protect cost, much like a contingency for unexpected
expenses in a budget. The size of time buffers is based on the total duration of the sequence of tasks to
which they are attached. The size of the buffer is determined by calculating the total of the contingencies in
the tasks that make up the sequence.
116
Types of Buffers
The three main types of buffers are as follows:
• Project buffers
• Feeding buffers
• Resource buffers
Project Buffers
The project buffer is a time buffer placed at the end of the critical chain to protect the overall project
schedule. Its size can be calculated as the square root of the sum of the squared differences between the
original task duration estimate and the reduced task duration estimate.
Feeding Buffers
The feeding buffer is a time buffer placed at the end of a sequence of tasks that lead into the critical chain.
Its size is calculated the same way as the project buffer size.
Resource Buffers
The resource buffer is different than the previous buffers. First, it is not a time buffer. It is a flag, usually
placed on the critical chain to alert a resource that it is needed. The flag can be placed at intervals such as
one week before the resource is needed, three days before the resource is needed, or one day before the
resource is needed. Because it does not contain any time interval, it does not affect the project scheduled
completion date. It serves merely to protect the critical chain.
Using Buffers
Let’s return to the example project in Figure 11.4. So far, the project can be completed at the end of the eighth
day. Resolving the resource conflict with Mukesh did not add any duration to the project. First, we put a
project buffer after C3, the final task in this project. Its size is the square root of the square of the contingencies
in tasks C1, C2, and C3 (or the square root of 9 + 9 + 4), which is approximately 4.7 days. Next, we add feeding
buffers at the end of the sequences A1-A2 and B1-B2. The calculated buffer sizes are 3.6 days for A1-A2 and
2.8 days for B1-B2. Incorporating these buffers into Figure 11.4 results in Figure 11.6.

117
Figure 11.6: Project Schedule with Buffers Added
Note that the CCPM approach gives us a project duration (including contingency buffers) of 13.7 days,
compared to the TPM approach of 16 days. In other words, extracting the contingency from each task,
collecting it at the end of the task sequences, and managing it has saved us an average of 2.3 days out of a 1
6-day schedule. That’s about a 14 percent schedule improvement.
Managing Buffers
The TPM will see the buffer as nothing more than management reserve. The only real similarity between a
management reserve and a buffer may be in how they are managed. Managing management reserve and
managing buffers can follow very similar logic. The three decision trigger levels in buffer management are as
follows:
• When the sequence of tasks schedule slips and penetrates into the first third of the buffer.
• When the sequence of tasks schedule slips and penetrates into the middle third of the buffer.
• When the sequence of tasks schedule slips and penetrates into the final third of the buffer.
Let’s take a closer look at each of these trigger points and the appropriate action that the CCPM project manager
should take.
Penetration into the First Third of the Buffer
Unlike the project manager using TPM who chases every slippage on the critical path or change in the critical
path, the project manager using CCPM is looking at the performance of a sequence and is less likely to act in
haste. Penetration into the first third of the buffer means that the cumulative slippage in the sequence is less
than one third of the buffer. In this case, the CCPM project manager will not take any action.

118
Penetration into the Middle Third of the Buffer
Penetration into the middle third of the buffer does call for some action on the part of the CCPM project
manager. In this case, the correct action is to investigate the cause of the slippage and put a get-well plan in
place. The earlier in the sequence this occurs, the more serious the problem.
Penetration into the Final Third of the Buffer
Penetration into the final third of the buffer is serious regardless of when in the sequence it occurs. Obviously,
if it is in the first third of the duration of the sequence, it is very serious. If it occurs late in the final third, there
may be little that can be done. In any case, action is called for.
REVIEW QUESTIONS 1.
What is CCPM?
2. Compare CCPM with TPM.
3. What are the problems associated with traditional project scheduling?
4. How uncertainty is managed by Critical Chain approach?
5. How CCPM approach is identical to TPM?
6. Define buffers and explain their types.

119
TOPIC 12
___________________________________________________________________________________
12. PROJECT CLOSURE
___________________________________________________________________________________
_ LEARNING OUTCOMES
After studying this topic you should be able to:
• Understand the steps needed to effectively close a project
• Develop a closing strategy
• Identify the components of project documentation
• Conduct a post-implementation audit
• Explain the significance of each post-implementation audit question
INTRODUCTION
Closing out the projects is the last phase of the traditional project management life cycle. In this lesson, we are
going to learn that how to close the projects.
12.1 STEPS IN CLOSING A PROJECT
Closing the project is routine once we have the customer’s approval of the deliverables.
There are six steps to closing the project:
1. Getting client acceptance of deliverables
2. Ensuring that all deliverables are installed
3. Ensuring that the documentation is in place
4. Getting client sign-off on final report 5. Conducting the post-implementation audit
6. Celebrating the success
Getting Client Acceptance
The client decides when the project is done. It is the job of the project manager to demonstrate that the
deliverables (whether product or service) meet client specifications. The client’s acceptance may be informal
or formal that involves testing against the client’s specifications.
Informal Acceptance
It is also known as ceremonial acceptance. It does not have an accompanying sign-off of completion. Two
situations fall under the heading of informal acceptance:
• The first involves deadline dates at which the client must accept the project as complete, whether or not
it meets specification.
• The second involves a project deliverable requiring little or no checking to see if specifications have been
met.

120
12.2 FORMAL ACCEPTANCE
In formal acceptance the client has written acceptance procedure. This acceptance procedure requires that
the project team demonstrate compliance with every feature in the client’s performance specification. A
checklist is used and requires a feature-by feature sign-off based on performance tests. These tests are
conducted jointly and administered by the client and appropriate members of the project team.
Installing Project Deliverables
Project deliverables may be hardware or software. The installation can involve phases, cutovers, or some
other rollout strategy. In other cases, it involves nothing more than flipping a switch. This installation triggers
the beginning of a number of close-out activities that mostly relate to documentation and report preparation.
Documenting the Project
There are at least five reasons for documentation:
1. Reference for future changes in deliverables: The documentation of the project just completed is the
foundation for the follow-up projects. By using the deliverables, the customer will identify improvement
opportunities, features to be added, and functions to be modified.
2. Historical record for estimating duration and cost on future projects, activities, and tasks: Estimated and
actual duration and cost for each activity on completed projects are particularly valuable for estimating
these variables on future projects.
3. Training resource for new project managers: The documentation may be used as training resources for
new project managers. The items such as how the WBS architecture was determined, how change
requests were analyzed and decisions reached, problem identification, analysis and resolution situations,
and a variety of other experiences are invaluable lessons for the newly appointed project manager.
4. Input for further training and development of the project team: As a reference, project documentation
can help the project team deal with situations that arise in the current project. How a similar problem or
change request was handled in the past is an excellent example.
5. Input for performance evaluation by the functional managers of the project team members: In many
organizations, project documentation can be used as input to the performance evaluations of the project
manager and team members.
The documentation for a given project should include the following parts:
• Project Overview Statement
• Project proposal and backup data
• Original and revised project schedules
• Minutes of all project team meetings

121
• Copies of all status reports
• Design documents
• Copies of all change notices
• Copies of all written communications
• Outstanding issues reports
• Final report
• Sample deliverables (if appropriate)
• Client acceptance documents
• Post-implementation audit report
For a given project, the project manager has to determine what documentation is appropriate. Always refer
back to value-added considerations. If the document has value, and many will have good value for future
projects, then include it in the documentation.
12.3 POST-IMPLEMENTATION AUDIT
The post-implementation audit is an evaluation of:
• the project’s goals and activity achievement as measured against the project plan; • budget; •
time deadlines;
• quality of deliverables; specifications; and client satisfaction.
The log of the project activities serves as baseline data for this audit. There are six important questions to be
answered:
1. Was the project goal achieved?
a) Does it do what the project team said it would do?
b) Does it do what the client said it would do?
2. Was the project work done on time, within budget, and according to specification?
3. Was the client satisfied with the project results?
4. Was business value realized? (Check success criteria.)
5. What lessons were learned about your project management methodology?
6. What worked? What didn’t?
The answers to these questions are helpful hints and suggestions for future project managers and teams.
12.4 FINAL REPORT
The final project report acts as the history of the project. It is the file that others can check to study the progress
and impediments of the project. It has the following contents:

122
• Overall success of the project
• Organization of the project
• Techniques used to get results
• Project strengths and weaknesses
• Project team recommendations
Throughout the life of the project, there will have been a number of insights and suggestions. This is the place to
record them for posterity.
Celebrating Success
There must be some recognition for the project team at the end of the project. Celebrating success may be either
formal or informal. In formal celebration team members may be
REVIEW QUESTIONS
1. List down the steps to closing the project.
2. What is the difference between the informal acceptance and the formal acceptance to close down the project?
3. Write down the two situations fall under the heading of informal acceptance.
4. What do you mean by “Installing Project Deliverables”?
5. What are the reasons to document the closing project?
6. Name at least five parts of the documentation for a given project in the documentation.
7. What is the purpose of Post-Implementation Audit?
8. What are the contents of the final report of a closing project?
9. Why is it important to celebrate the success of the project?