faculty/student perceptions of technology - ncolr. · pdf filefaculty and student perceptions...
TRANSCRIPT

The Journal of Interactive Online Learning Volume 1, Number 2, Fall 2002 www.ncolr.org ISSN: 1541-4914
Faculty and Student Perceptions of Technology Integration in Teaching
John R. Savery University of Akron
Introduction
This study examines the perceptions of faculty and students on the topic of technology
integration in the teaching of courses at a Midwestern College of Education. Examining the perceptions of a target audience is a widely used strategy based on the premise that perceptions matter and often influence behaviors. This approach has been used to study faculty perceptions of distance education (Belcheir & Cucek, 2002), and also student perceptions of online learning (O’Malley & McCraw, 1999). Cope and Ward (2002) used a phenomenological research approach to examine the importance of high school teacher perceptions on the integration of learning technology in the classroom and concluded that “teacher perceptions of learning technologies are likely to be key factors in the successful integration of learning technologies” (p. 72). They further noted that successful integration is more likely to occur when “teachers perceive learning technologies as part of a student-centred/conceptual change teaching approach” (p. 72).
The majority of North American colleges and universities practice some form of course and instructor evaluation as a form of quality control in the education process. The criteria included in the evaluation forms will vary by institution but, given that student evaluations of teaching are frequently included in the determination of retention and promotion, they can exert an influence on the behavior of teachers. At the University of Western Australia, student perceptions of teaching are regularly collected through customized surveys and the information is valued as a key component in academic staff development (University of Western Australia). It is not uncommon for university students to share their perceptions of a particular professor or course and based on those perceptions decide to take the course or avoid it if possible. Opinions based on gossip (i.e. un-reflected) can have a visible impact on enrollment.
In a study of teaching in multiple cultures Pratt (1992), notes “conceptions of teaching are, like other conceptions, anchored in cultural, social, historical, and personal realms of meaning. To ‘teach’ means different things depending upon one’s values, beliefs, and intentions” (p. 203). While recognizing the challenges associated with a variety of conceptions of teaching, this particular study takes a more narrow focus in attempting to identify the perceptions by faculty and students in a single college of education of the uses of technology in support of teaching and the impact of those perceptions on the behaviors of both faculty and students.
Methods The College was preparing for an accreditation visit in October 2002, by the National
Council for Accreditation of Teacher Education (NCATE). This organization provides standards for teacher preparation and within those standards is a specific objective: “to prepare candidates
11

[teachers] who can integrate technology into instruction to enhance student learning” (NCATE, 2002, p. 4). NCATE standards also “expect teacher educators to model effective teaching. The traditional lecture alone is inadequate. Teacher educators must use strategies that they expect their candidates to use. Why? Teachers teach as they are taught. Teacher educators should model expert teaching” (Wise, n.d., ¶ 7). Thus, information was needed by the new Dean of the College, and by the author, the new chair of the College Technology Committee, on the extent to which technology was being integrated into teaching to establish a benchmark for accreditation purposes and a baseline for the strategic planning process.
Members of the Technology Committee consisting of two representatives from each of the four college departments contributed to the design and revisions of a survey instrument and a series of interview questions to be administered to all full-time faculty in the College of Education (see Appendix A). Prior experience indicated that impersonal surveys would not generate a significant response rate, so each member of the Technology Committee personally delivered the survey to members in their department and provided a follow-up interview to clarify responses and gather further insights into the faculty member’s thoughts and feelings concerning their use of technology in teaching.
A one-page double-sided student survey was developed with questions that paralleled the faculty survey (see Appendix B). Surveys were completely anonymous and not identified with a particular instructor or course. Approximately 4,000 copies of the technology survey were distributed with the standard course evaluation forms to students enrolled in College of Education courses in the spring semester of 2001. Single credit courses taken at various times during the semester were not included for logistical reasons. Each department distributed and collected the course evaluation packets. The technology surveys were removed and placed in a separate box. Not all faculty members required students to complete the survey, and many students completed only one side of the survey. It is possible that a student taking multiple courses would complete the survey more than once. It was assumed that the student would respond to the survey questions as they related to the particular course. Graduate assistants1 entered the data on all returned surveys (n = 2,448) using a template prepared in SPSS. The author edited the data set to remove cases where three or fewer responses (15% of total) were provided. Descriptive statistics were run to detect and eliminate any data entry error. A total of 2,411 valid student surveys were used in this analysis.
Research Questions
The purpose of this study was to collect baseline data to identify the current extent of technology integration in teaching, to inform the strategic planning process, and for accreditation purposes. Thus, the research questions seek perceptions and opinion rather than criterion referenced data. The research questions focus on five areas: (1) faculty comfort levels and proficiency with technology, (2) faculty perceptions of the frequency with which they use technology for instruction, (3) student perceptions of the frequency with which specific technologies are used in the instruction they receive, (4) differences between faculty and student perceptions of technology use, and (5) student perceptions of the impact of technology on their learning.
22

Faculty Perspective 1. Faculty comfort levels and proficiency with technology.
Despite the effort by members of the Technology Committee to engage faculty colleagues in their departments in a discussion of technology and instruction, the survey response rate was only 58% (41/70). The margin for error is plus or minus 10. The survey asked faculty to report on their levels of proficiency and comfort with a list of specific technologies. Table 1 (below) summarizes the 41 responses scored as follows: a self-rating of N/A (never) = 0, Novice = 1, Competent = 2, and Proficient = 3. The list of technologies was then rank ordered based on faculty responses. Table 1
Faculty self-rating of comfort/proficiency with listed technologies Technology Never use Novice Competent Proficient
E-mail Application 0% 7.3% 34.1% 58.5% Word Processing (Word) 0 7.3 41.5 51.2 Internet Research 0 12.2 46.3 41.5 Library Research 0 17.1 46.3 36.6 Presentation (Power Point) 9.8 34.1 34.1 22.0 Library Electronic Reserve 12.2 34.1 34.1 19.5 Spreadsheet App. (Excel) 12.2 46.3 26.8 14.6 Database Application 14.6 51.2 19.5 14.6 Web page Authoring 17.1 58.5 7.3 17.1
Faculty rated themselves highly (competent to proficient) with E-mail, word processing, Internet research, and library research, which is consistent with the image of faculty as researcher and author. The reported comfort/proficiency level with other technologies was considerably lower. Comments collected in the interviews and open-ended questions suggest a need for training in the use of certain applications, and a recognition that some applications are simply not needed and therefore have not been learned or developed to any level of competence.
These survey results are similar to those at other institutions. Table 2 compares the results of two recent faculty surveys: (1) the 1998 UCLA Higher Education Research Institute (HERI) faculty survey of Stanford University, Johns Hopkins University, MIT, Carnegie-Mellon University, Cal Tech, and Virginia Tech; and (2) the 2001 survey of 119 faculty by the Center for Instruction and Research Technology (CIRT) at the University of North Florida. Although these institutions have a stronger research focus, they still provide a useful benchmark.
33

Table 2
Comparison of Technology Competency Survey Findings
Technologies Surveyed (1) HERI Survey
(1998) (2) CIRT Survey
(2001) (3) UA Faculty Survey (2001)
Level of Expertise Criteria/Rating Use 2-3
times/week + Comfortable Competent to
Proficient Using E-mail 97% Not asked 92% Word processor (e.g. Word) 92% Not asked 92% Internet research in my discipline 47% 78% 88% Databases (e.g. Access) Not asked 27% 41% Spreadsheets (e.g. Excel) Not asked 55% 41% Presentations (e.g. PowerPoint) 45% 63% 56% Course mgmt tool (e.g.WebCT) Not asked 32% 7% Building personal Web pages Not asked 39% 24%
2. Faculty perceptions of the frequency with which they use technology for instruction.
Faculty were asked how frequently per semester they perceived themselves using the listed technologies for instructional purposes. Table 3 summarizes the responses. The self-rating categories were scored as never (0), five times or less (1), from six to nine times (2), and ten or more times (3). The list of technologies has been rank ordered based on the percentage of responses above and below the five times per semester level. Table 3
Frequency of Use of Instructional Technologies by Faculty
Instructional Technologies Used five times or more
per semester Used less than five times
per semester E-mail for instruction 90.2% 9.8% Chalkboard 75.6 24.4 Overhead projector 70.7 29.3 Video player (VCR) 48.8 51.2 Online forum 39.0 61.0 Ceiling (computer) projector 26.8 73.2 Whiteboard 24.4 75.6 Video Camera 24.4 75.6 Teach in Computer Lab 22.0 78.0 Digital Camera 19.5 80.5 SmartBoard 17.1 82.9 Audio player 12.2 87.8 Instructor authored Web site 9.8 90.2 WebCT (course mgmt) 7.3 92.7
From a faculty perspective, the most frequently used technologies for instruction were E-mail correspondence (90%), writing on a chalkboard (70%), using slides with an overhead
44

projector (70%), and showing a video (45%). The least frequently used technology was the WebCT course management application. The raw data indicates that 35 faculty never used this technology, three faculty members used it less than five times per semester and only three faculty members used it more than five times per semester. The SmartBoard technology is a unique case since the equipment is scarce (there are only three available) and relatively few faculty have access to the rooms where the SmartBoards are located. However, six faculty stated they used this technology frequently (more than ten times) during the semester. The chart in Figure 1 represents the numeric data in Table 3 in a graphical format.
0 20 40 60 80 100
Frequency of Use Per Semester
E-mail for instructionChalkboard
Overhead projectorVideo player (VCR)
On-line forumCeiling (computer) projector
WhiteboardVideo Camera
Teach in Computer LabDigital Camera
SmartBoardAudio player
Instructor authored web siteWebCT (on-line course mgmt)
Spec
ific
Tech
nolo
gies
Frequency of Use of Specific Technologies for Instruction by Faculty
LessThan 5 Times/SemesterMore Than 5 Times/Semester
Figure 1. Faculty perceptions of the frequency of use of instructional technologies.
Faculty were also asked to indicate how frequently they required students to use technology as part of an assignment. The 13 faculty responding five times or less per semester accounted for 39% of the total, while 25 faculty or 61% of the total required their students to use technology five times or more per semester. Student Perspective 3. Student perceptions of how frequently specific technologies were used in the instruction they received.
Student responses were anonymous and not linked to specific courses or instructors (see Appendix B for Student Survey). A total of 2,411 surveys were analyzed. Table 4 summarizes the data as the percentage of responses above or below the frequency level of five times per semester. The technologies on the list were then rank ordered to indicate the most frequently used.
55

Table 4 Student Perceptions of Frequency of Use of Instructional Technologies
Frequency of Use of Technologies for Instruction
More than Five times per semester
Less than Five times per semester
Chalkboard 61.3 38.7 Overhead projector 55.6 44.4 E-mail for instruction 38.9 61.1 Video player (VCR) 35.3 64.7 Ceiling (computer) projector 27.3 72.7 Instructor authored Web site 22.7 77.3 Teach in Computer Lab 15.7 84.3 Whiteboard 11.5 88.5 Online forum 10.9 89.1 Audio player 7.6 92.4 WebCT (course mgmt) 7.5 92.5 SmartBoard 6.4 93.6 Video Camera 4.2 95.8 Digital Camera 3.9 96.1
Figure 2 depicts the frequency with which students perceive the use of a specific
technology by their teachers. For example, concerning the frequency of use of the chalkboard, 60% of students perceive that this technology is used five times or more per semester. Similarly, 96.1% of students report that a digital camera was used less than five times per semester. Based on this data, students report that the technologies used in their instruction consisted of writing on a chalkboard (60%), viewing slides on an overhead projector (55%), E-mail correspondence (38%), and watching a video (35%).
Students were asked if they were required to use technology to complete assignments. Of the 1,889 valid responses to this question, 74% said yes and 26% said no.
0 10 20 30 40 50 60 70 80 90 100
Frequency of Use
Chalkboard
Overhead projector
E-mail for instruction
Video player (VCR)
Ceiling (computer) projector
Instructor authored web site
Teach in Computer Lab
Whiteboard
On-line forum
Audio player
WebCT (on-line course mgmt)
SmartBoard
Video Camera
Digital Camera
Spec
ific
Tech
nolo
gies
Frequency of Use of Technologies for Instruction
More than Five times per semester
Less than Five times per semester
Figure 2. Student perceptions of the frequency of use of instructional technologies.
66

4. Differences between faculty and student perceptions of technology use.
Table 5 combines faculty and students responses regarding frequently of use of each of the available technologies. Data is aligned in two columns to juxtapose faculty and student perceptions on the same technologies and the same frequency classification. Table 5
Faculty and Student Perceptions of the Frequency of Use of Technologies
Less than Five times
per semester More than Five times
per semester %
Difference Technologies Used for Instruction
Faculty Perceptions
Student Perceptions
Faculty Perceptions
Student Perceptions
Major Differences 51.3 E-mail for instruction 9.8 61.1 90.2 38.9 28.1 Online forum 61.0 89.1 39.0 10.9 20.2 Video Camera 75.6 95.8 24.4 4.2
Moderate Differences 15.6 Digital Camera 80.5 96.1 19.5 3.9 15.1 Overhead projector 29.3 44.4 70.7 55.6 14.3 Chalkboard 24.4 38.7 75.6 61.3 13.5 Video player (VCR) 51.2 64.7 48.8 35.3 12.9 Instructor authored Web site 90.2 77.3 9.8 22.7 12.9 Whiteboard 75.6 88.5 24.4 11.5 10.7 SmartBoard 82.9 93.6 17.1 6.4
Minor Differences 6.3 Teach in Computer Lab 78.0 84.3 22.0 15.7 4.6 Audio player 87.8 92.4 12.2 7.6 0.5 Ceiling (computer) projector 73.2 72.7 26.8 27.3 0.2 WebCT (course mgmt) 92.7 92.5 7.3 7.5
Faculty and students shared very similar perceptions (0.2-6.3% difference) on the frequency of teaching in a computer lab, use of audio players, use of ceiling mounted (computer) projection systems, and the WebCT course management application. There is a larger gap in the perceptions (10-15% difference) of the frequency of use of technologies ranging from a SmartBoard to a digital camera. There is a very large difference in perception (20-51% difference) with respect to the frequency of use of E-mail for instruction, the use of the online discussion forum and the use of a video camera.
While 90.2% of faculty indicated that they used email for instruction five or more times per semester, only 38.9% of students shared this perception. As a faculty member who has used both technologies for instruction, I believe the difference in perception is accurate and can be explained fairly simply. A student receives one email message from the instructor and sends one reply. The instructor sends one email message to 20 or more students and receives multiple responses often requiring additional email messages. Thus, the student sees a single email event and the faculty member sees multiple email events. A similar pattern is followed using the online
77

discussion forum (Kirkley, Savery, & Grabner-Hagen, 1998; Savery, 1999) where the instructor is involved in several different discussions over a semester, while a student may make only the “required” three postings.
The differences in perception concerning the use of the video camera for instruction may also be related to the different roles. Typically in a college of education, pre-service teachers practice delivering a lesson (micro teaching) to their peers and this rehearsal is videotaped for analysis and critique. Thus, the student would perceive a single use of the video camera – their lesson. The instructor (who needs to arrange for the use of the equipment) would perceive multiple uses of the video camera by multiple students over several class sessions.
Figure 3 graphically represents the similarities and differences in the “more than fives times per semester” data. The overall faculty perception (darker bar) is that they are using technology much more frequently than students (lighter bar) seem to perceive.
A notable exception is the student perception that they are using an instructor authored Web site to access instructional materials much more frequently than instructors state they are using this technology. There is insufficient data to support a particular hypothesis at this time, but it is possible that students are naively identifying all Web-based materials as something their instructor created.
0 10 20 30 40 50 60 70 80 90 100
Used More than Five times per semester
WebCT (course mgmt)
Instructor authored web site
Audio player
SmartBoard
Digital Camera
Teach in Computer Lab
Whiteboard
Video Camera
Ceiling (computer) projector
On-line forum
Video player (VCR)
Overhead projector
Chalkboard
E-mail for instruction
Tech
nolo
gies
Faculty and Student Perceptions of Frequency of Use
Student PerceptionsFaculty Perceptions
Figure 3. Differences in faculty and student perceptions of frequency of use.
88

5. Student perceptions of the impact of technology on their learning.
Students were asked to respond to the three positively worded statements shown below using a 4-point scale (0-strongly disagree, 1-disagree, 2-agree, 3-strongly agree). 1. Overall, the use of technology in this course enhanced my learning experience. 2. Overall, my instructor successfully modeled the use of technology in this course. 3. As a result of this course, I am better prepared to integrate technology into my own teaching.
The responses to each question are displayed in Figure 4. The mean scores for each question were almost identical—for question 1, enhanced learning, the mean was 1.63; question 2, modeled by instructor, was 1.60; and question 2, better prepared to use, the mean equaled 1.50. Expressed as a percent of responses, the positive responses (Agree and Strongly Agree) were slightly more frequent (59%, 58%, and 52%, respectively) than the negative (Disagree and Strongly Disagree) responses (41%, 42%, and 48%, respectively).
Overall, student perceptions of the ability of their instructors to prepare them to use technology effectively in their teaching through modeling and using technology was only slightly positive.
0
100
200
300
400
500
600
700
800
Raw
num
ber o
f Res
pons
es
Strongly Disagree Disagree Agree Strongly AgreeResponse Options
Student Perceptions of Impact of Technology on Instruction
1. Enhance My Learning (n=1855)2. Modeled by Instructor (n=1811)3. Better Prepared to Use (n=1792)
Figure 4. Student responses to Impact of Technology questions.
Summary
Recall that the purpose of this study was to collect baseline data to identify the current extent of technology integration in teaching to inform the strategic planning process, and for accreditation purposes. The faculty responses indicated a high level of comfort with the “tools of the trade” used by academics (E-mail, word processing, Internet research, and library research). At the time of this study, faculty reported that the technologies they most frequently used for
99

instruction were E-mail correspondence (90%), writing on a chalkboard (70%), using slides with an overhead projector (70%), and showing a video (45%).
Student survey responses generally concur with the faculty perception that the technology used in classroom instruction most frequently involved chalkboards (61%), overheads (55%), and videos (35%). There is a large gap between faculty and student perceptions of the frequency of use of email for instruction. Faculty reported using email for instruction five times or more per semester (90%), but only 39% of students report a similar frequency.
The accreditation agency believes strongly that students who become teachers will most frequently teach the same way as they were taught. Therefore, it is important for teacher preparation institutions to provide pre-service teachers with many models of instruction, including the effective use of instructional technologies, to increase their instructional repertoire. Student responses to the three questions that directly addressed their perceptions of how technology was used in instruction were positive, but not resoundingly so. There is room for improvement in this area.
While this initial study collected data on the frequency with which specific technologies were being used, it did not address important aspects of technology integration such as, the appropriateness of the technology for achieving instructional goals, levels of interaction, availability of resources and support for students and faculty. Future studies will need to narrow the focus to specific programs, expand the scope of the research to include a range of instructional strategies, and develop better survey questions to determine exactly how technology is being integrated into the teaching and learning experience.
Since this study was initiated, the technology landscape has changed dramatically. Over 80% of the faculty in the college have received wireless laptop computers and are busy adapting their instruction to build on this new capability for information presentation and teacher/student interactions.
Note 1 The efforts of Mr. Murray Hooten III, Ms. Tina Miller, Ms. Lindsey Rardin, and Ms. Arati Thomas are greatly appreciated.
1010

References Belcheir, M. J., & Cucek, M. (2002). Faculty perceptions of teaching distance education
courses. Research Report 2002. (Boise State University Institutional Assessment Report 2002-02). Retrieved September 9, 2002, from http://www2.boisestate.edu/iassess/ Reports/RR%202002-02.htm
Cope, C., & Ward, P. (2002). Integrating learning technology into classrooms: The importance of teachers’ perceptions. Educational Technology & Society 5(1) 67-74.
Georgia Institute of Technology, Office of Assessment. (1999, August). 1998 Higher Education Research Institute Faculty Survey Results. Retrieved September 9, 2002, from http://www.assessment.gatech.edu/HERI%20Rpt/HERI-1Contents.htm
Kirkley, E., Savery, J. R., & Grabner-Hagen, M. M. (1998). Electronic teaching: Extending classroom dialogue and assistance through e-mail communication. In C. J. Bonk & K. S. King (Eds.), Electronic collaborators: Learner-centered technologies for literacy, apprenticeship, and discourse (pp. 209-232). Mahwah, NJ: Erlbaum.
National Council for Accreditation of Teacher Education. (2002a). Professional standards for the accreditation of schools, colleges, and departments of education. Washington, DC: Author.
O’Malley, J., & McCraw, H. (1999, Winter). Students’ perceptions of distance learning, online learning, and the traditional classroom. Online Journal of Distance Learning Administration, 2(4). Retrieved September 9, 2002, from www.westga.edu/~distance/ omalley24.html
Pratt, D. D. (1992). Conceptions of teaching. Adult Education Quarterly, 42(4) 203-220. Savery, J. R. (1999, June). Assisting university student performance with HyperNews. Paper
presented at ED-MEDIA 99, Seattle, WA. University of North Florida, Center for Instruction and Research Technology. (2001). 2001
faculty technology survey. Retrieved September 9, 2002, from http://www.unf.edu/ dept/cirt/survey.html
University of Western Australia, Evaluation of Teaching Unit. (2001, March). Policy statement: Student Perceptions of Teaching (SPOT). Retrieved September 9, 2002, from http://www.csd.uwa.edu.au/spot/spotpolicy.html
Wise, A. E. (n.d.). Performance-based accreditation: Reform in action. Retrieved September 9, 2002, from the National Council for Accreditation of Teacher Education Web site: http://www.ncate.org/newsbrfs/reforminaction.htm
1111

Appendix A
Faculty Survey Instrument and Interview Questions Preamble: The purpose of this interview/survey is to seek information to expand our understanding of the various ways in which technology is being integrated into instructional practices within the College of Education. This data will be included in the NCATE review. In general, we are seeking information in three broad areas.
1. Personal Use of Technology 2. Integration of Technology into Teaching 3. Suggestions for Technology Integration 4. What is needed?
Personal Use of Technology Please indicate your comfort level with each of these technologies. Scale is…as a user of this technology I consider myself to be a novice (know basics), competent (skilled), proficient (could teach others) or non-applicable.
Technology Novice Competent Proficient N/A E-mail
Word Processing Application Spreadsheet Application Presentation Application Database Application Library Research Library Electronic Reserve Internet Research Personal Web page Other (Specify)
Interviewer Notes:
1212
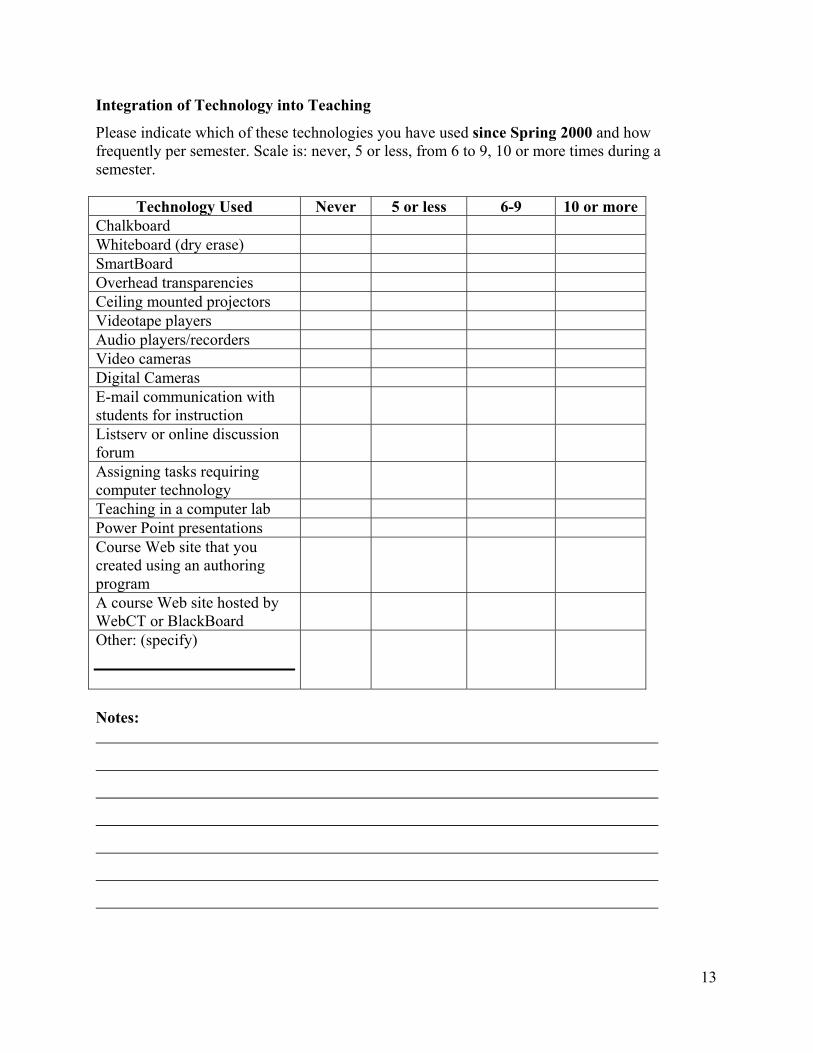
Integration of Technology into Teaching
Please indicate which of these technologies you have used since Spring 2000 and how frequently per semester. Scale is: never, 5 or less, from 6 to 9, 10 or more times during a semester.
Technology Used Never 5 or less 6-9 10 or more Chalkboard Whiteboard (dry erase) SmartBoard Overhead transparencies Ceiling mounted projectors Videotape players Audio players/recorders Video cameras Digital Cameras E-mail communication with students for instruction
Listserv or online discussion forum
Assigning tasks requiring computer technology
Teaching in a computer lab Power Point presentations Course Web site that you created using an authoring program
A course Web site hosted by WebCT or BlackBoard
Other: (specify)
Notes:
1313

Suggestions for Technology Integration
Please help us to understand how you would like to integrate technology into your instruction. Provide a brief anecdote to indicate when, where, how, and why you believe the use of specific instructional technologies will enhance teaching and learning.
What is needed? What kind of technologies or services do you want or need to facilitate your instructional practices and/or professional development?
1414

Appendix B Student Technology Integration Survey Each instructor in the College of Education attempts to model effective teaching in every course. The purpose of this survey is to understand how you perceive the use of technology in support of teaching and learning in this course. How many class sessions per week? one ___ two ___ three ___ What was the building and room number used for class sessions? ________________ Please indicate with a checkmark how frequently per semester the technologies listed below were used to support teaching and learning in this course.
Scale: Never used during semester Seldom used (less than 10% of class sessions)
Occasionally used (less than 50% of class sessions) Frequently used (more than 50% of class sessions)
Selected Instructional
Technologies Never Seldom Occasionally Frequently
Chalkboard Whiteboard (dry erase) SmartBoard Overhead transparency Videotape player Audio player (vinyl record, cassette tape, CD)
Audio recorder Video camera Digital camera Projected computer screen (Power Point show, Web pages, specific applications)
E-mail for instruction Online discussion forum Teaching in a computer lab Course specific Web site with online resources
Calculators or PDAs WebCT or BlackBoard Web site
Other: (please specify) _________________________
1515

1616
Continued on the other side of page Did course assignments require you to use technology? _____ YES _____ NO If YES, please provide a brief description of an assignment that required technology.
Overall, the use of technology in this course enhanced my learning experience.
Strongly Disagree ___ Disagree ___ Agree ___ Strongly Agree ____ Overall, my instructor successfully modeled the use of technology in this course.
Strongly Disagree ___ Disagree ___ Agree ___ Strongly Agree ____ As a result of this course, I am better prepared to integrate technology into my own teaching.
Strongly Disagree ___ Disagree ___ Agree ___ Strongly Agree ____ Additional Comments:
Thank you!