failed empirically movements: why the reh present-value
TRANSCRIPT

Received May 19, 2015 Published as Economics Discussion Paper May 29, 2015Revised August 3, 2015 Accepted August 6, 2015 Published August 18, 2015
© Author(s) 2015. Licensed under the Creative Commons License - Attribution 3.0
Vol. 9, 2015-24 | August 18, 2015 | http://dx.doi.org/10.5018/economics-ejournal.ja.2015-24
Knightian Uncertainty and Stock-PriceMovements: Why the REH Present-Value ModelFailed Empirically
Roman Frydman, Michael D. Goldberg, and Nicholas Mangee
AbstractMacroeconomic models that are based on either the rational expectations hypothesis (REH)or behavioral considerations share a core premise: All future market outcomes can becharacterized ex ante with a single overarching probability distribution. This paper assessesthe empirical relevance of this premise using a novel data set. The authors find that Knightianuncertainty, which cannot be reduced to a probability distribution, underpins outcomes in thestock market. This finding reveals the full implications of Robert Shiller’s ground-breakingrejection of the class of REH present-value models that rely on the consumption-basedspecification of the risk premium. The relevance of Knightian uncertainty is inconsistent withall REH models, regardless of how they specify the market’s risk premium. The authors’evidence is also inconsistent with bubble accounts of REH models’ empirical difficulties. Theyconsider a present-value model based on a New Rational Expectations Hypothesis, whichrecognizes the relevance of Knightian uncertainty in driving outcomes in real-world markets.Their novel data is supportive of the model’s implications that rational forecasting relies onboth fundamental and psychological factors.
(Published in Special Issue Radical Uncertainty and Its Implications for Economics)
JEL E44 G12 G14 B40Keywords Knightian uncertainty; structural change; fundamentals; psychology; present-value model; stock prices
AuthorsRoman Frydman, Department of Economics, New York University, New York, NY10012, USA, and INET Program on Imperfect Knowledge Economics (IKE), [email protected] D. Goldberg, Peter T. Paul College of Business and Economics, University of NewHampshire, Durham, NH 03824, USA, and INET Program on IKENicholas Mangee, Department of Economics, Armstrong State University, Savannah, GA31419, USA, and INET Program on IKE
Citation Roman Frydman, Michael D. Goldberg, and Nicholas Mangee (2015). Knightian Uncertainty andStock-Price Movements: Why the REH Present-Value Model Failed Empirically. Economics: The Open-Access,Open-Assessment E-Journal, 9 (2015-24): 1—50. http://dx.doi.org/10.5018/economics-ejournal.ja.2015-24
conomics: The Open-Access, Open-Assessment E-Journal
1 Introduction
In his classic book Risk, Uncertainty, and Profit, Frank Knight introduced a distinc-tion between measurable uncertainty, which he called “risk,” and “true uncertainty,”which cannot “by any method be reduced to an objective, quantitatively determinedprobability” (Knight, 1921, p. 321).
Over the last four decades, macroeconomists and finance theorists have devel-oped models that assume away Knightian uncertainty and represent the processunderpinning outcomes over an indefinite future with a single probability distribu-tion. A vast majority of these models rely on the rational expectations hypothesis(REH) to represent the forecast of the market (an aggregate of its participants).They do so by imposing consistency between this forecast and the probabilitydistribution of outcomes implied by the model (Muth, 1961). Lucas (1995, 2001)pointed out that once models that characterize outcomes with a probability distribu-tion are upheld as “the relevant economic theory,” REH represents how a rationalparticipant understands and forecasts market outcomes.
Many studies have found REH models inconsistent with time-series data,most notably in asset markets. But tests of an REH model always involve ajoint hypothesis: the process underpinning future outcomes can be represented exante with a probability distribution and market participants are rational and profit-seeking. Empirical rejection of the model could thus stem from either the model’sprobabilistic specification of outcomes or the presence of irrational participants inthe market.
Proponents of REH maintain the premise of market participants’ rationalityand continue to search for alternative probabilistic representations of outcomes.Indeed, the rejection of one REH model does not preclude the possibility thatanother, either existing or yet to be invented, might be able to account for time-series data. Although progress has been made, this search has not yet resolved themain long-standing empirical puzzles in financial economics.
The key question is whether the economics profession should continue todevote considerable resources and talent to searching for empirically relevant REHmodels. In answering this question, we build on Knight’s distinction between riskand “true uncertainty.” If uncertainty in markets cannot “be reduced to an objective,quantitatively determined probability,” economists should consider redirecting their
www.economics-ejournal.org 2

conomics: The Open-Access, Open-Assessment E-Journal
research to develop an alternative class of models that recognize the importance of“true,” or Knightian, uncertainty in real-world markets.1
In this paper, we provide evidence that Knightian uncertainty underpins out-comes in asset markets. We focus on the process driving stock prices.
For Knight, true uncertainty arises from “our imperfect knowledge of the future,the consequence of [unforeseeable] change, not change as such” (Knight, 1921,p. 198). There is ample evidence that the process driving outcomes undergoesquantitative structural change, especially in asset markets. The key question ishow to ascertain empirically whether this structural change is, at least in part,unforeseeable. Knight (1921, p. 231-232) provides the answer,
Business decisions. . . deal with situations which are far too unique. . . [to rely solely on] statistical tabulations. The conception of objec-tively measurable probability is simply inapplicable.
Here we examine whether historical events that are not exact repetitions ofsimilar events in the past are important in driving stock prices. Because of theiruniqueness, these events give rise to structural change that could not have beenforeseen with a probability distribution.
We provide evidence that a wide range of such historical events drives stock-price movements. Some large-impact events—for example, 9/11 or the inventionof breakthrough technologies—could not even have been imagined in advance.Moreover, stock prices are frequently moved by moderate-impact events that arealso to some extent unique, from announcements by central banks to quarterlycompany reports containing news about current developments and future plans.The quantitative impact of these events on the process underpinning stock prices
1 Our argument here is related to the distinction between “uncertainty outside and inside economicmodels” advanced by Hansen (2014) in his Nobel lecture. “Outside” uncertainty is inherent in aneconomist’s choice of his model’s specification. Uncertainty “inside economic models” refers tothe model’s representation of the uncertainty faced by market participants. Recent approaches toformalizing model uncertainty—for example, robustness (Hansen and Sargent, 2008) or ambiguity(Chen and Epstein, 2002)—represent this uncertainty in probabilistic terms. However, in his Nobellecture, Hansen recognizes that economists may have to move beyond probabilistic representationsof uncertainty.
www.economics-ejournal.org 3

conomics: The Open-Access, Open-Assessment E-Journal
depends on the extent of their novelty and the particular historical context in whichthey occur. Thus, ipso facto, the structural change that they trigger is unforeseeable.
Our evidence comes from Bloomberg News market wrap reports from January4, 1993, through December 31, 2009. Bloomberg journalists monitor the U.S. stockmarket throughout the day. They also speak in real time to market participantsabout the factors that they consider relevant and how these factors influence theirforecasts. At the end of each trading day, Bloomberg posts a wrap that summa-rizes the intraday news reports. Bloomberg’s real-time reporting about news andmarket developments gives us confidence that these wraps are far from ex postrationalization of a day’s stock-price movements.2
Mangee (2011) converts the information that comprises the wraps into a numer-ical data set according to a strict set of rules.3 This data set contains an extensiverecord of historical events as they occur and their impact on the market’s forecastsand stock prices. As such, Mangee’s data set provides direct evidence concerningthe relevance of Knightian uncertainty during the 17-year sample period. Notably,20% of the news that is reported by Bloomberg as driving daily stock-price move-ments involves historical events that are to some extent unique. We also providemuch other evidence that the price process undergoes structural change at timesand in ways that no one could have fully foreseen.
These findings pose a direct challenge to the core premise of existing macroe-conomics and finance theory. The empirical relevance of Knightian uncertaintyimplies that REH models’ ex ante probabilistic representations do not represent theprocess underpinning future outcomes.
To be sure, REH models are internally consistent. But their inconsistencywith how market outcomes actually unfold undercuts the widespread belief thatREH represents rational forecasting. Indeed, once we recognize that unforeseeablechange drives outcomes, REH’s presumption that participants ignore this changeimplies that they forego profit opportunities, and thus are irrational (Frydman andGoldberg, 2015).
It is unsurprising, therefore, that REH models have given rise to many long-standing anomalies, most notably in financial markets. One such anomaly is the
2 See Section 4 for a discussion and empirical evidence on this important issue.3 For a description of how Mangee constructs his data set, see Section 4 and Data Appendix A.
www.economics-ejournal.org 4

conomics: The Open-Access, Open-Assessment E-Journal
failure of the REH present-value model of stock prices, which relates these pricesto the market’s forecast of stocks’ fundamental value (the discounted value ofall future dividends). REH’s presumption that future dividends and the discountrate can be characterized with a probability distribution implies that—save fora mean-zero error term uncorrelated with available information—the market’sforecast equals the actual values of outcomes. If this were the case, stock priceswould be less volatile than their fundamental value.
In a ground-breaking paper, Shiller (1981) found the exact opposite: stockprices are more volatile than their ex post fundamental value. In computing thisvalue, Shiller used time-series data on dividends and interest rates. One of hismeasures of this value assumed that the risk premium is constant. He also used expost data on consumption and the REH consumption-based capital asset pricingmodel to account for the time-varying risk premium in measuring the fundamentalvalue.
Fama (2014) argues that Shiller’s “excess volatility” finding stems from themisspecification of the risk premium. However, more than three decades afterShiller published his paper, attempts to explain this “excess volatility” with anREH risk-premium model still encounter considerable difficulties.4
The empirical relevance of Knightian uncertainty explains why. As withdividends, interest rates, and stock prices, how the risk premium in a marketpopulated by rational participants unfolds over time cannot be represented with anREH model.
Shiller and other behavioral-finance economists did not relate the failure of theREH present-value model to the importance of Knightian uncertainty in the stockmarket. Instead, they followed their REH counterparts and retained the premisethat a probability distribution can be used to represent outcomes. Behavioral-finance theorists, therefore, continued to rely on REH as the way to represent howa rational, profit-seeking participant forecasts outcomes in terms of fundamentalfactors.
4 For an authoritative review of REH risk-premium models and their empirical difficulties, seeCampbell et al. (1997). The search for an empirically relevant REH risk-premium model continues.As John Cochrane put it in an interview for the New Yorker, “That’s the challenge. That’s what weall work on” (Cassidy, 2010, p. 3).
www.economics-ejournal.org 5

conomics: The Open-Access, Open-Assessment E-Journal
This belief led behavioral-finance economists to interpret the findings of excessvolatility as evidence that the market is dominated by individuals who are not “fullyrational” (Barberis and Thaler, 2003, p. 1056). Their “bubble” models suppose thatthese individuals’ forecasts—and thus stock prices—are driven by “psychologicalbiases” and momentum trading that are largely unrelated to fundamental factors.
This irrationality-based explanation of the REH present-value model’s em-pirical failure is, however, an artifact of behavioral-finance models’ reliance onprobabilistic representations of outcomes. Frydman and Goldberg’s (2015) NewRational Expectations Hypothesis (NREH) shows how the relevance of Knight-ian uncertainty accords psychological factors an important role in how a rational,profit-seeking participant forecasts outcomes in terms of fundamental factors.
NREH models are open to unforeseeable change, but only partly so. Theyimpose ex ante constraints on this change, for example, that it will be moderate forprotracted intervals.
Frydman and Goldberg (2015) rely on NREH to derive the present-valuemodel. Like REH, NREH represents the market’s forecasts of dividends and thediscount rate by imposing consistency between these forecasts and its partly openrepresentation of the process underpinning these outcomes.
This consistency implies that fundamental factors underpin stock prices. But,because an NREH model recognizes the relevance of Knightian uncertainty, itcan account for the diversity of ways in which a rational market participant mayforecast outcomes.5
A participant cannot rely solely on statistical analysis or other calculations toascertain which forecasting strategy he should use. Ultimately, a market participantis guided by the confidence that he has in choosing one strategy over others torelate available information on fundamental factors to future outcomes. Intuitionand emotions (such as optimism and fear) inevitably also play a role. Consequently,
5 This implication of Knightian uncertainty stands in sharp contrast to the premise that underpinsevery REH model. To be sure, there are many different REH models. However, in formulating anREH model, an economist presumes that the probability distribution implied by his particular modelprovides the only “objective” way to understand and forecast outcomes. As Sargent (2005, p. 566)acknowledged, “The fact is that [one] cannot talk about...differences [among people’s models] withinthe typical rational expectations model...All agents inside the model, the econometrician, and Godshare the same model.” See Frydman and Goldberg (2011) for further discussion and references.
www.economics-ejournal.org 6

conomics: The Open-Access, Open-Assessment E-Journal
we would expect that whenever market participants rely on psychological con-siderations in driving their forecasting, they relate these considerations to theirunderstanding of the influence of news about fundamental factors.
Bloomberg’s reports provide a particularly rich source of information about therole that market participants attach to psychological and fundamental factors indriving outcomes. Our analysis of Mangee’s data set reveals that, as the NREHpresent-value model predicts, fundamental factors are the main driver of stockprices. Psychological factors also play an important role in participants’ forecasting.But, in sharp contrast to the bubble models, these considerations are not unrelatedto fundamental factors. We find that psychological factors matter in ways that areconsistent with NREH: market participants rely on them almost entirely to helpthem interpret the impact of news concerning fundamental factors on future stockprices.
Direct evidence concerning factors driving market participants’ forecasts ofdividends and discount rates enables us to assess the empirical relevance of theNREH present-value model, regardless of the particular partly open specificationfor these outcomes chosen by an economist. Our approach requires neither aspecification of the time-varying risk premium nor an assumption that this premiumdoes not change over time.
Frydman and Goldberg (2015) show that recognizing Knightian uncertaintydoes not alter one of the main qualitative predictions of the present-value model:when news about fundamental factors raises (lowers) the market’s forecast ofdividends, or lowers (raises) its forecast of the discount rate, the market bidsstock prices up (down). We find that news about fundamental factors movesprices through the present-value model’s two main channels—the market’s forecastof dividends and its forecast of the discount rate—in ways that are remarkablyconsistent with the model’s predictions.
Taken as a whole, our findings point to the root cause of REH models’ empiricaldifficulties: no one can specify ex ante how outcomes will actually unfold withan overarching probability distribution. More important, our analysis points to away forward for economics that builds on the insights of both REH and behavioralapproaches. Accounting for the roles of fundamental and psychological factors inrational forecasting requires economists to recognize the relevance of Knightianuncertainty. Empirical support for an NREH present-value model holds promise
www.economics-ejournal.org 7

conomics: The Open-Access, Open-Assessment E-Journal
that opening models to unforeseeable change might enable economists to resolvelong-standing empirical puzzles without jettisoning market participants’ rationality.
The remainder of the paper is structured as follows. In Section 2, we considerboth the REH and NREH versions of the present-value model, and discuss howKnightian uncertainty leads to an additional term in the model. In Section 3,we consider Shiller’s (1981) volatility tests of the REH present-value model andargue that uncovering evidence of Knightian uncertainty rejects the entire classof REH models. In Section 4, we examine Mangee’s (2011) novel data set anddiscuss why the reporting on which it is based is not ex post rationalization ofstock-price movements. The remaining sections consider the qualitative predictionsimplied by both the REH and NREH versions of the present-value model. Section5 presents our empirical findings concerning the importance of both fundamentaland psychological factors in driving daily stock-price movements, whereas Section6 presents evidence of unforeseeable structural change and Knightian uncertainty.In Section 7, we use Mangee’s data set to assess the present-value model’s mainqualitative implications concerning how the market relies on news about fundamen-tal and psychological factors in forecasting dividends and interest rates. We alsopresent indirect evidence that news about fundamental and psychological factorsinfluence stock prices through its impact on the market’s risk premium. Section 8provides concluding remarks. A Data Appendix discusses Mangee’s (2011) dataand provides examples of his rule-based scoring of market wraps.
2 The Present-Value Model
The present-value model represents the price of stocks in terms of the market’sforecast of their fundamental value. Both REH and NREH versions of the modelrest on an equilibrium condition for the one-period return on stocks, wherebyprices at each point in time are equal to the market’s forecasts of the discountedvalue of the next period’s dividends and prices. Both versions also assume thatinternal consistency can be used to represent the market’s forecasts. However, REHand NREH models differ sharply in how they represent the process underpinningdividends, the discount rate, and prices.
www.economics-ejournal.org 8

conomics: The Open-Access, Open-Assessment E-Journal
A vast majority of existing REH macroeconomic and finance models are time-invariant. They characterize outcomes at each point in time with the same reduced-form relationship and probability distribution. Sometimes, REH theorists allow forstructural change in this process.6 However, because REH models constrain allfuture changes in the process underpinning dividends, the discount rate, and pricesto conform to an ex ante probabilistic rule, they in effect represent this processover an indefinite future with a single overarching probability distribution.
REH represents the market’s forecasts in terms of fundamental factors byimposing consistency between these forecasts and the distribution implied by aneconomist’s model. REH’s ex ante probabilistic characterization of the market’sforecasts, together with the assumption that market participants have access to thesame information, implies that the Law of Iterated Expectations (LIE) can be usedin deriving the present-value model from the equilibrium condition.
Like its REH counterpart, an NREH model specifies the set of quantitativestructures and constrains them to share certain qualitative features—for example,that the impact of a particular causal factor on outcomes will be positive at eachpoint in time. However, a partly open model does not constrain ex ante how thesestructures change over time with a probabilistic rule.7 As a result, the modelrepresents outcomes with a sequence of probability distributions that cannot bereduced ex ante to an overarching distribution. Consequently, LIE does not hold.
Frydman and Goldberg (2015) show that in this case, stock prices differ fromthe market’s forecast of stocks’ fundamental value by a term that arises from
6 Hamilton (1989) has developed a seminal class of such models. He supposes that there areseveral different regimes in which prices are related to a set of factors. Hamilton represents thesefactors (and the error terms) in each regime with a different probability distribution and supposesthat the timing of switches between regimes is governed by a Markov rule.
7 Instead, the model hypothesizes that there are protracted intervals during which the economywill undergo moderate structural change, in the sense that this change will fall between a lower andupper bound. A partly open model also recognizes that structural change sometimes will not bemoderate (it will fall outside the bounds); but, again, it does not specify the timing of such changeswith a probabilistic rule ex ante.
www.economics-ejournal.org 9

conomics: The Open-Access, Open-Assessment E-Journal
Knightian uncertainty. The NREH present-value model for stock prices can bewritten as follows:
pt =∞
∑j=0
ρjF M
t [(1−ρ)dt+1+ j − rt+1+ j|vt ]+ kut (1)
where pt and dt+1 denote the log price of a stock or a basket of stocks in period t andnext-period’s log dividends, respectively, rt+1 is the discount rate (which typicallyis the sum of the interest rate and a premium for potential capital losses), and0 < ρ < 1 is a parameter of linearization.8 F M
t (·|vt) represents the market’s time-t point forecast conditional on the information about the factors that it considersrelevant, denoted by vt . The t subscript on the F M
t (·) operator recognizes that thestrategy underpinning the markets’ point forecast changes over time. The Knightianuncertainty term, kut , follows from a simple decomposition of the market’s iteratedforecasts at each iteration of the equilibrium condition. For example, at t+1, wehave:
F Mt
(F M
t+1 [xt+2|vt ])
= F Mt ([xt+2] |vt)+ ku2,t (2)
ku2,t = F Mt
(F M
t+1 [xt+2] |vt
)−F M
t ([xt+2] |vt) (3)
where xt+2 = (1−ρ)dt+2 − rt+2. As such, kut = ∑∞j=2 ku j,t . We note that with
internal consistency, the market’s time-t forecast of its t +1 forecast of outcomesin Equations (2) and (3) depends on information available at t concerning thefundamental factors that the market considers relevant.
Standard REH models characterize F Mt (·|vt) with the conditional expectation
of the probability distribution implied by the model. The assumption that marketparticipants have access to the same information implies that LIE holds, and thusku j,t = 0 for all j and all t.9 Although ku j,t 6= 0 in NREH models, this term does
8 This formulation makes use of Campbell and Shiller’s (1988) log-linear specification. For easeof exposition, we ignore a constant term arising from linearization.
9 However, Allen et al. (2006) show that with asymmetric information, LIE does not hold, evenwith REH. In these models, stock prices differ from the market’s forecast of stocks’ fundamentalvalue by a term that arises from the asymmetry of information.
www.economics-ejournal.org 10

conomics: The Open-Access, Open-Assessment E-Journal
not affect their qualitative predictions concerning how news about the fundamentalfactors, vt , impacts the market’s forecasts of dividends and the discount rate at apoint in time or how these forecasts and stock prices co-move with vt over time.
In an NREH model, an economist formulates his own understanding of howavailable information is related to future dividends and the discount rate with apartly open representation. This representation supposes that particular fundamen-tal factors are relevant and imposes qualitative constraints ex ante on the impact ofthese factors at each point in time on all future outcomes, for example, that currentearnings impact future dividends positively at all forecasting horizons. Frydmanand Goldberg (2015) show that internal consistency imposes the same qualitativeconstraints on the representation of the market’s iterated forecasts and its forecastof outcomes in terms of the fundamental factors at every forecast horizon.10 Con-sequently, the NREH model’s qualitative implications concerning the impact ofnews about fundamentals at a point in time on stock prices are unaffected by thepresence of the kut term.
The kut term also does not affect the NREH model’s predictions concerningco-movements in time-series data. The reason is that the model generates only qual-itative predictions concerning these co-movements. For example, that stock pricesco-move positively with earnings for protracted intervals during which unforesee-able change is “moderate” (falling within upper and lower bounds) (Frydman andGoldberg, 2015).
The REH present value model also yields qualitative implications concerningthe impact of news on stock prices. Researchers typically assess these implicationswith time-series data. The probabilistic constraints imposed by REH imply ex antequantitative predictions concerning co-movements in the data, which are given bythe conditional moments implied by the model’s probabilistic representation.
10 Of course, the quantitative impact effects of news on the market’s iterated forecasts and themarket’s forecast of outcomes, in general, differ. Allen et al. (2006) provide an REH example withasymmetric information.
www.economics-ejournal.org 11

conomics: The Open-Access, Open-Assessment E-Journal
3 Shiller’s Findings
Shiller (1981) examined the quantitative prediction of the REH present-value modelconcerning time-series co-movements between stock prices and their fundamentalvalue. Reliance on REH enabled him to carry out his test without specifying theparticular probabilistic representation of the processes underpinning dividendsand the discount rate. Shiller exploited REH’s key implication: regardless of theparticular probabilistic characterization of outcomes implied by the model, theactual future values of dividends and the discount rate differ from the market’sforecast of these outcomes by a mean-zero error that is uncorrelated with allavailable information. This decomposition implies that stock prices should be lessvolatile than their fundamental value, pF
t :
pFt = E
(pF
t |vt
)+ εt = pt + εt (4)
where
pFt =
∞
∑j=0
ρk [(1−ρ)dt+1+ j − rt+1+ j] (5)
In computing the fundamental value in (5) at each point in time, Shiller usedtime-series data on the actual values of dividends and the interest rate at future dates.One of his measures of pF
t relied on the consumption-based capital asset pricingmodel (CAPM) and ex post data on consumption to account for the time-varyingrisk premium.
Shiller’s test of (4) involved a joint hypothesis: the particular CAPM specifica-tion that he used and the REH present-value model’s characterization of how themarket forecasts stocks’ fundamental value. Thus, his finding that prices are morevolatile than their fundamental value implies rejection of either the specific riskpremium specification underpinning his ex post measure of stocks’ fundamentalvalue or the entire class of REH present-value models.
In Section 6, we present evidence that unforeseeable structural change andKnightian uncertainty underpin the process driving stock-market outcomes. Aswith dividends and interest rates, this evidence is inconsistent with REH’s char-acterization of the market’s forecasting, and thus stock prices, regardless of the
www.economics-ejournal.org 12

conomics: The Open-Access, Open-Assessment E-Journal
chosen specification of the risk premium. Consequently, like Shiller, we interpretthe excess-volatility finding as a rejection of the empirical relevance of all REHrepresentations—including those yet to be invented—of how market participantsforecast the risk premium, as well as dividends, interest rates, and prices.
Rejection of the quantitative predictions of the entire class of REH present-value models leaves open the question of whether the model’s qualitativeimplications—that stock prices depend on fundamental factors and that thesefactors drive outcomes through their impact on the market’s forecasting of futuredividends and the discount rate—are empirically relevant. In order to assess thesepredictions we rely on direct evidence concerning how participants in marketsrelate stock-price movements to fundamental and other factors. This evidence alsoenables us to assess the competing qualitative predictions of the REH and NREHversions of the present-value model.
4 Uncovering Direct Evidence
Mangee’s (2011) Bloomberg News data set provides such direct evidence. Hemanually reads Bloomberg market wraps and converts textual information in theminto numerical data without the aid of a content-analysis program.11 This enableshim to identify only those factors that are explicitly reported as having drivenstock prices on a given day. A strict set of rules ensures that the wraps are scoredconsistently over the 17-year period.12
This rule-based manual approach is not constrained to search for words orphrases from a pre-specified list: any factor—whether fundamental, psychological,or technical—that is reported in a market wrap as a main driver of prices is recorded.Mangee also records whether a fundamental factor was mentioned as affectingprices positively or negatively. For example, if a rise (fall) in oil prices was
11 Most other textual-data studies rely on such a program to convert narrative information intonumerical data. See Frydman et al. (2015) for a discussion of why this approach is not suitable forassessing the relevance of Knightian uncertainty or the qualitative implications of the present valuemodel.
12 See Data Appendix A for a list of these rules.
www.economics-ejournal.org 13

conomics: The Open-Access, Open-Assessment E-Journal
mentioned as underpinning a rise (fall) in stock prices, he would record in his dataset a +1 (–1) for oil prices on the date of the report.
Herein lies one of the principal advantages of Mangee’s approach over thosethat rely on automated textual analysis: Rule-based manual reading enables usto rely on the wrap reports themselves, rather than on econometric analysis, touncover the factors that market participants consider relevant and how they interpretnews about these factors in forecasting outcomes. Moreover, Mangee’s rule-basedreading enables us to uncover the influence of historical events that are to someextent unique, from central-bank announcements and trade agreements to mergersand management shake-ups. Bloomberg’s real-time reporting of these historicalevents is important to ascertain the relevance of Knightian uncertainty.
Understanding the context in which a factor is considered relevant enablesMangee to address a central problem inherent in all news-impact studies: whatoften matters for markets is not the actual change in a fundamental factor, butits change relative to what the market expected. Bloomberg journalists reportthe influence of such expectations when they are relevant for explaining marketmovements.13
In Data Appendix B, we consider excerpts from several Bloomberg marketwraps to specify the information about the process underpinning stock pricesthat these wraps provide and help clarify how Mangee constructs his data set.The excerpts also show how the influence of expectations is incorporated intoBloomberg’s reporting of the impact of fundamental factors.
4.1 Real-Time News Reporting
To be sure, there is reason for skepticism regarding the scientific value of theinformation contained in Bloomberg’s market wraps. After all, these wraps couldmerely reflect end-of-day rationalizations based on journalists’ a priori conceptions,
13 Bloomberg journalists rely largely on polling conducted by their firm’s parent company,Bloomberg L.P., of the expectations of professional economists working at more than a hundredfinancial institutions and forecasting companies. These surveys often involve dozens of participantsand are regularly conducted before the announcement of a broad range of key macroeconomicindicators. Bloomberg journalists sometimes also rely on Thompson-Reuters and other companiesthat regularly conduct surveys of professional participants’ expectations.
www.economics-ejournal.org 14

conomics: The Open-Access, Open-Assessment E-Journal
which may have little connection to the developments and factors that actuallydrove market participants’ forecasts and stock prices.
Other textual-data studies also face this problem. Tetlock (2007), Tuckettet al. (2015), and others rely on regression analysis to address it. They reportthat their narrative-based sentiment measures have some ability to predict futureasset-price movements. This finding suggests that the news reports that underpinthese measures are not ex post rationalizations.
We follow an analogous approach and examine whether a monthly index basedon Mangee’s (2011) data can predict future stock-price movements. This data settracks the importance of a wide range of factors and how news about them affectsthe market’s forecasting. Here, we focus on the historical events that, accordingto Bloomberg News, underpinned market participants’ forecasting and stock-pricemovements. These events play a key role in our argument that unforeseeable changeand Knightian uncertainty drive market outcomes.14 We categorize a historicalevent as positive (negative) if Bloomberg News reported it as contributing to a rise(fall) in stock prices on a given day. We construct a net unforeseeable change index(UCI) which tracks the number of positive events relative to the number of negativeevents.
The relevance of Knightian uncertainty poses considerable difficulties forquantitative testing of net UCI’s predictive power; for example, a linear regressionmodel would miss structural changes.15 We thus examine the question in qualitativeterms: does our index of historical events predict the direction of change of theStandard and Poor’s (S&P) 500 price index? Table 1 reports our results at the one-,three-, six-, and 12-month forecast horizons.
While the net UCI does not have predictive power at the longer forecasthorizons, it does at the one-month horizon; it predicts correctly the qualitativemovement in prices roughly two out of every three months, on average, over the
14 We discuss the events that comprise our net UCI in Section 6.2.15 Most textual-data studies do not consider the structural stability of the regressions that underpin
the results of their tests of predictive power. However, the problem of structural change is wellknown in the news-impact literature, which finds that the quantitative impact of news about overalleconomic activity depends on the business cycle. See Pearce and Roley (1985), McQueen and Roley(1993), Fair (2002), Boyd et al. (2005), and Andersen et al. (2007).
www.economics-ejournal.org 15

conomics: The Open-Access, Open-Assessment E-Journal
Table 1: The Predictive Power of Historical EventsFull Sample: 1993:01–2009:12
Forecast Horizona Net UCIb
1 65.7∗
3 49.76 51.1
12 52.7
Notes: a : Forecast horizon in months; b : percentage of months in the full sample for which the net UCI indexand the direction of change of the Standard and Poor’s (S&P) 500 price index are the same sign, ∗ denotesstatistical significance at the 1% level based on a standard binomial distribution.
entire sample.16 With a sample of 178 months, we can reject the null hypothesis ofno predictive power at the 1% significance level.17
Beyond this result, the process by which Bloomberg News market wraps areproduced creates confidence that they contain valuable information for understand-ing stock markets. The crucial feature of this process is that Bloomberg journalistsmonitor developments in the US stock market throughout each trading day. Asearnings announcements are made or policy decisions become known, they andeveryone else can see the market react. Bloomberg’s journalists report these devel-opments as they occur. Their intraday reports thus provide direct observation of themajor pieces of news and market movements, rather than ex post rationalizations.Moreover, these reports regularly draw on interviews with hedge- and equity-fundmanagers and other professional participants. The market wraps summarize theintraday reports.18
Bloomberg’s market wraps thus provide a uniquely rich source of informationabout market participants’ decision-making and the key factors that they consider
16 There were some months for which the net UCI was zero. Because these observations provideno forecast concerning the direction of change of the future stock price, we omitted them from ourmeasures.
17 We are using the binomial distribution.18 The market wraps provide a rather extensive summary of a day’s developments and are thus
generally much longer than reports from other news sources. The wraps in our sample averaged1,122 words, whereas a sample of recent Associated Press reports averaged 120 words.
www.economics-ejournal.org 16

conomics: The Open-Access, Open-Assessment E-Journal
relevant in driving stock-price movements.19 Indeed, the demand for Bloombergreports suggests that market participants themselves consider them relevant, if notindispensable, for understanding such movements.20
4.2 The Factors Behind Price Movements
Mangee (2011) finds that 115 factors were mentioned as driving market movementson at least one day in the sample. We categorize these factors into three majorgroupings: fundamental, psychological, and technical factors, respectively.
Table A1 in the Data Appendix groups 85 fundamental factors into 16 broadcategories. For example, the “macroeconomic activity” category includes 17factors that are typically interpreted as measures of overall economic activity. Ourempirical analysis in the next section focuses largely on these broader categories.Table A2 lists the psychological factors reported by Bloomberg News. Table A3groups technical factors into two categories: those that involve some type ofmomentum or bandwagon behavior and those that are unrelated to such behavior.
5 Fundamentals and Psychology in Stock-Price Movements
Mangee’s data set enables us to assess the empirical relevance of the REH andNREH present-value models’ qualitative predictions at a point in time. In this sec-tion, we examine qualitative predictions concerning the impact of news about fun-damental factors or psychological considerations on daily stock-price movements.Mangee’s data set enables us to do so regardless of the particular specificationof a model in either class. Thus, like Shiller (1981), who tested the quantitative
19 As far as we know, Mangee (2011) is the first study to construct a numerical data set based onBloomberg News market wraps. Other textual sources that have been used in the literature includeDow Jones newswire feeds (Tetlock et al., 2008; Li, 2010; Cornell, 2013; and Boudoukh et al., 2013),Wall Street Journal columns (Tetlock, 2007, and Sullivan, 2013), Yahoo! Finance message boards(Antweiler and Frank, 2005 and Das and Chen, 2007), and corporate earnings releases (Davis et al.,2006; Engelberg, 2008 and Demers and Vega, 2010).
20 Bloomberg L.P. is one of the largest financial news firms as measured by market share offinancial professionals. Its subsidiary, Bloomberg News, is a major newswire service for more than315,000 clients in 174 countries, including 450 newspaper and magazine outlets.
www.economics-ejournal.org 17

conomics: The Open-Access, Open-Assessment E-Journal
predictions of an entire class of REH models, we examine qualitative predictionsof the entire classes of both REH and NREH models.
Both REH and NREH impose consistency in the model, thereby implyingthat market participants’ forecasting strategies depend on fundamental factors.In Section 2, we pointed out that the Knightian uncertainty term, kut , in theNREH present-value model in Equation (1) does not affect the model’s qualitativepredictions. As this term is equal to zero for all t in standard REH models, bothREH and NREH versions of the model in Equation (1) imply that news about thefundamental factors, vt , influences stock prices at every point in time.
One gauge of the relevance of a factor in moving stock prices is the proportionof trading days in the sample on which this factor was reported as having done so.Column 2 in Table 2 reports these frequencies for the three major groups and broadcategories of fundamental factors.
A frequency of 99.4% for the group of fundamental factors indicates that atleast one of these factors was considered relevant on virtually every trading day inthe 17-year sample. This evidence is strongly supportive of both REH and NREHmodels’ implication that fundamentals are a driver of stock prices.
However, Mangee’s data set provides evidence that psychological and othernon-fundamental factors also underpin stock-price movements. As Table 2 shows,although psychological considerations were reported to underpin stock-price move-ments considerably less frequently than fundamental factors, they were mentionedon roughly half of the trading days in the sample as underpinning the market’sforecasting. REH models’ implication that psychological factors play no role inhow market participants forecast outcomes is inconsistent with this finding.
The evidence in Table 2 also upends the raison d’être of behavioral-financemodels, which assume that asset prices are driven by psychological and otherconsiderations that are largely unrelated to fundamental factors.21 Contrary to thisclaim, we find that nearly all of Bloomberg’s mentions of psychological factors(98.5% to be exact) were explicitly related to how market participants interpretednews about fundamental factors.22
21 For an overview of behavioral-finance models, see Shleifer (2000).22 See Data Appendix C for examples of such reporting.
www.economics-ejournal.org 18

conomics: The Open-Access, Open-Assessment E-Journal
Table 2: Factors that Moved the MarketFactor Categoriesa % Trading Daysb % Positive Impactc
Fundamentals 99.4 -Dividends 42.7 99.5Macroeconomic activity 35.4 69.2Company variables 23.1 -Sales 23.2 91.3Oil 20.2 45.4Interest rates 17.3 1.9Rest of world 14.2 -Benchmark valuation 12.4 5.7Government 11.7 -Central Bank 9.6 -Housing 8.2 -Inflation 7.5 1.8Currency markets 6.1 66.2Financial institutions 6.3 -Geopolitical issues 2.2 -Trade 1.4 -
Psychological 55.4 -Psychology w/ fundamentals 54.6 -Pure psychology 1.1 -
Technical 6.3 -Momentum 1.9 -Non-momentum 4.9 -
Notes: a : Each category includes factors that Bloomberg News reported in at least one market wrap moveddaily stock prices. For category definitions, see Tables A1-A3. b : Each figure is the percentage of all tradingdays in the sample on which Bloomberg News reported that the factor moved stock prices. c : The percentageof all mentions from Bloomberg market wraps for which the qualitative impact of a factor was reported aspositive.
Table 2 shows that technical factors played a small role in underpinning dailyprice movements. These factors were mentioned as a driver of the market on
www.economics-ejournal.org 19

conomics: The Open-Access, Open-Assessment E-Journal
only 6.3% of the trading days in the sample. There is also little evidence for themomentum trading emphasized by behavioral bubble models. Such trading wasmentioned as driving the market on only 1.9% of all trading days in the sample.23
Most of Bloomberg’s mentions of technical factors involved the January effect andother such non-momentum considerations.
Mangee’s data is inconsistent with REH and behavioral-finance models’ sharplydifferent implications that either fundamental factors or behavioral considerations,respectively, underpin asset-price movements. This dualism is an artifact of theflawed premise underpinning both of these approaches: an ex ante overarchingprobability distribution can represent outcomes over an indefinite future (Frydmanand Goldberg, 2011).
An NREH model jettisons this premise, which enables it to recognize that thereare many rational ways to forecast dividends and the discount rate. A rationalmarket participant, therefore, cannot rely solely on statistical analysis or othercalculations to ascertain which forecasting strategy he should use. Ultimately, he isguided by the confidence that he has in choosing one strategy over others, as wellas his intuition and emotions in deciding when and how to revise it. As we discussin Section 7, we would also expect psychological factors to play a key role in howmarket participants assess the riskiness of holding open positions in the market.
Choosing a forecasting strategy entails selecting which fundamental factors arerelevant and determining how to interpret the impact of news about them on futureoutcomes. Consequently, whenever market participants rely on psychologicalfactors in driving their forecasting, they relate them to their understanding of theinfluence of news about fundamental factors. This connection is exactly whatwe find in Bloomberg market wraps. This evidence—that both psychologicaland fundamental factors underpin stock-price movements—is consistent with theNREH present-value model’s qualitative predictions.
23 There is evidence that momentum trading played a small role in the 1990s upswing in stockprices. But, this was not the case in the 2000s. For an empirical assessment of bubble models usingMangee’s (2011) Bloomberg data, see Frydman and Goldberg (2011).
www.economics-ejournal.org 20

conomics: The Open-Access, Open-Assessment E-Journal
6 Unforeseeable Change and Knightian Uncertainty
Beyond providing evidence that a wide variety of fundamental factors underpinstock prices, Mangee’s (2011) Bloomberg data contain direct evidence concerninghow market participants interpret and forecast outcomes in terms of these factors.Although Mangee’s data provide only qualitative evidence about such relationships,this evidence implies that the structure of the process underpinning dividends andinterest rates, and thereby stock prices, often undergoes quantitative change.
These findings accord with econometric studies that also find structural changein the price process. But the central question for macroeconomics and financetheory is this: Could the structural change that these studies estimate on the basisof ex post data have been represented ex ante with a probabilistic rule?
Much hinges on the answer. As we discussed at the outset, the core premiseof a vast majority of macroeconomics and finance models is that the answer isyes. However, a negative answer would not only undercut this core premise; itwould also call for rethinking these models claim to be able to represent rationalforecasting and how market outcomes actually unfold. In particular, it wouldsupport our argument that assuming away Knightian uncertainty lies at the root ofShiller’s findings and other long-standing empirical puzzles.
6.1 Structural Change
Mangee’s data set provides explicit evidence of quantitative structural changein equity markets. This evidence comes in part from reports of switches in thealgebraic sign of the impact of news on stock prices.24
By far the most important among these factors are those in the macroeconomicactivity category, which was mentioned as relevant on 35% of the trading days. Wereport in Section 7 that the market interpreted news on overall economic activitythrough both the dividend and discount rate channels, with positive and negative
24 Evidence also comes from fluctuations in the proportion of days each month a fundamentalfactor was mentioned in a wrap report as driving stock prices. These fluctuations are suggestive notonly of quantitative structural change, but that different fundamental factors were relevant for themarket’s forecasting during different subperiods in our sample. See Frydman et al. (2015) for adiscussion of these findings.
www.economics-ejournal.org 21

conomics: The Open-Access, Open-Assessment E-Journal
impacts, respectively. Thus, whenever this news mattered positively (negatively)for stock prices, its impact through the dividend channel was greater (smaller)in magnitude than its impact through the discount-rate channel. Consequently,our finding (reported in Table 2) that good news about macroeconomic activityimpacted stock prices positively on 69.2% of the days on which this news wasmentioned and negatively on 30.8% of those days provides explicit evidence ofquantitative structural change.
News-impact studies have uncovered a similar finding of structural changein the impact of macroeconomic news on stock prices, lending further supportto the value of Mangee’s evidence. These studies report that good news aboutmacroeconomic activity impacted stock prices negatively during expansions andpositively during contractions.25 Table 2 shows that the impact of oil prices andcurrency-market factors also involved switches in sign over the period of the sample.These sign switches, as with those involving news about macroeconomic activity,provide explicit evidence of quantitative structural change in the process underlyingstock prices.
6.2 Knightian Uncertainty
As any good forecaster of macroeconomic activity knows, shifts in the economiccycle are often triggered by events that, even in the best of cases, can be only dimlyanticipated. We would therefore expect that the quantitative structural changedocumented by the news-impact studies and Bloomberg News market wraps wouldbe all but impossible to foresee, even in probabilistic terms. Indeed, members ofthe NBER’s Business Cycle Dating Committee often disagree on the timing ofwhen a cycle begins or ends, even though they have access to ex post data.
To put it simply, structural change is often triggered by events that are not exactrepetitions of similar events in the past. Thus, ipso facto, the quantitative effect of
25 See Footnote 15 for references. Mangee (2014) also reports evidence from Bloomberg Newsthat the qualitative impact of macroeconomic news is connected to the economic cycle. However,he finds that sign switches occur throughout his sample, indicating that the frequency of structuralchange is much greater and the connection to the business cycle much looser than reported by thenews-impact studies.
www.economics-ejournal.org 22

conomics: The Open-Access, Open-Assessment E-Journal
these events on change in the economy’s structure cannot be represented ex antewith a probabilistic rule.
The appointment of Paul Volcker to lead the U.S. Federal Reserve is just oneof many examples. Few could have foreseen in 1978 that he would be appointedin 1979. In order to foresee fully the consequences of his appointment for thesubsequent movement of stock prices, one would have had to come up with aprecise estimate of the severity of the contractionary monetary policy that heultimately implemented. One would also have had to estimate a model that relatedprices to the monetary-policy stance. The very fact that Volcker’s change in policywas unusual, and that its impact was context-dependent, implies that there was nopast data that one could have used to estimate the precise impact of his appointmentex ante.
Studies that allow for such change use Hamilton’s (1989) Markov switchingmodel and constrain its transition probabilities to be fixed ex ante.26 However,events such as the appointment of a new Fed chair or a new CEO engenderunforeseeable structural change and thereby render any ex ante specifications ofMarkov switching models inconsistent with how outcomes will actually unfold. Infact, in an early study of currency markets, Kaminsky (1993) finds that the transitionprobabilities estimated on the basis of ex post data are not only time-varying, butdepend on who is Fed chair and the credibility of the incumbent’s policies.27 Thisunforeseeable structural change cannot be specified ex ante. Consequently, shefinds that Markov switching models are inconsistent with the actual turning pointsin the data.
Indeed, Bloomberg News reports that many of the factors that move stock pricesinvolve events that are to some extent novel and whose impact is context-dependent.In Table 3, we list the categories of fundamental factors from Table A1 that involvesuch historical events, which include appointment of a new CEO, mergers andacquisitions, wars, election outcomes, and other geopolitical developments.
26 For example, in the stock market see Driffill and Sola (1998) and Gutiérrez and Vázquez (2004).27 For evidence that structural change in models of stock returns are related to historical events
that are to some extent novel, see Pettenuzzo and Timmermann (2011) and Ang and Timmermann(2012).
www.economics-ejournal.org 23

conomics: The Open-Access, Open-Assessment E-Journal
Table 3: Historical Events that Moved the MarketMergers and acquisitions (435) Fed comments/Fed minutes/Legal or Accounting Issues (286) other Fed communication (369)Leverage/credit issues (159) Communication by governmentArmed conflicts (143) officials (151)Bailouts or nationalization Business spending (63)
of banks (90) Political conflict, instability,Liquidity issues (59) corruption (55)Management Shake-ups (47) Macroprudential policy (40)Bankruptcy (45) Purchases of large stake/Fiscal policy/stimulus plan (40) stock splits/share buybacks (38)Trade agreements (30) Political elections (22)Labor layoffs or strikes (25) Financial reform (19)Terrorism (21) Natural disasters (11)Initial Public Offerings (18) Cabinet changes (3)Healthcare policy (11) Taxes or rules on CEO bonuses (1)Tariff/quotas/subsidies (3) Introduction of Euro (1)
Notes: The table lists the fundamental factors from Table A1 that involve historical events that are to someextent unique. Figures in parentheses denote the total absolute number of mentions for each factor.
We find that such events account for a substantial fraction (roughly 20%) ofBloomberg’s mentions of fundamental factors over the sample.28
7 The Present-Value Model’s Two Channels
The empirical relevance of Knightian uncertainty and Shiller’s remarkable excess-volatility finding imply that the REH present-value model’s quantitative implica-tions are grossly inconsistent with how stock prices actually unfold. Moreover,
28 Liquidity issues largely involve central bank injections of liquidity into the banking system,which ease borrowing constraints. Bloomberg wrap reports indicate that these injections influencethe market through the dividend or the discount rate channel.
www.economics-ejournal.org 24

conomics: The Open-Access, Open-Assessment E-Journal
the evidence that psychological considerations impact stock-price movements isinconsistent with the REH model.
Although the REH present-value model’s quantitative predictions are rejected,the model shares with its NREH counterpart qualitative predictions concerninghow news about fundamental factors moves stock prices at each point in time. First,this news impacts prices through two channels: the market’s forecast of dividendsand its forecast of the discount rate. Second, ceteris paribus, as the market raises(lowers) its forecast of dividends, or lowers (raises) its forecast of the discount rate,it bids up (down) stock prices. Mangee’s (2011) Bloomberg data set provide muchsupport for these predictions.
7.1 The Dividend Channel
Bloomberg’s market wraps explicitly mention three broad categories of factorsmost often as influencing the market’s forecast of dividends. The most frequentlymentioned factors are in the dividend category, which includes mentions of firms’dividend and earnings announcements, as well as earnings forecasts by firms andanalysts. The other two sets of factors fall within the company variables andsales categories. The former includes a variety of factors—such as CEO andCFO changes, IPOs, and mergers and acquisitions—that impact companies’ futureearnings and thus dividends. The sales category includes firm or industry revenues.Table 2 reports the proportion of trading days in the sample that factors in these andother categories were mentioned in a market wrap as having driven stock priceson a given day. Many of these mentions were explicitly related to the dividendchannel.
Reports that earnings forecasts moved stock prices are ipso facto explicitmentions of the market’s forecasting of dividends. Moreover, Bloomberg’s wrapsoften report the impact of news about factors in the dividend category in termsof the market’s forecast of these factors. As such, these reports also are explicitmentions of the dividend channel. We find that 75% of the news concerningthe dividend category involved earnings forecasts or was related to the market’sforecasting of factors in this category.
Bloomberg’s wraps also frequently mention the dividend channel explicitly intheir reporting of other news, particularly about factors in the company variables
www.economics-ejournal.org 25

conomics: The Open-Access, Open-Assessment E-Journal
and sales categories. In Table 4, we report the share of trading days in the samplefor which any piece of news was explicitly mentioned as underpinning stock-pricemovements through the dividend channel. We find that this channel was explicitlymentioned on 46.1% of all trading days in the sample.29
Table 4: Mentions of Dividend and Interest Rate ForecastsExplicit Mentions Implied Mentions Total
Dividend channel 46.1 20.7 61.9Interest rate channel 25.8 17.8 38.6Either channel 63.2 70.5 95.0
Notes: All figures represent the percentage of total trading days on which Bloomberg News implicitly orexplicitly mentioned in the wrap reports dividend forecasts, interest rate forecasts, or either of the present valuemodel’s two channels.
The evidence of explicit mentions of the dividend channel suggests that newsconcerning the dividend, company variables, and sales categories is particularly rel-evant for forecasting dividends. Indeed, we would expect that most such forecastswould rely on this news.
We thus consider mentions of factors in these three categories that BloombergNews does not explicitly relate to the market’s forecasting of dividends or earningsas implied mentions of the dividend channel. Table 4 reports that implied mentionsof the dividend channel occurred on 20.7% of all trading days in the sample. Whenwe consider explicit and implied mentions together, we find that the dividendchannel was mentioned at least once as underpinning stock-price movements on61.9% of all trading days.
Table 2 provides corroborating evidence of the importance of the dividendchannel. It shows that the most important fundamental drivers of stock prices werefactors in the dividend, company variables, and sales categories; these factors, alongwith those concerning macroeconomic activity, were mentioned, respectively, on
29 The proportions of explicit mentions of the dividend channel involving news about the dividendcategory and news about the other categories are 30.3% and 21.8%, respectively. The sum of thesefigures is larger than the 46.1% reported in Table 4 because on some days, factors in more than onecategory were mentioned.
www.economics-ejournal.org 26

conomics: The Open-Access, Open-Assessment E-Journal
43%, 23%, 23%, and 35% of the trading days in the sample. These are the factorsthat we would expect would be the most relevant for the market in forecastingearnings and dividends.
Time-series data on stock prices and earnings lend support to Bloomberg’sreporting on the importance of the dividend channel. In Figure 1, we provide simpletime plots of the S&P 500 price index and underlying earnings over Mangee’s(2011) sample period.
Figure 1: The S&P500 Price Index and Company Earnings
Notes: The figure plots the monthly S&P500 Price Index (dotted line) and a monthly index of companyearnings (solid line). Data are from Robert Shiller’s website: http://www.econ.yale.edu/∼shiller/.
The strikingly close co-movement of the two series clearly suggests the im-portance of the dividend channel in underpinning price movements. The fact thatMangee’s data also show the importance of the dividend channel in actually drivingstock prices provides another indication that Bloomberg News’ wraps provide bonafide evidence concerning the process underpinning these prices.
www.economics-ejournal.org 27

conomics: The Open-Access, Open-Assessment E-Journal
7.2 The Discount-Rate Channel
In general, the market’s forecast of the discount rate consists of its forecast ofinterest rates and a risk premium. But, although interest-rate movements areobservable, those affecting the market’s risk premium are not. Not surprisingly,Bloomberg’s mentions of the discount-rate channel consist entirely of news that isdirectly related to the market’s forecasting of interest rates. We argue in Section7.5 that, although the wraps do not explicitly mention the market’s risk premium,they contain indirect evidence concerning key factors that underpin it.
Here we analyze Mangee’s evidence of explicit mentions of the discount-ratechannel, which pertain to the market’s forecast of interest rates. Many of these men-tions involve news about interest rates themselves, including news about short-termand long-term domestic rates. As with the dividend category, Bloomberg’s report-ing often relates the impact of interest-rate movements to the market’s forecast ofthese movements. This applies to 27.1% of its interest-rate mentions.
Bloomberg News also frequently mentions the discount-rate channel explicitlywhen it reports the impact on stock prices—again via the market’s forecasting ofinterest rates—of news about the inflation rate and central-bank communications.Consequently, we consider mentions of factors in all three categories—interestrates, inflation rates, and central-bank communications—that Bloomberg Newsdoes not explicitly relate to the market’s forecasting of interest rates as impliedmentions of the discount-rate channel.
We find that this channel was mentioned explicitly and implicitly as underpin-ning stock-price movements on 25.8% and 17.8% of all trading days in the sample,respectively (see Table 4). When we consider explicit and implied mentions to-gether, this channel was mentioned as driving stock-price movements at least onceon 38.6% of all trading days.
7.3 Mentions of Either Channel
Table 4 reports the share of trading days for which news was explicitly reportedto have influenced stock prices through either the dividend or the discount-ratechannel. We find that at least one of these two channels was explicitly mentionedon roughly two-thirds (63.2%) of all trading days.
www.economics-ejournal.org 28

conomics: The Open-Access, Open-Assessment E-Journal
We reported that Bloomberg News explicitly mentioned news concerningmacroeconomic factors as influencing stock prices through both the dividendand discount-rate channels. We thus include in our measure of implied mentionsof either channel news about macroeconomic activity that Bloomberg did notexplicitly relate to the market’s forecasting of dividends or interest rates.
When explicit and implied mentions of both channels are considered together,we find that Bloomberg’s market wraps reported that news about fundamentalfactors influenced stock prices through either the market’s forecast of dividends orinterest rates on nearly every trading day (95%) in the sample.
7.4 Model-Consistent Impacts
Beyond providing supportive evidence that news about fundamental factors in-fluences stock prices through the present-value model’s two channels, the newsconstituting Bloomberg’s market wraps is remarkably consistent with the model’spredictions concerning the direction of these impacts.
Bloomberg’s market wraps contain information about how changes in a funda-mental factor affected daily stock-price movements. For example, a fall in interestrates may have impacted stock prices negatively, or market participants revisedtheir forecasts of future company earnings, and subsequently bid up stock prices,following an announcement that GDP grew at a higher-than-expected rate. Forsuch usual fundamental factors, the last column in Table 2 provides the proportionof mentions in the sample involving a positive (and thus negative) impact on stockprices.
However, several of the categories in Table 2 include factors that are non-quantitative, heterogeneous, and to some extent unique; for example, FederalReserve communications and new trade policies. News about these factors pro-vides no way to measure their own direction of change. As a result, trackingwhether stock prices rise or fall as news becomes available cannot provide evi-dence concerning the qualitative relationships underpinning stock prices. For thesecategories, we therefore use a “-”.
According to the present-value model, news that the market interprets asinfluencing future dividends (interest rates) leads it to bid stock prices in the same(opposite) direction. Table 2 provides evidence for these qualitative predictions.
www.economics-ejournal.org 29

conomics: The Open-Access, Open-Assessment E-Journal
For example, the 99.5% figure for the dividend category reveals that these factorsmattered positively virtually every time they were mentioned in a wrap as drivingthe market. The 1.9% figure for the interest-rate category shows that these factorsmattered negatively nearly every time they were mentioned. This evidence is highlysupportive of the present-value model’s qualitative predictions.
Table 2 shows that factors in the inflation category also mattered negativelyfor stock prices nearly every time they were mentioned. This finding may appearinconsistent with the present-value model, given that a change in the expectedinflation rate, ceteris paribus, implies that real interest rates move in the oppositedirection. However, Bloomberg reporting reveals that the market understands infla-tion news largely through its impact on nominal interest rates: market participantsexplicitly relate 89% of inflation mentions to their forecasting of nominal rates.
The high proportion of factors in the company sales category that had a positiveimpact (91.3%) is also consistent with the present-value model’s predictions. Wewould expect, for example, that the market would interpret expanding companyor industry sales largely as positive news for future dividends. Indeed, BloombergNews often mentions the dividend channel in reporting this news.
We saw in Section 6.2 that 69.2% (30.8%) of mentions of macroeconomicactivity had a positive (negative) impact on prices. Consistent with the present-value model, Mangee’s (2011) data set reveals frequent mentions of the dividend(discount-rate) channel when macroeconomic activity was reported as affectingprices positively (negatively).
7.5 An NREH Model of Uncertainty Premium
Bloomberg’s reporting does not contain explicit mentions of news affecting stockprices through its influence on the market’s risk premium. Standard REH modelsrely on expected utility theory to relate this premium to the ex ante variance ofreturns or the ex ante covariance of returns and consumption. Bloomberg’s marketwraps contain no mentions of either measure of variation underpinning stock prices.
www.economics-ejournal.org 30

conomics: The Open-Access, Open-Assessment E-Journal
A Premium for Knightian Uncertainty
However, the wraps contain evidence that is consistent with an alternative NREHmodel of the market’s premium. The model relies on endogenous prospect theoryto model preferences under Knightian uncertainty and uses NREH to representthe market’s forecasts.30 According to endogenous prospect theory, participantshold open positions in the market only if they expect to earn a positive return—apremium—to compensate them for their extra sensitivity to potential losses. Fryd-man and Goldberg (2007) refer to this compensation as an “uncertainty premium,”echoing Knight’s (1921) distinction between “true” uncertainty and risk.
In the aggregate, the market’s uncertainty premium, upt , depends on the bulls’premium relative to the bears’ premium:31
upt = upLt −upS
t (6)
where the superscripts “L” and “S” denote the premiums of the bulls and bears, whohold long and short positions, respectively.32 Each group’s premium depends onparticipants’ forecasts of the potential losses from holding long or short positions.Frydman and Goldberg (2007) build on Keynes (1936) and represent these forecastsin terms of the departure of the asset price from participants’ assessments of thehistorical benchmark value:
upit = γ
i0t + γ
i1tgapt (7)
where gapt denotes the gap between the stock price and its historical benchmarkvalue, and γ i
1t and γ i0t , i =L,S, represent the influence of the gap on bulls’ or bears’
30 Endogenous prospect theory builds on Kahneman and Tversky’s (1979) prospect theory (Fry-dman and Goldberg, 2007). It enables economists to model the “limits to arbitrage” solely on thebasis of prospect theory.
31 The market’s uncertainty premium is defined as a forecast of the return to holding a longposition in the market. It is equal to the bulls’ premium relative to the bears’ premium because apositive return on a long position implies a negative return on a short position. Consequently, a smalluncertainty premium in the aggregate does not imply that bulls and bears require a small premium totake open positions in the market. A small market premium would asrise if the group of bulls’ andbears’ premiums were large but comparable.
32 The market’s unceratinty premium can be thought of as an expected return on holding a longposition in the market. But, it is a weighted average of the expectations of bulls and bears, where thebears’ expectations of the return are of course negative.
www.economics-ejournal.org 31
conomics: The Open-Access, Open-Assessment E-Journal
uncertainty premium and all other factors that influence this premium, respectively.The t subscripts on these parameters recognize that the relationship underpinningthe market’s premium changes over time.
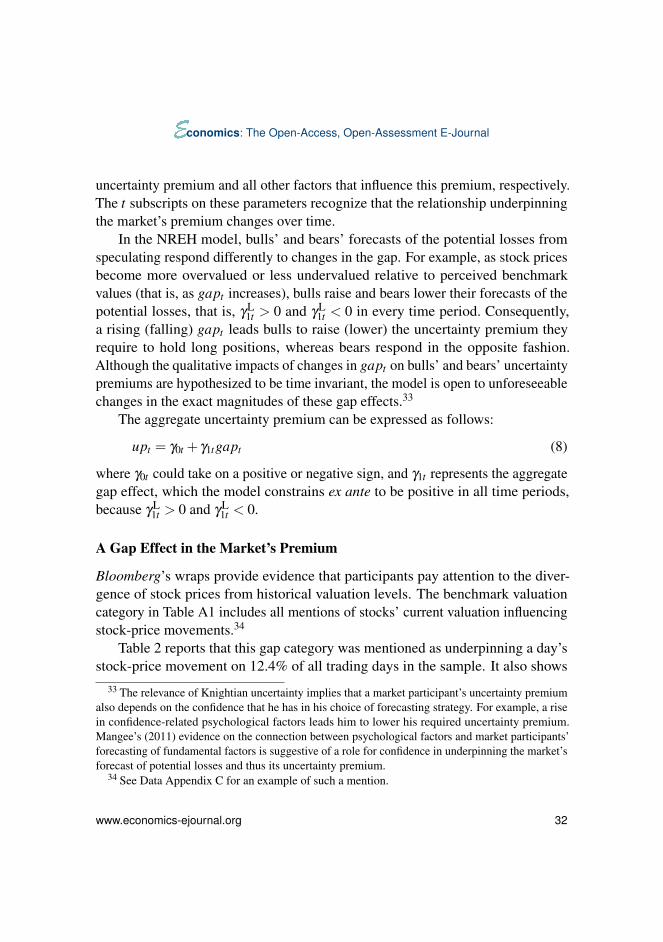
In the NREH model, bulls’ and bears’ forecasts of the potential losses fromspeculating respond differently to changes in the gap. For example, as stock pricesbecome more overvalued or less undervalued relative to perceived benchmarkvalues (that is, as gapt increases), bulls raise and bears lower their forecasts of thepotential losses, that is, γL
1t > 0 and γL1t < 0 in every time period. Consequently,
a rising (falling) gapt leads bulls to raise (lower) the uncertainty premium theyrequire to hold long positions, whereas bears respond in the opposite fashion.Although the qualitative impacts of changes in gapt on bulls’ and bears’ uncertaintypremiums are hypothesized to be time invariant, the model is open to unforeseeablechanges in the exact magnitudes of these gap effects.33
The aggregate uncertainty premium can be expressed as follows:
upt = γ0t + γ1tgapt (8)
where γ0t could take on a positive or negative sign, and γ1t represents the aggregategap effect, which the model constrains ex ante to be positive in all time periods,because γL
1t > 0 and γL1t < 0.
A Gap Effect in the Market’s Premium
Bloomberg’s wraps provide evidence that participants pay attention to the diver-gence of stock prices from historical valuation levels. The benchmark valuationcategory in Table A1 includes all mentions of stocks’ current valuation influencingstock-price movements.34
Table 2 reports that this gap category was mentioned as underpinning a day’sstock-price movement on 12.4% of all trading days in the sample. It also shows
33 The relevance of Knightian uncertainty implies that a market participant’s uncertainty premiumalso depends on the confidence that he has in his choice of forecasting strategy. For example, a risein confidence-related psychological factors leads him to lower his required uncertainty premium.Mangee’s (2011) evidence on the connection between psychological factors and market participants’forecasting of fundamental factors is suggestive of a role for confidence in underpinning the market’sforecast of potential losses and thus its uncertainty premium.
34 See Data Appendix C for an example of such a mention.
www.economics-ejournal.org 32

conomics: The Open-Access, Open-Assessment E-Journal
that this factor affected stock prices negatively on 94.3% of all days on whichit was mentioned as relevant. This finding is consistent with the NREH modelin Equation (8), which implies that a higher gap leads the market to raise itsuncertainty premium, and therefore its discount rate.
We would expect that the gap effect would grow with the magnitude of thegap. Figure 2 provides some support for this prediction, by plotting the S&P 500price-earnings (PE) ratio against a 12-month moving average of the proportionof days in each month that this factor was mentioned as underpinning a day’sstock-price movements.35
Figure 2: The S&P500 PE Ratio and Benchmark Valuation
Notes: The figure plots the monthly S&P500 Price-to-Earnings ratio (dotted line) and the monthly frequencywith which Bloomberg News mentions benchmark valuation factors as moving stock prices (solid line). Dataon the PE ratio are from Robert Shiller’s website: http://www.econ.yale.edu/∼shiller/.
The figure shows that prior to 1997, benchmark-valuation considerations playeda minor role in the market; they were mentioned in Bloomberg ’s wraps on roughly6% or fewer of the trading days each month. However, this frequency began to rise
35 The PE ratio in the figure follows Campbell and Shiller (2001) and uses a 10-year movingaverage for earnings.
www.economics-ejournal.org 33

conomics: The Open-Access, Open-Assessment E-Journal
sharply in 1997, reaching a high of 38% by the end of 1998. During this period,stock prices also rose sharply, implying that the market’s increasing focus onvaluation issues did not outweigh the impact of bullish trends in earnings and otherfundamental factors. The evidence from Bloomberg’s reporting and the NREHmodel imply that the market’s uncertainty premium was rising during this period.
As the PE ratio fell from historic highs during 2000–2002, we would expectthe market to focus less on valuation considerations. Figure 2 is consistent withthis view, though the frequency of mentions of this factor began falling at the endof 1999, which was proximate, but before the sharp fall in stocks’ PE ratio in early2000.
Much of the large upswing in stock prices during the 2000s was not associatedwith a corresponding rise in stocks’ PE ratio. However, at roughly 25, this ratiowas historically high.36
Figure 2 shows that the frequency with which valuation considerations werementioned began rising in 2007, some months prior to the sharp downswing instocks’ PE ratio. Interestingly, the sharpest increase in this frequency occurredafter the collapse of Lehman Brothers in September 2008 and the subsequent sharpfall in stock prices. Bloomberg’s market wraps reveal that the market considered aPE ratio of 18 or below a negative gap and reason to begin buying stocks in 2009.
The evidence in Figure 2 is consistent with the NREH model sketched in thissection: upswings in stocks’ PE ratio are associated with upswings in Bloomberg’smentions of the gap as driving market participants’ forecasting, and thus, presum-ably upswings in its uncertainty premium.37
This evidence undercuts REH proponents’ interpretation of Shiller’s (1981)and others’ findings that a countercyclical risk premium caused the volatility teststo miss the variation in stocks’ fundamental value.
36 Using monthly data from January 1881 through August 2014, the historical average PE ratio is16.6. If we focus on the period beginning in January 1980, the average PE ratio is 21.3.
37 We have also examined Mangee’s data concerning the connection between the market’s confi-dence in how it forecasts outcomes and its uncertainty premium. We found that an index of suchconfidence tends to rise during price upswings. According to the NREH model, such fluctuationsshould lead to an upswing in the market’s uncertainty premium.
www.economics-ejournal.org 34

conomics: The Open-Access, Open-Assessment E-Journal
8 Concluding Remarks: Why the REH Present-Value Model FailedEmpirically
The evidence that the process underpinning stock prices undergoes unforesee-able structural change leads us to a novel explanation of the REH present-valuemodel’s empirical failure: there is no overarching probability distribution thatcould characterize this process. Rational, profit-seeking participants cannot affordto ignore unforeseeable change and the Knightian uncertainty that it engenders.Consequently, they revise their forecasting strategies at times and in ways that noone could specify in advance with a probabilistic rule. These revisions render anyREH present-value model’s account of stock-price movements inconsistent withtime-series data, as Shiller and many others have found.
Acknowledgements: The authors are indebted to the Institute for New Economic Think-ing (INET) for supporting this research. We are also grateful to Dennis Snower forencouraging us to refocus an earlier draft of the paper on the central issue of Knightian un-certainty. We thank two anonymous referees and Romar Correa for their useful commentsand suggestions. Both the refocusing and refereeing process have improved the paperconsiderably. The authors also thank Matt Winkler and Bloomberg News for providingaccess to the company’s entire historical record of market wrap reports.
www.economics-ejournal.org 35

conomics: The Open-Access, Open-Assessment E-Journal
Data AppendixThis appendix consists of three sections. We first report the set of rules Mangee
(2011) uses in extracting relevant information contained in Bloomberg marketwraps and converting this information into numerical data. We then list the com-plete set of factors that underpinned stock prices during his sample. Finally, weconsider several of Bloomberg News’s market wraps to illustrate how they reporton the importance of fundamental, psychological, and technical factors and howMangee scores these wraps. In doing so, we provide examples of explicit andimplied mentions of the dividend and discount-rate channels.
A. Rule-Based ReadingIn what follows, we denote by Z a fundamental, psychological, or technical
factor and by P either the Dow Jones Industrial, Standard and Poors 500, orNASDAQ price index.
Recording the Relevance of ZMangee records a 1 for Z and 0 otherwise on a given day if:
1. Z is mentioned as underpinning the day’s P movement;2. a forecast of Z is mentioned as underpinning the day’s P movement;3. Z is mentioned as underpinning a single firm’s stock price and this move-
ment is in the same direction as the overall market;
It is often the case that one fundamental factor is mentioned as underpinning a day’sP movement because it influenced the market’s forecast of another fundamentalfactor. For these mentions, a 1 is recorded for both factors according to rules 1 and2.
Recording the Qualitative Impact of FundamentalsThe qualitative relationship between Z and P is determined by the followingcriteria:
www.economics-ejournal.org 36

conomics: The Open-Access, Open-Assessment E-Journal
A “+” is recorded for a fundamental factor for any of the following five cases:
a. Z increases(decreases) and P increases(decreases);b. Z increases by more than expected and P increases;c. Z decreases by more than expected and P decreases;d. Z increases but by less than expected and P decreases;e. Z decreases but by less than expected and P increases.
A “−” is recorded for a fundamental factor for any of the following five cases
f. Z increases(decreases) and P decreases(increases);h. Z increases by more than expected and P decreases;i. Z decreases by more than expected and P increases;j. Z increases but by less than expected and P increases;k. Z decreases but by less than expected and P decreases.
www.economics-ejournal.org 37

conomics: The Open-Access, Open-Assessment E-Journal
B. The Factors that Moved the MarketTable A1: Fundamental Factors
Macroeconomic Activity Company VariablesGDP growth BankruptcyIndex of leading economic CEO or CFO changes
indicators Legal or accounting issuesIndustrial production Firm added to indexProductivity IPOsPersonal income Business spendingService sector activity Mergers and acquisitionsEmployment Book-to-bill ratioUnemployment rate Labor layoff or strikeJobless claims Purchase of large stakeRetail sales national level Stock split/Share buybackManufacturing activityFactory orders Central Bank CommunicationDurables output MinutesNondurables output Comments by officialsConstruction spending Macroprudential policyConsumer spendingConsumer confidence Oil
Crude oil pricesInterest Rates
Federal Funds Financial InstitutionsDiscount Leverage or creditTreasury bill issuesTreasury note Liquidity issuesTreasury bond Credit card defaults
Credit ratingsInflation Rates Capital funding
Producer PricesConsumer Prices Currency MarketsManufacturing Prices Exchange ratesGDP Deflator Introduction of EuroEmployment Cost
SalesDividends Firm or industry revenues
Earnings announcements Auto SalesEarnings forecast announcementsDividend announcements International Trade
Trade agreementsBenchmark Valuation Tariffs
Gap from benchmark Quotaslevels Subsidies
Overvalued Current account balanceUndervalued
www.economics-ejournal.org 38

conomics: The Open-Access, Open-Assessment E-Journal
Table A1: Continued
Housing Government/FiscalHousing starts Fiscal policy/stimulus planHome sales Comments by officialsForeclosures Taxes or rules on CEOHome prices bonusesReal estate prices Credit worthinessCommercial prices Bailout or nationalizationMortgage rates of banks
Health care issuesGeopolitical Issues Budget surplus or deficit
Armed conflicts Political electionsNuclear testing Political conflicts,Terrorism instability or corruption
Financial reformRest of World Cabinet changes
All of the above factorsas they pertain to therest of the world
Notes: Each category includes fundamental factors that Bloomberg News reported in at least one market wrap moved daily stock prices. GDP, GrossDomestic Product; CEO, chief executive officer; CFO, chief financial officer; IPO, initial public offering. See Mangee (2011) for more detail onfactor definitions.
Table A2: Psychological Factors
Optimism ConcernPessimism EuphoriaConfidence Crowd psychologySentiment ExuberanceGreed WorryFear Panic
Notes: Psychological factors that Bloomberg News reported in at least one market wrap moved daily stock prices. See Mangee (2011) for moredetail on factor definitions.
Table A3: Technical Factors
Non-momentum MomentumProfit taking Market rallyFirm added to index Market momentumHoliday effect Momentum tradersJanuary effect BandwagonEnd of month effect Price-to-price loopEnd of quarter effect Moving averageFriday effect ChartismEnd of year effectGiving back effectTriple witchingMonday effect
Notes: Technical factors that Bloomberg News reported in at least one market wrap moved daily stock prices. See Mangee (2011) for more detail onfactor definitions.
www.economics-ejournal.org 39

conomics: The Open-Access, Open-Assessment E-Journal
C. Bloomberg News’ ReportingWe first provide examples of how Bloomberg News reports on the importance
of fundamental factors and how Mangee scores them.
The Dividend ChannelConsider the following excerpt from a market wrap:
“U.S. stocks rose as $35 billion in acquisitions and Merck & Co.’sbetter-than-forecast earnings carried the Standard & Poor’s 500 In-dex and Dow Jones Industrial Average to the steepest gains in aweek...GlobalSantaFe Corp., the second-biggest offshore oil and gasdriller, climbed to a record after agreeing to be bought by larger ri-val Transocean Inc. Merck, the third-largest U.S. drugmaker, had itsbiggest advance since April and accounted for almost a third of theDow average’s rally. ” [July 23, 2007]
The dividend channel is explicitly mentioned since the excerpt reports the impactof earnings relative to what the market expected. According to scoring rules 1, 3and b, a “+1” would be scored for both earnings and company variables on thegiven day.
The next explicit mention of the dividend channel involves news concerning afactor other than those in the dividend category:
“The U.S. stock market posted its first advance in four days after arally in oil prices improved earnings prospects for fuel producers andbetter-than-expected profit at Oracle Corp. ignited shares of softwaremakers.” [June 27, 2007]
According to scoring rules 1 and 2, a +1 would be recorded for both oil prices andearnings on the given day.
The last excerpt we consider involves disappointing news about macroeconomicactivity that, as we discussed in Section 7.1, is an implied mention of the dividendchannel:
www.economics-ejournal.org 40

conomics: The Open-Access, Open-Assessment E-Journal
“U.S. stocks fell, dragging the Standard & Poors 500 Index down froma nine-month high, after reports on job losses and service industrieswere worse than economists estimated...Benchmark indexes openedlower after data from ADP Employer Services showed companiescut 371,000 workers from payrolls in July, more than the averageestimate of 350,000 in a Bloomberg survey of economists...Equitiesextended losses as the Institute for Supply Management’s index ofnon-manufacturing businesses, which make up almost 90 percent ofthe economy, fell to 46.4 from 47 in June. ” [August 5, 2009]
According to scoring rules 1, a and c, a “+1” would be recorded for macroeconomicactivity on the given day.
The Discount-Rate ChannelThe following excerpt explicitly mentions news about interest rates as impact-
ing stock prices through how the market forecasts interest rates:
“U.S. stocks rose for a fourth day after the Federal Reserve cut itsbenchmark interest rate more than forecast to help revive the economy.”[November 6, 2002]
Scoring rules 1 and i imply a −1 for interest rates.The next explicit mention involves news concerning a factor other than those
in the interest rate category:
“U.S. stocks failed to sustain early gains as evidence of a pickup inmanufacturing and raw-material prices suggested the Federal Reservewon’t stop raising interest rates any time soon...The Dow average andthe S&P 500 retreated from early gains after the Institute for SupplyManagement said its factory index showed unexpected expansion inmanufacturing in September. The two indexes rose as much as 0.4percent before the report...“Today it’s all about rates,” said Todd Clark,director of trading at Nollenberger Capital Partners in San Francisco.“That was a much better-than-expected ISM manufacturing number.That clearly caught people off guard.” ” [October 3, 2005]
www.economics-ejournal.org 41

conomics: The Open-Access, Open-Assessment E-Journal
For this excerpt, Mangee records a “ −1” for macroeconomic activity and inflationrates (rules 1, f and h) and “−1” for interest rates (rule 2).
The next excerpt involves interest rate news without explicitly mentioningexpectations. As we discussed in Section 7.2, it is an implied mention of thediscount-rate channel.
“U.S. stocks suffered their worst slide in more than six weeks as bondyields surged. Coca- Cola Co. and bank shares led the decline. “It’sno longer a continuing flow of good news,” said John Niedenberger,who helps oversee $3.5 billion as a money manager with AdvancedInvestment Management in Pittsburgh. “Any time rates go up stockinvestors get nervous, because higher rates cause investors to valuestocks lower.” [August 8, 1997]
Scoring rules 1 and f imply a −1 for interest rates.This last excerpt shows how Bloomberg News reports on the impact of bench-
mark valuation factors, which we argued in Section 7.5, provides indirect evidenceof the relevance of a market uncertainty premium:
“US stocks fell in a volatile session whipped by concern that risingshare prices aren’t justified by corporate earnings prospects... “Thereis a sense that this just can’t keep going the way it has been, so wesee big swings,” said Larry Aasheim, money manager at CorestatesInvestment Advisors with $17 billion in assets. . . . “Valuations areteetering,” he said. ” [November 26, 1996]
Scoring rules 1 and f imply a −1 for benchmark valuation factors.
Psychological FactorsThe last two excerpts in the preceding section show how Bloomberg News
often reports on the importance of psychological factors: they relate these factorsto how market participants interpret the impact of news concerning fundamentalfactors. In scoring these wraps, Mangee recorded a “1” for “nervous” on August 8,1997 (scoring rule 1) a “1” for “concern” on November 26, 1996.
The next excerpt provides another example of such reporting:
www.economics-ejournal.org 42

conomics: The Open-Access, Open-Assessment E-Journal
“U.S. stocks rose for a second day, after Federal Reserve ChairmanAlan Greenspan fueled optimism for a growing economy and highercompany profits.” (July 23, 1997)
Scoring rule 1 implies a “1” for optimism.The last excerpt we consider shows how Bloomberg reports on the importance
of pure psychology factors (that is, which are not mentioned explicitly in connectionwith interpreting the influence of news about fundamental factors for stock prices):
“U.S. stocks slid...‘This is what happens when the contagion of fearspreads,’ said Quincy Krosby, who helps manage about $380 billionas chief investment strategist at the Hartford in Hartford, Connecticut.”[October 9th, 2008]
Scoring rule 1 implies a “1” for fear.
Technical FactorsThe technical factors listed in Table A3 are grouped into two categories: those
that behavioral models emphasize, which involve some type of momentum orbandwagon trading, and those that are unrelated to such trading. The followingtwo excerpts illustrate how Bloomberg News reports on the importance of thesetwo types of factors, respectively:
“U.S. stocks rose as...some of the buying came from ‘momentum’traders, who buy stocks that are going up in order to realize a quickgain. ‘It’s just money chasing stocks at this point, anticipating themarket making a new high and then carrying forward on its ownmomentum,’said Joseph DeMarco, head of trading at HSBC AssetManagement Americas Inc.” [July 8, 1998]
“U.S. stocks rose...[t]he so-called January effect was in evidence ascommunications equipment stocks, the worst-performing group in themajor indexes last year, rose.” [January 3, 2002]
Scoring rule 1 implies a “1” for both market momentum and momentum traders onJuly 8, 1998, whereas on January 3, 2002, it implies a “1” for the January effect.
www.economics-ejournal.org 43

conomics: The Open-Access, Open-Assessment E-Journal
References
Allen, Franklin, Stephen Morris, and Hyun Song Shin (2006), “Beauty Contestsand Iterated Expectations in Asset Markets,” The Review of Financial Studies,19(3), 719–752.http://rfs.oxfordjournals.org/content/19/3/719.abstract
Andersen, Torben G., Tim Bollerslev, Francis X. Diebold, and Clara Vega (2007),“Real-Time Price Discovery in Global Stock, Bond and Foreign Exchange Markets,”CREATES Research Paper, No. 2007–20.
Ang, Andrew and Allan Timmermann (2012), “Regime Changes and FinancialMarkets,” Annual Review of Financial Economics, 4(1), 313–337.http://ideas.repec.org/a/anr/refeco/v4y2012p313-337.html
Antweiler, Werner and Murray Z. Frank (2005), “Is All That Talk Just Noise? TheInformation Content of Internet Stock Message Boards,” Journal of Finance, 59(3),1259–1294.http://www.jstor.org/stable/3694736?seq=1
Barberis, Nicholas C. and Richard Thaler (2003), “A Survey of Behavioral Finance,”in Handbook of the Economics of Finance, G. Constantinides, R. Stulz, M. Harriseds., North Holland, Amsterdam, 2003.
Boudoukh, Jacob, Ronen Feldman, Shimon Kogan, and Mathew Richardson(2013), “Which News Moves Stock Prices? A Textual Analysis,” NBER WorkingPaper Series, No 18725, January.http://ideas.repec.org/p/nbr/nberwo/18725.html
Boyd, John H., Jian Hu, and Ravi Jagannathan (2005), “The Stock Market’sReaction to Unemployment News: Why Bad News is Usually Good for Stocks,”Journal of Finance, 60(2), 649–672.http://www.jstor.org/stable/3694763?seq=1
www.economics-ejournal.org 44

conomics: The Open-Access, Open-Assessment E-Journal
Campbell, John Y., Andrew W. Lo, and A. Craig MacKinlay (1997), The Econo-metrics of Financial Markets, Princeton, NJ: Princeton University Press.
Campbell, John Y. and Robert J. Shiller (2001), “Valuation Ratios and the Long-runStock Market Outlook: An Update,” Cowles Foundation Discussion Papers, No.1295, Yale University.http://citeseerx.ist.psu.edu/viewdoc/download?doi=10.1.1.2.8077
Campbell, John Y. and Robert J. Shiller (1988), “Stock Prices, Earnings, andExpected Dividends,” Journal of Finance, 43(3), 661–676.http://onlinelibrary.wiley.com/doi/10.1111/j.1540-6261.1988.tb04598.x/abstract
Cassidy, John (2010), “Interview with John Cochrane,” New York:http://www.newyorker.com/rational-irrationality/interview-with-john-cochrane.
Chen, Zengjing and Larry G. Epstein (2002), “Ambiguity, Risk, and Asset Payoffsin Continuous Time,” Econometrica, 70, 1403–1443.
Cornell, Bradford (2013), “What Moves Stock Prices? Another Look,” Journal ofPortfolio Management, 39(3), 32–38.http://www.iijournals.com/doi/abs/10.3905/jpm.2013.39.3.032
Das, Sanjiv and Mike Chen (2007), “Yahoo for Amazon: Opinion Extraction fromSmall Talk on the Web,” Management Science, 53(9), 1375–88.http://pubsonline.informs.org/doi/abs/10.1287/mnsc.1070.0704
Davis, Angela K., Jeremy M. Piger, and Lisa M. Sedor (2006), “Beyond theNumbers: An Analysis of Optimistic and Pessimistic Language in Earnings PressReleases,” Working Papers 2006–005, Federal Reserve Bank of St. Louis.http://ideas.repec.org/p/fip/fedlwp/2006-005.html
www.economics-ejournal.org 45

conomics: The Open-Access, Open-Assessment E-Journal
Demers, Elizabeth and Clara Vega (2010), “Soft Information in Earnings An-nouncements: News or Noise?” Working Paper, INSEAD.http://www.insead.edu/facultyresearch/research/doc.cfm?did=44292
Driffill, John and Martin Sola (1998), “Intrinsic Bubbles and Regime-Switching,”Journal of Monetary Economics, 42(2), 357–373.https://ideas.repec.org/a/eee/moneco/v42y1998i2p357-373.html
Engelberg, Joseph (2008), “Costly Information Processing: Evidence fromEarnings Announcements,” AFA 2009 San Francisco Meetings Paper. Available atSSRN: http://ssrn.com/abstract=1107998.
Fair, Ray C. (2002), “Events that Shook the Market,” Journal of Business, 75(4),713–731.http://ideas.repec.org/a/ucp/jnlbus/v75y2002i4p713-732.html
Fama (2014), “Two Pillars of Asset Pricing,” American Economic Review, 104(6),1467–1485.http://tasmania.ethz.ch/images/4/45/Fama-Nobel-work2014.pdf
Frydman, Roman and Michael D. Goldberg (2015), “A New Rational ExpectationsHypothesis: What Can Economists Really Know About the Future?” paperprepared for the Institute for New Economic Thinking 2015 Plenary conference,“Liberté, égalité, fragilité,” April 8–11, 2015, Paris, France.
Frydman, Roman and Michael D. Goldberg (2011), Beyond Mechanical Markets:Asset Price Swings, Risk and the Role of the State, Princeton, NJ: PrincetonUniversity Press.
Frydman, Roman and Michael D. Goldberg (2007), Imperfect Knowledge Eco-nomics: Exchange Rates and Risk, Princeton, NJ: Princeton University Press.
www.economics-ejournal.org 46

conomics: The Open-Access, Open-Assessment E-Journal
Frydman, Roman, Michael D. Goldberg, and Nicholas Mangee (2015), “NewEvidence for the Present-Value Model of Stock Prices: Why the REH VersionFailed Empirically,” Institute for New Economic Thinking Working Paper, No. 2,March.http://ineteconomics.org/ideas-papers/research-papers/new-evidence-for-the-present-value-model-of-stock-prices-why-the-reh-version-failed-empirically
Gutiérrez, Maria José and Jesús Vázquez (2004), “Switching Equilibria: ThePresent Value Model for Stock Prices Revisited,” Journal of Economic Dynamicsand Control, 28, 2297–2325.http://www.sciencedirect.com/science/article/pii/S0165188903002082
Hamilton, James D. (1994), Time Series Analysis, Princeton, NJ: PrincetonUniversity Press.
Hamilton, James D. (1989), “A New Approach to the Economic Analysis of Non-stationary Time Series and the Business Cycle,” Econometrica, 57(2), 357–384.http://ideas.repec.org/a/ecm/emetrp/v57y1989i2p357-84.html
Hansen, Lars Peter (2014), “Uncertainty Outside and Inside Economic Models,”NBER Working Paper, No. 20394.http://www.nber.org/papers/w20394
Hansen, Lars Peter and Thomas J. Sargent (2008), Robustness, NJ: PrincetonUniversity Press.
Kahneman, Daniel and Amos Tversky (1979), “Prospect Theory: An Analysis ofDecision Under Risk,” Econometrica, 47(2), 263-291.http://www.princeton.edu/ kahneman/docs/Publications/prospect_theory.pdf
www.economics-ejournal.org 47

conomics: The Open-Access, Open-Assessment E-Journal
Kaminsky, Graciela (1993), “Is There a Peso Problem?: Evidence from theDollar/Pound Exchange Rate, 1976-1987,” American Economic Review, 83(3),450–472.http://www.jstor.org/stable/2117528?seq=1
Keynes, John M. (1936), The General Theory of Employment, Interest and Money,Harcourt, Brace and World.
Knight, Frank H. (1921), Risk, Uncertainty and Profit, Boston: Houghton Mifflin.
Li, Feng (2010), “Textual Analysis of Corporate Disclosures: A Survey of theLiterature,” Journal of Accounting Literature, 29, 143–165.http://webuser.bus.umich.edu/feng/LI
Lucas, Robert E. Jr. (1995), “The Monetary Neutrality,” The Nobel Lecture,Stockholm: The Nobel Foundation.
Lucas, Robert E. Jr. (2001), “Professional Memoir,” mimeo: http://home.uchicago.edu.
Mangee, Nicholas (2014), “Stock Prices, the Business Cycle and ContingentChange: Evidence from Bloomberg News Market Wraps,” Economics Bulletin,34(4), 2165–2178.http://ideas.repec.org/a/ebl/ecbull/eb-14-00791.html
Mangee, Nicholas (2011), “The Long Swings Puzzle in Equity Markets: WhichWay Forward?,” Ph.D. Dissertation, University of New Hampshire.
McQueen, Grant and V. Vance Roley (1993), “Stock Prices, News and BusinessConditions,” The Review of Financial Studies, 6(3), 683–707.http://www.jstor.org/stable/2961983?seq=1
www.economics-ejournal.org 48

conomics: The Open-Access, Open-Assessment E-Journal
Muth, John F. (1961), “Rational Expectations and the Theory of Price Movements,”Econometrica, 29(3), 315–35.http://www.fep.up.pt/docentes/pcosme/S-E-1/se1_trab_0910/se1.pdf
Pearce, Douglas K. and V. Vance Roley (1985), “Stock Prices and EconomicNews,” Journal of Business, 58(1), 49–67.http://www.jstor.org/stable/2352909?seq=1
Pettenuzzo, Davide and Allan Timmermann (2011), “Predictability of StockReturns and Asset Allocation under Structural Breaks,” Journal of Econometrics,164(1), 60–78.http://ideas.repec.org/a/eee/econom/v164y2011i1p60-78.html
Sargent, Thomas J. (2005), “An Interview with Thomas J. Sargent,” by Evans,George W. and Seppo Honkapohja, Macroeconomic Dynamics, 9, 561–583.
Shiller, Robert J. (1981), “Do Stock Prices Move Too much to Be Justified bySubsequent Changes in Dividends?,” American Economic Review, 71, 421–436.http://www.aeaweb.org/aer/top20/71.3.421-436.pdf
Shleifer, Andrei (2000), Inefficient Markets, Oxford: Oxford University Press.
Sullivan, Peter (2013), “What Drives Exchange Rates? Do Fundamentals Matter?,”Working Paper.
Tetlock, Paul C. (2007), “Giving Content to Investor Sentiment: The Role ofMedia in the Stock Market,” Journal of Finance, 62(3), 1139–1168.
Tetlock, Paul C., Maytal Saar-Tsechansky and Sofus Macskassy (2008), “MoreThan Words: Quantifying Language to Measure Firms’ Fundamentals,” Journal ofFinance, 63(3), 1437–1467.http://onlinelibrary.wiley.com/doi/10.1111/j.1540-6261.2008.01362.x/abstract
www.economics-ejournal.org 49

conomics: The Open-Access, Open-Assessment E-Journal
Tuckett, David, Paul Ormerod, Rickard Nyman and Robert Elliot Smith (2015),“Information and Economics: A New Way to Think About Expectations and toImprove Economic Prediction,” paper presented at the Institute for New EconomicThinking 2015 Plenary conference, “Liberté, égalité, fragilité,” April 8–11, 2015,Paris, France.
www.economics-ejournal.org 50

Please note:
You are most sincerely encouraged to participate in the open assessment of this article. You can do so by either recommending the article or by posting your comments.
Please go to:
http://dx.doi.org/10.5018/economics-ejournal.ja.2015-24
The Editor
© Author(s) 2015. Licensed under the Creative Commons Attribution 3.0.