failure analysis of polyvinylidene fluoride by …
TRANSCRIPT

FYP - DISSERTATION
FAILURE ANALYSIS OF POLYVINYLIDENE
FLUORIDE BY DEGRADATION FOR A PIPELINE
By
ARIFF QAMARUDDIN
BIN RAZAK 22741
Dissertation submitted in partial fulfilment of the requirements
for the Bachelor of Engineering (Hons) Mechanical Engineering
January 2020
Universiti Teknologi Petronas
32610 Bandar Seri Iskandar
Perak Darul Ridzuan

I
CERTIFICATION OF APPROVAL
FAILURE ANALYSIS OF POLYVINYLIDENE
FLUORIDE BY DEGRADATION FOR A PIPELINE
by
Ariff Qamaruddin bin Razak
22741
A project dissertation submitted to the
Mechanical Engineering Programme
Universiti Teknologi PETRONAS
in partial fulfilment of the requirement for the
BACHELOR OF ENGINEERING (Hons)
(MECHANICAL)
Approved by,
Dr. Norlin binti Nosbi
UNIVERSITI TEKNOLOGI PETRONAS
BANDAR SERI ISKANDAR, PERAK
January 2020

II
________________ Ariff azak
CERTIFICATION OF ORIGINALITY
This is to certify that I am responsible for the work submitted in this
project, that the original work is my own except as specified in the
references and acknowledgements, and that the original work contained
herein have not been undertaken or done by unspecified sources or
persons.
ARIFF QAMARUDDIN BIN RAZAK

III
ABSTRACT
This present paper describes how polyvinylidene fluoride combats
corrosion issue in pipeline of oil and gas industry. This study is crucial
due to limited studies have been made upon polyvinylidene fluoride as a
material for pipeline to prove its reliability and sustainability in the
industry. Polyvinylidene fluoride will be tested upon its degradation over
time. Tests will be executed upon the specimens of this material to prove
that polyvinylidene fluoride has the better properties and favor compared
to conventional materials in pipeline which are stainless and carbon steel.
Upon this, the specimens of polyvinylidene fluoride will undergo tests
to observe its water and chemical absorption at various parameters.
Every samples of polyvinylidene fluoride will be tested upon its weight.
This will show whether polyvinylidene fluoride is reliable due to its
absorption rate. Study of this material will beneficial to oil and gas
industry in future upon the reliability of polymers to sustain in oil and gas
industry.
IV
ACKNOWLEDGEMENT
Every student’s project owns debt to their predecessors to their teachers,
friends and their parents. I gratefully acknowledge my deep indebtedness
to all of these.
The present work is an effort to throw some light on “FAILURE
ANALYSIS OF POLYVINYLIDENE FLUORIDE BY
DEGRADATION FOR A PIPELINE”. The work would not have been
possible to come to the present shape without the able guidance,
supervision and help to me by number of people.
With deep sense of gratitude, I acknowledged the encouragement and
guidance received by Dr. Norlin binti Nosbi. I also convey my heartfelt
affection to Mr. Mohd Jamalulhaq bin Mohd Pu’ad who helped and
supported me during the completion of my thesis.
I am also thankful to all my friends and all the staffs of University
Teknologi Petronas, who helped me a lot directly and indirectly.
V
TABLE OF CONTENT
CERTIFICATION OF APPROVAL……………………………………………. I
CERTIFICATION OF ORIGINALITY………………………………………… II
ABSTRACT………………………………………………..…………………… III
ACKNOWLEDGEMENT……………………………………............................. IV
CHAPTER 1: INTRODUCTION
1.1 Background of Study………………………...………………
1.2 Problem Statement……………………………...……………
1.3 Objective……………………………………………………..
1.4 Scope of Study…………………………………...…………..
1
3
4
4
CHAPTER 2: LITERATURE REVIEW
2.1 Overview………………………………………..……………
2.2 Materials of Pipeline……………………….............................
2.3 Corrosion in Pipeline…………………………………………
2.4 Non-Metallic Material in Pipeline……………...…………….
2.5 PVDF Application……………………………………………
2.6 Study of PVDF in Pipeline Application……………………...
6
7
8
9
10
12
CHAPTER 3: METHODOLOGY
3.1 Material………………..............................................................
3.2 Water Absorption Test…………………………..…………….
3.3 Chemical Exposure Test…………………………..……….….
3.4 Process Flow…………..............................................................
3.5 Project Milestone & Gantt Chart……………..……………….
14
15
18
22
23
CHAPTER 4: RESULTS & DISCUSSION
4.1 Immersion Test……………………………..............................
4.1.1 Distilled Water Immersion………………….……….….
4.1.2 Seawater Immersion……………………….……………
4.2 Chemical Exposure Test……....................................................
4.2.1 Nitric Acid Immersion….................................................. 4.2.2 20 Bar of CO2 at 25 °C Exposure………………..….…... 4.2.3 1 Bar of CO2 at 25 °C Exposure………………..….……. 4.2.4 20 Bar of CO2 at 60 °C Exposure………………...……...
4.3 Shapes, Size and Angle……………………………………..…
4.3.1 Post Test Samples………………...…………….……….
4.4 Project Limitations…………………………………………….
25
25
27
29
29
31
32
34
35
36

VI
CHAPTER 5: CONCLUSION & RECOMMENDATIONS
5.1 Conclusion……………………………………….……….…....
5.2 Recommendations……………………………….………….....
38
39
REFERENCES………………………………………………………………….. 40

VII
LIST OF FIGURES
Page
3.1 Samples Processed of PVDF 14
3.2 The Measurement of PVDF Samples 15
3.3 Samples of PVDF in Container 16
3.4 PVDF Samples Immersed in Distilled Water, Seawater and Nitric Acid 19
3.5 PVDF Samples in Hydrocarbon and Distilled Water Mixture 20
3.6 Pressure Vessel and Autoclave Machine Used for The Test 21
3.7 Process Flow of the Study 23
4.1 Weight Reading of PVDF in Distilled Water 26
4.2 Weight Reading of PVDF in Seawater 27
4.3 pH Reading of Seawater 28
4.4 Weight Reading of PVDF in Nitric Acid 10% Concentration 30
4.5 Weight Reading of PVDF Samples in CO2 Exposure 31
4.6 Weight Reading of PVDF Samples in CO2 Exposure 33
4.7 Weight Reading of PVDF Samples in CO2 Exposure 34
4.8 The Measurements of the Post Test PVDF Samples 35
VIII
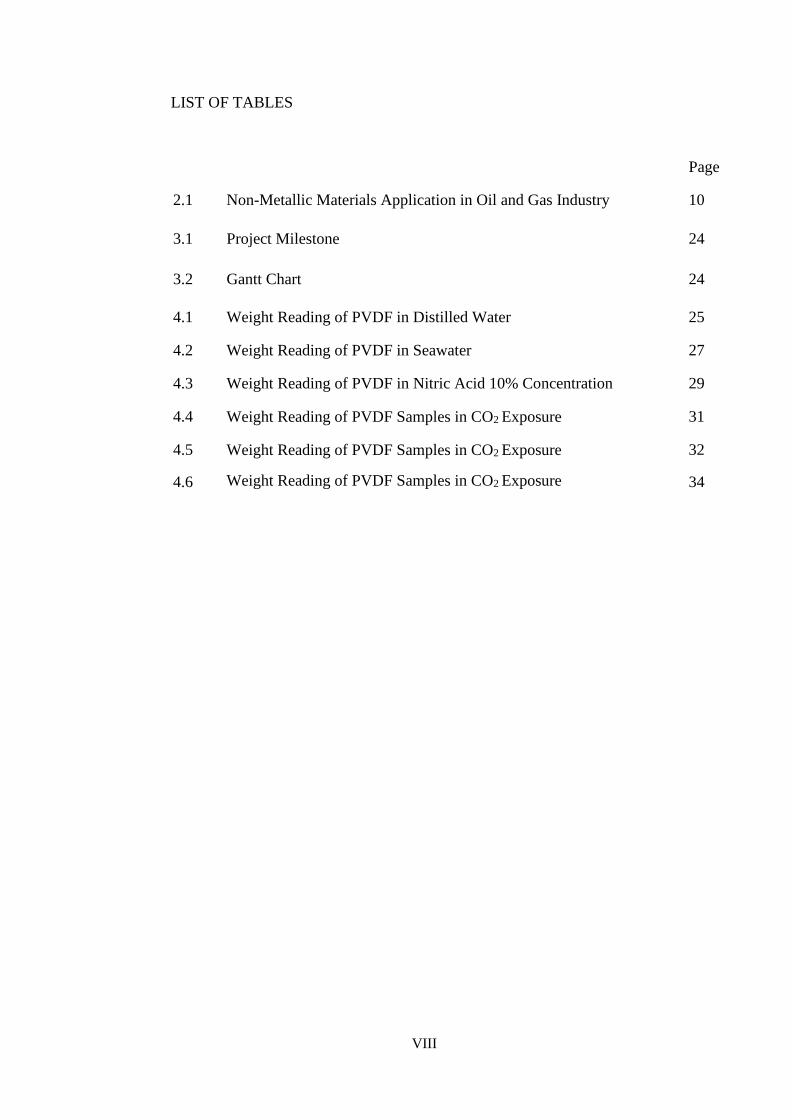
LIST OF TABLES
Page
2.1 Non-Metallic Materials Application in Oil and Gas Industry 10
3.1 Project Milestone 24
3.2 Gantt Chart 24
4.1 Weight Reading of PVDF in Distilled Water 25
4.2 Weight Reading of PVDF in Seawater 27
4.3 Weight Reading of PVDF in Nitric Acid 10% Concentration 29
4.4 Weight Reading of PVDF Samples in CO2 Exposure 31
4.5 Weight Reading of PVDF Samples in CO2 Exposure 32
4.6 Weight Reading of PVDF Samples in CO2 Exposure 34

IX
LIST OF EQUATION
Page
3.1 Increase in Weight Percentage 17
1
CHAPTER 1
INTRODUCTION
1.0 Background of Study
Corrosion exists as one of the issues that revolves in oil and gas industry.
Oil and gas pipelines, refineries and petrol chemical plants often face serious
corrosion problems. This is due to the present of water, carbon dioxide, and
hydrogen sulfide. Furthermore, this issue may be aggravated by
microbiological activity. The most crucial issue that influences corrosion
rate is the multiphase fluids flow regimes. These conditions may be
explained when at high flow rate, erosion-corrosion and flow-induced
corrosion will occur, whereas at low flow rate, usual corrosion that has been
found in pitting corrosion. Generally, corrosion is very related to the nature
and amount of the sediments. This is due high-velocity flow is capable to
sweep the sediment out of the pipeline. As for low velocity will allow
sediments to settle at the bottom which provides sites for pitting corrosion
to occur. This process will occur in any facilities that are available in this
industry.
Corrosion is integral difficulty to be handled. There are three areas in
which corrosion are critical which are economical concern, safety issues and
resources conversations. Those leakages of hazardous supplies from a
transport pipeline have the possibilities for serious and hazardous
environmental impact, and fatalities to mankind. While pipelines are
designed and developed to preserve their integrity, several factors such as
corrosion may also make it challenging to maintain away from the incidence
of leakage in a pipeline in the direction of its lifetime. On the specific hand,
this facility needs to endure the danger of failure since it may face defects
due to corrosion, erosion or fatigue due to fluctuating strain or temperature.
Although pipeline on its safety concern has been enhancing over time, and
2
human casualties, property loss, and environmental damage resulting from
pipeline incidents are infrequent, but when they do show up the penalties
may additionally be severe. For example, a 1999 liquid pipelines incident
that occur in Bellingham, Washington, resulted in the launch of 277,000
gallons of fuel into a pass to the center of the town. This incident had
precipitated three fatalities and injuring eight (Sosa & Alvarez-Ramirez,
2009).
Since the economic loss in the industry is extremely high, thus
combating corrosion is very essential. There are various methods that are
applicable supported with scientific studies to combat corrosion. Upon the
methods, the use of corrosion inhibitor is one of the best and economical
methods. It is broadly classified into anodic, cathodic or mixed corrosion
inhibitor due to various types of corrosion inhibitors. In addition, they are
also classified based on their chemical nature such as organic and inorganic
inhibitors. The mechanism of this method is based on its capability upon
chemical adsorption of the inhibitor on the metal surface and forms a
protective thin film. This protects the underlying metal from corrosion. It
also will lead to increase the potential of the metal surface. This is due to
the metal enters the passivation region where a natural protective oxide film
will form. Thus, the inhibitor may react with the corrosive component and
remove it from the media (Rahuma & Kannan, 2014).
From the studies that have been made in recent years, the findings have
proven that corrosion only can be delayed by decreasing the corrosion rate.
These solutions are not capable to stop corrosion from occurring. This
aspect is very crucial in pipeline due to this facility is used to transport crude
oil and end products. Pipeline exists to connect refineries, terminal to the oil
tanker ship and this will include distances and exposure to various
environments. Most of the pipelines are fabricated from steel specifically
carbon steel. Due to material selection, corrosion may occur due to
electrochemical process that requires the simultaneous presence of moisture
3
and oxygen. Thus, the present paper brings the idea by minimalizing
corrosion by substituting the conventional materials to polymer and study
its degradation. Polyvinylidene fluoride (PVDF) will be the subject for this
study. This material is a semi-crystalline polymer that has been widely
studied for its piezoelectric properties. This is due to its polar β phase.
Besides that, the polar phase α, is also studied for its structural applications
which yields the result to prove PVDF exhibits good mechanical properties
and chemical resistance. The mechanical properties of this material have
been studied by many authors, focusing on its analyzation of the
macroscopic tensile and creep behavior over several strain decades and over
temperature at large range (Challier et al., 2010). Nevertheless, upon the
studies have been made before, the studies regarding the application of
PVDF as pipeline are very limited since this material is widely used as
piezoelectric in electrical appliances. Thus, the findings cannot prove the
reliability of the material.
As conclusion, by this study of PVDF degradation, it is a hope for many
studies will be made for corrosion issue. With these studies and researches,
it holds the hope for future to combat corrosion in a better and efficient ways
since corrosion is inevitable and may cause harm to mankind and
environment.
1.2 Problem Statement
Corrosion is a very crucial to oil and gas industry since it may affect the
asset reliability of a company since this issue in inevitable. Thus, it must be
handled wisely by the engineers to ensure that the facilities may operate for
a long time without having severe issue of corrosion. This study will mainly
focus on corrosion in pipelines. This facility is widely fabricated by steel
such as carbon steel and stainless steel. Over time, these materials may face
corrosion and erosion due to the electrochemical reactions and flow of the
4
liquid inside the pipelines where foreign particles may exist and affect their
surfaces and resulting pitting which lead to thinning of the pipelines wall.
This study will be beneficial in the study of polymers in oil and gas
industry. By having this substitution, corrosion might be minimal since
there is no electrochemical process occurs and engineers will deal with
degradation of the materials. PVDF has been claimed on its capabilities
to substitute the application of metals in pipelines since the material is a
thermoplastic that has properties of the ease of fabrication, good welding
properties and high mechanical strength. Other than that, this material is
also excellent in chemical resistant and high operating temperature. Due
to limited studies have been made and lack of evidence to prove its
reliability, thus is it wise for polymers specifically PVDF to be fabricated
as pipelines to combat corrosion issue that revolves in this field?
1.3 Objective
To investigate PVDF degradation upon its claim by manufacturers to
have excellent properties to combat corrosion and erosion by testing the
material according to the parameters that are available in the environment
of oil and gas.
1.4 Scope of Study
This study is designed to investigate PVDF alongside its characteristic and
behavior. The intent of this study is to prove that PVDF is reliable to be
applied for pipeline facilities in oil and gas industry. To obtain the results,
tests will be conducted upon this material. The samples of PVDF will be

5
complied upon American Society for Testing and Material (ASTM)
standards. Those samples will be tested in liquid and gas environment. For
liquid, PVDF will be exposed to different pH level; distilled water for
neutral pH, acidic solution and seawater depending on its pH level. For
gases, PVDF will be tested with carbon dioxide, CO2. The intent of these
tests observes the degradations and moisture absorption of this material
when being expose to these environments.
6
CHAPTER 2
LITERATURE REVIEW
2.1 Overview
In the oil and gas industry, pipelines hold a huge role in the distribution
of oil and gas. About 60 countries have about 2000 km of pipelines
worldwide. Furthermore, it is estimated 10,000 km of new pipeline are
planned to be installed in this decade which in 2005, it has cost $27 billion
for 2500 km pipelines (Deffeyes, 2012). Pipeline may be fabricated in
small or large size as it exists from 152.4 to 1219.2 mm in diameter. Most
of these facilities are located underground and some of them are above
the ground, such as pump stations. Pipelines network has been set up in
Malaysia along this country for 2500 km. Malaysia has a small network
of oil and gas pipelines, and tankers and trucks still rely on this state.
Offshore oil fields Peninsular Malaysia are linked by the main oil
pipelines to onshore storage and terminal facilities. It runs and finishes at
the Kerteh plant in Terengganu from the Tapis pipeline. This also refers
to the oil pipeline of Sabah and Sarawak, where the pipelines connect
offshore with the Labuan and Bintulu oil terminals. An international oil
pipeline operates from the Dumai oil refinery in Indonesia to the Melaka
oil refinery and is an interconnecting oil product pipeline running from
the Melaka refinery to the Klang Valley Distribution Terminal (KVDT)
via Shell's Port Dickson refinery. This pipeline will be linked to the
Pengerang Refinery launched by ARAMCO and Petronas in the latest
development (Sovacool, 2011). There are wide range of products that
exist in liquid tank. From onshore and offshore field, crude oil may be
obtained as these crude lines will be transported to ports. Other than that,
this oil is also being transferred to interconnecting point and refineries.
Crude oil can be imported or imported domestically depending on its
demand and suitability of its sulphur content. In addition, refined products
such as gasoline, automotive diesel oil, kerosene and naphthalene also
7
form part of the pipeline market. However, the pipeline also carries
liquified natural gas (LNG) and liquified petroleum gas (LPG) and
propane and all these gasses at normal temperature and pressure, but they
are easily liquified when the pressure is applied (Pharris & Kolpa, 2012).
Hence, this proves that pipelines play a big role in the oil and gas industry
and they are a part of asset reliability that needs to be sustained.
2.2 Material of Pipeline
Most of the pipelines are using steel pipe to transport hydrocarbon. Most
widely fabricated are stainless steel and carbon steel pipe. They are
manufactured by accordance of the specifications of the American
Petroleum Institute (API 1994, 2000). Furthermore, the American Society
of Mechanical Engineers (ASME), the American National Standards
Institute (ANSI) and the ASTM are being used as guidance too in
manufacturing pipelines (Pharris & Kolpa, 2012). Due to this nature,
corrosion is unavoidable since these materials contact with the crude oils,
natural gas, petroleum products and environments. Crude oil has a
complicated chemistry and it includes many factors that influencing its
corrosiveness. These problems are hard to predicted since crude oil has
different physicochemical composition. Total acid number (TAN), which
includes total sulphur content, air, salt, and microorganisms, is normally
classified as corrosiveness of crude oil. In different ways and phases, the
application of these parameters and components affects corrosion. In
instances, chemical compound such as hydrogen sulfide, H2S and
alkanethiols are corrosive to carbon steel. This will cause iron sulphide scale
occurs. In addition, due to acid oxidation in this case, H2S, which makes gas
sour, this issue may cause general and pitting corrosion and hydrogen attack.
Appear as latter blisters and cracks, H2S can be released by cracking and
can cause death when exposed to the atmosphere. Upon carbon dioxide,
CO2, the existence of this chemical is not corrosive when it is dry. But it can
8
form carbonic acid, H2CO2 when it dissolves in air, and this compound is
very water- corrosive. Furthermore, corrosion also can be induced through
the presence of oxygen, O2. Due to its activity under atmospheric pressure,
this condition may occur, and air may enter the device during leakage or
opening valve, which may cause corrosion. When reacting with
hydrocarbon at high-temperature adsorption bed with water formation, the
presence of O2 in corrosion can result in pitting and affecting Stress
Corrosion Cracking (SCC).
2.3 Corrosion in Pipeline
In Malaysia, it has been discovered that hydrogen sulfide, H2S concentration
and carbon dioxide, CO2 are very high. These corrosive agents do encourage
corrosion to develop in pipelines (Sass et al., 2015). A sum of $600 million
was estimated to be spent annually in the oil and gas industry to fix and
maintain corroded pipelines due to corrosion. Corrosion could cause huge
economic costs and enormous damage to health, security and the
environment without proper mitigation (Yuan et al., 2016). Corrosion may
happen during the transportation of gas in pipelines where the water vapor
will condense as the gas cools. This will lead CO2 to dissolved in water and
decrease the pH to 4. In some occasions, liquid water remains as thin layer
on the inner surface of the upper part of pipe. As a result, it will cause severe
localized corrosion. Shallow pits will form, and they will be accumulated
with sharp surface areas. This occurrence happens when there is heat
exchanged between the pipe and the cold environment such as seawater
when the pipe is not thermally insulted. Since corrosion will lead to severity
such as leakage which may bring harm to environments and mankind,
mitigations must be taken. For H2S, injection of H2S scavengers and
corrosion inhibitors which come from organic and cement coating and
choosing the suitable alloy according to the standards may help in
preventing SCC. For sweet corrosion, passive black film iron carbonate,
FeCO3 is formed under particular condition on the carbon steel surface and
9
low-allow steel (to 9% Cr) may protect from corrosion but due high velocity
stream and stresses, the protective iron carbonate may break. Thus, the
effective to mitigate is by using martensitic stainless steels (>12% Cr) and
caustic injection in controlled pH.
In corrosion that induced by oxygen, this chemical element must not
exceed 10 ppmV. Despite this, presence of oxygen is crucial to keep
protective oxide films. For wholesome corrosion cases, to mitigate,
corrosion allowance addition is important to the thickness of the wall during
design. Moreover, water vapor must be removed in natural gas and thermal
insulation on the tube surface needs to be implemented. Other than that,
thick organic coatings, vapor corrosion inhibitors and injection of corrosion
inhibitors may help in preventing corrosion. Lastly, periodic cleaning using
pigs is crucial in accordance to the inspection plan (Pharris & Kolpa, 2012).
According to the "In-Line Inspection Systems Qualification Standard" API
1163, pigging is defined as a system driven through a pipeline for various
internal activities (depending on the type of pig) such as fluid separation,
cleaning or pipeline inspection. This method is applied to clean the pipeline
while locating any wall thinning occurs along the pipeline. Thus, according
to API 570 for pipelines standards and inspections, mitigation action can be
taken by cut and replace the pipelines that are affected by corrosion. In
conclusion, these problems have been revolved in this industry for decades,
thus latest technology and knowledge must be implied to sustain the
business for future concern.
2.4 Non-Metallic Material in Oil and Gas
Technology has been evolved over the years and it affects oil and gas
industry. The implementation of newest technology does help the
10
equipment to have a longer lifespan since technology may combat
corrosion issues. For decades, metals have been used for every equipment
in this industry which will cause corrosion in long term usage. Thus,
evolving technology has introduced oil and gas industry with non-
metallic material options. From the studies have been made, the presence
of non-metallic materials is also available worldwide. They have been
applied in various facilities in the industry, in onshore and offshore as
provided in Table 2.1.
TABLE 2.1. Non-Metallic Materials Application in Oil and Gas Industry
Non-Metallic Place Reference
Hydrogel polymer in
enhance oil
recovery (EOR)
Offshore (Abidin et al., 2012)
Polyethylene
coating
Pipeline (Samimi & Zarinabadi,
2011)
Cross-linked polyethylene
cable
insulation
Submersible
pumps in oil and
gas wells
(Livingston et al., 2014)
Reinforced
Thermoplastic Pipe in Saudi
Aramco
Sour wells (Bin Ziad et al., 2018)
2.5 PVDF Application in Pipeline
Since the application of steels in pipelines will lead to corrosion due to
its nature under any circumstances, the substitution of metals with
PVDF would be a better substitute as it has better properties based on
the claims made by ARKEMA.

11
PVDF is a semi-crystalline polymer with an extended zigzag chain
with a crystallinity of 35-70%. Consisting of PVDF that have insertion
from head-to-tail, but there are also head-to-head and tail-to-tail defects.
These may affect the houses with the crystallinity and PVDF itself. This
fluoropolymer has several transitions and changed its own density for
every polymorphic condition. Currently, there are five known states, α,
β, γ, δ and ε. The most common phase that exists is α-PVDF with −70 °
C, −38 ° C(β), 50 ° C (α') and 100 ° C (α') transitions.
Moreover, PVDF holds the characteristic that avoids most natural
and inorganic chemical substances as opposed to chlorinated solvents.
This will cause solid bases, amines, esters, and ketones attack this resin.
In these conditions- based solvents, the stage of influence from swelling
to complete dissolution. A wide range of polymers are compatible with
PVDF. Commercially PVDF possesses the ability to blend with acrylic
and methacrylic. As a result of radiation exposure, PVDF basically
interlinks as ethylene tetrafluoroethylene (ETFE). Radiation from
gamma rays will affect the mechanical residences of PVDF (Ebnesajjad,
2012).
In Prevent Corrosion's PVDF paper, PVDF is defined as a
thermoplastic that characterized by its ease of processing, better welding
properties, and good heat formability from other polymers. PVDF also
has high mechanical strength at 35-55 MPa and possessed an excellent
chemical resistance. It holds the capabilities for high operating
temperatures at 120 °C. Other than that, this polymer is good as
ultraviolet and gamma radiation resistor which makes PVDF has the
characteristic of ageing resistance. Furthermore, this polymer can be
designed and combined with any flanges, threaded and mechanical
connections (Palovcak & Pomante, 2018).

12
Amid excellent claims regarding PVDF, it has not been developed for
pipelines in the oil and gas industry. This study therefore intends to
investigate PVDF and its degradation when exposed to the environment of
oil and gas. While PVDF has great properties, it also suffers from several
limitations. This is due to the free volume that presents in PVDF matrix. As
results, PVDF will show membrane (selective barrier) characteristics (Goh
et al., 2017). Such undesirable properties can result in the corroding agents
being quickly penetrated for corrosion (Das & Prusty, 2013). To improve its
anti-corrosion properties, nanofillers has been suggested. This process
happens by reducing the pressure of contact and wettability. In addition, it
will decrease water penetration and corrosive by increasing the tortuous
pathway. Other than that, nanofillers also make the surface roughness
become lower. This is good for the characteristic of being water and oil
repellence (Nazari & Shi, 2016).
2.6 Study of PVDF in Pipeline Application
The study that has been made for PVDF is regarding the damage and
fracture of unplasticized PVDF at 20 °C to applied for pipeline studies.
The material has been studied by using different test geometries.
Mechanical tests that have executed indicate that damage is essentially
caused by void growth. Furthermore, the model has been observed to
have instability on Double-Edge-Notched Tensile Specimen (DENT)
which increases the stress and strains rates. This factor will trigger brittle
fracture (Challier et al., 2010). The study may be helpful in the present
paper to be guidance, but the limitation sets when the material used in
the study is unplasticized PVDF. Thus, the constraints are different to
the material that is used in present paper.
Despite having good reputation claimed by manufacturers, PVDF
does not have established studies in application in pipelines. This material
13
is widely used as a material in sensors due to its piezoelectric features.
PVDF application as coating has shown its weakness due to its free
volume in its matrix which allows corrosion to occur (Jing, 2017). Thus,
the present paper holds the aim to prove the capabilities of PVDF
application in pipelines. Tests and experiments will be conducted
according to ASTM standards. This material will be tested upon its
degradation to enlighten its reliability when it is being exposed to the
simulated environments in the industry.
In conclusion, oil and gas industry has an unavoidable issue such as
degradation. Therefore, by having this study, it is a hope that PVDF may
be a better substitution for metals upon its excellent properties. Since
PVDF may avoid ageing issue, this thermoplastic since it may save cost,
manpower and any unexpected incident which may cause fatalities and
injury.

14
CHAPTER 3
METHODOLOGY
3.1 Material
In this paper, PVDF had been processed according to ASTM D638: Standard
Test Method for Tensile Properties of Plastics. The samples were processed
according to the Type V of dog bone shape in the standard. Due to
unavailability of facilities in the campus, the samples had been cut using
manual notching machine that was available in Block 21, UTP. Due to the
constraints, the samples could not be cut into dog bone shape. As results, the
samples had been cut into rectangular shape as shown in Figure 3.1. The
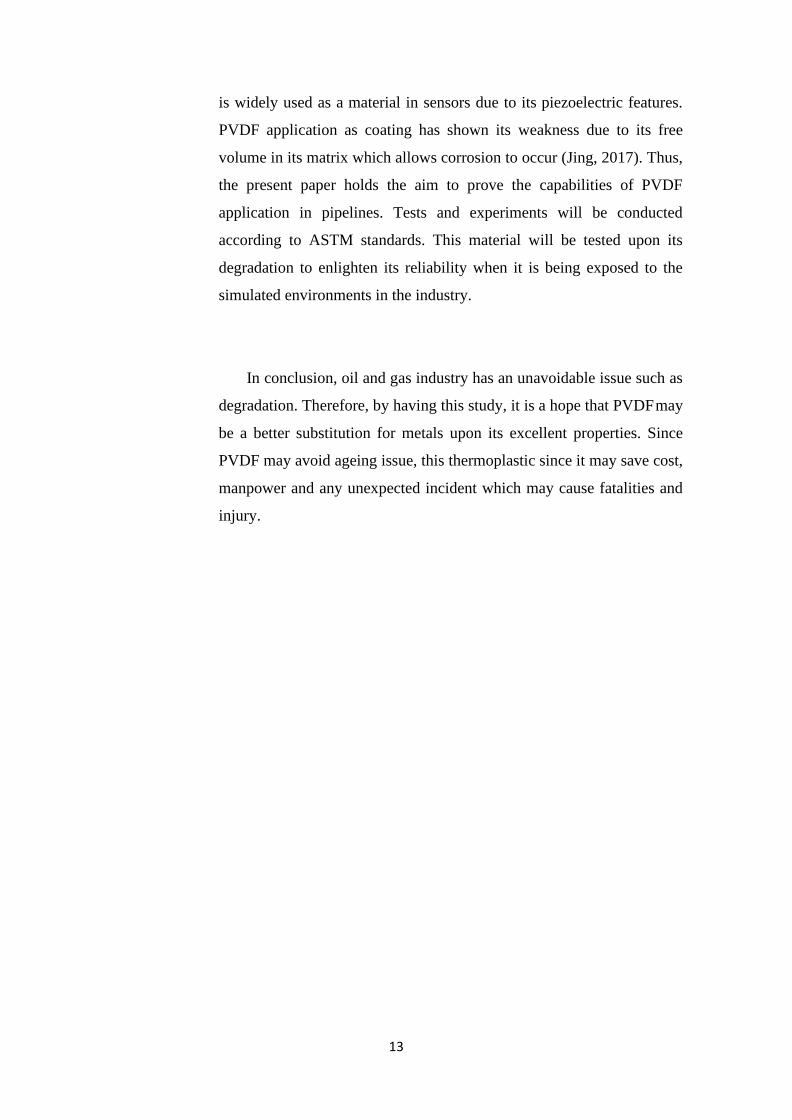
measurement of the samples was 63.5 mm in length and 3.18 ± 0.5 mm in
width as shown in Figure 3.2. The samples were processed from 1 m2 sheet
to specified measurement according to the standard in three days. 50 samples
altogether had been processed to undergo the test as planned.
CO2 Samples Seawater Samples
Distilled Water Samples Nitric Acid Samples
FIGURE 3.1. Samples Processed of PVDF
15
FIGURE 3.2. The Measurement of PVDF Samples
3.2 Water Absorption Test
In accordance of ASTM D570 for Standard Test Methods for Water
Absorption of Plastic
This method would be tested upon submerged specimens in water in
order to determine the water absorption relative level. This technique
would be applied to examine plastics in all forms. This includes finished,
hot-molded and cold-molded resin products. Laminated and homogenous
plastics in rod and tube form and 0.13 mm (0.005 in.) or greater thickness
plates was also applied. This standard also held two main focus:
1. As data on the proportion of water absorbed by a component, and
consequently in such cases where the relationship between moisture and
electrical or mechanical properties, measurements or appearance has
been established as a guide to the effects of water exposure or wet
preconditions on such properties.
2. As a deceptive test on a product's uniformity. This second feature
refers to plate, pipe, and tube fingers when testing on the finished product.
The moisture content of a plastic material was closely associated
with residences such as resistance to electrical insulation, dielectric

16
losses, mechanical power, shape, and dimensions. The effect of water
absorption on these properties was generally based on the type of
exposure. This would include immersion in water or by way of exposing
to excessive humidity. Such immersion experiments will be performed
by using distilled water and seawater. Seawater was collected from Teluk
Batik Beach, Lumut which was located in Perak at the coordinate of
4.1879° N, 100.6069° E. The samples were kept in the containers as
shown in Figure 3.3.
FIGURE 3.3. Samples of PVDF in Container
Procedure
Long-Term Immersion
The samples should be tested in order to determine the maximum water
consumed when thoroughly soaked, cleaned the moisture with a dry cloth,
immediately measured to the nearest 0.001 g and then put into the liquid.
The test had been conducted for two weeks. The weighing had been
repeated every day in the first week. It had proceeded by repeating every
four days during the second week. The test had been indicated by three
consecutive weighing, averages less than 1 % of the total weight expansion
or 5 mg, whichever is higher; the sample shall then be considered to be
substantially saturated. Once considerably saturated, the difference between
the significantly saturated weight and the dry weight is known as the water
absorbed. 10 samples of PVDF were prepared and kept in containers for this
17
test. Five of the samples were immersed and soaked in distilled water while
the others were immersed and soaked in seawater.
Calculation
The record had been included the values for each specimen, as follows,
and the common values for the specimens:
a. The test samples measurement was 63.5 mm in length with 3.18 ± 0.5
mm in width in accordance of ASTM D638.
b. The test had been executed for two weeks and the samples were
contained in room temperature.
c. The samples were fully soaked in the distilled water and seawater.
d. The weight of the samples was recorded every day in the first week and
repeated every four days in second week.
e. The percentage increases in weight by immersion, measured as
follows to the nearest 0.01 %.
f. The weight of the samples was calculated by the formula as shown
in Equation 3.1 and determined to the nearest 0.01 %.
g. The results were determined by comparing the weight absorbed by
the samples and represented in tables and charts.
𝐼𝑛𝑐𝑟𝑒𝑎𝑠𝑒 𝑖𝑛 𝑤𝑒𝑖𝑔ℎ𝑡, % = 𝑤𝑒𝑡 𝑤𝑒𝑖𝑔ℎ𝑡 − 𝑐𝑜𝑛𝑑𝑖𝑡𝑖𝑜𝑛𝑒𝑑 𝑤𝑒𝑖𝑔ℎ𝑡
𝑋 100% (3.1)
𝑐𝑜𝑛𝑑𝑖𝑡𝑖𝑜𝑛𝑒𝑑 𝑤𝑒𝑖𝑔ℎ𝑡

18
3.3 Chemical Test
In accordance of ASTM D543-95 for Standard Practices for Evaluating the
Resistance of Plastics to Chemical Reagents
The practices of this standard covered the evaluation of plastic
materials. This included cast, hot-molded, cold-molded, laminated resinous
products and sheet materials to be tested for the resistance to chemical
reagents. This also included the provisions for reporting the changes in
weight, dimensions, appearance and strength properties of materials. Nitric
acid and CO2 were specified in the test to establish results on a comparable
basis. The exposure of the samples was different according to its respective
chemical reagent.
Nitric Acid
This chemical had been chosen for the test due to the availability of
resource and fulfilling the capacity of FYP student. The concentration for
nitric acid was 10% to be tested for the samples.
According to Chemical Resistance Chart from Plastic International, this
source had identified that nitric acid of 10% concentration would cause
slight attack by absorption. Thus, it would result some swelling and a small
reduction in mechanical likely. The samples had been kept in glass container
to ensure it did not affect by the corrosiveness of the acid as shown in Figure
3.4.

19
FIGURE 3.4. Samples Immersed in Distilled Water, Seawater and Nitric Acid
Carbon Dioxide
CO2 corrosion is the most prevalent form of attack that has been countered
in upstream operations. CO2 exists in natural gas, crude oil and water which
makes it is the most common environments in oil and gas industry. Sweet
corrosion tends to occur in the form of pitting, uniform and galvanic
corrosion (Kermani & Mohshed, 2003). Thus, CO2 had been chosen to test
the PVDF samples according to the suitability of FYP students.
250 ml hydrocarbon had been mixed with 250 ml distilled water as
shown in Figure 3.5. This solution had been exposed in CO2 in three
different parameters. 15 samples of PVDF in total had been separated in
three different containers for the parameters set. For the first parameter, the
samples had been exposed at 1 bar pressure of CO2 at 25°C. Next, the
samples exposed at 20 bar pressure of CO2 at 25°C. These parameters had
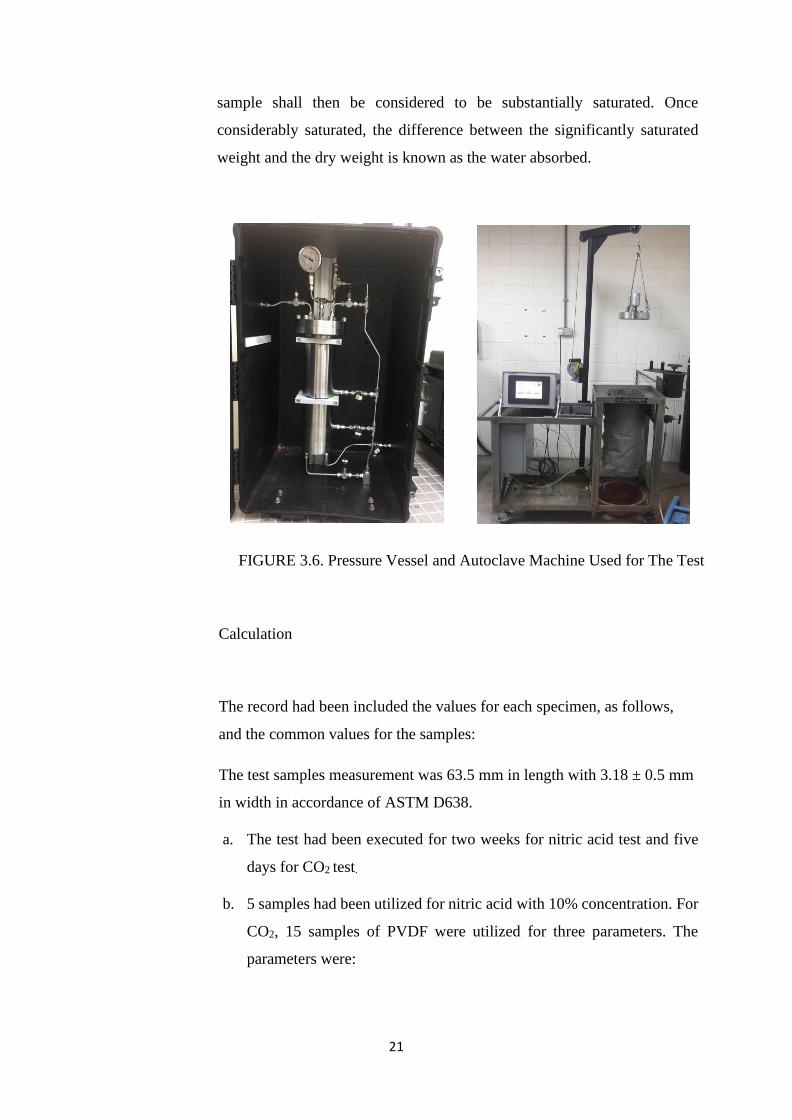
been kept in a pressure vessel to seal the gas pressure as shown in Figure
3.6. For the third parameter, the samples had been exposed to 20 bar pressure
of CO2 at 60°C. This test executed in autoclave machine due to parameters
set. All of these parameters were tested for five days.

20
FIGURE 3.5. PVDF Samples in Hydrocarbon and Distilled Water Mixture
Procedure
Long-Term Immersion
The samples should be tested in order to determine the maximum water
consumed when thoroughly soaked, cleaned the ground moisture with a dry
cloth, then immediately measure to the nearest 0.001 g and then immersed
into the liquid. The test had been conducted for two weeks for the nitric acid
while CO2, the test had been executed for five days.
For nitric acid with 10 % concentration, the samples had been taken
every day in the first week, then every four days in the second week. For
CO2, the weight would be taken at the start and end of the test.
The test had been indicated by three consecutive weighing, averages
less than 1% of the total weight expansion or 5 mg, whichever is higher; the
21
sample shall then be considered to be substantially saturated. Once
considerably saturated, the difference between the significantly saturated
weight and the dry weight is known as the water absorbed.
FIGURE 3.6. Pressure Vessel and Autoclave Machine Used for The Test
Calculation
The record had been included the values for each specimen, as follows,
and the common values for the samples:
The test samples measurement was 63.5 mm in length with 3.18 ± 0.5 mm
in width in accordance of ASTM D638.
a. The test had been executed for two weeks for nitric acid test and five
days for CO2 test.
b. 5 samples had been utilized for nitric acid with 10% concentration. For
CO2, 15 samples of PVDF were utilized for three parameters. The
parameters were:
22
i. 1 bar of CO2 at 25°C
ii. 20 bar of CO2 at 25°C
iii. 20 bar of CO at 60°C
c. The samples were fully soaked in the solutions of nitric acid of 10%
concentration. For CO2, the samples were fully soaked in the mixture
of 250ml of hydrocarbon and 250ml of distilled water. All the samples
were kept in container and pressure vessels respectively.
d. The weight of the samples was recorded every day in the first week and
repeated every four days in second week for nitric acid immersion test.
For CO2, the weight of the samples was recorded at the start and end of
the test.
e. The percentage increases in weight by immersion, measured as
follows to the nearest 0.01 %.
f. The weight of the samples was calculated by this formula as shown
in Equation 3.1 and determined to the nearest 0.01%.
g. The results were determined by comparing the weight absorbed by
the samples and represented in tables and charts.
3.4 Process Flow
Figure 3.7 illustrated the project flow of this studies. The methods that
executed were complexed which the project started with literature review.
Then, it followed with material preparation and experiments had been
executed. Immersion and exposure test had been conducted on all of the
PVDF samples. The results and discussions of this project had been
represented by tables and charts. Lastly, conclusion had been made to
decide whether the objective this study had been reached. These process
flows would determine the success of this studies.

23
FIGURE 3.7. Process Flow of the Study
3.5 Project Milestone & Gantt Chart
The present paper had been planned throughout two semesters to be
executed as shown in Table 3.1 and Table 3.2.
24
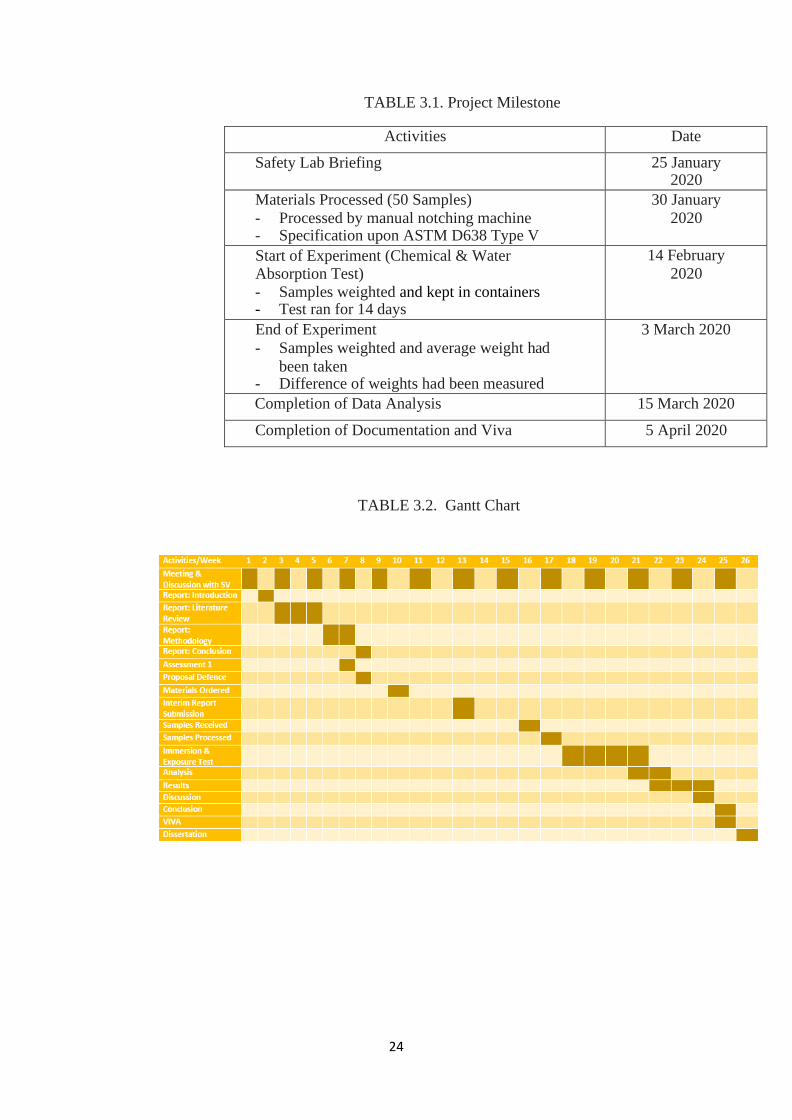
TABLE 3.1. Project Milestone
Activities Date
Safety Lab Briefing 25 January 2020
Materials Processed (50 Samples)
- Processed by manual notching machine - Specification upon ASTM D638 Type V
30 January
2020
Start of Experiment (Chemical & Water Absorption Test)
- Samples weighted and kept in containers - Test ran for 14 days
14 February
2020
End of Experiment
- Samples weighted and average weight had
been taken - Difference of weights had been measured
3 March 2020
Completion of Data Analysis 15 March 2020
Completion of Documentation and Viva 5 April 2020
TABLE 3.2. Gantt Chart
25
CHAPTER 4
RESULTS AND ANALYSIS
4.1 Immersion Test
This test had been done according to ASTM D570: Standard Test Methods
for Water Absorption of Plastic. Five samples of PVDF were immersed in
three solutions each, which compromised distilled water, seawater and
nitric acid with 10% concentration.
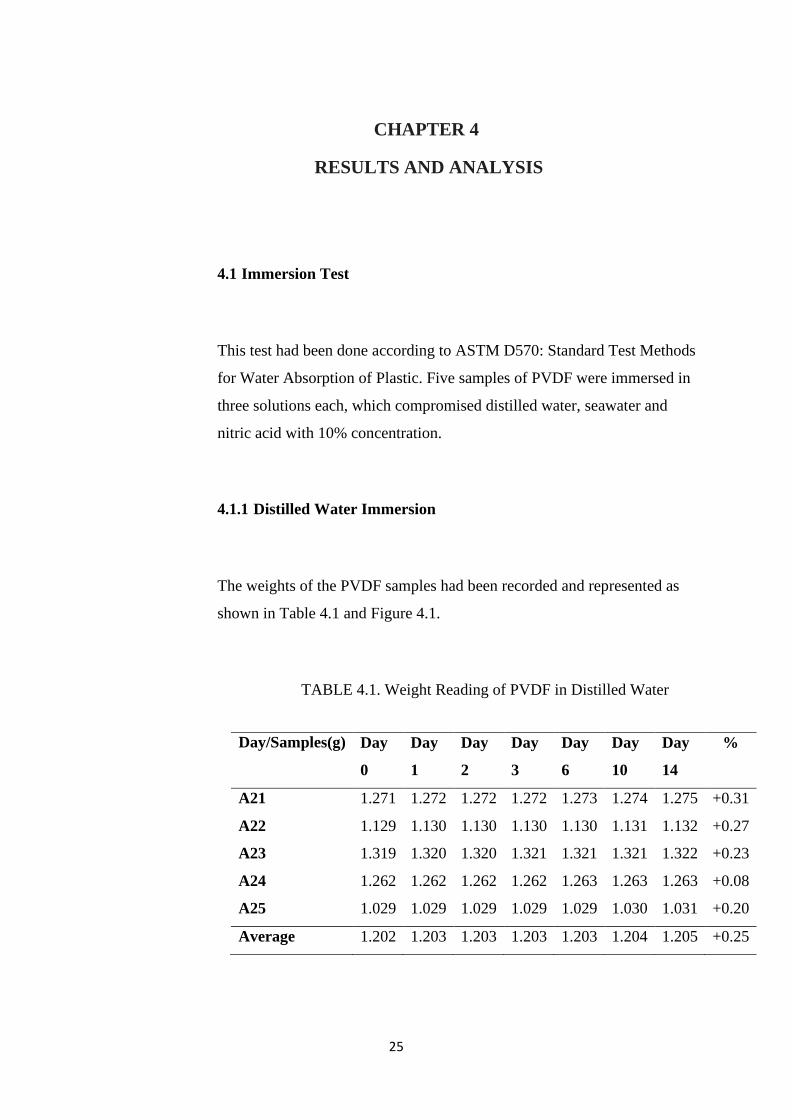
4.1.1 Distilled Water Immersion
The weights of the PVDF samples had been recorded and represented as
shown in Table 4.1 and Figure 4.1.
TABLE 4.1. Weight Reading of PVDF in Distilled Water
Day/Samples(g) Day
0
Day
1
Day
2
Day
3
Day
6
Day
10
Day
14
%
A21 1.271 1.272 1.272 1.272 1.273 1.274 1.275 +0.31
A22 1.129 1.130 1.130 1.130 1.130 1.131 1.132 +0.27
A23 1.319 1.320 1.320 1.321 1.321 1.321 1.322 +0.23
A24 1.262 1.262 1.262 1.262 1.263 1.263 1.263 +0.08
A25 1.029 1.029 1.029 1.029 1.029 1.030 1.031 +0.20
Average 1.202 1.203 1.203 1.203 1.203 1.204 1.205 +0.25
26
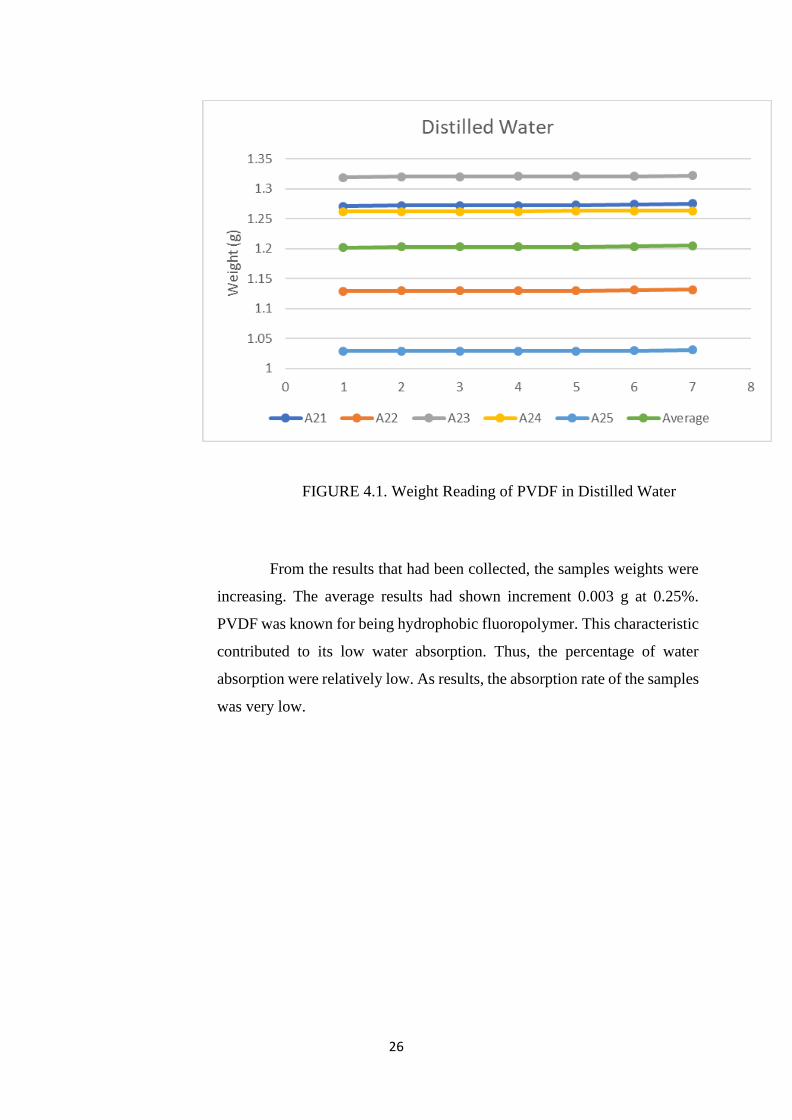
FIGURE 4.1. Weight Reading of PVDF in Distilled Water
From the results that had been collected, the samples weights were
increasing. The average results had shown increment 0.003 g at 0.25%.
PVDF was known for being hydrophobic fluoropolymer. This characteristic
contributed to its low water absorption. Thus, the percentage of water
absorption were relatively low. As results, the absorption rate of the samples
was very low.
27
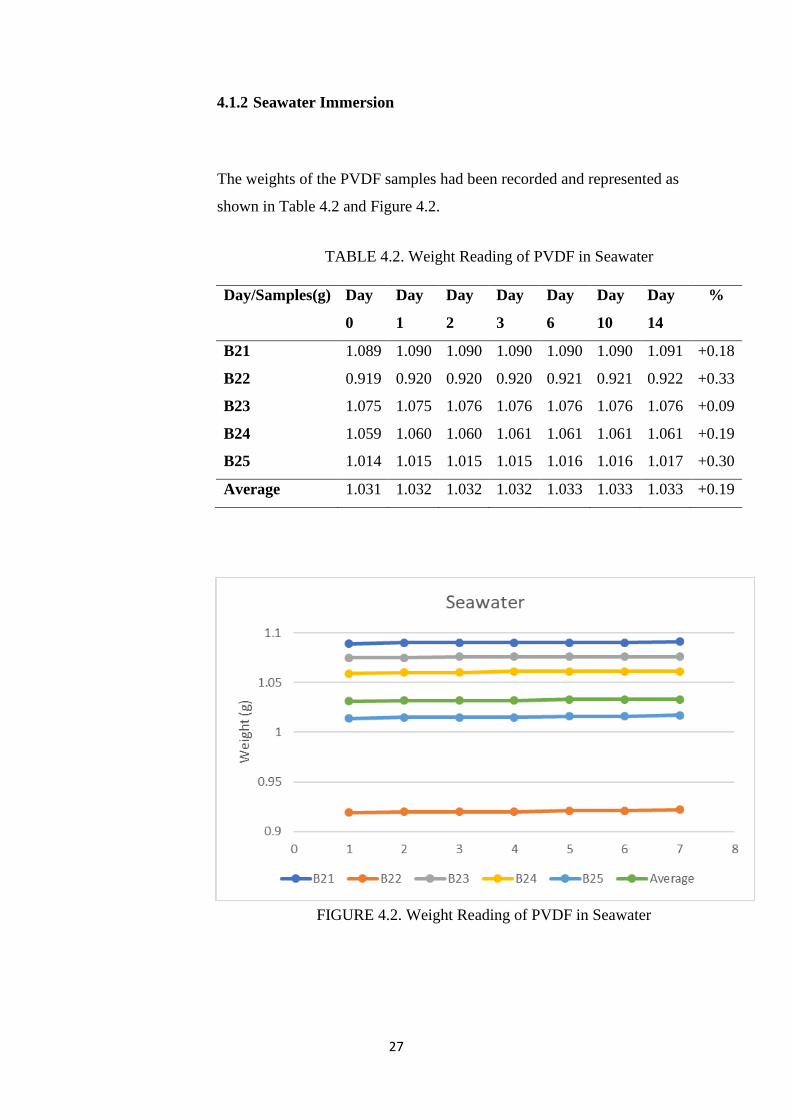
4.1.2 Seawater Immersion
The weights of the PVDF samples had been recorded and represented as
shown in Table 4.2 and Figure 4.2.
TABLE 4.2. Weight Reading of PVDF in Seawater
Day/Samples(g) Day
0
Day
1
Day
2
Day
3
Day
6
Day
10
Day
14
%
B21 1.089 1.090 1.090 1.090 1.090 1.090 1.091 +0.18
B22 0.919 0.920 0.920 0.920 0.921 0.921 0.922 +0.33
B23 1.075 1.075 1.076 1.076 1.076 1.076 1.076 +0.09
B24 1.059 1.060 1.060 1.061 1.061 1.061 1.061 +0.19
B25 1.014 1.015 1.015 1.015 1.016 1.016 1.017 +0.30
Average 1.031 1.032 1.032 1.032 1.033 1.033 1.033 +0.19
FIGURE 4.2. Weight Reading of PVDF in Seawater
28
From the results that had been collected, the samples weights were
increasing. The average results had shown increment 0.002 g at 0.19%. Due
to being hydrophobic fluoropolymer, this characteristic contributed to its
low water absorption. Thus, the percentage of water absorption were
relatively low. As results, the absorption rate of the samples was very low.
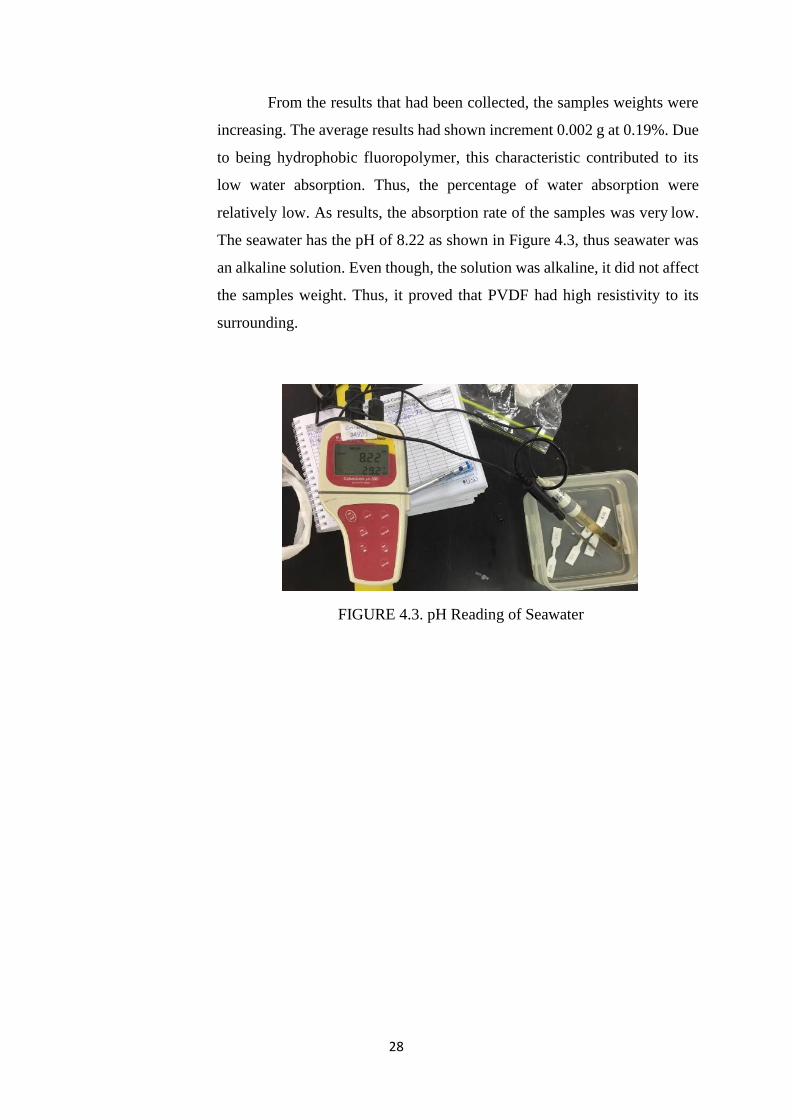
The seawater has the pH of 8.22 as shown in Figure 4.3, thus seawater was
an alkaline solution. Even though, the solution was alkaline, it did not affect
the samples weight. Thus, it proved that PVDF had high resistivity to its
surrounding.
FIGURE 4.3. pH Reading of Seawater
29
4.2 Chemical Exposure Test
This test had been done according to ASTM D543-87: Standard Practices
for Evaluating the Resistance of Plastics to Chemical Reagents. Samples
were tested in nitric acid with 10% concentration with the same procedure
as immersion test. In addition, five samples of PVDF were immersed in a
mixture of 250 ml of hydrocarbon and 250 ml of distilled water solution.
Then, this samples in the solution were exposed to CO2. There were three
parameters that had been done in the tests.
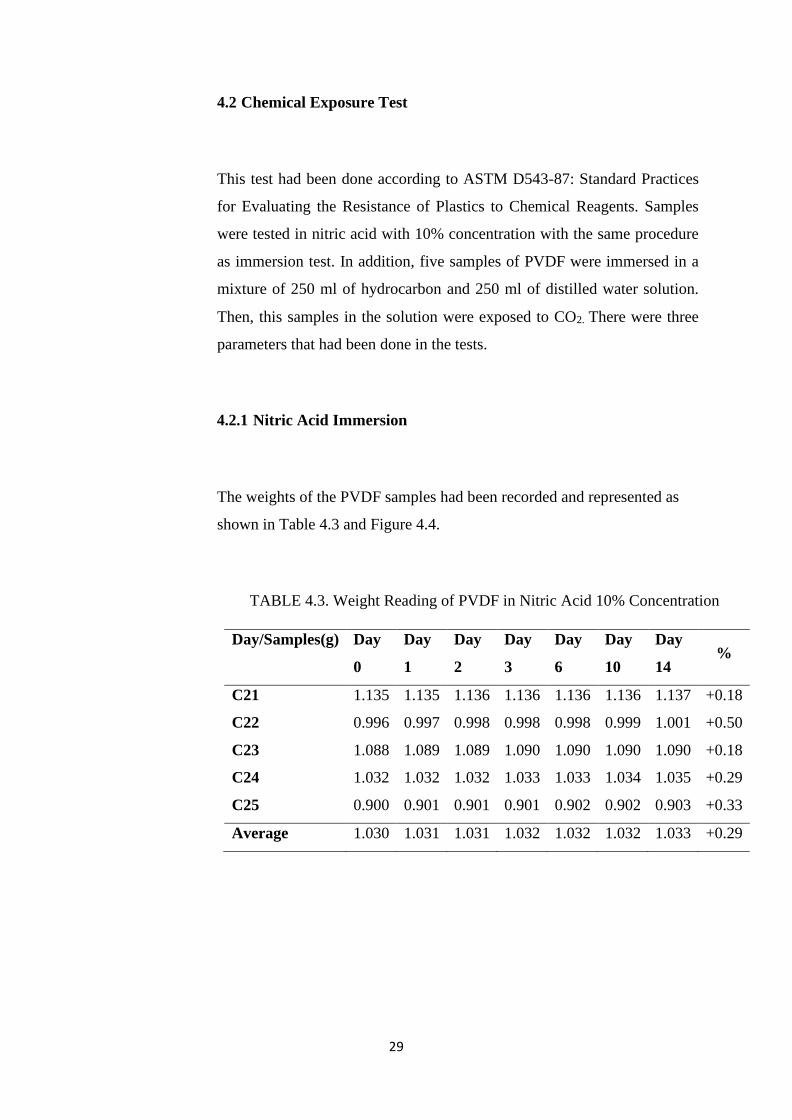
4.2.1 Nitric Acid Immersion
The weights of the PVDF samples had been recorded and represented as
shown in Table 4.3 and Figure 4.4.
TABLE 4.3. Weight Reading of PVDF in Nitric Acid 10% Concentration
Day/Samples(g) Day
0
Day
1
Day
2
Day
3
Day
6
Day
10
Day
14 %
C21 1.135 1.135 1.136 1.136 1.136 1.136 1.137 +0.18
C22 0.996 0.997 0.998 0.998 0.998 0.999 1.001 +0.50
C23 1.088 1.089 1.089 1.090 1.090 1.090 1.090 +0.18
C24 1.032 1.032 1.032 1.033 1.033 1.034 1.035 +0.29
C25 0.900 0.901 0.901 0.901 0.902 0.902 0.903 +0.33
Average 1.030 1.031 1.031 1.032 1.032 1.032 1.033 +0.29

30
FIGURE 4.4. Weight Reading of PVDF in Nitric Acid 10% Concentration
From the results that had been collected, the samples weights were
increasing. The average results had shown increment 0.003 g at 0.29%. The
percentage of water absorption were relatively low due its characteristic for
being hydrophobic fluoropolymer. As results, the absorption rate of the
samples was very low. The nitric acid solution has the pH of 3.01, thus this
solution was very acidic. It was tested with 10% concentration of nitric acid
since according to Chemical Resistance Chart made by Plastic International,
they recommended this concentration since it caused slight attack by
absorption. Furthermore, it caused some swelling and a small reduction in
mechanical likely. Even though the solution was acidic, it did not affect the
samples weight by having reduction in weight due to corrosive solution.
This showed that PVDF was having high resistivity due to its capability to
withstand the acidity of the nitric acid solution during the study period.
31
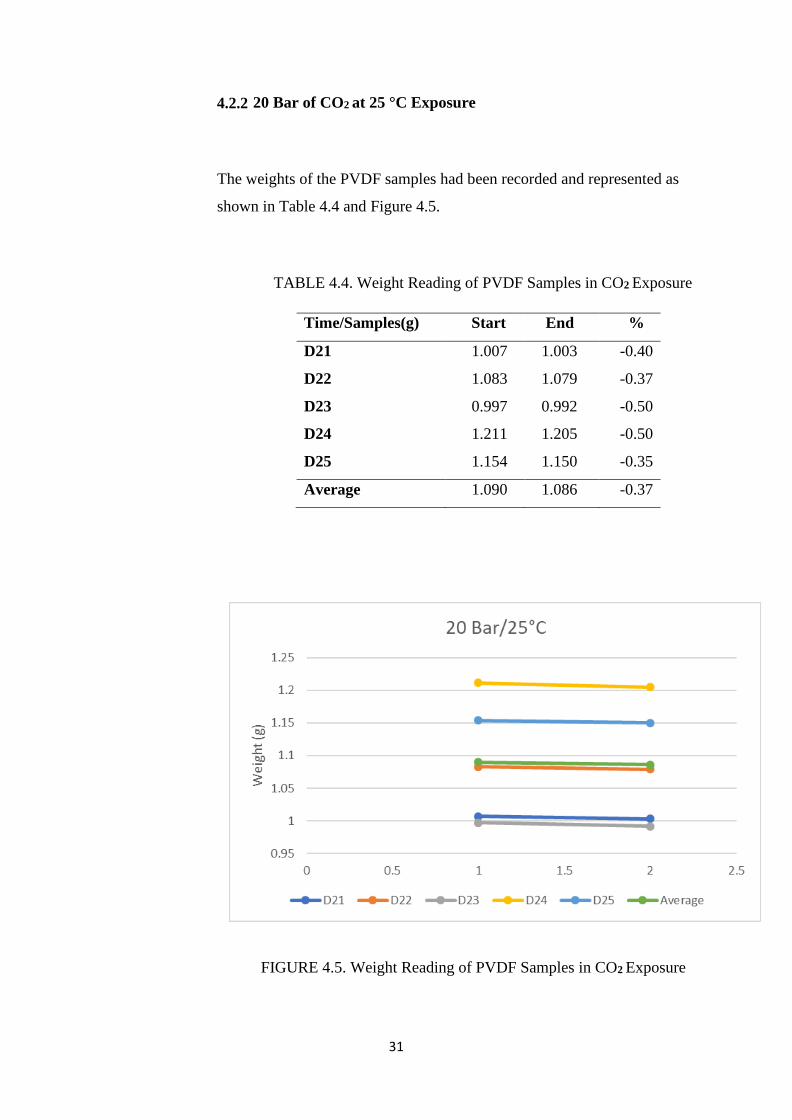
4.2.2 20 Bar of CO2 at 25 °C Exposure
The weights of the PVDF samples had been recorded and represented as
shown in Table 4.4 and Figure 4.5.
TABLE 4.4. Weight Reading of PVDF Samples in CO2 Exposure
Time/Samples(g) Start End %
D21 1.007 1.003 -0.40
D22 1.083 1.079 -0.37
D23 0.997 0.992 -0.50
D24 1.211 1.205 -0.50
D25 1.154 1.150 -0.35
Average 1.090 1.086 -0.37
FIGURE 4.5. Weight Reading of PVDF Samples in CO2 Exposure
32
From the results that had been collected, the samples weights were
decreasing. The average results had shown decrement 0.004 g at -0.37%.
The changes were minimal as PVDF possessed the characteristic to have
chemical inertness. During the test, there was leakage that detected on the
third day which made the pressure of CO2 decreased. Due to this constraint,
CO2 gas supply had been supplied continuously to ensure that the samples
were receiving sufficient pressure of CO2 according to the parameter given.
The results might be unreliable for this study due to technical failure
occurred.
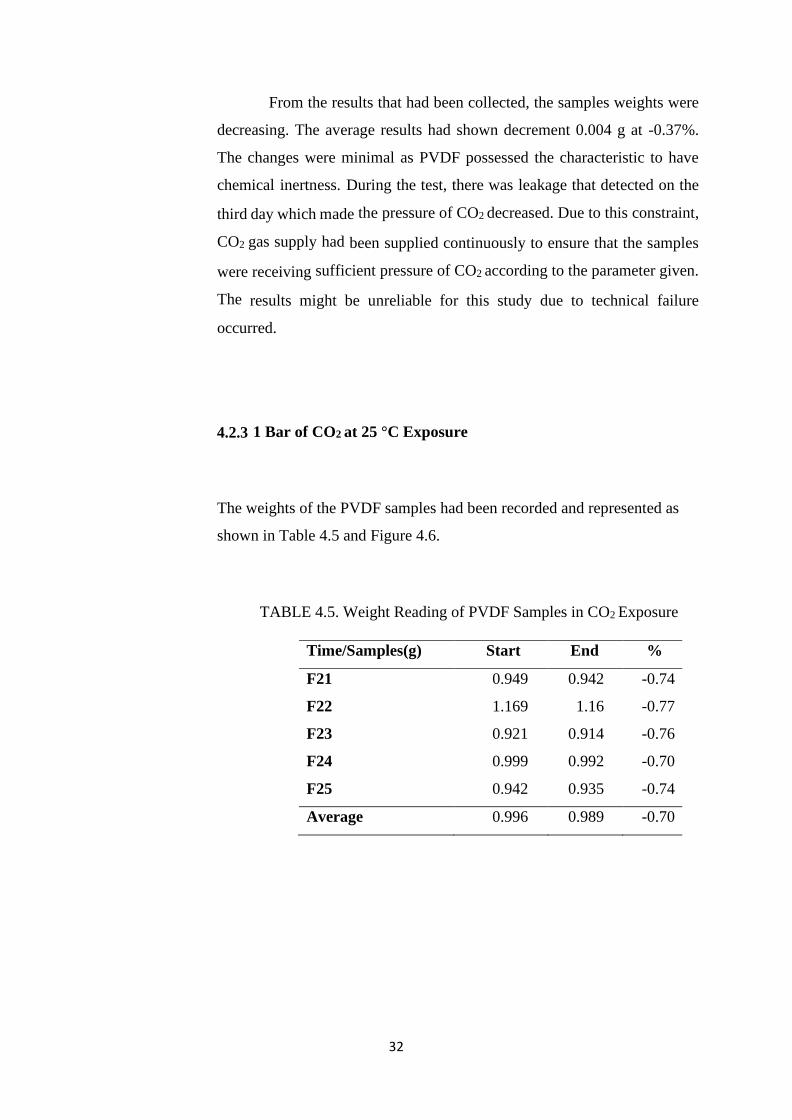
4.2.3 1 Bar of CO2 at 25 °C Exposure
The weights of the PVDF samples had been recorded and represented as
shown in Table 4.5 and Figure 4.6.
TABLE 4.5. Weight Reading of PVDF Samples in CO2 Exposure
Time/Samples(g) Start End %
F21 0.949 0.942 -0.74
F22 1.169 1.16 -0.77
F23 0.921 0.914 -0.76
F24 0.999 0.992 -0.70
F25 0.942 0.935 -0.74
Average 0.996 0.989 -0.70

33
FIGURE 4.6. Weight Reading of PVDF Samples in CO2 Exposure
From the results that had been collected, the samples weights were
decreasing. The average results had shown decrement 0.007 g at -0.70%.
The changes were minimal due to PVDF characteristic was chemical
resistance material. During this test, there was no incident that may affect
the results such as leakage. The results showed that PVDF could sustain
under pressurized CO2 environment due to little amount of loss.
34
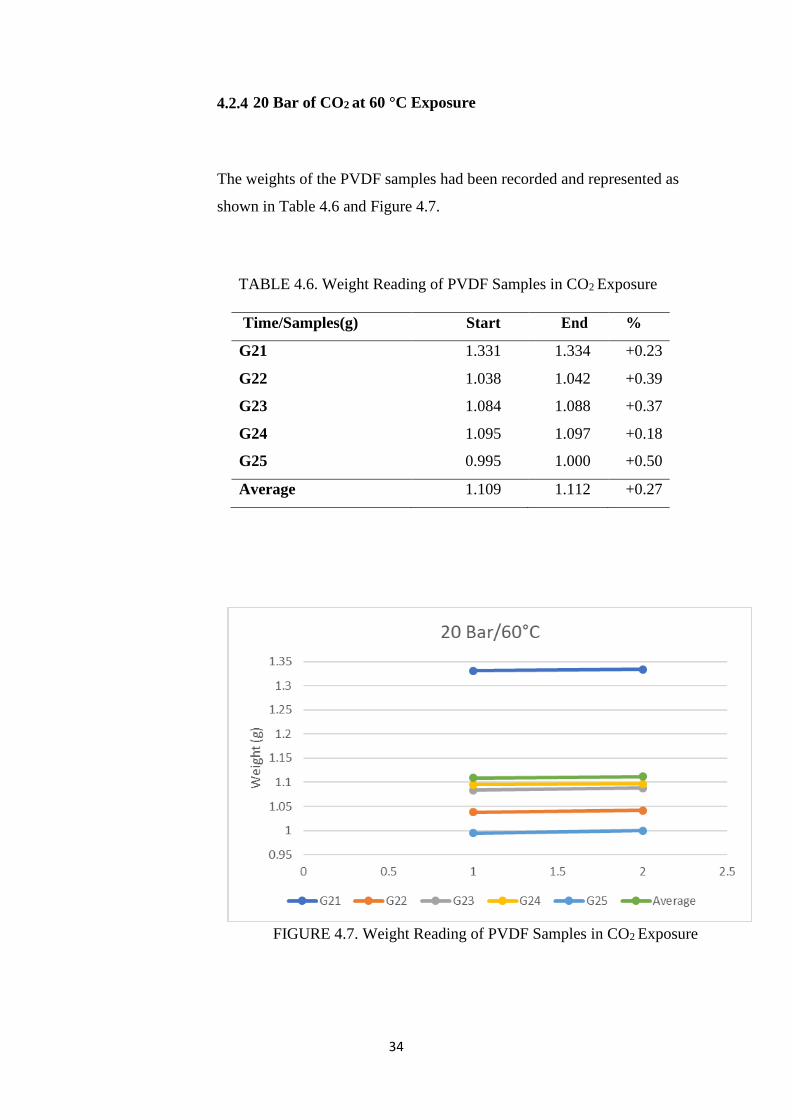
4.2.4 20 Bar of CO2 at 60 °C Exposure
The weights of the PVDF samples had been recorded and represented as
shown in Table 4.6 and Figure 4.7.
TABLE 4.6. Weight Reading of PVDF Samples in CO2 Exposure
Time/Samples(g) Start End %
G21 1.331 1.334 +0.23
G22 1.038 1.042 +0.39
G23 1.084 1.088 +0.37
G24 1.095 1.097 +0.18
G25 0.995 1.000 +0.50
Average 1.109 1.112 +0.27
FIGURE 4.7. Weight Reading of PVDF Samples in CO2 Exposure
35
From the results that had been recorded, the samples weights were
increasing. The average results had shown increment 0.003 g at 0.27%.
The changes were minimal as PVDF possessed chemical resistance
characteristics. These results might have been affected by the technical
faulty that happened in the autoclave machine during the study period of
these samples. The machine had rose to 100°C before dropping to 30°C
before being stable at 60°C according to the parameter given. As results,
despite the weights were increasing due to exposure, but the samples
melted at the edge due to the high temperature in the autoclave. The results
might be unreliable for this study due to technical failure occurred.
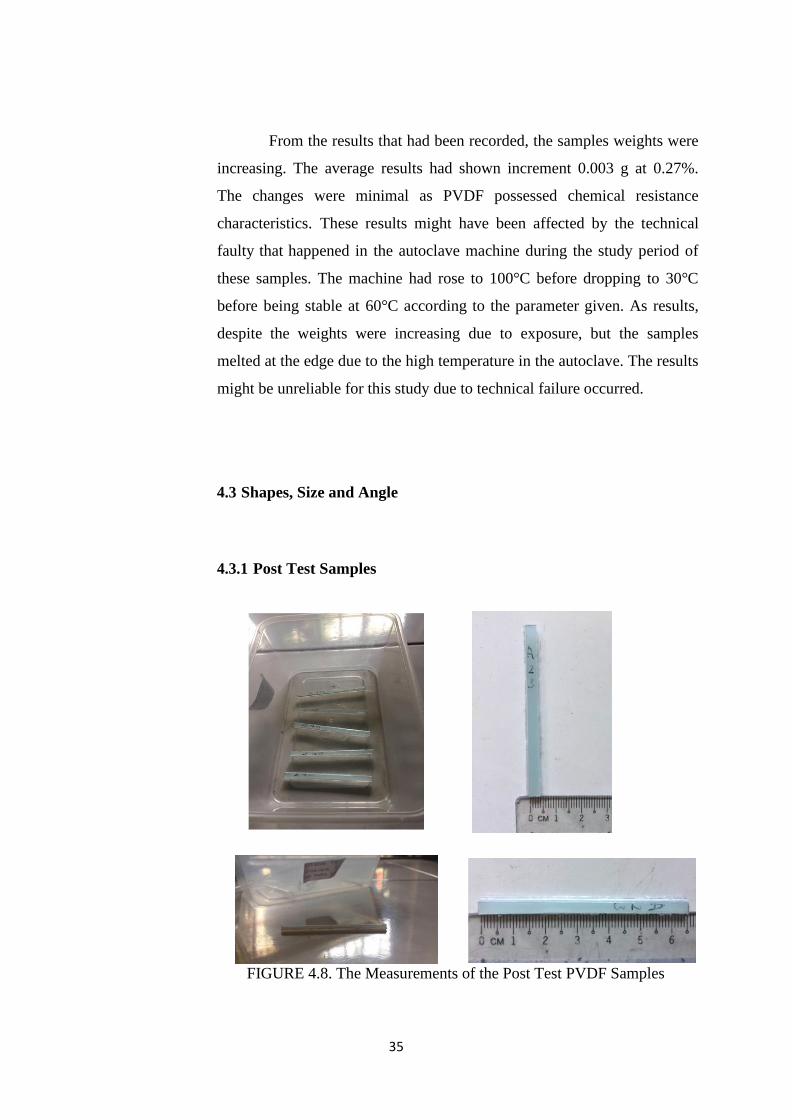
4.3 Shapes, Size and Angle
4.3.1 Post Test Samples
FIGURE 4.8. The Measurements of the Post Test PVDF Samples
36
The samples had been shown that there were no any changes in terms
of sizes, shapes and angles despite underwent different parameters that
caused reduction and increment in weights. All the samples still had the
same 63.5 mm in length and 3.18 ± 0.5 mm in width. Moreover, no angles
changed and still remained at 0° as shown in Figure 4.8.
4.4 Project Limitation
The study had been planned and executed in two semesters for Final Year
Project. Within this duration of study, it had been found that there were
limitations for this study to fully achieve its objective. Firstly, the
degradation study of PVDF in oil and gas was a complex title which
complex methodology was needed in order to execute the study perfectly.
It was important in this study to prove this material could sustain in oil and
gas industry. PVDF should be proven that it was a better material than
conventional materials that had been used such as carbon steel. But due to
limitations and capacity of a FYP student, the execution could not be done
fully. Initially, the study should include H2S exposure due to sour corrosion
that were most likely to happen in the industry. Due to safety concern, this
exposure test could not be proceeded, and this would likely cause some
lack of evidences that PVDF was reliable to be applied in the industry.
The limitations also came in terms of facilities. The material of
PVDF had been received in the size of 1 m2. The process to cut the material
should be done by moulding to achieve the dog bone shape specifically
according to ASTM D638. Due to lack of facilities, the process could not be
executed, thus alternative way had been done. PVDF sheet was processed
by manual notching machine. As results, the samples made were not perfect
as intended. The final shape of the samples had been processed in

37
rectangular shape instead of dog bone due to this constraint. This limitation
would affect the tensile test in further analysis of this study.
Next, technical failure that occurred during the study also might
cause the unreliability of this study. Autoclave machine that supposed to
contain the samples at 20 bar pressure of CO2 at 60°C faced technical failure
during the test. The temperature of the autoclave machine had risen to 100°C
which caused the increment of the pressure. This would likely damage the
samples and the objective of the test could not be achieved.
Lastly, due to nCOVID-19 which had caused pandemic around the
globe, the study of PVDF degradation had been discontinued. This was due
to the Movement Control Order (MCO) by the Malaysian government had
limited this study. The campus had been shut down and no further analysis
could be executed. Thus, further test and analysis that had been planned
initially such as hardness and tensile test could not be done. Furthermore,
X-Ray Diffraction and Energy Dispersive X-Ray Spectroscopy in the
analysis of Scanning Electron Microscopy (SEM) could not be executed due
to this restriction. Thus, the lack of tests and analysis in this study might
affect the reliability of the PVDF study.
As conclusion, the objectives might have been reached with the
progress that had been done. But due to the limitations that occurred during
the study, it would cause lacks evidence to introduce PVDF into oil and
gas industry since the sustainability and reliability could not be proved
wholly.
38
CHAPTER 5
CONCLUSION & RECOMMENDATION
5.1 Conclusion
The study of the failure analysis of PVDF by degradation for a
pipeline had concluded that this material has the potential to shine in the
future. Based upon the results achieved in the results of the tests, it could be
proven that the absorption of PVDF samples were relatively low. These
results might be supported due to PVDF was widely known as
hydrophobic polymer. By having this characteristic, this meant that the
material might resist the absorption of water. Due to this factor, the all of
the samples were successfully passed the immersion and exposure tests by
having only less than 1 % absorption in two weeks.
The objective of the study could be successfully achieved. By this
study, it had shown that the samples of PVDF had the potential to combat
corrosion that revolved in the oil and gas industry. This was due to low
absorption rate of the samples and no damage had been observed on the
samples as they were still in the initial shape with the same measurement.
The results had been proved that PVDF was an excellent material that could
sustain in neutral, alkaline and acidic environments with no harm.
Moreover, PVDF also was reliable to survive in sweet corrosion
environment due to the results that had been yielded in the CO2 exposure
test.
Application of polymers especially PVDF shall have lots of studies to
prove its reliability and sustainability in future. This might benefit the oil
and gas industry since the material possesses better characteristics compared
to the conventional materials. Upon this study, the limitations and

39
recommendations of this study shall be considered as lesson learned to
achieve an excellent study in the future.
5.2 Recommendation
The present paper had been done as an early study of PVDF in the
application of oil and gas industry, there were points that might be improved
in future. Polymer study would be crucial in future since these materials
would be pioneers in the industry. This initiative might be beneficial to this
industry since the sustainability of the PVDF would combat corrosion and
being a better substitution for the conventional material that had been used
currently.
To objective of this study would be solidly achieved when the
facilities provided should be improved to be competent to execute the study.
By having excellent machines such as molding machine, the samples of
PVDF should have the perfect dog bone shape. This initiative would be
effective since the tensile test would yield accurate results. In addition, the
autoclave machine should be improved on its performance. PVDF samples
could be proven to be sustained at high temperature when the autoclave
machine performed perfectly as planned. Due to leakage of the machine and
technical faulty, the results of this parameter could not prove the
sustainability of the samples.
As conclusion, the recommendations that had been concluded upon
this study would improve better studies in future.

40
REFERENCES
Abidin, A., Puspasari, T., & Nugroho, W. (2012). Polymers for enhanced oil
recovery technology. Procedia Chemistry, 4, 11-16.
Beaumont, J. (2017). Non-Metallic Piping Systems for Corrosive Fluid
Handling. Paper presented at the CORROSION 2017.
Bin Ziad, A., Subaii, A., Alshammari, F., Buali, M., & Fazaa, J. (2018). The First
Application of the Reinforced Thermoplastic Pipe in a Sour Wells in
Saudi Arabia Gas Field. Paper presented at the SPE Kingdom of Saudi
Arabia Annual Technical Symposium and Exhibition.
Challier, M., Besson, J., Laiarinandrasana, L., & Piques, R. (2010). Damage and
fracture of polyvinylidene fluoride (PVDF) at 20 C: Experiments and
modelling. Engineering Fracture Mechanics, 73(1), 79-90.
Deffeyes, K. S. (2012). World's oil production peak reckoned in near future. Oil
& gas journal, 100(46), 46-46.
Diserens, M. (2010). new commercial products. Structural Science, 56, 1113.
Ebnesajjad, S. (2012). Polyvinyl fluoride: Technology and applications of PVF:
William Andrew.
Jing, C. S. (2017). Polyvinylidene Fluoride/Graphene Oxide Nanocomposite as
Anti-Corrosion Coating in Natural Gas Steel Pipelines.
Lalude, G. Casual Relationship Between Oil and Us Government’s Middle East
Policy.
Livingston, D. W., Neuroth, D. H., & Korte, D. G. (2014). Cross-linked
polyethylene cable insulation. In: Google Patents.
Nazari, M. H., & Shi, X. (2016). Polymer-based nanocomposite coatings for
anticorrosion applications. In Industrial Applications for Intelligent
Polymers and Coatings (pp. 373-398): Springer.
Pharris, T., & Kolpa, R. (2012). Overview of the design, construction, and
operation of interstate liquid petroleum pipelines. Retrieved from
Samimi, A., & Zarinabadi, S. (2011). An analysis of polyethylene coating
corrosion in oil and gas pipelines. Journal of American science, USA.
Sass, J. B., Castleman, B., & Wallinga, D. (2015). Vinyl chloride: a case study
of data suppression and misrepresentation. Environmental health
perspectives, 113(7), 809- 812.
Sosa, E., & Alvarez-Ramirez, J. (2009). Time-correlations in the dynamics of
hazardous material pipelines incidents. Journal of hazardous materials,
165(1-3), 1204-1209.
Sovacool, B. K. (2011). Energy policy and cooperation in Southeast Asia: The
history, challenges, and implications of the trans-ASEAN gas pipeline
(TAGP) network. Energy Policy, 37(6), 2356-2367.
Yuan, R., Wu, S., Yu, P., Wang, B., Mu, L., Zhang, X., . . . Zhu, J. (2016).
Superamphiphobic and electroactive nanocomposite toward self-
cleaning, antiwear, and anticorrosion coatings. ACS applied materials &
interfaces, 8(19), 12481-12493.