fair-trade and tea: a comparative analysis of value …
TRANSCRIPT
FAIR-TRADE AND TEA: A COMPARATIVE ANALYSIS OF VALUE CHAINS IN
KABAROLE DISTRICT, UGANDA
A Research Project Submitted to Larenstein University of Applied Sciences in Partial Fulfillment of the Requirements for the Degree of
Masters in Agricultural Production Chain Management, Specialization Post Harvest Technology and Logistics
By
Martin Odoch
September 2008
Wageningen The Netherlands © Copyright. Martin Odoch, 2008. All Rights Reserved

ii
PERMISSION TO USE In presenting this research project in partial fulfilment of the requirements for a postgraduate degree, I agree that the library of this University may make it freely available for inspection. I further agree that permission for copying of this research project in any manner, in whole or in part, for scholarly purposes may be granted by the Larenstein Director of Research. Any copying or publication or use of this research project or parts thereof for financial gain shall not be allowed without my written permission. Due recognition shall be given to me and to the University in any scholarly use which may be made of any material in my research project. Requests for permission to copy or to make other use of material in this research project in whole or part should be addressed to: Director of Research Larenstein University of Applied Sciences P.O. Box 9001 6880 GB Velp The Netherlands Fax: 31 26 3615287

iii
ACKNOWLEDGEMENT This thesis could not have been written without the enthusiasm, commitment and support of a large number of people within Kabarole District, Uganda. I am especially grateful to the smallholder tea growers who offered their time to the research. Without their knowledge, experience and support, nothing that is described here could have been accomplished. I am thankful to the management of Mpanga Grower’s Tea Factory Limited and Kiamara Tea Factory Limited for accepting the research to be conducted within their organisations. Finally, I am very grateful to Mr. Jos van Hal who has been the ideal thesis supervisor. His detailed advice and insightful criticisms aided the writing of this thesis.

iv
DEDICATION This thesis is dedicated to my father, John Omona who showed me that an education is the most important gift that a parent can provide and my mother Betty Omona, who taught me that after a good education the sky, is the limit.

v
TABLE OF CONTENTS
PERMISSION TO USE...................................................................................................................ii
ACKNOWLEDGEMENT ...............................................................................................................iii
DEDICATION...............................................................................................................................iv
TABLE OF CONTENTS ..................................................................................................................v
LIST OF TABLES ........................................................................................................................ viii
LIST OF FIGURES ...................................................................................................................... viii
LIST OF ABBREVIATIONS............................................................................................................ ix
ABSTRACT ...................................................................................................................................x
CHAPTER 1 INTRODUCTION ...................................................................................................... 1
1.1 Country Background.................................................................................................. 1
1.2 Agriculture and Tea in Uganda .................................................................................. 1
1.3 Problem Statement ................................................................................................... 2
1.4 Research Objective .................................................................................................... 2
1.4.1 Central Research Question 1 ............................................................................. 2
1.4.2 Central Research Question 2 ............................................................................. 2
1.4.3 Central Research Question 3 ............................................................................. 2
1.5 Significance of the Study ........................................................................................... 2
1.6 Outline of the Study .................................................................................................. 3
1.7 Definition of Terminologies ....................................................................................... 3
CHAPTER 2 LITERATURE REVIEW.......................................................................................... 4
2.1 Global Tea Production ............................................................................................... 4
2.2 Marketing and Consumption of tea .......................................................................... 5
2.3 Conventional Value Chain of Tea............................................................................... 6
2.4 Fair trade Value Chain of Tea .................................................................................... 7
CHAPTER 3 METHODOLOGY................................................................................................. 9
CHAPTER 3 METHODOLOGY................................................................................................. 9
3.1 Study Area ................................................................................................................. 9
3.2 Research Framework................................................................................................. 9
3.3 Survey ...................................................................................................................... 10
3.4 Case Study 1 ............................................................................................................ 10
3.5 Case Study 2 ............................................................................................................ 10
3.6 Data Analysis ........................................................................................................... 10

vi
CHAPTER 4 RESULTS ........................................................................................................... 11
4.1 Smallholder Marketing Alternatives and Buyer Requirements............................... 11
4.2 The Roles of the Different Stakeholders in the Tea Value Chains........................... 13
4.2.1 Identification of Stakeholders in the Conventional Value Chain..................... 13
4.2.2 Identification of Stakeholders in the Fair Trade Value Chain.......................... 14
4.3 Farmer Constraints within the Value Chains. .......................................................... 15
4.4 Evaluation of the Conventional and Fair trade Value Chains. ................................. 16
4.4.1 Green leaf Purchase Price................................................................................ 17
4.4.2 Cost of NPK Fertiliser Credit Scheme............................................................... 17
4.4.3 Performance in the Smallholder Green leaf market ....................................... 18
4.4.4 Performance at the Mombasa Auction Sales .................................................. 19
4.5 Smallholder’s Satisfaction with the Fair trade Production Standards..................... 20
4.6 Benefits for Smallholder Tea Producers under both Value Chains. ........................ 20
4.7 Improving Leaf Supply into the Fair Trade Value Chain. ......................................... 21
4.8 Expected Benefits of Improving the Quantity of Fair Trade Leaf. ........................... 21
CHAPTER 5 DISCUSSION ..................................................................................................... 23
5.1 Smallholder Marketing Alternatives and Buyer Requirements............................... 23
5.2 The Roles of the Different Stakeholders in the Tea Value Chains........................... 23
5.2.1 Agro Input Suppliers ........................................................................................ 23
5.2.2 Producers......................................................................................................... 24
5.2.3 Green Leaf Transporters.................................................................................. 24
5.2.4 Tea Processors ................................................................................................. 25
5.2.5 Mombasa Tea Auction..................................................................................... 26
5.2.6 Traders............................................................................................................. 26
5.2.7 Consumers ....................................................................................................... 26
5.2.8 Chain Supporters ............................................................................................. 26
5.2.9 Chain Influencer............................................................................................... 27
5.3 Farmer Constraints within the Value Chains. .......................................................... 27
5.4 Evaluation of the Conventional and Fair trade Value Chains.................................. 29
5.4.1 Green Leaf Purchase Price............................................................................... 29
5.4.2 Fertiliser Credit Scheme .................................................................................. 29
5.4.3 Performance in the Smallholder Green Leaf Market ...................................... 30
5.4.4 Performance at the Mombasa Auction Sales .................................................. 30

vii
5.5 Producing Tea under the Fair Trade Chain. ............................................................. 31
5.6 Benefits for Smallholder Tea Producers under both Value Chains. ........................ 31
5.7 Improving Leaf Supply into the Fair Trade Value Chain. ......................................... 32
5.8 Expected Benefits of Improving the Quantity of Fair Trade Leaf. ........................... 32
CHAPTER 6 CONCLUSION AND RECOMMENDATIONS ....................................................... 34
6.1 Conclusion ............................................................................................................... 34
6.2 Recommendations................................................................................................... 34
REFERENCES ............................................................................................................................ 36
APPENDICES............................................................................................................................. 38

viii
LIST OF TABLES Table 1 Annual Production of Tea in Selected Countries (metric tons) ................4 Table 2 Mombasa Auction Average Prices per Country 2005 – 2007 ..................5 Table 3 Conventional Chain Stakeholders and their Roles.................................13 Table 4 Fair trade Chain Stakeholders and their Roles ......................................14 Table 5 Summary of Farmers Constraints by Value Chain System....................28
LIST OF FIGURES Figure 1 Uganda Tea Production 1995 – 2002 (‘000 tonnes)...............................1 Figure 2 A Comparison of Global Tea Production and Consumption...................6 Figure 3 Percentages of Tea Exports from Mombasa by Buyer, 2007.................7 Figure 4 Map of Uganda showing Kabarole District .............................................9 Figure 5 Value Chain Map of the Conventional and Fair Trade Chains .............11 Figure 6 Key Buyer Requirements in the Marketing of Smallholder Leaf ...........12 Figure 7 Key Farmer Constraints According to Marketing Channels..................15 Figure 8 Key Performance Indicators Influencing the Farmers’ Choices............16 Figure 9 Green Leaf Prices of the Conventional and Fair Trade Processor .......17 Figure 10 NPK Fertilizer Prices of the Conventional and Fair Trade Processor...17 Figure 11 Conventional and Fair trade Green Leaf Market Shares by Centre .....18 Figure 12 Percentage Leaf Distribution by Farmers in the Hybrid System...........18 Figure 13 Conventional and Fair Trade BP1 Prices at the Mombasa Auction .....19 Figure 14 Conventional and Fair Trade D1 Prices at the Mombasa Auction........19 Figure 15 Farmers Satisfaction with Fair trade Production Standards .................20 Figure 16 Benefits Considered Significant by Farmers under both Chains ..........20 Figure 17 Farmer Recommended Strategies to Increase Leaf Supply.................21 Figure 18 Expected Benefits of Improving Fair trade Leaf Supply .......................21 Figure 19 Cyclic Relation between Fertilisers and Market prices .........................31

ix
LIST OF ABBREVIATIONS BP1 - Broken Pekoe 1 D1 - Dust 1 EATTA - East African Tea Trade Association FAO - Food and Agriculture Organization FAOSTAT - Food and Agriculture Organization Statistics FLO - Fair trade Labelling Organization FLO CERT - Fair trade Labelling Organization Certification GDP - Gross Domestic Product HA - Hectare KPI’s - Key Performance Indicators NARO - National Agriculture Research Organization NGO’s - Non Governmental Organizations NPK fertilizer - Nitrogen, Phosphorus and Potassium fertilizer SACCOS - Savings and Credit Cooperative Society SOMO - The Centre for Research on Multinational Corporations SPSS - Statistical Package for the Social Sciences UAE - United Arab Emirates UBOS - Uganda National Bureau of Statistics UGX Shs - Uganda Shillings UK - United Kingdom UNDP - United Nation’s Development Program UTA - Uganda Tea Association VCA - Value Chain Analysis VNKT - The Association of Dutch Coffee Roasters and Tea Packers

x
ABSTRACT This dissertation examines the competiveness of the fair trade tea value chain through a comparative study of the conventional and fair trade tea value chains in Kabarole district, Uganda. By examining this economically important subject, it clarifies the process by which value chains compete for smallholder farmer’s leaf and the constraints that the chains experience in their functioning. Comparison of the value chains involved the use of four indicators namely; green leaf price, fertilizer pricing, green leaf market share and auction selling prices. Two major research strategies were employed: (1) a quantitative analysis of smallholder data through a survey of 45 respondents and (2) case studies of two tea processors. Additional information was collected from literature and interviews. The data collected was analysed using SPSS 16.0 statistical program. Descriptive statistics were used to compare the responses of farmers in the value chains to a number of issues relevant to the study. Cross tabulation was employed to compare the conventional and fair trade harvest share from farmers selling to both value chains. This thesis examined how farmers decide to which value chain they market their green leaf. The value chain concept was used through out the discussion of the results and the roles of the stakeholders. In conclusion it was revealed that the conventional value chain was more competitive for smallholder leaf compared to the fair trade value chain. The study thereafter generated recommendations to contribute to improving the leaf supply into the fair trade value chain. Keywords Smallholder tea farmer, Fair trade, Conventional trade, Value chain, Competitiveness

1
CHAPTER 1 INTRODUCTION 1.1 Country Background Uganda is a land-locked country occupying an area of 241,551 km2, 18% of which consists of open inland waters and permanent wetlands. The country has a tropical climate with temperatures ranging between 15 to 30oC through the year and rainfall of between 700 to 2,000mm per annum (UNDP 2008). Uganda has a rapidly growing population with 28.2 million people as per 2007 estimates. Majority of the country’s population i.e. 87%, live in rural areas and 73 per cent of the rural population is engaged in agriculture. The country has made considerable progress in poverty reduction attaining a real per capita income of US$ 334 in 2005. However, in-spite of the considerable efforts to transform the economy, the overall welfare of the small scale producers and the rural population has not correspondingly registered a substantial improvement (UNDP 2008). 1.2 Agriculture and Tea in Uganda The Ugandan economy is heavily dependant on the agricultural sector that accounts for 31 percent of the national Gross Domestic Product (GDP) and eighty five percent of total export earnings. The agricultural sector provides 80 percent of employment and most of the raw materials to the industrial sector. The hand-hoe is the predominant technology for cultivation in all crop systems with the exception of tea and sugarcane, which are grown on large estates (UNDP 2008). The tea industry as a whole has done relatively well in recent years, with rapid increase in production since the mid-1990s. Production reached a record high of 25,900 metric tons in 1998, surpassing for the first time the 1972 level of 23,400 metric tons. In 2001, a new high of 33,800 metric tons was achieved as shown in figure 1 below (African Development Bank, 2002).
Figure 1 Uganda Tea Production 1995 – 2002 (‘000 tonnes) Source: Uganda Bureau of Statistics (UBOS) While this performance is commendable, the production must be seen from a national or global perspective. According to Uganda Tea Association, about 200,000 hectares of land have been identified as suitable for tea growing in Uganda, but recorded tea area planted or under production is only about 20,500 ha, which is only 10% of the reported potential area. In terms of output, Uganda’s production of 33,000 metric tons compares poorly with neighboring countries with which it started almost on the same comparative footing in the 1960s (African Development Bank, 2002).

2
1.3 Problem Statement In Kabarole district, smallholder tea growers market their produce through two different and competing value chain systems i.e. the fair trade and conventional value chains. The fair trade chain differs from the conventional chain in that it internalizes social and environmental costs in addition to other production expenses. The conventional value chain on the other hand undertakes minimum social or environmental protection measures and normally offers producers a lower market price in comparison to fair trade. However in spite of the benefits under the fair trade value chain, the conventional chain is very competitive for smallholder leaf in a number of tea buying centers. In fact, contrary to conventional wisdom, it performs better than the fair trade value chain in the leaf collection centers of Mugusu and Kahangi. 1.4 Research Objective To evaluate the competitiveness of the fair trade value chain in relationship to the conventional value chain among smallholder tea producers in Kabarole and make recommendations to enlarge the supply of leaf into the fair trade chain. 1.4.1 Central Research Question 1 1. How are the tea value chains organized within Kabarole district? Sub Questions
i. What marketing alternatives and requirements exist to smallholder producers? ii. What are the roles of the different stakeholders in the tea value chains? iii. What constraints exist within the smallholder tea value chains?
1.4.2 Central Research Question 2 2. What is the competitive relationship between the conventional and the fair trade value chain? Sub Questions
iv. What key performance indicators can be used to compare tea value chains and how do the chains in Kabarole score?
v. How do producers react to the demands under fair trade certification? vi. What benefits are there for smallholder tea producers under both value
chains?
1.4.3 Central Research Question 3 3. What business adjustments will be required to improve the fair trade value chain? Sub Questions vii. How can leaf supply into the fair trade value chain be increased? viii. What would be the benefit of improving the fair trade value chain leaf supply?
1.5 Significance of the Study The tea industry in Kabarole district has had a long history of difficulty during the country’s history of civil wars. The situation has greatly improved to date with the rebuilding of most tea factories within the district completed. However the planting of new tea acreage has not kept pace with the raising demand from the factories and to date the demand for green leaf out strips supply (Mpanga Field Report, 2007).

3
The mismatch between supply of raw material and factory processing capacity within the district has created a situation where an increasing number of smallholder farmers are less loyal to buyers irrespective of contracts. This behaviour among farmers has created an interest within the tea buyers to understand the decision making process of farmers when marketing leaf. The research plays a role in this area by clearly identifying the indicators that a small holder farmer employs in deciding to adopt a particular tea buyer over another. In addition, analysis on critical buyer services and how they relate to the marketing decisions of farmers is elaborated by the research. Mpanga Grower’s Tea Factory Limited hopes that information derived from the study will aid the organisation in improving the fair trade value chain. 1.6 Outline of the Study This study is organized into five main chapters. Chapter I offers an overview of agriculture within Uganda and the importance of tea to the country’s economy. It further describes the research objective and links the research problem with three main research questions. In Chapter 2 the concept of value chain analysis is reviewed along with the global tea industry. The chapter ends by reviewing both the conventional and fair trade tea value chains. Chapter 3 deals with the research methodology elaborating the research area, tools used and the data analysis procedure. Chapter 4 consists of the empirical findings of the research and Chapter 5 covers the discussion of these findings. The report ends with Chapter 6 that formulates the conclusion and recommendations of the study. 1.7 Definition of Terminologies i. Competitiveness Competitiveness is used as a comparative concept of
the ability and performance of a value chain system in buying smallholder leaf and supplying goods and/or services.
ii. Smallholder Farmer Adopted from Mpanga Grower’s Tea Factory Limited, a
smallholder tea farmer is one with a total acreage holding of not more than 5 Ha.
iii. Hybrid Buyer System A smallholder tea farmer who sells green leaf
simultaneously to both the fair trade and conventional value chain systems.
4
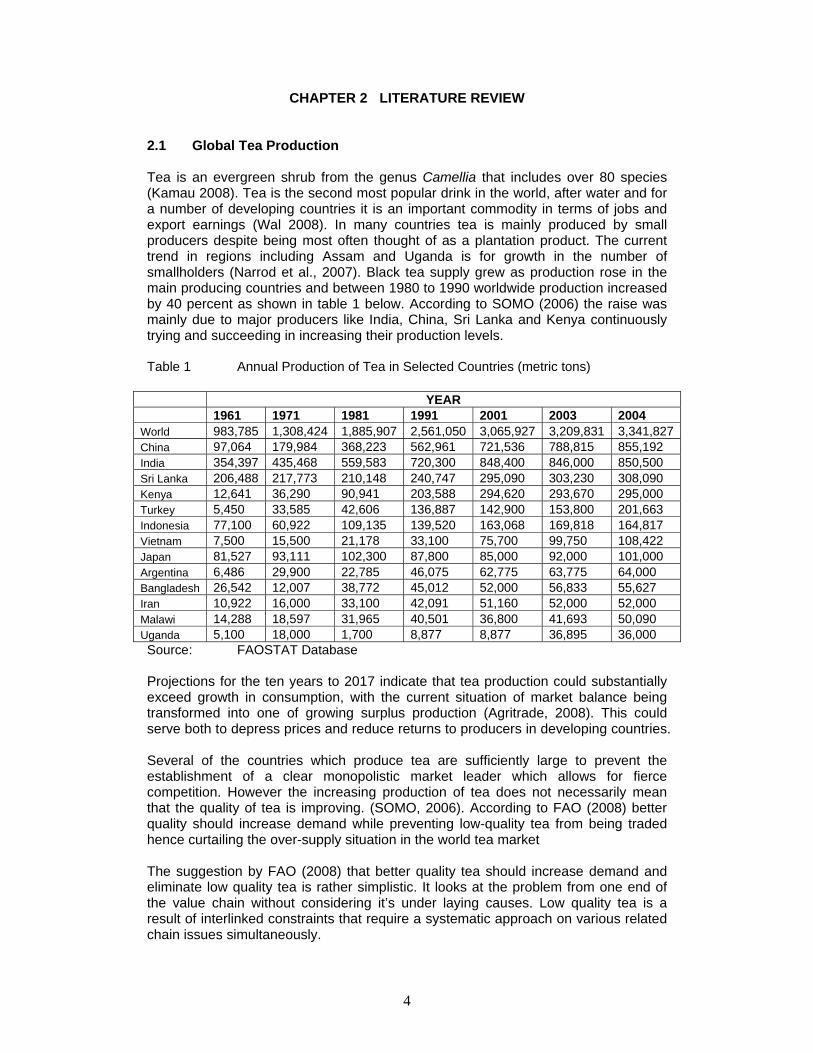
CHAPTER 2 LITERATURE REVIEW 2.1 Global Tea Production Tea is an evergreen shrub from the genus Camellia that includes over 80 species (Kamau 2008). Tea is the second most popular drink in the world, after water and for a number of developing countries it is an important commodity in terms of jobs and export earnings (Wal 2008). In many countries tea is mainly produced by small producers despite being most often thought of as a plantation product. The current trend in regions including Assam and Uganda is for growth in the number of smallholders (Narrod et al., 2007). Black tea supply grew as production rose in the main producing countries and between 1980 to 1990 worldwide production increased by 40 percent as shown in table 1 below. According to SOMO (2006) the raise was mainly due to major producers like India, China, Sri Lanka and Kenya continuously trying and succeeding in increasing their production levels. Table 1 Annual Production of Tea in Selected Countries (metric tons)
YEAR 1961 1971 1981 1991 2001 2003 2004 World 983,785 1,308,424 1,885,907 2,561,050 3,065,927 3,209,831 3,341,827China 97,064 179,984 368,223 562,961 721,536 788,815 855,192 India 354,397 435,468 559,583 720,300 848,400 846,000 850,500 Sri Lanka 206,488 217,773 210,148 240,747 295,090 303,230 308,090 Kenya 12,641 36,290 90,941 203,588 294,620 293,670 295,000 Turkey 5,450 33,585 42,606 136,887 142,900 153,800 201,663 Indonesia 77,100 60,922 109,135 139,520 163,068 169,818 164,817 Vietnam 7,500 15,500 21,178 33,100 75,700 99,750 108,422 Japan 81,527 93,111 102,300 87,800 85,000 92,000 101,000 Argentina 6,486 29,900 22,785 46,075 62,775 63,775 64,000 Bangladesh 26,542 12,007 38,772 45,012 52,000 56,833 55,627 Iran 10,922 16,000 33,100 42,091 51,160 52,000 52,000 Malawi 14,288 18,597 31,965 40,501 36,800 41,693 50,090 Uganda 5,100 18,000 1,700 8,877 8,877 36,895 36,000 Source: FAOSTAT Database Projections for the ten years to 2017 indicate that tea production could substantially exceed growth in consumption, with the current situation of market balance being transformed into one of growing surplus production (Agritrade, 2008). This could serve both to depress prices and reduce returns to producers in developing countries. Several of the countries which produce tea are sufficiently large to prevent the establishment of a clear monopolistic market leader which allows for fierce competition. However the increasing production of tea does not necessarily mean that the quality of tea is improving. (SOMO, 2006). According to FAO (2008) better quality should increase demand while preventing low-quality tea from being traded hence curtailing the over-supply situation in the world tea market The suggestion by FAO (2008) that better quality tea should increase demand and eliminate low quality tea is rather simplistic. It looks at the problem from one end of the value chain without considering it’s under laying causes. Low quality tea is a result of interlinked constraints that require a systematic approach on various related chain issues simultaneously.

5
2.2 Marketing and Consumption of tea There is no single world price for tea, but rather differing prices at different auctions (Agritrade, 2008) Tea is unusual among the major agricultural commodities in that it is sold through auctions or in private deals and unlike coffee or cocoa, there is no futures market for tea (SOMO, 2006). The price trend until recently has been downward. World Bank figures suggest that between 1970 and 2000, tea prices fell by 44% in real terms. The FAO composite price index, a world indicator price for tea, shows that tea prices are slowly increasing since 2002. After two years decrease between 2000 and 2002, the price for tea increased by 31.7% in 5 years. In recent years it raised by 6.5% in 2007 after an 11.6% raise in 2006, in a sign that global oversupply of tea was improving (Agritrade, 2008). However for all the tea producing countries selling through the Mombasa auction, the price trend in 2006/07 was a decline as revealed in Table 2 below. Table 2 Mombasa Auction Average Prices per Country 2005 – 2007
Source: East African Tea Trade Association (EATTA) Although the auction system would seem to approximate to a 'fair market' in which prices are determined solely by the interplay of supply and demand, the system does not always work well for small-scale producers. There has been evidence of collusion among brokers to influence prices and in 2005 the situation was deemed so bad that the Kenyan National Chamber of Commerce called for the elimination of tea auctions (Agritrade, 2008). The economic relationships between companies in production and consuming countries are determining the tea market. In other words, the tea value chain is characterized by strong integration, both horizontally and vertically. This double integration explains the considerable hold the major tea companies have on the entire production process, from tea shrub to tea bag. The direct link between producers and manufacturers is most obvious in the plantation sector. Tea marketing companies owning or at least strongly influencing tea plantations are not uncommon hence manipulation of supply and demand is a frequent phenomenon (Wal 2008). Low prices for tea tend to be passed on to the poorest segments of a country e.g. low price to smallholder farmers. Given that it is easier to cut costs than raise prices, companies have chosen to remain competitive by lowering or resisting increases in production costs.

6
According to Agritrade (2008) labour costs account for over half of the cost of production, and approximately 75% of that arises in plucking. Therefore falling market prices have caused downward pressure on farmers’ incomes and labourers' wages, even though the proportion of wages in the consumer price of tea is already low (Agritrade, 2008). The tea market is further constrained by the fact that supply is increasing faster than consumption as shown in figure 2 below.
Figure 2 A Comparison of Global Tea Production and Consumption. Source: VNKT According to Wal (2008) in addition to low farm gate prices, problematic issues to smallholder tea farmers include poor extension services, limited marketing channels, poor access to credit and low level of farmer organization. 2.3 Conventional Value Chain of Tea According to Kaplinsky 2000, value chain analysis helps in understanding the advantages and disadvantages of firms and countries specializing in production rather than services, and why the way in which producers are connected to final markets may influence their ability to gain from participating in global markets The tea supply chain begins in a smallholder farm or a plantation, where the tealeaves are grown and plucked. Small farmers sell their crop to middlemen, plantations and or to ‘bought leaf’ factories i.e. factories that buy up the raw tea (Oxfam 2002). According to Narrod et al. (2007), once tealeaves are harvested, they are then either transported to a bought-leaf factory, in the case of smallholders, or processed in the factory on-site, in the case of large plantations. He further notes that in most cases it is the factory that collects the leaf directly from the smallholder, with whom there is usually a contract, and middlemen are less of an issue with tea than with coffee. It is important to point out that the role of middlemen within the Kabarole tea industry has under gone dramatic transformations within the last three years. It is true that compared to the coffee middlemen, the tea middle men are a recent development in the industry. However their influence on farmers implies that they cannot be ignored.

7
Prices for smallholder tea tend to be lower than prices for plantation tea because of the generally lower quality. Compared to large plantations that are often run by multinationals with access to the latest technical information, smallholders lack the knowledge of how to pick and store the leaves properly, and how best to treat the bushes and the land. This situation is exacerbated because often they do not have the capital to be able to afford the necessary technical inputs like fertilizers (Narrod et al., 2007). Processing is done in the producing country because tea must be processed within hours of its being picked to maintain quality (Ontita, 2007). The tea is then usually taken to the auction centre, where its price is determined on a week to week basis. Only about 16% of tea is sold outside the auction centres through direct contracts (FAO, 1999) There are two auction centers within Africa with the major center at Mombasa, Kenya and the minor auction center at Limbe, Malawi (Agritrade, 2008). Tea supplied by small farmers has the sometimes-justified reputation of being inferior to plantation grown tea, which depresses their prices (SOMO, 2006). According to UTA (2007), 97.2% of tea produced in Uganda is exported while 2.8% is used for domestic consumption. Exportation of Ugandan tea is through the Mombasa auction, which markets to worldwide destinations as shown in figure 3 below.
U.A.E4% U.K
17%
RUSSIA4%
OTHERS14%
AFGHANISTAN8%
SUDAN7%
EGYPT19%
PAKISTAN23%
YEMEN4%
Figure 3 Percentages of Tea Exports from Mombasa by Buyer, 2007 Source: East African Tea Trade Association (EATTA) Value is added to the tealeaves at each stage of the supply chain, each with associated costs. These costs include; harvesting and sorting, processing, packaging, internal transport, warehousing, sales charges, freight, insurance, interest, blending, packaging and retailer sales cost (SOMO, 2006) There are also secondary stakeholders, who are not directly involved in the abovementioned activities, e.g., auctioneers, traders, shipping companies, warehousemen, bankers, but who are nevertheless affected by, or who are having an effect on the activities of the primary stakeholders. The tea chain can be characterized as a vertically integrated production chain, in which direct links between manufacturers and producers are common (SOMO, 2006). 2.4 Fair trade Value Chain of Tea The primary aim of fair trade is to improve the livelihood of marginalized producers in developing countries by developing more direct, equitable and long term trading relationships. Central to the fair trade concept is the notion of empowerment: smallholders and workers are required to organize and co-operate, to strengthen

8
their position in the trade chain. The unique aspect of the fair trade system is the premise that fair trading practices are the key to improving the situation of producers. Therefore, buyers must pay a price that covers the costs of socially and ecologically sustainable production; pay a premium specifically for social and economical development of the workers or small farmers; pre-finance the trade if necessary and aim for long term contracts (Agritrade, 2008). Fair trade involvement at Mpanga Grower’s Tea Factory Limited is due to the fact that it’s a smallholder’s factory. Out of the total 1,274 Ha serving the company, the smallholder farmers’ account for 1,074 Ha or 84.3% of the acreage (Mpanga Field Report, 2007) In many ways the cultivation of tea is very attractive to smallholders because tea provides work and income throughout the year, requires little investment and the risk of disastrous crop failure is fairly low (Narrod et al., 2007). Smallholder supply chains are confronted with limited economies of scale no matter what sort of value chain they are engaged in. The constraints range from small production quantities and heterogeneous quality of produce to limited access to input supplies, capital, market information and the necessary farm management skills (Jones et al, 2000). In appreciating the role of fair trade in cash crops, an examination of the fair trade coffee movement provides interesting findings. Detailed studies on the coffee cooperatives in Mexico found that fair trade strengthened producer organizations (Jaffee, 2007). According to Murray et al. (2003), fair trade initiatives substantially improved the well-being of small-scale coffee farmers and their families, particularly due to better access to credit facilities and improved capabilities to enhance the quality of the product. Fair trade farmers were also more successful in diversifying their production and experienced greater satisfaction in terms of prices obtained for their crop (Becchetti and Costantino, 2006). The fair trade tea industry is growing rapidly, from 1,964 tons in 2004, to 5,413 tons in 2007, representing a 175% increase in three years. But this still represents only 0.5%, 2% and 5% of the market shares in the UK, Germany and Switzerland respectively in 2005. Farmers who grow tea for the UK fair trade brand, Tea direct receive a guaranteed minimum price of US$1.95/kg, some 40 cents a kilogram higher than the Mombasa auction price in early 2005 (Fair trade Foundation 2008). In addition, a premium of €0.50/kg is paid to all fair trade processors to improve the socio-economic situation of the workers, their families and the community. According to the Fair Trade Foundation (2008), once the primary product is sold to a registered fair trade importer, the costs are similar to those for a conventional product. This implies that differences between the two tea value chains are mainly experienced prior to this point.

9
CHAPTER 3 METHODOLOGY 3.1 Study Area Kabarole district is located in Western Uganda at a road distance of 320kms from Kampala, the capital city. The district lies between 0’ 15’N - 1’ 00’ N latitudes and 30’ 00’ S - 31’ 15’S longitudes (Kabarole District Local Government, 2008). Agriculture is the heart of the district’s economy with a number of households relaying on agriculture for their food and nutritional needs. The district grows both food and cash crops with the common crops being bananas and tea respectively (Kabarole District Local Government, 2008).
Figure 4 Map of Uganda showing Kabarole District Source: Kabarole Local Government
Despite the fact that most farmers practice subsistence type of farming, there is always surplus that is sold to the markets. The district cash crops include mainly tea and robusta coffee which contribute a substantial percentage to the national economy. The district is also among the few in Uganda which grow high quality tea.
3.2 Research Framework The research fieldwork was conducted within Kabarole District, Uganda from 21st July 2008 until 17th August 2008. The study involved both qualitative and quantitative approaches based on empirical data, literature review and documents. The research data was collected by use of a survey and two case studies. The survey targeted smallholder tea producers i.e. farmers with less than five (5) hectares of total tea acreage and the two case studies involved tea processing factories. The study focused on smallholder tea farmers because they are the subject of interest in the competition between the two factories and the primary target group under fair trade. The two case studies involved the fair trade value chain of Mpanga Grower’s Tea Factory Limited and the conventional value chain of Kiamara Tea Factory Limited.

10
3.3 Survey The survey was conducted among smallholder tea farmers in Kabarole District which is the leading tea producing district of Uganda. Three different clusters of farmers were established; farmers supplying all their produce to the conventional chain, farmers supplying all their produce to the fair trade chain and farmers supplying both the fair trade and conventional chains simultaneously. The formation of the three clusters was done to enable the comparative study of the conventional and fair trade value chains. The three clusters were established out of the total population of 835 smallholder tea farmers registered to both Mpanga Grower’s Tea Factory Limited and Kiamara Tea Factory Limited. Simple random sampling was then applied within each cluster to produce a representative sample of fifteen (15) farmers per cluster and a total of forty five (45) farmers. The clusters were used to compare the competitiveness of the fair trade value chain in relationship to the conventional value chain among smallholder tea producers. This was achieved through identifying and analyzing the indicators used by farmers in marketing their tea to the buyers. Questionnaires translated into Rutooro, which is the local language in Kabarole district were used to collect data. All questionnaires were administered to smallholder farmers after 14:00hrs and within their gardens. The questionnaires focused on their marketing alternatives, constraints faced in tea production, indicators of importance in marketing tea, opinion of fair trade production standards, benefits under both value chains and how to increase leaf supply into fair trade. (Related to Sub Questions 1, 3, 4, 5, 6 and 7) 3.4 Case Study 1 The first case study was conducted at Mpanga Grower’s Tea Factory Limited with two (2) members of management and two (2) tea extension officers. Interviews tackled issues related to the role of the different stakeholders in the fair trade value chain, constraints within the value chain, key performance indicators used to evaluate the chain performance, benefits of increasing leaf supply and areas, if any, for further improvements. (Related to Sub Questions 2, 3, 4 and 8) 3.5 Case Study 2 The second case study was conducted at Kiamara Tea Factory Limited with one (1) member of management and two (2) division field officers. Interviews tackled issues related to the role of different stakeholders in the conventional value chain, constraints within the value chain, and key performance indicators used to evaluate the chain performance. (Related to Sub Questions 2, 3, and 4) 3.6 Data Analysis The comparative analysis involved use of the value chain analysis (VCA) tool. The competing value chains were mapped together to include all the chain actors, supporters and influencers. The information was then used to identify the various stakeholders and investigate their roles. The assessment into competitiveness of the tea value chains at farmer level was done by studying the opinion of the producers on key chain performance indicators (KPI), then comparing the data on both chains through clustered bar charts, graphs and the cross tab test within the SPSS statistical computer program. Data collected from the two (2) case studies concerning green leaf market share and auction performance were plotted to reveal trends within the two value chain systems. The plots were then compared to reveal differences, if any, in performance.

11
CHAPTER 4 RESULTS 4.1 Smallholder Marketing Alternatives and Buyer Requirements. The tea value chain comprises all the stages from green leaf production through conversion into a bulk packaged product available for blending and sale to consumers (Wal 2008). The study established that smallholder farmers within Kabarole district have the ability to sell their leaf to two different value chain systems as shown in figure 5 below.
Fertilisers Plant Purchase Process Marketing Distribute. Distribute Consumption Herbicides Quality Bagging Retail
Figure 5 Value Chain Map of the Conventional and Fair Trade Chains Figure 5 above illustrates the organisation of the fair trade and conventional tea value chains of Mpanga Grower’s Tea Factory Limited and Kiamara Tea Factory Limited respectively. The organisation of the two chains confirms the presence of both large estates and smallholders as stated by Mulley (2004) that tea producers within Kabarole district range from large multinational companies with hundreds of hectares, to smaller individually owned plots with holdings as small as 0.1 ha. The study of the leaf marketing activities by smallholder tea farmers revealed that the farmers sell their leaf to; middlemen, plantation factories and cooperative owned factories. The middlemen are employed to buy leaf on behalf of the plantation factories which represent the conventional value chain system while the cooperative owned factories represent the fair trade value chain. In both the value chain systems, the buyer collects the tea from designated leaf collection sheds. The farmers are not charged directly for the leaf collection service however the buyers’ factor in the cost of this service when deciding the price to pay the smallholder farmers. Prices paid by

12
the buyers are usually determined by market forces and are always under constant review according to market trends. In the case of the fair trade factory, the price offered to the different farmers per kilogram of green leaf is identical however the survey revealed price variations within the conventional value chain. Variation of between 10 to 20 Shs less the prevailing market price was noted among the farmers supplying their leaf into the conventional value chain. This situation was due to whether the leaf was purchased by the factory or its agent and the leaf quality harvested by the farmer. In the conventional value chain, prices for smallholder tea tended to be lower than prices for plantation tea because of the generally lower quality. Leaf quality in the fair trade value chain is set at a minimum of 35% good leaf while in the conventional chain; the minimum is 25% good leaf. The study determined in the survey that the requirements which smallholder farmers felt were significant to determining the purchase of their leaf varied from farmer to farmer. However there was a close correlation within each of the three different clusters. It is interesting to note that the hybrid buyer system i.e. farmers selling to both chains exhibited characteristics that were different from the two other clusters as shown in figure 6 below.
Which key requirement does you buyer consider when purchasing your leaf?
Signed contractual obligation
Shareholding status of
the farmer
Condition of the access
road
Recovery of debts
Quantity of leaf
Location of the leaf
shed
Leaf quality
Coun
t
12
10
8
6
4
2
0
Hybrid Buyer SystemConventional BuyerFair Trade Buyer
What kind of tea buyer do you sell to?
Figure 6 Key Buyer Requirements in the Marketing of Smallholder Leaf This finding of the research on farmers selling leaf to the hybrid buyer situation is that it is a complex group with multiple functions. The group has some related features in common with the fair trade and conventional value chain farmers and some differences as well.

13
4.2 The Roles of the Different Stakeholders in the Tea Value Chains. The research was able to identify the roles of the different conventional value chain stakeholders as stated in table 3 below. 4.2.1 Identification of Stakeholders in the Conventional Value Chain. Table 3 Conventional Chain Stakeholders and their Roles
Stakeholder Chain Position Roles
Input Suppliers Actor
Supplies farm inputs e.g. NPK [ 25:25:5 + 5S], glyphosate herbicide, etc
Machinery, tools and production equipments Consumables e.g. plucking baskets, cleaning
chemicals, fuels, packaging materials, etc.
Producers Actor
Cultivation and harvesting of tea bushes Manual transportation of the harvest to
designated leaf collection centres Leaf quality control through maintaining good
plucking standards
Leaf Transporters/ Middlemen Actor
Leaf quality control by rapid field checks Collection and transportation of leaf from the
collection centres to the factory Acts as a communication channel between the
factory and the producers
Processor
Kiamara Tea Factory Ltd
Actor
Payment for the collected leaf and processing it into black tea
Provides agro inputs e.g. fertilisers to smallholders through a credit scheme
Processing quality control Packaging and labelling of final product Coordinates marketing activities at Mombasa
East African Tea Trade Association (EATTA) Auction
Actor
Provides warehousing facilities and marketing opportunities to processors
Presents samples of tea invoices on offer to prospective buyers through printed catalogues
Generates market information to the buyers and processors on a weekly basis
Whole Sellers Actor
Purchases bulk tea from different processors at the auction
Implements shipment of tea worldwide Quality control and monitoring
Retailers Actor
Blending of bulk teas into branded tea Convenient Packaging and value addition Marketing and advertisements of the products Quality control and monitoring
Consumers Actor Purchases branded tea from the retailers Taste and preferences dictates market trends
Uganda Tea Association (UTA) Supporter Implements lobbying and advocacy services on
behalf of the tea industry in Uganda National Agricultural
Research Organization(NARO)
Supporter Research and development of high yielding,
drought resistant tea varieties Implements pest and disease control in tea
Government of Uganda Influencer
Construction of physical infrastructure and maintenance e.g. tea feeder roads
Formulation of agriculture sector polices

14
4.2.2 Identification of Stakeholders in the Fair Trade Value Chain. The study was able to identify the roles of the different fair trade value chain stakeholders as summarized in table 4 below. Table 4 Fair trade Chain Stakeholders and their Roles
Stakeholder Chain Position Roles
Input Suppliers Actor As in 4.2.1 above Producers Actor As in 4.2.1 above
Leaf Transporters Actor As in 4.2.1 above
Processor
Mpanga Grower’s Tea Factory Ltd
[Fair Trade Producer
Organization ]
Actor
Payment for the collected leaf and processing it into black tea
Provision of agro inputs to smallholders such as fertilisers and herbicides on credit
Provision of Farmer Tea Extension Services Processing quality control Coordinates marketing activities in Mombasa Redistribution of premium funds through
funding community projects under fair trade. East African Tea Trade Association (EATTA)
Auction Actor
As in 4.2.1 above
Fair Trade Whole Sellers Actor As in 4.2.1 above
Fair Trade Retailers Actor As in 4.2.1 above Consumers Actor As in 4.2.1 above Uganda Tea
Association (UTA) Supporter As in 4.2.1 above
National Agricultural Research
Organization(NARO) Supporter
As in 4.2.1 above
Fair Trade Labeling Organization
(FLO) Supporter
Management and administration of Fair Trade stakeholders world wide
Annual auditing and certification of Fair Trade actors through FLO CERT
Government of
Uganda Influencer As in 4.2.1 above

15
4.3 Farmer Constraints within the Value Chains. In considering the three study clusters at farmer level, it was realised that the problems that are consider most significant to the farmers do vary from one group to the next. The costs of agro inputs e.g. fertilisers was most pronounced among farmers selling to the fair trade buyer and those under the hybrid buyer system i.e. selling to both the fair trade buyer and the conventional buyer. Majority of the smallholder tea farmers selling to the conventional buyer however felt that the low green leaf price was more of issue than the cost of fertilisers as shown in figure 7 below.
Which problem do you consider most significant in negatively affecting your farming operations?
Low green leaf price
Reliable leaf collection transport
Availability of labour
Accessibility to technical / agronomic information
Cost of agro inputs e.g. fertilizers
Coun
t
10
8
6
4
2
0
Hybrid Buyer SystemConventional BuyerFair Trade Buyer
What kind of tea buyer do you sell to?
Figure 7 Key Farmer Constraints According to Marketing Channels The study further revealed that some constraints were cluster specific. It’s interesting to note that the fair trade cluster had constraints in more areas than the two other clusters. Labour availability and reliable leaf collection were additional constraints specific to the fair trade cluster while accessibility to technical or agronomic information was a constraint experienced specifically by farmers in the conventional value chain. It’s interesting to note that the hybrid system did not experience a group specific constraint. This could be partly because as they do not commit themselves to either of the marketing systems but rather take advantage of the strong points of both value chains.

16
4.4 Evaluation of the Conventional and Fair trade Value Chains. The research implemented this stage of the study by first determining the relevant indicators that could be employed to compare the two different value chains. This was achieved through the interviews with some farmers and meeting with the management of the two factories during the case studies. The research selected green leaf price and agro input pricing at farmer level due to their prominence in the survey as shown in figure 8 below.
Which key performance indicator do you consider when deciding on your buyer?
OtherPresences of the
buyer's extension services
Ability of the buyer to
offer agro inputs on
credit
Price offered for the green
leaf
Need for cash
transaction at farm gate
Availability of advance payment at the factory
Arrival time of the leaf transporter
Coun
t
6
5
4
3
2
1
0
Hybrid Buyer SystemConventional BuyerFair Trade Buyer
What kind of tea buyer do you sell to?
Figure 8 Key Performance Indicators Influencing the Farmers’ Choices At the processor level of the value chain, the study adopted the indicators of green leaf market share and the Mombasa auction prices as indicators to evaluate the competitiveness of the two value chains. This decision was based upon the case studies conducted with the management of the conventional and fair trade tea processors.

17
4.4.1 Green leaf Purchase Price The research findings on the green leaf price offered by the two factories to smallholder tea farmers over the last seven years are presented in figure 9 below. It was noted that the difference in price between the two value chains was marginal in the past.
Comparision of the Conventional and Fair Trade Green Leaf Price
0
50
100
150
200
250
300
2002 2003 2004 2005 2006 2007 2008
Period (Years)
Pric
e pe
r Kg
(UGX. S
hs)
MPANGAKIAMARA
Figure 9 Green Leaf Prices of the Conventional and Fair Trade Processor The research further revealed that in the year 2008, the two value chain systems are offering the same price per kilogram of green leaf that is bought from the smallholder farmers. 4.4.2 Cost of NPK Fertiliser Credit Scheme The research findings on the pricing of the agro inputs such as fertilisers were different from that of green leaf price. The conventional value chain was found to offer a more competitive price as shown in figure 10 below. The difference in pricing is mainly due to the fact that the conventional chain purchases larger quantities of inputs from agro suppliers who in return offer significant price discounts.
Comparision of NPK Fertiliser Prices Under the Conventional and Fair Trade Value Chains
0
20,000
40,000
60,000
80,000
100,000
120,000
2002 2003 2004 2005 2006 2007 2008
Period (Years)
Pric
e pe
r Ba
g (U
GX.
Shs
)
MPANGA NPKKIAMARA NPK
Figure 10 NPK Fertilizer Prices of the Conventional and Fair Trade Processor

18
4.4.3 Performance in the Smallholder Green leaf market Results obtained from the case study at Mpanga Grower’s Tea Factory Limited showed a significant decline in the purchased leaf quantity from Mugusu leaf collection centre and Kahangi leaf collection centre revealed a stagnant trend as shown in figure 11 below. This is mainly due to the fact that farmers having the option to sell outside the fair trade chain have done so.
Comparision of the Conventional and Fair trade Green Leaf Market Shares
0
20,000
40,000
60,000
80,000
100,000
120,000
2000 2001 2002 2003 2004 2005 2006 2007
Period (Years)
Gre
en L
eaf P
urch
ased
(Kgs
)
MPANGA KAHANGIMPANGA MUGUSUKIAMARA KAHANGI
Figure 11 Conventional and Fair trade Green Leaf Market Shares by Centre Information about Kiamara Tea Factory was obtained that revealed a slight growth in the quantity of leaf received by the factory over the same period from Kahangi. However the management did not further reveal the Mugusu statistics to the author. Further examination into the ability of the two value chains to attract farmers leaf involved a cross tabulation of the farmers in the hybrid system i.e. selling to both chains as shown in figure 12 below. It was noted that 6 out of 15 farmers sold equal portions of their harvest to the two chains, 2 out of 15 farmers sold more leaf to the conventional chain and 7 out of 15 farmers sold more leaf to the fair trade chain.
Count
0 0 0 0 0 0 0 0 2 20 0 0 0 0 0 0 6 0 60 0 0 0 0 0 1 0 0 10 0 0 0 0 1 0 0 0 10 0 0 0 1 0 0 0 0 10 0 0 1 0 0 0 0 0 10 0 1 0 0 0 0 0 0 10 1 0 0 0 0 0 0 0 11 0 0 0 0 0 0 0 0 1
1 1 1 1 1 1 1 6 2 15
405059606364677374
If selling to bothfair trade andconventionalbuyers, what isthe percentagesold to the fairtrade buyer perweek?
Total
26 27 33 36 37 40 41 50 60
If selling to both fair trade and conventional buyers,what is the percentage sold to the conventional buyer
per week?Total
Figure 12 Percentage Leaf Distribution by Farmers in the Hybrid System

19
4.4.4 Performance at the Mombasa Auction Sales As a result of the two case studies, the research was able to collect information on the selling price of the two factories at the Mombasa auction during the period of January 2008 to August 2008. A decision was made to analyse the selling prices of two selected primary grades that are good indicators of a factory’s market performance.
Comparision of the BP1 Market Prices of the Conventional and Fair Trade Processor
0
50
100
150
200
250
3 4 6 7 9 11 12 16 17 19 20 22 23 24 25 26 27 28 29 32 33
Mombasa Auction Number (Weeks)
Pric
e pe
r Kg
(US$
Cen
ts)
KIAMARAMPANGA
Figure 13 Conventional and Fair Trade BP1 Prices at the Mombasa Auction
Comparision of the D1 Market Prices for the Conventional and Fair Trade Processor
0
50
100
150
200
250
300
350
3 4 6 7 9 11 12 16 17 19 20 22 23 24 25 26 27 28 29 32 33
Mombasa Auction Number (Weeks)
Pric
e pe
r Kg
(US$
Cent
s)
KIAMARAMPANGA
Figure 14 Conventional and Fair Trade D1 Prices at the Mombasa Auction The broken pekoe (BP1) and the Dust 1 (D1) were selected and above in figure 13 and 14 are the results of the market trend analysis. Auctions at which one of the factories did not sell a particular grade were disregarded to enable complete data and enable drawing of unbiased observations.

20
4.5 Smallholder’s Satisfaction with the Fair trade Production Standards. In conducting the survey among fair trade producers, 10 out of 15 respondents felt satisfied with producing tea under the fair trade standards system. Five out of fifteen respondents responded as very satisfied when inquired of the same as shown in the figure 15 below.
How do you feel about producing tea under the fair trade standards?SatisfiedVery satisfied
Frequ
ency
10
8
6
4
2
0
Figure 15 Farmers Satisfaction with Fair trade Production Standards 4.6 Benefits for Smallholder Tea Producers under both Value Chains. Benefits that the smallholders associated with the different value chains varied according to the chain that the respondent below to and the type of buying system that the farmer subscribed to as shown in figure 16 below.
Which chain benefit do you consider most important?
OtherProvision of extension services
Offer of agro inputs on credit
Offer of paid employment for relatives by the
Company
Construction of social
infrastructure; roads,
boreholes, classrooms,
etc
Availability of advance
payment / soft loans at the
factory
Reliable and timely leaf collection
Coun
t
10
8
6
4
2
0
Hybrid Buyer SystemConventional BuyerFair Trade Buyer
What kind of tea buyer do you sell to?
Figure 16 Benefits Considered Significant by Farmers under both Chains

21
4.7 Improving Leaf Supply into the Fair Trade Value Chain. The study revealed that a number of the fair trade farmers were of the opinion that the most significant manner to increase the supply of leaf into the value chain would involve offering a higher price for the leaf purchased in relation to other buyers as shown in figure 17 below.
What needs to be done to increase the number of farmers offering their leaf to the fair trade chain?
Improve the Company's
management
Offer a bonus payments to farmers /
dividends
Provide cheaper agro inputs
Factory should give farmers tea plantlets
with contractual obiligations
Offer a higher green leaf price than the
competition
Freq
uenc
y
10
8
6
4
2
0
Figure 17 Farmer Recommended Strategies to Increase Leaf Supply A substantial number of farmers were of the opinion that offering tea plantlets as a revolving green loan to farmers could increase leaf supply in the long term. The point being that this would give the fair trade processor the moral authority to claim the harvest derived from these plantlets when they mature. 4.8 Expected Benefits of Improving the Quantity of Fair Trade Leaf. The study interviewed four respondents concerning the expected benefits that improving the quantity of fair trade leaf would have on the value chain. It was revealed by the respondents that the benefits would be mainly experienced in four aspects.
Figure 18 Expected Benefits of Improving Fair trade Leaf Supply According to the Factory Manager, it would improve on the capacity utilization of the factory’s two line system. Current machine utilization at the factory was noted at sixty

22
five percent however to ensure maximum machine productivity, it’s advisable to aim for eighty five percent utilization. Three respondents out of four were of the opinion that improving the quantity of fair trade leaf would aid the recovery of debts owed to the company by farmers. It was mentioned that some indebted fair trade farmers were selling their leaf into the conventional value chain system and therefore making it difficult for the fair trade processor to recover outstanding debts. Two respondents out of the four felt that it would improve profitability of the fair trade processor. One respondent was of the opinion that it would increase profitability of the company therefore improved payment of annual bonus to the members, the smallholder farmers. Two respondents out of the four were of the opinion that there would not be any directly related fair trade gain while the other two were not sure.

23
CHAPTER 5 DISCUSSION 5.1 Smallholder Marketing Alternatives and Buyer Requirements. In the case of the smallholder tea farmers in Kabarole district, the value chain begins with the agro input suppliers and ends with the tea consumers. In regards to the available marketing opportunities present to smallholder tea farmers within Kabarole district, the survey revealed that smallholder farmers sell their tea into two different and rivaling value chain systems namely the conventional and fair trade value chains. In the conventional value chain system, the smallholder’s leaf is bought by middlemen working as field agents of the conventional processor. The middlemen are most influential in encouraging farmers to divert their leaf supply from the fair trade chain into the conventional chain. They are able to achieve this through spending more time with the farmers compared to the fair trade extension officers. This higher degree of attention per farmer by the middlemen enables them to build better trust and rapport over time with the farmers. In the marketing of smallholder tea, there are a number of buyer requirements and the importance of each requirement is determined by the value chain system under which a farmer sells his leaf. Among farmers selling their leaf into the fair trade value chain and those in the hybrid buyer system, leaf quality is the most important requirement demanded by the buyer among others while in the conventional value chain, the buyer is more interested in the farmer’s ability to provide a viable quantity of leaf for collection as revealed in figure 6. Leaf quality in the fair trade value chain is set at a minimum of 35% good leaf while in the conventional chain; the set minimum standard is 25% good leaf. In addition to leaf quality, the fair trade value chain requires farmers’ selling points to be easily accessed in terms of proximity to the main road and condition of the village road. The fair trade chain was also noted for requiring that a farmer is a member of the organization to be able to sell his leaf into the system. This buyer requirement is as a result of the fair trade standards that demand exclusion of non fair trade produce from the value chain. In the case of the conventional value chain, it requires farmers’ selling points to be easy to access in terms of near to the main roads and good condition of the roads, presence of a signed contractual agreement between the farmer and the organization. Contracts are demanded by the conventional buyers to ensure that their interests were safe. 5.2 The Roles of the Different Stakeholders in the Tea Value Chains. The value chain of black tea produced from Kabarole District involves the chain actors, the chain supporters and the chain influencers. These elements of the chain constitute the stakeholders and their roles play an important part in the functioning of the value chain systems. 5.2.1 Agro Input Suppliers Agro input suppliers in both the conventional and fair trade value chains carry out the similar role of supplying farm inputs e.g. NPK fertilisers and herbicides. In fact there are cases were the same agro input supplier offers services to both the value chains. However the terms of trade between the agro suppliers and the two chain systems are not identical. With regards to the NPK fertiliser purchase price, the conventional value chain obtains the input at a relatively much lower price than the fair trade value chain. This is mainly due to the fact that the conventional value chain system

24
purchases the fertiliser in larger quantities compared to the fair trade value chain system hence qualifies for price discounts. The conventional chain is able to place large orders due to a centralised procurement system that works for the benefit of six (6) affiliated factories. The fair trade chain by comparison orders smaller quantities that do not merit price discounts and the improper procurement procedure creates the danger of inflated purchase prices. The research findings in relation to the cost of NPK fertiliser under the smallholder credit scheme revealed consistently higher prices in the fair trade value chain in comparison to the conventional value chain. Prices differed greatly between the two value chains as shown in Figure 10. It is evident that the fair trade value chain is not offering farmers a competitive price on fertiliser but this is closely relate to the fact that the organisations have differences in their trading relationships with the agro suppliers. 5.2.2 Producers Both the conventional and fair trade value chains have company owned estates that sell the harvested leaf directly to the parent organisation. In the case of the fair trade processor, approximately 20% of the green leaf purchased by the organisation is grown by its own estates while for the conventional processor, 78.5% of the harvest is derived from company owned estates. Therefore smallholder tea farmers contribute approximately 80% and 21.5% of the total leaf production into the fair trade and conventional value chains respectively. The trend of production under the fair trade vale chain is consistent with the fact that out of the total 1,274 Ha serving the company, the smallholder farmers’ account for 1,074 Ha or 84.3% of the acreage. To ensure high productivity of tea bushes during harvesting, farmers employ the use of NPK fertilisers at a recommended annual dosage of 8 bags per hectare. The farm inputs used by the farmers are provided by the conventional or fair trade processors under a credit scheme. After application of inputs, the farmers harvest manually the tea by plucking the top two leaves and the bud. At the end of harvesting, a farmer sorts out the coarse leaf from the harvest as a quality control measure then transports it to a designated leaf collection shed. During the wait for the leaf collection trucks, a farmer has time to consider to which value chain system he will sell his leaf. The farmer’s decision process is guided by the consideration of specific key performance indicators as presented in figure 8 and theses indicators have a serious implication on the leaf quantity purchased by each processors. According to Oxfam (2002), smallholders lack the knowledge of how best to treat the bushes and the land. It observes that this situation is exacerbated because they often do not have the capital to be able to afford the necessary technical inputs like fertilizers. Oxfam (2002) further noted that there is, however, some scope for small farmers to shop around for the best deal in different factories. This evidence of shopping around was confirmed by the study in the form of smallholder tea farmers selling into the hybrid buyer system. 5.2.3 Green Leaf Transporters Green leaf transportation is carried out by the private leaf collector hired by the fair trade processor and in the case of the conventional processor, transportation is carried out by the middlemen and the company owned leaf transportation service. Altenburg (2007) observed that if firms specialize in a certain stage of the value chain and establish linkages with input providers (upstream) and processors (downstream), this is usually referred to as vertical linkages. Therefore the relation between the middlemen buying leaf as agents of the conventional processor reveals the presence of vertical linkages within the actors of the conventional value chain system

25
Its normal practice within the conventional value chain that leaf from the company owned estates are transported using the company transport service and middlemen are used to collect smallholder’s leaf. The strategy being that the middlemen pay more attention to farmers in pursuing their leaf because middlemen are commission agents paid per kilogram of green leaf delivered to the conventional value chain. The middle men are therefore motivated to pursue leaf from smallholders and carry out more visits per farmer compared to the tea extension officers under the fair trade value chain. This is related to the fact that the middle men have contracts with measurable job performance indicators such as leaf quantity and quality delivered while in the fair trade value chain this role in not clearly defined between the tea extension service officers and the private leaf collection service. This grey area in leaf collection and transportation undermines the performance of the fair trade value chain in marketing itself to the farmers. This current state of affairs could be linked to the performance of the value chains in the Mugusu and Kahangi leaf collection centres as shown in figure 11. The ability of the green leaf transporters to collect farmer’s leaf on time is one of the issues that farmers considered most significant in affecting their farming operations (figure 7) and an indicator used to decided to which buyer they offered their leaf (figure 6). Hence the performance of the leaf collectors is directly linked with the performance of the value chains in the smallholder green leaf market and could be used as an indicator in their comparison. These finding aids in answering part of the research sub question four. In addition to leaf transportation, the leaf transporters carry out rapid field quality checks and are authorised to reject leaf if it does not meet the factories’ requirements. They are also used as a channel of communication between the factories and the growers. However in the case of the fair trade value chain this role is carried out hand in hand with the farmer tea extension services. 5.2.4 Tea Processors Tea processing involves the preparation of green leaf or withering, followed by leaf maceration, fermentation, drying, sorting and then grading into the respective grades for different market segments. Tea processing within the conventional value chain is carried out by a multinational company while the fair trade tea is processed by a large farmer’s cooperative. Both the conventional and fair trade processors exhibit the characteristics of large scale integrated factories. According to Gibbon (2001), tea needs to be processed industrially within a short time of picking while tea processing technology dictates that plants need a guaranteed throughput in order to function properly; therefore likely to be found large-scale integrated factory estates. The roles of the tea processors in both value chain systems are a point a difference. In the case of both value chain systems, the processors are involved in collection and payment for the leaf, provision of agro input to the smallholders on credit, processing quality control, packaging & labeling of the finished product and coordinating the tea marketing activities within the Mombasa auction. However in addition to the aforementioned roles, the fair trade processor undertakes the addition roles of providing a farmer tea extension service and construction of fair trade community projects. The formation of the fair trade processor, Mpanga Grower’s Tea Factory Limited was based on the fact that smallholder farmers were constrained in marketing their tea. The need for collective action is the strongest driving force within the fair trade processor organization while in the case of the conventional processor; it’s more of an opportunistic organization. Therefore the business model is the most significant difference among the processors and impacts on their activities and strategies within

26
the chain. As stated by Buckley (2007), small-scale producers often lack the confidence, skills, and experience to engage successfully in the market. He further noted that collective action can make a big difference, as producers no longer have to rely on their own skills and resources and do not have to face the risks of engaging in the market on their own. 5.2.5 Mombasa Tea Auction The East African Tea Trade Association’s Mombasa auction is held on a weekly basis at Mombasa, Kenya. The auction provides warehousing facilities at a fee to the processors marketing their produce through the auction floor. Both the conventional and fair trade processors have an agent based at the auction house referred to as a broker. The broker under takes the duties of carrying out sensory tests of the processor’s produces and offer the samples to the buyers prior to the auction date. The broker through close interaction from the auction association provides the processor with information on market trends and buyer feed back. The auction is the point of depart between the fair trade value chain and the conventional value chains. In the case of the fair trade processor, the auction handles 98% of the company’s productions while 2% is sold to the fair trade wholesalers. This current marketing segregation does not work much to the benefit of the fair trade processor. This is because 100% of the tea produced by the fair trade producer is fairly traded tea, which implies produced at a higher cost price, but only 2% draws benefits of fair trade. It is therefore one of the areas of constraint under the fair trade value chain. 5.2.6 Traders Traders under the fair trade and conventional chains involve wholesalers and retailers. The decision by wholesalers and retailers to buy a particular tea always begins with tea testing. This forms the main basis for the price offer at the whole seller and retailer level. In both value chain systems, the wholesalers and retailers are integrated into a single multinational company or part of a multinational company. The wholesalers and retailers play the role of purchasing bulk teas from different processors at the auction and in some cases from different world wide auctions. The tea is then shipped to various destinations for blending and packaging into branded teas. The fair trade traders though involved in similar activities as the conventional counter parts, operate a higher ethical standard due to the fair trade standards. 5.2.7 Consumers The role of the consumers of both fair trade and conventional tea are similar. The consumers purchase branded tea from the retailers for final consumption. The consumer tastes and preferences determine the market trends within the tea industry. Consumers are a very important part of the industry given they fact that they provide the purchasing power and they are more significant in the case of the fair trade value chain which sells into a niche market. 5.2.8 Chain Supporters According to Altenburg (2007) firms are connected with non-firm organizations, e.g. employer’s associations, trade unions, NGOs, universities and government agencies. He further notes that many of these relationships do not directly influence the process of value addition and should therefore be distinguished from vertical value chain links. The author is of the same opinion and therefore firms whose involvement does not directly influence the process of black tea value addition are discussed under chain supporters.

27
There is a number of different chain supporters involved with the two value chains. However a number of the chain supporters manifest identical roles within the two different value chains.
i. Uganda Tea Association (UTA). This is an umbrella association that involves the membership of all tea producers, processors and traders within Uganda. It is therefore a chain supporter for both the conventional and fair trade value chain systems. UTA conducts lobbying and advocacy activities on behalf of the tea sector on cross cutting issues that affect the tea industry.
ii. National Agricultural Research Organization (NARO). This is a chain supporter involved in ensuring that the research and development of high performance clone tea in Uganda is an ongoing process. The organization is also involved in the pest and disease control activity within the tea sector.
iii. East African Tea Trade Association (EATTA). The organisation was formed in
1957 to promote the best interests of tea trade in Africa. It’s an organisation bringing together tea producers, buyers or exporters, brokers, tea packers and warehouses, all working to promote the best interests of the tea trade in Africa. .
iv. Fair trade Labeling Organizations International (FLO). It’s an umbrella
organization that unites producers, buyers and customers of fair trade world wide. It’s the leading standard setting and certification organization for fair trade labeled products. Its roles include management and administration of the global fair trade movement.
5.2.9 Chain Influencer The Government of Uganda through the Ministry of Agriculture and the Ministry of Finance, Economic Planning and Development influence operations of the tea sector within Kabarole District. This is achieved mainly through policy formulation on agriculture and trade. The Government of Uganda is also involved in constructing and maintaining infrastructure used by the tea industry. 5.3 Farmer Constraints within the Value Chains. The study revealed an interesting phenomenon among the groups that were studied. It was revealed that the three groups of farmers did rate the indentified constraints differently and in some cases had completely different set of constraints. To ensure clarity in the analysis, the study was interested in a single constraint that the farmer felt was most significant in affecting his/her tea farming practise. In the conventional value chain system, three constraints were ranked as most significant. These were namely; cost of agro inputs, accessibility to technical / agronomic information and low green leaf price. Out of the three constraints majority of the farmers felt that low green leaf price was the major problem, followed by cost of agro inputs and finally accessibility to technical / agronomic information as shown in table 5 below. However in the case of farmers under the fair trade system, cost of agro inputs was ranked first among the constraints revealed. The farmer’s opinion on this matter is reinforced when a relation is drawn to figure 10 comparing the NPK fertiliser price offered by the conventional and fair trade tea factories to the smallholder tea farmers. It’s observed that the fertiliser under the fair trade system is consistently more expensive than that under the conventional value chain over a period of five years.

28
Table 5 Summary of Farmers Constraints by Value Chain System
8 6 10
2
2
1
4 7 5
Cost of agro inputs e.g.fertilizersAccessibility to technical/ agronomic informationAvailability of labourReliable leaf collectiontransportLow green leaf price
Which problem doyou consider mostsignificant innegatively affectingyour farmingoperations?
Fair TradeBuyer
ConventionalBuyer
Hybrid BuyerSystem
What kind of tea buyer do you sell to?
This study confirms that the cost of agro inputs is of real concern to smallholder tea farmers and more so to the fair trade farmers and those under the hybrid buyer system. According to Oxfam (2002), increasing costs are particularly hard on smallholders for on one hand, they pay more for inputs such as fertilizer as they do not buy in bulk, and on the other hand they have poor access to infrastructure. The reason as to why farmers in the hybrid buyer situation expressed most concern on the issue related to agro input is most likely based on the fact that since they are actors of questionable loyalty, both value chain systems are least likely to offer them fertilizer on credit. This is because the cost of the fertilizer is recovered by the processor through deductions to the value of green leaf delivered by the farmer. However this situation is not only due to the processor’s reluctance to offer fertilizers on credit. The farmers under the hybrid system are also reluctant to accept fertilizers from the processors on credit for it comes along with contractual obligations. However they prefer to maintain their freedom of choice when selling their tea leaves and would not like to be tied down to a specific value chain system. The study further revealed that some constraints were group specific. It’s interesting to note that the fair trade cluster stated challenges in more areas than the two other clusters (Table 7). Labour availability and reliable leaf collection were addition constraints specific to the fair trade group. This appears to contradict the theory that farmers under the fair trade system are faced with fewer constraints than though outside the system. In the conventional value chain accessibility to technical or agronomic information was a constraint experienced specifically to the group. This is easily explained by the fact that the conventional value chain system does not offer a farmer’s tea extension service. It was intriguing that the hybrid system did not experience a group specific constraint as the previous two clusters. However this could be an indication of the free riding phenomenon of this group of farmers were by the simply pick the better elements of the two competing value chains hence only experience constrains that occur in both value chain systems. The analysis of the three clusters enables the research to establish a clear understanding of the constraints that existent within the fair trade value chain. This finding contributes to the objective of the research because competiveness is directly linked to the degree of chain constraints. Understanding the constraints within the fair trade vale chain and formulating recommendations to reduce or eliminate them could encourage smallholder tea farmers to return. This would in return increase the supply of fair trade leaf.

29
5.4 Evaluation of the Conventional and Fair trade Value Chains Kaplinsky (2000) states that value chain analysis plays a key role in understanding the need and scope for systemic competitiveness. According to Altenburg (2007), firms generally do not become competitive on their own, that is, without a supportive environment of related suppliers and service providers as well as customers which are both reliable and demanding. Esser et al (1996) states that the concept of systemic competitiveness was developed in the 1990s by the German Development Institute and like the network approaches it argues that competitiveness of firms is dependent on the quality of inter-firm relations that define economic incentives. The study into competitiveness was initiated by first identifying indicators that would be used to compare the two value chains at the micro level of the chain. After careful consideration, the author selected the indicators of green leaf price and agro input pricing at farmer level due to the importance attached to the issues as shown in figure 8. The indicator of green leaf quantity trends and selling price at Mombasa auction were selected to examine the competiveness of the two value chain systems in being able to draw in smallholder’s leaf and offer better marketing prices. 5.4.1 Green Leaf Purchase Price The research revealed that the price of green leaf offered to the tea farmers was higher in the fair trade value chain compared to the conventional value chain in the past (Figure 9). The price difference was noted to be marginal at 10 Shs. per kilogram of green leaf. The research further revealed that to date, the two competing value chains are offering the same price of 250 Shs per kilogram of green leaf purchased. Therefore in relation to the green leaf price, no value chain has a competitive advantage over the other given the fact that they are offering the same price. The lack of a price difference however puts to question the ability of fair trade to make a difference in the livelihood of farmers. However this criticism could be countered by the fact that the fair trade processor markets only approximately 2% of the entire annual production into the value chain with 98% sold into the conventional market. In addition, fair trade is more than just about price advantages but rather about improvement in the livelihood of disadvantaged farmers with livelihood being a broader concept. 5.4.2 Fertiliser Credit Scheme The research findings in relation to the cost of NPK fertiliser under the smallholder credit scheme was the complete opposite with the case of green leaf. It was revealed that the cost of NPK fertiliser, which is one of the most expensive inputs used in the production of tea, was consistently higher in the fair trade value chain in comparison to the conventional value chain. Unlike in the case of green leaf price were by the two value chains were offering the same price for the produce in the current year, under the fertiliser scheme, prices differed greatly between the two value chains (Figure 10). In the current year, the conventional value chain is offering a 50kg bag of NPK fertiliser at 90,000 Shs while the fair trade value chain estimates to offer the same at 110,000 Shs. This is a significant difference of 20,000 Shs per bag. A number of farmers are well aware of the differences in price and this has been a point of difficult relations between the fair trade processor and the farmers. Some farmers are of the opinion that the fair trade processor is simply making an extra profit off them while others believe that it’s a case of the management failing to select the best price option in the agro input market. It is evident that the fair trade value chain is not offering farmers a competitive price on fertiliser. This finding can be related to the response by fair trade farmers concerning farming constraints as revealed in figure 7.
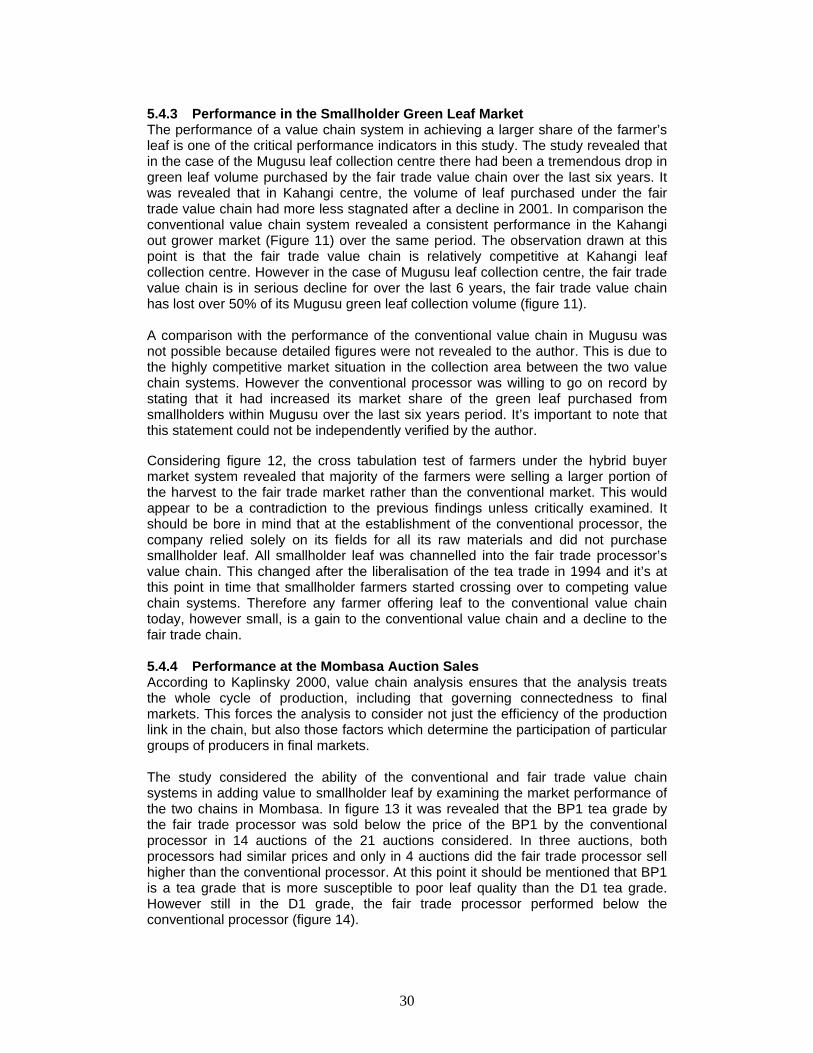
30
5.4.3 Performance in the Smallholder Green Leaf Market The performance of a value chain system in achieving a larger share of the farmer’s leaf is one of the critical performance indicators in this study. The study revealed that in the case of the Mugusu leaf collection centre there had been a tremendous drop in green leaf volume purchased by the fair trade value chain over the last six years. It was revealed that in Kahangi centre, the volume of leaf purchased under the fair trade value chain had more less stagnated after a decline in 2001. In comparison the conventional value chain system revealed a consistent performance in the Kahangi out grower market (Figure 11) over the same period. The observation drawn at this point is that the fair trade value chain is relatively competitive at Kahangi leaf collection centre. However in the case of Mugusu leaf collection centre, the fair trade value chain is in serious decline for over the last 6 years, the fair trade value chain has lost over 50% of its Mugusu green leaf collection volume (figure 11). A comparison with the performance of the conventional value chain in Mugusu was not possible because detailed figures were not revealed to the author. This is due to the highly competitive market situation in the collection area between the two value chain systems. However the conventional processor was willing to go on record by stating that it had increased its market share of the green leaf purchased from smallholders within Mugusu over the last six years period. It’s important to note that this statement could not be independently verified by the author. Considering figure 12, the cross tabulation test of farmers under the hybrid buyer market system revealed that majority of the farmers were selling a larger portion of the harvest to the fair trade market rather than the conventional market. This would appear to be a contradiction to the previous findings unless critically examined. It should be bore in mind that at the establishment of the conventional processor, the company relied solely on its fields for all its raw materials and did not purchase smallholder leaf. All smallholder leaf was channelled into the fair trade processor’s value chain. This changed after the liberalisation of the tea trade in 1994 and it’s at this point in time that smallholder farmers started crossing over to competing value chain systems. Therefore any farmer offering leaf to the conventional value chain today, however small, is a gain to the conventional value chain and a decline to the fair trade chain. 5.4.4 Performance at the Mombasa Auction Sales According to Kaplinsky 2000, value chain analysis ensures that the analysis treats the whole cycle of production, including that governing connectedness to final markets. This forces the analysis to consider not just the efficiency of the production link in the chain, but also those factors which determine the participation of particular groups of producers in final markets. The study considered the ability of the conventional and fair trade value chain systems in adding value to smallholder leaf by examining the market performance of the two chains in Mombasa. In figure 13 it was revealed that the BP1 tea grade by the fair trade processor was sold below the price of the BP1 by the conventional processor in 14 auctions of the 21 auctions considered. In three auctions, both processors had similar prices and only in 4 auctions did the fair trade processor sell higher than the conventional processor. At this point it should be mentioned that BP1 is a tea grade that is more susceptible to poor leaf quality than the D1 tea grade. However still in the D1 grade, the fair trade processor performed below the conventional processor (figure 14).

31
Hence in summary, the results reveal that the fair trade processor performed below the conventional processor on more occasions under comparison. The situation should be placed in to context. The leaf quality that a factory receives is a very significant parameter that affects its market prices at the auction and leaf quality is highly dependant on the ability of farmers to apply agro inputs such as NPK fertilisers. However the ability of farmers to use the NPK fertilisers is directly affected by the cost of the fertiliser. Therefore the higher cost of fertiliser discourages use of recommended dosage which affects the leaf quality of the fair trade processor and in return affects the market prices. This cyclic problem cycle can be broken through intervening at the point of higher fertiliser costs as shown in figure 19 below.
Figure 19 Cyclic Relation between Fertilisers and Market prices 5.5 Producing Tea under the Fair Trade Chain. According to FLO (2007), fair trade is an initiative for small farmers and wage workers in the South, who have been restrained in their economical and or social development by the conditions of trade. It further states that if fair access to markets under better conditions of trade can help to overcome the restraints of development, they can join fair trade. The study revealed that farmers under the fair trade value chain system were mostly satisfied with producing tea under the fair trade standards. 66.7% of the smallholders indicated that they were satisfied with producing tea under fair trade while 33.3% indicated that they were very satisfied (Figure 15). The findings of the research reveal that even with additional requirements, producing tea under the fair trade system does not impact negatively on farmers. This could be partly related to the fact that the fair trade standards are drawn up in a participatory approach. All actors in the value chain are invited to participant in the formulation of the fair trade standards hence it creates ownership among the stakeholders. In addition to creating ownership, it ensures that the standards are reasonable, achievable and effective. 5.6 Benefits for Smallholder Tea Producers under both Value Chains. Benefits that the smallholders associated with the different value chains varied according to the chain that the respondent belonged to and the type of buying system that the farmer subscribed to as shown in figure 16. In the group of farmers that supply leaf to the conventional processor, in their opinion the most significant benefit was punctuality. In regards to the farmers under the fair trade processor, the most

32
significant benefit of belonging to the value chain was availability of financial supporting system. In the case of the farmers under the hybrid buyer system, the most significant benefits under their arrangement was reliable and timely leaf collection along with availability of the farmer tea extension service. Interesting was the fact that the farmers under the fair trade value chain system did not view construction of fair trade infrastructure as benefits but rather its farmers under the hybrid system that appreciated this item. This could be associated with the fact that the fair trade farmers consider the fair trade projects as a given while the hybrid farmers are taking advantage given the fair trade principle of being all inclusive. None of the 15 fair trade farmers surveyed scored the construction of social community fair trade projects as a significant benefit but in comparison 5 out of 15 farmers under the hybrid system considered these structures as benefits (figure 16). The relation between what farmers considered to be the benefits of supplying leaf into a particular value chain system and the principle elements that they considered when deciding which buyer to sell their leaf to as shown in Figure 8 are closely related. There are 4 items that reoccur in both figures 8 and 16 i.e. reliable leaf collection, presence of advance payments, offer of agro inputs and the provision of extension services. The response of the conventional farmers in considering punctuality of leaf collection as a significant benefit offers an important intervention point for consideration by the fair trade value chain processor. This is due to the fact that the fair trade chain has had challenges in observing reliable leaf collection schedules in the past and to date. Improving this aspect would allow the fair trade value chain to compete favorably in the aspect of punctual leaf collection times which is a strongly desirable factor with some smallholder farmers. 5.7 Improving Leaf Supply into the Fair Trade Value Chain. The study revealed that a number of the farmers were of the opinion that the most significant manner to increase the supply of leaf into the value chain would involve having to offer a higher price for the leaf purchased in relation to other buyers as shown in figure 17. A significant number of farmers were of the opinion that the factory offering plantlets to farmers who sign committing themselves to provide the factory with the produce once harvested would be the best strategy. However this suggestion has its limitation in that farmers have on a number of occasions revealed a trait of not observing contractual obligations. In addition, the option of providing plantlets on credit to the farmers bear a close link to creating a bounded situation which is contrary to the principles of fair trade. The approach is also a very long term venture that would require a lot of patience and have a number of difficulties associated with the implementation. Principle among which would be the fact that at establishment a number of tea plantlets die out and do not come to bear. It would be difficult to make a farmer pay for such a plantlet but the cost still has to be recovered in one way or another. Finally the high inflation rate within Uganda would then complicate this venture much further given the fact that tea plants mature in four years. Additional suggestions made by the farmers to the study included; a need to provide cheaper agro inputs such as fertilizers, bonus payment to farmer or dividends and improve the management of the fair trade processor organization (figure 17). 5.8 Expected Benefits of Improving the Quantity of Fair Trade Leaf. During the case study that was conducted with the fair trade processor, it was revealed by the respondents interviewed that the benefits of improving the quantity of

33
fair trade leaf could occur in four areas. The research interviewed four respondents in relation to the expected benefits of improving the quantity of fair trade leaf supplied (figure 18). According to one respondent, it would improve on the current capacity utilization of the factory’s two processing lines. The current machine utilization stands at 65% but could be increased to 85% as recommended for maximum profitability. Three respondents out of the four interviewed were of the opinion that improving the quantity of fair trade leaf would improve recovery of debts owed to the company. This was related to the fact that some fair trade farmers were selling their leaf into the conventional value chain system and making it hard for the fair trade processor to recover outstanding debts. Two respondents out of the four interviewed felt that it would also improve profitability of the fair trade processor. It was mentioned by one of the respondents that it would place the company in a better financial position to increase bonus payments to its members. The bonus amount paid by the factory is UGX. 30/= Shs for all leaf that is supplied during the year. The figure is not static but has to be set by the fair trade Board of Directors before payment is effected. It was further interesting to note that most of the responses were given with the organization as the beneficiary rather than the farmers. Two respondents out of the four were of the opinion that there would not be any directly related fair trade gain. This was due to the fact that currently the factory has a quota to supply 48 tons of black tea to Café Direct, which is its only fair trade buyer. This reliance on a single fair trade buyer limits the amount of tea that the organization is able to sell into the niche market. The implications being that this is another point of constraint within the fair trade tea value chain. It is worth mentioning that all the persons interviewed gave responses with the factory as the main beneficiary. The implications being that most probably the respondents were experiencing a conflict of interest when responding to the questions.

34
CHAPTER 6 CONCLUSION AND RECOMMENDATIONS 6.1 Conclusion The report examined the fair trade and conventional value chain systems and after the comparative analysis a number of conclusions were drawn. It was noted that smallholder tea farmers sell their leaf to the middlemen, plantation factories and cooperative owned factories. The prices paid by the buyers are currently the same but over time the fair trade price has been a little higher. The different value chains showed related and at times different buyer requirements. In cases were the requirements were the same for both chains, variations were noted on the degree of importance attached. In regards to competiveness, the indicators chosen revealed that the conventional value chain was more competitive than the fair trade value chain. This was seen in the fact that it offered cheaper NPK fertilizers, retained its green leaf market share and enjoyed higher selling prices at the Mombasa auction. In regards to green leaf price, the conventional and fair trade value chains performed equally. 6.2 Recommendations The research findings identify channels that could be used to improve the quantity of leaf supplied into the fair trade value chain. The performance of the fair trade value chain in regards to the analyzed indicators could be improved by implementation of the following recommendations.
There is a need for the fair trade value chain processor to introduce measures that counter the influence of the conventional middlemen on the smallholder farmers. This is because the middle men are instrumental in the conventional chain’s competition with the fair trade chain. One of the reasons they are successful is due to the fact that they spend more time with the farmers. This allows them to build a better rapport with the producers which in turn places them in a good bargaining position to influence their buyer choice. At the initiation of the green leaf privatization program at Mpanga Grower’s Tea Factory Limited, the organization received application from farmers who were interested in purchasing green leaf from fellow farmers on behalf of the company. Their offer was not taken up at the time but recruiting such farmers to act as agents could be a channel to neutralize the advantages that the conventional middle men currently enjoy among the farmers.
It is also important that the organization creates a solution to the higher price at which the agro inputs are offered to farmers. The cost of the NPK fertilizer is a sticking issue in the relation of the factory and its growers. Price reduction could be achieved through firstly having in place a well written company policy on procurement procedure. This should be backed up with enforcement clauses and penalties for those who choose not to follow the procedure. This would minimize kickbacks within the system. The organization should then follow up on the Uganda Tea Associations proposal to purchase fertilizer on behalf of all its members. This would ensure large volumes are purchased from a single supplier hence price discounts. It would be unrealistic to expect all organizations to sign up to the proposal at start but having all smallholder tea factories in Uganda on board would be a significant amount of fertilizer at start. This intervention would aid in reducing a bit the price of fertilizer but it would still not be affordable to some farmers. Therefore the organization

35
should look into the prospects of reducing farmer dependence on inorganic fertilizers. Successful studies have been conduct concerning the use of compost manure in organic tea within Malaysia hence a study into the feasibility of using compost manure should be perused by the organization. Kabarole district has a lot of plant and animal refuse that could easily be used by the tea farmers as compost manure. Venturing into organic tea growing could further provide the organization with an opportunity for higher market prices that organic tea commands.
Improvement to the fair trade value chain should also involve strengthening
the marketing function of the organization. It was revealed in the study that the market prices of the fair trade processor were lower than the conventional processor. This is partly due to the comparatively lower use of fertilizer among the fair trade farmers which affects the factory tea quality. A way around this challenge is for the organization to sell more tea under the fair trade value chain. The fair trade processor has relied on a single fair trade buyer for over six years and sells only 2% of its total production into the fair trade market. This implies that the organization is not using its fair trade status to full benefit given the fact that all 100% of the tea is fair trade certified. It would be the duty of a marketing department to increase the sells but unfortunately the organization eliminated the marketing department in 1995. Perhaps this was not a wise decision. There is a need now to involve a professional marketing department run by competent individuals. Once appointed, the personnel should have clear and discussed job performance indicators. This would ensure that the company achieves value for money in the appointments.

36
REFERENCES
1. African Development Bank Report. 2002. Review of ADB Group Assistance to
the Agriculture and Rural Development Sector in Uganda - Technical Analysis of Key Findings. African Development Bank. Abidjan Cote d’Ivoire.
2. Agritrade, 2008. http://agritrade.cta.int/en/Resources/Agritrade-documents/Executive-briefs/Tea-Executive-brief (accessed 26/08/08)
3. Becchetti, L and M. Constantino. 2006. Fair Trade on Marginalized Producers: an Impact Analysis on Kenyan Farmers. Working paper CEIS 220 / ECINEQ2006.
4. Brad G. Mulley and Jon D. Unruh (2004). The role of off-farm employment in tropical forest conservation: labour, migration, and smallholder attitudes toward land in western Uganda. Elsevier Limited.
5. Daniel Jaffee, 2007. Brewing Justice: Fair Trade Coffee, Sustainability, and Survival. University of California Press. Berkeley and Los Angeles, California.
6. David M Kamau. 2008. Productivity and Resource Use in Aging Tea Plantations. Phd Thesis. Wageningen University, Wageningen. The Netherlands.
7. Esser K, Hillebrand W, Messner D and Meyer-Stahmer J, (1996): Systemic Competitiveness: New Governance Patterns for Industrial Development, London. United Kingdom (GDI Book Series No. 7).
8. Edward G Ontita. 2007. Creativity in Everyday Practice: Resources and Livelihoods in Nyamira, Kenya. Phd Thesis Wageningen University, Wageningen. The Netherlands.
9. Fairtrade Foundation. 2008. Review of UK Supply Chain, Returns to Producers, and Retail Margin Issues. http:// www.fairtrade.org.uk (accessed 31/09/2008)
10. Fair-trade Labelling Organizations International, 2007. Generic Fair-trade Standards for Small Farmers' Organizations. Version: 01.03.2007. FLO. Bonn, Germany.
11. FAO. 1999. Dealing with Price Risks: Intergovernmental Group on Tea. Committee on Commodity Problems, FAO. Rome. Italy
12. FAO, May 14th 2008 http://www.fao.org/newsroom/en/news/2008/1000836/index.html (accessed 22/09/2008)
13. Gereffi, G. 1994, “The Organization of Buyer-Driven Global Commodity Chains: How U. S. Retailers Shape Overseas Production Networks”, in G. Gereffi and M. Korzeniewicz (eds.), Commodity Chains and Global Capitalism, London: Praeger.
14. Gibbon, P. 2001, Upgrading Primary Production: A Global Commodity Chain Approach. In: World Development, Vol. 29, No. 2, pp 345-364.
15. Giel Ton, Jos Bijman and Joost Oothuizen. 2007. Producer Organizations and Market Chains: Facilitating Trajectories of Change in Developing Countries, Wageningen Academic Publishers, Wageningen. The Netherlands.
16. Jaffee, D. 2007. Brewing Justice: Fair Trade Coffee, Sustainability and Survival. Berkeley: University of California Press. United States of America.
17. Kabarole Local Government Report. 2008. Unpublished Literature. 18. KIT,Faida Mali and IIRR.2006. Chain empowerment: Supporting African
farmers to develop markets. Royal Tropical Institute, Amsterdam; Faida Market Link, Arusha; and International Institute of Rural Reconstruction, Nairobi.

37
19. Masinga, F., 2004. Green Tea Still Runs Half Circle, Uganda Communication Commission, District Information Portal, Kabarole www.dip.go.ug/news_details.php?more=17. (accessed 15/08/08)
20. Mpanga Field Report. 2007. Unpublished Literature. 21. Murray D., L. Raynolds and P. Taylor (2003) One Cup at a time: Poverty
Alleviation and Fair Trade coffee in Latin America. Colorado State University: Fair Trade Research Group.
22. Narrod, C., Roy, D., Okello, J., Avendano, B., Rich, K. and Thorat, A. 2000. The Role of Public-Private Partnerships and Collective Action in Ensuring Smallholder Participation in High Value Fruit and Vegetable Supply Chains. In IFPRI (Ed.) Washington D.C., United States of America.
23. Oxfam International. 2002. The Tea Market – a background study. Oxfam International. London. United Kingdom
24. Penrose-Buckley, C. 2007. Producer Organisations: A Guide to Developing Collective Rural Enterprises. Oxfam GB. United Kingdom.
25. Raphael Kaplinsky and Mike Morris 2000. A Handbook for Value Chain Research.IDRC. www.seepnetwork.org/files/2303_file_Handbook_for_Value_Chain_Research.pdf (accessed on 10/09/08)
26. Sanne van der Wal. 2008. Sustainability Issues in the Tea Sector: A Comparative Analysis of Six Leading Producing Countries. SOMO – Centre for Research on Multinational Corporations. Amsterdam. The Netherlands.
27. Stephen Jones, Brendan B., Nick R., and Sarah R., (2000) Fair Trade: Overview, Impact, Challenges Study to Inform DFID’s Support to Fair Trade. Oxford Policy Management. Oxford. United Kingdom.
28. SOMO, Profound and India Committee of the Netherlands. 2006. Sustainabilitea: The Dutch Tea Market and Corporate Social Responsibility. SOMO – Centre for Research on Multinational Corporations. Utrecht. The Netherlands.
29. Tilman Altenburg (2007) Donor Approaches to Supporting Pro-Poor Value Chains. A Report prepared for the Donor Committee for Enterprise Development Working Group on Linkages and Value Chains. German Development Institute. Bonn. Germany.
30. United Nations Development Programme (UNDP), 2008.Uganda Human Development Report 2007: Rediscovering Agriculture for Human Development. United Nations Development Programme. Kampala, Uganda
31. UTA, 2007. Unpublished Literature.

38
APPENDICES APPENDIX A: PRODUCER’S SURVEY QUESTIONNAIRE Tea Buying Centre: _________ Date: ______________ Village/Trading Centre: _________ Cluster Code: _____________ 1. On how many hectares of land is your tea plantation? _________ 2. How important is tea farming as a source of your agriculture income? � Unimportant � Not sure � Important � Very important 3. To what estimated percentage is your income dependant on tea? _________ 4. What kind of tea buyer purchases your tea leaf? � Fair trade buyer � Conventional buyer � Both 5. Approximately how much tea do you sell per week to your buyer/s during peak season and off seasons? _________ Peak season (kg per week) _________ Off season (kg per week) 5a. If selling to both fair trade and conventional buyers, what is the percentage sold to each buyer per week? _________ Conventional buyer (kg per week) _________ Fair trade buyer (kg per week) 6. How much money is currently offered by your buyer for a kilogram of your leaf? (If supplying both fair-trade and conventional, please state both prices as below) _________ Fair Trade _________ Conventional 7. According to your opinion, who decides the price at which your tea is bought? � Myself � Bargaining process between myself and the buyer � Buyer � Other (specify) _________
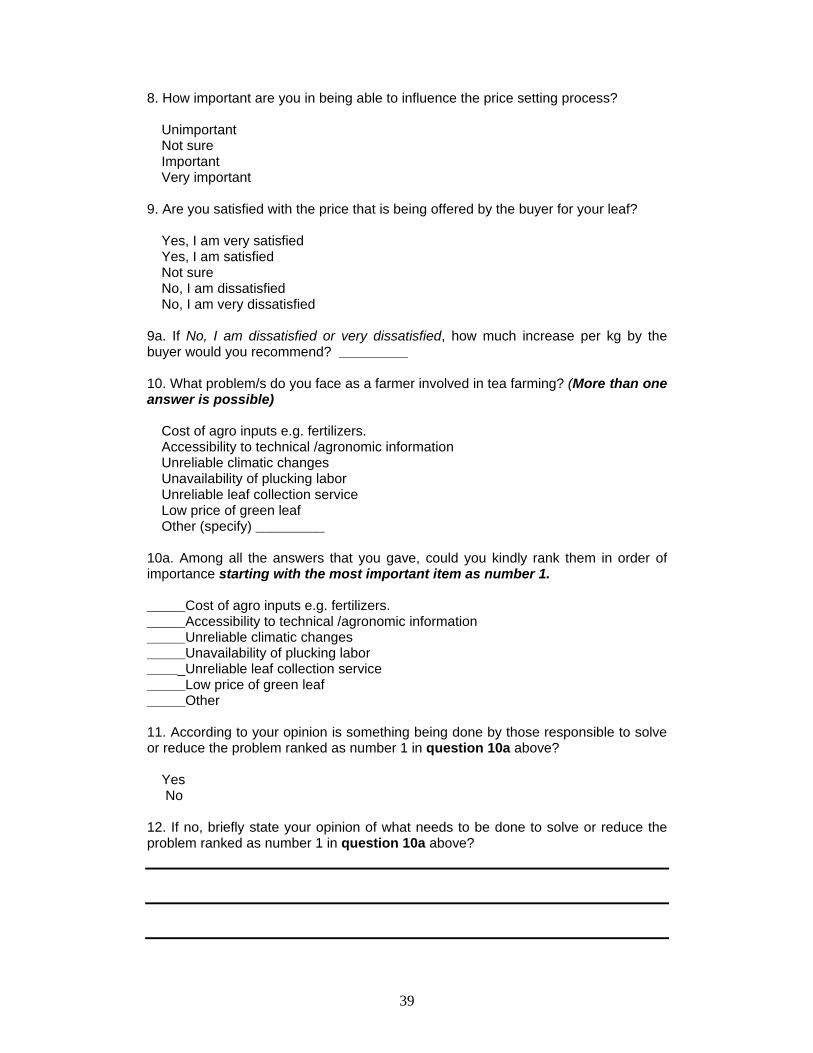
39
8. How important are you in being able to influence the price setting process? � Unimportant � Not sure � Important � Very important 9. Are you satisfied with the price that is being offered by the buyer for your leaf? � Yes, I am very satisfied � Yes, I am satisfied � Not sure � No, I am dissatisfied � No, I am very dissatisfied 9a. If No, I am dissatisfied or very dissatisfied, how much increase per kg by the buyer would you recommend? _________ 10. What problem/s do you face as a farmer involved in tea farming? (More than one answer is possible) � Cost of agro inputs e.g. fertilizers. � Accessibility to technical /agronomic information � Unreliable climatic changes � Unavailability of plucking labor � Unreliable leaf collection service � Low price of green leaf � Other (specify) _________ 10a. Among all the answers that you gave, could you kindly rank them in order of importance starting with the most important item as number 1. _____Cost of agro inputs e.g. fertilizers. _____Accessibility to technical /agronomic information _____Unreliable climatic changes _____Unavailability of plucking labor _____Unreliable leaf collection service _____Low price of green leaf _____Other 11. According to your opinion is something being done by those responsible to solve or reduce the problem ranked as number 1 in question 10a above? � Yes � No 12. If no, briefly state your opinion of what needs to be done to solve or reduce the problem ranked as number 1 in question 10a above?

40
14. How long have you been selling your tea to your current main buyer? _________ 15. What issues do you normally consider when deciding on which buyer to sell your leaf to? (more than one answer is possible) � Arrival time of the leaf transporter � Availability of advance payment at the factory � Need for cash transaction at farm gate � Leaf quality demanded by the buyer � Price offered for the green leaf � Ability of the buyer to offer agro inputs on credit � Presences of the buyer’s extension services � Other (specify) _________ 15a. Based on your answers given above under question 15, could you kindly rank them in order of importance starting with the most important item as number 1. ______Arrival time of the leaf transporter _____Availability of advance payment at the factory _____Need for cash transaction at farm gate _____Leaf quality demanded by the buyer _____Price offered for the green leaf _____Ability of the buyer to offer agro inputs on credit _____Presences of the buyer’s extension services _____Other 16. According to your opinion, what requirements are important to your buyer when he/she is deciding to purchase your leaf? (more than one answer is possible) 16a. Based on your answers above in question 16, could you kindly rank them in order of importance starting with the most important item of your buyer as number 1. [QTN. 17 TO BE FILLED BY ONLY THOSE SUPPLYING THE FAIR TRADE BUYER] 17. How do you feel about producing tea under the standards of the fair trade system? � Very satisfied � Satisfied � Not sure � Dissatisfied � Very dissatisfied

41
17a. If dissatisfied or very dissatisfied, which fair-trade issue is mainly responsible for your opinion? 18. What benefits do you directly associate with selling tea to your current buyer/s? � Reliable and timely leaf collection � Availability of advance payment/soft loans at the factory � Construction of social infrastructure; roads, boreholes, classrooms, etc � Payment of dividends � Offer of paid employment for relatives within the Company � Offer agro inputs on credit � Provision of extension services � Other (specify) _________ 18a. Based on your answers given above under question 18, could you kindly rank them in order of importance starting with the most important item as number 1. _____Reliable and timely leaf collection _____Availability of advance payment/soft loans at the factory _____Construction of social infrastructure; roads, boreholes, classrooms, etc _____Payment of dividends _____Offer of paid employment for relatives within the Company _____Offer agro inputs on credit _____Provision of extension services _____Other [QTN. 19 AND 20 TO BE FILLED BY ONLY THOSE SUPPLYING THE FAIR TRADE BUYER] 19. In your opinion, what needs to be done to increase the number of farmers supplying their leaf to the fair-trade buyer? 20. How confident are you that if your opinion under question 19 is adopted, there will be an increase in the number of farmers supplying leaf to the fair trade buyer? � Very Confident � Confident � Not sure � Un confident � Very Un confident