fairchem speciality limited - live stock market updates ...€¦ · fairchem speciality limited...
TRANSCRIPT
FAIRCHEM SPECIALITY LIMITEDWorks & Office :253/P & 312, Village -Chekhala, Sanand - Kadi Highway,
Taluka : Sanand, Dist.: Ahmedabad 382 115. INDIA.Phone (Board Nosj: +91 90163 24095 / +91 94099 58550
FAIRCHEM. E-mail: [email protected], [email protected] GIN: L15140MH1985PLC286828 Website : www.fairchem.inDate: August 06, 2019
To,National Stock Exchange of India Ltd.Exchange Plaza,Plot no. C/i, G Block, Bandra-kurla ComplexBandra (E)Mumbai —400051.
To,Department of Corporate Services,BSE Limited.Phiroze Jeejeebhoy Towers,Dalal Street,Mumbai -400001.
Ourselves: : BSE Code: 530117 and NSE Symbol: ‘FAIRCHEM’Dear Sirs,
Sub.: Corrigendum in Annual Report for F.Y. 2018-2019
We wish to inform you that the Company had mailed/dispatched the Annual Report for the F.Y.2018-19 to all the shareholders. Thereafter, it was observed that in the Extract of Annual Returnwhich is annexure to Directors’ Report on page no. 24 of the report, under IV ShareholdingPattern (i)(B)(2)(d) ‘Others (non-Residents), number of shares as at the end of the year, incolumns titled as ‘Physical’ ‘Total’ and ‘% changes during the year’, the number of shares/percentwere inadvertently misprinted in the Annual Report.
Therefore, the Company has published in all the editions of “Economics Times” corrigendum toAnnual Report F.Y. 2018-19 on August 06, 2019, a copy of which is enclosed herewith. TheCompany has also hosted the Annual Report 2018-19 duly incorporating the changes as per thecorrigendum on the Company’s website www.fairchem.in
We sincerely regret the inconvenience caused in the matter.
You are request to take above on your record.
Thanking you,
Yours faithfully,For F rchem Speciality Limited,
Raje ihaveriChie Financial Officer & Company SecretaryEnd: as above
Regd. Office : 324, Dr. D.N. Road, Fort, Mumbai —400001, INDIA
Till £COS oM)cTINls!~L ~Al!1t~ DAil~Al~t•lt w~*LtoKo.letl~i~ - ___cqmPaflieS & E~nOmy C~..jaq.. nw.qn, w,,....•
4FAIRCI-ILEM
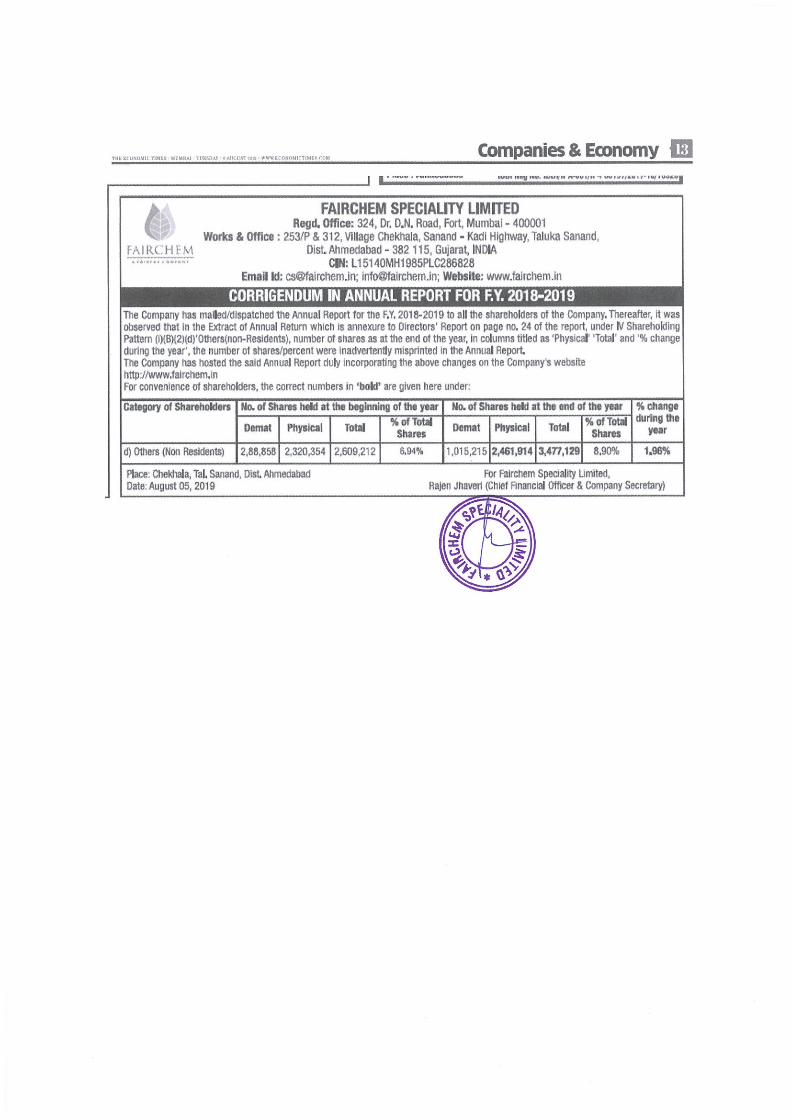
FAIRCHEM SPECIALITY LIMITEDRegd. Office: 324, Or, D.N. Road, Fort, Mumbai - 400001
Waits & Office : 253/P & 312, Village Chekhala, Sanand - Kadi Highway, Taluka Sanand,01st Mmedabad - 382 115, Gujarat, INDIA
till: Li 51 4OMHI 985PLC286828Email Id: [email protected]; [email protected]; Website: www.falrchem.ln
CORRIGENDUM IN ANNUAL REPORT FOR F.Y. 2018-2019The Company has maled/dispatched the Annual Report for tue F.Y. 2018-2019 to all the shareholders of the Company. Thereafter, It wasobserved that in the Eatraci of Annual Return which is annexure to Directorr Report on page no, 24 of the report under N ShareholdingPattern Q)(B)(2fl~’0thers(non.Resldents), number ot shares as at the end of the year, In columns titled as Physical ‘Total’ and ‘% changedunng the year’, the number of shares/percent were inadvertently nilsprlnted In the Annual Report.The Company has hosted the said Annual Report duly incorporating the above changes on the Company’s websltehttpt//www,tairciientinFor convenience of shareholders, the correct numbers in ‘bob’ are given here under:
Category of ~wstuldn No. of Shares lucId at the beglmilng of the vast No. of Shams held at the end of the year
Denial Physical Total
d) Others (Noci Residents) I 2.Sfi,858~ 2,320,354 1Z609212 I% of Toll
Shares
Place: Ct~diaIa, Tal. Sasiand, (list MniedabadDate: August 05, 2019
For Falichem Speciality Limited,Rajen Jhaved (Chief Snancial Officer & Company Secretar~

Annual Report 2018-19
1
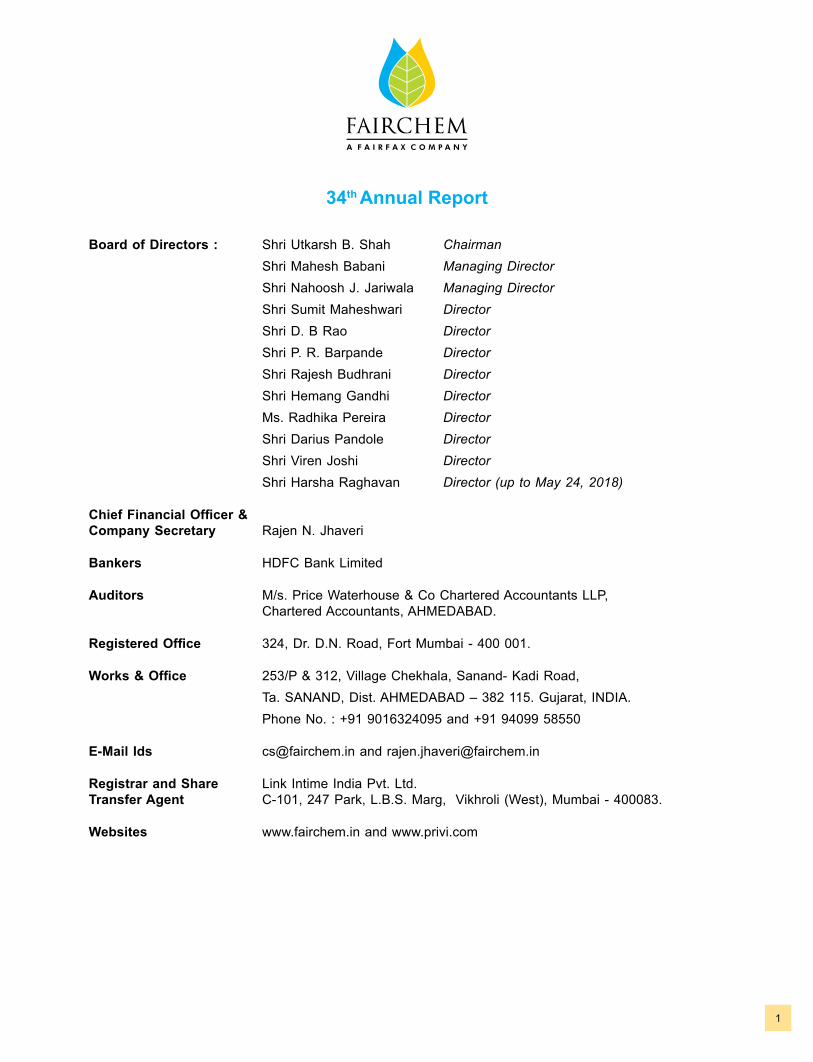
34th Annual Report
Board of Directors : Shri Utkarsh B. ShahShri Mahesh BabaniShri Nahoosh J. JariwalaShri Sumit MaheshwariShri D. B RaoShri P. R. BarpandeShri Rajesh BudhraniShri Hemang GandhiMs. Radhika PereiraShri Darius PandoleShri Viren JoshiShri Harsha Raghavan
ChairmanManaging DirectorManaging DirectorDirectorDirectorDirectorDirectorDirectorDirectorDirectorDirectorDirector (up to May 24, 2018)
Chief Financial Officer & Company Secretary
Rajen N. Jhaveri
Bankers HDFC Bank Limited
Auditors M/s. Price Waterhouse & Co Chartered Accountants LLP, Chartered Accountants, AHMEDABAD.
Registered Office 324, Dr. D.N. Road, Fort Mumbai - 400 001.
Works & Office 253/P & 312, Village Chekhala, Sanand- Kadi Road,Ta. SANAND, Dist. AHMEDABAD – 382 115. Gujarat, INDIA.Phone No. : +91 9016324095 and +91 94099 58550
E-Mail Ids [email protected] and [email protected]
Registrar and Share Transfer Agent
Link Intime India Pvt. Ltd. C-101, 247 Park, L.B.S. Marg, Vikhroli (West), Mumbai - 400083.
Websites www.fairchem.in and www.privi.com

2
FAIRCHEM SPECIALITY LIMITED
TABLE OF CONTENTS
Contents Page No.
Management Discussion and Analysis 3
Directors’ Report 11
Secretarial Audit Report 31
Report on Corporate Governance 34
Independent Auditors’ Report - Standalone 48
Balance Sheet - Standalone 54
Statement of Profit & Loss - Standalone 55
Statement of Changes in Equity - Standalone 56
Cash Flow Statement - Standalone 57
Notes to the Standalone Financial Statement 59
Independent Auditors’ Report - Consolidated 98
Consolidated Balance Sheet 106
Consolidated Statement of Profit & Loss 107
Statement of Changes in Equity - Consolidated 108
Consolidated Cash Flow Statement 109
Notes to the Consolidated Financial Statement 111
Form AOC - 1 162
Annual Report 2018-19
3
MANAGEMENT DISCUSSION AND ANALYSISGlobal Economic OutlookAs per the latest World Economic Outlook published by the International Monetary Fund (IMF) in April 2018, after strong growth in 2017 and early 2018, global economic activity slowed notably in the second half of last year, reflecting a confluence of factors affecting major economies. China’s growth declined following a combination of needed regulatory tightening to rein in shadow banking and an increase in trade tensions with the United States. The euro area economy lost more momentum than expected as consumer and business confidence weakened and car production in Germany was disrupted by the introduction of new emission standards; investment dropped in Italy as sovereign spreads widened; and external demand, especially from emerging Asia, softened. Elsewhere, natural disasters hurt activity in Japan. As a result of these developments, global growth is now projected to slow from 3.6 percent in 2018 to 3.3 percent in 2019, before returning to 3.6% in 2020.
Indian Economy:As per the latest Bi-monthly policy statement of the Reserve Bank of India (RBI), India’s real Gross Domestic Product (GDP) for FY 2018-19 has been pegged down to 7.0%, revised downwards from 7.2% predicted earlier. On India’ external front, export growth remained weak in January and February 2019 while imports, especially non-oil non-gold imports, declined. The trade deficit narrowed in February 2019 to its lowest level in 17 months. Net FDI inflows were strong while foreign portfolio investors turned net buyers in the domestic capital market in Q4:2018- 19. India’s foreign exchange reserves were at US$ 412.9 billion on March 31, 2019.
With risks broadly balanced. GDP growth for 2019-20 is projected at 7.2 per cent: 6.8-7.1 per cent in H1:2019-20 and 7.3-7.4 per cent in H2.
While India will remerge as the Fastest growing medium sized economy in the world, there are the following events – some of which helps your company and some could pose some challenges:
a) International Crude Oil Prices: After a steady decline in Brent Crude oil prices in the last few months of 2018, reaching a low of $50.5 per barrel at the end of the 2018, the prices have steadily climbed up to $ 74 per barrel, and now softened a bit to $ 71.2 per barrel. The outlook for oil prices is that it is expected to remain at about $ 70 to $ 75 per barrel during 2019. The increase in crude Oil prices also leads to increase in the raw material prices of petroleum based products like Citral, Phenols, etc.
b) Global Growth: As the advanced economies and the EME continue to grow in 2018, it will have beneficial impact on the Indian economy. A 50-basis point increase in global growth, provides 20 basis point increase in the domestic growth. The US government has recently been showing signs of protectionism, which could dent the global growth and in turn the domestic economy.
c) Exchange Rate: With the US Fed having indicated that it is in favor of increasing the target interest rates in the US, and with increased Current account deficit, Indian rupee could be under pressure and could depreciate. For exporting companies, including your company, this is beneficial as the depreciation of the Indian rupee against the dollar helps in improving the revenues as well as net income.
Global Aroma Chemicals Market Overview: -Global Flavours & Fragrance (F&F) Industry is expected to reach USD 28 billion by 2022 (Source: Leffingwell report). Post 2000, Aroma Chemicals has been the fastest growing segment within F&F industry at CAGR of ~6.21% as compared to F&F growth of ~5%.
The aroma chemicals market was valued at US$ 4.09 billion in 2016 and is projected to reach US$ 6.6 billion by 2024, exhibiting a CAGR of 6.21% during this period, according to Market Report published by Transparency Market Insights.
Growing personal disposable income in emerging economies such as India, China and ASEAN countries coupled with increasing demand for cosmetics and homecare products resulted in the growth of aroma chemicals market.
Among the application of aroma chemicals, the cosmetic and toiletries segment held the highest market share in 2016 and is expected to show the same trend over the forecast years.
Europe accounted for the largest market share in terms of revenue and volume in the global aroma chemicals market in 2016-2017. The region is expected to retain its dominance throughout the forecast period, due to
4
FAIRCHEM SPECIALITY LIMITED
growing use of cosmetic and personal care products in European economies. In terms of revenue, Europe had a market share of 33.47% in 2016. (Source: Coherent Market report).
Europe is followed by North America and Asia Pacific in the market of aroma chemicals. The North American market growth is expected at a CAGR of 5.80% with Asia Pacific market with a CAGR of 7.15%. (Source: Coherent Market report). Asia Pacific is the fastest growing market and is expected to retain its dominance during the forecast period.
Growing population coupled with the increasing disposable income in economies such as India and china has fueled the growth of cosmetics, personal care, and home care products, in turn increasing the demand for fragrances thus leading to increased demand of aroma chemicals. Moreover, the growing retail sector in emerging economies of the region has made the availability easier of products, such as cosmetics, fragrance, soap, and detergents, which is further surging the market growth.
In terms of geographical regions, Asia Pacific is expected to be the major revenue contributor to the market in future. Rapid increase in population, rapid urbanization, women empowerment, increasing investments, and the rise in demand for better lifestyles are few factors that will drive market growth.
Presence of some of the major aroma chemical producers in Asia Pacific countries and the rising demand for aroma chemicals in these countries will also aid in the growth of the fragrance market in this region.
Regulations
Regulations are forcing companies to follow compliance, which could affect the market’s growth trajectory.
For instance, wastewater discharge during the production of various synthetic aroma chemicals consists of many effluents, which need to meet applicable regulations for such discharge. As regulations are getting stringent and are imposing various restrictions on the emissions, like waste water, air emissions etc producers are required to comply with the norms.
Growth drivers
As per market information, use of aroma chemicals so far was limited to the personal and household care sector. Market expansion and penetration of new generation lifestyle products like body deodorants has provided new market opportunities.
Demand for aroma chemicals is expected to rise especially in emerging economies such as India, China, Brazil and Africa. Rising income expected to drive increasing willingness among young consumers to spend on personal care products.
Shifting consumer preferences would create lucrative prospects for aroma chemicals market. Increasing market penetration and investment towards product development will help the aroma chemicals market to register strong growth in the forthcoming years.
With companies focusing on product diversification, consumers will have wider options to choose from. Spurred by these factors, the global aroma chemicals market will continue treading along a positive trajectory.
GLOBAL FLAVOUR AND FRAGRANCE INDUSTRY:The future of the global flavor and fragrance market looks impressive with opportunities in fragrance products, such as fine fragrance, cosmetic and toiletries, household and air care.
The global flavors and fragrances market size was valued at USD 20.75 billion in 2018 and is expected to expand at a CAGR of 4.7% over the forecast period 2019 – 2023.Increasing demand from application industries such as food, beverages, and cosmetics and toiletries is projected to drive the growth.
Emerging trends, which have a direct impact on the dynamics of the flavor and fragrance industry, include increased use of biotic ingredients and business expansion by major players in emerging markets.
On the basis of its comprehensive research, Lucintel forecasts that, fine fragrances, and household and air care are likely to experience the highest growth in the forecast period.
Within the global flavor& fragrance market, the beverage application is likely to remain the largest in the flavor segment during the forecast period, while soap & detergents is likely to be the largest in segment for the fragrance market.
Annual Report 2018-19
5
Industry Insights:Increasing disposable income in developing economies is projected to augment the demand for cosmetics, toiletries, perfumes, and soaps and detergents. This factor is anticipated to drive the market in near future. Natural fragrances are perceived to be safe, healthier and therapeutic. Natural flavor and fragrance ingredients are expected to grow rapidly owing to the rising preference for organic ingredients in food and personal care sector. Manufacturers engaged in developing natural fragrances often charge a green premium on their products.
The demand for synthetic fragrances is also predicted to witness a significant CAGR as they are long lasting, emit strong fragrance, and offer a greater freedom of creativity to manufacturers. Moreover, synthetic fragrances are less expensive compared to natural variants. Growing number of retail stores, new product launches, and economic prices of personal care products are anticipated to be extremely influential factors contributing to the growth of the fragrance market.
With Fragrances projected to expand at the highest CAGR over the forecast period. Increasing investment in new product developments to cater to demand from personal care, home care, automotive, pharmaceutical, and hospitality industries is projected to augment growth.
Manufacturers have integrated their production and distribution channels for better market approachability. Most companies are vertically integrated and produce products that cater to various applications. Manufacturers have to abide by manufacturing and labeling laws, regulations, and guidelines published by regulatory authorities such as Food and Drug Administration (FDA), U.S. Department of Agriculture (USDA), Health Canada, European Food Safety Authority, and World Health Organization (WHO).
Manufacturers also obtain certifications such as Kosher, Halal, and ISO to gain a competitive edge in the market. End-user business activities greatly influence financial condition as well as operations of raw material manufacturers and suppliers
Product Insights:Aroma chemicals are expected to hold the largest market share over the forecast period. Majority of demand for these chemicals is likely to come from fragrance industry. The demand for esters was valued at USD 5.73 billion in 2018. Increasing concern about fitness and well-being by people of all ages is likely to provide lucrative opportunities for aroma chemicals in fragrances. Increasing R&D investments is projected to further drive the demand for aroma chemicals over the forecast period.
Natural segment is estimated to witness the fastest growth over the forecast period. Rapid shift towards natural products, especially in developed countries is projected to drive the growth in the forthcoming years.
Global Flavors and Fragrances Market: Regional AnalysisRegions in which the global flavors and fragrances market is classified includes Europe, North America, the Middle East and Africa, Latin America, and Asia Pacific. Among these regions, Asia Pacific holds a dominating share in terms of revenue. Growing economic development in emerging countries like China and India are considered responsible for the dominance of Asia Pacific. Increase in per capita spending on consumer products in high-growth economies, such as China, India, South Korea, and Indonesia is also expected to drive the flavors & fragrances market in the Asia Pacific. In addition, emerging economies are growing at a significant rate; therefore, the investors are investing heavily in these markets. This is likely to create huge growth opportunities for the flavor and fragrances market. The demand for flavor and fragrances is expected to remain high in developed countries for example, in 2018 the U.S. holds’ 24% share of the total World demand and is projected to expand at a CAGR of 2.9% over the forecast period.
The fragrance segment is anticipated to grow owing to increased demand for the products from personal care, cosmetics, home care, therapy, oral care, and air freshener products. North America and Europe are anticipated to register growth owing to concentration of cosmetics industries in these particular regions.
Asia Pacific is expected to become the largest market and is also expected to witness above average growth over the forecast period due to strengthening economies, growing urbanization, changing lifestyle, and a rise in per capita income.
Indian Opportunities and Growth:With a large and growing demand and the resultant opportunities for Indian manufacturers, the market for
6
FAIRCHEM SPECIALITY LIMITED
Flavours& Fragrances and ingredients is set to serve up a spicy fare.
The global Flavours& Fragrances houses and some of the scaled up Indian players are directly aligned to the major FMCG players, and supply specific fragrance or flavour blends for specific products. Few FMCG players also have blending capability for some blends, for which they source ingredients directly from ingredient manufacturers. Indian ingredients manufacturers supplying to the global Flavours& Fragrances houses are very closely aligned with them. It is common for Flavours& Fragrances houses to develop new flavours or fragrances jointly with their ingredient suppliers. Flavours& Fragrances houses also inspect and formally approve their suppliers and require them to maintain international standards.
Based on their source and processes, flavour and fragrance ingredients can be broadly classified into –
(a) Essential oils: Concentrated liquids containing aroma compounds extracted from natural sources
(b) Aroma chemicals: Chemical compounds with a distinct smell produced synthetically through a chemical process, derived from natural or synthetic feedstock.
Fragrances are an important part of FMCG products. Despite constituting less than 1% of a product’s volume and under 10% of its total cost of production, fragrances are instrumental in creating a distinct product association with the consumers. India is also characterized by a large unorganisedFlavours& Fragrances blending market, estimated to be larger than the organised market, but difficult to quantify. The unorganised market largely caters to tobacco, incense (agarbatti) and other such end products with thriving unorganized markets by themselves.
The growth is driven by the following major factors1. Developing countries are witnessing growth of 13% in this category compared to the global growth of
4%. Large global players traditionally from developed countries are now targeting these geographies and expanding the market.
2. Higher consumer willingness to experiment with new flavours and fragrances: This trend has led to additional sales in developed markets where consumers have higher disposable incomes, and thus are willing to spend on non-essential sophisticated products across food categories.
3. A shift in perception of fragrance from being a nonessential attribute to an indispensable part of personal care: Fragrance was considered to be a discretionary attribute in several mass market products in developing countries, including China and India. However, with the increased penetration of scented personal care products in developing nations, fragrance is now perceived as more of a necessity than a luxury. Global market growth is primarily driven by Asian markets. These markets are expected to grow at 6.5% over the next 5 years, constituting ~ 30% of the global market by 2020.
4. Rural Penetration of FMCG: Marketing by FMCG companies has created demand for categories like deodorants, room fresheners and perfumed soaps in rural markets. This has opened up a new opportunity for the currently underpenetrated fragrance market (penetrated only to an extent of 0.5% of the potential market). Growth of aspirational products and growth of the rural retail sector will also help in driving demand.
5. Premiumisation: As Indian consumers graduate from using basic soaps and detergents to higher end products such as skin creams, lotions, hair gels and other specialized cosmetics products, the quality and value of the flavors and fragrances used in these products is expected to increase. Products like room fresheners and car perfumes are seeing increased penetration, bolstering the demand of flavors and fragrances. The air care market in India is expected to grow at 40% p.a.
In the aroma chemicals space, some large Indian players are Privi Organics India Limited and Eternis. For both these players, the majority of the revenue is contributed by exports. This is common across most scaled up Indian players.
Annual Report 2018-19
7
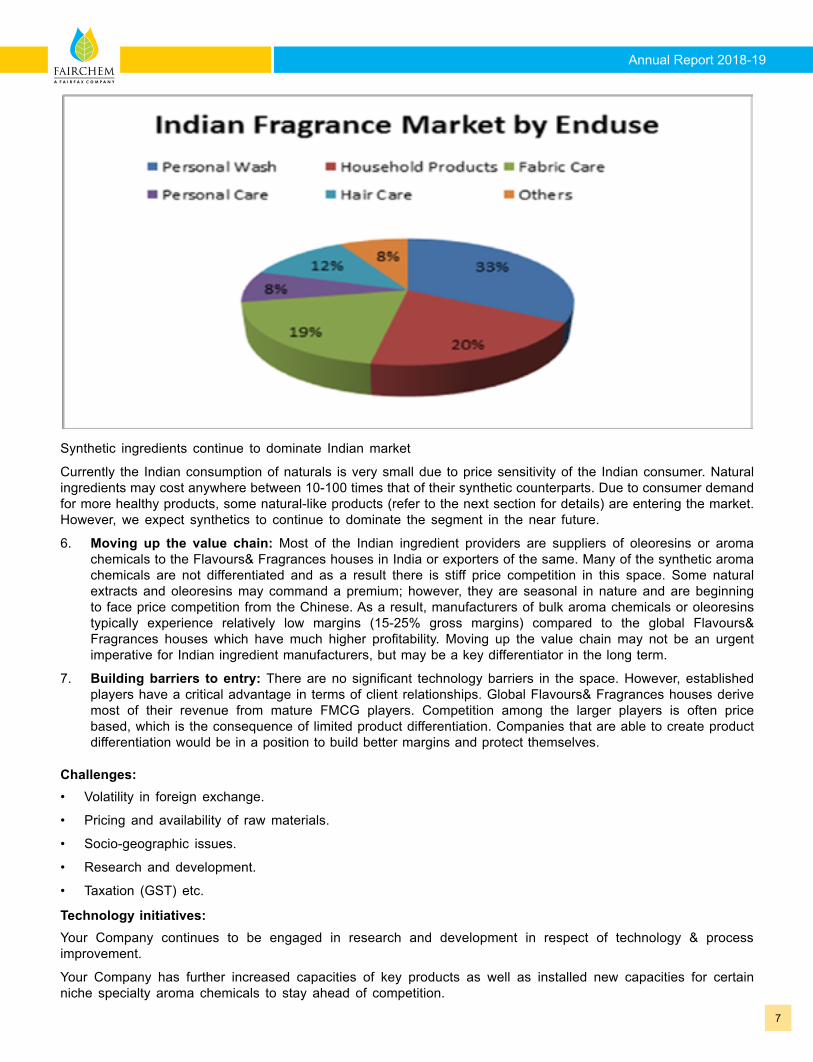
Synthetic ingredients continue to dominate Indian market
Currently the Indian consumption of naturals is very small due to price sensitivity of the Indian consumer. Natural ingredients may cost anywhere between 10-100 times that of their synthetic counterparts. Due to consumer demand for more healthy products, some natural-like products (refer to the next section for details) are entering the market. However, we expect synthetics to continue to dominate the segment in the near future.
6. Moving up the value chain: Most of the Indian ingredient providers are suppliers of oleoresins or aroma chemicals to the Flavours& Fragrances houses in India or exporters of the same. Many of the synthetic aroma chemicals are not differentiated and as a result there is stiff price competition in this space. Some natural extracts and oleoresins may command a premium; however, they are seasonal in nature and are beginning to face price competition from the Chinese. As a result, manufacturers of bulk aroma chemicals or oleoresins typically experience relatively low margins (15-25% gross margins) compared to the global Flavours& Fragrances houses which have much higher profitability. Moving up the value chain may not be an urgent imperative for Indian ingredient manufacturers, but may be a key differentiator in the long term.
7. Building barriers to entry: There are no significant technology barriers in the space. However, established players have a critical advantage in terms of client relationships. Global Flavours& Fragrances houses derive most of their revenue from mature FMCG players. Competition among the larger players is often price based, which is the consequence of limited product differentiation. Companies that are able to create product differentiation would be in a position to build better margins and protect themselves.
Challenges:• Volatility in foreign exchange.
• Pricing and availability of raw materials.
• Socio-geographic issues.
• Research and development.
• Taxation (GST) etc.
Technology initiatives:Your Company continues to be engaged in research and development in respect of technology & process improvement.
Your Company has further increased capacities of key products as well as installed new capacities for certain niche specialty aroma chemicals to stay ahead of competition.
8
FAIRCHEM SPECIALITY LIMITED
Your Company is now a leading producer globally in two of its flagship products - Dihydromyrcenol and Amber Fleur, which are important ingredients in the manufacture of Fragrances.
This will help the Company to increase its market share not only for its key products but also for the new products as its key customers would prefer to buy a basket of products from one stop shop.
Your company continues to be the largest single CST processing site in Asia, which is invariably the reason for survival and growth under the current volatile situation in respect of raw materials. CST also allows us to be self-sufficient on Key Raw Materials.
Your company has been investing and will continue to invest in forward looking technologies (like biotechnology) for future from the point of view of expanding into other industry segments.
Registration, Evaluation, Authorization and Restriction of Chemicals (REACH):
Your Company has registered 12 products and will be registering 3 more products under REACH. Your Company has already pre- registered all the products. This would provide an advantage to the Company over its competitors for sale in Europe.
OutlookYour Company has achieved a growth of over 37.64% in value over the previous year.
Your Company has exported its first consignment of Terpene-4-OL TO BASF which would be used in the production of Herbicides, which going forward would add a lot of value to the Top Line as well as Bottom line of the company.
With existence of our 100% Subsidiary in US, our market share continues to keep growing year on year. Your Company intends to penetrate North and South American markets further by:
1. Utilizing on the base created so far by our subsidiary.
2. Establishing an office in South American region.
Your Company has moved ahead on the path of expanding its global presence by way of setting up own office in Netherlands, which is a valuable step forward from strategic point of view for future growth.
Your Company continues to see its growth coming from key accounts in emerging and developing countries and its ability to provide a range of products.
Your Company has made inroads into the developing markets (Nigeria, Egypt, UAE, Pakistan, South Africa) by seeking more and more customers, case in study Reckitt Benckiser, the same helps Privi to propel the growth path further.
Your Company has started to sell value added products from backward integrated feedstocks, thus contributing to enhance the revenues.
Your company continues to establish strategic long-term business relations with global leading companies in F&F industry, like Givaudan, Firmenich, IFF and with well-known global leading FMCG producers, like P&G, Henkel, Colgate and the latest acquisition of Reckitt Benckiser as a customer that has the potential to contribute to an approximate topline revenue of USD 40 million going forward.
OLEO CHEMICALS AND NUTRACEUTICALS:
The Industry Structure And Developments:OELO CHEMICALS :
Oleo Chemicals are preferred since they are produced from biological fats or oils i.e. natural sources. The demand for biodegradable chemicals is supporting oleo chemicals market. Fatty Acids, methyl esters and fatty alcohols are major oleo chemicals manufactured in India. The Company is mainly in the business of Fatty Acids which is one of the largest segments in Oleo Chemicals. Dimer Acid, Linoleic Acid / Soya Fatty Acid, other Distilled Fatty Acids are the main products of the Company in Oleo Chemical segment.
Dimer Acid : Responding to the demand pull of Dimer Acid, the Company had increased its dimerizing capacity before the commencement of financial year 2017-18. The Company achieved a marked volume growth of about 35 % in sale of Dimer Acid during F.Y. 2017-18, inter alia, capturing a dominant share of Dimer Acid market in India. The Company was able to maintain the said volume during F.Y. 2018-19 which indicates that the quality
Annual Report 2018-19
9
of Company’s Dimer Acid is well accepted by one and all in India. During F.Y. 2018-19, the Company has made a small beginning of exporting Dimer Acid to nearby country also. Dimer Acid is used for making two kinds of polyamides i.e. Non-reactive and reactive. Non-reactive polyamides are used by manufacturers of printing inks, adhesives, paper coatings etc..Rising demand from industries such as printing inks, adhesives and paper coatings may drive global dimer acid market size for non-reactive polyamide resins. The demand for Reactive polyamide resins application will be driven by increasing surface coatings & adhesives demand in marine and construction.
Linoleic Acid / Soya Fatty Acid :While Dimer Acid was the focused product during F.Y. 2017-18, during F.Y. 2018-19, the Company worked on improvement in quality of Soya Fatty Acid and a result was able to push the sales of said product. The end use of both - Linoleic Acid and Soya Fatty Acid - is same i.e. for making Alkyd Resins which in turn is used in making paints. There is some qualitative difference. Linoleic Acid is a better product compared to Soya Fatty Acid and is preferred when premium / decorative grade paint is needed.
NUTRACEUTICALS :The word Nutraceutical is derived from two words viz. `Nutrition’ and `Pharmaceutical’. When used in food, it provides health and nutrition benefits in addition to basic nutrition value present in food items. The consumers are now more health conscious and better informed about such nutritional products. The Company is mainly in the business of (natural) Tocopherols and Sterols – intermediate nutraceuticals and they are exclusively exported. Tocopherols have anti-oxidant properties. Tocopherols, after they are further concentrated by customers, are then used in (a) Pet Food, (b) food as it prevents rancidity. Tocopherols when converted into Natural Vitamin E finds the application in Pharmaceutical, cosmetic etc.. Sterols after they are further concentrated, finds its use in making of Cortico Steroids and as food additive.
During the F.Y. 2019-20, the Company has planned to focus on this segment. It has carried out lab trials for achieving higher concentration of tocopherols and as a result thereof obtain separate stream of sterols which can further be processed for getting highly concentrated sterols.
Strengths, Opportunities and Threat :
The major strength in Oleo Chemical business is Company’s ability to process by-products having no technical specifications and make higher grade fatty acids and nutraceuticals intermediate finished products meeting stringent quality standards. The Company enjoys leadership position in its area of business. Another advantage in favour of the Company is its strong customer and supplier relationship of more than 15 years.
Ideally, there is a place for one company in this business of Oleo Chemicals and Nutraceuticals in India due to limited availability of one of the raw materials within India. The import of the said raw material is not a very viable proposition at current prices of raw material as well as prime finished product obtained therefrom.
HUMAN RESOURCE MANAGEMENT :Out of all the resources, human capital is of immense importance which may decide overall growth of Oleo Chemicals business. Human capital has the inherent capacity of delivering more than 100 % unlike other resources. During the year, the Company went for additional welfare measures to secure the employees of the Company. During the year, the industrial relations very cordial. As at March 31, 2019, the Company had 190 employees on the payroll of the Company.
OUTLOOK :The outlook of Oleo Chemicals business appears to be promising. The Company is continuously working on process optimization and strives to explore the ways to beat the inflation and thereby maintain / reduce per unit processing cost. This is one area where the Company benefits without any corresponding loss to either its customer or supplier of raw material and so this benefit is permanent.
INTERNAL CONTROL SYSTEMS AND THEIR ADEQUACY :There are adequate internal control systems for financial reporting. Internal audit has been done by a firm of Chartered Accountants. The Company is continuously exploring to strengthen its internal control either based on feedback of statutory / internal auditors or based on the need felt from day to day operations. With effect from December, 2018, entire finance dept. is shifted to the office at works and so now all the employees of the Company are at single location. This has its own advantages.
10
FAIRCHEM SPECIALITY LIMITED
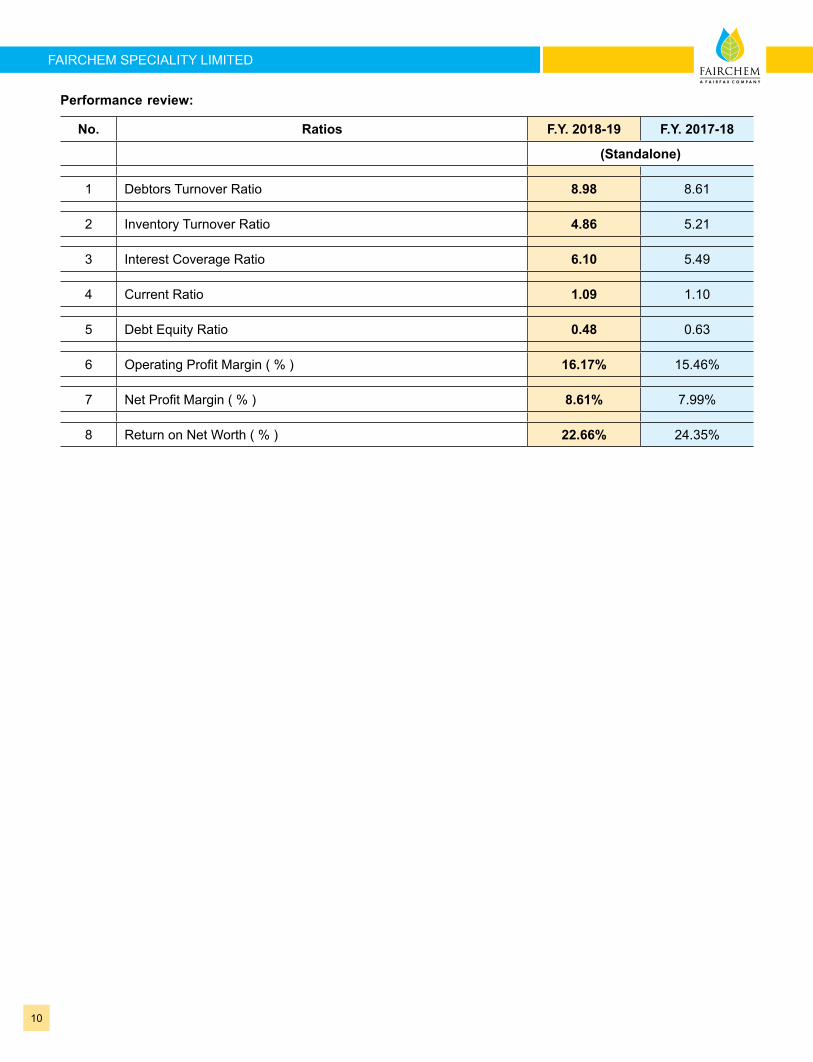
Performance review:
No. Ratios F.Y. 2018-19 F.Y. 2017-18
(Standalone)
1 Debtors Turnover Ratio 8.98 8.61
2 Inventory Turnover Ratio 4.86 5.21
3 Interest Coverage Ratio 6.10 5.49
4 Current Ratio 1.09 1.10
5 Debt Equity Ratio 0.48 0.63
6 Operating Profit Margin ( % ) 16.17% 15.46%
7 Net Profit Margin ( % ) 8.61% 7.99%
8 Return on Net Worth ( % ) 22.66% 24.35%
Annual Report 2018-19
11
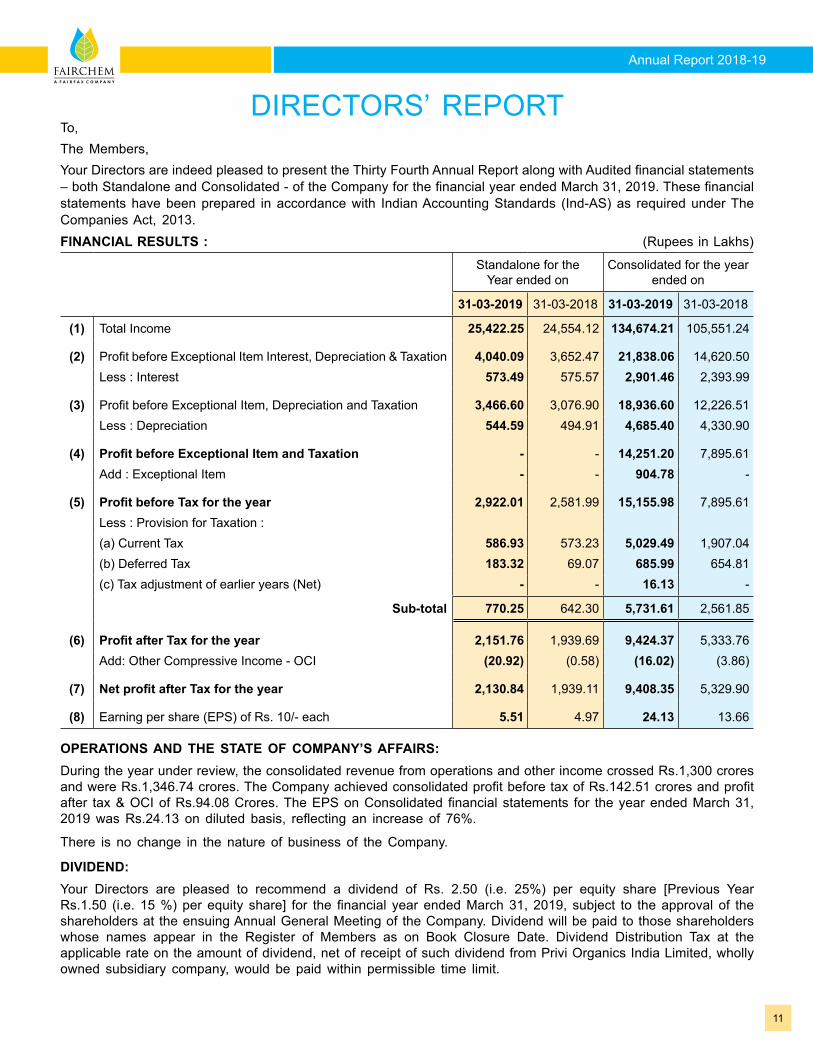
DIRECTORS’ REPORTTo,The Members,Your Directors are indeed pleased to present the Thirty Fourth Annual Report along with Audited financial statements – both Standalone and Consolidated - of the Company for the financial year ended March 31, 2019. These financial statements have been prepared in accordance with Indian Accounting Standards (Ind-AS) as required under The Companies Act, 2013.FINANCIAL RESULTS : (Rupees in Lakhs)
Standalone for the Year ended on
Consolidated for the year ended on
31-03-2019 31-03-2018 31-03-2019 31-03-2018
(1) Total Income 25,422.25 24,554.12 134,674.21 105,551.24
(2) Profit before Exceptional Item Interest, Depreciation & Taxation 4,040.09 3,652.47 21,838.06 14,620.50Less : Interest 573.49 575.57 2,901.46 2,393.99
(3) Profit before Exceptional Item, Depreciation and Taxation 3,466.60 3,076.90 18,936.60 12,226.51Less : Depreciation 544.59 494.91 4,685.40 4,330.90
(4) Profit before Exceptional Item and Taxation - - 14,251.20 7,895.61Add : Exceptional Item - - 904.78 -
(5) Profit before Tax for the year 2,922.01 2,581.99 15,155.98 7,895.61Less : Provision for Taxation :(a) Current Tax 586.93 573.23 5,029.49 1,907.04(b) Deferred Tax 183.32 69.07 685.99 654.81(c) Tax adjustment of earlier years (Net) - - 16.13 -
Sub-total 770.25 642.30 5,731.61 2,561.85
(6) Profit after Tax for the year 2,151.76 1,939.69 9,424.37 5,333.76Add: Other Compressive Income - OCI (20.92) (0.58) (16.02) (3.86)
(7) Net profit after Tax for the year 2,130.84 1,939.11 9,408.35 5,329.90
(8) Earning per share (EPS) of Rs. 10/- each 5.51 4.97 24.13 13.66
OPERATIONS AND THE STATE OF COMPANY’S AFFAIRS:During the year under review, the consolidated revenue from operations and other income crossed Rs.1,300 crores and were Rs.1,346.74 crores. The Company achieved consolidated profit before tax of Rs.142.51 crores and profit after tax & OCI of Rs.94.08 Crores. The EPS on Consolidated financial statements for the year ended March 31, 2019 was Rs.24.13 on diluted basis, reflecting an increase of 76%.
There is no change in the nature of business of the Company.
DIVIDEND: Your Directors are pleased to recommend a dividend of Rs. 2.50 (i.e. 25%) per equity share [Previous Year Rs.1.50 (i.e. 15 %) per equity share] for the financial year ended March 31, 2019, subject to the approval of the shareholders at the ensuing Annual General Meeting of the Company. Dividend will be paid to those shareholders whose names appear in the Register of Members as on Book Closure Date. Dividend Distribution Tax at the applicable rate on the amount of dividend, net of receipt of such dividend from Privi Organics India Limited, wholly owned subsidiary company, would be paid within permissible time limit.
12
FAIRCHEM SPECIALITY LIMITED
RESERVE :Your Directors have decided not to transfer any amount to the Reserve for the year under review.
MATERIAL CHANGES AND COMMITMENTS :
There have been no material changes and commitments which have occurred between the end of the financial year to which the financial statements relate and the date of this Report, affecting the financial position of the company.
CAPITAL STRUCTURE :
(a) During the year, Authorised Equity Share Capital of the Company was increased from Rs. 40.00 crores to Rs. 50.00 crores by way of creation of 10,000,000 equity shares of Rs. 10/- each
(b) During the year, 1,452,949 Compulsorily Convertible Preference Shares of Rs. 10/- each were converted, as per the terms of their issue, in equal number of Equity Shares of Rs. 10/- each fully paid.
MEETINGS OF THE BOARD :During the Financial Year 2018-19, 5 (five) meetings of the Board of Directors took place. For further details, please refer Report on Corporate Governance.
PARTICULARS OF LOANS GUARANTEES AND INVESTMENTS :The Company has not given any loan, made investment, given any guarantee or provided any security – covered u/s. 186 of The Companies Act, 2013 – to anyone.
MANAGEMENT DISCUSSION AND ANALYSIS REPORT :Management discussion and analysis, as required under SEBI (LODR) Regulations, is given in a separate section in this Annual Report.
CORPORATE GOVERNANCE/MANAGEMENT DISCUSSION AND ANALYSIS REPORT :A Report on the Corporate Governance Code along with a certificate from a practicing Company Secretary regarding the compliance of conditions of Corporate Governance as stipulated in Regulation 34 of SEBI (LODR) Regulations, 2015 is annexed to this Report.
FIXED DEPOSITS :During the year, Company has not accepted any Fixed Deposits.
CREDIT RATING :CARE Ratings Limited carried out annual review of credit facilities of HDFC Bank and vide its letter dated June 26, 2018, has revised / upgraded its rating as under:
1. For Long-term Bank facilities: From CARE A-; Positive to CARE A; Stable (Single A; Outlook: Stable)
2. For Long-term/ Short – term Bank facilities: From CARE A-; Positive / CARE A1 to CARE A; Stable/ CARE A1 (Single A; Outlook: stable/ A one).
INVESTOR EDUCATION AND PROTECTION FUND (IEPF) :Pursuant to the provisions of section 124 of the Companies Act, 2013 and rules made thereunder, during the year, 41,750 equity shares of Rs. 10/- each of 270 shareholders whose dividend had remained unclaimed / unpaid for a consecutive period of seven years were transferred to IEPF.
TECHNICAL ACHIEVEMENT :The Company keeps on exploring the possibility of technical improvement and process optimization for better yields / product mix / energy efficiency.
DIRECTORS :
Shri Utkarsh Bhikhoobhai Shah (DIN 00101663) and Shri Mahesh Purshottambhai Babani (DIN 00051162)shall retire at the forthcoming Annual General Meeting of the Company and being eligible, offer themselves for re-appointment.
Annual Report 2018-19
13
RE-APPOINTMENT OF INDEPENDENT DIRECTOR :The term of Ms. Radhika Pereira, the Independent Woman Director of the company who was appointed to fill in the casual vacancy, expires on March 31, 2020, being the tenure of Ms. Sonal Ambani, the Independent Woman Director in whose place she was appointed. The Nomination and Remuneration Committee of the Board of Directors on the basis of the report of performance evaluation of Independent Directors, has recommended reappointment of Ms. Radhika Pereira (DIN 00016712) as Independent Director for a terms of 5 (five) consecutive years on the Board of the Company. The rationale for her re-appointment is given in the Explanatory Statement annexed to the Notice convening 34th annual general meeting of the members of the Company.
STATEMENT ON DECLARATION GIVEN BY INDEPENDENT DIRECTORS:The Company has received declarations from all the Independent Directors of the Company, inter alia, confirming that they meet the criteria of Independence as prescribed under Section 149 of the Companies Act, 2013 and Regulation 16(1)(b) of SEBI (LODR) Regulations, 2015.
COMPANY’S POLICY ON DIRECTORS’ APPOINTMENT AND REMUNERATION INCLUDING CRITERIA FOR DETERMINING QUALIFICATIONS, POSITIVE ATTRIBUTES, INDEPENDENCE OF A DIRECTOR ETC.:
Pursuant to the provisions of Section 178 and other applicable provisions, if any, of the Companies Act, 2013 read with the Rules made thereunder and Clause 49 of the Listing Agreement, now regulation 19 of SEBI (LODR) Regulation, 2015 the Board of Directors at their Meeting held on August 11, 2014 approved the Remuneration and Nomination Policy as recommended by the Nomination and Remuneration Committee. The salient features of the said policy covering the policy on appointment and remuneration and other matters have been explained in the Corporate Governance Report.
BOARD EVALUATION:
Based on the criteria for evaluation of Independent Directors and the Board, as recommended by the Nomination and Remuneration Committee and as adopted by the Board, Board carried out evaluation of its own performance and that of the individual Directors.
DIRECTORS’ RESPONSIBILITY STATEMENT:Pursuant to the requirement of Section 134 of the Companies Act, 2013 with respect to Directors’ Responsibility Statement, the Directors hereby confirm:
i. that in the preparation of the financial statements for the year ended March 31, 2019, the applicable accounting standards read with requirements set out under Schedule III of the Companies Act have been followed and there are no material departures from the same;
ii. that the Directors have selected such accounting policies and applied them consistently and made judgments and estimates that are reasonable and prudent so as to give a true and fair view of the state of affairs of the Company at the end of the financial year viz. March 31, 2019 and of the profit of the Company for that period;
iii. that the Directors have taken proper and sufficient care for the maintenance of adequate accounting records in accordance with the provisions of this Act for safeguarding the assets of the Company and for preventing and detecting fraud and other irregularities;
iv. that the Directors have prepared the annual accounts on a ‘Going Concern’ basis;
v. that the Directors have laid down internal financial controls to be followed by the company and that such internal financial controls are adequate and were operating effectively and
vi. that the Directors have devised proper systems to ensure compliance with the provisions of all applicable laws and that such systems are adequate and operating effectively.
PARTICULARS OF EMPLOYEES: Details of Employees as per Rule 5(2) of the Companies (Appointment and Remuneration of Managerial Personnel) Rules, 2014 are given below:
14
FAIRCHEM SPECIALITY LIMITED
A. Names of the employees employed throughout the year and were in receipt of remuneration of not less than Rs. 102.00 Lakhs during the year
Details of Employees as per Rule 5(2) of the Companies (Appointment and Remuneration of Managerial Personnel) Rules, 2014 and forming part of the Directors’ Report for the year ended March 31, 2019
Sr. No. Name & Age
Designation/nature of
Duties
Remuneration (In Rs.)
Qualification & experience
Date of Commencement of employment
Last employment, Name of employer, post held and
period (years)
% of equity shares held with spouse & dependent children
1 Shri Nahoosh Jariwala
(57 Years)
Managing Director
1,44,39,600 B.Com
(37 years)
May 15, 2010 M/s. H.K. Finechem Limited (Executive Director) (16
years)
Nil
B. Names of employees employed for part of the year and were in receipt of remuneration of not less than Rs. 8.50 Lakhs per month
Details of Employees as per Rule 5(2) of the Companies (Appointment and Remuneration of Managerial Personnel) Rules, 2014 and forming part of the Directors’ Report for the year ended March 31, 2019
Sr. No. Name & Age
Designation/nature of
Duties
Remuneration (In Rs.)
Qualification & experience
Date of Commencement of employment
Last employment, Name of employer, post held and
period (years)
% of equity shares held with spouse & dependent children
Nil
LISTING :
The Company’s securities are listed with BSE Limited and National Stock Exchanges of India Limited. The Company has paid the listing fees for F.Y. 2019-20 on the paid up equity share capital.
BUSINESS RESPONSIBILITY REPORT :
The Business Responsibility Reporting, as prescribed under Regulation 34 of SEBI (LODR) Regulations, 2015 is not applicable to the Company.
CONTRACTS AND ARRANGEMENTS WITH RELATED PARTIES :
All contracts / arrangements / transactions with related parties entered into by the Company during the financial year with related parties were in the ordinary course of business and on an arm’s length basis. During the year, the Company had not entered into any contract / arrangement / transaction with related parties which could be considered material in accordance with related party transactions.
INTERNAL CONTROL AND ITS ADEQUACY :
The Company has, commensurate with its size, single operational location and resultant requirement, Internal Control system. A well-known firm of Chartered Accountants carried out internal audit of the said system. Based on the recommendation / report of the said Internal Auditors which are presented to the Audit Committee, required corrective actions were initiated / taken by the Company.
Internal Financial Controls
The Directors have laid down policies and procedures which are adopted by the company for ensuring the orderly and efficient conduct of its business, including adherence to company‘s policies, the safeguarding of its assets, the prevention and detection of frauds and errors, the accuracy and completeness of the accounting records, and the timely preparation of reliable financial information;
FRAUD :
No fraud is reported by the Auditors of the Company
CORPORATE SOCIAL RESPONSIBILITY :
The Corporate Social Responsibility Committee had formulated and recommended to the Board a Corporate Social Responsibility Policy which has been approved by the Board. The other details of the CSR activities as required U/s. 135 of The Companies Act, 2013 are given in the CSR Report as Annexure to Directors’ Report.
Annual Report 2018-19
15
RISK MANAGEMENT POLICY :
The Company has put in place Risk Management Plan. The Company has identified following elements of risk which in the opinion of the Board may threaten the existence of the Company:
1. Severe simultaneous drought in those Soya producing countries of the world on which Indian Crude Soya Oil refining is partly dependent.
2. Development of new and substantially cheaper manufacturing technologies using altogether new inputs for making various kinds of resins which are required for making paints, printing ink, hardeners.
The Company has identified other hard vegetable oils such as Palm to which it can switch over to in the extreme event of non-availability of soya based raw materials throughout or major part of the year.
AUDITORS :
The auditors M/s. Price Waterhouse & Co Chartered Accountants LLP were appointed at the 31st Annual General Meeting held on September 9, 2016 for a term of five years, from the conclusion of 31st AGM till the conclusion of 36th AGM to be held in the year 2021.
SECRETARIAL AUDIT REPORT :As required by Section 204 of The Companies Act, 2013 read with The Companies (Appointment and Remuneration of Managerial Personnel) Rules, 2014, the Board has appointed M/s. Parikh Dave & Associates, Company Secretaries, Ahmedabad, a firm of Company Secretaries in Practice to conduct Secretarial Audit for the Financial Year 2018-19. The Report of the Secretarial Audit for the financial year ended on March 31, 2019 is annexed as Annexure to this Report.
CONFIRMATION OF COMPLIANCE OF SECRETARIAL STANDARDS :
As required under ‘revised’ SS-1 – Secretarial Standards on meetings of the Board of Directors which has come into effect form October 01, 2017, the company confirms compliances of applicable secretarial standards.
COST AUDITOR :
As per the Companies (Cost Records and Audit) Rules, 2014 as amended by Companies (Cost Records and Audit) Amendment Rules, 2014, issued by the Central Government, the Company is required to get its cost records maintained by it for the products covered under Chapters 2917 and 3823 of Sr. No. 18 of table mentioned under Rule 3 (B) – Non-regulated Sectors audited by a Cost Auditor. Accordingly, the Board of Directors, as per the recommendation of the Audit Committee, have appointed M/s. Rajendra Patel & Associates, Cost Accountants as Cost Auditors for the financial year 2019-20.
VIGIL MECHANISM :
As required under Companies Act and SEBI (LODR) Regulations, the Company has put in place Vigil Mechanism /Whistle Blower Policy for Directors and Employees so that the Directors can report concerns about unethical behaviour, actual or suspected fraud or violation of the Company’s Code of Conduct Policy
Disclosure as per the Sexual Harassment of Women at Workplace (Prevention, Prohibition and Redressal) Act, 2013 :
The Company has adopted a policy on prevention, prohibition and redressal of sexual harassment at workplace in line with the provisions of the Sexual Harassment of Women at Workplace (Prevention, Prohibition and Redressal) Act, 2013 and the Rules made thereunder and has complied with the provision relating to the constitution of Internal Complaints Committee. During the year, no complaint of sexual harassment was received by the Company.
CONSERVATION OF ENERGY, TECHNOLOGY ABSORPTION, AND FOREIGN EXCHANGE EARNINGS AND OUT GO :
A. Conservation of Energy a. Steps taken or impact on conservation of energy : None b. Steps taken by the Company for utilizing alternate source of energy : None: c. Capital Investment on energy conservation equipments : NIL d. Statement of Power and Fuel Consumption as per statement annexed.
As per annexure attached.
16
FAIRCHEM SPECIALITY LIMITED
B. Technology Absorption (i) the efforts made towards technology absorption; None
(ii) the benefits derived like product improvement, cost reduction, product development or import substitution;
(iii) in case of imported technology (imported during the last three years reckoned from the beginning of the year under reference) –
a) details of the technology imported; NIL
b) the year of import; Not Applicable
c) whether the technology has been fully absorbed – Not Applicable and if not, areas where absorption has not taken place, and the reasons thereof; Not Applicable
(iv) the expenditure incurred on Research and Development. – Rs. 277.60 Lakhs
C. Foreign exchange earnings and Outgo – Foreign Exchange Earnings : Rs. 2,597.85 Lakhs
Foreign Exchange Outgo : Rs. 1,176.77 Lakhs
Extract of Annual Return:
The details forming part of the extract of Annual Return in Form MGT-9 is annexed herewith as Annexure to this Report.
ACKNOWLEDGMENTS: Your Board of Directors wishes to place on record its appreciation to the contribution made by the employees of the company. The company has achieved impressive growth through the competence, hard work, solidarity, cooperation and support of employees at all levels. The Directors also wish to thank the Government authorities, bank and shareholders for their cooperation and assistance extended to the company.
For and on behalf of the Board of Directors,
Place : Mumbai Utkarsh Shah Date : May 09, 2019 Chairman
DIN : 00101663
Annual Report 2018-19
17
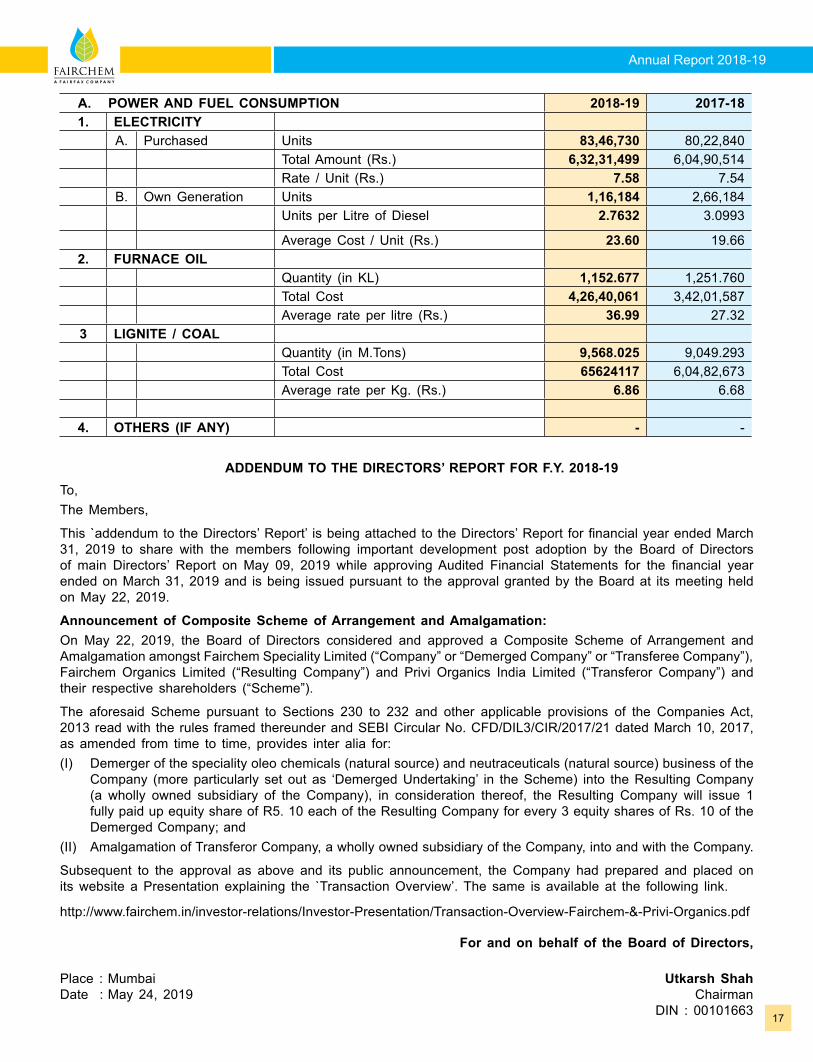
A. POWER AND FUEL CONSUMPTION 2018-19 2017-181. ELECTRICITY
A. Purchased Units 83,46,730 80,22,840Total Amount (Rs.) 6,32,31,499 6,04,90,514Rate / Unit (Rs.) 7.58 7.54
B. Own Generation Units 1,16,184 2,66,184Units per Litre of Diesel 2.7632 3.0993
Average Cost / Unit (Rs.) 23.60 19.662. FURNACE OIL
Quantity (in KL) 1,152.677 1,251.760Total Cost 4,26,40,061 3,42,01,587Average rate per litre (Rs.) 36.99 27.32
3 LIGNITE / COALQuantity (in M.Tons) 9,568.025 9,049.293Total Cost 65624117 6,04,82,673Average rate per Kg. (Rs.) 6.86 6.68
4. OTHERS (IF ANY) - -
ADDENDUM TO THE DIRECTORS’ REPORT FOR F.Y. 2018-19
To,The Members,
This `addendum to the Directors’ Report’ is being attached to the Directors’ Report for financial year ended March 31, 2019 to share with the members following important development post adoption by the Board of Directors of main Directors’ Report on May 09, 2019 while approving Audited Financial Statements for the financial year ended on March 31, 2019 and is being issued pursuant to the approval granted by the Board at its meeting held on May 22, 2019.
Announcement of Composite Scheme of Arrangement and Amalgamation:On May 22, 2019, the Board of Directors considered and approved a Composite Scheme of Arrangement and Amalgamation amongst Fairchem Speciality Limited (“Company” or “Demerged Company” or “Transferee Company”), Fairchem Organics Limited (“Resulting Company”) and Privi Organics India Limited (“Transferor Company”) and their respective shareholders (“Scheme”).
The aforesaid Scheme pursuant to Sections 230 to 232 and other applicable provisions of the Companies Act, 2013 read with the rules framed thereunder and SEBI Circular No. CFD/DIL3/CIR/2017/21 dated March 10, 2017, as amended from time to time, provides inter alia for:(I) Demerger of the speciality oleo chemicals (natural source) and neutraceuticals (natural source) business of the
Company (more particularly set out as ‘Demerged Undertaking’ in the Scheme) into the Resulting Company (a wholly owned subsidiary of the Company), in consideration thereof, the Resulting Company will issue 1 fully paid up equity share of R5. 10 each of the Resulting Company for every 3 equity shares of Rs. 10 of the Demerged Company; and
(II) Amalgamation of Transferor Company, a wholly owned subsidiary of the Company, into and with the Company.
Subsequent to the approval as above and its public announcement, the Company had prepared and placed on its website a Presentation explaining the `Transaction Overview’. The same is available at the following link.
http://www.fairchem.in/investor-relations/Investor-Presentation/Transaction-Overview-Fairchem-&-Privi-Organics.pdf
For and on behalf of the Board of Directors, Place : Mumbai Utkarsh Shah Date : May 24, 2019 Chairman
DIN : 00101663
18
FAIRCHEM SPECIALITY LIMITED
ANNEXURE TO DIRECTORS’ REPORT - DISCLOSURES ON MANAGERIAL REMUNERATION
Details of remuneration as required under Rule 5(1) of the Companies (Appointment and Remuneration of Managerial Personnel)
Details of remuneration as required under Rule 5(1) of the Companies (Appointment and Remuneration of Managerial Personnel) Rules, 2014 is provided below:
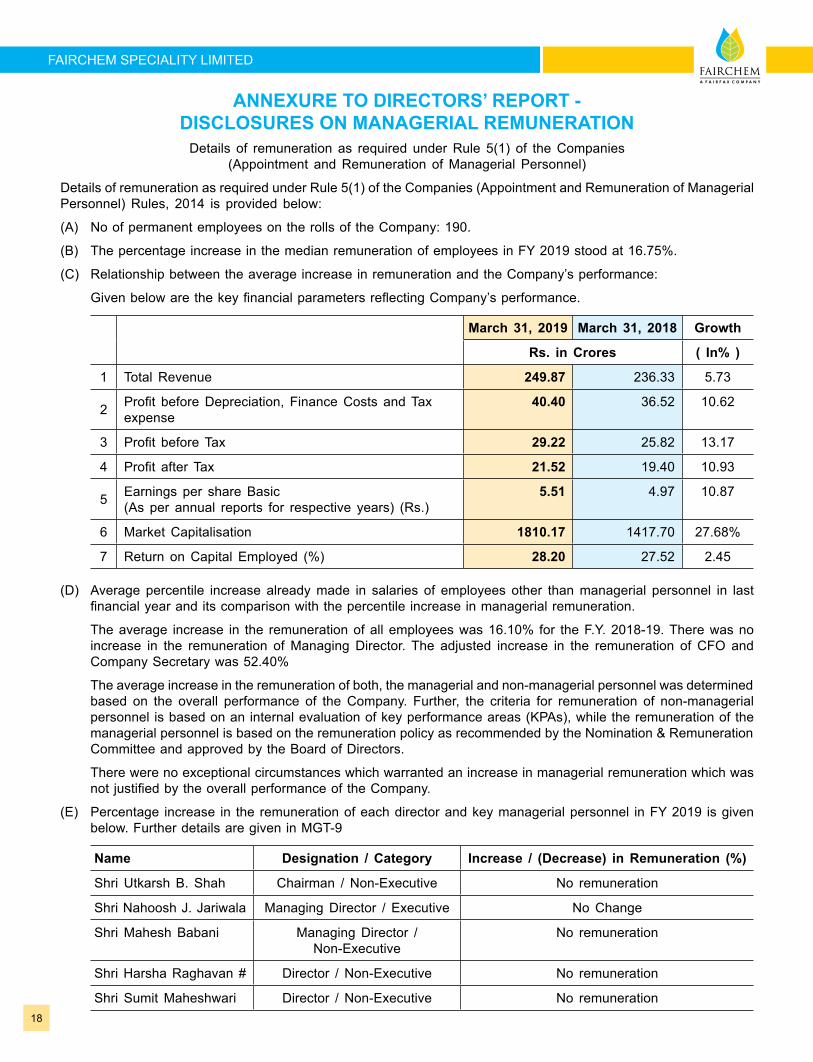
(A) No of permanent employees on the rolls of the Company: 190.
(B) The percentage increase in the median remuneration of employees in FY 2019 stood at 16.75%.
(C) Relationship between the average increase in remuneration and the Company’s performance:
Given below are the key financial parameters reflecting Company’s performance.
March 31, 2019 March 31, 2018 Growth
Rs. in Crores ( In% )
1 Total Revenue 249.87 236.33 5.73
2 Profit before Depreciation, Finance Costs and Tax expense
40.40 36.52 10.62
3 Profit before Tax 29.22 25.82 13.17
4 Profit after Tax 21.52 19.40 10.93
5 Earnings per share Basic (As per annual reports for respective years) (Rs.)
5.51 4.97 10.87
6 Market Capitalisation 1810.17 1417.70 27.68%
7 Return on Capital Employed (%) 28.20 27.52 2.45
(D) Average percentile increase already made in salaries of employees other than managerial personnel in last financial year and its comparison with the percentile increase in managerial remuneration.
The average increase in the remuneration of all employees was 16.10% for the F.Y. 2018-19. There was no increase in the remuneration of Managing Director. The adjusted increase in the remuneration of CFO and Company Secretary was 52.40%
The average increase in the remuneration of both, the managerial and non-managerial personnel was determined based on the overall performance of the Company. Further, the criteria for remuneration of non-managerial personnel is based on an internal evaluation of key performance areas (KPAs), while the remuneration of the managerial personnel is based on the remuneration policy as recommended by the Nomination & Remuneration Committee and approved by the Board of Directors.
There were no exceptional circumstances which warranted an increase in managerial remuneration which was not justified by the overall performance of the Company.
(E) Percentage increase in the remuneration of each director and key managerial personnel in FY 2019 is given below. Further details are given in MGT-9
Name Designation / Category Increase / (Decrease) in Remuneration (%)
Shri Utkarsh B. Shah Chairman / Non-Executive No remuneration
Shri Nahoosh J. Jariwala Managing Director / Executive No Change
Shri Mahesh Babani Managing Director / Non-Executive
No remuneration
Shri Harsha Raghavan # Director / Non-Executive No remuneration
Shri Sumit Maheshwari Director / Non-Executive No remuneration
Annual Report 2018-19
19
Name Designation / Category Increase / (Decrease) in Remuneration (%)
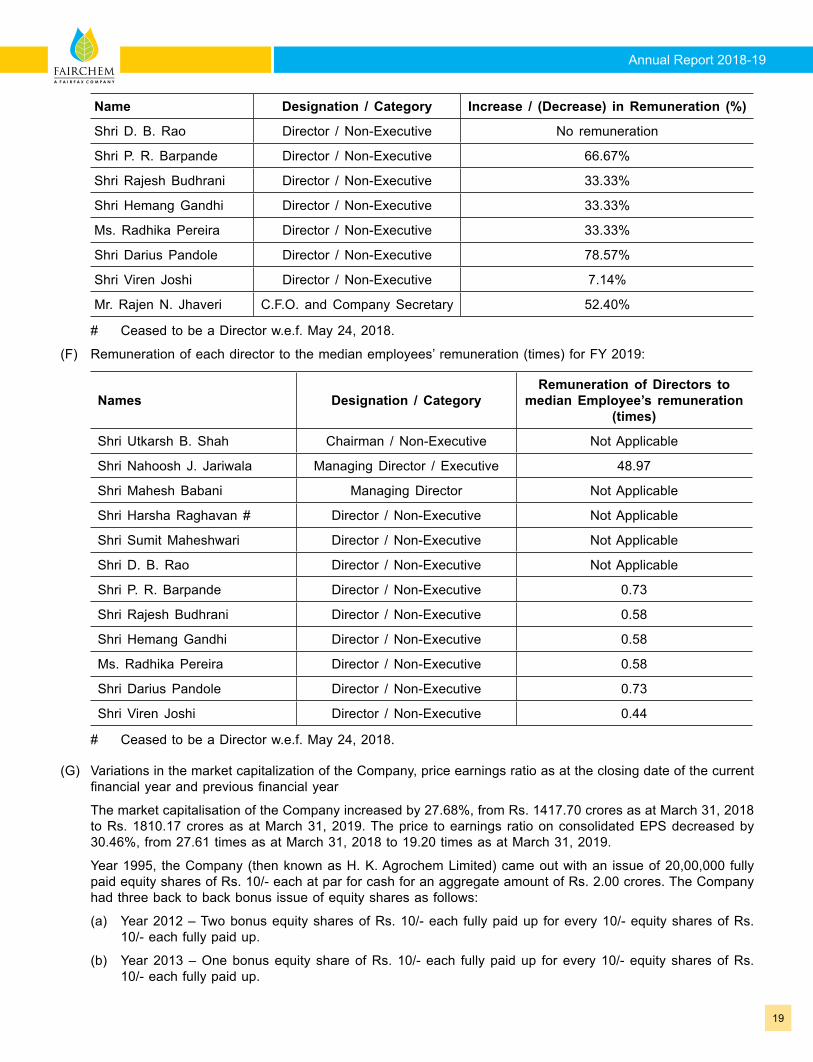
Shri D. B. Rao Director / Non-Executive No remuneration
Shri P. R. Barpande Director / Non-Executive 66.67%
Shri Rajesh Budhrani Director / Non-Executive 33.33%
Shri Hemang Gandhi Director / Non-Executive 33.33%
Ms. Radhika Pereira Director / Non-Executive 33.33%
Shri Darius Pandole Director / Non-Executive 78.57%
Shri Viren Joshi Director / Non-Executive 7.14%
Mr. Rajen N. Jhaveri C.F.O. and Company Secretary 52.40%
# Ceased to be a Director w.e.f. May 24, 2018.
(F) Remuneration of each director to the median employees’ remuneration (times) for FY 2019:
Names Designation / CategoryRemuneration of Directors to
median Employee’s remuneration (times)
Shri Utkarsh B. Shah Chairman / Non-Executive Not Applicable
Shri Nahoosh J. Jariwala Managing Director / Executive 48.97
Shri Mahesh Babani Managing Director Not Applicable
Shri Harsha Raghavan # Director / Non-Executive Not Applicable
Shri Sumit Maheshwari Director / Non-Executive Not Applicable
Shri D. B. Rao Director / Non-Executive Not Applicable
Shri P. R. Barpande Director / Non-Executive 0.73
Shri Rajesh Budhrani Director / Non-Executive 0.58
Shri Hemang Gandhi Director / Non-Executive 0.58
Ms. Radhika Pereira Director / Non-Executive 0.58
Shri Darius Pandole Director / Non-Executive 0.73
Shri Viren Joshi Director / Non-Executive 0.44
# Ceased to be a Director w.e.f. May 24, 2018.
(G) Variations in the market capitalization of the Company, price earnings ratio as at the closing date of the current financial year and previous financial year
The market capitalisation of the Company increased by 27.68%, from Rs. 1417.70 crores as at March 31, 2018 to Rs. 1810.17 crores as at March 31, 2019. The price to earnings ratio on consolidated EPS decreased by 30.46%, from 27.61 times as at March 31, 2018 to 19.20 times as at March 31, 2019.
Year 1995, the Company (then known as H. K. Agrochem Limited) came out with an issue of 20,00,000 fully paid equity shares of Rs. 10/- each at par for cash for an aggregate amount of Rs. 2.00 crores. The Company had three back to back bonus issue of equity shares as follows:
(a) Year 2012 – Two bonus equity shares of Rs. 10/- each fully paid up for every 10/- equity shares of Rs. 10/- each fully paid up.
(b) Year 2013 – One bonus equity share of Rs. 10/- each fully paid up for every 10/- equity shares of Rs. 10/- each fully paid up.
20
FAIRCHEM SPECIALITY LIMITED
(c) Year 2014 – One bonus equity share of Rs.10/- each fully paid up for every 10/- equity shares of Rs.10/- each fully paid up.
The equity shares of the Company closed at Rs. 463.40 on Bombay Stock Exchange of India Limited on March 31, 2019, representing an increase of 6629% since the date of Public Issue (after adjustment for 3 bonus issues).
(d) Year 2017 - 12,634,353 equity shares of Rs.10/- each fully paid up issued to the eligible shareholders of Privi Organics Limited pursuant to Scheme of Arrangement approved by Hon’ble NCLT.
(e) Year 2017 - 11,81,404 equity shares of Rs.10/- each fully paid up issued on conversion of equal number of compulsorily convertible preference shares of Rs.10/- each on exercise of option by the holders of said CCPS.
(f) Year 2018 – 14,52,949 equity shares of Rs. 10/- each fully paid up issued on conversion of equal number of compulsorily convertible preference shares of Rs.10/- each as per the terms of issue of said CCPS.
(H) Key Parameters for Variable Component of remuneration availed by the Directors
There was no variable component in form of Commission payment to any Director-whether Executive or Non-Executive Directors during F.Y. 2018-19.
(I) There were no employees (who are not Directors) who received remuneration in excess of the highest paid Director of the Company during the year.
Annual Report 2018-19
21
ANNEXURE TO DIRECTORS’ REPORTANNUAL REPORT ON CORPORATE SOCIAL RESPONSIBILITY (CSR) ACTIVITIES:(1) Brief outline of the Company’s CSR policy, including overview of the projects or programs proposed to be
undertaken and a reference to web-link to the CSR policy and projects or programs: The CSR policy framed pursuant to the provisions of section 135 of The Companies Act, 2013 is available on the
Company’s website. The web-link of the same is - http://fairchem.in/investor-relations/Policies/CSR-Policy.pdf The Company proposes to focus on the following areas of the CSR Policy: a. Organising / sponsoring need based programs for Health b. Providing financial support to non-profit making entities involved in preventive health care. c. Providing direct financial assistance for medical treatment in hospitals / nursing homes. d. Providing financial support to campaigns meant for creating public awareness in the area of eradication
of diseases. e. Initiatives relating to better hygiene and sanitation.
(2) Composition of the CSR Committee (w.e.f. May 21, 2017):
Sr. No. Name of the Director1. Shri Utkarsh Shah2. Shri Nahoosh Jariwala3. Shri D. B. Rao4. Shri Hemang Gandhi, Independent Director5. Ms. Radhika Pereira, Independent Director
(3) Average Net Profit of the Company for last three financial years (i.e. F.Y. 2015-16, 2016-17 and 2017-18) was Rs. 1,925.41 lakhs.
(4) Prescribed CSR Expenditure (2% of the amount as in item No. 3 above.) Rs. 38.51 lakhs.
(5) Details of CSR spent during the Financial Year (a) Total amount spent for the financial year : Rs. 38.52 lakhs. (b) Amount unspent : Not Applicable. (c) Manner in which the amount is spent during the financial year detailed below:
Sr. No.
CSR Project/ Activities Sector Location of
the Project
Amount outlay (Budget) Project or Program wise
Amount spent on the Project or Program Sub heads:
(1) Direct Expenditure on Projects
(2) Overheads
Cumulative Expenditure
up to Reporting
Period
Amount Spent Direct or Through
implementing Agency
1
Civil construction
work for improvement / addition / upgradation of school
infrastructure
Education
Chekhala & Amanagar
Villages – both falling under
Chekhala Gram Panchayat
Ta. Sanand
Rs. 70.80
lakhs Rs. 30.99 lakhs Rs. 67.69 lakhs Direct
2 Armed forces Welfare
Measures for the benefit
of armed forces
veterans, war widows
and their dependents
Pan-India - Rs. 7.53 lakhs Rs. 7.53 lakhs
Armed Forces
Flag Day Fund,
Kendriya Sainik
Board, New Delhi
Place : Mumbai Nahoosh Jariwala Date : May 09, 2019 Chairman, CSR Committee and Managing Director
22
FAIRCHEM SPECIALITY LIMITED
EXTRACT OF ANNUAL RETURNas on financial year ended on 31.03.2019
Pursuant to Section 92 (3) of the Companies Act, 2013 and rule 12(1) of the Company (Management & Administration) Rules, 2014.
I. REGISTRATION AND OTHER DETAILS :
i CIN L15140MH1985PLC286828
ii Registration Date 25.05.1985
iii Name of the Company FAIRCHEM SPECIALITY LIMITED
iv Category/Sub-category of the Company Public Company/Limited by Shares
v Address of the Registered office 324, Dr. D.N. Road, Fort, Mumbai - 400 001
Contact details Works and Office : 253/P and 312, Village Chekhala, Sanand – Kadi Highway, Taluka SANAND, Dist. AHMEDABAD – 382 115. Phone (Board Nos.) : + 91 90163 24095 / 94099 58550
vi Whether listed company Yes
vii Name , Address & contact details of the Registrar & Transfer Agent, if any.
Link Intime India Pvt. Ltd. C-101, 247 Park, L.B.S. Marg, Vikhroli (West), Mumbai - 400083. Phone: (022) 4918 6270
II. PRINCIPAL BUSINESS ACTIVITIES OF THE COMPANY : All the business activities contributing 10% or more of the total turnover of the company :
Sl. No.
Name and Description of main products / services
NIC Code of the Product / service
% to total turnover of the company
1 Dimer Acid 3009 38%
2 Linoleic Acid / Soya Fatty Acid 3004 23%
III. PARTICULARS OF HOLDING, SUBSIDIARY & ASSOCIATE COMPANIES :
Sl No
Name & Address of the Company CIN/GLN
Holding/ Subsidiary/ Associate
% Of Shares
Held
Applicable Section
1 Privi Organics India Limited (POIL) Privi House, A-71, TTC Thane Belapur Road, Near Kopar khairane Railway Station, Navi Mumbai Thane - 400709.
U24220MH2016PLC283393 Subsidiary 100% 2(87)(ii)
2 Fairchem Organics Limited Plot A-71, TTC Industrial Estate, Near Thane Belapur Road, Kopar Khairane, Navi Mumbai - 400709.
U24200MH2019PLC323176 Subsidiary 100% 2(87)(ii)
3 Privi Biotechnologies Private Limited "Privi House" A-71 TTC, Thane Belapur road, Near Kopar Khairane Railway Station, Navi Mumbai – 400709.
U74220MH1985PTC037534 Subsidiary 100% subsidiary of POIL
2(87)(ii)
4 Privi Organics USA Corporation - Subsidiary 100% subsidiary of POIL
2(87)(ii)
Annual Report 2018-19
23
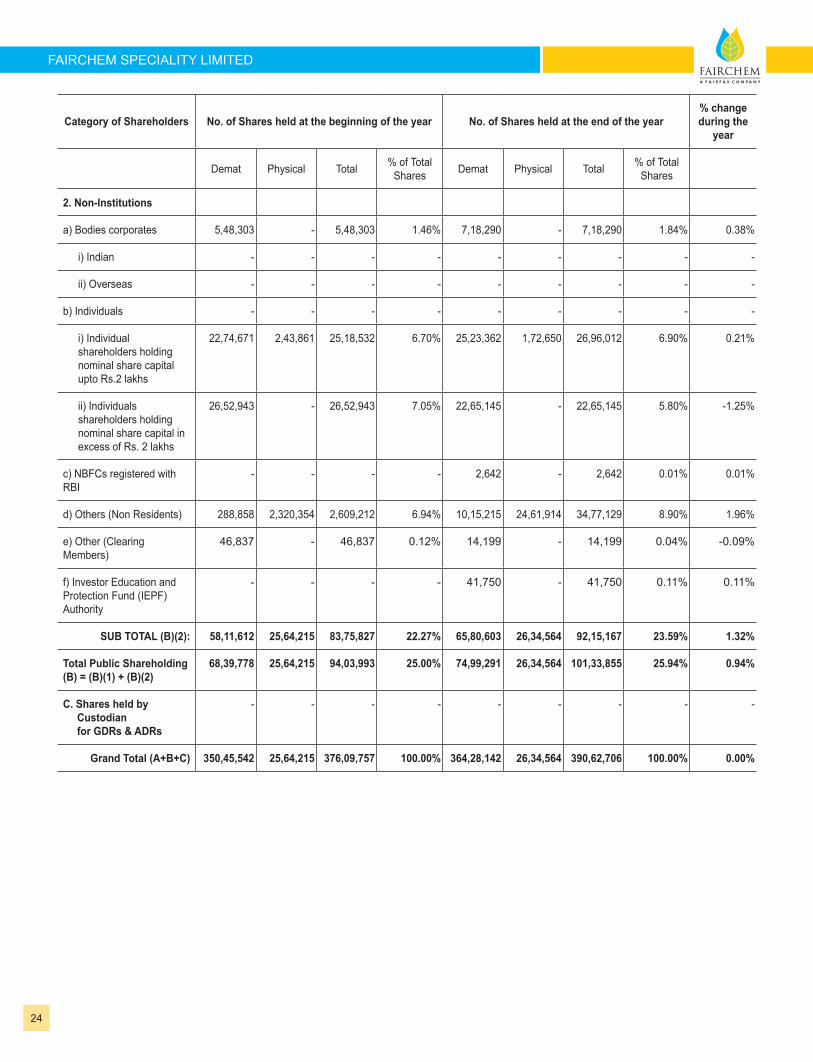
IV. SHAREHOLDING PATTERN (Equity Share capital Break up as % to total Equity)
i) Category-wise Share Holding
Category of Shareholders No. of Shares held at the beginning of the year No. of Shares held at the end of the year % change during the
year
Demat Physical Total % of Total Shares Demat Physical Total % of Total
Shares
A. Promoters
(1) Indian
a) Individual/HUF 84,49,450 - 84,49,450 22.47% 84,06,385 - 84,06,385 21.52% -0.95%
b) Central Govt. or State Govt.
- - - - - - - - -
c) Bodies Corp. 14,48,996 - 14,48,996 3.85% 14,76,388 - 14,76,388 3.78% -0.07%
d) Banks/FI - - - - - - - - -
e) Any other - - - - - - - - -
Sub-Total (A)(1) 98,98,446 - 98,98,446 26.32% 98,82,773 - 98,82,773 25.30% -1.02%
(2) Foreign
a) NRIs - Individuals - - - - - - - - -
b) Other - Individuals - - - - - - - - -
c) Bodies Corp. 183,07,318 - 183,07,318 48.68% 190,46,078 - 190,46,078 48.76% 0.08%
d) Banks/FI - - - - - - - - -
e) Any other - - - - - - - - -
Sub-Total (A))(2) 183,07,318 - 183,07,318 48.68% 190,46,078 - 190,46,078 48.76% 0.08%
Total Share holding Promoter(s) A=A(1)+A(2)
282,05,764 - 282,05,764 75.00% 289,28,851 - 289,28,851 74.06% -0.94%
B. Public Shareholding
1. Institutions
a) Mutual Funds 4,70,000 - 4,70,000 1.25% 4,70,000 - 4,70,000 1.20% -0.05%
b) Banks/FI 2,065 - 2,065 0.01% 3,242 - 3,242 0.01% 0.00%
c) Central Govt. - - - - - - - - -
d) State Govt(s) - - - - - - - - -
e) Venture Capital Funds - - - - - - - - -
f) Insurance Companies - - - - - - - - -
g) FIIs - - - - - - - - -
h) Foreign venture Capital Funds
- - - - - - - - -
i) Others (specify) Foreign Portfolio Investor (Corporate)
5,56,101 - 5,56,101 1.48% 4,45,446 - 4,45,446 1.14% -0.34%
Sub-total (B) (1) 10,28,166 - 10,28,166 2.73% 9,18,688 - 9,18,688 2.35% -0.38%
24
FAIRCHEM SPECIALITY LIMITED
Category of Shareholders No. of Shares held at the beginning of the year No. of Shares held at the end of the year % change during the
year
Demat Physical Total % of Total Shares Demat Physical Total % of Total
Shares
2. Non-Institutions
a) Bodies corporates 5,48,303 - 5,48,303 1.46% 7,18,290 - 7,18,290 1.84% 0.38%
i) Indian - - - - - - - - -
ii) Overseas - - - - - - - - -
b) Individuals - - - - - - - - -
i) Individual shareholders holding nominal share capital upto Rs.2 lakhs
22,74,671 2,43,861 25,18,532 6.70% 25,23,362 1,72,650 26,96,012 6.90% 0.21%
ii) Individuals shareholders holding nominal share capital in excess of Rs. 2 lakhs
26,52,943 - 26,52,943 7.05% 22,65,145 - 22,65,145 5.80% -1.25%
c) NBFCs registered with RBI
- - - - 2,642 - 2,642 0.01% 0.01%
d) Others (Non Residents) 288,858 2,320,354 2,609,212 6.94% 10,15,215 24,61,914 34,77,129 8.90% 1.96%
e) Other (Clearing Members)
46,837 - 46,837 0.12% 14,199 - 14,199 0.04% -0.09%
f) Investor Education and Protection Fund (IEPF) Authority
- - - - 41,750 - 41,750 0.11% 0.11%
SUB TOTAL (B)(2): 58,11,612 25,64,215 83,75,827 22.27% 65,80,603 26,34,564 92,15,167 23.59% 1.32%
Total Public Shareholding (B) = (B)(1) + (B)(2)
68,39,778 25,64,215 94,03,993 25.00% 74,99,291 26,34,564 101,33,855 25.94% 0.94%
C. Shares held by Custodian for GDRs & ADRs
- - - - - - - - -
Grand Total (A+B+C) 350,45,542 25,64,215 376,09,757 100.00% 364,28,142 26,34,564 390,62,706 100.00% 0.00%
Annual Report 2018-19
25
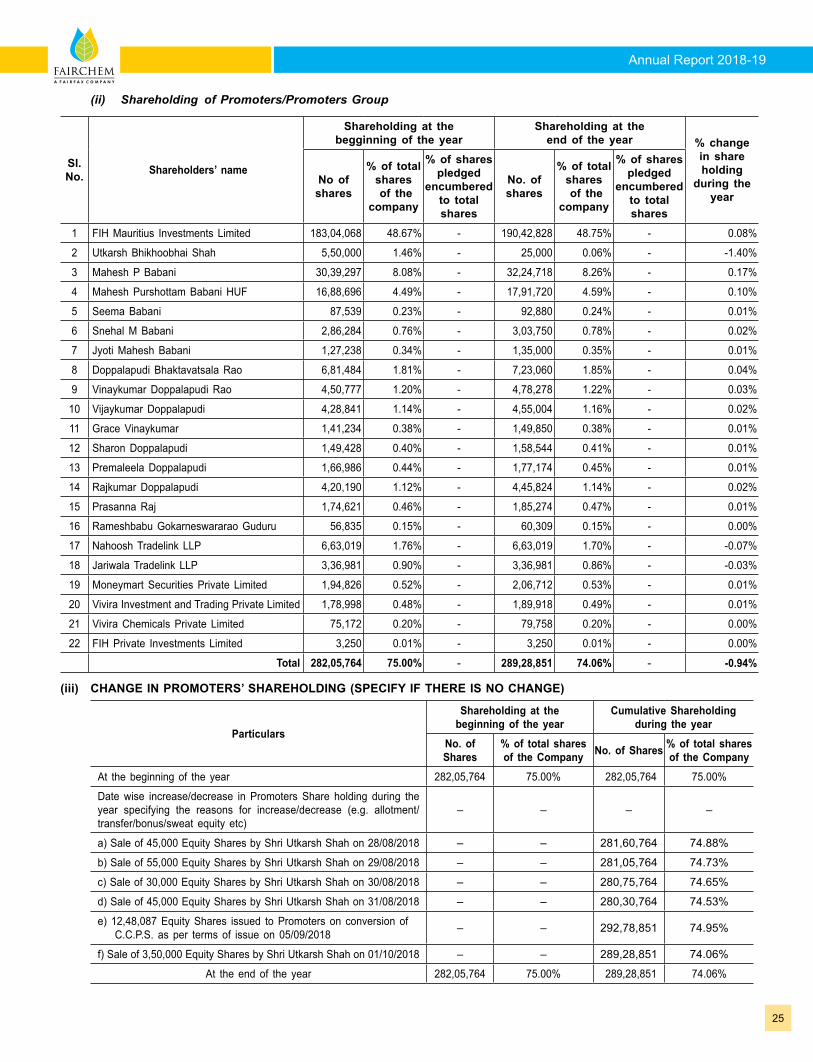
(ii) Shareholding of Promoters/Promoters Group
Sl. No. Shareholders’ name
Shareholding at the begginning of the year
Shareholding at the end of the year % change
in share holding
during the year
No of shares
% of total shares of the
company
% of shares pledged
encumbered to total shares
No. of shares
% of total shares of the
company
% of shares pledged
encumbered to total shares
1 FIH Mauritius Investments Limited 183,04,068 48.67% - 190,42,828 48.75% - 0.08%
2 Utkarsh Bhikhoobhai Shah 5,50,000 1.46% - 25,000 0.06% - -1.40%
3 Mahesh P Babani 30,39,297 8.08% - 32,24,718 8.26% - 0.17%
4 Mahesh Purshottam Babani HUF 16,88,696 4.49% - 17,91,720 4.59% - 0.10%
5 Seema Babani 87,539 0.23% - 92,880 0.24% - 0.01%
6 Snehal M Babani 2,86,284 0.76% - 3,03,750 0.78% - 0.02%
7 Jyoti Mahesh Babani 1,27,238 0.34% - 1,35,000 0.35% - 0.01%
8 Doppalapudi Bhaktavatsala Rao 6,81,484 1.81% - 7,23,060 1.85% - 0.04%
9 Vinaykumar Doppalapudi Rao 4,50,777 1.20% - 4,78,278 1.22% - 0.03%
10 Vijaykumar Doppalapudi 4,28,841 1.14% - 4,55,004 1.16% - 0.02%
11 Grace Vinaykumar 1,41,234 0.38% - 1,49,850 0.38% - 0.01%
12 Sharon Doppalapudi 1,49,428 0.40% - 1,58,544 0.41% - 0.01%
13 Premaleela Doppalapudi 1,66,986 0.44% - 1,77,174 0.45% - 0.01%
14 Rajkumar Doppalapudi 4,20,190 1.12% - 4,45,824 1.14% - 0.02%
15 Prasanna Raj 1,74,621 0.46% - 1,85,274 0.47% - 0.01%
16 Rameshbabu Gokarneswararao Guduru 56,835 0.15% - 60,309 0.15% - 0.00%
17 Nahoosh Tradelink LLP 6,63,019 1.76% - 6,63,019 1.70% - -0.07%
18 Jariwala Tradelink LLP 3,36,981 0.90% - 3,36,981 0.86% - -0.03%
19 Moneymart Securities Private Limited 1,94,826 0.52% - 2,06,712 0.53% - 0.01%
20 Vivira Investment and Trading Private Limited 1,78,998 0.48% - 1,89,918 0.49% - 0.01%
21 Vivira Chemicals Private Limited 75,172 0.20% - 79,758 0.20% - 0.00%
22 FIH Private Investments Limited 3,250 0.01% - 3,250 0.01% - 0.00%
Total 282,05,764 75.00% - 289,28,851 74.06% - -0.94%
(iii) CHANGE IN PROMOTERS’ SHAREHOLDING (SPECIFY IF THERE IS NO CHANGE)
Particulars
Shareholding at the beginning of the year
Cumulative Shareholding during the year
No. of Shares
% of total shares of the Company No. of Shares % of total shares
of the CompanyAt the beginning of the year 282,05,764 75.00% 282,05,764 75.00%
Date wise increase/decrease in Promoters Share holding during the year specifying the reasons for increase/decrease (e.g. allotment/transfer/bonus/sweat equity etc)
– – – –
a) Sale of 45,000 Equity Shares by Shri Utkarsh Shah on 28/08/2018 – – 281,60,764 74.88%
b) Sale of 55,000 Equity Shares by Shri Utkarsh Shah on 29/08/2018 – – 281,05,764 74.73%
c) Sale of 30,000 Equity Shares by Shri Utkarsh Shah on 30/08/2018 – – 280,75,764 74.65%
d) Sale of 45,000 Equity Shares by Shri Utkarsh Shah on 31/08/2018 – – 280,30,764 74.53%
e) 12,48,087 Equity Shares issued to Promoters on conversion of C.C.P.S. as per terms of issue on 05/09/2018 – – 292,78,851 74.95%
f) Sale of 3,50,000 Equity Shares by Shri Utkarsh Shah on 01/10/2018 – – 289,28,851 74.06%
At the end of the year 282,05,764 75.00% 289,28,851 74.06%
26
FAIRCHEM SPECIALITY LIMITED
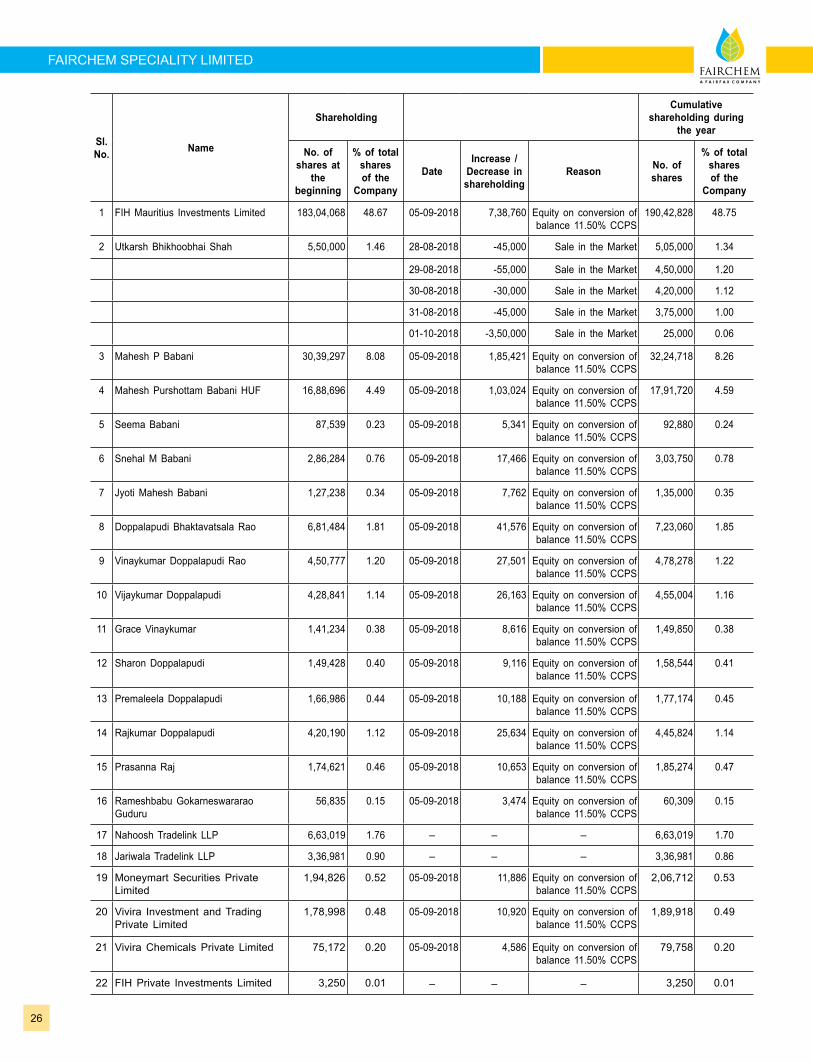
Sl. No. Name
ShareholdingCumulative
shareholding during the year
No. of shares at
the beginning
% of total shares of the
Company
DateIncrease /
Decrease in shareholding
Reason No. of shares
% of total shares of the
Company
1 FIH Mauritius Investments Limited 183,04,068 48.67 05-09-2018 7,38,760 Equity on conversion of balance 11.50% CCPS
190,42,828 48.75
2 Utkarsh Bhikhoobhai Shah 5,50,000 1.46 28-08-2018 -45,000 Sale in the Market 5,05,000 1.34
29-08-2018 -55,000 Sale in the Market 4,50,000 1.20
30-08-2018 -30,000 Sale in the Market 4,20,000 1.12
31-08-2018 -45,000 Sale in the Market 3,75,000 1.00
01-10-2018 -3,50,000 Sale in the Market 25,000 0.06
3 Mahesh P Babani 30,39,297 8.08 05-09-2018 1,85,421 Equity on conversion of balance 11.50% CCPS
32,24,718 8.26
4 Mahesh Purshottam Babani HUF 16,88,696 4.49 05-09-2018 1,03,024 Equity on conversion of balance 11.50% CCPS
17,91,720 4.59
5 Seema Babani 87,539 0.23 05-09-2018 5,341 Equity on conversion of balance 11.50% CCPS
92,880 0.24
6 Snehal M Babani 2,86,284 0.76 05-09-2018 17,466 Equity on conversion of balance 11.50% CCPS
3,03,750 0.78
7 Jyoti Mahesh Babani 1,27,238 0.34 05-09-2018 7,762 Equity on conversion of balance 11.50% CCPS
1,35,000 0.35
8 Doppalapudi Bhaktavatsala Rao 6,81,484 1.81 05-09-2018 41,576 Equity on conversion of balance 11.50% CCPS
7,23,060 1.85
9 Vinaykumar Doppalapudi Rao 4,50,777 1.20 05-09-2018 27,501 Equity on conversion of balance 11.50% CCPS
4,78,278 1.22
10 Vijaykumar Doppalapudi 4,28,841 1.14 05-09-2018 26,163 Equity on conversion of balance 11.50% CCPS
4,55,004 1.16
11 Grace Vinaykumar 1,41,234 0.38 05-09-2018 8,616 Equity on conversion of balance 11.50% CCPS
1,49,850 0.38
12 Sharon Doppalapudi 1,49,428 0.40 05-09-2018 9,116 Equity on conversion of balance 11.50% CCPS
1,58,544 0.41
13 Premaleela Doppalapudi 1,66,986 0.44 05-09-2018 10,188 Equity on conversion of balance 11.50% CCPS
1,77,174 0.45
14 Rajkumar Doppalapudi 4,20,190 1.12 05-09-2018 25,634 Equity on conversion of balance 11.50% CCPS
4,45,824 1.14
15 Prasanna Raj 1,74,621 0.46 05-09-2018 10,653 Equity on conversion of balance 11.50% CCPS
1,85,274 0.47
16 Rameshbabu Gokarneswararao Guduru
56,835 0.15 05-09-2018 3,474 Equity on conversion of balance 11.50% CCPS
60,309 0.15
17 Nahoosh Tradelink LLP 6,63,019 1.76 – – – 6,63,019 1.70
18 Jariwala Tradelink LLP 3,36,981 0.90 – – – 3,36,981 0.86
19 Moneymart Securities Private Limited
1,94,826 0.52 05-09-2018 11,886 Equity on conversion of balance 11.50% CCPS
2,06,712 0.53
20 Vivira Investment and Trading Private Limited
1,78,998 0.48 05-09-2018 10,920 Equity on conversion of balance 11.50% CCPS
1,89,918 0.49
21 Vivira Chemicals Private Limited 75,172 0.20 05-09-2018 4,586 Equity on conversion of balance 11.50% CCPS
79,758 0.20
22 FIH Private Investments Limited 3,250 0.01 – – – 3,250 0.01
Annual Report 2018-19
27
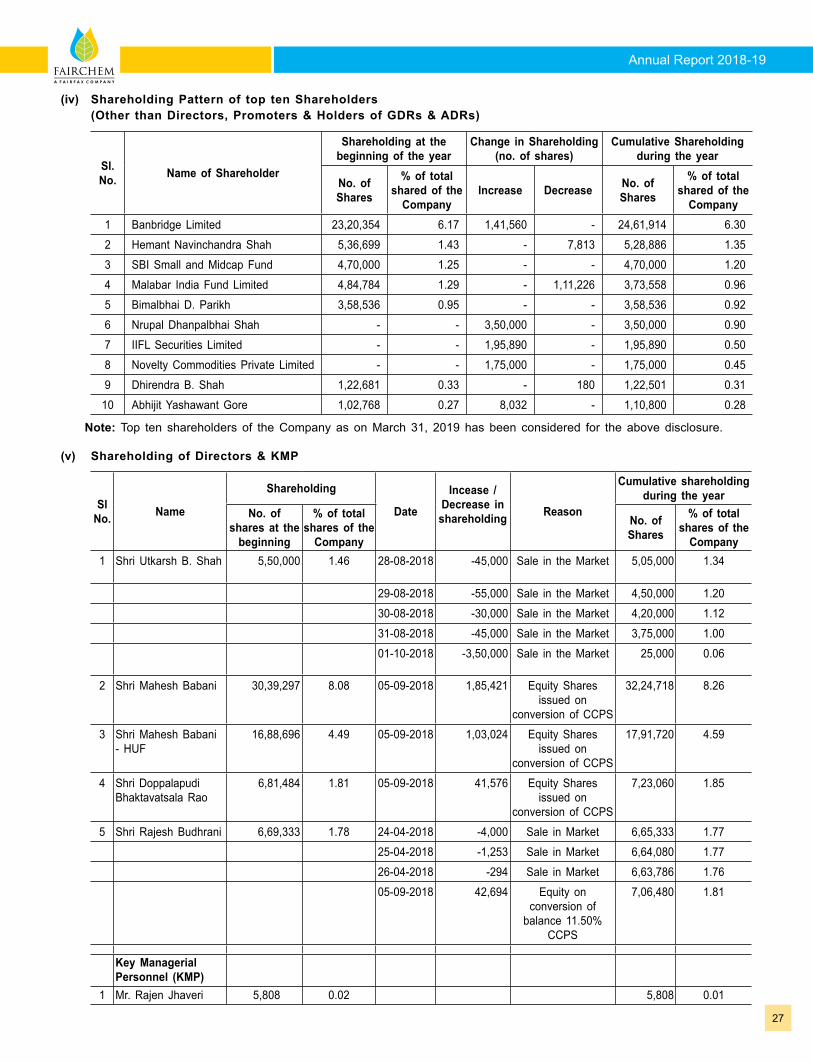
(iv) Shareholding Pattern of top ten Shareholders (Other than Directors, Promoters & Holders of GDRs & ADRs)
Sl. No. Name of Shareholder
Shareholding at the beginning of the year
Change in Shareholding (no. of shares)
Cumulative Shareholding during the year
No. of Shares
% of total shared of the
CompanyIncrease Decrease No. of
Shares
% of total shared of the
Company1 Banbridge Limited 23,20,354 6.17 1,41,560 - 24,61,914 6.30
2 Hemant Navinchandra Shah 5,36,699 1.43 - 7,813 5,28,886 1.35
3 SBI Small and Midcap Fund 4,70,000 1.25 - - 4,70,000 1.20
4 Malabar India Fund Limited 4,84,784 1.29 - 1,11,226 3,73,558 0.96
5 Bimalbhai D. Parikh 3,58,536 0.95 - - 3,58,536 0.92
6 Nrupal Dhanpalbhai Shah - - 3,50,000 - 3,50,000 0.90
7 IIFL Securities Limited - - 1,95,890 - 1,95,890 0.50
8 Novelty Commodities Private Limited - - 1,75,000 - 1,75,000 0.45
9 Dhirendra B. Shah 1,22,681 0.33 - 180 1,22,501 0.31
10 Abhijit Yashawant Gore 1,02,768 0.27 8,032 - 1,10,800 0.28
Note: Top ten shareholders of the Company as on March 31, 2019 has been considered for the above disclosure.
(v) Shareholding of Directors & KMP
Sl No. Name
Shareholding
Date
Incease /Decrease in shareholding Reason
Cumulative shareholding during the year
No. of shares at the
beginning
% of total shares of the
Company
No. of Shares
% of total shares of the
Company1 Shri Utkarsh B. Shah 5,50,000 1.46 28-08-2018 -45,000 Sale in the Market 5,05,000 1.34
29-08-2018 -55,000 Sale in the Market 4,50,000 1.20
30-08-2018 -30,000 Sale in the Market 4,20,000 1.12
31-08-2018 -45,000 Sale in the Market 3,75,000 1.00
01-10-2018 -3,50,000 Sale in the Market 25,000 0.06
2 Shri Mahesh Babani 30,39,297 8.08 05-09-2018 1,85,421 Equity Shares issued on
conversion of CCPS
32,24,718 8.26
3 Shri Mahesh Babani - HUF
16,88,696 4.49 05-09-2018 1,03,024 Equity Shares issued on
conversion of CCPS
17,91,720 4.59
4 Shri Doppalapudi Bhaktavatsala Rao
6,81,484 1.81 05-09-2018 41,576 Equity Shares issued on
conversion of CCPS
7,23,060 1.85
5 Shri Rajesh Budhrani 6,69,333 1.78 24-04-2018 -4,000 Sale in Market 6,65,333 1.77
25-04-2018 -1,253 Sale in Market 6,64,080 1.77
26-04-2018 -294 Sale in Market 6,63,786 1.76
05-09-2018 42,694 Equity on conversion of
balance 11.50% CCPS
7,06,480 1.81
Key Managerial Personnel (KMP)
1 Mr. Rajen Jhaveri 5,808 0.02 5,808 0.01
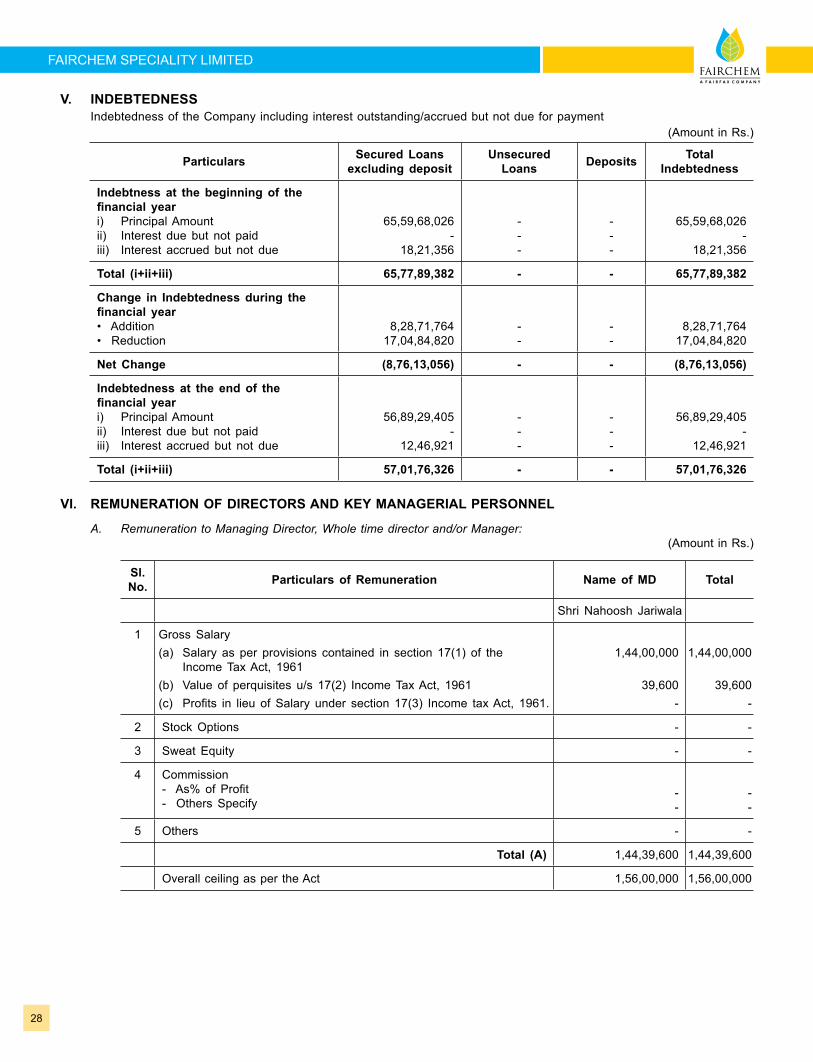
28
FAIRCHEM SPECIALITY LIMITED
V. INDEBTEDNESS Indebtedness of the Company including interest outstanding/accrued but not due for payment
(Amount in Rs.)
Particulars Secured Loans excluding deposit
Unsecured Loans Deposits Total
Indebtedness
Indebtness at the beginning of the financial year i) Principal Amountii) Interest due but not paidiii) Interest accrued but not due
65,59,68,026 -
18,21,356
---
- - -
65,59,68,026 -
18,21,356
Total (i+ii+iii) 65,77,89,382 - - 65,77,89,382
Change in Indebtedness during the financial year • Addition• Reduction
8,28,71,76417,04,84,820
- -
- -
8,28,71,764 17,04,84,820
Net Change (8,76,13,056) - - (8,76,13,056)
Indebtedness at the end of the financial yeari) Principal Amountii) Interest due but not paidiii) Interest accrued but not due
56,89,29,405 -
12,46,921
---
---
56,89,29,405 -
12,46,921
Total (i+ii+iii) 57,01,76,326 - - 57,01,76,326
VI. REMUNERATION OF DIRECTORS AND KEY MANAGERIAL PERSONNEL
A. Remuneration to Managing Director, Whole time director and/or Manager:(Amount in Rs.)
Sl. No. Particulars of Remuneration Name of MD Total
Shri Nahoosh Jariwala
1 Gross Salary(a) Salary as per provisions contained in section 17(1) of the Income Tax Act, 1961 (b) Value of perquisites u/s 17(2) Income Tax Act, 1961(c) Profits in lieu of Salary under section 17(3) Income tax Act, 1961.
1,44,00,000
39,600-
1,44,00,000
39,600-
2 Stock Options - -
3 Sweat Equity - -
4 Commission - As% of Profit - Others Specify
- -
- -
5 Others - -
Total (A) 1,44,39,600 1,44,39,600
Overall ceiling as per the Act 1,56,00,000 1,56,00,000
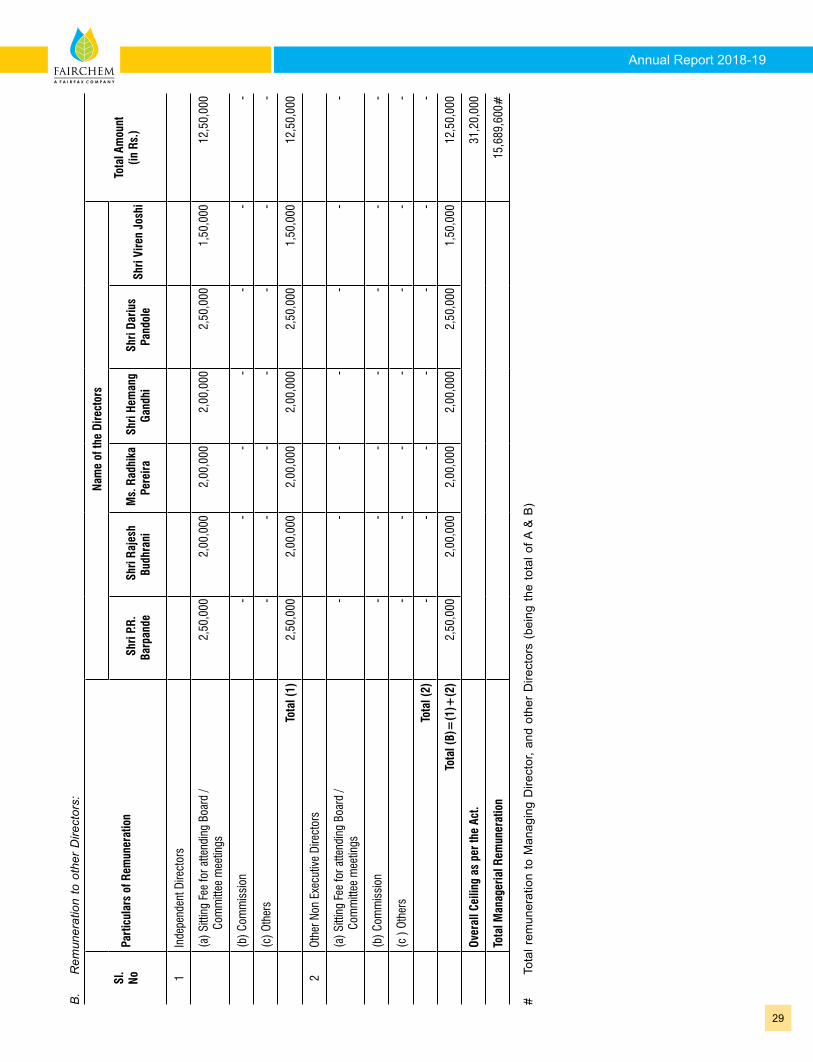
Annual Report 2018-19
29
B.
Rem
uner
atio
n to
oth
er D
irect
ors:
Sl.
NoPa
rtic
ular
s of
Rem
uner
atio
n
Nam
e of
the
Dire
ctor
s
Tota
l Am
ount
(in
Rs.
) S
hri P
.R.
Barp
ande
S
hri R
ajes
h Bu
dhra
ni
Ms.
Rad
hika
Pe
reira
S
hri H
eman
g Ga
ndhi
S
hri D
ariu
s Pa
ndol
e S
hri V
iren
Josh
i
1In
depe
nden
t Dire
ctor
s
(a) S
ittin
g Fe
e fo
r atte
ndin
g Bo
ard
/
Co
mm
ittee
mee
tings
2,5
0,00
0 2
,00,
000
2,0
0,00
0 2
,00,
000
2,5
0,00
0 1
,50,
000
12,
50,0
00
(b) C
omm
issi
on-
--
--
--
(c) O
ther
s-
--
--
--
Tota
l (1)
2,5
0,00
0 2
,00,
000
2,0
0,00
0 2
,00,
000
2,5
0,00
0 1
,50,
000
12,
50,0
00
2Ot
her N
on E
xecu
tive
Dire
ctor
s
(a) S
ittin
g Fe
e fo
r atte
ndin
g Bo
ard
/
Co
mm
ittee
mee
tings
--
--
--
-
(b) C
omm
issi
on-
--
--
--
(c )
Othe
rs-
--
--
--
Tota
l (2)
--
--
--
-
Tota
l (B)
=(1
)+(2
) 2
,50,
000
2,0
0,00
0 2
,00,
000
2,0
0,00
0 2
,50,
000
1,5
0,00
0 1
2,50
,000
Over
all C
eilin
g as
per
the
Act.
31,2
0,00
0
Tota
l Man
ager
ial R
emun
erat
ion
15,6
89,6
00#
#
Tota
l rem
uner
atio
n to
Man
agin
g D
irect
or, a
nd o
ther
Dire
ctor
s (b
eing
the
tota
l of A
& B
)
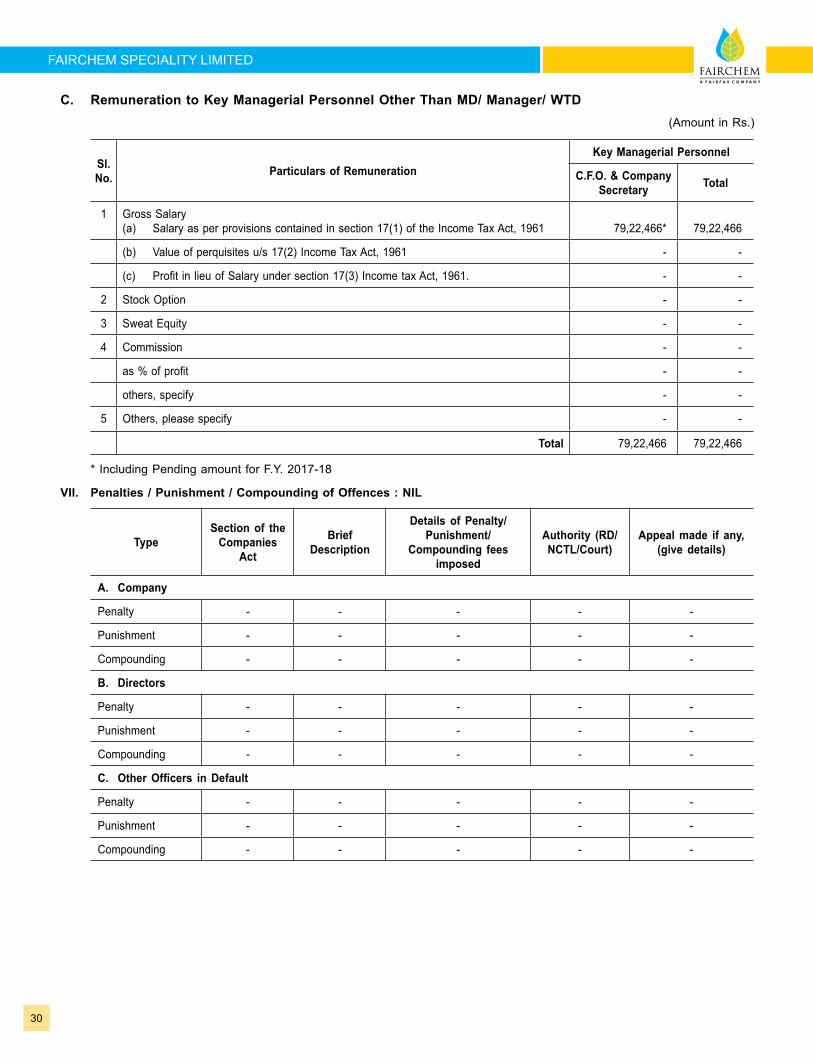
30
FAIRCHEM SPECIALITY LIMITED
C. Remuneration to Key Managerial Personnel Other Than MD/ Manager/ WTD(Amount in Rs.)
Sl. No. Particulars of Remuneration
Key Managerial Personnel
C.F.O. & Company Secretary Total
1 Gross Salary(a) Salary as per provisions contained in section 17(1) of the Income Tax Act, 1961
79,22,466*
79,22,466
(b) Value of perquisites u/s 17(2) Income Tax Act, 1961 - -
(c) Profit in lieu of Salary under section 17(3) Income tax Act, 1961. - -
2 Stock Option - -
3 Sweat Equity - -
4 Commission - -
as % of profit - -
others, specify - -
5 Others, please specify - -
Total 79,22,466 79,22,466
* Including Pending amount for F.Y. 2017-18
VII. Penalties / Punishment / Compounding of Offences : NIL
TypeSection of the
Companies Act
Brief Description
Details of Penalty/Punishment/
Compounding fees imposed
Authority (RD/NCTL/Court)
Appeal made if any, (give details)
A. Company
Penalty - - - - -
Punishment - - - - -
Compounding - - - - -
B. Directors
Penalty - - - - -
Punishment - - - - -
Compounding - - - - -
C. Other Officers in Default
Penalty - - - - -
Punishment - - - - -
Compounding - - - - -
Annual Report 2018-19
31
Form No. MR-3
SECRETARIAL AUDIT REPORT FOR THE FINANCIAL YEAR ENDED ON MARCH 31, 2019
[Pursuant to Section 204(1) of the Companies Act, 2013 and Rule No.9 of the Companies (Appointment and Remuneration of Managerial Personnel) Rules, 2014]
To, The Members, FAIRCHEM SPECIALITY LIMITEDCIN: L15140MH1985PLC286828Works & Office: 253/P & 312, Village – Chekhala, Sanand – Kadi Highway,Taluka – Sanand,Dist. Ahmedabad – 382 115We have conducted the secretarial audit of the compliance of applicable statutory provisions and the adherence to good corporate practices by FAIRCHEM SPECIALITY LIMITED (hereinafter called the company). Secretarial Audit was conducted in a manner that provided us a reasonable basis for evaluating the corporate conducts/statutory compliances and expressing our opinion thereon. Based on our verification of the Company’s books, papers, minute books, forms and returns filed and other records maintained by the company and also the information provided by the Company, its officers, agents and authorized representatives during the conduct of secretarial audit; we hereby report that in our opinion, the company has during the audit period covering the financial year ended on March 31, 2019 complied with the statutory provisions listed hereunder and also that the Company has proper Board-processes and compliance mechanism in place to the extent, in the manner and subject to the reporting made hereinafter: We have examined the books, papers, minute books, forms and returns filed and other records maintained by the Company for the financial year ended on March 31, 2019 according to the provisions of: 1) The Companies Act, 2013 (the Act) and the Rules made thereunder; 2) The Securities Contracts (Regulation) Act, 1956 (‘SCRA’) and the Rules made thereunder; 3) The Depositories Act, 1996 and the Regulations and Bye-laws framed thereunder; 4) Foreign Exchange Management Act, 1999 and the Rules and Regulations made thereunder to the extent of Foreign
Direct Investment, Overseas Direct Investment and External Commercial Borrowings; 5) The following Regulations and Guidelines prescribed under the Securities and Exchange Board of India Act, 1992
(‘SEBI Act’): (a) The Securities and Exchange Board of India (Substantial Acquisition of Shares and Takeovers) Regulations, 2011; (b) The Securities and Exchange Board of India (Prohibition of Insider Trading) Regulations, 2015; (c) The Securities and Exchange Board of India (Issue of Capital and Disclosure Requirements) Regulations, 2009
(upto 10th November, 2018) and The Securities and Exchange Board of India (Issue of Capital and Disclosure Requirements) Regulations, 2018 (with effect from 11th November, 2018)
(d) The Securities and Exchange Board of India (Share Based Employees Benefits)Regulations,2014 - Not Applicable as the Company has not issued any Shares / options to the Directors /Employees under the said Regulations during the year under review;
(e) The Securities and Exchange Board of India (Issue and Listing of Debt Securities) Regulations, 2008 - Not Applicable as the Company has not issued any listed debt securities during the year under review;
(f) The Securities and Exchange Board of India (Registrars to an Issue and Share Transfer Agents) Regulations, 1993 regarding the Companies Act and dealing with client;
(g) The Securities and Exchange Board of India (Delisting of Equity Shares) Regulations, 2009 - Not Applicable as the Company has not delisted its securities from any Stock Exchange during the year under review;
(h) The Securities and Exchange Board of India (Buy Back of Securities) Regulations, 1998 - Not Applicable as the Company has not bought – back any of its securities during the year under review;
(i) The Securities and Exchange Board of India (Listing Obligations and Disclosure Requirements) Regulations, 2015.
We have also examined compliance with the applicable Standards / Clauses / Regulations of the following: i. Secretarial Standards issued by The Institute of the Company Secretaries of India (ICSI) and made effective from
time to time.
32
FAIRCHEM SPECIALITY LIMITED
ii. The Uniform Listing Agreement entered into by the Company with National Stock Exchange of India Limited and BSE Limited.
During the Audit period under review, the Company has complied with the applicable provisions of Act, Rules, Regulations, Guidelines, Standards, etc. as mentioned above.
We further report that:During the audit period under review there were no specific laws which were exclusively applicable to the Company / Industry. However, having regard to the compliance system prevailing in the Company and on examination of relevant documents and records on test - check basis, the Company has complied with the material aspects of the following significant laws applicable to the Company being engaged in the manufacturing activities: 1. Factories Act,1948; 2. The Boilers Act, 1923 and the Rules framed thereunder; 3. Explosive Act, 1884;
We further report that:The Board of Directors of the Company is duly constituted with proper balance of Executive Directors, Non-Executive Directors and Independent Directors. The changes in the composition of the Board which took place during the year under review were carried out in compliance of the provisions of Act. Adequate notice is given to all the Directors to schedule the Board Meetings at least seven days in advance. Agenda and detailed notes on agenda were sent well in advance and a system exists for seeking and obtaining further information and clarifications on the agenda items before the meeting and for meaningful participation at the meeting.All the decisions at the meetings of Board of Directors/ Committees of the Company were carried unanimously. We were informed that there were no dissenting views of the members’ on any of the matters during the year that were required to be captured and recorded as part of the minutes.
We further report that:Based on the review of compliance mechanism established by the Company, the information provided by the Company, its officers and authorized representatives during the conduct of the audit we are of the opinion that that there are adequate systems and processes in the Company commensurate with the size and operations of the Company to monitor and ensure compliance with applicable general laws, rules, regulations and guidelines.As informed to us, the Company has responded appropriately to the notices received from various statutory / regulatory authorities including initiating the corrective measures wherever found necessary.
We further report that:The Compliance by the Company of the applicable financial laws like Direct and Indirect Tax laws, has not been reviewed in this Audit since the same have been subject to the review by the Statutory Auditor(s) and other designated professionals.
We further report that:During the Audit period under review, the event / action having major bearing on the Company’s affairs in pursuance of the above mentioned laws, rules, regulations, guidelines, standards, etc. is as mentioned below:1) 14,52,949 Compulsorily Convertible Preference Shares (CCPS)of Rs. 10/- each which were remaining out of the
total 1,26,34,353 CCPS issued pursuant to the scheme of Arrangement approved by the Hon’ble National Company Law Tribunal, Mumbai Bench vide its order dated February 22, 2017 between Privi Organics Limited (“Demerged Company”), Fairchem Speciality Limited (the “1st Resulting Company”) and Adi Aromatic Limited (“2nd Resulting Company”) have been converted into 14,52,949 Equity shares of Rs. 10/- each fully paid up.
2) Company has obtained necessary approval of members to mortgage its properties and to borrow money in excess of paid up share capital and free Reserve of the company up to Rs. 200.00 Crore (Rupees Two Hundred Crore Only) in compliance of the provisions of section 180 (1) (a) and 180(1) (c) of the Companies Act, 2013 respectively.
For Parikh Dave & Associates Company Secretaries
Uday G. Dave Partner
Place : Ahmedabad PRACTICING COMPANY SECRETARY PARTNERDate : May 08, 2019 FCS No.: 6545 C. P. No.: 7158
Note: This report is to be read with our letter of even date which is annexed as Annexure – A and forms an integral part of this report.
Annual Report 2018-19
33
ANNEXURE A
To, The Members, FAIRCHEM SPECIALITY LIMITEDCIN: L15140MH1985PLC286828
Our report of even date is to be read along with this letter.
1. Maintenance of Secretarial record is the responsibility of the management of the Company. Our responsibility is to express an opinion on these secretarial records based on our audit.
2. We have followed the audit practices and process as were appropriate to obtain reasonable assurance about the correctness of the contents of the Secretarial records. The verification was done on test basis to ensure that correct facts are reflected in Secretarial records. We believe that the process and practices followed by us provide a reasonable basis for our opinion.
3. We have not verified the correctness and appropriateness of financial records and Books of Accounts of the Company.
4. Wherever required, we have obtained the Management representation about the Compliance of laws, rules and regulations and happening of events etc.
5. The Compliance of the provisions of Corporate and other applicable laws, rules, regulations, standards is the responsibility of the management. Our examination was limited to the verification of procedure on test basis.
6. The Secretarial Audit report is neither an assurance as to the future viability of the Company nor of the efficacy or effectiveness with which the management has conducted the affairs of the Company.
For Parikh Dave & Associates Company Secretaries
Uday G. Dave Partner
Place : Ahmedabad PRACTICING COMPANY SECRETARYDate : May 08, 2019 FCS No. 6545 C P No.: 7158
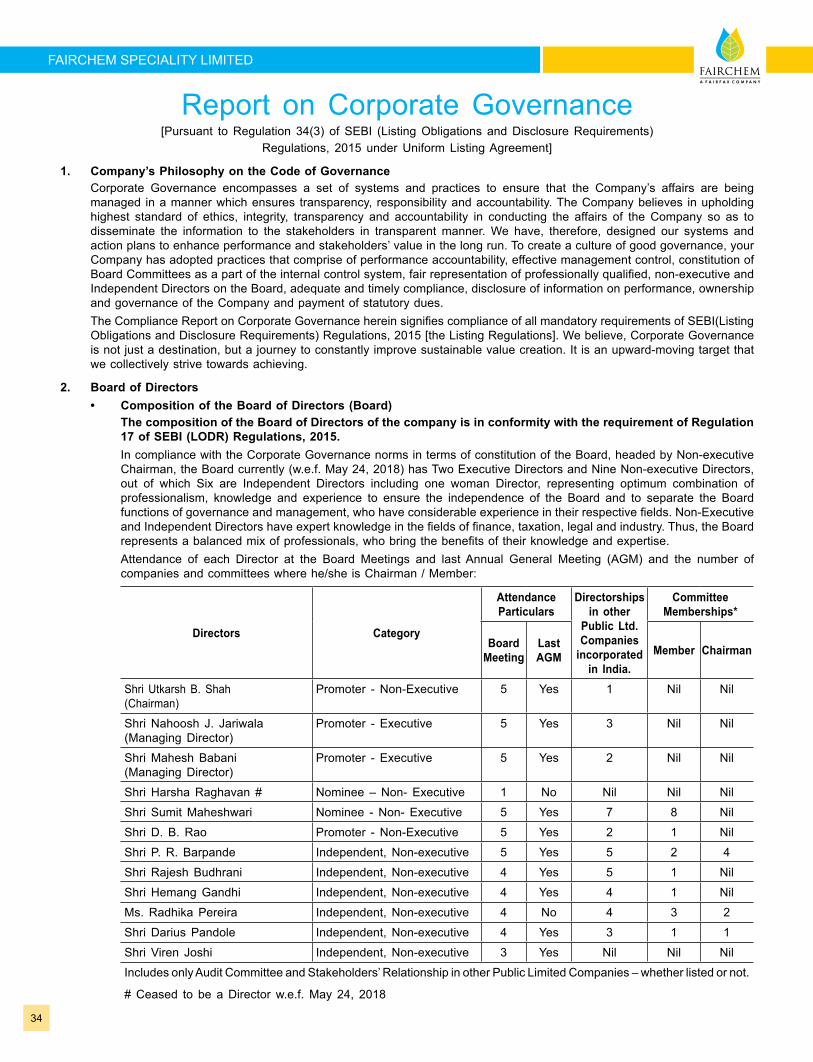
34
FAIRCHEM SPECIALITY LIMITED
Report on Corporate Governance[Pursuant to Regulation 34(3) of SEBI (Listing Obligations and Disclosure Requirements)
Regulations, 2015 under Uniform Listing Agreement]
1. Company’s Philosophy on the Code of Governance Corporate Governance encompasses a set of systems and practices to ensure that the Company’s affairs are being
managed in a manner which ensures transparency, responsibility and accountability. The Company believes in upholding highest standard of ethics, integrity, transparency and accountability in conducting the affairs of the Company so as to disseminate the information to the stakeholders in transparent manner. We have, therefore, designed our systems and action plans to enhance performance and stakeholders’ value in the long run. To create a culture of good governance, your Company has adopted practices that comprise of performance accountability, effective management control, constitution of Board Committees as a part of the internal control system, fair representation of professionally qualified, non-executive and Independent Directors on the Board, adequate and timely compliance, disclosure of information on performance, ownership and governance of the Company and payment of statutory dues.
The Compliance Report on Corporate Governance herein signifies compliance of all mandatory requirements of SEBI(Listing Obligations and Disclosure Requirements) Regulations, 2015 [the Listing Regulations]. We believe, Corporate Governance is not just a destination, but a journey to constantly improve sustainable value creation. It is an upward-moving target that we collectively strive towards achieving.
2. Board of Directors • Composition of the Board of Directors (Board) The composition of the Board of Directors of the company is in conformity with the requirement of Regulation
17 of SEBI (LODR) Regulations, 2015. In compliance with the Corporate Governance norms in terms of constitution of the Board, headed by Non-executive
Chairman, the Board currently (w.e.f. May 24, 2018) has Two Executive Directors and Nine Non-executive Directors, out of which Six are Independent Directors including one woman Director, representing optimum combination of professionalism, knowledge and experience to ensure the independence of the Board and to separate the Board functions of governance and management, who have considerable experience in their respective fields. Non-Executive and Independent Directors have expert knowledge in the fields of finance, taxation, legal and industry. Thus, the Board represents a balanced mix of professionals, who bring the benefits of their knowledge and expertise.
Attendance of each Director at the Board Meetings and last Annual General Meeting (AGM) and the number of companies and committees where he/she is Chairman / Member:
Directors Category
Attendance Particulars
Directorships in other
Public Ltd. Companies
incorporated in India.
Committee Memberships*
Board Meeting
Last AGM Member Chairman
Shri Utkarsh B. Shah (Chairman)
Promoter - Non-Executive 5 Yes 1 Nil Nil
Shri Nahoosh J. Jariwala (Managing Director)
Promoter - Executive 5 Yes 3 Nil Nil
Shri Mahesh Babani (Managing Director)
Promoter - Executive 5 Yes 2 Nil Nil
Shri Harsha Raghavan # Nominee – Non- Executive 1 No Nil Nil Nil
Shri Sumit Maheshwari Nominee - Non- Executive 5 Yes 7 8 Nil
Shri D. B. Rao Promoter - Non-Executive 5 Yes 2 1 Nil
Shri P. R. Barpande Independent, Non-executive 5 Yes 5 2 4
Shri Rajesh Budhrani Independent, Non-executive 4 Yes 5 1 Nil
Shri Hemang Gandhi Independent, Non-executive 4 Yes 4 1 Nil
Ms. Radhika Pereira Independent, Non-executive 4 No 4 3 2
Shri Darius Pandole Independent, Non-executive 4 Yes 3 1 1
Shri Viren Joshi Independent, Non-executive 3 Yes Nil Nil Nil
Includes only Audit Committee and Stakeholders’ Relationship in other Public Limited Companies – whether listed or not.
# Ceased to be a Director w.e.f. May 24, 2018
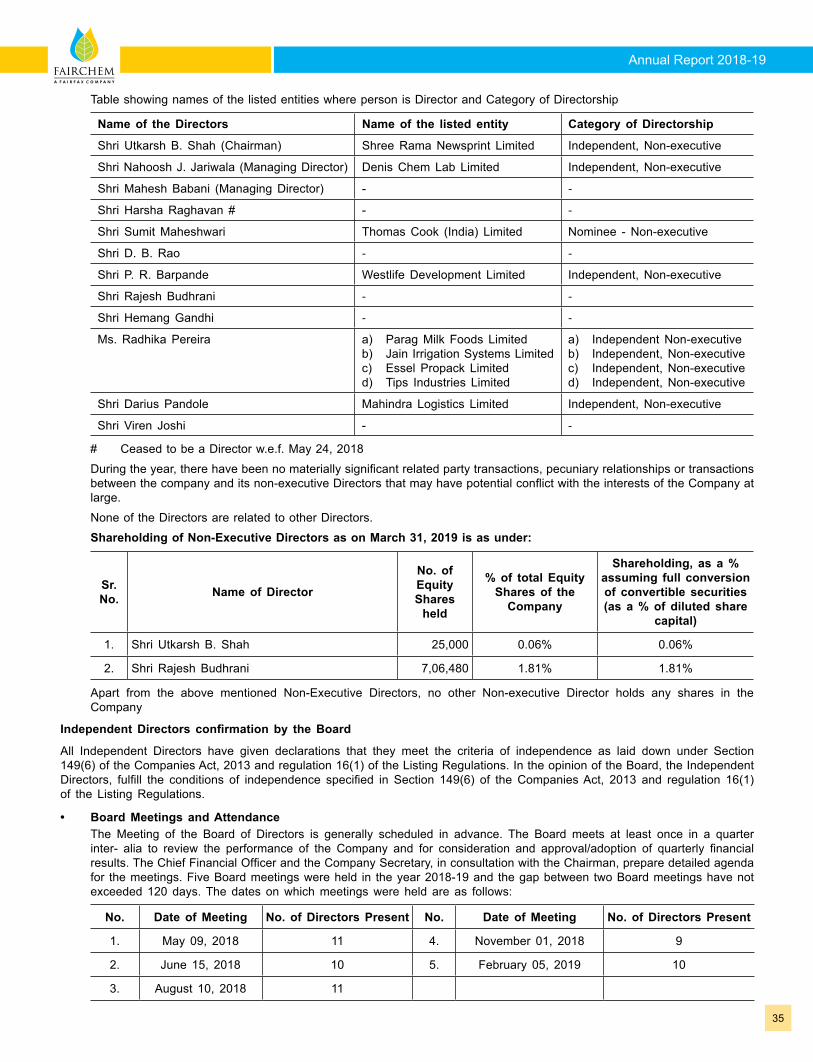
Annual Report 2018-19
35
Table showing names of the listed entities where person is Director and Category of Directorship
Name of the Directors Name of the listed entity Category of Directorship
Shri Utkarsh B. Shah (Chairman) Shree Rama Newsprint Limited Independent, Non-executive
Shri Nahoosh J. Jariwala (Managing Director) Denis Chem Lab Limited Independent, Non-executive
Shri Mahesh Babani (Managing Director) - -
Shri Harsha Raghavan # - -
Shri Sumit Maheshwari Thomas Cook (India) Limited Nominee - Non-executive
Shri D. B. Rao - -
Shri P. R. Barpande Westlife Development Limited Independent, Non-executive
Shri Rajesh Budhrani - -
Shri Hemang Gandhi - -
Ms. Radhika Pereira a) Parag Milk Foods Limitedb) Jain Irrigation Systems Limitedc) Essel Propack Limitedd) Tips Industries Limited
a) Independent Non-executiveb) Independent, Non-executivec) Independent, Non-executived) Independent, Non-executive
Shri Darius Pandole Mahindra Logistics Limited Independent, Non-executive
Shri Viren Joshi - -
# Ceased to be a Director w.e.f. May 24, 2018
During the year, there have been no materially significant related party transactions, pecuniary relationships or transactions between the company and its non-executive Directors that may have potential conflict with the interests of the Company at large.
None of the Directors are related to other Directors.
Shareholding of Non-Executive Directors as on March 31, 2019 is as under:
Sr. No. Name of Director
No. of Equity Shares
held
% of total Equity Shares of the
Company
Shareholding, as a % assuming full conversion of convertible securities (as a % of diluted share
capital)
1. Shri Utkarsh B. Shah 25,000 0.06% 0.06%
2. Shri Rajesh Budhrani 7,06,480 1.81% 1.81%
Apart from the above mentioned Non-Executive Directors, no other Non-executive Director holds any shares in the Company
Independent Directors confirmation by the Board
All Independent Directors have given declarations that they meet the criteria of independence as laid down under Section 149(6) of the Companies Act, 2013 and regulation 16(1) of the Listing Regulations. In the opinion of the Board, the Independent Directors, fulfill the conditions of independence specified in Section 149(6) of the Companies Act, 2013 and regulation 16(1) of the Listing Regulations.
• Board Meetings and Attendance The Meeting of the Board of Directors is generally scheduled in advance. The Board meets at least once in a quarter
inter- alia to review the performance of the Company and for consideration and approval/adoption of quarterly financial results. The Chief Financial Officer and the Company Secretary, in consultation with the Chairman, prepare detailed agenda for the meetings. Five Board meetings were held in the year 2018-19 and the gap between two Board meetings have not exceeded 120 days. The dates on which meetings were held are as follows:
No. Date of Meeting No. of Directors Present No. Date of Meeting No. of Directors Present
1. May 09, 2018 11 4. November 01, 2018 9
2. June 15, 2018 10 5. February 05, 2019 10
3. August 10, 2018 11
36
FAIRCHEM SPECIALITY LIMITED
• Appointment of Independent Directors The Nomination and Remuneration Committee identifies, based on Company’s policy for such position, suitable person
having expert knowledge and skill in his / her profession / area of business and who can effectively participate in Board proceedings and recommends the same to the Board. The Board after evaluating the said Committee’s recommendation takes the decision which according to the Board is in the best interest of the Company.
• Meeting of Independent Directors The Independent Directors meet at least once in a financial year without the presence of Promoter Directors and
management personnel. They discuss the matters pertaining to the business and other related affairs of the Company. The views expressed at such meeting are brought to the knowledge of the Chairman of the Board.
During the year, one meeting of Independent Directors was held on February 05, 2019.• Familiarization Programme In order to enable the Independent Directors of the Company to fulfil their role in the Company and to keep them updated,
various presentations are made on business models, new initiatives taken by the Company, changes taking place in the Industry scenario etc. The details of the familiarization programme of Independent Directors of the Company is available on the website of the Company at the following link: http://fairchem.in/policies.html
3. Audit Committee Composition : The composition of Audit Committee is in line with provisions of Section 177 of the Companies Act, 2013 and is in
compliance with Regulation 18 of SEBI (LODR) Regulations, 2015. The members of Audit Committee comprises of two Managing Directors, six Independent Directors and one Nominee Director with Shri P. R. Barpande – Independent Director as Chairman of the Committee, Shri Mahesh Babani, Shri Nahoosh Jariwala, Shri Sumit Maheshwari, Shri Rajesh Budhrani, Shri Hemang Gandhi, Ms. Radhika Pereira, Shri Darius Pandole and Shri Viren Joshi asmembers. All the members of the Committee are financially literate and have adequate accounting knowledge. The Audit Committee met Five times during the financial year 2018-19 - on May 09, 2018, June 15, 2018, August 10, 2018, November 01, 2018 and February 05, 2019.
The details of composition of the Committee and attendance at Meetings are as follows:
Name Designation / Category No. of Committee Meeting(s) attended
Shri P. R. Barpande (Chairman) Non-Executive – Independent 5
Shri Mahesh Babani Executive – Promoter 5
Shri Nahoosh Jariwala Executive – Promoter 5
Shri Sumit Maheshwari Non-Executive – Nominee 5
Shri Rajesh Budhrani Non-Executive – Independent 4
Shri Hemang Gandhi Non-Executive – Independent 4
Ms. Radhika Pereira Non-Executive – Independent 4
Shri Darius Pandole Non-Executive – Independent 5
Shri Viren Joshi Non-Executive – Independent 3
The scope of the Audit Committee includes: 1. Review of the Company’s financial reporting process and the disclosure of its financial information to ensure that
the financial statement is correct, sufficient and credible.
2. Recommending to the Board, the appointment, re-appointment and if required, the replacement or removal of statutory auditor and fixation of audit fees.
3. Approval of payment to statutory auditors for any other services rendered by the statutory auditors.
4. Reviewing, with the management, the annual financial statements and auditor’s report thereon before submission to the Board for approval, with particular reference to:
a. Matters required to be included in the Directors’ Responsibility Statement to be included in the Board’s report in terms of clause (c) of sub section 3 of Section 134 of the Companies Act, 2013,
b. Changes, if any, in accounting policies and practices and reasons for the same,
c. Major accounting entries involving estimates based on the exercise of judgment by management,
d. Significant adjustments made in the financial statements arising out of audit findings,
e. Compliance with listing and other legal requirements relating to financial statements,
Annual Report 2018-19
37
f. Disclosure of any related party transactions,
g. Modified opinion(s) in the draft audit report
5. Reviewing, with the management, the quarterly financial statements before its submission to the Board for approval.
6. Reviewing, with the management, the statement of uses / application of funds raised through an issue (public issue, rights issue, preferential issue, etc.), the statement of funds utilized for purposes other than those stated in the offer document / prospectus / notice and the report submitted by the monitoring agency monitoring the utilisation of proceeds of a public or rights issue, and making appropriate recommendations to the Board to take up steps in this matter.
7. Review and monitor the auditor’s independence and performance, and effectiveness of audit process.
8. Approval or any subsequent modification of transactions of the Company with related parties.
9. Scrutiny of inter-corporate loans and investments.
10. Valuation of undertakings or assets of the Company, wherever it is necessary.
11. Evaluation of internal financial controls and risk management systems.
12. Reviewing, with the management, performance of statutory and internal auditors, adequacy of the internal control systems.
13. Reviewing the adequacy of internal audit function, if any, including the structure of the internal audit department, staffing and seniority of the official heading the department, reporting structure coverage and frequency of internal audit.
14. Discussion with internal auditors, any significant findings and follow up thereon.
15. Reviewing the findings of any internal investigations by the internal auditors into matters where there is suspected fraud or irregularity or a failure of internal control systems of a material nature and reporting the matter to the Board.
16. Discussion with statutory auditors before the audit commences, about the nature and scope of audit as well as has post-audit discussion to ascertain any area of concern.
17. To look into the reasons for substantial defaults in the payment to the depositors, debenture holders, shareholders (in case of non-payment of declared dividends) and creditors.
18. To review the functioning of the Whistle Blower mechanism.
19. Approval of appointment of CFO (i.e., the Whole time Finance Director or any other person heading the finance function or discharging that function) after assessing the qualifications, experience and background, etc. of the candidate.
20. Carrying out any other function as is mentioned in the terms of reference of the Audit Committee. In addition to the areas noted above, Audit Committee looks into controls and security of the Company’s internal
control systems and internal audit reports.
The audit committee have reviewed the following information: 1. management discussion and analysis of financial condition and results of operations; 2. statement of significant related party transactions, submitted by management; 3. management letters issued by the statutory auditors; 4. internal audit reports relating to internal control weaknesses; and 5. the appointment and terms of remuneration of the Internal Auditors.
The Committee Meetings were also attended by Internal Auditors, Statutory Auditors and Company Secretary who also acted as Secretary of the Committee.
A certificate from the Managing Director on the standalone financial statements and other matters of the Company for the financial year ended March 31, 2019 is also appended at the end of this Report.
The Chairman of the Audit Committee was present in the last Annual General Meeting to answer the shareholders’ queries.
4. Nomination and Remuneration Committee The Nomination and Remuneration Committee constituted in accordance with the provisions of Section 178 of the
Companies Act, 2013 and Regulation 19 of SEBI (LODR) Regulations, 2015, the Nomination and Remuneration Committee comprises of Shri Viren Joshi – Independent Director as Chairman of the Committee, Shri Utkarsh Shah and Shri Darius Pandole as members.
During the year one meeting of Nomination and Remuneration Committee was held on May 09, 2018 and all the members
38
FAIRCHEM SPECIALITY LIMITED
attended the meeting. The details of composition of the Nomination and Remuneration Committee and attendance at Meetings during the financial year 2018-19 were as follows :
Name Designation No. of Committee Meeting attended
Shri Viren Joshi (Chairman) Non-Executive – Independent 1
Shri Utkarsh Shah Non-Executive – Promoter 1
Shri Harsha Raghavan # Non-Executive – Nominee 1
Shri Darius Pandole Non-Executive – Independent 1
# Ceased to be a Director and resultantly as member of the committee w.e.f. May 24, 2018
Terms of Reference : (1) To identify persons who are qualified to become Directors and who may be appointed in senior management in
accordance with the criteria laid down and to recommend to the Board their appointment and removal. (2) To formulate the criteria for determining qualifications, positive attributes and independence of a Director and
recommend to the Board a policy relating to the remuneration for the Directors, key managerial personnel and other employees.
(3) To formulate the criteria for evaluation of Independent Directors and the Board. (4) To devise a policy on Board Diversity (5) Whether to extend or continue the term of appointment of the independent director, on the basis of the report of
performance evaluation of independent directors.
Performance Evaluation: Pursuant to the provisions of Companies Act, 2013 and the Listing Regulations, the Board has carried out the annual
evaluation of its own performance, its committees and Directors individually. A Structured questionnaire was prepared after circulating the draft forms, covering various aspects of the Board’s functioning such as adequacy of the Composition of the Board and its committee, Board culture, execution and The performance of specific duties, obligations and governance. A Consolidated summary of the ratings given by each Director was then prepared. The report of performance evaluation was then discussed and noted by the Board.
The performance evaluation of the Chairman and Managing Director and the Non Independent Directors was carried by the Independent Directors. The Directors expressed their satisfaction with the evaluation process.
Remuneration Policy : The Company’s Remuneration Policy for Directors and Senior Management personnel is given here below:
The remuneration policy is recommended by the Nomination & Remuneration Committee and approved by the Board. The key objective of the remuneration policy is to ensure that it is aligned to the overall performance of the Company. The policy ensures that it is fair and reasonable and is linked to financial performance. For Director in Executive category, it mainly comprises of fixed component. The remuneration policy is placed on the website of the Company http://fairchem.in/policies.html. The remuneration paid to the Directors is in line with there remuneration policy of the Company.
Remuneration to Directors : Non-Executive Directors The remuneration for non-executive (Independent) Directors consists of sitting fees. No other payment is made to the
non-executive Directors.
Details of the remuneration paid to and shareholding of Non-executive Directors is provided in MGT-9 which forms part of Directors’ Report.
Executive Directors The executive Directors of the Company viz. Managing Directors have been appointed on a contractual basis, in terms
of the resolution passed by the shareholders at the annual general meeting. Elements of the remuneration package comprise of salary and perquisites as approved by the members at the annual general meeting. Out of two Managing Directors only Shri Nahoosh Jariwala, Executive Managing Director draws the remunerations and is given perquisites during the year.
Details of the remuneration paid to and shareholding of Executive Directors is provided in MGT-9 which forms part of Directors’ Report.
Details of Remuneration : The details relating to remuneration of Directors, as required under Regulation 34 of SEBI (LODR) Regulations, 2015
are as follows:
Annual Report 2018-19
39
Details of remuneration paid to Directors during the financial year 2018-19.(Amounts in Rs.)
Directors Salaries Perquisites Sitting Fees Total
Shri Utkarsh B. Shah (Non-executive Director) Nil Nil Nil Nil
Shri Mahesh Babani (Managing Director) Nil Nil Nil Nil
Shri Nahoosh J. Jariwala (Managing Director) 1,44,00,000 39,600 Nil 1,44,39,600
Shri Sumit Maheshwari (Non-executive Director) Nil Nil Nil Nil
Shri D.B. Rao (Non-executive Director) Nil Nil Nil Nil
Shri P.R. Barpande (Independent Director) Nil Nil 2,50,000 2,50,000
Shri Rajesh Budhrani (Independent Director) Nil Nil 2,00,000 2,00,000
Shri Hemang Gandhi (Independent Director) Nil Nil 2,00,000 2,00,000
Ms. Radhika Pereira (Independent Director) Nil Nil 2,00,000 2,00,000
Shri Darius Pandole (Independent Director) Nil Nil 2,50,000 2,50,000
Shri Viren Joshi (Independent Director) Nil Nil 1,50,000 1,50,000
The Company has not granted any stock options to its Directors.
Service contract / Agreement and Notice period: The Company has entered into agreements with Shri Nahoosh Jariwala, Managing Director for his employment for a period of 3 years. Either party to an agreement is entitled to terminate the agreement by giving not less than 3 (Three) months’ notice in writing to the other party.
5. Stakeholders’ Relationship Committee
Stakeholders’ Relationship Committee consists of Shri Utkarsh B. Shah as Chairman of the committee, Promoter Non-Executive Director and Shri Hemang Gandhi, Independent Non-Executive Director as members of the committee. At present, Mr. Rajen Jhaveri is the Company Secretary and Compliance Officer of the Company. The Committee met Two times during the Financial Year 2018-19 – on June 15, 2018 and August 10, 2018.
The details of composition of the Committee and attendance at Meetings during the Financial Year 2018-19 were as follows :
Name Designation No. of Committee Meeting(s) attended
Shri Utkarsh Shah Non-Executive – Promoter 2
Shri Hemang Gandhi Non-Executive – Independent 2
The committee was reconstituted with effect from May 09, 2019 and two new more Directors are inducted as members of Committee and be re-constituted with following 4 Directors as its members and now the committee consist of Shri Utkarsh Shah, as chairman of the committee, Shri Hemang Gandhi, Shri Nahoosh Jariwala and Shri D.B. Rao as members of the Committee.
The said committee looks into the redressal of Grievances of security Holders, if any, like Transfer / Transmission / Demat of Shares, Non-receipt of Annual Report, Non-receipt of Declared Dividends, Loss of Share Certificates etc. and instance of several trade transaction of equity shares of the company by a ‘connected person’.
During the year, No complaints were received from the security holders as per the certificate of RTA. No investor complaint was pending at the beginning or at the end of the year.
Compliance Officer:
Mr. Rajen Jhaveri, Company Secretary and Compliance Officer can be contacted at: Fairchem Speciality Limited Works & Office : 253/P and 312, Village Chekhala, Sanand – Kadi Highway, Taluka SANAND, Dist. AHMEDABAD – 382 115. Gujarat. Phone (Board Nos.): + 91 90163 24095 / 94099 58550 Mail ID: [email protected]
40
FAIRCHEM SPECIALITY LIMITED
6. Administrative Committee
It comprises of 3 Members viz. (1) Shri Utkarsh B. Shah, Promoter - Non-Executive (2) Shri Nahoosh Jariwala, Managing Director (3) Shri Sumit Maheshwari, Nominee Director. The Committee looks after businesses which are administrative in nature and within the overall Board approved limits/ directions and framework.
7. Corporate Social Responsibility Committee
Pursuant to the provisions of section 135 of The Companies Act, 2013, Company has formed Corporate Social Responsibility Committee.The committee was reconstituted with effect from May 11, 2017, and presently it consists of five Directors as its members viz. (1) Shri Utkarsh Shah, (2) Shri Nahoosh Jariwala, (3) Shri D. B. Rao, (4) Ms. Radhika Pereira and (5) Shri Hemang Gandhi, out of which two Directors are Independent Directors.
The Committee is primarily responsible for formulating and recommending to the Board of Directors a Corporate Social Responsibility Committee policy and monitoring the same from time to time amount of expenditure to be incurred on the activities pertaining to CSR.
The Company has also formulated the C.S.R. Policy and the same is available on the website of the Company at http://fairchem.in/investor-relations/Policies/CSR-Policy.pdf.
8. Disclosures
(a) Besides the transactions mentioned elsewhere in the Annual Report, there were no materially significant related party transactions entered into by the Company which may have the potential conflict with the interest of the Company at large.
The Company has formulated a policy on materiality of Related Party Transactions and also on dealing with Related party transactions and during the year, there were no material transactions with related parties. The policy is also available on the website of the Companyhttp://fairchem.in/investor-relations/Policies/Policy-on-Related-Party-Transactions.pdf.
(b) There were no penalties / strictures imposed on the Company by the Stock Exchange(s) or SEBI or any statutory authority, on any matter related to Capital Markets, during the last three years.
(c) The Company has in place the Whistle Blower Policy and the same is available on the website of the Company http://fairchem.in/investor-relations/Policies/Whistle-Blower-Policy.pdf. Under said policy, the employees are encouraged to report genuine concerns about suspected misconduct without fear of punishment or unfair treatment. During the year under review, no employee was denied the access to the Audit Committee and / or its Chairman.
(d) The Company has complied with all mandatory requirements of Regulation 17 to 27 and clauses (b) to (i) of sub regulation (2) of Regulation 46 of SEBI (LODR) Regulations, 2015.
(e) A certificate has been received from Parikh Dave & Associates, Practicing Company Secretaries that none of the Directors on the Board have been debarred or disqualified from being appointed or continuing as a Director of the Company Securities and Exchange Board of India / Ministry of Corporate Affairs or any such statutory authority as required under Part C of Schedule V of listing regulations.
(f) Where the board had not accepted any recommendation of any committee of the board which is mandatorily required, in the relevant financial year. Not Applicable.
(g) Total fees for all services paid by the listed entity and its subsidiaries, on a consolidated basis, to the statutory auditor and all entities in the network firm/network entity of which the statutory auditor is a part. Details relating to fees paid to the Statutory Auditors are given in Note 36 to the Standalone and Consolidated Financial Statements.
9. Subsidiary Company Privi Organics India Ltd. is the material unlisted Indian subsidiary company and Fairchem Organics Limited is the wholly
owned subsidiary company incorporated on March 27, 2019 under the purview of the material un-listed subsidiary as per criteria given in Regulation 16(1)(c) of SEBI (LODR) Regulations, 2015. The Audit Committee of the Company reviews the financial statements and investments made by unlisted subsidiary company and the minutes of the unlisted subsidiary company are placed at the Board Meeting of the Company. The policy on Material Subsidiary Company is available on the website of the Company http://fairchem.in/policies.html.
10. Code of Conduct
The Company has in place Code of Conduct and Ethics for all the Directors and for all Senior Management Personnel. It seeks to achieve, among others, higher standards of personal and professional integrity. A copy of the code has been placed on the Company’s website http://fairchem.in/investor-relations/Policies/Code-of-Conduct.pdf. The code has been circulated to all the Directors and Senior Management Personnel and they affirm its compliance every year.
The Company has also in place a prevention of Insider Trading Code based on SEBI (Prohibition of Insider Trading) Regulations, 2015. This code is applicable to all Designated Persons defined under the Code of Conduct for Prevention of
Annual Report 2018-19
41
Insider Trading adopted by the Company. The code ensures prevention of dealing in shares by person shaving access to the unpublished price sensitive information. The full text of the Regulations of SEBI (Prohibition of Insider Trading)Regulations, 2015 as notified dated January 15, 2015 is available https://www.sebi.gov.in/legal/regulations/jan-2015/sebi-prohibition-of-insider-trading-regulations-2015-issued-on-15-jan-2015-_28884.html.
11. Means of Communication During the year, quarterly Unaudited financial results – both standalone and consolidated, and audited annual financial
results – both standalone and consolidated of the Company were submitted to the stock exchanges soon after its approval by the Board of Directors at their Meetings and were also published in The Economic Times, Mumbai edition in English and vernacular newspaper in Maharashtra Times, Mumbai edition in Marathi. Annual financial performance of the Company is also posted on the Company’s website http://fairchem.in/investor-relations.html.
News releases, presentations, etc.:
Official news releases are displayed on the website of the Company www.fairchem.in.
The Company’s website www.fairchem.in contains a separate dedicated section where the useful information for the Shareholders is available.
The report on Management Discussion and Analysis is annexed and forms part of the annual report.
12. General Body Meeting Disclosure: Location, date and time of General Meetings held during the last 3 years:
Meeting Year Venue of General Meeting Date & Time No. of Special Resolutions
31st AGM 2015-2016Memories Hall, 2nd Floor, TGB Banquets &
Hotels Limited (The Grand Bhagwati) S.G. Road, Bodakdev, Ahmedabad – 380054
September 09, 2016 at 5.00 p.m. One
32nd AGM 2016-2017Hall of Culture, Nehru Science Centre,
Dr. Annie Besant Road, Louts Colony, Worli, Mumbai – 400018
August 11, 2017 at 4.00 p.m. Two
33rd AGM 2017-2018Hall of Culture, Nehru Science Centre,
Dr. Annie Besant Road, Louts Colony, Worli, Mumbai – 400018
August 10, 2018 at 4.00 p.m. Eight
Details of the Special Resolutions passed the Annual General Meetings held in the past 3 financial years:
33rd A.G.M. held on August 10, 2018.
(1) Re-appointment of Shri Nahoosh J. Jariwala (DIN: 00012412) as the Managing Director(2) Increasing borrowing power pursuant to Section 180(1)(c) of the Companies Act, 2013(3) Taking consent of shareholders pursuant to Section 180(1)(a) of the Companies Act, 2013(4) Re-appointment of Shri Padmanabh Ramchandra Barpande, as an Independent Director(5) Re-appointment of Shri Hemang Manhar Gandhi, as an Independent Director(6) Re-appointment of Shri Darius Dinshaw Pandole, as an Independent Director(7) Re-appointment of Shri Rajesh Harichandra Budhrani, as an Independent Director(8) Re-appointment of Shri Viren Ajit Joshi, as an Independent Director
32nd A.G.M. held on August 11, 2017.
(1) Adoption of New set of Articles of Association in lieu of present Articles of Association.
(2) Maintaining the register of members, etc. at the office premises of M/s. Link Intime India Private Limited (R.T.A).
31st A.G.M. held on September 09, 2016.
(1) Adoption of New set of Articles of Association in lieu of present Articles of Association.
(2) Re-appointment of Shri Nahoosh J. Jariwala (DIN: 00012412) as Managing Director of the Company.
Details of resolutions passed during F.Y. 2018-19 through postal ballot: NIL
General Shareholder Information Date, Time and Venue of 34th Annual General Meeting
Thursday, 08th August, 2019 at 5.00 p.m. at Hall of Culture, Nehru Centre, Dr. Annie Besant Road, Louts Colony, Worli, Mumbai – 400 018.
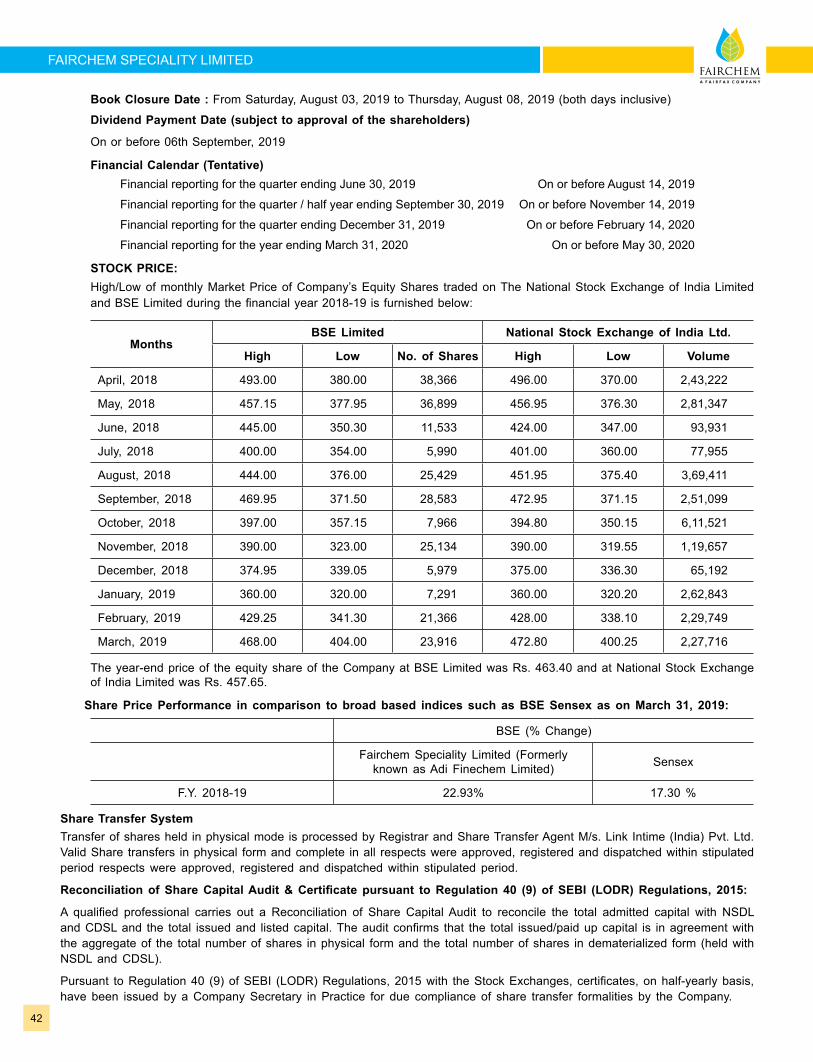
42
FAIRCHEM SPECIALITY LIMITED
Book Closure Date : From Saturday, August 03, 2019 to Thursday, August 08, 2019 (both days inclusive)
Dividend Payment Date (subject to approval of the shareholders)
On or before 06th September, 2019
Financial Calendar (Tentative)Financial reporting for the quarter ending June 30, 2019 On or before August 14, 2019
Financial reporting for the quarter / half year ending September 30, 2019 On or before November 14, 2019
Financial reporting for the quarter ending December 31, 2019 On or before February 14, 2020
Financial reporting for the year ending March 31, 2020 On or before May 30, 2020
STOCK PRICE: High/Low of monthly Market Price of Company’s Equity Shares traded on The National Stock Exchange of India Limited
and BSE Limited during the financial year 2018-19 is furnished below:
MonthsBSE Limited National Stock Exchange of India Ltd.
High Low No. of Shares High Low Volume
April, 2018 493.00 380.00 38,366 496.00 370.00 2,43,222
May, 2018 457.15 377.95 36,899 456.95 376.30 2,81,347
June, 2018 445.00 350.30 11,533 424.00 347.00 93,931
July, 2018 400.00 354.00 5,990 401.00 360.00 77,955
August, 2018 444.00 376.00 25,429 451.95 375.40 3,69,411
September, 2018 469.95 371.50 28,583 472.95 371.15 2,51,099
October, 2018 397.00 357.15 7,966 394.80 350.15 6,11,521
November, 2018 390.00 323.00 25,134 390.00 319.55 1,19,657
December, 2018 374.95 339.05 5,979 375.00 336.30 65,192
January, 2019 360.00 320.00 7,291 360.00 320.20 2,62,843
February, 2019 429.25 341.30 21,366 428.00 338.10 2,29,749
March, 2019 468.00 404.00 23,916 472.80 400.25 2,27,716
The year-end price of the equity share of the Company at BSE Limited was Rs. 463.40 and at National Stock Exchange of India Limited was Rs. 457.65.
Share Price Performance in comparison to broad based indices such as BSE Sensex as on March 31, 2019:
BSE (% Change)
Fairchem Speciality Limited (Formerly known as Adi Finechem Limited) Sensex
F.Y. 2018-19 22.93% 17.30 %
Share Transfer System Transfer of shares held in physical mode is processed by Registrar and Share Transfer Agent M/s. Link Intime (India) Pvt. Ltd. Valid Share transfers in physical form and complete in all respects were approved, registered and dispatched within stipulated period respects were approved, registered and dispatched within stipulated period.
Reconciliation of Share Capital Audit & Certificate pursuant to Regulation 40 (9) of SEBI (LODR) Regulations, 2015:
A qualified professional carries out a Reconciliation of Share Capital Audit to reconcile the total admitted capital with NSDL and CDSL and the total issued and listed capital. The audit confirms that the total issued/paid up capital is in agreement with the aggregate of the total number of shares in physical form and the total number of shares in dematerialized form (held with NSDL and CDSL).
Pursuant to Regulation 40 (9) of SEBI (LODR) Regulations, 2015 with the Stock Exchanges, certificates, on half-yearly basis, have been issued by a Company Secretary in Practice for due compliance of share transfer formalities by the Company.
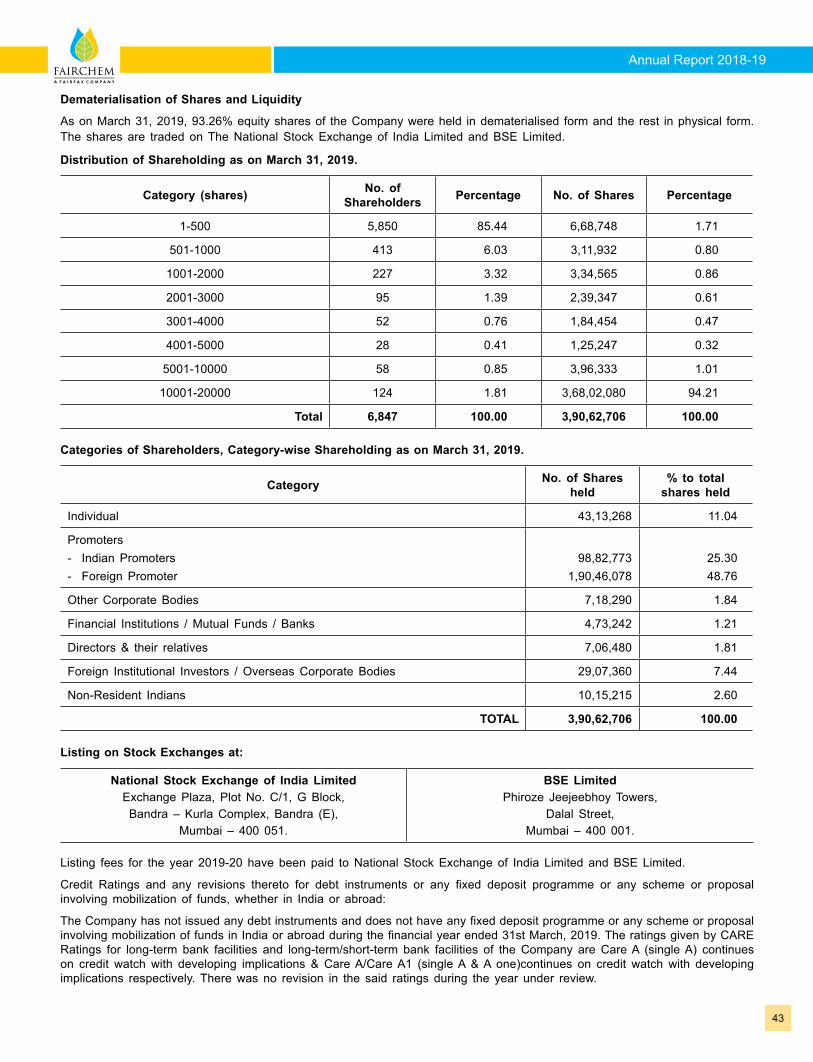
Annual Report 2018-19
43
Dematerialisation of Shares and Liquidity
As on March 31, 2019, 93.26% equity shares of the Company were held in dematerialised form and the rest in physical form. The shares are traded on The National Stock Exchange of India Limited and BSE Limited.
Distribution of Shareholding as on March 31, 2019.
Category (shares) No. of Shareholders Percentage No. of Shares Percentage
1-500 5,850 85.44 6,68,748 1.71
501-1000 413 6.03 3,11,932 0.80
1001-2000 227 3.32 3,34,565 0.86
2001-3000 95 1.39 2,39,347 0.61
3001-4000 52 0.76 1,84,454 0.47
4001-5000 28 0.41 1,25,247 0.32
5001-10000 58 0.85 3,96,333 1.01
10001-20000 124 1.81 3,68,02,080 94.21
Total 6,847 100.00 3,90,62,706 100.00
Categories of Shareholders, Category-wise Shareholding as on March 31, 2019.
Category No. of Shares held
% to total shares held
Individual 43,13,268 11.04
Promoters- Indian Promoters- Foreign Promoter
98,82,7731,90,46,078
25.3048.76
Other Corporate Bodies 7,18,290 1.84
Financial Institutions / Mutual Funds / Banks 4,73,242 1.21
Directors & their relatives 7,06,480 1.81
Foreign Institutional Investors / Overseas Corporate Bodies 29,07,360 7.44
Non-Resident Indians 10,15,215 2.60
TOTAL 3,90,62,706 100.00
Listing on Stock Exchanges at:
National Stock Exchange of India Limited Exchange Plaza, Plot No. C/1, G Block, Bandra – Kurla Complex, Bandra (E),
Mumbai – 400 051.
BSE LimitedPhiroze Jeejeebhoy Towers,
Dalal Street, Mumbai – 400 001.
Listing fees for the year 2019-20 have been paid to National Stock Exchange of India Limited and BSE Limited.
Credit Ratings and any revisions thereto for debt instruments or any fixed deposit programme or any scheme or proposal involving mobilization of funds, whether in India or abroad:
The Company has not issued any debt instruments and does not have any fixed deposit programme or any scheme or proposal involving mobilization of funds in India or abroad during the financial year ended 31st March, 2019. The ratings given by CARE Ratings for long-term bank facilities and long-term/short-term bank facilities of the Company are Care A (single A) continues on credit watch with developing implications & Care A/Care A1 (single A & A one)continues on credit watch with developing implications respectively. There was no revision in the said ratings during the year under review.
44
FAIRCHEM SPECIALITY LIMITED
Stock Codes / Symbol BSE Ltd. …. 530117 National Stock Exchange of India Ltd. …. FAIRCHEM Demat ISIN No. in NSDL & CDSL for Equity Shares …. INE959A01019
Registered Office 324, Dr. D.N. Road, Fort, Mumbai – 400 001,
Contact Person Mr. Rajen Jhaveri Chief Financial Officer and Company Secretary
E-mail [email protected] [email protected] [email protected]
Plant Location & Works and Office 253/P and 312, Chekhala, Sanand-Kadi Highway, Ta. Sanand, Dist. Ahmedabad - 382 115.
Registrar & Share Transfer Agent: Link Intime India Pvt. Ltd. C101, 247 Park, L.B.S. Marg, Vikhroli (West), Mumbai - 400 083.
Corporate Office at Ahmedabad: Link Intime India Pvt. Ltd. 5th Floor, 506 to 508, Amarnath Business Centre – 1 (ABC-1), Beside Gala Business Centre, Nr. St. Xavier’s College Corner, Off C G Road, Ellisbridge, Ahmedabad - 380006.
Declaration: In accordance with Part D of Schedule V of SEBI (Listing Obligations and Disclosure Requirements) Regulations, 2015,
I hereby confirm that, all the Directors and the Senior Management personnel of the Company have affirmed compliance with the Code of Business Conduct and Ethics for Board of Directors, Senior Management & Employees, as applicable to them, for the financial year ended March 31, 2019.
For Fairchem Speciality Limited,
Place : Mumbai Nahoosh JariwalaDate : May 09, 2019 Managing Director
Annual Report 2018-19
45
CEO AND CFO CERTIFICATION
The Managing Directors and the Chief Financial Officer of the Company give annual certification on financial reporting and internal controls to the Board in terms of Regulation 17(8) of SEBI (LODR) Regulations, 2015. The Managing Directors and the Chief Financial Officer also give quarterly certification on financial results while placing the financial results before the Board in terms of Regulation 33 of SEBI (LODR) Regulations, 2015. The annual certificate given by the Managing Directors and the Chief Financial Officer is published in this Report.
CERTIFICATE OF COMPLIANCE WITH THE CODE OF CONDUCT POLICY
As provided under Regulation 26 (3) of SEBI (LODR) Regulations, 2015 with the Stock Exchanges, the Board Members and the Senior Management Personnel have confirmed compliance with the Code of Conduct for the year ended March 31, 2019.
For Fairchem Speciality Limited,
Place : Mumbai Nahoosh Jariwala Mahesh BabaniDate : May 09, 2019 Managing Director Managing Director
46
FAIRCHEM SPECIALITY LIMITED
CEO / CFO CERTIFICATION UNDER Regulation 17(8) of SEBI (LODR) Regulations, 2015
To, The Board of Directors, Fairchem Speciality Limited
(1) We have reviewed financial statements and the cash flow statement of Fairchem Speciality Limited for the year ended March 31, 2019 and hereby certify that to the best of our knowledge and belief
(i) these statements do not contain any materially untrue statement or omit any material fact or contain statements that might be misleading;
(ii) these statements together present a true and fair view of the Company’s affairs and are in compliance with existing accounting standards, applicable laws and regulations.
(2) During the year, there are, to the best of our knowledge and belief, no transactions entered into by the Company which are fraudulent, illegal or violative of the Company’s Code of Conduct.
(3) We accept responsibility for establishing and maintaining internal controls for financial reporting and we have evaluated the effectiveness of Company’s internal control systems pertaining to financial reporting. We have not come across any reportable deficiencies in the design or operation of such internal controls.
(4) We have indicated to the Auditors and the Audit Committee :
(i) that there are no significant changes in internal control over financial reporting during the year;
(ii) that there are no significant changes in accounting policies during the year and
(iii) that there are no instances of significant fraud of which we have become aware.
Rajen Jhaveri Nahoosh Jariwala Mahesh Babani Chief Financial Officer Managing Director Managing Director
Place : Mumbai Date : May 09, 2019
Annual Report 2018-19
47
COMPLIANCE CERTIFICATE ON CORPORATE GOVERNANCE
To, The Members, FAIRCHEM SPECIALITY LIMITEDCIN : L15140MH1985PLC286828Works & Office: 253/P & 312, Village – Chekhala, Sanand – Kadi Highway,Taluka – Sanand,Dist. Ahmedabad – 382 115
We have examined all relevant records of FAIRCHEM SPECIALITY LIMITED for the purpose of certifying compliance of conditions of Corporate Governance as stipulated under para C of Schedule V read with Regulation 34(3) of SEBI (Listing Obligations and Disclosure Requirements) Regulations, 2015 for the year ended on March 31, 2019.
The compliance of conditions of Corporate Governance is the responsibility of the management. Our examination was limited to the procedures and implementation thereof, adopted by the Company for ensuring the compliance of the conditions of the Corporate Governance. It is neither an audit nor an expression of opinion on the financial statements of the Company. This certificate is neither an assurance as to the further viability of the Company nor of the effectiveness with which the management has conducted the affairs of the Company.
On the basis of the examination of the records produced, explanations and information furnished, we certify that the Company has complied with the mandatory conditions of the Corporate Governance as stipulated in para C of Schedule V read with Regulation 34 (3) of SEBI (Listing Obligations and Disclosure Requirements) Regulations, 2015.
This certificate is issued solely for the purpose of complying with the aforesaid regulations.
For Parikh Dave & Associates Company Secretaries
Uday G. DavePARTNER
Place : Ahmedabad PRACTISING COMPANY SECRETARYDate : May 9, 2019 FCS No. 6545 C. P. No.: 7158
48
FAIRCHEM SPECIALITY LIMITED
Independent Auditors’ ReportTo the Members of
FAIRCHEM SPECIALITY LIMITEDReport on the audit of the Standalone Ind AS financial statements
Opinion1. We have audited the accompanying standalone Ind AS financial statements of Fairchem Speciality Limited (“the Company”),
which comprise the Balance Sheet as at March 31, 2019, and the Statement of Profit and Loss (including Other Comprehensive Income), Statement of Changes in Equity and Statement of Cash flows for the year then ended, and notes to the standalone Ind AS financial statements, including a summary of significant accounting policies and other explanatory information.
2. In our opinion and to the best of our information and according to the explanations given to us, the aforesaid standalone Ind AS financial statements give the information required by the Companies Act, 2013 (“the Act”) in the manner so required and give a true and fair view in conformity with the accounting principles generally accepted in India, of the state of affairs of the Company as at March 31, 2019, and total comprehensive income (comprising profit and other comprehensive income), changes in equity and its cash flows for the year then ended.
Basis for opinion3. We conducted our audit in accordance with the Standards on Auditing (SAs) specified under section 143(10) of the Act. Our
responsibilities under those Standards are further described in the Auditor’s Responsibilities for the Audit of the Financial Statements section of our report. We are independent of the Company in accordance with the Code of Ethics issued by the Institute of Chartered Accountants of India together with the ethical requirements that are relevant to our audit of the standalone Ind AS financial statements under the provisions of the Act and the Rules thereunder, and we have fulfilled our other ethical responsibilities in accordance with these requirements and the Code of Ethics. We believe that the audit evidence we have obtained is sufficient and appropriate to provide a basis for our opinion.
Key audit matters 4. Key audit matters are those matters that, in our professional judgment, were of most significance in our audit of the
standalone Ind AS financial statements of the current period. These matters were addressed in the context of our audit of the standalone Ind AS financial statements as a whole, and in forming our opinion thereon, and we do not provide a separate opinion on these matters.
Key audit matter How our audit addressed the key audit matterRevenue Recognition
Refer to Note 2 (c), 30 and 50 to the Standalone Ind AS financial statements.
The Company has adopted Ind-AS 115 “Revenue from Contracts with Customers” which is effective from April 1, 2018. The Company has opted for modified retrospective approach and accordingly, reviewed its existing customer contracts in this regard.
Management has used judgement in respect of matters such as identification of performance obligations; allocation of consideration to identified performance obligations and recognition of revenue over a period of time or at a point in time based on timing when control is transferred to customer.
We focused on this area as revenue is required to be recognised in accordance with the terms of the customer contracts, which involves significant management judgements as described above and thus there is an inherent risk of material misstatement; and further, additional disclosures are required to be made in the year of adoption in accordance with the applicable accounting standards.
Our testing of revenue transactions was designed to cover certain customer contracts. Our audit procedures included the following:
• Understanding, evaluating the design and testing the operating effectiveness of controls over revenue recognition.
• Assessing appropriateness of management’s significant judgements in accounting for identified contracts such as identification of performance obligation and allocation of consideration to identified performance obligation;
• Evaluating the contract terms for assessment of the timing of transfer of control to the customer to assess whether revenue is recognised appropriately over a period of time or at a point in time (as the case may be) based on timing when control is transferred to customer
• Testing whether the revenue recognition is in line with the terms of customer contracts and the transfer of control; and
• Evaluating adequacy of the presentation and disclosures
Based on the above stated procedures, no significant exceptions were noted in revenue recognition including those relating to presentation and disclosures.
Annual Report 2018-19
49
Other Information
5. The Company’s Board of Directors is responsible for the other information. The other information comprises the information included in the board report, but does not include the standalone Ind AS financial statements and our auditor’s report thereon.
Our opinion on the standalone Ind AS financial statements does not cover the other information and we do not express any form of assurance conclusion thereon.
In connection with our audit of the standalone Ind AS financial statements, our responsibility is to read the other information and, in doing so, consider whether the other information is materially inconsistent with the standalone Ind AS financial statements or our knowledge obtained in the audit or otherwise appears to be materially misstated. If, based on the work we have performed, we conclude that there is a material misstatement of this other information, we are required to report that fact.
We have nothing to report in this regard.
Responsibilities of management and those charged with governance for the Standalone Ind AS Financial Statements
6. The Company’s Board of Directors is responsible for the matters stated in section 134(5) of the Act with respect to the preparation of these standalone Ind AS financial statements that give a true and fair view of the financial position, financial performance, changes in equity and cash flows of the Company in accordance with the accounting principles generally accepted in India, including the Accounting Standards specified under section 133 of the Act. This responsibility also includes maintenance of adequate accounting records in accordance with the provisions of the Act for safeguarding of the assets of the Company and for preventing and detecting frauds and other irregularities; selection and application of appropriate accounting policies; making judgments and estimates that are reasonable and prudent; and design, implementation and maintenance of adequate internal financial controls, that were operating effectively for ensuring the accuracy and completeness of the accounting records, relevant to the preparation and presentation of the standalone Ind AS financial statements that give a true and fair view and are free from material misstatement, whether due to fraud or error.
7. In preparing the standalone Ind AS financial statements, management is responsible for assessing the Company’s ability to continue as a going concern, disclosing, as applicable, matters related to going concern and using the going concern basis of accounting unless management either intends to liquidate the Company or to cease operations, or has no realistic alternative but to do so. Those Board of Directors are also responsible for overseeing the Company’s financial reporting process.
Auditor’s responsibilities for the audit of the Standalone Ind AS Financial Statements
8. Our objectives are to obtain reasonable assurance about whether the standalone Ind AS financial statements as a whole are free from material misstatement, whether due to fraud or error, and to issue an auditor’s report that includes our opinion. Reasonable assurance is a high level of assurance, but is not a guarantee that an audit conducted in accordance with SAs will always detect a material misstatement when it exists. Misstatements can arise from fraud or error and are considered material if, individually or in the aggregate, they could reasonably be expected to influence the economic decisions of users taken on the basis of these standalone Ind AS financial statements.
9. As part of an audit in accordance with SAs, we exercise professional judgment and maintain professional scepticism throughout the audit. We also:
• Identify and assess the risks of material misstatement of the standalone Ind AS financial statements, whether due to fraud or error, design and perform audit procedures responsive to those risks, and obtain audit evidence that is sufficient and appropriate to provide a basis for our opinion. The risk of not detecting a material misstatement resulting from fraud is higher than for one resulting from error, as fraud may involve collusion, forgery, intentional omissions, misrepresentations, or the override of internal control.
• Obtain an understanding of internal control relevant to the audit in order to design audit procedures that are appropriate in the circumstances. Under section 143(3)(i) of the Companies Act, 2013, we are also responsible for expressing our opinion on whether the company has adequate internal financial controls with reference to financial statements in place and the operating effectiveness of such controls.
• Evaluate the appropriateness of accounting policies used and the reasonableness of accounting estimates and related disclosures made by management.
• Conclude on the appropriateness of management’s use of the going concern basis of accounting and, based on the audit evidence obtained, whether a material uncertainty exists related to events or conditions that may cast significant doubt on the Company’s ability to continue as a going concern. If we conclude that a material uncertainty exists, we are required to draw attention in our auditor’s report to the related disclosures in the standalone Ind AS financial statements or, if such disclosures are inadequate, to modify our opinion. Our conclusions are based on the audit evidence obtained up to the date of our auditor’s report. However, future events or conditions may cause the Company to cease to continue as a going concern.
50
FAIRCHEM SPECIALITY LIMITED
• Evaluate the overall presentation, structure and content of the standalone Ind AS financial statements, including the disclosures, and whether the standalone Ind AS financial statements represent the underlying transactions and events in a manner that achieves fair presentation.
10. We communicate with those charged with governance regarding, among other matters, the planned scope and timing of the audit and significant audit findings, including any significant deficiencies in internal control that we identify during our audit.
11. We also provide those charged with governance with a statement that we have complied with relevant ethical requirements regarding independence, and to communicate with them all relationships and other matters that may reasonably be thought to bear on our independence, and where applicable, related safeguards.
12. From the matters communicated with those charged with governance, we determine those matters that were of most significance in the audit of the standalone Ind AS financial statements of the current period and are therefore the key audit matters. We describe these matters in our auditor’s report unless law or regulation precludes public disclosure about the matter or when, in extremely rare circumstances, we determine that a matter should not be communicated in our report because the adverse consequences of doing so would reasonably be expected to outweigh the public interest benefits of such communication.
Report on other legal and regulatory requirements
13. As required by the Companies (Auditor’s Report) Order, 2016 (“the Order”), issued by the Central Government of India in terms of sub-section (11) of section 143 of the Act, we give in the Annexure B, a statement on the matters specified in paragraphs 3 and 4 of the Order, to the extent applicable.
14. As required by Section 143(3) of the Act, we report that:
a) We have sought and obtained all the information and explanations which to the best of our knowledge and belief were necessary for the purposes of our audit.
b) In our opinion, proper books of account as required by law have been kept by the Company so far as it appears from our examination of those books.
c) The Balance Sheet, the Statement of Profit and Loss (including other comprehensive income), the Statement of Changes in Equity and the Cash flow Statement dealt with by this Report are in agreement with the books of account.
d) In our opinion, the aforesaid standalone Ind AS financial statements comply with the Accounting Standards specified under Section 133 of the Act.
e) On the basis of the written representations received from the directors as on March 31, 2019 taken on record by the Board of Directors, none of the directors is disqualified as on March 31, 2019 from being appointed as a director in terms of Section 164 (2) of the Act.
f) With respect to the adequacy of the internal financial controls with reference to financial statements of the Company and the operating effectiveness of such controls, refer to our separate Report in “Annexure A”.
g) With respect to the other matters to be included in the Auditor’s Report in accordance with Rule 11 of the Companies (Audit and Auditors) Rules, 2014, in our opinion and to the best of our information and according to the explanations given to us:
i. The Company has disclosed the impact of pending litigations on its financial position in its standalone Ind AS financial statements – Refer Note 45;
ii. The Company did not have any long-term contracts including derivative contracts for which there were any material foreseeable losses;
iii. There has been no delay in transferring amounts, required to be transferred, to the Investor Education and Protection Fund by the Company during the year ended March 31, 2019;
iv. The reporting on disclosures relating to Specified Bank Notes is not applicable to the Company for the year ended March 31, 2019.
For Price Waterhouse & Co Chartered Accountants LLPChartered Accountants
Firm Registration Number: 304026E/ E-300009
Place : Mumbai Priyanshu GundanaDate : May 9, 2019 Partner
M No : 109553
Annual Report 2018-19
51
“Annexure A” to Independent Auditors’ ReportReferred to in paragraph 14(f)of the Independent Auditors’ Report of even date to the members of Fairchem Speciality Limited on the standalone Ind AS financial statements for the year ended March 31, 2019Report on the Internal Financial Controls with reference to financial statements under Clause (i) of Sub-section 3 of Section 143 of the Act1. We have audited the internal financial controls with reference to financial statements of Fairchem Speciality Limited (“the
Company”) as of March 31, 2019 in conjunction with our audit of the standalone Ind AS financial statements of the Company for the year ended on that date.
Management’s Responsibility for Internal Financial Controls2. The Company’s management is responsible for establishing and maintaining internal financial controls based on the internal
control over financial reporting criteria established by the Company considering the essential components of internal control stated in the Guidance Note on Audit of Internal Financial Controls Over Financial Reporting issued by the Institute of Chartered Accountants of India (ICAI). These responsibilities include the design, implementation and maintenance of adequate internal financial controls that were operating effectively for ensuring the orderly and efficient conduct of its business, including adherence to company’s policies, the safeguarding of its assets, the prevention and detection of frauds and errors, the accuracy and completeness of the accounting records, and the timely preparation of reliable financial information, as required under the Act.
Auditors’ Responsibility3. Our responsibility is to express an opinion on the Company’s internal financial controls with reference to financial statements
based on our audit. We conducted our audit in accordance with the Guidance Note on Audit of Internal Financial Controls Over Financial Reporting (the“Guidance Note”) and the Standards on Auditing deemed to be prescribed under section 143(10) of the Act to the extent applicable to an audit of internal financial controls, both applicable to an audit of internal financial controls and both issued by the ICAI. Those Standards and the Guidance Note require that we comply with ethical requirements and plan and perform the audit to obtain reasonable assurance about whether adequate internal financial controls with reference to financial statements was established and maintained and if such controls operated effectively in all material respects.
4. Our audit involves performing procedures to obtain audit evidence about the adequacy of the internal financial controls with reference to financial statements and their operating effectiveness. Our audit of internal financial controls with reference to financial statements included obtaining an understanding of internal financial controls with reference to financial statements, assessing the risk that a material weakness exists, and testing and evaluating the design and operating effectiveness of internal control based on the assessed risk. The procedures selected depend on the auditor’s judgement, including the assessment of the risks of material misstatement of the financial statements, whether due to fraud or error.
5. We believe that the audit evidence we have obtained is sufficient and appropriate to provide a basis for our audit opinion on the Company’s internal financial controls with reference to financial statements.
Meaning of Internal Financial Controls with reference to financial statements6. A company’s internal financial controls with reference to financial statements is a process designed to provide reasonable
assurance regarding the reliability of financial reporting and the preparation of financial statements for external purposes in accordance with generally accepted accounting principles. A company’s internal financial controls with reference to financial statements includes those policies and procedures that (1) pertain to the maintenance of records that, in reasonable detail, accurately and fairly reflect the transactions and dispositions of the assets of the company; (2) provide reasonable assurance that transactions are recorded as necessary to permit preparation of financial statements in accordance with generally accepted accounting principles, and that receipts and expenditures of the company are being made only in accordance with authorisations of management and directors of the company; and (3) provide reasonable assurance regarding prevention or timely detection of unauthorised acquisition, use, or disposition of the company’s assets that could have a material effect on the financial statements.
Inherent Limitations of Internal Financial Controls with reference to financial statements7. Because of the inherent limitations of internal financial controls with reference to financial statements, including the possibility
of collusion or improper management override of controls, material misstatements due to error or fraud may occur and not be detected. Also, projections of any evaluation of the internal financial controls with reference to financial statements to future periods are subject to the risk that the internal financial control controls with reference to financial statements may become inadequate because of changes in conditions, or that the degree of compliance with the policies or procedures may deteriorate.
Opinion8. In our opinion, the Company has, in all material respects, adequate internal financial controls with reference to financial
statements and such internal financial controls with reference to financial statements were operating effectively as at March 31, 2019, based on the internal control over financial reporting criteria established by the Company considering the essential components of internal control stated in the Guidance Note on Audit of Internal Financial Controls Over Financial Reporting issued by the Institute of Chartered Accountants of India.
For Price Waterhouse & Co Chartered Accountants LLP Chartered Accountants
Firm Registration Number:304026E/ E-300009
Place : Mumbai Priyanshu GundanaDate : May 9, 2019 Partner
M No : 109553
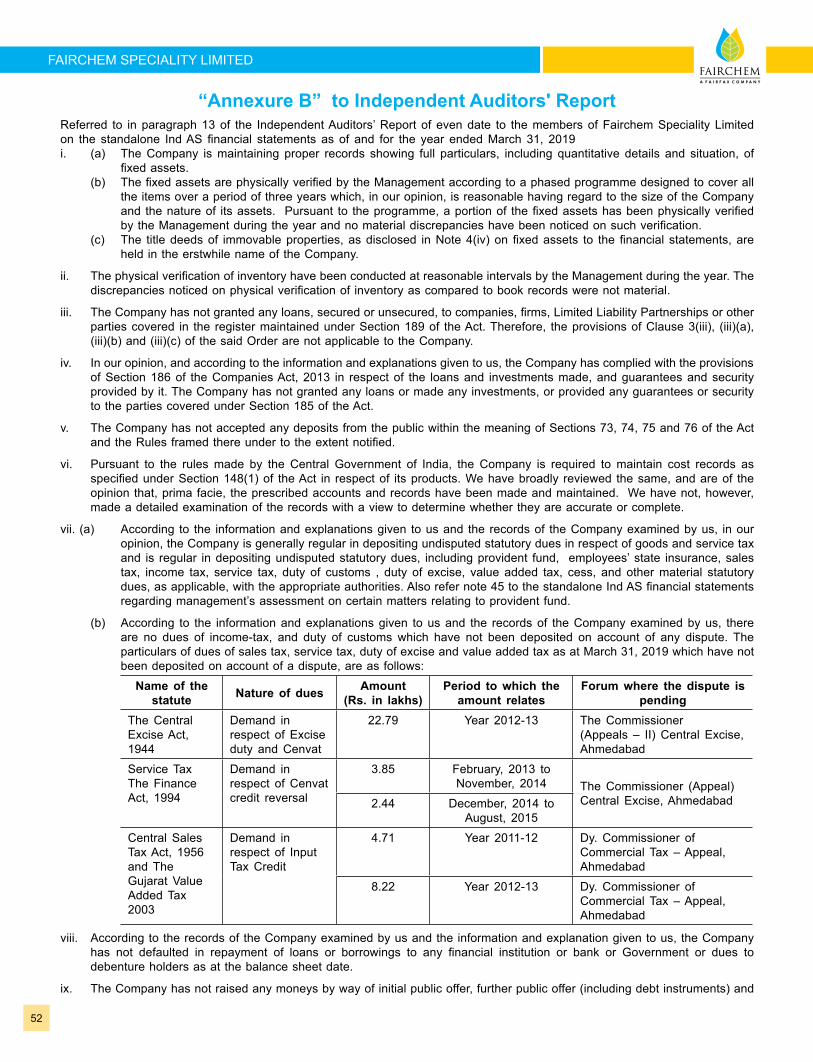
52
FAIRCHEM SPECIALITY LIMITED
“Annexure B” to Independent Auditors' ReportReferred to in paragraph 13 of the Independent Auditors’ Report of even date to the members of Fairchem Speciality Limited on the standalone Ind AS financial statements as of and for the year ended March 31, 2019i. (a) The Company is maintaining proper records showing full particulars, including quantitative details and situation, of
fixed assets. (b) The fixed assets are physically verified by the Management according to a phased programme designed to cover all
the items over a period of three years which, in our opinion, is reasonable having regard to the size of the Company and the nature of its assets. Pursuant to the programme, a portion of the fixed assets has been physically verified by the Management during the year and no material discrepancies have been noticed on such verification.
(c) The title deeds of immovable properties, as disclosed in Note 4(iv) on fixed assets to the financial statements, are held in the erstwhile name of the Company.
ii. The physical verification of inventory have been conducted at reasonable intervals by the Management during the year. The discrepancies noticed on physical verification of inventory as compared to book records were not material.
iii. The Company has not granted any loans, secured or unsecured, to companies, firms, Limited Liability Partnerships or other parties covered in the register maintained under Section 189 of the Act. Therefore, the provisions of Clause 3(iii), (iii)(a), (iii)(b) and (iii)(c) of the said Order are not applicable to the Company.
iv. In our opinion, and according to the information and explanations given to us, the Company has complied with the provisions of Section 186 of the Companies Act, 2013 in respect of the loans and investments made, and guarantees and security provided by it. The Company has not granted any loans or made any investments, or provided any guarantees or security to the parties covered under Section 185 of the Act.
v. The Company has not accepted any deposits from the public within the meaning of Sections 73, 74, 75 and 76 of the Act and the Rules framed there under to the extent notified.
vi. Pursuant to the rules made by the Central Government of India, the Company is required to maintain cost records as specified under Section 148(1) of the Act in respect of its products. We have broadly reviewed the same, and are of the opinion that, prima facie, the prescribed accounts and records have been made and maintained. We have not, however, made a detailed examination of the records with a view to determine whether they are accurate or complete.
vii. (a) According to the information and explanations given to us and the records of the Company examined by us, in our opinion, the Company is generally regular in depositing undisputed statutory dues in respect of goods and service tax and is regular in depositing undisputed statutory dues, including provident fund, employees’ state insurance, sales tax, income tax, service tax, duty of customs , duty of excise, value added tax, cess, and other material statutory dues, as applicable, with the appropriate authorities. Also refer note 45 to the standalone Ind AS financial statements regarding management’s assessment on certain matters relating to provident fund.
(b) According to the information and explanations given to us and the records of the Company examined by us, there are no dues of income-tax, and duty of customs which have not been deposited on account of any dispute. The particulars of dues of sales tax, service tax, duty of excise and value added tax as at March 31, 2019 which have not been deposited on account of a dispute, are as follows:
Name of the statute Nature of dues Amount
(Rs. in lakhs)Period to which the
amount relatesForum where the dispute is
pendingThe Central Excise Act, 1944
Demand in respect of Excise duty and Cenvat
22.79 Year 2012-13 The Commissioner (Appeals – II) Central Excise, Ahmedabad
Service Tax The Finance Act, 1994
Demand in respect of Cenvat credit reversal
3.85 February, 2013 toNovember, 2014 The Commissioner (Appeal)
Central Excise, Ahmedabad2.44 December, 2014 toAugust, 2015
Central Sales Tax Act, 1956 and The Gujarat Value Added Tax 2003
Demand in respect of Input Tax Credit
4.71 Year 2011-12 Dy. Commissioner of Commercial Tax – Appeal, Ahmedabad
8.22 Year 2012-13 Dy. Commissioner of Commercial Tax – Appeal, Ahmedabad
viii. According to the records of the Company examined by us and the information and explanation given to us, the Company has not defaulted in repayment of loans or borrowings to any financial institution or bank or Government or dues to debenture holders as at the balance sheet date.
ix. The Company has not raised any moneys by way of initial public offer, further public offer (including debt instruments) and
Annual Report 2018-19
53
term loans. Accordingly, the provisions of Clause 3(ix) of the Order are not applicable to the Company.
x. During the course of our examination of the books and records of the Company, carried out in accordance with the generally accepted auditing practices in India, and according to the information and explanations given to us, we have neither come across any instance of material fraud by the Company or on the Company by its officers or employees, noticed or reported during the year, nor have we been informed of any such case by the Management.
xi. The Company has paid/provided for managerial remuneration in accordance with the requisite approvals mandated by the provisions of Section 197 read with Schedule V to the Act.
xii. As the Company is not a Nidhi Company and the Nidhi Rules, 2014 are not applicable to it, the provisions of Clause 3(xii) of the Order are not applicable to the Company.
xiii. The Company has entered into transactions with related parties in compliance with the provisions of Sections 177 and 188 of the Act. The details of such related party transactions have been disclosed in the financial statements as required under Indian Accounting Standard (Ind AS) 24, Related Party Disclosures specified under Section 133 of the Act.
xiv. The Company has not made any preferential allotment or private placement of shares or fully or partly convertible debentures during the year under review. Accordingly, the provisions of Clause 3(xiv) of the Order are not applicable to the Company.
xv. The Company has not entered into any non cash transactions with its directors or persons connected with him. Accordingly, the provisions of Clause 3(xv) of the Order are not applicable to the Company.
xvi. The Company is not required to be registered under Section 45-IA of the Reserve Bank of India Act, 1934. Accordingly, the provisions of Clause 3(xvi) of the Order are not applicable to the Company.
For Price Waterhouse & Co Chartered Accountants LLP Chartered Accountants
Firm Registration Number:304026E/ E-300009
Place : Mumbai Priyanshu GundanaDate : May 9, 2019 Partner
M No : 109553
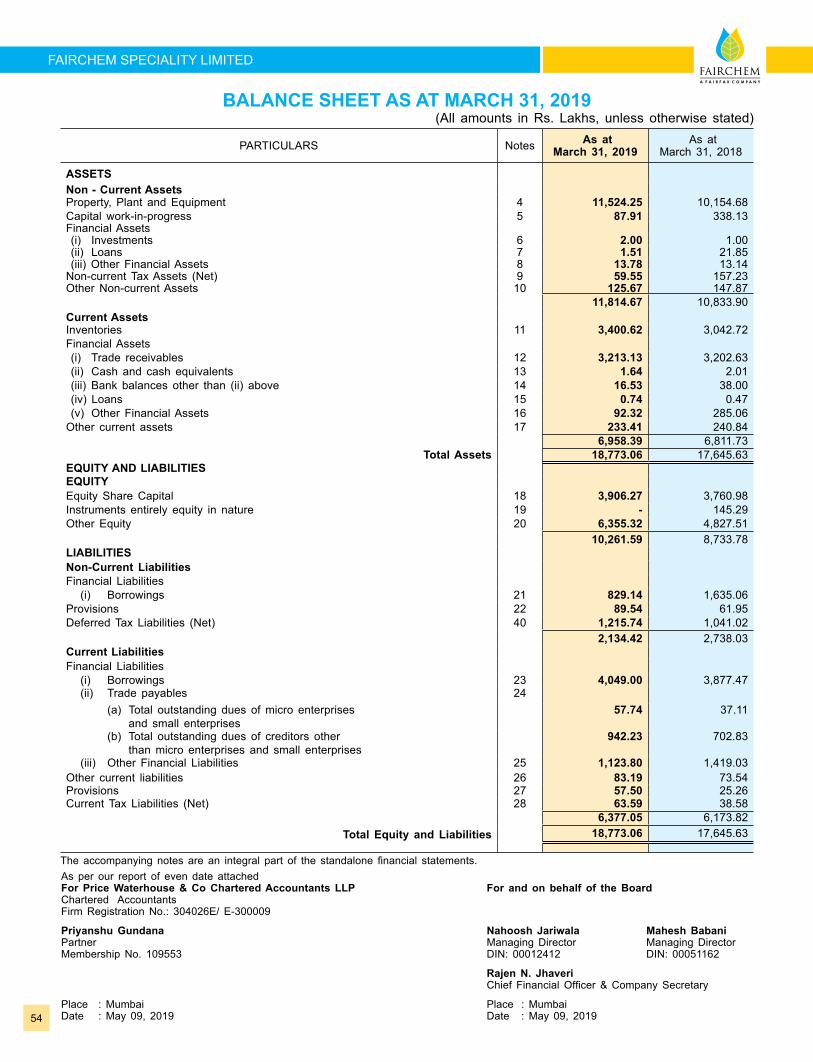
54
FAIRCHEM SPECIALITY LIMITED
BALANCE SHEET AS AT MARCH 31, 2019(All amounts in Rs. Lakhs, unless otherwise stated)
PARTICULARS Notes As at March 31, 2019
As at March 31, 2018
ASSETSNon - Current AssetsProperty, Plant and Equipment 4 11,524.25 10,154.68 Capital work-in-progress 5 87.91 338.13 Financial Assets (i) Investments 6 2.00 1.00 (ii) Loans 7 1.51 21.85 (iii) Other Financial Assets 8 13.78 13.14 Non-current Tax Assets (Net) 9 59.55 157.23 Other Non-current Assets 10 125.67 147.87
11,814.67 10,833.90 Current AssetsInventories 11 3,400.62 3,042.72 Financial Assets (i) Trade receivables 12 3,213.13 3,202.63 (ii) Cash and cash equivalents 13 1.64 2.01 (iii) Bank balances other than (ii) above 14 16.53 38.00 (iv) Loans 15 0.74 0.47 (v) Other Financial Assets 16 92.32 285.06 Other current assets 17 233.41 240.84
6,958.39 6,811.73 Total Assets 18,773.06 17,645.63
EQUITY AND LIABILITIESEQUITYEquity Share Capital 18 3,906.27 3,760.98 Instruments entirely equity in nature 19 - 145.29 Other Equity 20 6,355.32 4,827.51
10,261.59 8,733.78 LIABILITIESNon-Current LiabilitiesFinancial Liabilities (i) Borrowings 21 829.14 1,635.06 Provisions 22 89.54 61.95 Deferred Tax Liabilities (Net) 40 1,215.74 1,041.02
2,134.42 2,738.03 Current LiabilitiesFinancial Liabilities (i) Borrowings 23 4,049.00 3,877.47 (ii) Trade payables 24 (a) Total outstanding dues of micro enterprises and small enterprises
57.74 37.11
(b) Total outstanding dues of creditors other than micro enterprises and small enterprises
942.23 702.83
(iii) Other Financial Liabilities 25 1,123.80 1,419.03 Other current liabilities 26 83.19 73.54 Provisions 27 57.50 25.26 Current Tax Liabilities (Net) 28 63.59 38.58
6,377.05 6,173.82 Total Equity and Liabilities 18,773.06 17,645.63
The accompanying notes are an integral part of the standalone financial statements.As per our report of even date attachedFor Price Waterhouse & Co Chartered Accountants LLP For and on behalf of the BoardChartered Accountants Firm Registration No.: 304026E/ E-300009
Priyanshu Gundana Nahoosh Jariwala Mahesh BabaniPartner Managing Director Managing DirectorMembership No. 109553 DIN: 00012412 DIN: 00051162
Rajen N. Jhaveri Chief Financial Officer & Company Secretary
Place : Mumbai Place : MumbaiDate : May 09, 2019 Date : May 09, 2019
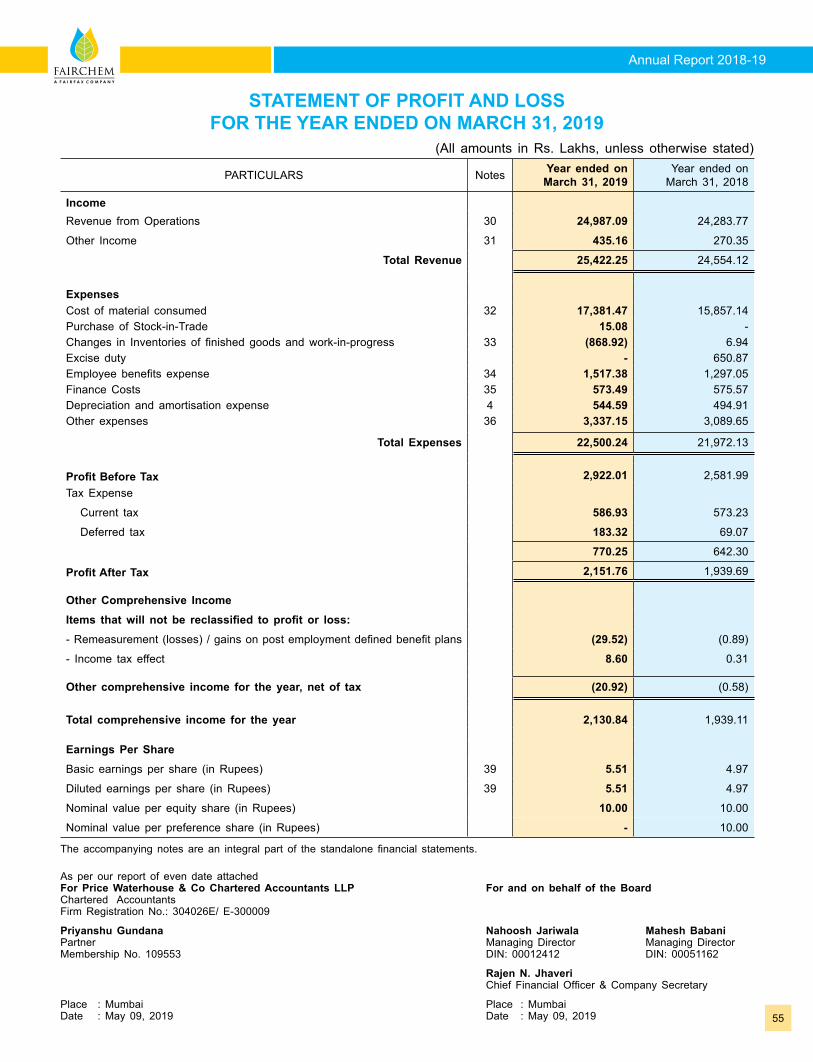
Annual Report 2018-19
55
As per our report of even date attachedFor Price Waterhouse & Co Chartered Accountants LLP For and on behalf of the BoardChartered Accountants Firm Registration No.: 304026E/ E-300009
Priyanshu Gundana Nahoosh Jariwala Mahesh BabaniPartner Managing Director Managing DirectorMembership No. 109553 DIN: 00012412 DIN: 00051162
Rajen N. Jhaveri Chief Financial Officer & Company Secretary
Place : Mumbai Place : MumbaiDate : May 09, 2019 Date : May 09, 2019
STATEMENT OF PROFIT AND LOSS FOR THE YEAR ENDED ON MARCH 31, 2019
(All amounts in Rs. Lakhs, unless otherwise stated)
PARTICULARS Notes Year ended on March 31, 2019
Year ended on March 31, 2018
IncomeRevenue from Operations 30 24,987.09 24,283.77
Other Income 31 435.16 270.35
Total Revenue 25,422.25 24,554.12
ExpensesCost of material consumed 32 17,381.47 15,857.14 Purchase of Stock-in-Trade 15.08 - Changes in Inventories of finished goods and work-in-progress 33 (868.92) 6.94 Excise duty - 650.87 Employee benefits expense 34 1,517.38 1,297.05 Finance Costs 35 573.49 575.57 Depreciation and amortisation expense 4 544.59 494.91 Other expenses 36 3,337.15 3,089.65
Total Expenses 22,500.24 21,972.13
Profit Before Tax 2,922.01 2,581.99 Tax Expense
Current tax 586.93 573.23
Deferred tax 183.32 69.07
770.25 642.30
Profit After Tax 2,151.76 1,939.69
Other Comprehensive IncomeItems that will not be reclassified to profit or loss:- Remeasurement (losses) / gains on post employment defined benefit plans (29.52) (0.89)
- Income tax effect 8.60 0.31
Other comprehensive income for the year, net of tax (20.92) (0.58)
Total comprehensive income for the year 2,130.84 1,939.11
Earnings Per ShareBasic earnings per share (in Rupees) 39 5.51 4.97
Diluted earnings per share (in Rupees) 39 5.51 4.97
Nominal value per equity share (in Rupees) 10.00 10.00
Nominal value per preference share (in Rupees) - 10.00
The accompanying notes are an integral part of the standalone financial statements.
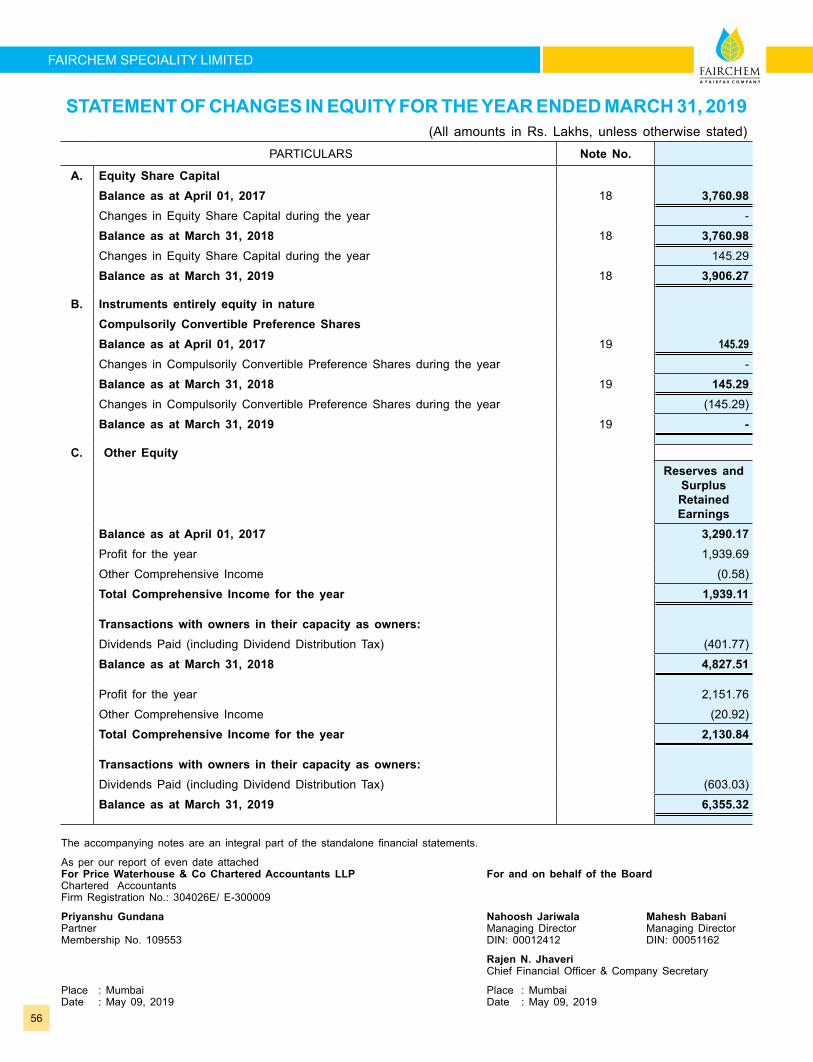
56
FAIRCHEM SPECIALITY LIMITED
STATEMENT OF CHANGES IN EQUITY FOR THE YEAR ENDED MARCH 31, 2019(All amounts in Rs. Lakhs, unless otherwise stated)
PARTICULARS Note No.
A. Equity Share CapitalBalance as at April 01, 2017 18 3,760.98 Changes in Equity Share Capital during the year -
Balance as at March 31, 2018 18 3,760.98 Changes in Equity Share Capital during the year 145.29
Balance as at March 31, 2019 18 3,906.27
B. Instruments entirely equity in natureCompulsorily Convertible Preference SharesBalance as at April 01, 2017 19 145.29 Changes in Compulsorily Convertible Preference Shares during the year -
Balance as at March 31, 2018 19 145.29 Changes in Compulsorily Convertible Preference Shares during the year (145.29)
Balance as at March 31, 2019 19 -
C. Other EquityReserves and
SurplusRetained Earnings
Balance as at April 01, 2017 3,290.17 Profit for the year 1,939.69
Other Comprehensive Income (0.58)
Total Comprehensive Income for the year 1,939.11
Transactions with owners in their capacity as owners:Dividends Paid (including Dividend Distribution Tax) (401.77)
Balance as at March 31, 2018 4,827.51
Profit for the year 2,151.76
Other Comprehensive Income (20.92)
Total Comprehensive Income for the year 2,130.84
Transactions with owners in their capacity as owners:Dividends Paid (including Dividend Distribution Tax) (603.03)
Balance as at March 31, 2019 6,355.32
The accompanying notes are an integral part of the standalone financial statements.
As per our report of even date attachedFor Price Waterhouse & Co Chartered Accountants LLP For and on behalf of the BoardChartered Accountants Firm Registration No.: 304026E/ E-300009
Priyanshu Gundana Nahoosh Jariwala Mahesh BabaniPartner Managing Director Managing DirectorMembership No. 109553 DIN: 00012412 DIN: 00051162
Rajen N. Jhaveri Chief Financial Officer & Company Secretary
Place : Mumbai Place : MumbaiDate : May 09, 2019 Date : May 09, 2019
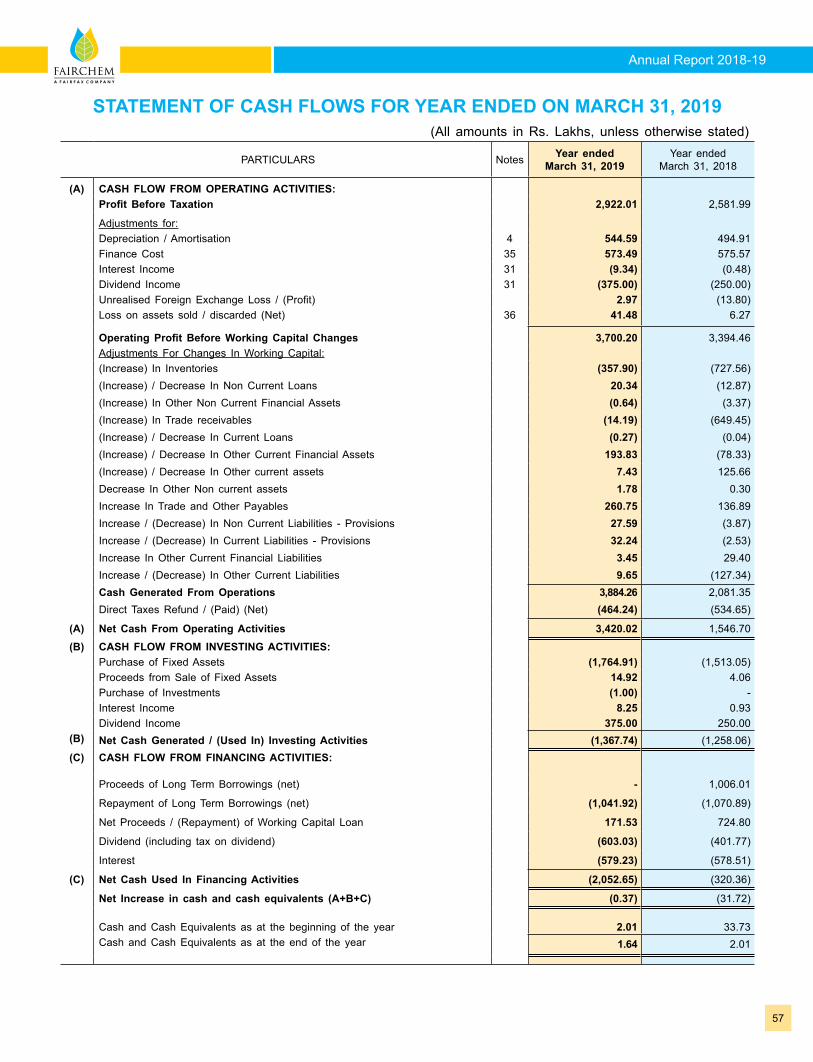
Annual Report 2018-19
57
STATEMENT OF CASH FLOWS FOR YEAR ENDED ON MARCH 31, 2019(All amounts in Rs. Lakhs, unless otherwise stated)
PARTICULARS Notes Year ended March 31, 2019
Year ended March 31, 2018
(A) CASH FLOW FROM OPERATING ACTIVITIES:Profit Before Taxation 2,922.01 2,581.99
Adjustments for:Depreciation / Amortisation 4 544.59 494.91 Finance Cost 35 573.49 575.57 Interest Income 31 (9.34) (0.48)Dividend Income 31 (375.00) (250.00)Unrealised Foreign Exchange Loss / (Profit) 2.97 (13.80)Loss on assets sold / discarded (Net) 36 41.48 6.27
Operating Profit Before Working Capital Changes 3,700.20 3,394.46 Adjustments For Changes In Working Capital:(Increase) In Inventories (357.90) (727.56)(Increase) / Decrease In Non Current Loans 20.34 (12.87)(Increase) In Other Non Current Financial Assets (0.64) (3.37)(Increase) In Trade receivables (14.19) (649.45)(Increase) / Decrease In Current Loans (0.27) (0.04)(Increase) / Decrease In Other Current Financial Assets 193.83 (78.33)(Increase) / Decrease In Other current assets 7.43 125.66 Decrease In Other Non current assets 1.78 0.30 Increase In Trade and Other Payables 260.75 136.89 Increase / (Decrease) In Non Current Liabilities - Provisions 27.59 (3.87)Increase / (Decrease) In Current Liabilities - Provisions 32.24 (2.53)Increase In Other Current Financial Liabilities 3.45 29.40 Increase / (Decrease) In Other Current Liabilities 9.65 (127.34)Cash Generated From Operations 3,884.26 2,081.35 Direct Taxes Refund / (Paid) (Net) (464.24) (534.65)
(A) Net Cash From Operating Activities 3,420.02 1,546.70
(B) CASH FLOW FROM INVESTING ACTIVITIES:
(B)
Purchase of Fixed Assets (1,764.91) (1,513.05)Proceeds from Sale of Fixed Assets 14.92 4.06 Purchase of Investments (1.00) - Interest Income 8.25 0.93 Dividend Income 375.00 250.00 Net Cash Generated / (Used In) Investing Activities (1,367.74) (1,258.06)
(C) CASH FLOW FROM FINANCING ACTIVITIES:
Proceeds of Long Term Borrowings (net) - 1,006.01
Repayment of Long Term Borrowings (net) (1,041.92) (1,070.89)
Net Proceeds / (Repayment) of Working Capital Loan 171.53 724.80
Dividend (including tax on dividend) (603.03) (401.77)
Interest (579.23) (578.51)
(C) Net Cash Used In Financing Activities (2,052.65) (320.36)
Net Increase in cash and cash equivalents (A+B+C) (0.37) (31.72)
Cash and Cash Equivalents as at the beginning of the year 2.01 33.73 Cash and Cash Equivalents as at the end of the year 1.64 2.01
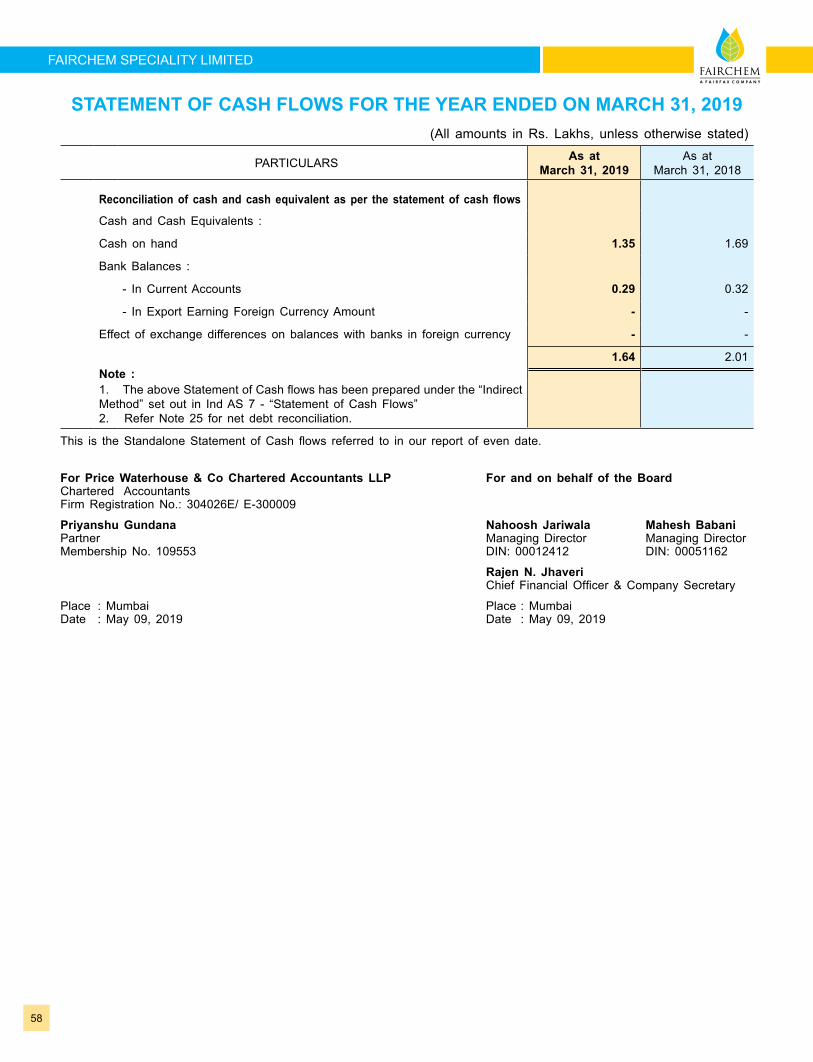
58
FAIRCHEM SPECIALITY LIMITED
(All amounts in Rs. Lakhs, unless otherwise stated)
PARTICULARS As at March 31, 2019
As at March 31, 2018
Reconciliation of cash and cash equivalent as per the statement of cash flows
Cash and Cash Equivalents :
Cash on hand 1.35 1.69
Bank Balances :
- In Current Accounts 0.29 0.32
- In Export Earning Foreign Currency Amount - -
Effect of exchange differences on balances with banks in foreign currency - -
1.64 2.01 Note :1. The above Statement of Cash flows has been prepared under the “Indirect Method” set out in Ind AS 7 - “Statement of Cash Flows”2. Refer Note 25 for net debt reconciliation.
This is the Standalone Statement of Cash flows referred to in our report of even date.
For Price Waterhouse & Co Chartered Accountants LLP For and on behalf of the BoardChartered Accountants Firm Registration No.: 304026E/ E-300009
Priyanshu Gundana Nahoosh Jariwala Mahesh BabaniPartner Managing Director Managing DirectorMembership No. 109553 DIN: 00012412 DIN: 00051162
Rajen N. Jhaveri Chief Financial Officer & Company Secretary
Place : Mumbai Place : MumbaiDate : May 09, 2019 Date : May 09, 2019
STATEMENT OF CASH FLOWS FOR THE YEAR ENDED ON MARCH 31, 2019
Annual Report 2018-19
59
NOTES TO THE STANDALONE FINANCIAL STATEMENTS1 Background of the Company Fairchem Speciality Limited (Formerly known as Adi Finechem Limited) (the “Company”) was incorporated in
May, 1985 as “H. K. Agro Oil Ltd.” under the provisions of the Companies Act, 1956. The Company is engaged in manufacturing of Speciality Oleo Chemicals. The manufacturing facility is set up at Village Chekhala, Ta. Sanand, Dist. Ahmedabad, Gujarat. The equity shares of the Company are listed on BSE Limited and National Stock Exchange of India Ltd.
2 Significant accounting policies This Note provides a list of the significant accounting policies adopted by the Company in the preparation of
these financial statements. These policies have been consistently applied to all the years presented, unless otherwise stated.
a) Basis of preparation
i) Compliance with Ind AS These financial statements comply in all material aspects with Indian Accounting Standards (Ind AS)
notified under Section 133 of the Companies Act, 2013 (the ‘Act’) [Companies (Indian Accounting Standards) Rules, 2015] and other relevant provisions of the Act.
ii) New standards or interpretations adopted by the Company
a) The Company has applied the following amendment for the first time for its annual reporting period commencing April 1, 2018:
Ind AS 115 – Revenue from Contracts from Customers
Ind AS 21 – The effect of changes in Foreign Exchange rates
b) New standards or interpretations issued but not yet effective
The Company will apply the following standard for the first time for its annual reporting period commencing 1st April, 2019:
Ind AS 116 replaces Ind AS 17 ‘Leases’ and will primarily change lease accounting for lessees; lessor accounting under Ind AS 116 is expected to be similar to lease accounting under Ind AS 17. Lessee accounting under Ind AS 116 will be similar in many respects to existing Ind AS 17 accounting for finance leases, but is expected to be substantively different to existing accounting for operating leases. Where a contract meets Ind AS 116’s definition of a lease, lease agreements will give rise to the recognition of a non-current asset representing the right to use the leased item, and a loan obligation for future lease payables.
Lease costs will be recognised in the form of depreciation of the right to use asset and interest on the lease liability, which may impact the phasing of operating profit and profit before tax, compared to existing cost profiles and presentation in the income statement, and will also impact the classification of associated cash flows.
The Company has operating lease arrangement in the form of leasehold land. The Company is in the process of evaluating the impact of adoption of Ind AS 116 on its financial statements and will accordingly consider the same from period beginning April 1, 2019.
iii) Historical cost convention The Financial Statements have been prepared on a historical cost basis, except for the following: • Certain financial assets and liabilities that are measured at fair value ; and • Defined benefit plans - plan assets measured at fair value.
iv) Current versus non-current classification The company presents assets and liabilities in the balance sheet based on current/non-current
60
FAIRCHEM SPECIALITY LIMITED
classification. An asset is treated as current when it is: • Expected to be realised or intended to be sold or consumed in normal operating cycle, or • Held primarily for the purpose of trading, or • Expected to be realised within twelve months after the reporting period, or • Cash or cash equivalent unless restricted from being exchanged or used to settle a liability
for at least twelve months after the reporting period, all other assets are classified as non-current.
A liability is current when: • It is expected to be settled in normal operating cycle, or • It is held primarily for the purpose of trading, or • It is due to be settled within twelve months after the reporting period, or • There is no unconditional right to defer the settlement of the liability for at least twelve months
after the reporting period, all other liabilities are classified as non-current.
b) Foreign currency transactions and translations
(i) Functional and presentation currency Items included in the financial statements are measured using the currency of the primary economic
environment in which the entity operates (“the functional currency”). The financial statements are presented in Indian rupee (INR), which is Fairchem Speciality Limited’s functional and presentation currency.
(ii) Transactions and balances Foreign currency transactions are translated into the functional currency using exchange rates at the
date of the transaction. Foreign exchange gains and losses from settlement of these transactions and from translation of monetary assets and liabilities at the reporting date are recognised in the Statement of Profit and Loss.
Foreign exchange differences regarded as an adjustment to borrowing costs are presented in the statement of profit and loss, within finance costs. All other foreign exchange gains and losses are presented in the statement of profit and loss on a net basis within other incomes/expenses.
c) Revenue recognition
Sale of products Revenue is recognised at the point in time when the performance obligation is satisfied and control of the goods
is transferred to the customer upon dispatch or delivery, in accordance with the terms of customer contracts. Revenue is recognised at an amount that the Company expects to receive from customers that is net of trade discounts, rebates and goods and service tax (GST). The Company do not have any contracts where the transfer of the promised goods to customer and payment by the customer exceeds one year. As a consequence, the Company does not adjust any of the transaction price for the time value of money.
A contract liability is the obligation to transfer goods to the customer for which the Company has received consideration from the customer. Contract liabilities are recognised as revenue when the Company performs under the contract.
Export benefit entitlements under Duty Drawback and Merchandise Exports from India Scheme (MEIS) are recognised when the right to receive credit as per the terms of the scheme is established in respect of the exports and there is no uncertainty in receiving the same.
d) Income tax The income tax expense or credit for the period is the tax on the current period’s taxable income based
on the applicable income tax rate adjusted by changes in deferred tax assets and liabilities attributable to temporary differences and to unused tax losses.
NOTES TO THE STANDALONE FINANCIAL STATEMENTS
Annual Report 2018-19
61
The current income tax charge is calculated on the basis of the tax laws enacted or substantively enacted at the end of the reporting period in India. Management periodically evaluates positions taken in tax returns with respect to situations in which applicable tax regulation is subject to interpretation. It establishes provisions where appropriate on the basis of amounts expected to be paid to the tax authorities.
Deferred income tax is provided in full, using the liability method, on temporary differences arising between the tax bases of assets and liabilities and their carrying amounts in the financial statements.
Deferred tax assets are recognised for all deductible temporary differences and unused tax losses only if it is probable that future taxable amounts will be available to utilize those temporary differences and losses.
Deferred tax assets and liabilities are offset when there is a legally enforceable right to offset deferred tax assets and liabilities and when the deferred tax balances relate to the same taxation authority. Current tax assets and tax liabilities are offset where the entity has a legally enforceable right to offset and intends either to settle on a net basis, or to realize the asset and settle the liability simultaneously.
Deferred income tax is determined using tax rates (and laws) that have been enacted or substantially enacted by the end of the reporting period and are expected to apply when the related deferred income tax asset is realised or the deferred income tax liability is settled.
Current and deferred tax is recognised in profit or loss, except to the extent that it relates to items recognised in other comprehensive income or directly in equity in which case, the tax is recognised in other comprehensive income or directly in equity, respectively.
e) Investments in Subsidiary Investments in subsidiary company is carried at cost less accumulated impairment losses, if any. Where
an indication of impairment exists, the carrying amount of the investment is assessed and written down immediately to its recoverable amount. On disposal of investment in subsidiary company, the difference between net disposal proceeds and the carrying amounts are recognised in the Statement of Profit and Loss.
f) Leases
As Lessee
Leases of property, plant and equipment where the company, as lessee, has substantially all the risks and rewards of ownership are classified as finance leases. Finance leases are capitalised at the lease’s inception at the fair value of the leased asset or, if lower, the present value of the minimum lease payments. The corresponding rental obligations, net of finance charges, are included in borrowings or other financial liabilities as appropriate. Each lease payment is allocated between the liability and finance cost. The finance cost is charged to the profit or loss over the lease period so as to produce a constant periodic rate of interest on the remaining balance of the liability for each period.
Leases in which a significant portion of the risks and rewards of ownership are not transferred to the Company as lessee are classified as operating leases. Payments made under operating leases (net of any incentives received from the lessor) are charged to profit or loss on a straight-line basis over the period of the lease unless the payments are structured to increase in line with expected general inflation to compensate for the lessor’s expected inflationary cost increases.
g) Impairment of assets Assets are tested for impairment whenever events or changes in circumstances indicate that the carrying
amount may not be recoverable. An impairment loss is recognised for the amount by which the asset’s carrying amount exceeds its recoverable amount. The recoverable amount is the higher of an asset’s fair value less cost of disposal and value in use. For the purposes of assessing impairment, assets are grouped at the lowest levels for which there are separately identifiable cash inflows which are largely independent of the cash inflows from other assets or groups of assets (cash-generating units). Assets are reviewed for possible reversal of the impairment at the end of each reporting period.
NOTES TO THE STANDALONE FINANCIAL STATEMENTS
62
FAIRCHEM SPECIALITY LIMITED
NOTES TO THE STANDALONE FINANCIAL STATEMENTS When there is indication that an impairment loss recognised for an asset in earlier accounting periods no
longer exists or may have decreased, such reversal of impairment loss is recognised in the statement of profit and loss, to the extent the amount was previously charged to the statement of profit and loss.
h) Cash and cash equivalents For the purpose of presentation in the statement of cash flows, cash and cash equivalents includes cash
on hand, deposits held at call with financial institutions, other short-term, highly liquid investments with original maturities of three months or less that are readily convertible to known amounts of cash and which are subject to an insignificant risk of changes in value.
i) Trade receivables Trade receivables are recognised initially at fair value and subsequently measured at amortised cost using
the effective interest rate (EIR) method, less provision for impairment, if any.
j) Inventories Raw materials, packing material, stores and fuel, work in progress and finished goods are stated at the
lower of cost and net realisable value. The cost of raw materials, packing materials, stores and fuel are determined based on first-in, first-out (FIFO) method and comprises cost of purchase. The cost of semi-finished goods comprises raw materials, direct labour, and appropriate proportion of variable and fixed overhead expenditure, the latter being allocated on the basis of normal operating capacity. Cost of inventories also include all other costs incurred in bringing the inventories to their present location and condition.
Net realisable value is the estimated selling price in the ordinary course of business less the estimated costs of completion and the estimated costs necessary to make the sale .
k) Financial assets and liabilities
(i) Financial assets
1. Classification The Company classifies its financial assets in the following measurement categories:
• at fair value (either through other comprehensive income, or through profit or loss), and
• at amortised cost.
The classification depends on the entity’s business model for managing the financial assets and the contractual terms of the cash flows. For assets measured at fair value, gains and losses will either be recorded in profit or loss or other comprehensive income. For investments in debt instruments, this will depend on the business model in which the investment is held. For investments in equity instruments, this will depend on whether the Company has made an irrevocable selection at the time of initial recognition to account for the equity investment at fair value through other comprehensive income. The Company reclassifies debt investments when and only when its business model for managing those assets changes.
2. Initial Recognition and Measurement At initial recognition, the Company measures a financial asset at its fair value plus, in the case
of a financial asset not at fair value through profit or loss, transaction costs that are directly attributable to the acquisition of the financial asset. Transaction costs of financial assets carried at fair value through profit or loss are expensed in statement of profit or loss.
3. Subsequent Measurement Measured at amortised cost: Financial assets that are held within a business model whose
objective is to hold financial assets in order to collect contractual cash flows that are solely payments of principal and interest, are subsequently measured at amortised cost using the EIR method less impairment, if any. The amortisation of EIR and loss or gains arising from impairment, if any, is recognised in the Statement of Profit and Loss.
Annual Report 2018-19
63
NOTES TO THE STANDALONE FINANCIAL STATEMENTS Measured at fair value through other comprehensive income (FVOCI): Financial assets
that are held within a business model whose objective is, selling financial assets and collecting contractual cash flows that are solely payments of principal and interest, are subsequently measured at fair value through other comprehensive income. Fair value movements are recognised in the other comprehensive income (OCI). Interest income measured using the EIR method and impairment losses, if any are recognised in the Statement of Profit and Loss. On derecognition, cumulative gain or loss previously recognised in OCI is reclassified from the equity to “Profit or Loss” in the Statement of Profit and Loss.
Measured at fair value through profit or loss (FVPL): A financial asset not classified as either amortised cost or FVOCI, is classified as FVTPL. Such financial assets are measured at fair value with all changes in fair value, including interest income and dividend income if any, recognised as ‘other income’ in the Statement of Profit and Loss.
Equity instruments The company subsequently measures all equity investments at fair value. Where the company’s
management has elected to present fair value gains and losses on equity investments in other comprehensive income, there is no subsequent reclassification of fair value gains and losses to profit or loss. Dividends from such investments are recognised in profit or loss as other income when the company’s right to receive payments is established.
Impairment losses (and reversal of impairment losses) on equity investments measured at Fair Value through Other Comprehensive Income (FVOCI) are not reported separately from other changes in fair value.
4. Impairment of financial assets The Company is required to assess on a forward looking basis the expected credit losses
associated with its assets carried at amortised cost and FVOCI debt instruments. The impairment methodology applied depends on whether there has been a significant increase in credit risk. Note 42 details how the Company determines whether there has been a significant increase in credit risk. For trade receivables only, the Company applies the simplified approach permitted by Ind AS 109 Financial Instruments, which requires expected lifetime losses to be recognised from initial recognition of the receivables.
5. Derecognition A financial asset is de-recognised only when the Company
• has transferred the rights to receive cash flows from the financial asset or,
• retains the contractual rights to receive the cash flows of the financial asset, but assumes a contractual obligation to pay the cash flows to one or more recipients.
6. Income recognition Interest income from debt instruments is recognised using the EIR method. The effective interest
rate is the rate that exactly discounts estimated future cash receipts through the expected life of the financial asset to the gross carrying amount of a financial asset.
Dividends are recognised in profit or loss only when the right to receive payment is established, it is probable that the economic benefits associated with the dividend will flow to the Company and the amount of the dividend can be measured reliably.
(ii) Financial liabilities: 1. Initial Recognition and Measurement Financial liabilities are recognised when the Company becomes a party to the contractual
provisions of the instrument. Financial liabilities are initially measured at its fair value plus or minus, in the case of a financial liability not at fair value through profit or loss, transaction costs that are directly attributable to the issue of the financial liability.
64
FAIRCHEM SPECIALITY LIMITED
NOTES TO THE STANDALONE FINANCIAL STATEMENTS 2. Subsequent Measurement Financial liabilities are subsequently measured at amortised cost using the EIR method.
Financial liabilities carried at fair value through profit or loss are measured at fair value with all changes in fair value recognised in the Statement of Profit and Loss.
3. Derecognition A financial liability is derecognised when the obligation specified in the contract is discharged,
cancelled or expires.
l) Offsetting financial instruments Financial assets and liabilities are offset and the net amount is reported in the balance sheet where there
is a legally enforceable right to offset the recognised amounts and there is an intention to settle on a net basis or realize the asset and settle the liability simultaneously. The legally enforceable right must not be contingent on future events and must be enforceable in the normal course of business and in the event of default, insolvency or bankruptcy of the Company or the counterparty.
m) Property, plant and equipment Freehold land is carried at historical cost. All other items of property, plant and equipment are stated at
historical cost less depreciation. Historical cost includes expenditure that is directly attributable to the acquisition of the items.
Subsequent costs are included in the asset’s carrying amount or recognised as a separate asset, as appropriate, only when it is probable that future economic benefits associated with the item will flow to the company and the cost of the item can be measured reliably. An item of property, plants and equipment is derecognised upon disposal or when no future economic benefits are expected to arise from the continued use of the asset. All other repairs and maintenance are charged to profit or loss during the reporting period in which they are incurred.
Gains and losses on disposals are determined by comparing proceeds with carrying amounts. These are included in profit or loss within other income/expense.
(ii) Depreciation methods, estimated useful lives and residual value Depreciation is provided on a pro-rata basis on the straight-line method over the estimated useful life
as per technical evaluation. Estimated useful life of the assets/significant component thereof are as under:
Assets class Useful life in years
• Buildings 10 to 30
• Plant and Equipment 10 to 25
• Electrical Installations 10
• Office Equipments and Computers 3 to 5
• Furniture and Fixtures 10
• Vehicles 6 to 8
Depreciation methods and useful lives are reviewed at each financial year end and adjusted if appropriate.
Amortisation of leased assets are over the Lease period.
n) Trade and other payables These amounts represent liabilities for goods and services provided to the company prior to the end
of financial year which are unpaid. Trade and other payables are presented as current liabilities unless
Annual Report 2018-19
65
payment is not due within 12 months after the reporting period. They are recognised initially at their fair value and subsequently measured at amortised cost using the EIR method.
o) Borrowings Borrowings are initially recognised at fair value, net of transaction costs incurred. Borrowings are
subsequently measured at amortised cost. Any difference between the proceeds (net of transaction costs) and the redemption amount is recognised in profit or loss over the period of the borrowings using the EIR method. Fees paid on the establishment of loan facilities are recognised as transaction costs of the loan to the extent that it is probable that some or all of the facility will be drawn down. In this case, the fee is deferred until the draw down occurs. To the extent there is no evidence that it is probable that some or all of the facility will be drawn down, the fee is capitalised as a prepayment for liquidity services and amortised over the period of the facility to which it relates.
Borrowings are removed from the balance sheet when the obligation specified in the contract is discharged, cancelled or expired. The difference between the carrying amount of a financial liability that has been extinguished or transferred to another party and the consideration paid, including any non-cash assets transferred or liabilities assumed, is recognised in profit or loss as other income/expenses.
p) Borrowings costs General and specific borrowing costs that are directly attributable to the acquisition, construction or
production of a qualifying asset are capitalised during the period of time that is required to complete and prepare the asset for its intended use or sale. Qualifying assets are assets that necessarily take a substantial period of time to get ready for their intended use or sale.
Investment income earned on the temporary investment of specific borrowings pending their expenditure on qualifying assets is deducted from the borrowing costs eligible for capitalisation.
Other borrowing costs are expensed in the period in which they are incurred.
q) Provisions and Contingencies Provisions are recognised when there is a present obligation (legal or constructive) as a result of a past
event, it is probable that an outflow of resources embodying economic benefits will be required to settle the obligation and there is a reliable estimate of the amount of the obligation. When a provision is measured using the cash flows estimated to settle the present obligation, its carrying amount is the present value of those cash flows (when the effect of the time value of money is material). The discount rate used to determine the present value is a pre-tax rate that reflects current market assessments of the time value of money and the risks specific to the liability. The increase in the provision due to the passage of time is recognised as interest expense.
Contingent liabilities are disclosed when there is a possible obligation arising from past events, the existence of which will be confirmed only by the occurrence or non occurrence of one or more uncertain future events not wholly within the control of the Company or a present obligation that arises from past events where it is either not probable that an outflow of resources will be required to settle the obligation or a reliable estimate of the amount cannot be made.
r) Employee Benefits
(i) Defined contribution plans Company’s contribution to Provident fund and other funds are determined under the relevant schemes
and/or statute and charged to revenue. The Company contributes to a Government administered Provident Fund and has no further obligation beyond making its contribution.
The Company makes contributions to state plans namely Employee’s State Insurance Fund and Employee’s Pension Scheme 1995 and has no further obligation beyond making the payment to them. The Company’s contributions to the above funds are charged to Statement of Profit and Loss every year.
NOTES TO THE STANDALONE FINANCIAL STATEMENTS
66
FAIRCHEM SPECIALITY LIMITED
NOTES TO THE STANDALONE FINANCIAL STATEMENTS (ii) Defined benefit plans
The Company provides for gratuity, a defined benefit plan (the “Gratuity Plan”) covering eligible employees, which is funded. The Gratuity Plan provides a lump sum payment to vested employees at retirement, death, incapacitation or termination of employment, of an amount based on the respective employee’s salary and the tenure of employment. The Company’s liability is actuarially determined using the Projected Unit Credit method at the end of each year. Remeasurement gains and losses arising from experience adjustments and changes in actuarial assumptions are recognised in the period in which they occur, directly in other comprehensive income. They are included in retained earnings in the statement of changes in equity and in the balance sheet
Gratuity Fund contributions are made to a trust administered by the Company which has further invested in Life Insurance Corporation. The contributions made to the trust are recognised as plan assets. The defined benefit obligation recognised in the balance sheet represents the present value of the defined benefit obligation as reduced by the fair value of plan assets.
(iii) Other employee benefits Compensated Absences: Accumulated compensated absences, which are expected to be availed or
encashed within 12 months from the end of the year end are treated as short term employee benefits. The obligation towards the same is measured at the expected cost of accumulating compensated absences as the additional amount expected to be paid as a result of the unused entitlement as at the year end.
Accumulated compensated absences, which are expected to be availed or encashed beyond 12 months from the end of the year end are treated as other long term employee benefits. The Company’s liability is actuarially determined (using the Projected Unit Credit method) at the end of each year. Actuarial losses/ gains are recognised in the Statement of Profit and Loss in the year in which they arise.
Termination Benefits: Termination benefits in the nature of voluntary retirement benefits are recognised in the Statement of Profit and Loss as and when incurred.
s) Segment reporting Operating segments are reported in a manner consistent with the internal reporting provided to the
Managing Directors who are identified as the chief operating decision makers. The managing directors assess the financial performance and position of the company, and make strategic decisions. Refer note 48 for segment information presented.
t) Earnings per share
i) Basic earnings per share
Basic earnings per share is calculated by dividing:
• the profit attributable to owners of the company
• by the weighted average number of equity shares outstanding during the financial year, adjusted for bonus elements in equity shares issued during the year and excluding treasury shares.
(ii) Diluted earnings per share
Diluted earnings per share adjusts the figures used in the determination of basic earnings per share to take into account:
• the after income tax effect of interest and other financing costs associated with dilutive potential equity shares, and
• the weighted average number of additional equity shares that would have been outstanding assuming the conversion of all dilutive potential equity shares.
Annual Report 2018-19
67
u) Rounding off
All amounts disclosed in the financial statements and notes have been rounded off to the nearest lakhs, or decimal thereof as per the requirement of Schedule III, unless otherwise stated.
3 Critical estimates and judgements The preparation of financial statements requires the use of accounting estimates which, by definition, will
seldom equal the actual results. Management also needs to exercise judgement in applying the company’s accounting policies.
The areas involving critical estimates or judgements are: • Estimation of defined benefit obligation – Note 29 • Impairment of trade receivables – Note 42 • Estimation of useful life of tangible assets – Note 4 Estimates and judgements are continually evaluated. They are based on historical experience and other factors,
including expectations of future events that may have a financial impact on the company.
NOTES TO THE STANDALONE FINANCIAL STATEMENTS
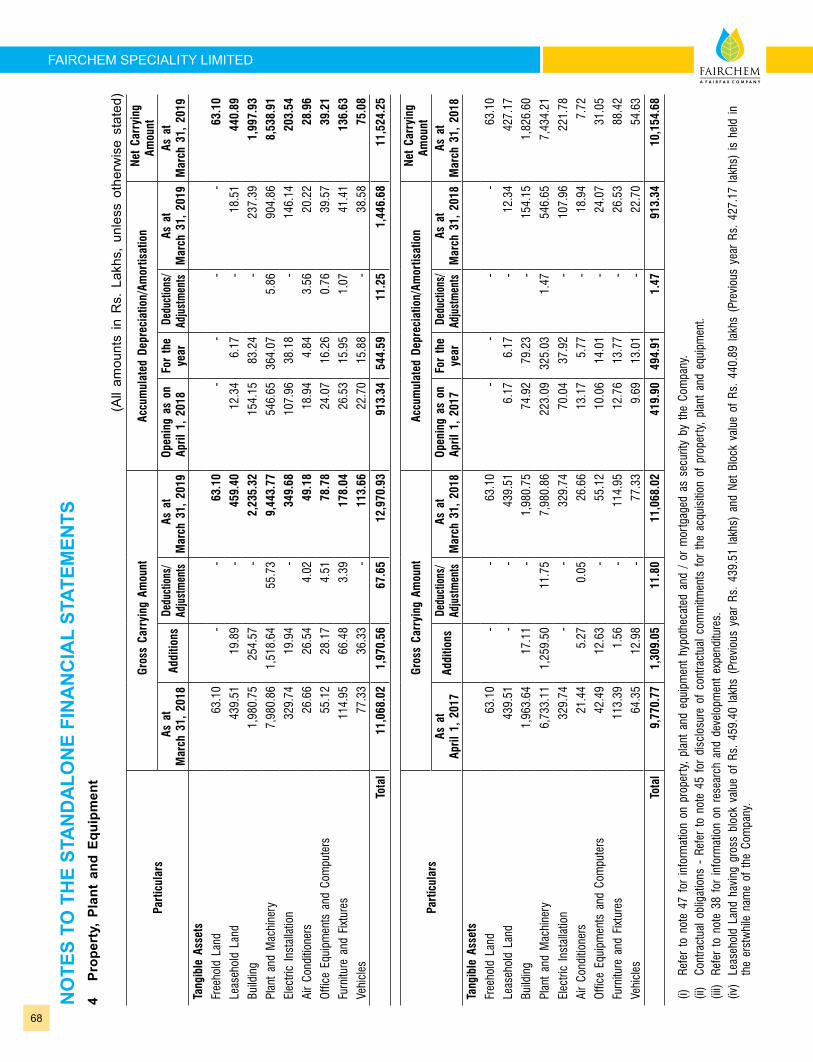
68
FAIRCHEM SPECIALITY LIMITEDN
OTE
S TO
TH
E ST
AN
DA
LON
E FI
NA
NC
IAL
STAT
EMEN
TS4
Prop
erty
, Pl
ant
and
Equi
pmen
t
(All
amou
nts
in R
s. L
akhs
, un
less
oth
erw
ise
stat
ed)
Part
icul
ars
Gro
ss C
arry
ing
Amou
ntAc
cum
ulat
ed D
epre
ciat
ion/
Amor
tisat
ion
Net
Car
ryin
g Am
ount
As
at
Mar
ch 3
1, 2
018
Add
ition
s De
duct
ions
/ Ad
just
men
ts A
s at
M
arch
31,
201
9 O
peni
ng a
s on
Ap
ril 1
, 20
18Fo
r th
e ye
ar
Ded
uctio
ns/
Adju
stm
ents
As
at
M
arch
31,
201
9As
at
Mar
ch 3
1, 2
019
Tang
ible
Ass
ets
Free
hold
Lan
d 6
3.10
-
-
6
3.10
-
-
-
-
6
3.10
Leas
ehol
d La
nd 4
39.5
1 1
9.89
-
4
59.4
0 1
2.34
6
.17
-
18.
51
440
.89
Build
ing
1,9
80.7
5 2
54.5
7 -
2
,235
.32
154
.15
83.
24
-
237
.39
1,9
97.9
3
Plan
t an
d M
achi
nery
7,9
80.8
6 1
,518
.64
55.
73
9,4
43.7
7 5
46.6
5 3
64.0
7 5
.86
904
.86
8,5
38.9
1
Elec
tric
Inst
alla
tion
329
.74
19.
94
-
349
.68
107
.96
38.
18
-
146
.14
203
.54
Air
Cond
ition
ers
26.
66
26.
54
4.0
2 4
9.18
1
8.94
4
.84
3.5
6 2
0.22
2
8.96
Offic
e Eq
uipm
ents
and
Com
pute
rs 5
5.12
2
8.17
4
.51
78.
78
24.
07
16.
26
0.7
6 3
9.57
3
9.21
Furn
iture
and
Fix
ture
s 1
14.9
5 6
6.48
3
.39
178
.04
26.
53
15.
95
1.0
7 4
1.41
1
36.6
3
Vehi
cles
77.
33
36.
33
-
113
.66
22.
70
15.
88
-
38.
58
75.
08
Tota
l 1
1,06
8.02
1
,970
.56
67.
65
12,
970.
93
913
.34
544.
59
11.
25
1,4
46.6
8 1
1,52
4.25
Part
icul
ars
Gro
ss C
arry
ing
Amou
ntAc
cum
ulat
ed D
epre
ciat
ion/
Amor
tisat
ion
Net
Car
ryin
g Am
ount
As a
t
April
1,
2017
Ad
ditio
ns
Dedu
ctio
ns/
Adju
stm
ents
A
s at
M
arch
31,
201
8 O
peni
ng a
s on
Ap
ril 1
, 20
17
For
the
year
D
educ
tions
/Ad
just
men
ts
As a
t
Mar
ch 3
1, 2
018
As a
t
Mar
ch 3
1, 2
018
Tang
ible
Ass
ets
Free
hold
Lan
d 6
3.10
-
-
6
3.10
-
-
-
-
6
3.10
Leas
ehol
d La
nd 4
39.5
1 -
-
4
39.5
1 6
.17
6.1
7 -
1
2.34
4
27.1
7
Build
ing
1,9
63.6
4 1
7.11
-
1
,980
.75
74.
92
79.
23
-
154
.15
1,8
26.6
0
Plan
t an
d M
achi
nery
6,7
33.1
1 1
,259
.50
11.
75
7,9
80.8
6 2
23.0
9 3
25.0
3 1
.47
546
.65
7,4
34.2
1
Elec
tric
Inst
alla
tion
329
.74
-
-
329
.74
70.
04
37.
92
-
107
.96
221
.78
Air
Cond
ition
ers
21.
44
5.2
7 0
.05
26.
66
13.
17
5.7
7 -
1
8.94
7
.72
Offic
e Eq
uipm
ents
and
Com
pute
rs 4
2.49
1
2.63
-
5
5.12
1
0.06
1
4.01
-
2
4.07
3
1.05
Furn
iture
and
Fix
ture
s 1
13.3
9 1
.56
-
114
.95
12.
76
13.
77
-
26.
53
88.
42
Vehi
cles
64.
35
12.
98
-
77.
33
9.6
9 1
3.01
-
2
2.70
5
4.63
Tota
l 9
,770
.77
1,30
9.05
1
1.80
1
1,06
8.02
4
19.9
0 49
4.91
1
.47
913
.34
10,
154.
68
(i)
Refe
r to
not
e 47
for
info
rmat
ion
on p
rope
rty,
pla
nt a
nd e
quip
men
t hy
poth
ecat
ed a
nd /
or
mor
tgag
ed a
s se
curit
y by
the
Com
pany
.(ii
) Co
ntra
ctua
l obl
igat
ions
- R
efer
to
note
45
for
disc
losu
re o
f co
ntra
ctua
l com
mitm
ents
for
the
acq
uisi
tion
of p
rope
rty,
pla
nt a
nd e
quip
men
t.(ii
i) Re
fer
to n
ote
38 f
or in
form
atio
n on
res
earc
h an
d de
velo
pmen
t ex
pend
iture
s.(iv
) Le
aseh
old
Land
hav
ing
gros
s bl
ock
valu
e of
Rs.
459
.40
lakh
s (P
revi
ous
year
Rs.
439
.51
lakh
s) a
nd N
et B
lock
val
ue o
f Rs
. 44
0.89
lakh
s (P
revi
ous
year
Rs.
427
.17
lakh
s) is
hel
d in
th
e er
stw
hile
nam
e of
the
Com
pany
.
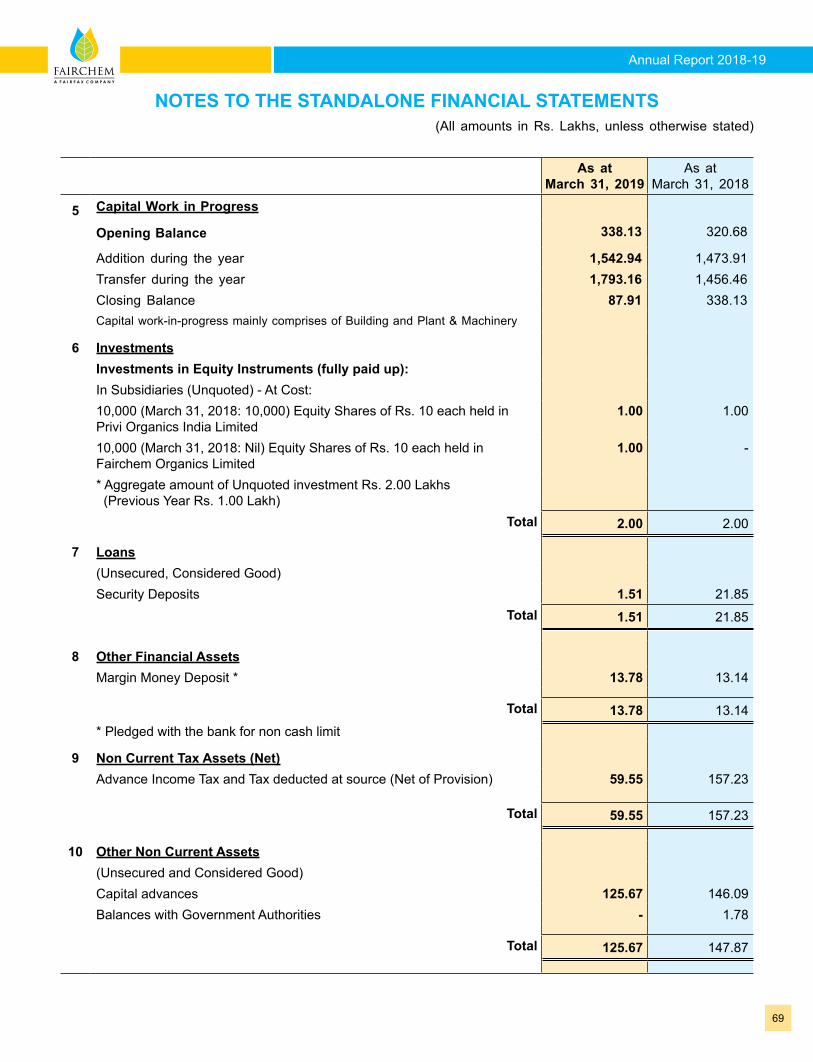
Annual Report 2018-19
69
As at March 31, 2019
As at March 31, 2018
5 Capital Work in Progress
Opening Balance 338.13 320.68
Addition during the year 1,542.94 1,473.91 Transfer during the year 1,793.16 1,456.46 Closing Balance 87.91 338.13 Capital work-in-progress mainly comprises of Building and Plant & Machinery
6 InvestmentsInvestments in Equity Instruments (fully paid up):In Subsidiaries (Unquoted) - At Cost:10,000 (March 31, 2018: 10,000) Equity Shares of Rs. 10 each held in Privi Organics India Limited
1.00 1.00
10,000 (March 31, 2018: Nil) Equity Shares of Rs. 10 each held in Fairchem Organics Limited
1.00 -
* Aggregate amount of Unquoted investment Rs. 2.00 Lakhs (Previous Year Rs. 1.00 Lakh)
Total 2.00 2.00
7 Loans(Unsecured, Considered Good)Security Deposits 1.51 21.85
Total 1.51 21.85
8 Other Financial AssetsMargin Money Deposit * 13.78 13.14
Total 13.78 13.14 * Pledged with the bank for non cash limit
9 Non Current Tax Assets (Net)Advance Income Tax and Tax deducted at source (Net of Provision) 59.55 157.23
Total 59.55 157.23
10 Other Non Current Assets(Unsecured and Considered Good)Capital advances 125.67 146.09 Balances with Government Authorities - 1.78
Total 125.67 147.87
NOTES TO THE STANDALONE FINANCIAL STATEMENTS(All amounts in Rs. Lakhs, unless otherwise stated)
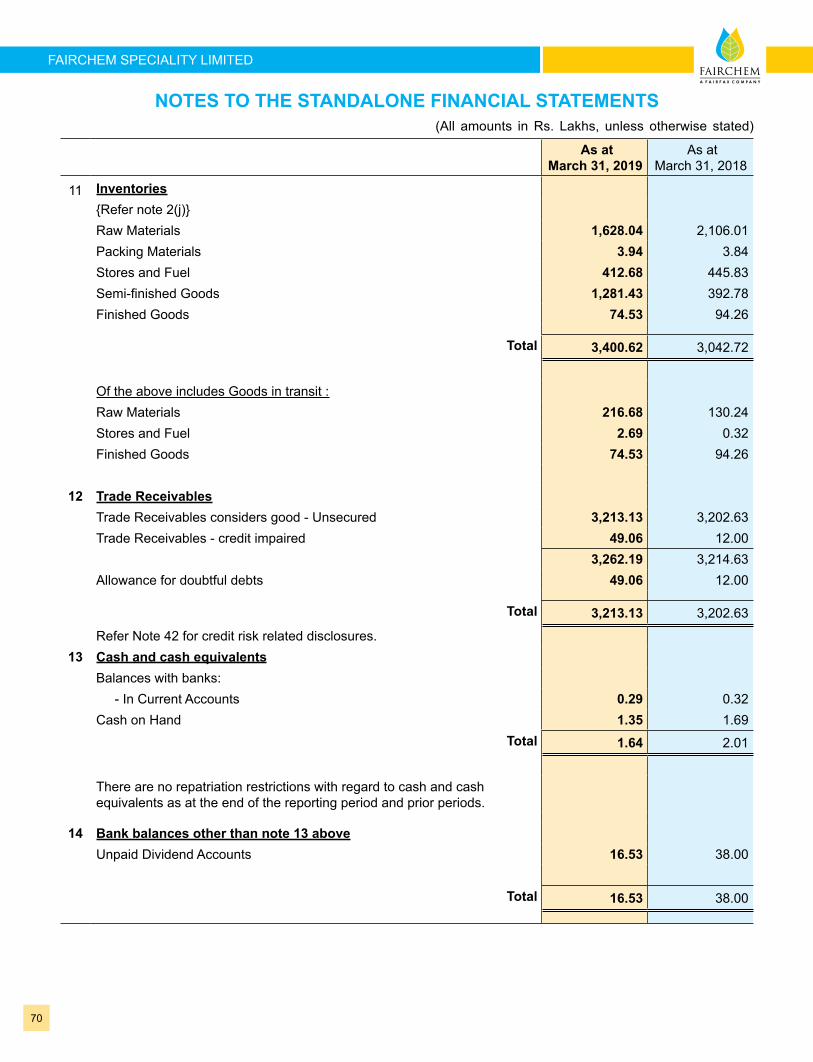
70
FAIRCHEM SPECIALITY LIMITED
NOTES TO THE STANDALONE FINANCIAL STATEMENTS(All amounts in Rs. Lakhs, unless otherwise stated)
As at March 31, 2019
As at March 31, 2018
11 Inventories{Refer note 2(j)}Raw Materials 1,628.04 2,106.01 Packing Materials 3.94 3.84 Stores and Fuel 412.68 445.83 Semi-finished Goods 1,281.43 392.78 Finished Goods 74.53 94.26
Total 3,400.62 3,042.72
Of the above includes Goods in transit :Raw Materials 216.68 130.24 Stores and Fuel 2.69 0.32 Finished Goods 74.53 94.26
12 Trade ReceivablesTrade Receivables considers good - Unsecured 3,213.13 3,202.63 Trade Receivables - credit impaired 49.06 12.00
3,262.19 3,214.63 Allowance for doubtful debts 49.06 12.00
Total 3,213.13 3,202.63
Refer Note 42 for credit risk related disclosures.13 Cash and cash equivalents
Balances with banks: - In Current Accounts 0.29 0.32 Cash on Hand 1.35 1.69
Total 1.64 2.01
There are no repatriation restrictions with regard to cash and cash equivalents as at the end of the reporting period and prior periods.
14 Bank balances other than note 13 aboveUnpaid Dividend Accounts 16.53 38.00
Total 16.53 38.00
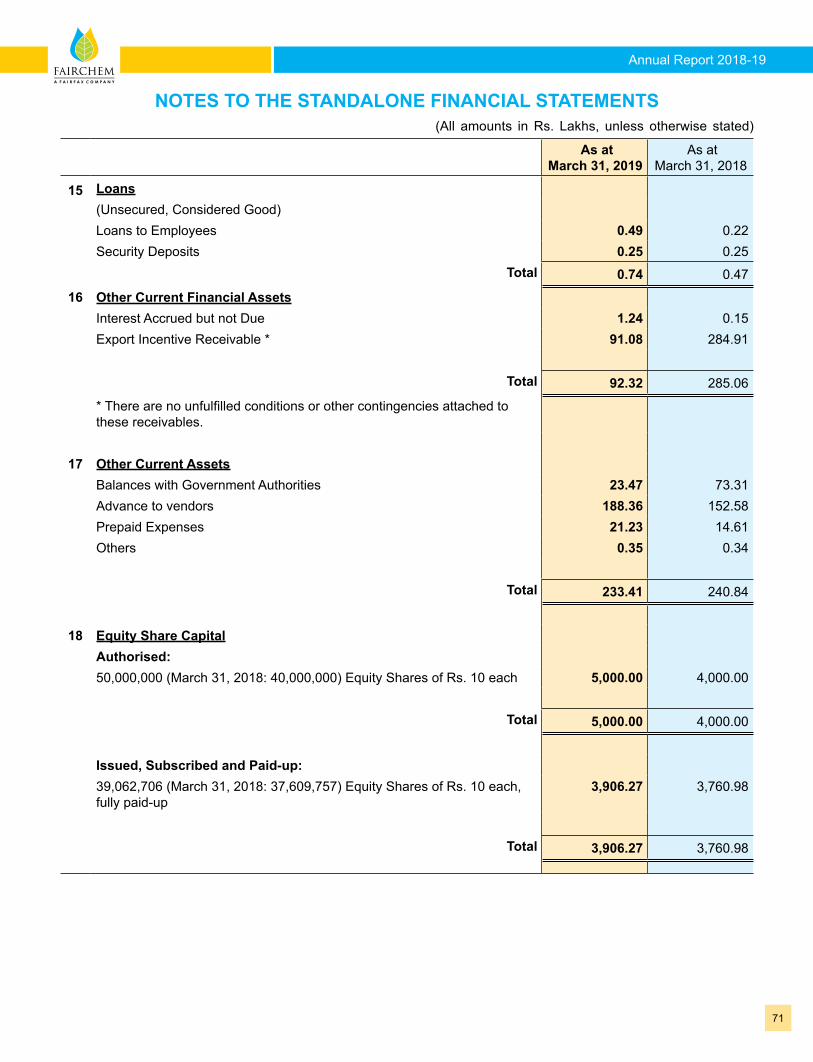
Annual Report 2018-19
71
NOTES TO THE STANDALONE FINANCIAL STATEMENTS(All amounts in Rs. Lakhs, unless otherwise stated)
As at March 31, 2019
As at March 31, 2018
15 Loans(Unsecured, Considered Good)Loans to Employees 0.49 0.22 Security Deposits 0.25 0.25
Total 0.74 0.47
16 Other Current Financial AssetsInterest Accrued but not Due 1.24 0.15 Export Incentive Receivable * 91.08 284.91
Total 92.32 285.06
* There are no unfulfilled conditions or other contingencies attached to these receivables.
17 Other Current AssetsBalances with Government Authorities 23.47 73.31 Advance to vendors 188.36 152.58 Prepaid Expenses 21.23 14.61 Others 0.35 0.34
Total 233.41 240.84
18 Equity Share CapitalAuthorised:50,000,000 (March 31, 2018: 40,000,000) Equity Shares of Rs. 10 each 5,000.00 4,000.00
Total 5,000.00 4,000.00
Issued, Subscribed and Paid-up:39,062,706 (March 31, 2018: 37,609,757) Equity Shares of Rs. 10 each, fully paid-up
3,906.27 3,760.98
Total 3,906.27 3,760.98
72
FAIRCHEM SPECIALITY LIMITED
NOTES TO THE STANDALONE FINANCIAL STATEMENTS(All amounts in Rs. Lakhs, unless otherwise stated)
As at March 31, 2019
As at March 31, 2018
18.1 Movement in Equity Share Capital No. of Equity Shares
Balance as at the beginning of the year 376,09,757 376,09,757
Add: Conversion of Compulsorily Convertible Preference shares to Equity Shares
14,52,949 -
Balance as at the end of the year 390,62,706 376,09,757
18.2 Rights, preferences and restrictions attached to sharesThe company has one class of equity shares having a par value of Rs.10 per share. Each shareholder is eligible for one vote per share held. The dividend proposed by the Board of Directors is subject to the approval of the shareholders in the ensuing Annual General Meeting, except in case of interim dividend. In the event of liquidation, the equity shareholders are eligible to receive the remaining assets of the Company after distribution of all preferential amounts, in proportion to their shareholding.
18.3 Details of Shareholders holding more than 5% of the aggregate shares in the company:
As at March 31, 2019 As at March 31, 2018
Nos (%) Nos (%)
FIH Mauritius Investments Limited 190,42,828 48.75% 183,04,068 48.67%
Mr. Mahesh Babani 32,24,718 8.26% 30,39,297 8.08%
Banbridge Limited 24,61,914 6.30% 23,20,354 6.17%
18.4 Aggregate number of shares allotted as fully paid up by way of bonus shares (during 5 years immedi-ately preceding March 31, 2019):Equity Shares allotted as fully paid up Bonus Shares- During Financial Year ended March 31, 2014 - 1,140,000 Shares- During Financial Year ended March 31, 2015 - 1,254,000 Shares
18.5 Shares allotted as fully paid up pursuant to a scheme of arrangement without payment being received in cash (during 5 years immediately preceding March 31, 2019):During Financial Year ended March 31, 2017 - Equity Shares at Rs. 10/- each - 12,634,353 Shares
As at March 31, 2019
As at March 31, 2018
19 Instruments entirely equity in natureAuthorised:5,000,000 (March 31, 2018: 5,000,000) Preference Shares of Rs. 10 each 500.00 500.00
500.00 500.00
Issued, Subscribed and Paid-up:Nil (March 31, 2018: 1,452,949) 0.0001% Compulsorily Convertible Pref-erence Shares of Rs. 10 each
- 145.29
- 145.29
Annual Report 2018-19
73
As at March 31, 2019
As at March 31, 2018
No. of Compulsorily Convertible Preference Shares
19.1 Movement in 0.0001% Compulsorily Convertible Preference SharesBalance as at the beginning of the year 14,52,949 14,52,949 Less: Conversion to Equity Shares (14,52,949) -Balance as at the end of the year - 14,52,949
19.2 Rights, preferences and restrictions attached to shares 0.0001% Compulsorily Convertible Preference Shares (CCPS) : 12,634,353, 0.0001% CCPS of Rs.10 each
were issued on March 14, 2017 to the erstwhile shareholders of Privi Organics Limited pursuant to the Scheme of Arrangement without payment being received in cash.
Out of above, 11,181,404, 0.0001% CCPS of Rs. 10 each were converted into 11,181,404 Equity Shares of Rs. 10 each during F.Y. 2016-17 and 1,452,949, 0.0001% CCPS of Rs. 10 each were converted into 1,452,949 Equity Shares of Rs. 10 each during F.Y. 2018-19
CCPS carry no voting rights.
Equity shares issued and allotted by the company in terms upon conversion shall rank pari passu in all respects.
19.3 Details of Shareholders holding more than 5% of the aggregate shares in the company:
As at March 31, 2019 As at March 31, 2018
Nos (%) Nos (%) FIH Mauritius Investments Limited - 0% 7,38,760 50.85%Mr. Mahesh Babani - 0% 1,85,421 12.76%Banbridge Limited - 0% 1,41,560 9.74%Mahesh Purshottam Babani HUF - 0% 1,03,024 7.09%
19.4 Shares allotted as fully paid up pursuant to a scheme of arrangement without payment being received in cash (during 5 years immediately preceding March 31, 2019):
During Financial Year ended March 31, 2017 - Compulsorily Convertible Preference Shares of Rs. 10/- each - 12,634,353 Shares
NOTES TO THE STANDALONE FINANCIAL STATEMENTS(All amounts in Rs. Lakhs, unless otherwise stated)
74
FAIRCHEM SPECIALITY LIMITED
NOTES TO THE STANDALONE FINANCIAL STATEMENTS(All amounts in Rs. Lakhs, unless otherwise stated)
As at March 31, 2019
As at March 31, 2018
20 Other EquityRetained Earnings 6,355.32 4,827.51
Total 6,355.32 4,827.51
Retained EarningsBalance as at the beginning of the year 4,827.51 3,290.17 Profit for the year 2,151.76 1,939.69 Other Comprehensive Income (20.92) (0.58)
6,958.35 5,229.28 Less : Dividend paid including Dividend distribution tax 603.03 401.77 Balance as at the end of the year 6,355.32 4,827.51
Total 6,355.32 4,827.51
21 Borrowings - Non-CurrentSecured - at amortized cost Term Loan from Bank * 829.14 1,635.06
Total 829.14 1,635.06
* After considering unamortised expenses of Rs. 6.41 Lakhs as at March 31, 2019 (March 31, 2018: Rs. 9.27 Lakhs).
Security DetailsTerm Loans from banks are secured by hypothecation by way of first and exclusive charges on all present and future stocks, book debts and collateral security by way of Equitable mortgage of industrial property bearing Survey No. 253/P and 312 situated at village Chekhala, Sanand-Kadi Road and Hypothecation of plant and machinery installed at the factory premises.
Annual Report 2018-19
75
Name of bank Maturity Date Terms of Repayment
Outstanding as at
March 31, 2019
Outstanding as at
March 31, 2018
HDFC bank (Term Loans)
July, 2018 Repayment in 60 monthly installments
- 25.32
August, 2018 Repayment in 48 monthly installments
- 74.80
February, 2020 Repayment in 60 monthly installments
87.80 181.67
August, 2019 Repayment in 48 monthly installments
50.74 164.77
January, 2019 Repayment in 36 monthly installments
- 121.57
August, 2021 Repayment in 60 monthly installments
1,282.76 1,733.90
June, 2020 Repayment in 36 monthly installments
225.41 387.51
ICICI Bank (Vehicle Loan)
July, 2018 Repayment in 60 monthly installments
- 1.94
The carrying amount of financial and non-financials assets hypothecated and / or mortgaged as security for current andnon-current borrowings are disclosed in note 47.
As at March 31, 2019
As at March 31, 2018
22 Non-Current Provisions
Provision for Employee Benefits [Refer Note 29(a)]
Provision for compensated absences 89.54 61.95
Total 89.54 61.95
23 Borrowings
Secured:
Working Capital Loans from Bank 3,995.81 3,482.41
Packing credit in Foreign Currency 53.19 395.06
Total 4,049.00 3,877.47
Working Capital Loan and Packing credit in Foreign Currency from bank are secured by hypothecation by way of First and exclusive charges on all present and future stocks, book debts and collateral security by way of Equitable mortgage of industrial property bearing Survey No. 253/P and 312 situated at village Chekhala, Sanand-Kadi Road and Hypothecation of plant and machinery installed at the factory premises.
Packing credit from bank is due for repayment within 90 days (March 31, 2018: 120 days)
NOTES TO THE STANDALONE FINANCIAL STATEMENTS(All amounts in Rs. Lakhs, unless otherwise stated)
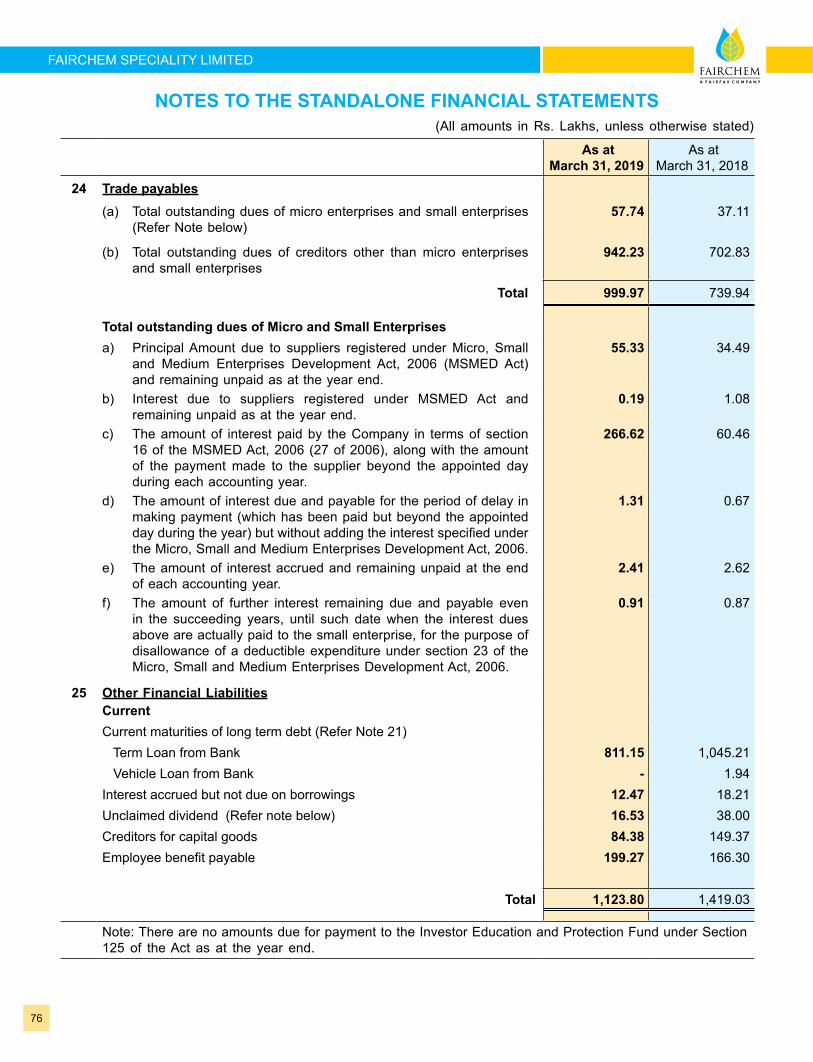
76
FAIRCHEM SPECIALITY LIMITED
As at March 31, 2019
As at March 31, 2018
24 Trade payables(a) Total outstanding dues of micro enterprises and small enterprises
(Refer Note below) 57.74 37.11
(b) Total outstanding dues of creditors other than micro enterprises and small enterprises
942.23 702.83
Total 999.97 739.94
Total outstanding dues of Micro and Small Enterprises a) Principal Amount due to suppliers registered under Micro, Small
and Medium Enterprises Development Act, 2006 (MSMED Act) and remaining unpaid as at the year end.
55.33 34.49
b) Interest due to suppliers registered under MSMED Act and remaining unpaid as at the year end.
0.19 1.08
c) The amount of interest paid by the Company in terms of section 16 of the MSMED Act, 2006 (27 of 2006), along with the amount of the payment made to the supplier beyond the appointed day during each accounting year.
266.62 60.46
d) The amount of interest due and payable for the period of delay in making payment (which has been paid but beyond the appointed day during the year) but without adding the interest specified under the Micro, Small and Medium Enterprises Development Act, 2006.
1.31 0.67
e) The amount of interest accrued and remaining unpaid at the end of each accounting year.
2.41 2.62
f) The amount of further interest remaining due and payable even in the succeeding years, until such date when the interest dues above are actually paid to the small enterprise, for the purpose of disallowance of a deductible expenditure under section 23 of the Micro, Small and Medium Enterprises Development Act, 2006.
0.91 0.87
25 Other Financial LiabilitiesCurrentCurrent maturities of long term debt (Refer Note 21) Term Loan from Bank 811.15 1,045.21 Vehicle Loan from Bank - 1.94 Interest accrued but not due on borrowings 12.47 18.21 Unclaimed dividend (Refer note below) 16.53 38.00 Creditors for capital goods 84.38 149.37 Employee benefit payable 199.27 166.30
Total 1,123.80 1,419.03
Note: There are no amounts due for payment to the Investor Education and Protection Fund under Section 125 of the Act as at the year end.
NOTES TO THE STANDALONE FINANCIAL STATEMENTS(All amounts in Rs. Lakhs, unless otherwise stated)
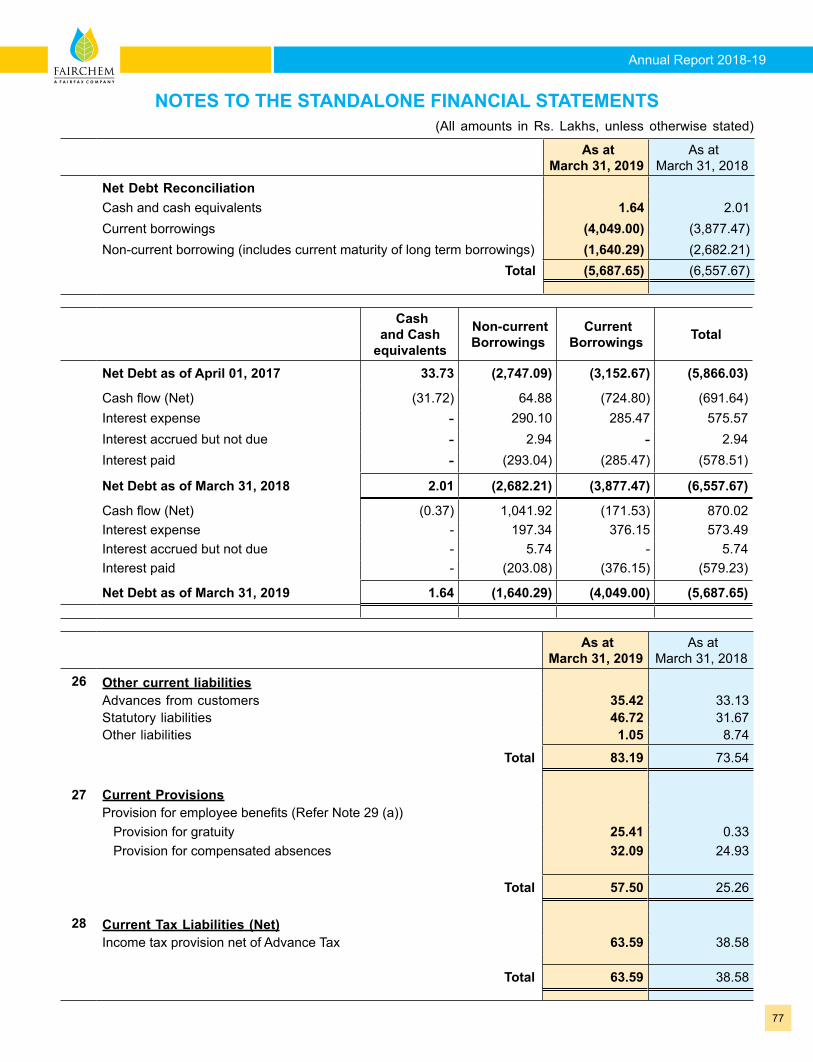
Annual Report 2018-19
77
As at March 31, 2019
As at March 31, 2018
Net Debt ReconciliationCash and cash equivalents 1.64 2.01 Current borrowings (4,049.00) (3,877.47)Non-current borrowing (includes current maturity of long term borrowings) (1,640.29) (2,682.21)
Total (5,687.65) (6,557.67)
Cash and Cash
equivalents
Non-current Borrowings
Current Borrowings Total
Net Debt as of April 01, 2017 33.73 (2,747.09) (3,152.67) (5,866.03)
Cash flow (Net) (31.72) 64.88 (724.80) (691.64)Interest expense - 290.10 285.47 575.57 Interest accrued but not due - 2.94 - 2.94 Interest paid - (293.04) (285.47) (578.51)
Net Debt as of March 31, 2018 2.01 (2,682.21) (3,877.47) (6,557.67)
Cash flow (Net) (0.37) 1,041.92 (171.53) 870.02 Interest expense - 197.34 376.15 573.49 Interest accrued but not due - 5.74 - 5.74 Interest paid - (203.08) (376.15) (579.23)
Net Debt as of March 31, 2019 1.64 (1,640.29) (4,049.00) (5,687.65)
As at March 31, 2019
As at March 31, 2018
26 Other current liabilitiesAdvances from customers 35.42 33.13 Statutory liabilities 46.72 31.67 Other liabilities 1.05 8.74
Total 83.19 73.54
27 Current ProvisionsProvision for employee benefits (Refer Note 29 (a)) Provision for gratuity 25.41 0.33 Provision for compensated absences 32.09 24.93
Total 57.50 25.26
28 Current Tax Liabilities (Net)Income tax provision net of Advance Tax 63.59 38.58
Total 63.59 38.58
NOTES TO THE STANDALONE FINANCIAL STATEMENTS(All amounts in Rs. Lakhs, unless otherwise stated)
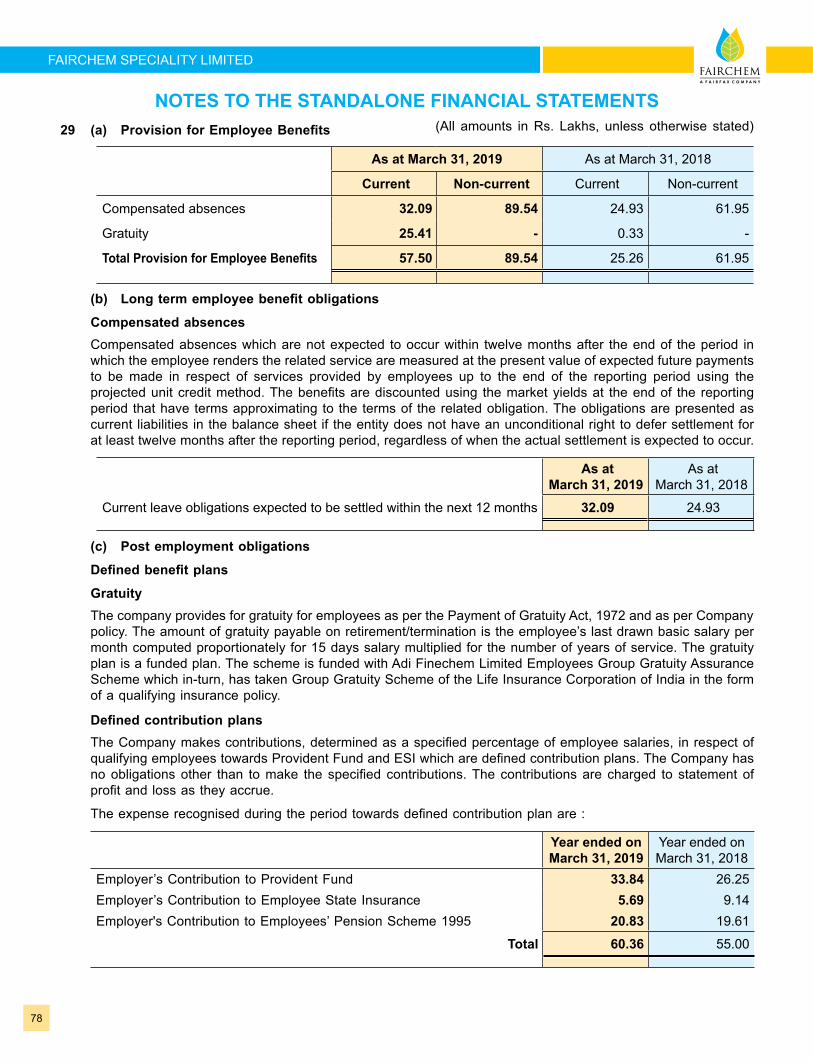
78
FAIRCHEM SPECIALITY LIMITED
29 (a) Provision for Employee Benefits
As at March 31, 2019 As at March 31, 2018
Current Non-current Current Non-current
Compensated absences 32.09 89.54 24.93 61.95
Gratuity 25.41 - 0.33 -
Total Provision for Employee Benefits 57.50 89.54 25.26 61.95
(b) Long term employee benefit obligations
Compensated absences Compensated absences which are not expected to occur within twelve months after the end of the period in
which the employee renders the related service are measured at the present value of expected future payments to be made in respect of services provided by employees up to the end of the reporting period using the projected unit credit method. The benefits are discounted using the market yields at the end of the reporting period that have terms approximating to the terms of the related obligation. The obligations are presented as current liabilities in the balance sheet if the entity does not have an unconditional right to defer settlement for at least twelve months after the reporting period, regardless of when the actual settlement is expected to occur.
As at March 31, 2019
As at March 31, 2018
Current leave obligations expected to be settled within the next 12 months 32.09 24.93
(c) Post employment obligations
Defined benefit plans
Gratuity The company provides for gratuity for employees as per the Payment of Gratuity Act, 1972 and as per Company
policy. The amount of gratuity payable on retirement/termination is the employee’s last drawn basic salary per month computed proportionately for 15 days salary multiplied for the number of years of service. The gratuity plan is a funded plan. The scheme is funded with Adi Finechem Limited Employees Group Gratuity Assurance Scheme which in-turn, has taken Group Gratuity Scheme of the Life Insurance Corporation of India in the form of a qualifying insurance policy.
Defined contribution plans The Company makes contributions, determined as a specified percentage of employee salaries, in respect of
qualifying employees towards Provident Fund and ESI which are defined contribution plans. The Company has no obligations other than to make the specified contributions. The contributions are charged to statement of profit and loss as they accrue.
The expense recognised during the period towards defined contribution plan are :
Year ended on March 31, 2019
Year ended on March 31, 2018
Employer’s Contribution to Provident Fund 33.84 26.25 Employer’s Contribution to Employee State Insurance 5.69 9.14 Employer's Contribution to Employees’ Pension Scheme 1995 20.83 19.61
Total 60.36 55.00
NOTES TO THE STANDALONE FINANCIAL STATEMENTS(All amounts in Rs. Lakhs, unless otherwise stated)
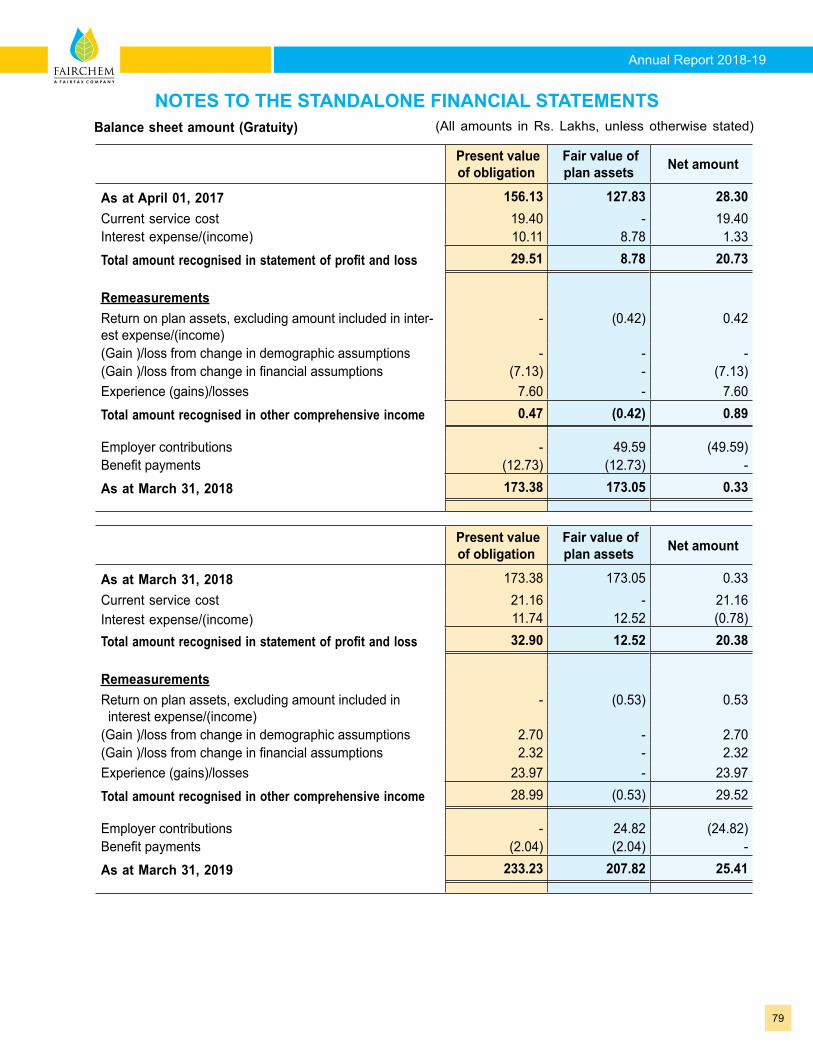
Annual Report 2018-19
79
Balance sheet amount (Gratuity)
Present value of obligation
Fair value of plan assets Net amount
As at April 01, 2017 156.13 127.83 28.30 Current service cost 19.40 - 19.40 Interest expense/(income) 10.11 8.78 1.33
Total amount recognised in statement of profit and loss 29.51 8.78 20.73
RemeasurementsReturn on plan assets, excluding amount included in inter-est expense/(income)
- (0.42) 0.42
(Gain )/loss from change in demographic assumptions - - - (Gain )/loss from change in financial assumptions (7.13) - (7.13)Experience (gains)/losses 7.60 - 7.60
Total amount recognised in other comprehensive income 0.47 (0.42) 0.89
Employer contributions - 49.59 (49.59)Benefit payments (12.73) (12.73) -
As at March 31, 2018 173.38 173.05 0.33
Present value of obligation
Fair value of plan assets Net amount
As at March 31, 2018 173.38 173.05 0.33 Current service cost 21.16 - 21.16 Interest expense/(income) 11.74 12.52 (0.78)
Total amount recognised in statement of profit and loss 32.90 12.52 20.38
RemeasurementsReturn on plan assets, excluding amount included in interest expense/(income)
- (0.53) 0.53
(Gain )/loss from change in demographic assumptions 2.70 - 2.70 (Gain )/loss from change in financial assumptions 2.32 - 2.32 Experience (gains)/losses 23.97 - 23.97
Total amount recognised in other comprehensive income 28.99 (0.53) 29.52
Employer contributions - 24.82 (24.82)Benefit payments (2.04) (2.04) -
As at March 31, 2019 233.23 207.82 25.41
NOTES TO THE STANDALONE FINANCIAL STATEMENTS(All amounts in Rs. Lakhs, unless otherwise stated)
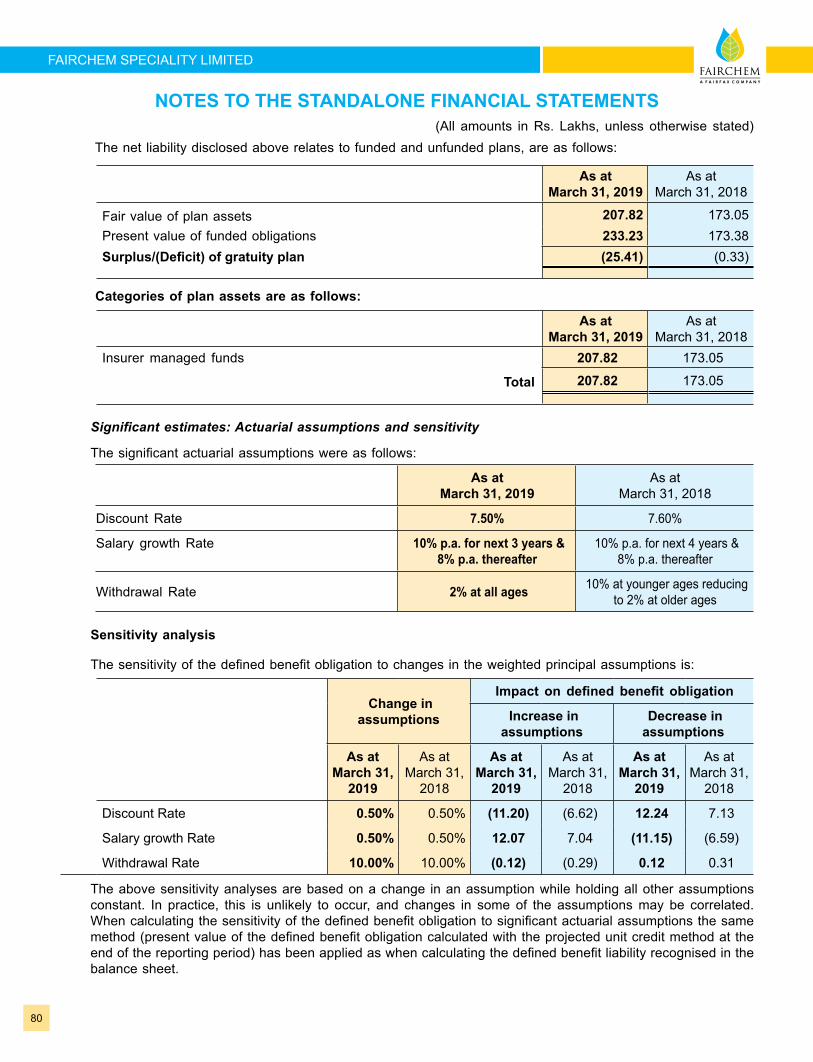
80
FAIRCHEM SPECIALITY LIMITED
NOTES TO THE STANDALONE FINANCIAL STATEMENTS(All amounts in Rs. Lakhs, unless otherwise stated)
The net liability disclosed above relates to funded and unfunded plans, are as follows:
As at March 31, 2019
As at March 31, 2018
Fair value of plan assets 207.82 173.05 Present value of funded obligations 233.23 173.38 Surplus/(Deficit) of gratuity plan (25.41) (0.33)
Categories of plan assets are as follows:
As at March 31, 2019
As at March 31, 2018
Insurer managed funds 207.82 173.05
Total 207.82 173.05
Significantestimates:Actuarialassumptionsandsensitivity
The significant actuarial assumptions were as follows:
As at March 31, 2019
As at March 31, 2018
Discount Rate 7.50% 7.60%
Salary growth Rate 10% p.a. for next 3 years & 8% p.a. thereafter
10% p.a. for next 4 years & 8% p.a. thereafter
Withdrawal Rate 2% at all ages 10% at younger ages reducing to 2% at older ages
Sensitivity analysis
The sensitivity of the defined benefit obligation to changes in the weighted principal assumptions is:
Change in assumptions
Impact on defined benefit obligation
Increase in assumptions
Decrease in assumptions
As at March 31,
2019
As at March 31,
2018
As at March 31,
2019
As at March 31,
2018
As at March 31,
2019
As at March 31,
2018
Discount Rate 0.50% 0.50% (11.20) (6.62) 12.24 7.13
Salary growth Rate 0.50% 0.50% 12.07 7.04 (11.15) (6.59)
Withdrawal Rate 10.00% 10.00% (0.12) (0.29) 0.12 0.31
The above sensitivity analyses are based on a change in an assumption while holding all other assumptions constant. In practice, this is unlikely to occur, and changes in some of the assumptions may be correlated. When calculating the sensitivity of the defined benefit obligation to significant actuarial assumptions the same method (present value of the defined benefit obligation calculated with the projected unit credit method at the end of the reporting period) has been applied as when calculating the defined benefit liability recognised in the balance sheet.
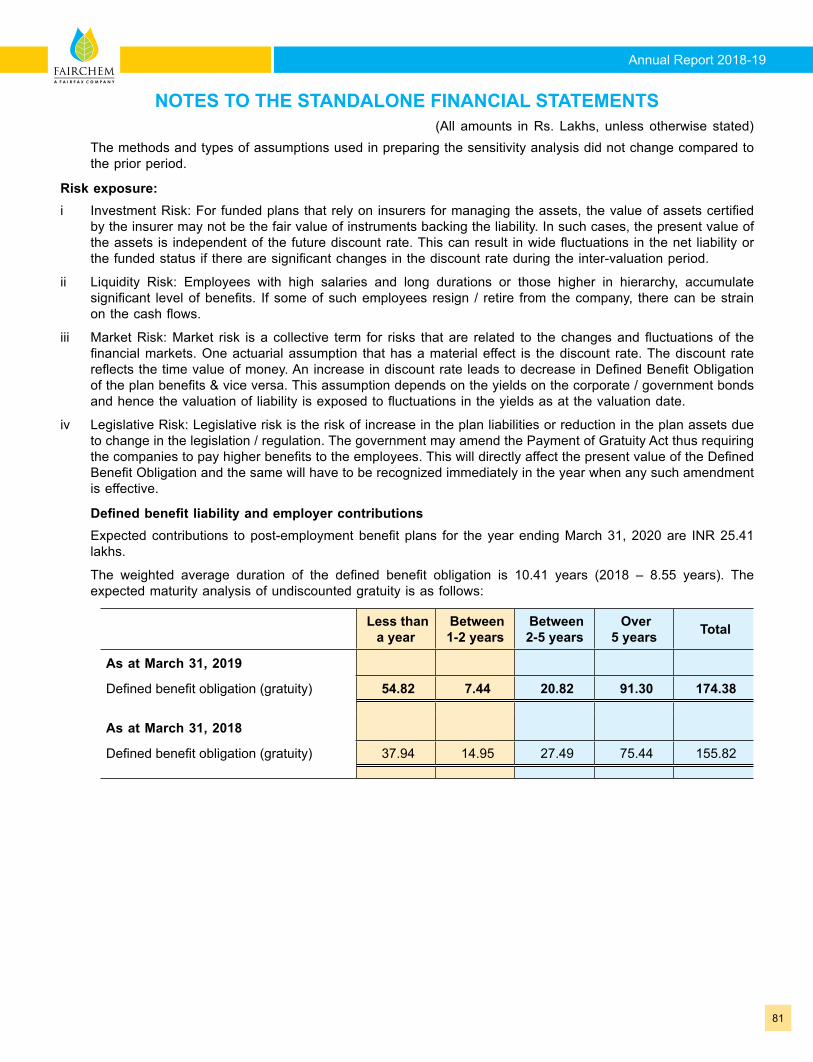
Annual Report 2018-19
81
The methods and types of assumptions used in preparing the sensitivity analysis did not change compared to the prior period.
Risk exposure:i Investment Risk: For funded plans that rely on insurers for managing the assets, the value of assets certified
by the insurer may not be the fair value of instruments backing the liability. In such cases, the present value of the assets is independent of the future discount rate. This can result in wide fluctuations in the net liability or the funded status if there are significant changes in the discount rate during the inter-valuation period.
ii Liquidity Risk: Employees with high salaries and long durations or those higher in hierarchy, accumulate significant level of benefits. If some of such employees resign / retire from the company, there can be strain on the cash flows.
iii Market Risk: Market risk is a collective term for risks that are related to the changes and fluctuations of the financial markets. One actuarial assumption that has a material effect is the discount rate. The discount rate reflects the time value of money. An increase in discount rate leads to decrease in Defined Benefit Obligation of the plan benefits & vice versa. This assumption depends on the yields on the corporate / government bonds and hence the valuation of liability is exposed to fluctuations in the yields as at the valuation date.
iv Legislative Risk: Legislative risk is the risk of increase in the plan liabilities or reduction in the plan assets due to change in the legislation / regulation. The government may amend the Payment of Gratuity Act thus requiring the companies to pay higher benefits to the employees. This will directly affect the present value of the Defined Benefit Obligation and the same will have to be recognized immediately in the year when any such amendment is effective.
Defined benefit liability and employer contributions Expected contributions to post-employment benefit plans for the year ending March 31, 2020 are INR 25.41
lakhs.
The weighted average duration of the defined benefit obligation is 10.41 years (2018 – 8.55 years). The expected maturity analysis of undiscounted gratuity is as follows:
Less than a year
Between 1-2 years
Between 2-5 years
Over 5 years Total
As at March 31, 2019
Defined benefit obligation (gratuity) 54.82 7.44 20.82 91.30 174.38
As at March 31, 2018
Defined benefit obligation (gratuity) 37.94 14.95 27.49 75.44 155.82
NOTES TO THE STANDALONE FINANCIAL STATEMENTS(All amounts in Rs. Lakhs, unless otherwise stated)
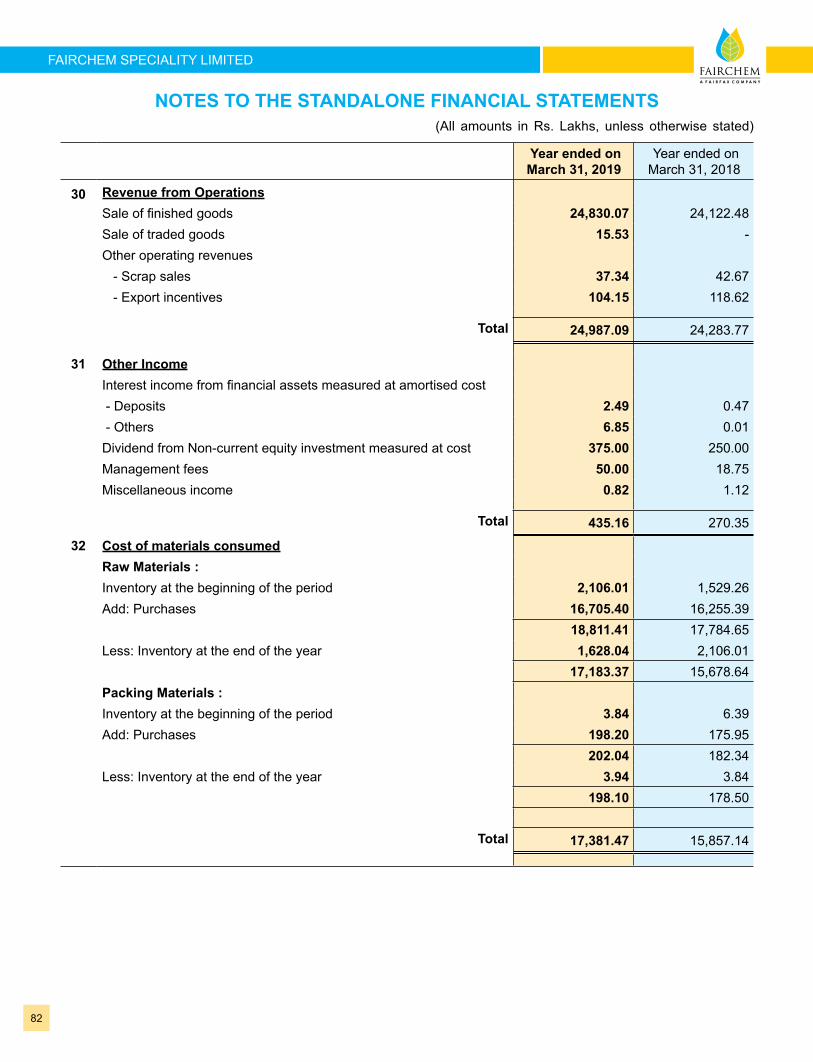
82
FAIRCHEM SPECIALITY LIMITED
Year ended on March 31, 2019
Year ended on March 31, 2018
30 Revenue from OperationsSale of finished goods 24,830.07 24,122.48 Sale of traded goods 15.53 - Other operating revenues - Scrap sales 37.34 42.67 - Export incentives 104.15 118.62
Total 24,987.09 24,283.77
31 Other IncomeInterest income from financial assets measured at amortised cost - Deposits 2.49 0.47 - Others 6.85 0.01 Dividend from Non-current equity investment measured at cost 375.00 250.00 Management fees 50.00 18.75 Miscellaneous income 0.82 1.12
Total 435.16 270.35
32 Cost of materials consumedRaw Materials :Inventory at the beginning of the period 2,106.01 1,529.26 Add: Purchases 16,705.40 16,255.39
18,811.41 17,784.65 Less: Inventory at the end of the year 1,628.04 2,106.01
17,183.37 15,678.64 Packing Materials :Inventory at the beginning of the period 3.84 6.39 Add: Purchases 198.20 175.95
202.04 182.34 Less: Inventory at the end of the year 3.94 3.84
198.10 178.50
Total 17,381.47 15,857.14
NOTES TO THE STANDALONE FINANCIAL STATEMENTS(All amounts in Rs. Lakhs, unless otherwise stated)
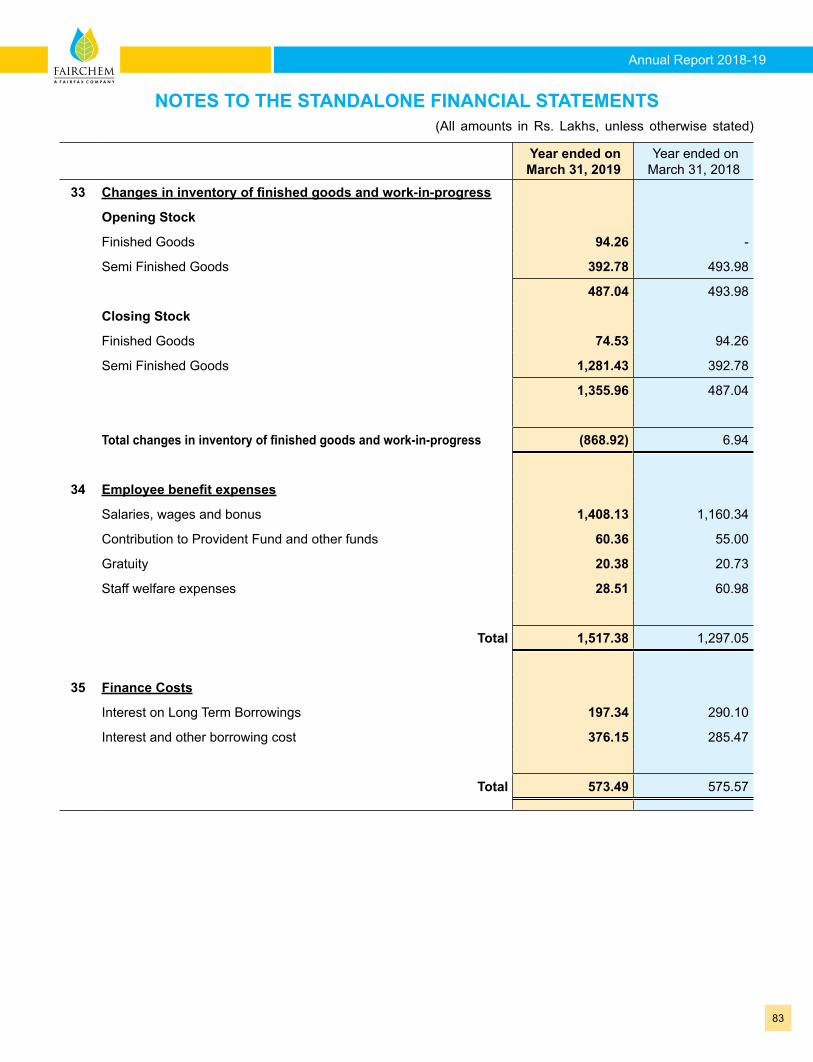
Annual Report 2018-19
83
Year ended on March 31, 2019
Year ended on March 31, 2018
33 Changes in inventory of finished goods and work-in-progress
Opening Stock
Finished Goods 94.26 -
Semi Finished Goods 392.78 493.98
487.04 493.98
Closing Stock
Finished Goods 74.53 94.26
Semi Finished Goods 1,281.43 392.78
1,355.96 487.04
Total changes in inventory of finished goods and work-in-progress (868.92) 6.94
34 Employee benefit expenses
Salaries, wages and bonus 1,408.13 1,160.34
Contribution to Provident Fund and other funds 60.36 55.00
Gratuity 20.38 20.73
Staff welfare expenses 28.51 60.98
Total 1,517.38 1,297.05
35 Finance Costs
Interest on Long Term Borrowings 197.34 290.10
Interest and other borrowing cost 376.15 285.47
Total 573.49 575.57
NOTES TO THE STANDALONE FINANCIAL STATEMENTS(All amounts in Rs. Lakhs, unless otherwise stated)
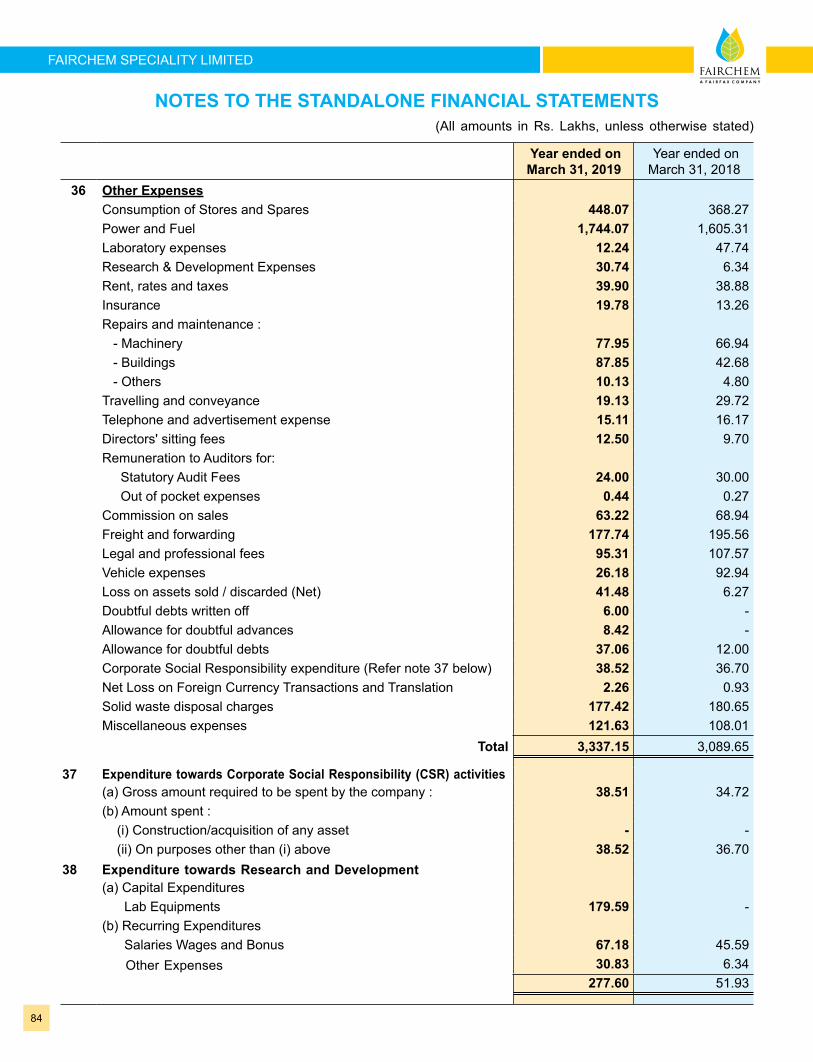
84
FAIRCHEM SPECIALITY LIMITED
NOTES TO THE STANDALONE FINANCIAL STATEMENTS(All amounts in Rs. Lakhs, unless otherwise stated)
Year ended on March 31, 2019
Year ended on March 31, 2018
36 Other ExpensesConsumption of Stores and Spares 448.07 368.27 Power and Fuel 1,744.07 1,605.31 Laboratory expenses 12.24 47.74 Research & Development Expenses 30.74 6.34 Rent, rates and taxes 39.90 38.88 Insurance 19.78 13.26 Repairs and maintenance : - Machinery 77.95 66.94 - Buildings 87.85 42.68 - Others 10.13 4.80 Travelling and conveyance 19.13 29.72 Telephone and advertisement expense 15.11 16.17 Directors' sitting fees 12.50 9.70 Remuneration to Auditors for: Statutory Audit Fees 24.00 30.00 Out of pocket expenses 0.44 0.27 Commission on sales 63.22 68.94 Freight and forwarding 177.74 195.56 Legal and professional fees 95.31 107.57 Vehicle expenses 26.18 92.94 Loss on assets sold / discarded (Net) 41.48 6.27 Doubtful debts written off 6.00 - Allowance for doubtful advances 8.42 - Allowance for doubtful debts 37.06 12.00 Corporate Social Responsibility expenditure (Refer note 37 below) 38.52 36.70 Net Loss on Foreign Currency Transactions and Translation 2.26 0.93 Solid waste disposal charges 177.42 180.65 Miscellaneous expenses 121.63 108.01
Total 3,337.15 3,089.65
37 Expenditure towards Corporate Social Responsibility (CSR) activities(a) Gross amount required to be spent by the company : 38.51 34.72 (b) Amount spent : (i) Construction/acquisition of any asset - - (ii) On purposes other than (i) above 38.52 36.70
38 Expenditure towards Research and Development(a) Capital Expenditures Lab Equipments 179.59 - (b) Recurring Expenditures Salaries Wages and Bonus 67.18 45.59 Other Expenses 30.83 6.34
277.60 51.93
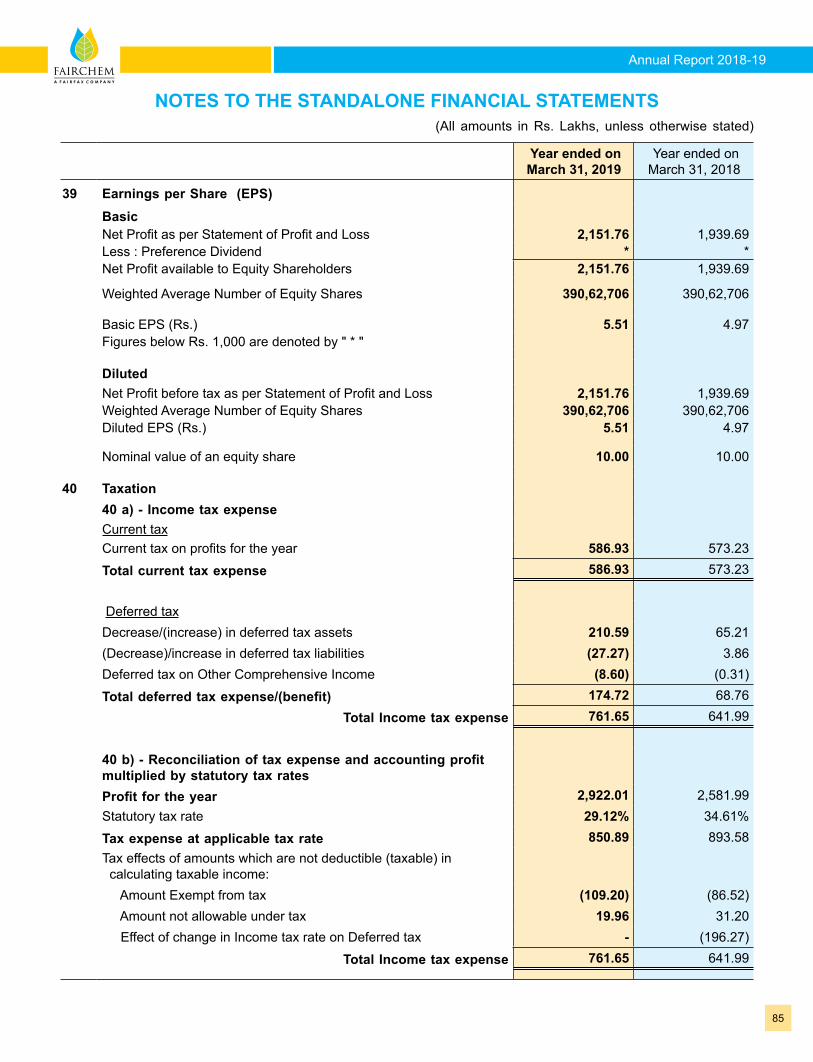
Annual Report 2018-19
85
Year ended on March 31, 2019
Year ended on March 31, 2018
39 Earnings per Share (EPS)BasicNet Profit as per Statement of Profit and Loss 2,151.76 1,939.69 Less : Preference Dividend * * Net Profit available to Equity Shareholders 2,151.76 1,939.69
Weighted Average Number of Equity Shares 390,62,706 390,62,706
Basic EPS (Rs.) 5.51 4.97 Figures below Rs. 1,000 are denoted by " * "
DilutedNet Profit before tax as per Statement of Profit and Loss 2,151.76 1,939.69 Weighted Average Number of Equity Shares 390,62,706 390,62,706 Diluted EPS (Rs.) 5.51 4.97
Nominal value of an equity share 10.00 10.00
40 Taxation40 a) - Income tax expenseCurrent taxCurrent tax on profits for the year 586.93 573.23
Total current tax expense 586.93 573.23
Deferred tax Decrease/(increase) in deferred tax assets 210.59 65.21 (Decrease)/increase in deferred tax liabilities (27.27) 3.86 Deferred tax on Other Comprehensive Income (8.60) (0.31)
Total deferred tax expense/(benefit) 174.72 68.76
Total Income tax expense 761.65 641.99
40 b) - Reconciliation of tax expense and accounting profit multiplied by statutory tax ratesProfit for the year 2,922.01 2,581.99 Statutory tax rate 29.12% 34.61%
Tax expense at applicable tax rate 850.89 893.58 Tax effects of amounts which are not deductible (taxable) in calculating taxable income: Amount Exempt from tax (109.20) (86.52) Amount not allowable under tax 19.96 31.20 Effect of change in Income tax rate on Deferred tax - (196.27)
Total Income tax expense 761.65 641.99
NOTES TO THE STANDALONE FINANCIAL STATEMENTS(All amounts in Rs. Lakhs, unless otherwise stated)
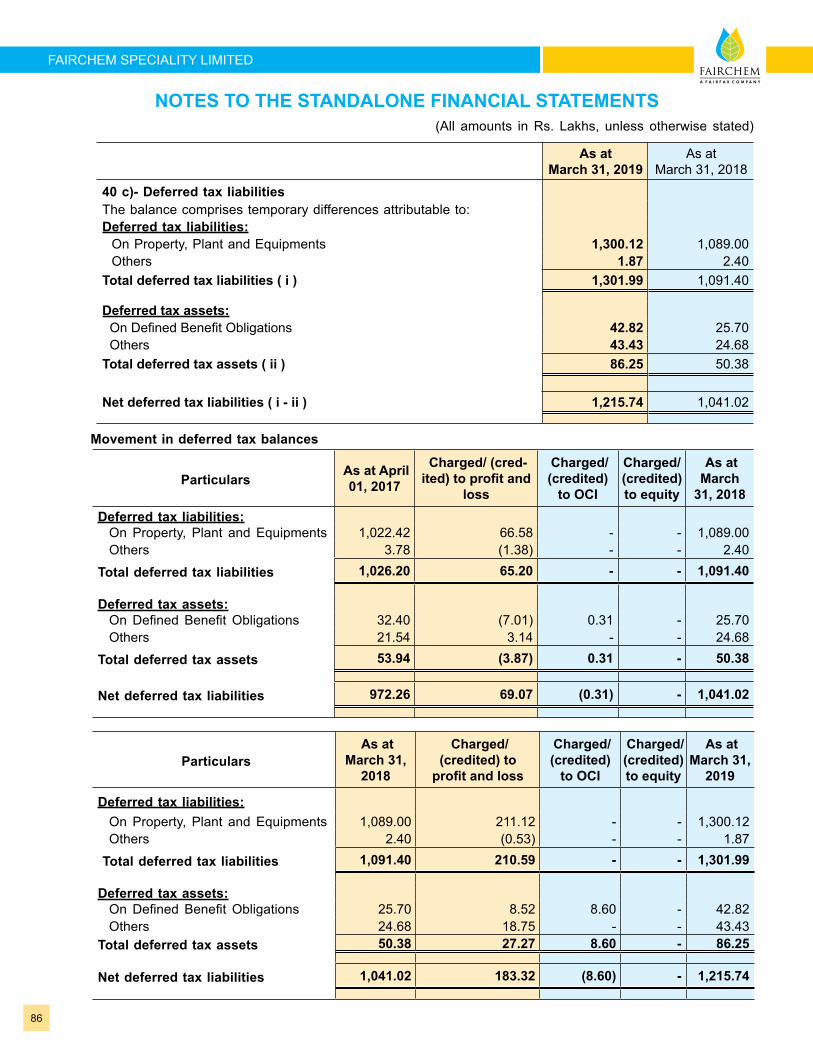
86
FAIRCHEM SPECIALITY LIMITED
As at March 31, 2019
As at March 31, 2018
40 c)- Deferred tax liabilitiesThe balance comprises temporary differences attributable to:Deferred tax liabilities: On Property, Plant and Equipments 1,300.12 1,089.00 Others 1.87 2.40 Total deferred tax liabilities ( i ) 1,301.99 1,091.40
Deferred tax assets: On Defined Benefit Obligations 42.82 25.70 Others 43.43 24.68 Total deferred tax assets ( ii ) 86.25 50.38
Net deferred tax liabilities ( i - ii ) 1,215.74 1,041.02
Movement in deferred tax balances
Particulars As at April
01, 2017
Charged/ (cred-ited) to profit and
loss
Charged/ (credited)
to OCI
Charged/ (credited) to equity
As at March
31, 2018 Deferred tax liabilities: On Property, Plant and Equipments 1,022.42 66.58 - - 1,089.00 Others 3.78 (1.38) - - 2.40
Total deferred tax liabilities 1,026.20 65.20 - - 1,091.40
Deferred tax assets: On Defined Benefit Obligations 32.40 (7.01) 0.31 - 25.70 Others 21.54 3.14 - - 24.68
Total deferred tax assets 53.94 (3.87) 0.31 - 50.38
Net deferred tax liabilities 972.26 69.07 (0.31) - 1,041.02
Particulars As at
March 31, 2018
Charged/ (credited) to
profit and loss
Charged/ (credited)
to OCI
Charged/ (credited) to equity
As at March 31,
2019
Deferred tax liabilities: On Property, Plant and Equipments 1,089.00 211.12 - - 1,300.12 Others 2.40 (0.53) - - 1.87
Total deferred tax liabilities 1,091.40 210.59 - - 1,301.99
Deferred tax assets: On Defined Benefit Obligations 25.70 8.52 8.60 - 42.82 Others 24.68 18.75 - - 43.43 Total deferred tax assets 50.38 27.27 8.60 - 86.25
Net deferred tax liabilities 1,041.02 183.32 (8.60) - 1,215.74
NOTES TO THE STANDALONE FINANCIAL STATEMENTS(All amounts in Rs. Lakhs, unless otherwise stated)
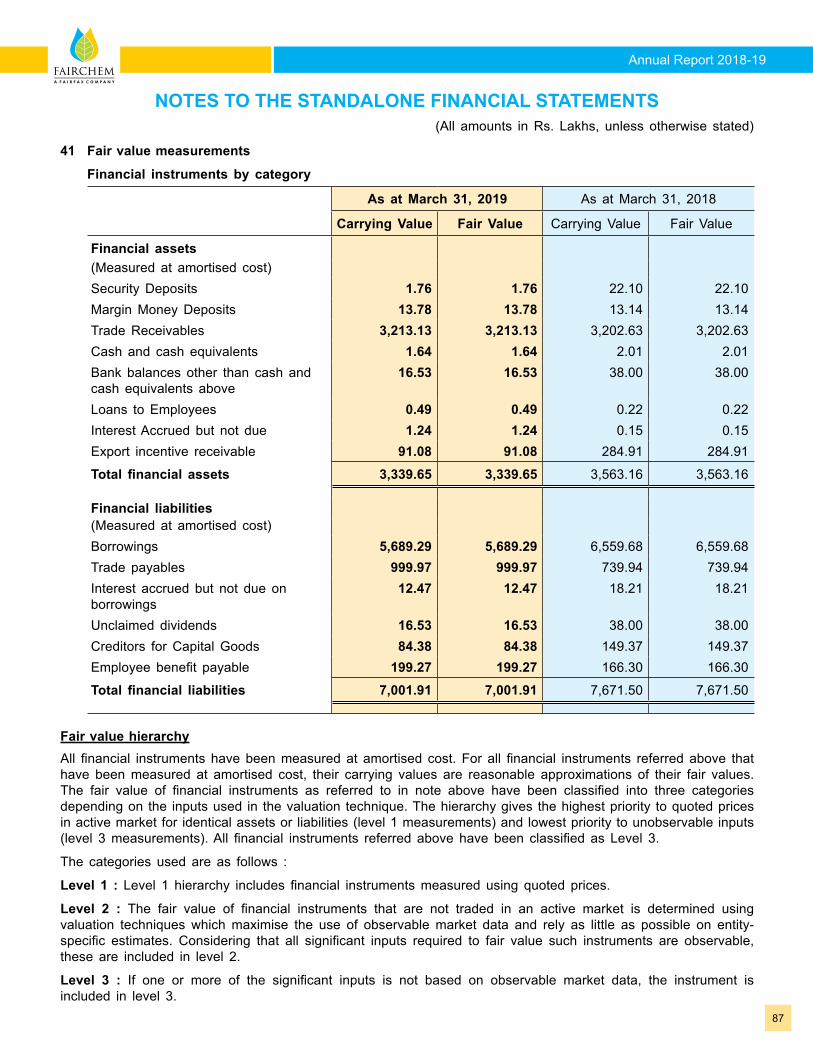
Annual Report 2018-19
87
NOTES TO THE STANDALONE FINANCIAL STATEMENTS(All amounts in Rs. Lakhs, unless otherwise stated)
41 Fair value measurements
Financial instruments by category
As at March 31, 2019 As at March 31, 2018
Carrying Value Fair Value Carrying Value Fair Value
Financial assets(Measured at amortised cost)Security Deposits 1.76 1.76 22.10 22.10 Margin Money Deposits 13.78 13.78 13.14 13.14 Trade Receivables 3,213.13 3,213.13 3,202.63 3,202.63 Cash and cash equivalents 1.64 1.64 2.01 2.01 Bank balances other than cash and cash equivalents above
16.53 16.53 38.00 38.00
Loans to Employees 0.49 0.49 0.22 0.22 Interest Accrued but not due 1.24 1.24 0.15 0.15 Export incentive receivable 91.08 91.08 284.91 284.91
Total financial assets 3,339.65 3,339.65 3,563.16 3,563.16
Financial liabilities(Measured at amortised cost)Borrowings 5,689.29 5,689.29 6,559.68 6,559.68 Trade payables 999.97 999.97 739.94 739.94 Interest accrued but not due on borrowings
12.47 12.47 18.21 18.21
Unclaimed dividends 16.53 16.53 38.00 38.00 Creditors for Capital Goods 84.38 84.38 149.37 149.37 Employee benefit payable 199.27 199.27 166.30 166.30
Total financial liabilities 7,001.91 7,001.91 7,671.50 7,671.50
Fair value hierarchy All financial instruments have been measured at amortised cost. For all financial instruments referred above that have been measured at amortised cost, their carrying values are reasonable approximations of their fair values. The fair value of financial instruments as referred to in note above have been classified into three categories depending on the inputs used in the valuation technique. The hierarchy gives the highest priority to quoted prices in active market for identical assets or liabilities (level 1 measurements) and lowest priority to unobservable inputs (level 3 measurements). All financial instruments referred above have been classified as Level 3.
The categories used are as follows :
Level 1 : Level 1 hierarchy includes financial instruments measured using quoted prices.
Level 2 : The fair value of financial instruments that are not traded in an active market is determined using valuation techniques which maximise the use of observable market data and rely as little as possible on entity-specific estimates. Considering that all significant inputs required to fair value such instruments are observable, these are included in level 2.
Level 3 : If one or more of the significant inputs is not based on observable market data, the instrument is included in level 3.
88
FAIRCHEM SPECIALITY LIMITED
Valuation technique used to determine fair valueThe fair value of the financial instruments is determined using discounted cash flow analysis.
Valuation processesThe finance department of the company includes a team that performs the valuations of financial assets and liabilities required for financial reporting purposes, including level 3 fair values. This team reports directly to the Chief Financial Officer (CFO). Discussions of valuation process and results are held between the CFO and the valuation team at least once in three months, in line with the company’s quarterly reporting period. Changes in the fair value are analysed at the end of each reporting period during the quarterly valuation discussion between the CFO and the valuation team.
Fair value of financial assets/liabilities measured at amortised cost
The carrying amounts of trade receivables, cash and cash equivalents, other bank balances, investments, margin money deposits, loans to employees, security deposits, trade payables, capital creditors, interest accrued but not due on borrowings, unclaimed dividends, employee benefit payable and other deposits are considered to be as their fair values, due to their current nature.
The fair values of borrowings have been calculated based on cash flows discounted using a current lending rate. They are classified as level 3 in the hierarchy due to the inclusion of unobservable inputs including counterparty credit risk.
For Level 3 financial instruments, the fair value has been based on present values and the discount rates used, are adjusted for counterparty or own risk.
42 Financial risk management The Company’s business activities expose it to a variety of financial risks, namely liquidity risk, market risks
and credit risk. The Company’s management has overall responsibility for the establishment and oversight of the Company’s risk management framework. The key risks and mitigating actions are also placed before the Board of directors of the Company. The Company’s risk management policies are established to identify and analyse the risks faced by the Company, to set appropriate risk limits and to control and monitor risks and adherence to limits. Risk management policies and systems are reviewed regularly to reflect changes in market conditions and the Company’s activities.
The Risk Management framework of the Company is supported by the Finance team and experts of respective business divisions that provides assurance that the Company’s financial risk activities are governed by appropriate policies and procedures and that financial risks are identified, measured and managed in accordance with the Company’s policies and risk objectives. The activities are designed to:
- protect the Company’s financial results and position from financial risks
- maintain market risks within acceptable parameters, while optimising returns; and
- protect the Company’s financial investments, while maximising returns.
The Treasury department provides funding and foreign exchange management services for the Company’s operations. In addition to guidelines and exposure limits, a system of authorities and extensive independent reporting covers all major areas of treasury’s activity.
This note explains the sources of risk which the entity is exposed to and how the entity manages the risk.
(A) Management of Credit Risk Credit risk is the risk of financial loss to the Company if a customer or counter-party fails to meet its
contractual obligations.
Cash and cash equivalents & bank balances
The Company is also exposed to credit risk on cash and cash equivalents and bank balances other than cash and cash equivalents. These balances (other than cash on hand) are with high credit rating banks which are governed by Reserve Bank of India. The company believes its credit risk in such bank balances is immaterial.
NOTES TO THE STANDALONE FINANCIAL STATEMENTS
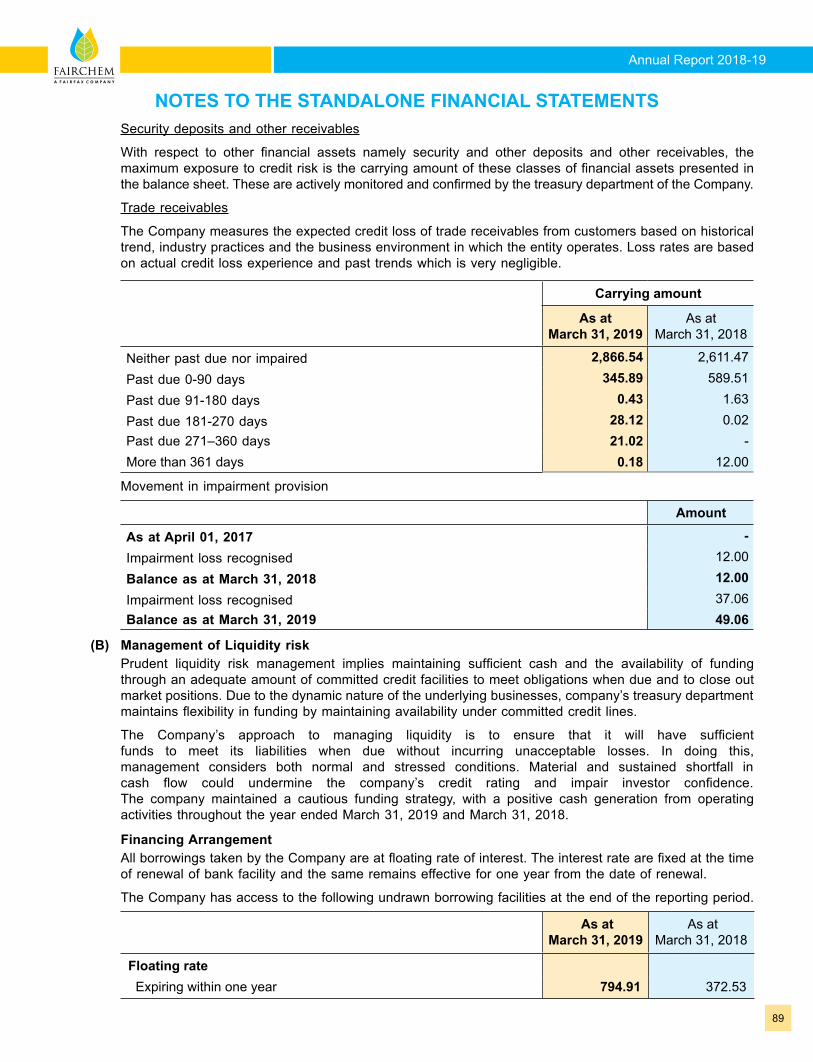
Annual Report 2018-19
89
Security deposits and other receivables
With respect to other financial assets namely security and other deposits and other receivables, the maximum exposure to credit risk is the carrying amount of these classes of financial assets presented in the balance sheet. These are actively monitored and confirmed by the treasury department of the Company.
Trade receivables
The Company measures the expected credit loss of trade receivables from customers based on historical trend, industry practices and the business environment in which the entity operates. Loss rates are based on actual credit loss experience and past trends which is very negligible.
Carrying amount
As at March 31, 2019
As at March 31, 2018
Neither past due nor impaired 2,866.54 2,611.47
Past due 0-90 days 345.89 589.51
Past due 91-180 days 0.43 1.63
Past due 181-270 days 28.12 0.02 Past due 271–360 days 21.02 - More than 361 days 0.18 12.00
Movement in impairment provision
Amount
As at April 01, 2017 - Impairment loss recognised 12.00
Balance as at March 31, 2018 12.00 Impairment loss recognised 37.06 Balance as at March 31, 2019 49.06
(B) Management of Liquidity risk Prudent liquidity risk management implies maintaining sufficient cash and the availability of funding
through an adequate amount of committed credit facilities to meet obligations when due and to close out market positions. Due to the dynamic nature of the underlying businesses, company’s treasury department maintains flexibility in funding by maintaining availability under committed credit lines.
The Company’s approach to managing liquidity is to ensure that it will have sufficient funds to meet its liabilities when due without incurring unacceptable losses. In doing this, management considers both normal and stressed conditions. Material and sustained shortfall in cash flow could undermine the company’s credit rating and impair investor confidence. The company maintained a cautious funding strategy, with a positive cash generation from operating activities throughout the year ended March 31, 2019 and March 31, 2018.
Financing Arrangement All borrowings taken by the Company are at floating rate of interest. The interest rate are fixed at the time
of renewal of bank facility and the same remains effective for one year from the date of renewal.
The Company has access to the following undrawn borrowing facilities at the end of the reporting period.
As at March 31, 2019
As at March 31, 2018
Floating rate Expiring within one year 794.91 372.53
NOTES TO THE STANDALONE FINANCIAL STATEMENTS
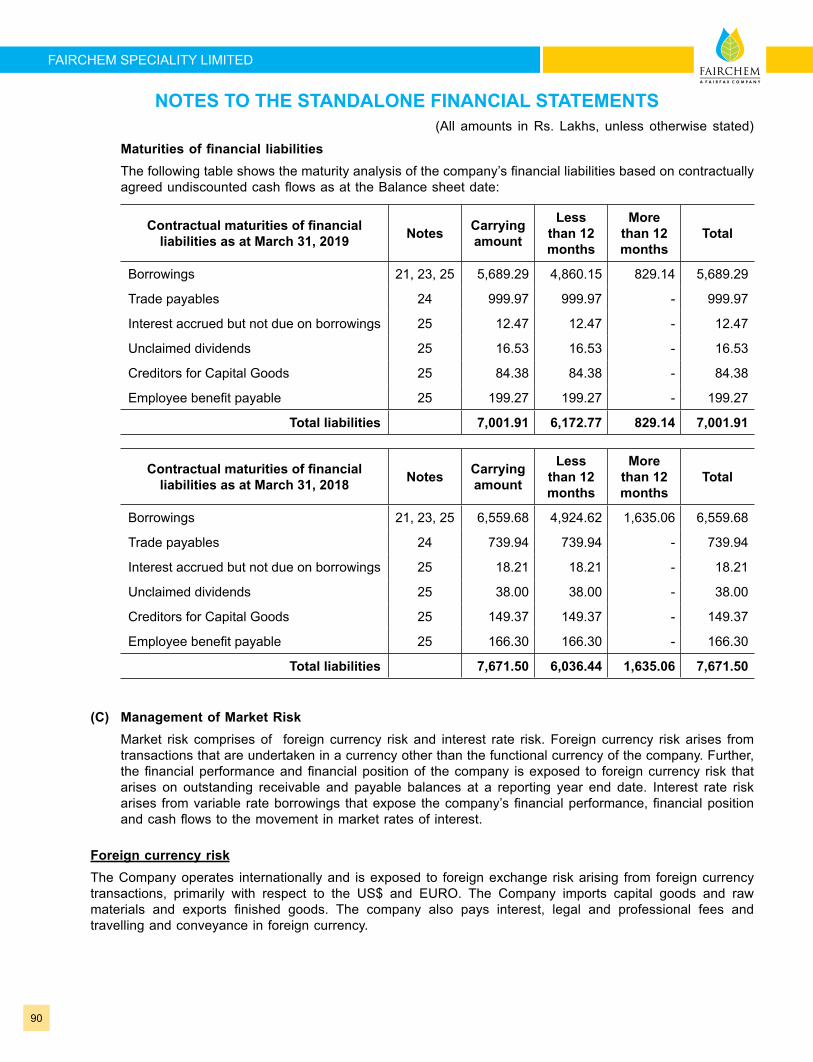
90
FAIRCHEM SPECIALITY LIMITED
Maturities of financial liabilities The following table shows the maturity analysis of the company’s financial liabilities based on contractually
agreed undiscounted cash flows as at the Balance sheet date:
Contractual maturities of financial liabilities as at March 31, 2019 Notes Carrying
amount
Less than 12 months
More than 12 months
Total
Borrowings 21, 23, 25 5,689.29 4,860.15 829.14 5,689.29
Trade payables 24 999.97 999.97 - 999.97
Interest accrued but not due on borrowings 25 12.47 12.47 - 12.47
Unclaimed dividends 25 16.53 16.53 - 16.53
Creditors for Capital Goods 25 84.38 84.38 - 84.38
Employee benefit payable 25 199.27 199.27 - 199.27
Total liabilities 7,001.91 6,172.77 829.14 7,001.91
Contractual maturities of financial liabilities as at March 31, 2018 Notes Carrying
amount
Less than 12 months
More than 12 months
Total
Borrowings 21, 23, 25 6,559.68 4,924.62 1,635.06 6,559.68
Trade payables 24 739.94 739.94 - 739.94
Interest accrued but not due on borrowings 25 18.21 18.21 - 18.21
Unclaimed dividends 25 38.00 38.00 - 38.00
Creditors for Capital Goods 25 149.37 149.37 - 149.37
Employee benefit payable 25 166.30 166.30 - 166.30
Total liabilities 7,671.50 6,036.44 1,635.06 7,671.50
(C) Management of Market Risk Market risk comprises of foreign currency risk and interest rate risk. Foreign currency risk arises from
transactions that are undertaken in a currency other than the functional currency of the company. Further, the financial performance and financial position of the company is exposed to foreign currency risk that arises on outstanding receivable and payable balances at a reporting year end date. Interest rate risk arises from variable rate borrowings that expose the company’s financial performance, financial position and cash flows to the movement in market rates of interest.
Foreign currency risk The Company operates internationally and is exposed to foreign exchange risk arising from foreign currency
transactions, primarily with respect to the US$ and EURO. The Company imports capital goods and raw materials and exports finished goods. The company also pays interest, legal and professional fees and travelling and conveyance in foreign currency.
NOTES TO THE STANDALONE FINANCIAL STATEMENTS(All amounts in Rs. Lakhs, unless otherwise stated)
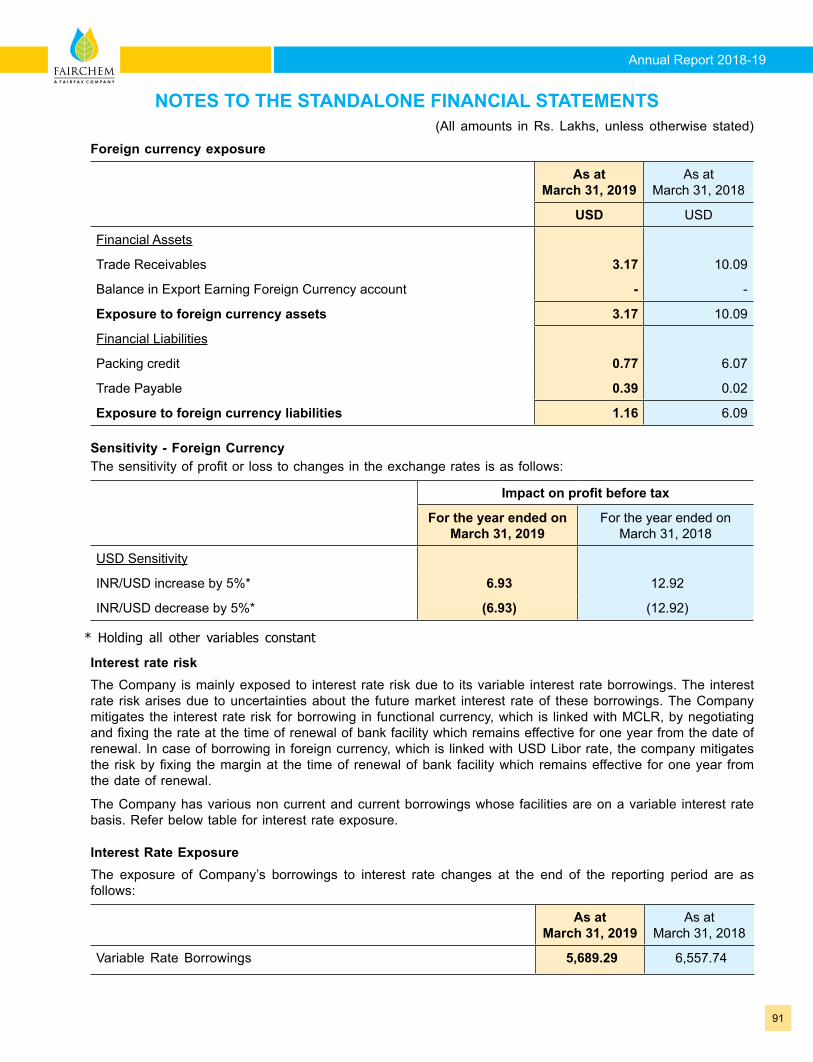
Annual Report 2018-19
91
Foreign currency exposure
As at March 31, 2019
As at March 31, 2018
USD USD
Financial Assets
Trade Receivables 3.17 10.09
Balance in Export Earning Foreign Currency account - -
Exposure to foreign currency assets 3.17 10.09
Financial Liabilities
Packing credit 0.77 6.07
Trade Payable 0.39 0.02
Exposure to foreign currency liabilities 1.16 6.09
Sensitivity - Foreign Currency The sensitivity of profit or loss to changes in the exchange rates is as follows:
Impact on profit before tax
For the year ended on March 31, 2019
For the year ended on March 31, 2018
USD Sensitivity
INR/USD increase by 5%* 6.93 12.92
INR/USD decrease by 5%* (6.93) (12.92)
* Holding all other variables constant
Interest rate risk The Company is mainly exposed to interest rate risk due to its variable interest rate borrowings. The interest
rate risk arises due to uncertainties about the future market interest rate of these borrowings. The Company mitigates the interest rate risk for borrowing in functional currency, which is linked with MCLR, by negotiating and fixing the rate at the time of renewal of bank facility which remains effective for one year from the date of renewal. In case of borrowing in foreign currency, which is linked with USD Libor rate, the company mitigates the risk by fixing the margin at the time of renewal of bank facility which remains effective for one year from the date of renewal.
The Company has various non current and current borrowings whose facilities are on a variable interest rate basis. Refer below table for interest rate exposure.
Interest Rate Exposure The exposure of Company’s borrowings to interest rate changes at the end of the reporting period are as
follows:
As at March 31, 2019
As at March 31, 2018
Variable Rate Borrowings 5,689.29 6,557.74
NOTES TO THE STANDALONE FINANCIAL STATEMENTS(All amounts in Rs. Lakhs, unless otherwise stated)
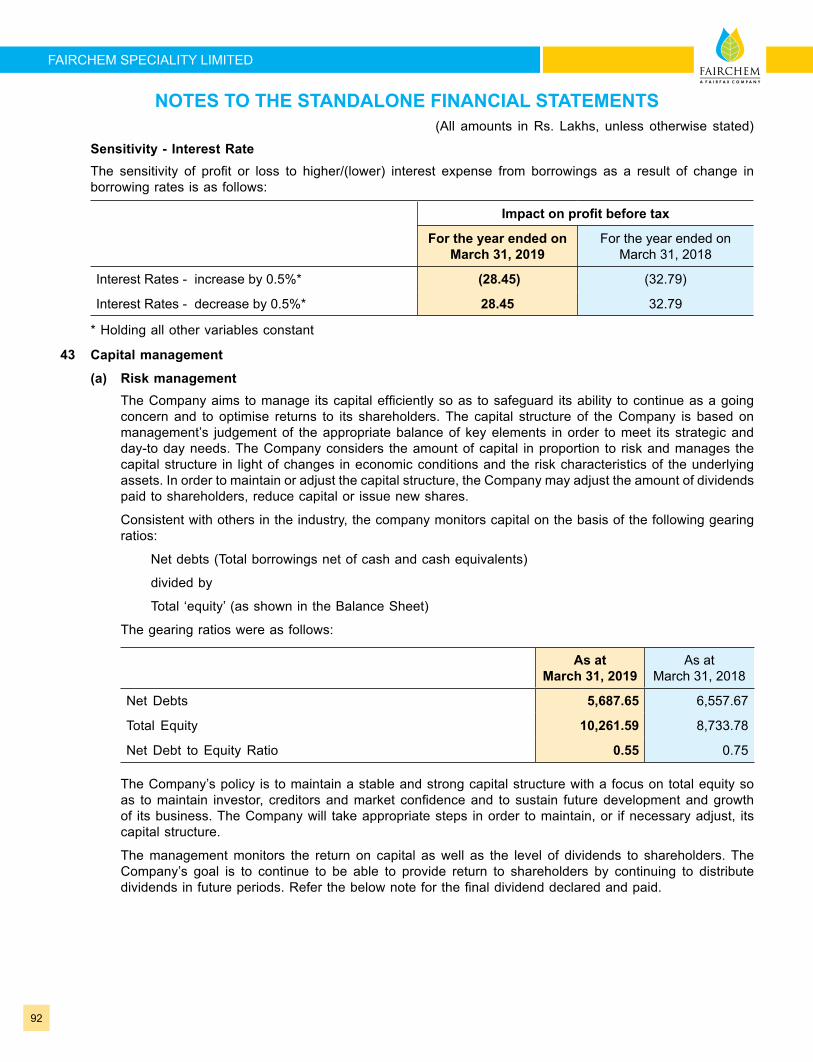
92
FAIRCHEM SPECIALITY LIMITED
Sensitivity - Interest Rate The sensitivity of profit or loss to higher/(lower) interest expense from borrowings as a result of change in
borrowing rates is as follows:
Impact on profit before tax
For the year ended on March 31, 2019
For the year ended on March 31, 2018
Interest Rates - increase by 0.5%* (28.45) (32.79)
Interest Rates - decrease by 0.5%* 28.45 32.79
* Holding all other variables constant
43 Capital management
(a) Risk management The Company aims to manage its capital efficiently so as to safeguard its ability to continue as a going
concern and to optimise returns to its shareholders. The capital structure of the Company is based on management’s judgement of the appropriate balance of key elements in order to meet its strategic and day-to day needs. The Company considers the amount of capital in proportion to risk and manages the capital structure in light of changes in economic conditions and the risk characteristics of the underlying assets. In order to maintain or adjust the capital structure, the Company may adjust the amount of dividends paid to shareholders, reduce capital or issue new shares.
Consistent with others in the industry, the company monitors capital on the basis of the following gearing ratios:
Net debts (Total borrowings net of cash and cash equivalents)
divided by
Total ‘equity’ (as shown in the Balance Sheet)
The gearing ratios were as follows:
As at March 31, 2019
As at March 31, 2018
Net Debts 5,687.65 6,557.67
Total Equity 10,261.59 8,733.78
Net Debt to Equity Ratio 0.55 0.75
The Company’s policy is to maintain a stable and strong capital structure with a focus on total equity so as to maintain investor, creditors and market confidence and to sustain future development and growth of its business. The Company will take appropriate steps in order to maintain, or if necessary adjust, its capital structure.
The management monitors the return on capital as well as the level of dividends to shareholders. The Company’s goal is to continue to be able to provide return to shareholders by continuing to distribute dividends in future periods. Refer the below note for the final dividend declared and paid.
NOTES TO THE STANDALONE FINANCIAL STATEMENTS(All amounts in Rs. Lakhs, unless otherwise stated)
Annual Report 2018-19
93
(b) Dividend
For the year ended on
March 31, 2019
For the year ended on
March 31, 2018
Equity shares
Final dividend for the year ended March 31, 2018 - INR 1.50 (March 31, 2017- INR 1) per fully paid up share
564.15 376.10
Dividends not recognised at the end of the reporting period
In addition to the above dividends, since year end, the directors have recommended the payment of a final dividend of INR 2.50 per fully paid equity share (March 31, 2018 – INR 1.50 per fully paid up share). This proposed dividend is subject to the approval of shareholders in the ensuing annual general meeting.
976.57 564.15
44 Related party disclosures
(a) Relationships Promoter Group FIH Mauritius Investments Limited, Republic of Mauritius (FMIL) FIH Private Investments Limited, Mauritius (FMIL is wholly owned and controlled by Fairfax India Holdings Corporation, Canada) Subsidiaries Privi Organics India Limited, India Privi Biotechnologies Private Limited, India * Privi Organics USA Inc, USA * Fairchem Organics Limited (w.e.f. March 27, 2019)
Associates Minar Organics Private Limited, India (up to March 21, 2018) *
*Investment held through subsidiary companies pursuant to the scheme of arrangement
Other Related Parties with whom transactions have taken place during the year Fairfreight Lines Private Limited
Key Management Personnel: Mr. Nahoosh Jariwala Managing Director Mr. Mahesh Babani Managing Director
Post employment benefit plan Adi Finechem Limited Employees Group Gratuity Assurance Scheme
NOTES TO THE STANDALONE FINANCIAL STATEMENTS(All amounts in Rs. Lakhs, unless otherwise stated)
94
FAIRCHEM SPECIALITY LIMITED
The nature and volume of transactions carried out and balances with related parties in the ordinary course of business are as follows:
Transactions
Name of the related party and nature of the relationshipFor the year
ended on March 31, 2019
For the year ended on
March 31, 2018
Subsidiariesa) Management fees income Privi Organics India Limited 50.00 18.75
b) Share Application Money Fairchem Organics Limited 1.00 -
Other Related Partiesa) Freight Expenses Fairfreight Lines Private Limited 3.73 -
Key Management Personnel:a) Remuneration Mr. Nahoosh Jariwala 144.00 144.00
Balances
Name of the related party and nature of the relationship
As at March 31, 2019
As at March 31, 2018
Key Management Personnel:
Mr. Nahoosh Jariwala(Net of Tax Deducted at Source)
8.25 8.25
Other Related Parties
Fairfreight Lines Private Limited 0.47 -
Terms and Conditions1) Transactions with related parties are at normal commercial terms.2) All outstanding balances are unsecured and payable in cash.
45 Contingent Liabilities and commitments
As at March 31, 2019
As at March 31, 2018
(a) Contingent liabilitiesClaims against the Company not acknowledged as debt 15.00 15.00
Disputed Custom Duty liability - 5.20
Disputed excise and service tax liability 48.77 50.78
Disputed Value added tax and Central Sales Tax liability 12.93 12.93
Total 76.70 83.91
NOTES TO THE STANDALONE FINANCIAL STATEMENTS(All amounts in Rs. Lakhs, unless otherwise stated)
Annual Report 2018-19
95
The Company is in the process of evaluating the impact of the recent Supreme Court Judgment in case of “Vivekananda Vidyamandir And Others Vs The Regional Provident Fund Commissioner (II) West Bengal” and the related circular (Circular No. C-I/1(33)2019/Vivekananda Vidya Mandir/284) dated March 20, 2019 issued by the Employees’ Provident Fund Organisation in relation to non-exclusion of certain allowances from the definition of “basic wages” of the relevant employees for the purposes of determining contribution to provident fund under the Employees’ Provident Funds & Miscellaneous Provisions Act, 1952. In the assessment of the management which is supported by legal advice, the aforesaid matter is not likely to have a significant impact and accordingly, no provision has been made in these Financial Statements.
The company is contesting the demands and the management believes that its position is likely to be upheld in the appellate process. It is not practicable to estimate the timing of cash outflows, if any in respect of legal matters, pending resolution of the proceedings with the appellate authorities.
As at March 31, 2019
As at March 31, 2018
(b) Capital Commitments Estimated value of contracts in capital account remaining to be executed
1013.09 243.08
Total 1,013.09 243.08
46 Events occurring after reporting period The Company evaluated subsequent events through May 9, 2019, the date the financial statements were
available for issuance, and determined that there were no additional material subsequent events requiring disclosure.
47 Assets hypothecated and/or mortgaged as security The carrying amounts of assets hypothecated and / or mortgaged as security for borrowings are:
Notes As at March 31, 2019
As at March 31, 2018
Non-CurrentNon-financial assetsLand (Freehold) 4 63.10 63.10 Building 4 1,997.93 1,826.60 Plant and Machinery 4 8,538.91 7,434.21 Vehicles 4 - 11.70 Total non-current assets hypothecated and / or mortgaged as security
10,599.94 9,335.61
CurrentNon-financial assetsInventories 11 3,400.62 3,042.72 Financial assetsTrade receivables 12 3,213.13 3,202.63 Total current assets hypothecated and / or mortgaged as security
6,613.75 6,245.35
48 Segment reporting In accordance with Ind AS -108 ‘Operating Segment’, segment information has been given in the Consolidated
Financial Statements of Fairchem Speciality Limited, and therefore, no separate disclosure on segment information is given in the Standalone Financial Statements.
NOTES TO THE STANDALONE FINANCIAL STATEMENTS(All amounts in Rs. Lakhs, unless otherwise stated)
96
FAIRCHEM SPECIALITY LIMITED
49 Leases
Company as lessee The Company had entered into cancellable lease agreement for Corporate office premises for a period of nine
years which commenced from September 7, 2013. As at December 15, 2018, the Company has terminated the said lease agreement. The lease rentals aggregating Rs. 24.44 Lakhs (Previous Year Rs. 34.50 Lakhs) have been included under the head “Other Expenses” Note 36 “Rent, rates and taxes” of Statement of Profit and Loss.
50 Ind AS 115 – Revenue from Contracts with Customers The Company has adopted Ind-AS 115 “Revenue from Contracts with Customers” which is effective from April
1, 2018. The Company has opted for modified retrospective approach and accordingly, reviewed its existing customer contracts in this regard.
Management has used judgement in respect of matters such as identification of performance obligations; allocation of consideration to identified performance obligations and recognition of revenue over a period of time or at a point in time based on timing when control is transferred to customer.
The adoption of this standard does not have any material impact to the standalone financial statements of the Company.
(A) The Company is primarily in the Business of manufacture and sale of Speciality Oleo Chemicals. All sales are made at a point in time and revenue recognised upon satisfaction of the performance obligations which is typically upon dispatch or delivery. The Company has a credit evaluation policy based on which the credit limits for the trade receivables are established. The Company does not give significant credit period resulting in no significant financing component.
(B) Reconciliation of revenue recognised from Contract liability:
As at March 31, 2019
As at March 31, 2018
Opening Contract liability 33.13 100.04
Less: Recognised as revenue during the year (962.09) (1,121.58)
Add: Addition to contract liability during the year 965.21 1,055.54
Add: Other Adjustments (0.83) (0.87)
Closing Contract liability 35.42 33.13
(C) Reconciliation of revenue as per contract price and as recognised in statement of profit and loss:
For the year ended on
March 31, 2019
For the year ended on
March 31, 2018
Revenue from contract with customer as per Contract price 25,039.32 24,339.90
Less: Discounts and incentives (6.61) (14.08)
Less:- Sales Returns /Credits / Reversals (187.11) (203.34)
Revenue from contract with customer as per statement of profit and loss 24,845.60 24,122.48
NOTES TO THE STANDALONE FINANCIAL STATEMENTS
Annual Report 2018-19
97
Disaggregation of Revenue from contract with customers
For the year ended on
March 31, 2019
For the year ended on
March 31, 2018
India 22,247.75 21,436.93
Middle East 519.84 100.60
North America 2,078.01 2,584.95
Revenue from contract with customer as per statement of profit and loss 24,845.60 24,122.48
NOTES TO THE STANDALONE FINANCIAL STATEMENTS
For Price Waterhouse & Co Chartered Accountants LLP For and on behalf of the BoardChartered Accountants Firm Registration No.: 304026E/ E-300009
Priyanshu Gundana Nahoosh Jariwala Mahesh BabaniPartner Managing Director Managing DirectorMembership No. 109553 DIN: 00012412 DIN: 00051162
Rajen N. Jhaveri Chief Financial Officer & Company Secretary
Place : Mumbai Place : MumbaiDate : May 09, 2019 Date : May 09, 2019
98
FAIRCHEM SPECIALITY LIMITED
Independent Auditors’ ReportTo the Members of
FAIRCHEM SPECIALITY LIMITED
Report on the Consolidated Ind AS Financial Statements
Opinion
1. We have audited the accompanying Consolidated Ind AS financial statements of Fairchem Speciality Limited (hereinafter referred to as the ‘Holding Company”) and its subsidiaries (Holding Company and its subsidiaries together referred to as “the Group”), (refer Note 2 to the attached consolidated Ind AS financial statements), which comprise the consolidated Balance Sheet as at March 31, 2019, and the consolidated Statement of Profit and Loss (including Other Comprehensive Income), the consolidated statement of changes in equity and the consolidated statement of cash flows for the year then ended, and notes to the Consolidated Ind AS financial statements, including a summary of significant accounting policies and other explanatory information prepared based on the relevant records.(hereinafter referred to as “the consolidated financial statements”)
2. In our opinion and to the best of our information and according to the explanations given to us, the aforesaid Consolidated Ind AS financial statements give the information required by the Companies Act, 2013 (“the Act”) in the manner so required and give a true and fair view in conformity with the accounting principles generally accepted in India, of the consolidated state of affairs of the Group as at March 31, 2019, of consolidated total comprehensive income (comprising profit and other comprehensive income), consolidated changes in equity and its consolidated cash flows for the year then ended.
Basis for opinion
3. We conducted our audit in accordance with the Standards on Auditing (SAs) specified under section 143(10) of the Act. Our responsibilities under those Standards are further described in the Auditor’s Responsibilities for the Audit of the Consolidated Financial Statements section of our report.We are independent of the Group in accordance with the ethical requirements that are relevant to our audit of the consolidated financial statements in India in terms of the Code of Ethics issued by ICAI and the relevant provisions of the Act, and we have fulfilled our other ethical responsibilities in accordance with these requirements. We believe that the audit evidence we have obtained and the audit evidence obtained by the other auditors in terms of their reports referred to in sub-paragraph 16 of the Other Matter paragraph below, is sufficient and appropriate to provide a basis for our opinion.
Emphasis of Matter
4. We draw your attention to the following paragraph included in the audit report on the consolidated Ind As financial statements of Privi Organics India Limited (a subsidiary of the Company) and its subsidiaries, issued by another firm of Chartered Accountants vide its report dated May 09, 2019:
“We draw attention to Note 39 to the consolidated financial statements, which describes the effect of fire in the Company. Our opinion is not qualified in respect of this matter.”
[Note 39 as described above is reproduced as note 47 to the consolidated Ind As financial statements.]
Key audit matters
5. Key audit matters are those matters that, in our professional judgment, were of most significance in our audit of the consolidated Ind AS financial statements of the current period. These matters were addressed in the context of our audit of the consolidated Ind AS financial statements as a whole, and in forming our opinion thereon, and we do not provide a separate opinion on these matters.
Consolidated | Annual Report 2018-19
99
Key audit matter How our audit addressed the key audit matter
Revenue Recognition
Refer to Notes 2 (d), 30 and 50 to the Consolidated Ind AS financial statements.
The Holding Company has adopted Ind-AS 115 “Revenue from Contracts with Customers” which is effective from April 1, 2018. The Holding Company has opted for modified retrospective approach and accordingly, reviewed its existing customer contracts in this regard.
Management has used judgement in respect of matters such as identification of performance obligations; allocation of consideration to identified performance obligations and recognition of revenue over a period of time or at a point in time based on timing when control is transferred to customer.
We focused on this area as revenue is required to be recognised in accordance with the terms of the customer contracts, which involves significant management judgements as described above and thus there is an inherent risk of material misstatement; and further, additional disclosures are required to be made in the year of adoption in accordance with the applicable accounting standards.
Our testing of revenue transactions was designed to cover certain customer contracts. Our audit procedures included the following:
• Understanding, evaluating the design and testing the operating effectiveness of controls over revenue recognition.
• Assessing appropriateness of management’s significant judgements in accounting for identified contracts such as identification of performance obligation and allocation of consideration to identified performance obligation;
• Evaluating the contract terms for assessment of the timing of transfer of control to the customer to assess whether revenue is recognised appropriately over a period of time or at a point in time (as the case may be) based on timing when control is transferred to customer
• Testing whether the revenue recognition is in line with the terms of customer contracts and the transfer of control;
• Testing of journal entries for unusual/irregular revenue transactions; and
• Evaluating adequacy of the presentation and disclosures
Based on the above stated procedures, no significant exceptions were noted in revenue recognition including those relating to presentation and disclosures.

100
FAIRCHEM SPECIALITY LIMITED
6. The following Key Audit Matter and related audit procedures (as reproduced) were communicated by auditors of Privi Organics India Limited, a subsidiary of the Holding Company:
Key audit matter How our audit addressed the key audit matterValuation of work-in-progress and finished goods inventory –
The company has work-in-progress (WIP) inventory of Rs. 6,186.55 lakhs and finished goods inventory (including goods in transit) of Rs. 7327.70 lakhs as at 31 March 2019.
The valuation of WIP and finished goods is considered to be a key audit matter due to the significant judgement and estimates required to be exercised by the management in respect of determining the purity and recovery factors, the process weight allocation for apportionment of overheads, and allocation of costs to intermediate products in arriving at the value of inventory.
In view of the significance of the matter, we applied the following audit procedures in this area, among others, to obtain sufficient appropriate audit evidence :
• Compared rates of raw materials, finished goods, and overheads with the previous periods to assess the reasonableness and in case of variances noted, reasons which could be co-related to other audit evidence.
• Assessed the reasonableness of key assumptions made by the management for purity/ recovery factors, process weight, cost allocations in line with past period and in case of any variations, obtained explanation from the management which corroborate with our knowledge of the business and other audit evidences.
• Reviewed the overheads allocation to verify that the same is in line with the normal capacity of the production facilities and is comparable to the previous periods and variances are appropriately explained in line with our understanding of operations.
• Reviewed the subsequent conversion of WIP in to finished goods.
Other Information7. The Holding Company’s Board of Directors is responsible for the other information. The other information
comprises the information included in the annual report, but does not include the consolidated Ind AS financial statements and our auditor’s report thereon.
Our opinion on the consolidated Ind AS financial statements does not cover the other information and we do not express any form of assurance conclusion thereon.
In connection with our audit of the Consolidated Ind AS financial statements, our responsibility is to read the other information and, in doing so, consider whether the other information is materially inconsistent with the consolidated Ind AS financial statements or our knowledge obtained in the audit or otherwise appears to be materially misstated. If, based on the work we have performed and the reports of the other auditors as furnished to us (Refer paragraph 16 below), we conclude that there is a material misstatement of this other information, we are required to report that fact. We have nothing to report in this regard.
Responsibilities of Management and Those Charged with Governance for the Consolidated Ind AS Financial Statements
8. The Holding Company’s Board of Directors is responsible for the preparation and presentation of these consolidated financial statements in terms of the requirements of the Act that give a true and fair view of the consolidated financial position, consolidated financial performance and consolidated cash flows, and changes in equity of the Group in accordance with the accounting principles generally accepted in India, including the Accounting Standards specified under section 133 of the Act. The respective Board of Directors of the companies included in the Group are responsible for maintenance of adequate accounting records in accordance with the provisions of the Act for safeguarding the assets of the Group and for preventing and detecting frauds and other irregularities; selection and application of appropriate accounting policies; making judgments and estimates that are reasonable and prudent; and the design, implementation and maintenance of adequate internal financial controls, that were operating effectively for ensuring accuracy and completeness of the accounting records, relevant to the preparation and presentation of the financial statements that give a true and fair view and are free from material misstatement, whether due to fraud or error, which have been
Consolidated | Annual Report 2018-19
101
used for the purpose of preparation of the consolidated financial statements by the Directors of the Holding Company, as aforesaid.
9. In preparing the consolidated Ind AS financial statements, the respective Board of Directors of the companies included in the Group are responsible for assessing the ability of the Group to continue as a going concern, disclosing, as applicable, matters related to going concern and using the going concern basis of accounting unless management either intends to liquidate the Group or to cease operations, or has no realistic alternative but to do so.
10. The respective Board of Directors of the companies included in the Group are responsible for overseeing the financial reporting process of the Group.
Auditor’s responsibilities for the audit of the Consolidated Ind AS Financial Statements11. Our objectives are to obtain reasonable assurance about whether the consolidated Ind AS financial statements
as a whole are free from material misstatement, whether due to fraud or error, and to issue an auditor’s report that includes our opinion. Reasonable assurance is a high level of assurance, but is not a guarantee that an audit conducted in accordance with SAs will always detect a material misstatement when it exists. Misstatements can arise from fraud or error and are considered material if, individually or in the aggregate, they could reasonably be expected to influence the economic decisions of users taken on the basis of these Consolidated Ind AS financial statements.
12. As part of an audit in accordance with SAs, we exercise professional judgment and maintain professional scepticism throughout the audit. We also:
• Identify and assess the risks of material misstatement of the consolidated financial statements, whether due to fraud or error, design and perform audit procedures responsive to those risks, and obtain audit evidence that is sufficient and appropriate to provide a basis for our opinion. The risk of not detecting a material misstatement resulting from fraud is higher than for one resulting from error, as fraud may involve collusion, forgery, intentional omissions, misrepresentations, or the override of internal control.
• Obtain an understanding of internal control relevant to the audit in order to design audit procedures that are appropriate in the circumstances. Under section 143(3)(i) of the Act, we are also responsible for expressing our opinion on whether the Holding company has adequate internal financial controls with reference to financial statements in place and the operating effectiveness of such controls
• Evaluate the appropriateness of accounting policies used and the reasonableness of accounting estimates and related disclosures made by management.
• Conclude on the appropriateness of management’s use of the going concern basis of accounting and, based on the audit evidence obtained, whether a material uncertainty exists related to events or conditions that may cast significant doubt on the ability of the Group to continue as a going concern. If we conclude that a material uncertainty exists, we are required to draw attention in our auditor’s report to the related disclosures in the consolidated financial statements or, if such disclosures are inadequate, to modify our opinion. Our conclusions are based on the audit evidence obtained up to the date of our auditor’s report. However, future events or conditions may cause the Group to cease to continue as a going concern.
• Evaluate the overall presentation, structure and content of the consolidated Ind AS financial statements, including the disclosures, and whether the consolidated Ind AS financial statements represent the underlying transactions and events in a manner that achieves fair presentation.
• Obtain sufficient appropriate audit evidence regarding the financial information of the entities or business activities within the Group to express an opinion on the consolidated Ind AS financial statements. We are responsible for the direction, supervision and performance of the audit of the financial statements of such entities included in the consolidated financial statements of which we are the independent auditors. For the other entities included in the consolidated financial statements, which have been audited by other auditors, such other auditors remain responsible for the direction, supervision and performance of the audits carried out by them. We remain solely responsible for our audit opinion.
13. We communicate with those charged with governance of the Holding Company and such other entities included in the consolidated financial statements of which we are the independent auditors regarding, among other matters, the planned scope and timing of the audit and significant audit findings, including any significant deficiencies in internal control that we identify during our audit.
102
FAIRCHEM SPECIALITY LIMITED
14. We also provide those charged with governance with a statement that we have complied with relevant ethical requirements regarding independence, and to communicate with them all relationships and other matters that may reasonably be thought to bear on our independence, and where applicable, related safeguards.
15. From the matters communicated with those charged with governance, we determine those matters that were of most significance in the audit of the consolidated Ind AS financial statements of the current period and are therefore the key audit matters. We describe these matters in our auditor’s report unless law or regulation precludes public disclosure about the matter or when, in extremely rare circumstances, we determine that a matter should not be communicated in our report because the adverse consequences of doing so would reasonably be expected to outweigh the public interest benefits of such communication.
Other Matter16. We did not audit the financial statements of three subsidiaries whose financial statements reflect total assets
of Rs. 123,796.65 lakhs and net assets of Rs. 47,305.27 lakhs as at March 31, 2019, total revenue of Rs. 109,117.04 lakhs, total comprehensive income (comprising of profit and other comprehensive income) of Rs 7,652.51 lakhs and net cash flows amounting to Rs. 413.17 lakhs for the year ended on that date, as considered in the consolidated Ind AS financial statements. These financial statements have been audited by other auditors whose reports have been furnished to us by the Management, and our opinion on the consolidated Ind AS financial statements in so far as it relates to the amounts and disclosures included in respect of these subsidiaries and our report in terms of sub-section (3) of Section 143 of the Act including report on Other Information in so far as it relates to the aforesaid subsidiaries, is based solely on the reports of the other auditors.
Our opinion on the consolidated Ind AS financial statements and our report on Other Legal and Regulatory Requirements below, is not modified in respect of the above matters with respect to our reliance on the work done and the reports of the other auditors.
Report on other legal and regulatory requirements
17. As required by Section 143(3) of the Act, we report, to the extent applicable, that: a) We have sought and obtained all the information and explanations which to the best of our knowledge
and belief were necessary for the purposes of our audit of the aforesaid consolidated Ind As financial statements.
b) In our opinion, proper books of account as required by law relating to preparation of aforesaid consolidated Ind AS financial statements have been kept so far as it appears from our examination of those books and the reports of other auditors.
c) The Consolidated Balance Sheet, the Consolidated Statement of Profit and Loss (including other comprehensive income), the Consolidated Statement of Changes in Equity and the Consolidated Cash Flow Statement dealt with by this Report are in agreement with the relevant books of account and records maintained for the purpose of preparation of the Consolidated Ind AS financial statements.
d) In our opinion, the aforesaid Consolidated Ind AS financial statements comply with the Accounting Standards specified under Section 133 of the Act.
e) On the basis of the written representations received from the directors of the Holding Company as on March 31, 2019 taken on record by the Board of Directors of the Holding Company and the reports of the statutory auditor of its subsidiary companies incorporated in India, none of the directors of the Group companies incorporated in India is disqualified as on March 31, 2019 from being appointed as a director in terms of Section 164 (2) of the Act.
f) With respect to the adequacy of the internal financial controls with reference to financials statements of the Group and the operating effectiveness of such controls, refer to our separate Report in “Annexure A”.
g) With respect to the other matters to be included in the Auditor’s Report in accordance with Rule 11 of the Companies (Audit and Auditors) Rules, 2014, in our opinion and to the best of our information and according to the explanations given to us:
i. The Consolidated Ind AS financial statements disclose the impact, if any, of pending litigations on its consolidated financial position of the Group– Refer Note 45 to the Consolidated Ind AS financial statements;
Consolidated | Annual Report 2018-19
103
ii. Provision has been made in the Consolidated Ind AS financial statements, as required under applicable law or accounting standards, for material foreseeable losses, if any, on long term contracts including derivative contracts as at March 31, 2019 – Refer note 25 to the Consolidated Ind AS financial statements in respect of such items as it relates to the Group;
iii. There has been no delay in transferring amounts, required to be transferred, to the Investor Education and Protection Fund by the Holding Company and its subsidiary companies, incorporated in India during the year ended March 31, 2019;
iv. The reporting on disclosures relating to Specified Bank Notes is not applicable to the Group for the year ended March 31, 2019.
For Price Waterhouse & Co Chartered Accountants LLP Chartered Accountants
Firm Registration Number:304026E/ E-300009
Priyanshu Gundana Place: Mumbai Partner Date: May 9, 2019 Membership Number: 109553
104
FAIRCHEM SPECIALITY LIMITED
“Annexure A” to Independent Auditors’ Report Referred to in paragraph 17(f) of the Independent Auditors’ Report of even date to the members of Fairchem Speciality Limited on the consolidated Ind AS financial statements for the year ended March 31, 2019
Report on the Internal Financial Controls with reference to financial statements under Clause (i) of Sub-section 3 of Section 143 of the Act1. In conjunction with our audit of the consolidated Ind AS financial statements of the Company as of and for
the year ended March 31, 2019, we have audited the internal financial controls with reference to financial statements of Fairchem Speciality Limited (hereinafter referred to as “the Holding Company”) and its subsidiary companies which are companies incorporated in India, as of that date.
Management’s Responsibility for Internal Financial Controls2. The respective Board of Directors of the Holding company and its subsidiary companies, to whom reporting
under clause (i) of sub section 3 of Section 143 of the Act in respect of the adequacy of the internal financial controls with reference to financial statements is applicable, which are companies incorporated in India, are responsible for establishing and maintaining internal financial controls based on internal controls over financial reporting criteria established by the Company considering the essential components of internal control stated in the Guidance Note on Audit of Internal Financial Controls Over Financial Reporting criteria issued by the Institute of Chartered Accountants of India (ICAI). These responsibilities include the design, implementation and maintenance of adequate internal financial controls that were operating effectively for ensuring the orderly and efficient conduct of its business, including adherence to the respective company’s policies, the safeguarding of its assets, the prevention and detection of frauds and errors, the accuracy and completeness of the accounting records, and the timely preparation of reliable financial information, as required under the Act.
Auditor’s Responsibility3. Our responsibility is to express an opinion on the Holding Company’s internal financial controls with reference to
financial statements based on our audit. We conducted our audit in accordance with the Guidance Note on Audit of Internal Financial Controls With Reference to Financial Statements (the “Guidance Note”) issued by the ICAI and the Standards on Auditing deemed to be prescribed under section 143(10) of the Companies Act, 2013, to the extent applicable to an audit of internal financial controls, both applicable to an audit of internal financial controls and both issued by the ICAI. Those Standards and the Guidance Note require that we comply with ethical requirements and plan and perform the audit to obtain reasonable assurance about whether adequate internal financial controls with reference to financial statements was established and maintained and if such controls operated effectively in all material respects.
4. Our audit involves performing procedures to obtain audit evidence about the adequacy of the internal financial controls with reference to financial statements and their operating effectiveness. Our audit of internal financial controls with reference to financial statements included obtaining an understanding of internal financial controls with reference to financial statements, assessing the risk that a material weakness exists, and testing and evaluating the design and operating effectiveness of internal control based on the assessed risk. The procedures selected depend on the auditor’s judgement, including the assessment of the risks of material misstatement of the financial statements, whether due to fraud or error.
5. We believe that the audit evidence we have obtained and the audit evidence obtained by the other auditors in terms of their reports referred to in the Other Matters paragraph below, is sufficient and appropriate to provide a basis for our audit opinion on the Company’s internal financial controls with reference to financial statements.
Meaning of Internal Financial Controls with reference to financial statements6. A company’s internal financial control with reference to financial statements is a process designed to provide
reasonable assurance regarding the reliability of financial reporting and the preparation of financial statements for external purposes in accordance with generally accepted accounting principles. A company’s internal financial controls with reference to financial statements includes those policies and procedures that (1) pertain to the maintenance of records that, in reasonable detail, accurately and fairly reflect the transactions and dispositions of the assets of the company; (2) provide reasonable assurance that transactions are recorded as necessary to permit preparation of financial statements in accordance with generally accepted accounting principles, and that receipts and expenditures of the company are being made only in accordance with authorisations of management and directors of the company; and (3) provide reasonable assurance regarding prevention or timely detection of unauthorised acquisition, use, or disposition of the company’s assets that could have a material effect on the financial statements.
Consolidated | Annual Report 2018-19
105
Inherent Limitations of Internal Financial Controls with reference to financial statements 7. Because of the inherent limitations of internal financial controls with reference to financial statements, including
the possibility of collusion or improper management override of controls, material misstatements due to error or fraud may occur and not be detected. Also, projections of any evaluation of the internal financial controls with reference to financial statements to future periods are subject to the risk that the internal financial control with reference to financial statements may become inadequate because of changes in conditions, or that the degree of compliance with the policies or procedures may deteriorate.
Opinion8. In our opinion, the Holding Company and its subsidiary companies, which are companies incorporated in India,
have, in all material respects, adequate internal financial controls with reference to financial statements and such internal financial controls with reference to financial statements were operating effectively as at March 31, 2019, based on the internal control over financial reporting criteria established by the Company considering the essential components of internal control stated in the Guidance Note on Audit of Internal Financial Controls Over Financial Reporting issued by the Institute of Chartered Accountants of India.
Other Matters9. Our aforesaid reports under Section 143(3)(i) of the Act on the adequacy and operating effectiveness of
the internal financial controls with reference to financial statements insofar as it relates to two subsidiary companies, which are companies incorporated in India, is based on the corresponding reports of the auditors of such companies incorporated in India. Our opinion is not qualified in respect of this matter.
For Price Waterhouse & Co Chartered Accountants LLP Chartered Accountants
Firm Registration Number : 304026E/ E-300009
Priyanshu Gundana Place: Mumbai Partner Date: May 09, 2019 Membership Number: 109553
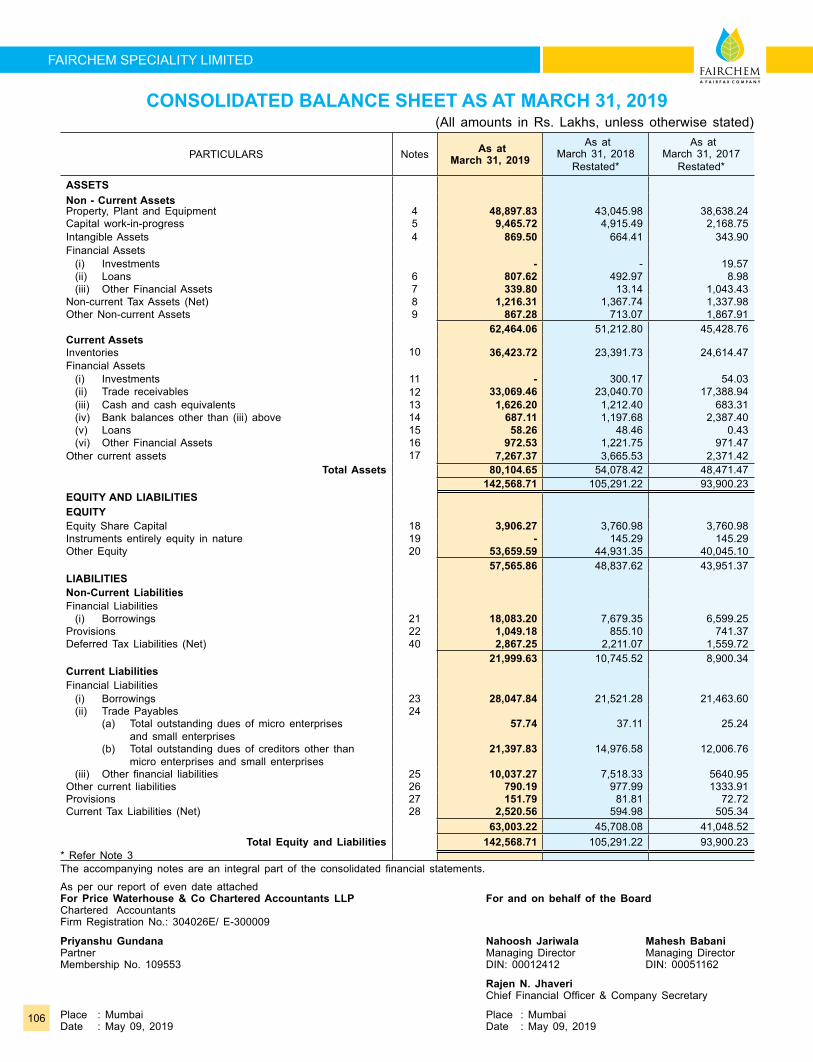
106
FAIRCHEM SPECIALITY LIMITED
CONSOLIDATED BALANCE SHEET AS AT MARCH 31, 2019(All amounts in Rs. Lakhs, unless otherwise stated)
PARTICULARS Notes As atMarch 31, 2019
As atMarch 31, 2018
Restated*
As atMarch 31, 2017
Restated*
ASSETSNon - Current AssetsProperty, Plant and Equipment 4 48,897.83 43,045.98 38,638.24 Capital work-in-progress 5 9,465.72 4,915.49 2,168.75 Intangible Assets 4 869.50 664.41 343.90 Financial Assets (i) Investments - - 19.57 (ii) Loans 6 807.62 492.97 8.98 (iii) Other Financial Assets 7 339.80 13.14 1,043.43 Non-current Tax Assets (Net) 8 1,216.31 1,367.74 1,337.98 Other Non-current Assets 9 867.28 713.07 1,867.91
62,464.06 51,212.80 45,428.76 Current AssetsInventories 10 36,423.72 23,391.73 24,614.47 Financial Assets (i) Investments 11 - 300.17 54.03 (ii) Trade receivables 12 33,069.46 23,040.70 17,388.94 (iii) Cash and cash equivalents 13 1,626.20 1,212.40 683.31 (iv) Bank balances other than (iii) above 14 687.11 1,197.68 2,387.40 (v) Loans 15 58.26 48.46 0.43 (vi) Other Financial Assets 16 972.53 1,221.75 971.47 Other current assets 17 7,267.37 3,665.53 2,371.42
Total Assets 80,104.65 54,078.42 48,471.47 142,568.71 105,291.22 93,900.23
EQUITY AND LIABILITIESEQUITYEquity Share Capital 18 3,906.27 3,760.98 3,760.98 Instruments entirely equity in nature 19 - 145.29 145.29 Other Equity 20 53,659.59 44,931.35 40,045.10
57,565.86 48,837.62 43,951.37LIABILITIESNon-Current LiabilitiesFinancial Liabilities (i) Borrowings 21 18,083.20 7,679.35 6,599.25 Provisions 22 1,049.18 855.10 741.37 Deferred Tax Liabilities (Net) 40 2,867.25 2,211.07 1,559.72
21,999.63 10,745.52 8,900.34 Current LiabilitiesFinancial Liabilities (i) Borrowings 23 28,047.84 21,521.28 21,463.60 (ii) Trade Payables 24 (a) Total outstanding dues of micro enterprises and small enterprises
57.74 37.11 25.24
(b) Total outstanding dues of creditors other than micro enterprises and small enterprises
21,397.83 14,976.58 12,006.76
(iii) Other financial liabilities 25 10,037.27 7,518.33 5640.95 Other current liabilities 26 790.19 977.99 1333.91Provisions 27 151.79 81.81 72.72 Current Tax Liabilities (Net) 28 2,520.56 594.98 505.34
63,003.22 45,708.08 41,048.52Total Equity and Liabilities 142,568.71 105,291.22 93,900.23
* Refer Note 3The accompanying notes are an integral part of the consolidated financial statements.
As per our report of even date attachedFor Price Waterhouse & Co Chartered Accountants LLP For and on behalf of the BoardChartered Accountants Firm Registration No.: 304026E/ E-300009
Priyanshu Gundana Nahoosh Jariwala Mahesh BabaniPartner Managing Director Managing DirectorMembership No. 109553 DIN: 00012412 DIN: 00051162
Rajen N. Jhaveri Chief Financial Officer & Company Secretary
Place : Mumbai Place : MumbaiDate : May 09, 2019 Date : May 09, 2019
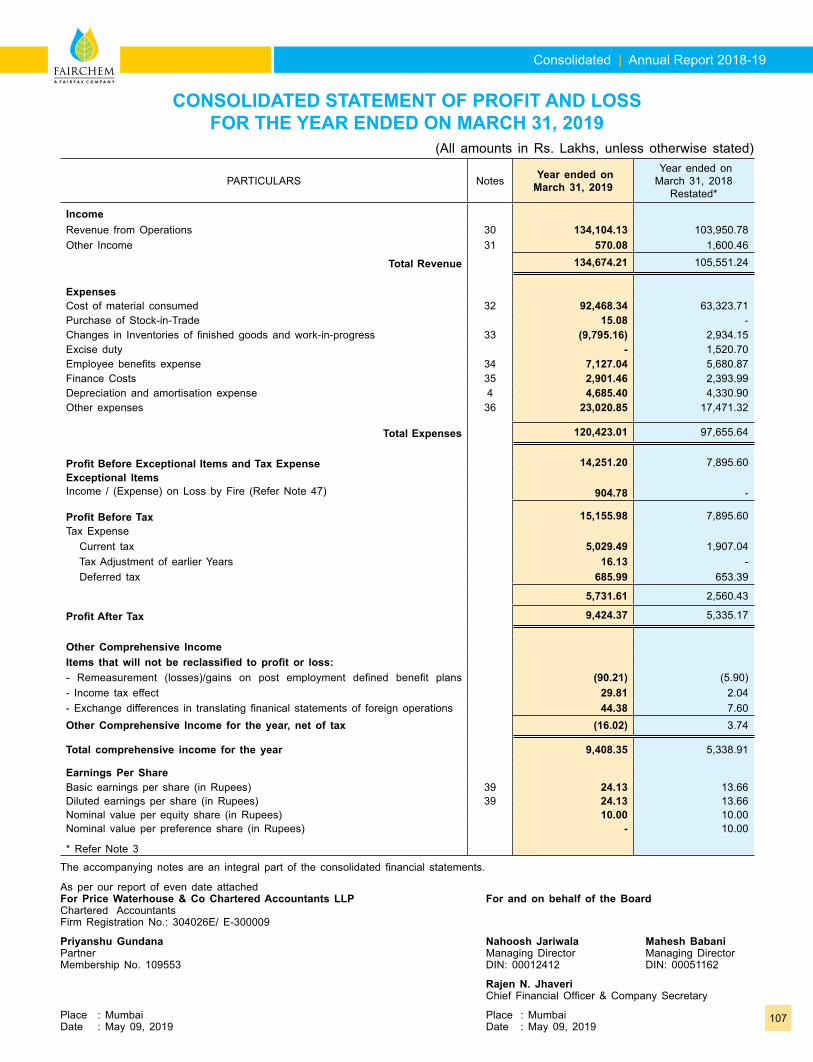
Consolidated | Annual Report 2018-19
107
As per our report of even date attachedFor Price Waterhouse & Co Chartered Accountants LLP For and on behalf of the BoardChartered Accountants Firm Registration No.: 304026E/ E-300009
Priyanshu Gundana Nahoosh Jariwala Mahesh BabaniPartner Managing Director Managing DirectorMembership No. 109553 DIN: 00012412 DIN: 00051162
Rajen N. Jhaveri Chief Financial Officer & Company Secretary
Place : Mumbai Place : MumbaiDate : May 09, 2019 Date : May 09, 2019
CONSOLIDATED STATEMENT OF PROFIT AND LOSS FOR THE YEAR ENDED ON MARCH 31, 2019
(All amounts in Rs. Lakhs, unless otherwise stated)
PARTICULARS Notes Year ended on March 31, 2019
Year ended on March 31, 2018
Restated*
IncomeRevenue from Operations 30 134,104.13 103,950.78 Other Income 31 570.08 1,600.46
Total Revenue 134,674.21 105,551.24
ExpensesCost of material consumed 32 92,468.34 63,323.71 Purchase of Stock-in-Trade 15.08 - Changes in Inventories of finished goods and work-in-progress 33 (9,795.16) 2,934.15 Excise duty - 1,520.70 Employee benefits expense 34 7,127.04 5,680.87 Finance Costs 35 2,901.46 2,393.99 Depreciation and amortisation expense 4 4,685.40 4,330.90 Other expenses 36 23,020.85 17,471.32
Total Expenses 120,423.01 97,655.64
Profit Before Exceptional Items and Tax Expense 14,251.20 7,895.60 Exceptional ItemsIncome / (Expense) on Loss by Fire (Refer Note 47) 904.78 -
Profit Before Tax 15,155.98 7,895.60 Tax Expense Current tax 5,029.49 1,907.04 Tax Adjustment of earlier Years 16.13 - Deferred tax 685.99 653.39
5,731.61 2,560.43
Profit After Tax 9,424.37 5,335.17
Other Comprehensive IncomeItems that will not be reclassified to profit or loss:- Remeasurement (losses)/gains on post employment defined benefit plans (90.21) (5.90)- Income tax effect 29.81 2.04 - Exchange differences in translating finanical statements of foreign operations 44.38 7.60 Other Comprehensive Income for the year, net of tax (16.02) 3.74
Total comprehensive income for the year 9,408.35 5,338.91
Earnings Per ShareBasic earnings per share (in Rupees) 39 24.13 13.66 Diluted earnings per share (in Rupees) 39 24.13 13.66 Nominal value per equity share (in Rupees) 10.00 10.00 Nominal value per preference share (in Rupees)
* Refer Note 3
- 10.00
The accompanying notes are an integral part of the consolidated financial statements.
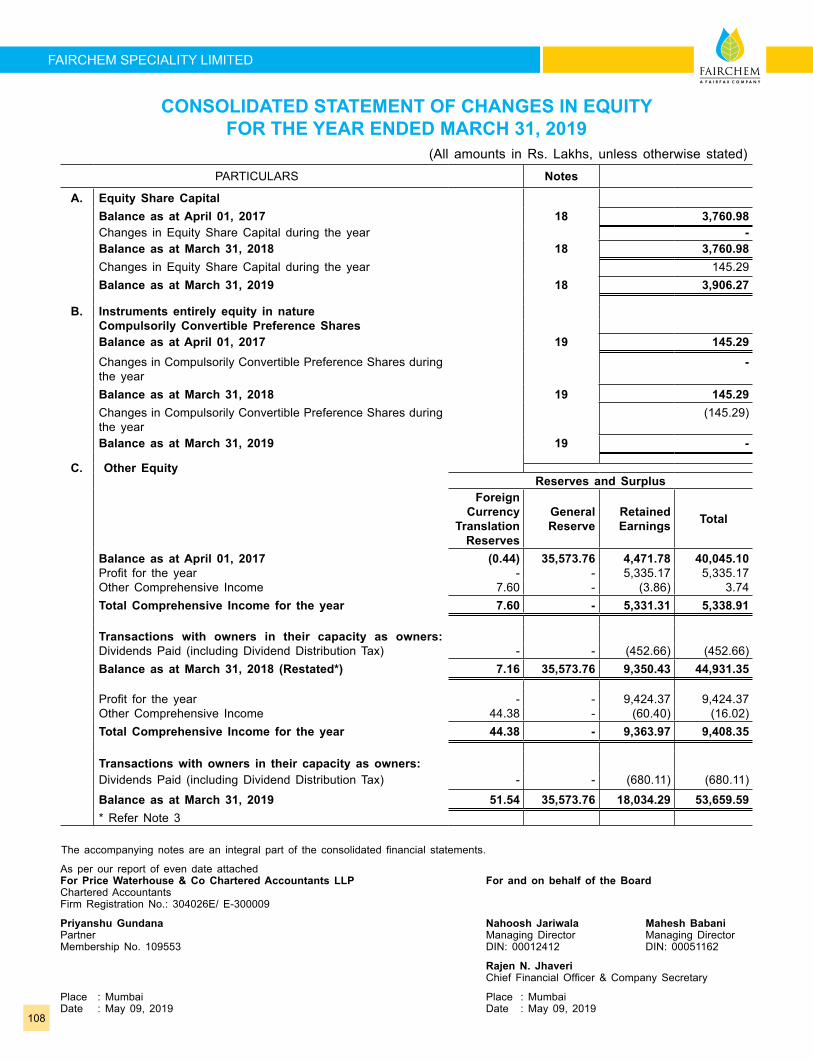
108
FAIRCHEM SPECIALITY LIMITED
CONSOLIDATED STATEMENT OF CHANGES IN EQUITY FOR THE YEAR ENDED MARCH 31, 2019
(All amounts in Rs. Lakhs, unless otherwise stated) PARTICULARS Notes
A. Equity Share CapitalBalance as at April 01, 2017 18 3,760.98 Changes in Equity Share Capital during the year - Balance as at March 31, 2018 18 3,760.98 Changes in Equity Share Capital during the year 145.29 Balance as at March 31, 2019 18 3,906.27
B. Instruments entirely equity in natureCompulsorily Convertible Preference SharesBalance as at April 01, 2017 19 145.29 Changes in Compulsorily Convertible Preference Shares during the year
-
Balance as at March 31, 2018 19 145.29 Changes in Compulsorily Convertible Preference Shares during the year
(145.29)
Balance as at March 31, 2019 19 -
C. Other EquityReserves and Surplus
Foreign Currency
Translation Reserves
General Reserve
Retained Earnings Total
Balance as at April 01, 2017 (0.44) 35,573.76 4,471.78 40,045.10Profit for the year - - 5,335.17 5,335.17Other Comprehensive Income 7.60 - (3.86) 3.74Total Comprehensive Income for the year 7.60 - 5,331.31 5,338.91
Transactions with owners in their capacity as owners:Dividends Paid (including Dividend Distribution Tax) - - (452.66) (452.66)Balance as at March 31, 2018 (Restated*) 7.16 35,573.76 9,350.43 44,931.35
Profit for the year - - 9,424.37 9,424.37Other Comprehensive Income 44.38 - (60.40) (16.02)Total Comprehensive Income for the year 44.38 - 9,363.97 9,408.35
Transactions with owners in their capacity as owners:Dividends Paid (including Dividend Distribution Tax) - - (680.11) (680.11)
Balance as at March 31, 2019 51.54 35,573.76 18,034.29 53,659.59* Refer Note 3
The accompanying notes are an integral part of the consolidated financial statements.
As per our report of even date attachedFor Price Waterhouse & Co Chartered Accountants LLP For and on behalf of the BoardChartered Accountants Firm Registration No.: 304026E/ E-300009
Priyanshu Gundana Nahoosh Jariwala Mahesh BabaniPartner Managing Director Managing DirectorMembership No. 109553 DIN: 00012412 DIN: 00051162
Rajen N. Jhaveri Chief Financial Officer & Company Secretary
Place : Mumbai Place : MumbaiDate : May 09, 2019 Date : May 09, 2019
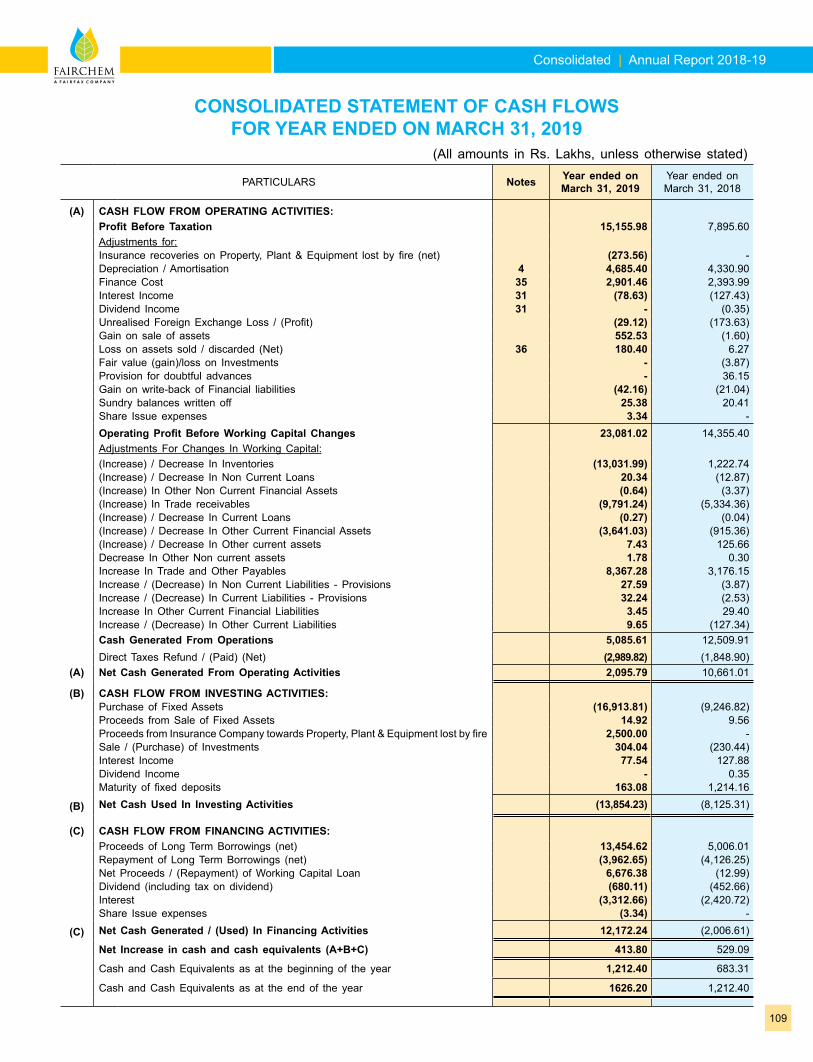
Consolidated | Annual Report 2018-19
109
CONSOLIDATED STATEMENT OF CASH FLOWS FOR YEAR ENDED ON MARCH 31, 2019
(All amounts in Rs. Lakhs, unless otherwise stated)
PARTICULARS Notes Year ended on March 31, 2019
Year ended on March 31, 2018
(A) CASH FLOW FROM OPERATING ACTIVITIES:Profit Before Taxation 15,155.98 7,895.60 Adjustments for:Insurance recoveries on Property, Plant & Equipment lost by fire (net) (273.56) - Depreciation / Amortisation 4 4,685.40 4,330.90 Finance Cost 35 2,901.46 2,393.99 Interest Income 31 (78.63) (127.43)Dividend Income 31 - (0.35)Unrealised Foreign Exchange Loss / (Profit) (29.12) (173.63)Gain on sale of assets 552.53 (1.60)Loss on assets sold / discarded (Net) 36 180.40 6.27 Fair value (gain)/loss on Investments - (3.87)Provision for doubtful advances - 36.15 Gain on write-back of Financial liabilities (42.16) (21.04)Sundry balances written off 25.38 20.41 Share Issue expenses 3.34 - Operating Profit Before Working Capital Changes 23,081.02 14,355.40 Adjustments For Changes In Working Capital:(Increase) / Decrease In Inventories (13,031.99) 1,222.74 (Increase) / Decrease In Non Current Loans 20.34 (12.87)(Increase) In Other Non Current Financial Assets (0.64) (3.37)(Increase) In Trade receivables (9,791.24) (5,334.36)(Increase) / Decrease In Current Loans (0.27) (0.04)(Increase) / Decrease In Other Current Financial Assets (3,641.03) (915.36)(Increase) / Decrease In Other current assets 7.43 125.66 Decrease In Other Non current assets 1.78 0.30 Increase In Trade and Other Payables 8,367.28 3,176.15 Increase / (Decrease) In Non Current Liabilities - Provisions 27.59 (3.87)Increase / (Decrease) In Current Liabilities - Provisions 32.24 (2.53)Increase In Other Current Financial Liabilities 3.45 29.40 Increase / (Decrease) In Other Current Liabilities 9.65 (127.34)Cash Generated From Operations 5,085.61 12,509.91 Direct Taxes Refund / (Paid) (Net) (2,989.82) (1,848.90)
(A) Net Cash Generated From Operating Activities 2,095.79 10,661.01
(B) CASH FLOW FROM INVESTING ACTIVITIES:
(B)
Purchase of Fixed Assets (16,913.81) (9,246.82)Proceeds from Sale of Fixed Assets 14.92 9.56 Proceeds from Insurance Company towards Property, Plant & Equipment lost by fire 2,500.00 - Sale / (Purchase) of Investments 304.04 (230.44)Interest Income 77.54 127.88 Dividend Income - 0.35 Maturity of fixed deposits 163.08 1,214.16 Net Cash Used In Investing Activities (13,854.23) (8,125.31)
(C) CASH FLOW FROM FINANCING ACTIVITIES:
(C)
Proceeds of Long Term Borrowings (net) 13,454.62 5,006.01 Repayment of Long Term Borrowings (net) (3,962.65) (4,126.25)Net Proceeds / (Repayment) of Working Capital Loan 6,676.38 (12.99)Dividend (including tax on dividend) (680.11) (452.66)Interest (3,312.66) (2,420.72)Share Issue expenses (3.34) - Net Cash Generated / (Used) In Financing Activities 12,172.24 (2,006.61)
Net Increase in cash and cash equivalents (A+B+C) 413.80 529.09
Cash and Cash Equivalents as at the beginning of the year 1,212.40 683.31
Cash and Cash Equivalents as at the end of the year 1626.20 1,212.40
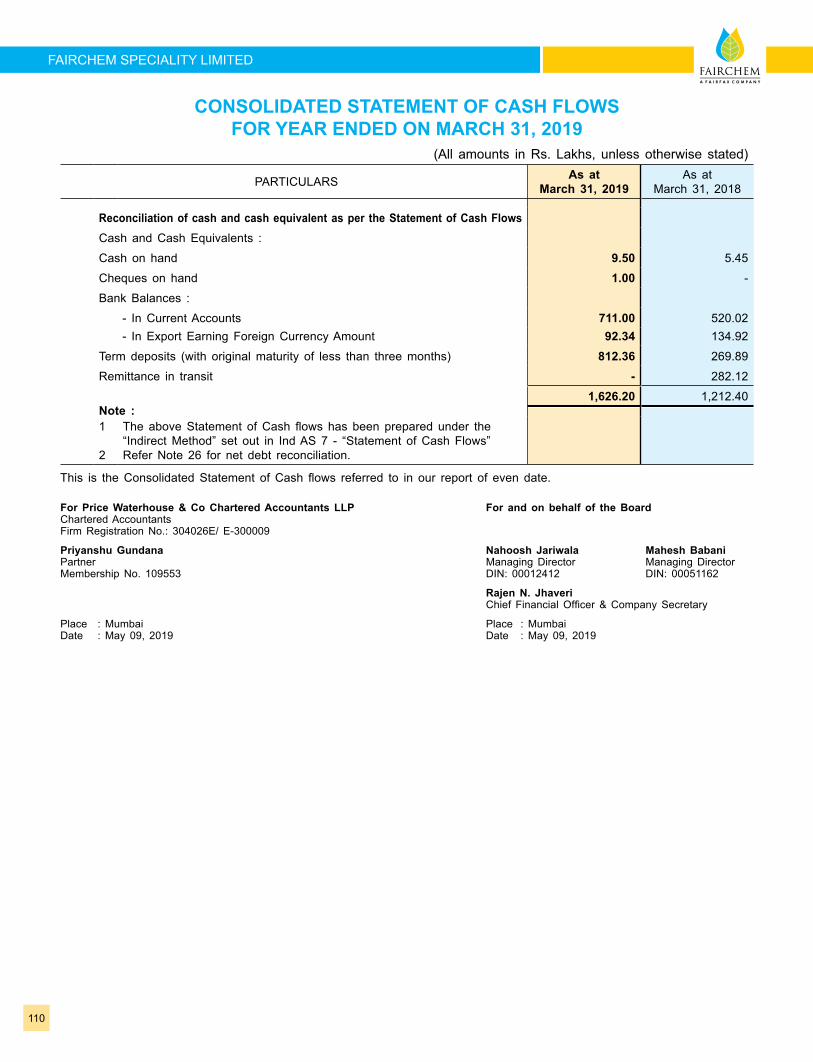
110
FAIRCHEM SPECIALITY LIMITED
CONSOLIDATED STATEMENT OF CASH FLOWS FOR YEAR ENDED ON MARCH 31, 2019
(All amounts in Rs. Lakhs, unless otherwise stated)
PARTICULARS As at March 31, 2019
As at March 31, 2018
Reconciliation of cash and cash equivalent as per the Statement of Cash FlowsCash and Cash Equivalents :
Cash on hand 9.50 5.45
Cheques on hand 1.00 -
Bank Balances :
- In Current Accounts 711.00 520.02 - In Export Earning Foreign Currency Amount 92.34 134.92
Term deposits (with original maturity of less than three months) 812.36 269.89
Remittance in transit - 282.12
1,626.20 1,212.40 Note :1 The above Statement of Cash flows has been prepared under the “Indirect Method” set out in Ind AS 7 - “Statement of Cash Flows”2 Refer Note 26 for net debt reconciliation.
This is the Consolidated Statement of Cash flows referred to in our report of even date.
For Price Waterhouse & Co Chartered Accountants LLP For and on behalf of the BoardChartered Accountants Firm Registration No.: 304026E/ E-300009
Priyanshu Gundana Nahoosh Jariwala Mahesh BabaniPartner Managing Director Managing DirectorMembership No. 109553 DIN: 00012412 DIN: 00051162
Rajen N. Jhaveri Chief Financial Officer & Company Secretary
Place : Mumbai Place : MumbaiDate : May 09, 2019 Date : May 09, 2019
Consolidated | Annual Report 2018-19
111
NOTES TO THE CONSOLIDATED FINANCIAL STATEMENTS1 Background of the Company Fairchem Speciality Limited (the “Company”) was incorporated in May, 1985 as “H. K. Agro Oil Ltd.” under
the provisions of the Companies Act, 1956. The Company is engaged in manufacturing of Speciality Oleo Chemicals. The manufacturing facility is set up at Village Chekhala, Ta. Sanand, Dist. Ahmedabad, Gujarat. The equity shares of the Company are listed on BSE Limited and National Stock Exchange of India Ltd.
2 Significant accounting policies The Consolidated Financial Statements include the Financial Statements of Fairchem Speciality Limited, the parent
Company and all of its wholly owned subsidiary companies and its associate (collectively referred to as ‘Group’). This Note provides a list of the significant accounting policies adopted by the Group in the preparation of these financial
statements. These policies have been consistently applied to all the years presented, unless otherwise stated. a) Basis of preparation
i) Compliance with Ind AS These financial statements comply in all material aspects with Indian Accounting Standards (Ind AS)
notified under Section 133 of the Companies Act, 2013 (the Act) [Companies (Indian Accounting Standards) Rules, 2015] and other relevant provisions of the Act.
ii) New standards or interpretations adopted by the Company a) The Group has applied the following amendment for the first time for its annual reporting period
commencing April 1, 2018: Ind AS 115 – Revenue from Contracts from Customers Ind AS 21 – The effect of changes in Foreign Exchange rates b) New standards or interpretations issued but not yet effective The Group will apply the following standard for the first time for its annual reporting period
commencing 1st April, 2019:
i) The Ministry of Corporate Affairs (MCA) has notified the Companies (Indian Accounting Standards), Amendment Rules 2019 on March 30, 2019 which includes Ind AS - 116 “Leases”. This will replace Ind AS 17 “Leases”.
Ind AS - 116 will result in almost all leases being recognized on the balance sheet by the lessees, as the distinction between operating and finance leases is removed. Under the new standard, an asset (the right to use the leased item) and a financial liability to pay rentals are recognized. The only exceptions are short term and low value leases.
In order to identify the potential impact of the standard on the Group’s financial statements, the Group is analysing leasing contracts. The Group has begun the analysis on the key areas identified, in order to estimate the effect of the application of the new standard for which the work is ongoing and impact areas may be identified as the Group progresses further in the implementation process. As a result, at this stage the Group is not able to estimate the impact of the new standard on the consolidated financial statements. The Group will make more detailed assessments of the impact over the future periods.
ii) Ind AS 21 – The effect of changes in Foreign Exchange rates The amendment clarifies on the accounting of transactions that include the receipt or payment
of advance consideration in a foreign currency. The appendix explains that the date of the transaction, for the purpose of determining the exchange rate, is the date of initial recognition of the non- monetary prepayment asset or deferred income liability. If there are multiple payments or receipts in advance, a date of transaction is established for each payment or receipt.
iii) Ind AS 12 - Appendix C, Uncertainty over Income Tax Adjustments The amendment requires an entity to determine probability of the relevant tax authority accepting
the uncertain tax treatment that the Company has used in tax computation or plan to use in their income tax filings.
iv) Amendment to Ind AS 12 – Income taxes The amendment clarifies that an entity shall recognise the income tax consequences of

112
FAIRCHEM SPECIALITY LIMITED
dividends in profit or loss, other comprehensive income or equity according to where the entity originally recognised those past transactions or events
v) Ind AS 19 - Plan amendment, curtailment or settlement The amendments require an entity to use updated assumptions to determine current service
cost and net interest for the remainder of the period after a plan amendment, curtailment or settlement and to recognise in profit or loss as part of past service cost, or a gain or loss on settlement, any reduction in a surplus, even if that surplus was not previously recognised because of the impact of the asset ceiling.
Based on preliminary assessment, the Company does not expect any significant impact on its financial statements on account of above amendments.
iii) Historical cost convention The Financial Statements have been prepared on a historical cost basis, except for the following: • Certain financial assets and liabilities that is measured at fair value ; and • Defined benefit plans - plan assets measured at fair value.
iv) Current versus non-current classification The Group presents assets and liabilities in the balance sheet based on current/non-current
classification. An asset is treated as current when it is:
• Expected to be realised or intended to be sold or consumed in normal operating cycle, or
• Held primarily for the purpose of trading, or
• Expected to be realised within twelve months after the reporting period, or
• Cash or cash equivalent unless restricted from being exchanged or used to settle a liability for at least twelve months after the reporting period, all other assets are classified as non-current.
A liability is current when:
• It is expected to be settled in normal operating cycle, or
• It is held primarily for the purpose of trading, or
• It is due to be settled within twelve months after the reporting period, or
• There is no unconditional right to defer the settlement of the liability for at least twelve months after the reporting period, all other liabilities are classified as non-current.
b) Principles of consolidation The Consolidated Financial Statements include the Financial Statements of Fairchem Speciality Limited,
the parent Company and all of its wholly owned subsidiary companies and its associate (collectively referred to as ‘Group’).
Subsidiaries are all entities over which the Group has control. The Group controls an entity when the Group is exposed to, or has rights to, variable returns from its involvement with the entity and has the ability to affect those returns through its power to direct the relevant activities of the entity. Subsidiaries are fully consolidated from the date on which control is transferred to the Group. They are deconsolidated from the date that control ceases.
The Group combines the Financial Statements of the parent and its subsidiaries line by line adding together like items of assets, liabilities, equity, income and expenses. Intercompany transactions, balances and unrealised gains on transactions between group companies are eliminated. Unrealised losses are also eliminated unless the transaction provides evidence of an impairment of the transferred asset. Accounting policies of subsidiaries have been changed where necessary to ensure consistency with the policies adopted by the Group.
NOTES TO THE CONSOLIDATED FINANCIAL STATEMENTS
Consolidated | Annual Report 2018-19
113
c) Foreign currency transactions and translations
(i) Functional and presentation currency Items included in the financial statements are measured using the currency of the primary economic
environment in which the entity operates (“the functional currency”). The financial statements are presented in Indian rupee (INR), which is Group’s functional and presentation currency.
(ii) Transactions and balances Foreign currency transactions are translated into the functional currency using exchange rates at the
date of the transaction. Foreign exchange gains and losses from settlement of these transactions and from translation of monetary assets and liabilities at the reporting date are recognised in the Statement of Profit and Loss.
Foreign exchange differences regarded as an adjustment to borrowing costs are presented in the statement of profit and loss, within finance costs. All other foreign exchange gains and losses are presented in the statement of profit and loss on a net basis within other incomes/expenses.
(ii) Translations On consolidation, the assets and liabilities of foreign operations are translated from USD at the rate
of exchange prevailing at the reporting date and their statement of profit and loss are translated at the average exchange rates prevailing for the year. The exchange differences arising on translation for consolidation are recognised in OCI under Foreign Currency Translation Reserve. On disposal of a foreign operation, the component of OCI relating to that particular foreign operation is recognised in profit or loss.
d) Revenue recognition
Sale of products Revenue is recognised at the point in time when the performance obligation is satisfied and control of the
goods is transferred to the customer upon dispatch or delivery, in accordance with the terms of customer contracts. Revenue is recognised at an amount that the Group expects to receive from customers that is net of trade discounts, rebates and goods and service tax (GST). The Group does not have any contracts where the transfer of the promised goods to customer and payment by the customer exceeds one year. As a consequence, the Group does not adjust any of the transaction price for the time value of money.
A contract liability is the obligation to transfer goods to the customer for which the Group has received consideration from the customer. Contract liabilities are recognised as revenue when the Group performs under the contract.
Income in respect of insurance and other claims is recognized only on reasonable certainity of ultimate collection as per the requirement of the accounting standards.
Export incentives are recognised when the right to receive credit as per the terms of the scheme is established in respect of the exports and there is no uncertainty in receiving the same.
Interest revenue is calculated by using the effective interest method for financial assets measured at amortised cost.
Dividend income is recognised when the right to receive payment is established.
e) Income tax The income tax expense or credit for the period is the tax on the current period’s taxable income based
on the applicable income tax rate adjusted by changes in deferred tax assets and liabilities attributable to temporary differences and to unused tax losses.
The current income tax charge is calculated on the basis of the tax laws enacted or substantively enacted at the end of the reporting period in India. Management periodically evaluates positions taken in tax returns with respect to situations in which applicable tax regulation is subject to interpretation. It establishes provisions where appropriate on the basis of amounts expected to be paid to the tax authorities.
NOTES TO THE CONSOLIDATED FINANCIAL STATEMENTS
114
FAIRCHEM SPECIALITY LIMITED
Deferred income tax is provided in full, using the liability method, on temporary differences arising between the tax bases of assets and liabilities and their carrying amounts in the financial statements.
Deferred tax assets are recognised for all deductible temporary differences and unused tax losses only if it is probable that future taxable amounts will be available to utilize those temporary differences and losses.
Deferred tax assets and liabilities are offset when there is a legally enforceable right to offset deferred tax assets and liabilities and when the deferred tax balances relate to the same taxation authority. Current tax assets and tax liabilities are offset where the entity has a legally enforceable right to offset and intends either to settle on a net basis, or to realize the asset and settle the liability simultaneously.
Deferred tax liabilities are not recognised for temporary differences between the carrying amount and tax bases of investment in subsidiary where the group is able to control the timing of the reversal of the temporary difference and it is probable that the difference will not reverse in the forseeable future.
Deferred income tax is determined using tax rates (and laws) that have been enacted or substantially enacted by the end of the reporting period and are expected to apply when the related deferred income tax asset is realised or the deferred income tax liability is settled.
Current and deferred tax is recognised in profit or loss, except to the extent that it relates to items recognised in other comprehensive income or directly in equity in which case, the tax is recognised in other comprehensive income or directly in equity, respectively.
Minimum Alternate tax (‘MAT’) under the provisions of the Income tax Act, 1961 is recognised as current tax in the Statement of Profit and loss. The credit available under the Act in respect of MAT paid is recognised as an asset only when and to the extent it is probable that the company will pay normal income tax during the year for which the MAT credit can be carried forward for set-off against the normal tax liability. MAT credit recognised as an asset is reviewed at each balance sheet date and written down to the extent the aforesaid convincing evidence no longer exists.
f) Leases
As Lessee Leases of property, plant and equipment where the Group, as lessee, has substantially all the risks and
rewards of ownership are classified as finance leases. Finance leases are capitalised at the lease’s inception at the fair value of the leased asset or, if lower, the present value of the minimum lease payments. The corresponding rental obligations, net of finance charges, are included in borrowings or other financial liabilities as appropriate. Each lease payment is allocated between the liability and finance cost. The finance cost is charged to the profit or loss over the lease period so as to produce a constant periodic rate of interest on the remaining balance of the liability for each period.
Leases in which a significant portion of the risks and rewards of ownership are not transferred to the Group as lessee are classified as operating leases. Payments made under operating leases (net of any incentives received from the lessor) are charged to profit or loss on a straight-line basis over the period of the lease unless the payments are structured to increase in line with expected general inflation to compensate for the lessor’s expected inflationary cost increases.
g) Impairment of assets Assets are tested for impairment whenever events or changes in circumstances indicate that the carrying
amount may not be recoverable. An impairment loss is recognised for the amount by which the asset’s carrying amount exceeds its recoverable amount. The recoverable amount is the higher of an asset’s fair value less cost of disposal and value in use. For the purposes of assessing impairment, assets are grouped at the lowest levels for which there are separately identifiable cash inflows which are largely independent of the cash inflows from other assets or groups of assets (cash-generating units). Assets are reviewed for possible reversal of the impairment at the end of each reporting period.
When there is indication that an impairment loss recognised for an asset in earlier accounting periods no longer exists or may have decreased, such reversal of impairment loss is recognised in the statement of profit and loss, to the extent the amount was previously charged to the statement of profit and loss.
NOTES TO THE CONSOLIDATED FINANCIAL STATEMENTS
Consolidated | Annual Report 2018-19
115
h) Cash and cash equivalents For the purpose of presentation in the statement of cash flows, cash and cash equivalents includes cash
on hand, deposits held at call with financial institutions, other short-term, highly liquid investments with original maturities of three months or less that are readily convertible to known amounts of cash and which are subject to an insignificant risk of changes in value.
i) Trade receivables Trade receivables are recognised initially at fair value and subsequently measured at amortised cost using
the effective interest rate (EIR) method, less provision for impairment, if any.
j) Inventories Raw materials, packing material, stores and fuel, work in progress and finished goods are stated at the
lower of cost and net realisable value. The cost of raw materials, packing materials, stores and fuel are determined based on first-in, first-out (FIFO) method and comprises cost of purchase. The cost of semi-finished goods comprises raw materials, direct labour, and appropriate proportion of variable and fixed overhead expenditure, the latter being allocated on the basis of normal operating capacity. Cost of inventories also include all other costs incurred in bringing the inventories to their present location and condition.
Net realisable value is the estimated selling price in the ordinary course of business less the estimated costs of completion and the estimated costs necessary to make the sale .
k) Financial assets and liabilities
(i) Financial assets 1. Classification The Group classifies its financial assets in the following measurement categories:
• at fair value (either through other comprehensive income, or through profit or loss), and
• at amortised cost.
The classification depends on the entity’s business model for managing the financial assets and the contractual terms of the cash flows. For assets measured at fair value, gains and losses will either be recorded in profit or loss or other comprehensive income. For investments in debt instruments, this will depend on the business model in which the investment is held. For investments in equity instruments, this will depend on whether the Group has made an irrevocable selection at the time of initial recognition to account for the equity investment at fair value through other comprehensive income. The Group reclassifies debt investments when and only when its business model for managing those assets changes.
2. Initial Recognition and Measurement At initial recognition, the Group measures a financial asset at its fair value plus, in the case
of a financial asset not at fair value through profit or loss, transaction costs that are directly attributable to the acquisition of the financial asset. Transaction costs of financial assets carried at fair value through profit or loss are expensed in statement of profit or loss.
3. Subsequent Measurement Measured at amortised cost: Financial assets that are held within a business model whose
objective is, to hold financial assets in order to collect contractual cash flows that are solely payments of principal and interest, are subsequently measured at amortised cost using the EIR method less impairment, if any. The amortisation of EIR and loss or gains arising from impirment, if any is recognised in the Statement of Profit and Loss.
Measured at fair value through other comprehensive income (FVOCI): Financial assets that are held within a business model whose objective is, selling financial assets and collecting contractual cash flows that are solely payments of principal and interest, are subsequently measured at fair value through other comprehensive income. Fair value movements are
NOTES TO THE CONSOLIDATED FINANCIAL STATEMENTS
116
FAIRCHEM SPECIALITY LIMITED
recognised in the other comprehensive income (OCI). Interest income measured using the EIR method and impairment losses, if any are recognised in the Statement of Profit and Loss. On derecognition, cumulative gain or loss previously recognised in OCI is reclassified from the equity to “Profit or Loss” in the Statement
Measured at fair value through profit or loss (FVPL): A financial asset not classified as either amortised cost or FVOCI, is classified as FVTPL. Such financial assets are measured at fair value with all changes in fair value, including interest income and dividend income if any, recognised as ‘other income’ in the Statement of Profit and Loss.
Equity instruments The company subsequently measures all equity investments at fair value. Where the management
has elected to present fair value gains and losses on equity investments in other comprehensive income, there is no subsequent reclassification of fair value gains and losses to profit or loss. Dividends from such investments are recognised in profit or loss as other income when the company’s right to receive payments is established.
Impairment losses (and reversal of impairment losses) on equity investments measured at Fair Value through Other Comprehensive Income (FVOCI) are not reported separately from other changes in fair value.
4. Impairment of financial assets The Group is required to assess on a forward looking basis the expected credit losses
associated with its assets carried at amortised cost and FVOCI debt instruments. The impairment methodology applied depends on whether there has been a significant increase in credit risk. Note 42 details how the Company determines whether there has been a significant increase in credit risk. For trade receivables only, the Company applies the simplified approach permitted by Ind AS 109 Financial Instruments, which requires expected lifetime losses to be recognised from initial recognition of the receivables.
5. Derecognition A financial asset is de-recognised only when the Group • has transferred the rights to receive cash flows from the financial asset or, • retains the contractual rights to receive the cash flows of the financial asset, but assumes
a contractual obligation to pay the cash flows to one or more recipients.
6. Income recognition Interest income from debt instruments is recognised using the EIR method. The effective interest
rate is the rate that exactly discounts estimated future cash receipts through the expected life of the financial asset to the gross carrying amount of a financial asset.
Dividends are recognised in profit or loss only when the right to receive payment is established, it is probable that the economic benefits associated with the dividend will flow to the Group, and the amount of the dividend can be measured reliably.
(ii) Financial liabilities:
1. Initial Recognition and Measurement Financial liabilities are recognised when the Group becomes a party to the contractual provisions
of the instrument. Financial liabilities are initially measured at its fair value plus or minus, in the case of a financial liability not at fair value through profit or loss, transaction costs that are directly attributable to the issue of the financial liability.
2. Subsequent Measurement Financial liabilities are subsequently measured at amortised cost using the EIR method.
Financial liabilities carried at fair value through profit or loss are measured at fair value with all changes in fair value recognised in the Statement of Profit and Loss.
NOTES TO THE CONSOLIDATED FINANCIAL STATEMENTS
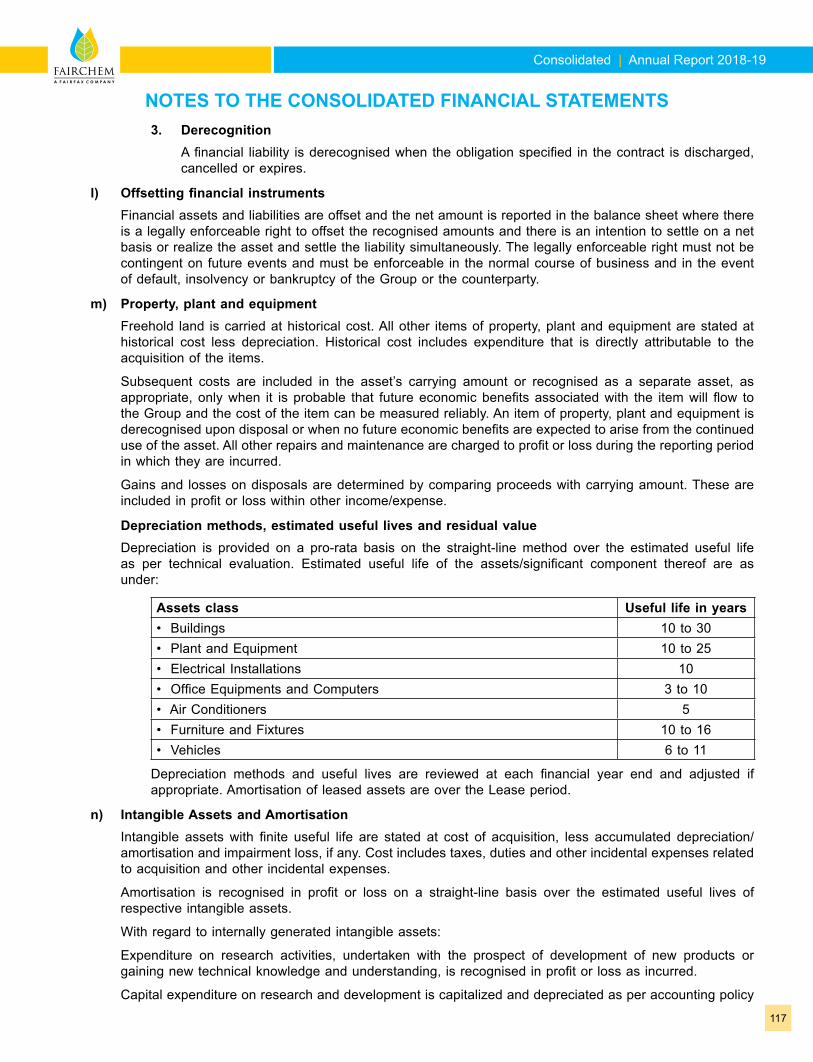
Consolidated | Annual Report 2018-19
117
3. Derecognition A financial liability is derecognised when the obligation specified in the contract is discharged,
cancelled or expires.
l) Offsetting financial instruments Financial assets and liabilities are offset and the net amount is reported in the balance sheet where there
is a legally enforceable right to offset the recognised amounts and there is an intention to settle on a net basis or realize the asset and settle the liability simultaneously. The legally enforceable right must not be contingent on future events and must be enforceable in the normal course of business and in the event of default, insolvency or bankruptcy of the Group or the counterparty.
m) Property, plant and equipment Freehold land is carried at historical cost. All other items of property, plant and equipment are stated at
historical cost less depreciation. Historical cost includes expenditure that is directly attributable to the acquisition of the items.
Subsequent costs are included in the asset’s carrying amount or recognised as a separate asset, as appropriate, only when it is probable that future economic benefits associated with the item will flow to the Group and the cost of the item can be measured reliably. An item of property, plant and equipment is derecognised upon disposal or when no future economic benefits are expected to arise from the continued use of the asset. All other repairs and maintenance are charged to profit or loss during the reporting period in which they are incurred.
Gains and losses on disposals are determined by comparing proceeds with carrying amount. These are included in profit or loss within other income/expense.
Depreciation methods, estimated useful lives and residual value Depreciation is provided on a pro-rata basis on the straight-line method over the estimated useful life
as per technical evaluation. Estimated useful life of the assets/significant component thereof are as under:
Assets class Useful life in years• Buildings 10 to 30• Plant and Equipment 10 to 25• Electrical Installations 10• Office Equipments and Computers 3 to 10• Air Conditioners 5• Furniture and Fixtures 10 to 16• Vehicles 6 to 11
Depreciation methods and useful lives are reviewed at each financial year end and adjusted if appropriate. Amortisation of leased assets are over the Lease period.
n) Intangible Assets and Amortisation Intangible assets with finite useful life are stated at cost of acquisition, less accumulated depreciation/
amortisation and impairment loss, if any. Cost includes taxes, duties and other incidental expenses related to acquisition and other incidental expenses.
Amortisation is recognised in profit or loss on a straight-line basis over the estimated useful lives of respective intangible assets.
With regard to internally generated intangible assets:
Expenditure on research activities, undertaken with the prospect of development of new products or gaining new technical knowledge and understanding, is recognised in profit or loss as incurred.
Capital expenditure on research and development is capitalized and depreciated as per accounting policy
NOTES TO THE CONSOLIDATED FINANCIAL STATEMENTS
118
FAIRCHEM SPECIALITY LIMITED
mentioned above. Revenue expenditure is charged off in the year in which it is incurred.
Assets class Useful life in years• Computers and softwares 3 to 6• Rights of sale of products 5• Development rights 5
Development activities involve a plan or design for the production of new or substantially improved products or processes. Development expenditure is capitalised only if development costs can be measured reliably, the product or process is technically and commercially feasible, future economic benefits are probable, and the Group intends to and has sufficient resources to complete development and to use the asset. The expenditure capitalised includes the cost of materials, direct labour, overhead costs that are directly attributable to preparing the asset for its intended use, and directly attributable borrowing costs (in the same manner as in the case of tangible fixed assets). Other development expenditure is recognised in profit or loss as incurred.
Intangible assets are amortised in profit or loss over their estimated useful lives, from the date that they are available for use based on the expected pattern of consumption of economic benefits of the asset.
Gains or losses arising from derecognition of an intangible asset are measured as the difference between the net disposal proceeds and the carrying amount of the asset and are recognised in the statement of profit or loss when the asset is derecognised.
o) Trade and other payables These amounts represent liabilities for goods and services provided to the Group prior to the end of
financial year which are unpaid. Trade and other payables are presented as current liabilities unless payment is not due within 12 months after the reporting period. They are recognised initially at their fair value and subsequently measured at amortised cost using the EIR method.
p) Borrowings Borrowings are initially recognised at fair value, net of transaction costs incurred. Borrowings are
subsequently measured at amortised cost. Any difference between the proceeds (net of transaction costs) and the redemption amount is recognised in profit or loss over the period of the borrowings using the EIR method. Fees paid on the establishment of loan facilities are recognised as transaction costs of the loan to the extent that it is probable that some or all of the facility will be drawn down. In this case, the fee is deferred until the draw down occurs. To the extent there is no evidence that it is probable that some or all of the facility will be drawn down, the fee is capitalised as a prepayment for liquidity services and amortised over the period of the facility to which it relates.
Borrowings are removed from the balance sheet when the obligation specified in the contract is discharged, cancelled or expired. The difference between the carrying amount of a financial liability that has been extinguished or transferred to another party and the consideration paid, including any non-cash assets transferred or liabilities assumed, is recognised in profit or loss as other income/expenses.
q) Borrowings Costs General and specific borrowing costs that are directly attributable to the acquisition, construction or
production of a qualifying asset are capitalised during the period of time that is required to complete and prepare the asset for its intended use or sale. Qualifying assets are assets that necessarily take a substantial period of time to get ready for their intended use or sale.
Investment income earned on the temporary investment of specific borrowings pending their expenditure on qualifying assets is deducted from the borrowing costs eligible for capitalisation.
Other borrowing costs are expensed in the period in which they are incurred.
r) Provisions and Contingencies Provisions are recognised when there is a present obligation (legal or constructive) as a result of a past
event, it is probable that an outflow of resources embodying economic benefits will be required to settle the
NOTES TO THE CONSOLIDATED FINANCIAL STATEMENTS
Consolidated | Annual Report 2018-19
119
obligation and there is a reliable estimate of the amount of the obligation. When a provision is measured using the cash flows estimated to settle the present obligation, its carrying amount is the present value of those cash flows (when the effect of the time value of money is material). The discount rate used to determine the present value is a pre-tax rate that reflects current market assessments of the time value of money and the risks specific to the liability. The increase in the provision due to the passage of time is recognised as interest expense.
Contingent liabilities are disclosed when there is a possible obligation arising from past events, the existence of which will be confirmed only by the occurrence or non occurrence of one or more uncertain future events not wholly within the control of the Group or a present obligation that arises from past events where it is either not probable that an outflow of resources will be required to settle the obligation or a reliable estimate of the amount cannot be made.
s) Employee Benefits
(i) Defined contribution plans Group’s contribution to Provident fund and other funds are determined under the relevant schemes
and/or statute and charged to revenue. The Group contributes to a Government administered Provident Fund and has no further obligation beyond making its contribution.
The Group makes contributions to state plans namely Employees’ State Insurance Fund and Employees’ Pension Scheme, 1995 and has no further obligation beyond making the payment to them. The Group’s contributions to the above funds are charged to Statement of Profit and Loss every year.
(ii) Defined benefit plans The Group provides for gratuity, a defined benefit plan (the “Gratuity Plan”) covering eligible
employees, which is funded. The Gratuity Plan provides a lump sum payment to vested employees at retirement, death, incapacitation or termination of employment, of an amount based on the respective employee’s salary and the tenure of employment. The Group’s liability is actuarially determined using the Projected Unit Credit method at the end of each year. Remeasurement gains and losses arising from experience adjustments and changes in actuarial assumptions are recognised in the period in which they occur, directly in other comprehensive income. They are included in retained earnings in the statement of changes in equity and in the balance sheet.
Gratuity Fund contributions are made to a trust administered by the Holding Company which has further invested in Life Insurance Corporation. The contributions made to the trust are recognised as plan assets. The defined benefit obligation recognised in the balance sheet represents the present value of the defined benefit obligation as reduced by the fair value of plan assets.
(iii) Other employee benefits Compensated Absences: Accumulated compensated absences, which are expected to be availed or
encashed within 12 months from the end of the year end are treated as short term employee benefits. The obligation towards the same is measured at the expected cost of accumulating compensated absences as the additional amount expected to be paid as a result of the unused entitlement as at the year end.
Accumulated compensated absences, which are expected to be availed or encashed beyond 12 months from the end of the year are treated as other long term employee benefits. The Group’s liability is actuarially determined (using the Projected Unit Credit method) at the end of each year. Actuarial losses/ gains are recognised in the Statement of Profit and Loss in the year in which they arise.
Termination Benefits: Termination benefits in the nature of voluntary retirement benefits are recognised in the Statement of Profit and Loss as and when incurred.
t) Segment reporting Operating segments are reported in a manner consistent with the internal reporting provided to the
Managing Directors who are identified as the chief operating decision makers. The managing directors
NOTES TO THE CONSOLIDATED FINANCIAL STATEMENTS
120
FAIRCHEM SPECIALITY LIMITED
assess the financial performance and position of the Group, and make strategic decisions. Refer note 48 for segment information presented.
u) Earnings per share
i) Basic earnings per share Basic earnings per share is calculated by dividing:
• the profit attributable to owners of the Group
• by the weighted average number of equity shares outstanding during the financial year, adjusted for bonus elements in equity shares issued during the year and excluding treasury shares.
(ii) Diluted earnings per share Diluted earnings per share adjusts the figures used in the determination of basic earnings per share
to take into account:
• the after income tax effect of interest and other financing costs associated with dilutive potential equity shares, and
• the weighted average number of additional equity shares that would have been outstanding assuming the conversion of all dilutive potential equity shares.
v) Rounding off All amounts disclosed in the financial statements and notes have been rounded off to the nearest lakhs,
or decimal thereof as per the requirement of Schedule III, unless otherwise stated.
w) Critical estimates and judgements The preparation of financial statements requires the use of accounting estimates which, by definition,
will seldom equal the actual results. Management also needs to exercise judgement in applying the company’s accounting policies.
The areas involving critical estimates or judgements are:
• Estimation of defined benefit obligation – Note 29
• Impairment of trade receivables – Note 42
• Estimation of useful life of tangible assets – Note 4
Estimates and judgments are continually evaluated. They are based on historical experience and other factors, including expectations of future events that may have a financial impact on the Group.
NOTES TO THE CONSOLIDATED FINANCIAL STATEMENTS
Consolidated | Annual Report 2018-19
121
3 Restated Consolidated Financial Statement as at / for the year ended March 31, 2018 and March 31, 2017 due to correction of error
During the current year, Privi Organics India Limited (the subsidiary company) noted certain error (Refer Note (i)) in its consolidated financial statements for the period ended March 31, 2017. The error has been corrected by restating each of the affected financial statement line item for prior periods. The following note summarises the impact on consolidated financial statements of Fairchem Speciality Limited.
Consolidated Balance Sheet as at March 31, 2018 and as at March 31, 2017
Particulars NoteAs previously reported as at March 31 2018
Adjust-ment
As Restated as at March
31 2018
As previously reported as at March 31 2017
Adjust-ment
As Restated as at March
31 2017
ASSETSNon-Current AssetsProperty, Plant and Equipment 43,045.98 - 43,045.98 38,638.24 - 38,638.24 Capital work-in-progress 4,915.49 - 4,915.49 2,168.75 - 2,168.75 Intangible Assets 664.41 - 664.41 343.90 - 343.90 Financial Assets (i) Investments - - - 19.57 - 19.57 (ii) Loans 492.97 - 492.97 8.98 - 8.98 (iii) Other Financial Assets 13.14 - 13.14 1,043.43 - 1,043.43 Non-current Tax Assets (Net) 1,367.74 - 1,367.74 1,337.98 - 1,337.98 Other Non-current Assets 713.07 - 713.07 1,867.91 - 1,867.91
51,212.80 - 51,212.80 45,428.76 - 45,428.76 Current AssetsInventories 23,391.73 - 23,391.73 24,614.47 - 24,614.47
Financial Assets (i) Investments 300.17 - 300.17 54.03 - 54.03 (ii) Trade receivables 23,040.70 - 23,040.70 17,388.94 - 17,388.94 (iii) Cash and cash equivalents 1,212.40 - 1,212.40 683.31 - 683.31 (iv) Bank balances other than (iii) above 1,197.68 - 1,197.68 2,387.40 - 2,387.40 (v) Loans 48.46 - 48.46 0.43 - 0.43 (vi) Other Financial Assets 1,221.75 - 1,221.75 971.47 - 971.47 Other current assets 3,665.53 - 3,665.53 2,371.42 - 2,371.42
54,078.42 - 54,078.42 48,471.47 - 48,471.47
TOTAL ASSETS 105,291.22 - 105,291.22 93,900.23 - 93,900.23
EQUITY AND LIABILITIES
EQUITYEquity Share Capital 3,760.98 - 3,760.98 3,760.98 - 3,760.98 Instruments entirely equity in nature 145.29 - 145.29 145.29 - 145.29 Other Equity (i) 45,389.63 (458.28) 44,931.35 40,504.81 (459.71) 40,045.10
49,295.90 (458.28) 48,837.62 44,411.08 (459.71) 43,951.37 LIABILITIESNon-Current LiabilitiesFinancial Liabilities (i) Borrowings 7,679.35 - 7,679.35 6,599.25 - 6,599.25 Provisions 855.10 - 855.10 741.37 - 741.37 Deferred Tax Liabilities (Net) (i) 2,455.79 (244.72) 2,211.07 1,803.01 (243.29) 1,559.72
10,990.24 (244.72) 10,745.52 9,143.63 (243.29) 8,900.34 Current LiabilitiesFinancial Liabilities (i) Borrowings 21,521.28 - 21,521.28 21,463.60 - 21,463.60 (ii) Trade Payables (a) Total outstanding dues of micro enterprises and small enterprises
37.11 - 37.11 25.24 - 25.24
(b) Total outstanding dues of creditors other than micro enterprises and small enterprises
14,976.58 - 14,976.58 12,006.76 - 12,006.76
(iii) Other financial liabilities 7,518.33 - 7,518.33 5,640.95 - 5,640.95
Other current liabilities (i) 274.99 703.00 977.99 630.91 703.00 1,333.91 Provisions 81.81 - 81.81 72.72 - 72.72 Current Tax Liabilities (Net) 594.98 - 594.98 505.34 - 505.34
45,005.08 703.00 45,708.08 40,345.52 703.00 41,048.52
TOTAL EQUITY AND LIABILITIES 105,291.22 - 105,291.22 93,900.23 - 93,900.23
NOTES TO THE CONSOLIDATED FINANCIAL STATEMENTS(All amounts in Rs. Lakhs, unless otherwise stated)
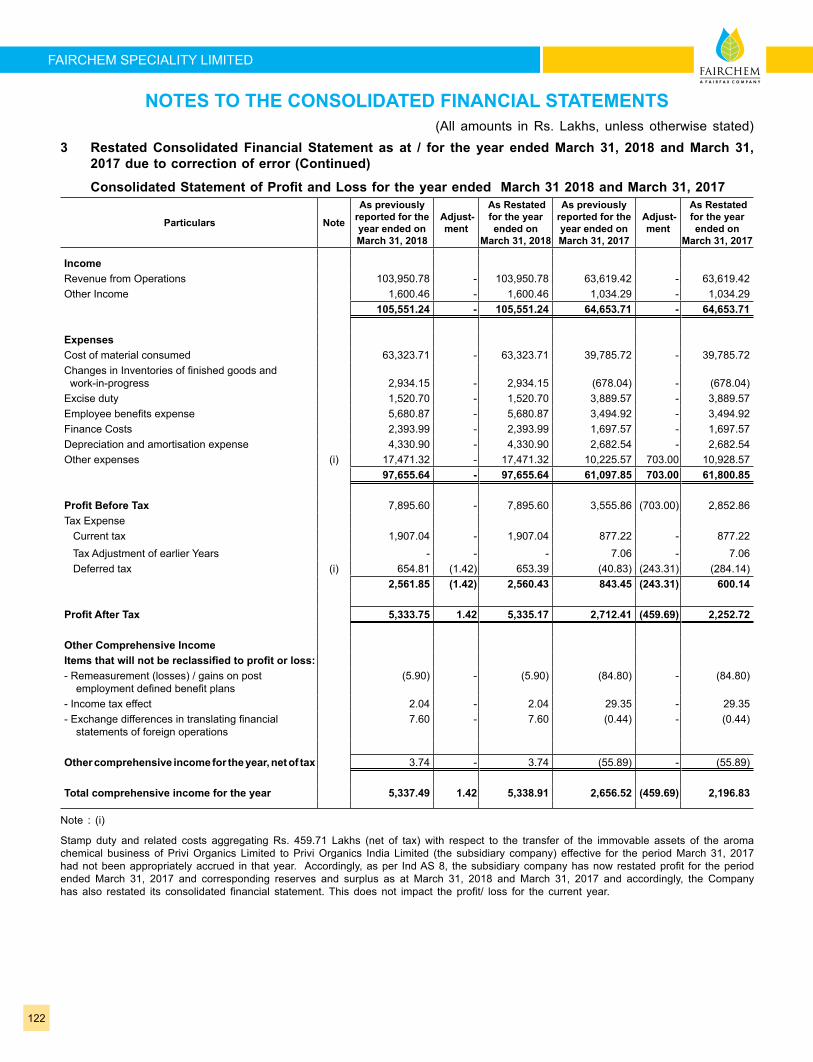
122
FAIRCHEM SPECIALITY LIMITED
3 Restated Consolidated Financial Statement as at / for the year ended March 31, 2018 and March 31, 2017 due to correction of error (Continued)
Consolidated Statement of Profit and Loss for the year ended March 31 2018 and March 31, 2017
Particulars Note
As previously reported for the year ended on March 31, 2018
Adjust-ment
As Restated for the year ended on
March 31, 2018
As previously reported for the year ended on March 31, 2017
Adjust-ment
As Restated for the year ended on
March 31, 2017
IncomeRevenue from Operations 103,950.78 - 103,950.78 63,619.42 - 63,619.42 Other Income 1,600.46 - 1,600.46 1,034.29 - 1,034.29
105,551.24 - 105,551.24 64,653.71 - 64,653.71
ExpensesCost of material consumed 63,323.71 - 63,323.71 39,785.72 - 39,785.72 Changes in Inventories of finished goods and work-in-progress
2,934.15
-
2,934.15
(678.04)
-
(678.04)
Excise duty 1,520.70 - 1,520.70 3,889.57 - 3,889.57 Employee benefits expense 5,680.87 - 5,680.87 3,494.92 - 3,494.92 Finance Costs 2,393.99 - 2,393.99 1,697.57 - 1,697.57 Depreciation and amortisation expense 4,330.90 - 4,330.90 2,682.54 - 2,682.54 Other expenses (i) 17,471.32 - 17,471.32 10,225.57 703.00 10,928.57
97,655.64 - 97,655.64 61,097.85 703.00 61,800.85
Profit Before Tax 7,895.60 - 7,895.60 3,555.86 (703.00) 2,852.86 Tax Expense Current tax 1,907.04 - 1,907.04 877.22 - 877.22 Tax Adjustment of earlier Years - - - 7.06 - 7.06 Deferred tax (i) 654.81 (1.42) 653.39 (40.83) (243.31) (284.14)
2,561.85 (1.42) 2,560.43 843.45 (243.31) 600.14
Profit After Tax 5,333.75 1.42 5,335.17 2,712.41 (459.69) 2,252.72
Other Comprehensive IncomeItems that will not be reclassified to profit or loss:- Remeasurement (losses) / gains on post employment defined benefit plans
(5.90) - (5.90) (84.80) - (84.80)
- Income tax effect 2.04 - 2.04 29.35 - 29.35 - Exchange differences in translating financial statements of foreign operations
7.60 - 7.60 (0.44) - (0.44)
Other comprehensive income for the year, net of tax 3.74 - 3.74 (55.89) - (55.89)
Total comprehensive income for the year 5,337.49 1.42 5,338.91 2,656.52 (459.69) 2,196.83
Note : (i)
Stamp duty and related costs aggregating Rs. 459.71 Lakhs (net of tax) with respect to the transfer of the immovable assets of the aroma chemical business of Privi Organics Limited to Privi Organics India Limited (the subsidiary company) effective for the period March 31, 2017 had not been appropriately accrued in that year. Accordingly, as per Ind AS 8, the subsidiary company has now restated profit for the period ended March 31, 2017 and corresponding reserves and surplus as at March 31, 2018 and March 31, 2017 and accordingly, the Company has also restated its consolidated financial statement. This does not impact the profit/ loss for the current year.
NOTES TO THE CONSOLIDATED FINANCIAL STATEMENTS(All amounts in Rs. Lakhs, unless otherwise stated)
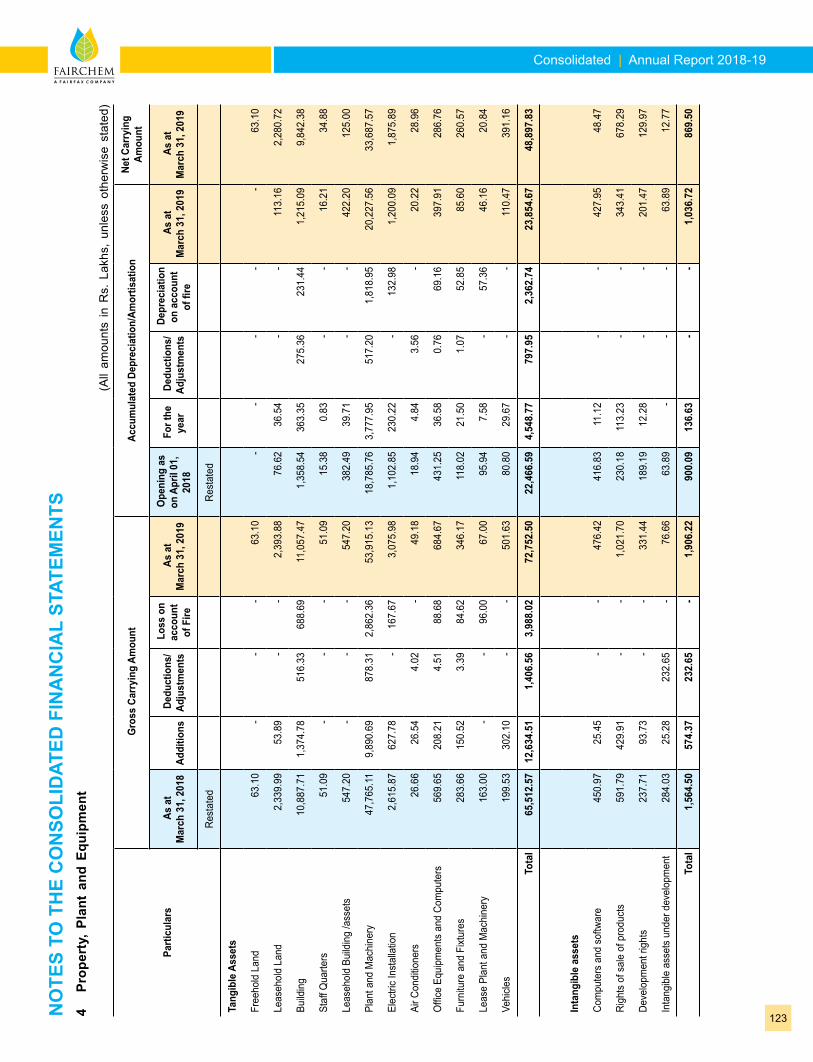
Consolidated | Annual Report 2018-19
123NO
TES
TO T
HE
CO
NSO
LID
ATED
FIN
AN
CIA
L ST
ATEM
ENTS
4 Pr
oper
ty,
Plan
t an
d Eq
uipm
ent
(All
amou
nts
in R
s. L
akhs
, un
less
oth
erw
ise
stat
ed)
Parti
cula
rs
Gro
ss C
arry
ing
Amou
nt
Accu
mul
ated
Dep
reci
atio
n/Am
ortis
atio
nNe
t Car
ryin
g Am
ount
As
at
Mar
ch 3
1, 2
018
Ad
ditio
ns
Ded
uctio
ns/
Adju
stm
ents
Los
s on
ac
coun
t of
Fire
As
at
Mar
ch 3
1, 2
019
Ope
ning
as
on A
pril
01,
2018
For
the
year
D
educ
tions
/Ad
just
men
ts
Dep
reci
atio
n on
acc
ount
of
fire
As
at
Mar
ch 3
1, 2
019
As
at
Mar
ch 3
1, 2
019
Rest
ated
Rest
ated
Tang
ible
Ass
ets
Free
hold
Lan
d 6
3.10
-
- -
63.
10
- -
- -
- 6
3.10
Leas
ehol
d La
nd 2
,339
.99
53.
89
- -
2,3
93.8
8 7
6.62
3
6.54
-
- 1
13.1
6 2
,280
.72
Build
ing
10,
887.
71
1,3
74.7
8 5
16.3
3 6
88.6
9 1
1,05
7.47
1
,358
.54
363
.35
275
.36
231
.44
1,2
15.0
9 9
,842
.38
Staf
f Qua
rters
51.
09
- -
- 5
1.09
1
5.38
0
.83
- -
16.
21
34.
88
Leas
ehol
d Bu
ildin
g /a
sset
s 5
47.2
0 -
- -
547
.20
382
.49
39.
71
- -
422
.20
125
.00
Plan
t and
Mac
hine
ry 4
7,76
5.11
9
,890
.69
878
.31
2,8
62.3
6 5
3,91
5.13
1
8,78
5.76
3
,777
.95
517
.20
1,8
18.9
5 2
0,22
7.56
3
3,68
7.57
Elec
tric
Inst
alla
tion
2,6
15.8
7 6
27.7
8 -
167
.67
3,0
75.9
8 1
,102
.85
230
.22
- 1
32.9
8 1
,200
.09
1,8
75.8
9
Air C
ondi
tione
rs 2
6.66
2
6.54
4
.02
- 4
9.18
1
8.94
4
.84
3.5
6 -
20.
22
28.
96
Offi
ce E
quip
men
ts a
nd C
ompu
ters
569
.65
208
.21
4.5
1 8
8.68
6
84.6
7 4
31.2
5 3
6.58
0
.76
69.
16
397
.91
286
.76
Furn
iture
and
Fixt
ures
283
.66
150
.52
3.3
9 8
4.62
3
46.1
7 1
18.0
2 2
1.50
1
.07
52.
85
85.
60
260
.57
Leas
e Pl
ant a
nd M
achi
nery
163
.00
- -
96.
00
67.
00
95.
94
7.5
8 -
57.
36
46.
16
20.
84
Vehi
cles
199
.53
302
.10
- -
501
.63
80.
80
29.
67
- -
110
.47
391
.16
Tota
l 6
5,51
2.57
1
2,63
4.51
1
,406
.56
3,9
88.0
2 7
2,75
2.50
2
2,46
6.59
4
,548
.77
797
.95
2,3
62.7
4 2
3,85
4.67
4
8,89
7.83
Inta
ngib
le a
sset
s
Com
pute
rs a
nd s
oftw
are
450
.97
25.
45
- -
476
.42
416
.83
11.
12
- -
427
.95
48.
47
Righ
ts o
f sal
e of
pro
duct
s 5
91.7
9 4
29.9
1 -
- 1
,021
.70
230
.18
113
.23
- -
343
.41
678
.29
Deve
lopm
ent r
ight
s 2
37.7
1 9
3.73
-
- 3
31.4
4 1
89.1
9 1
2.28
-
- 2
01.4
7 1
29.9
7
Inta
ngib
le a
sset
s un
der d
evel
opm
ent
284
.03
25.
28
232
.65
- 7
6.66
6
3.89
-
- -
63.
89
12.
77
Tota
l 1
,564
.50
574
.37
232
.65
- 1
,906
.22
900
.09
136
.63
- -
1,0
36.7
2 8
69.5
0
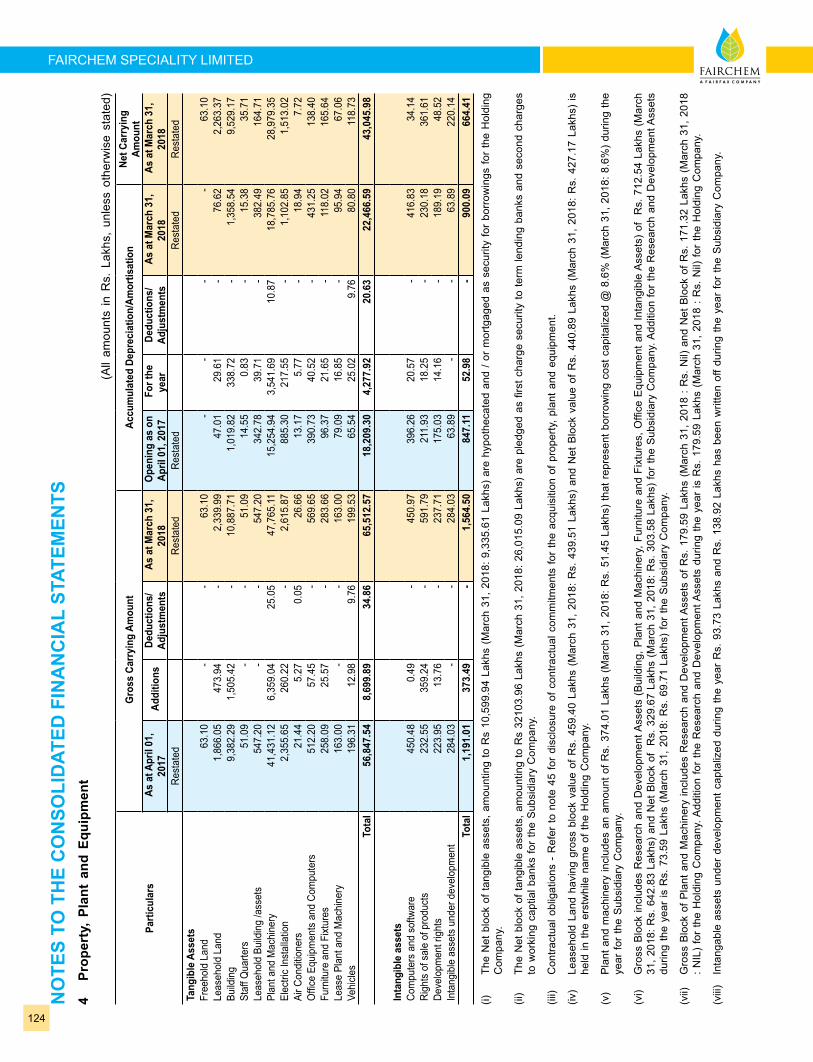
124
FAIRCHEM SPECIALITY LIMITEDN
OTE
S TO
TH
E C
ON
SOLI
DAT
ED F
INA
NC
IAL
STAT
EMEN
TS4
Prop
erty
, Pl
ant
and
Equi
pmen
t(A
ll am
ount
s in
Rs.
Lak
hs,
unle
ss o
ther
wis
e st
ated
)
Parti
cula
rs
Gro
ss C
arry
ing
Amou
nt
Accu
mul
ated
Dep
reci
atio
n/Am
ortis
atio
nNe
t Car
ryin
g Am
ount
As
at A
pril
01,
2017
A
dditi
ons
Dedu
ctio
ns/
Adju
stm
ents
A
s at
Mar
ch 3
1,
2018
O
peni
ng a
s on
Ap
ril 0
1, 2
017
For
the
year
De
duct
ions
/ Ad
just
men
ts A
s at
Mar
ch 3
1,
2018
A
s at
Mar
ch 3
1,
2018
Re
stat
ed
Rest
ated
Re
stat
ed
Rest
ated
Re
stat
ed
Tang
ible
Ass
ets
Fr
eeho
ld L
and
63.
10
- -
63.
10
- -
- -
63.
10
Leas
ehol
d La
nd 1
,866
.05
473
.94
- 2
,339
.99
47.
01
29.
61
- 7
6.62
2
,263
.37
Build
ing
9,3
82.2
9 1
,505
.42
- 1
0,88
7.71
1
,019
.82
338
.72
- 1
,358
.54
9,5
29.1
7 St
aff Q
uarte
rs 5
1.09
-
- 5
1.09
1
4.55
0
.83
- 1
5.38
3
5.71
Le
aseh
old
Build
ing
/ass
ets
547
.20
- -
547
.20
342
.78
39.
71
- 3
82.4
9 1
64.7
1 Pl
ant a
nd M
achi
nery
41,
431.
12
6,3
59.0
4 2
5.05
4
7,76
5.11
1
5,25
4.94
3
,541
.69
10.
87
18,
785.
76
28,
979.
35
Elec
tric
Inst
alla
tion
2,3
55.6
5 2
60.2
2 -
2,6
15.8
7 8
85.3
0 2
17.5
5 -
1,1
02.8
5 1
,513
.02
Air C
ondi
tione
rs 2
1.44
5
.27
0.0
5 2
6.66
1
3.17
5
.77
- 1
8.94
7
.72
Offi
ce E
quip
men
ts a
nd C
ompu
ters
512
.20
57.
45
- 5
69.6
5 3
90.7
3 4
0.52
-
431
.25
138
.40
Furn
iture
and
Fixt
ures
258
.09
25.
57
- 2
83.6
6 9
6.37
2
1.65
-
118
.02
165
.64
Leas
e Pl
ant a
nd M
achi
nery
163
.00
- -
163
.00
79.
09
16.
85
- 9
5.94
6
7.06
Ve
hicle
s 1
96.3
1 1
2.98
9
.76
199
.53
65.
54
25.
02
9.7
6 8
0.80
1
18.7
3 To
tal
56,
847.
54
8,6
99.8
9 3
4.86
6
5,51
2.57
1
8,20
9.30
4
,277
.92
20.
63
22,
466.
59
43,
045.
98
Inta
ngib
le a
sset
sCo
mpu
ters
and
sof
twar
e 4
50.4
8 0
.49
- 4
50.9
7 3
96.2
6 2
0.57
-
416
.83
34.
14
Righ
ts o
f sal
e of
pro
duct
s 2
32.5
5 3
59.2
4 -
591
.79
211
.93
18.
25
- 2
30.1
8 3
61.6
1 De
velo
pmen
t rig
hts
223
.95
13.
76
- 2
37.7
1 1
75.0
3 1
4.16
-
189
.19
48.
52
Inta
ngib
le a
sset
s un
der d
evel
opm
ent
284
.03
- -
284
.03
63.
89
- -
63.
89
220
.14
Tota
l 1
,191
.01
373
.49
- 1
,564
.50
847
.11
52.
98
- 9
00.0
9 6
64.4
1
(i)
The
Net
blo
ck o
f tan
gibl
e as
sets
, am
ount
ing
to R
s 10
,599
.94
Lakh
s (M
arch
31,
201
8: 9
,335
.61
Lakh
s) a
re h
ypot
heca
ted
and
/ or
mor
tgag
ed a
s se
curit
y fo
r bo
rrow
ings
for
the
Hol
ding
C
ompa
ny.
(ii)
The
Net
blo
ck o
f tan
gibl
e as
sets
, am
ount
ing
to R
s 32
103.
96 L
akhs
(M
arch
31,
201
8: 2
6,01
5.09
Lak
hs)
are
pled
ged
as fi
rst c
harg
e se
curit
y to
term
lend
ing
bank
s an
d se
cond
cha
rges
to
wor
king
cap
tial b
anks
for
the
Sub
sidi
ary
Com
pany
.
(iii)
Con
tract
ual o
blig
atio
ns -
Ref
er to
not
e 45
for
disc
losu
re o
f con
tract
ual c
omm
itmen
ts fo
r th
e ac
quis
ition
of p
rope
rty, p
lant
and
equ
ipm
ent.
(iv)
Leas
ehol
d La
nd h
avin
g gr
oss
bloc
k va
lue
of R
s. 4
59.4
0 La
khs
(Mar
ch 3
1, 2
018:
Rs.
439
.51
Lakh
s) a
nd N
et B
lock
val
ue o
f Rs.
440
.89
Lakh
s (M
arch
31,
201
8: R
s. 4
27.1
7 La
khs)
is
held
in th
e er
stw
hile
nam
e of
the
Hol
ding
Com
pany
.
(v)
Pla
nt a
nd m
achi
nery
incl
udes
an
amou
nt o
f Rs.
374
.01
Lakh
s (M
arch
31,
201
8: R
s. 5
1.45
Lak
hs)
that
rep
rese
nt b
orro
win
g co
st c
apita
lized
@ 8
.6%
(M
arch
31,
201
8: 8
.6%
) du
ring
the
year
for
the
Sub
sidi
ary
Com
pany
.
(vi)
Gro
ss B
lock
incl
udes
Res
earc
h an
d D
evel
opm
ent A
sset
s (B
uild
ing,
Pla
nt a
nd M
achi
nery
, Fur
nitu
re a
nd F
ixtu
res,
Offi
ce E
quip
men
t and
Inta
ngib
le A
sset
s) o
f R
s. 7
12.5
4 La
khs
(Mar
ch
31, 2
018:
Rs.
642
.83
Lakh
s) a
nd N
et B
lock
of
Rs.
329
.67
Lakh
s (M
arch
31,
201
8: R
s. 3
03.5
8 La
khs)
for
the
Sub
sidi
ary
Com
pany
. Add
ition
for
the
Res
earc
h an
d D
evel
opm
ent A
sset
s du
ring
the
year
is R
s. 7
3.59
Lak
hs (
Mar
ch 3
1, 2
018:
Rs.
69.
71 L
akhs
) fo
r th
e S
ubsi
diar
y C
ompa
ny.
(vii)
G
ross
Blo
ck o
f Pla
nt a
nd M
achi
nery
incl
udes
Res
earc
h an
d D
evel
opm
ent A
sset
s of
Rs.
179
.59
Lakh
s (M
arch
31,
201
8 : R
s. N
il) a
nd N
et B
lock
of R
s. 1
71.3
2 La
khs
(Mar
ch 3
1, 2
018
: NIL
) fo
r th
e H
oldi
ng C
ompa
ny. A
dditi
on fo
r th
e R
esea
rch
and
Dev
elop
men
t Ass
ets
durin
g th
e ye
ar is
Rs.
179
.59
Lakh
s (M
arch
31,
201
8 : R
s. N
il) fo
r th
e H
oldi
ng C
ompa
ny.
(viii
) In
tang
able
ass
ets
unde
r de
velo
pmen
t cap
taliz
ed d
urin
g th
e ye
ar R
s. 9
3.73
Lak
hs a
nd R
s. 1
38.9
2 La
khs
has
been
writ
ten
off d
urin
g th
e ye
ar fo
r th
e S
ubsi
diar
y C
ompa
ny.
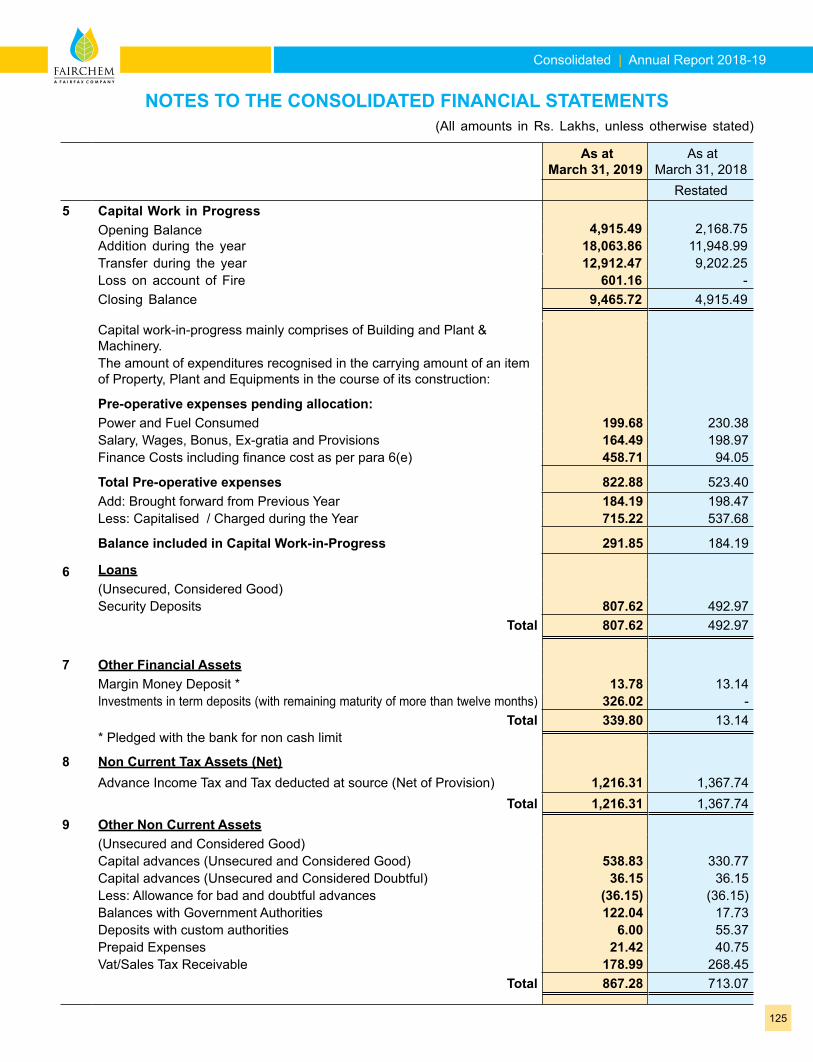
Consolidated | Annual Report 2018-19
125
As at March 31, 2019
As at March 31, 2018
Restated5 Capital Work in Progress
Opening Balance 4,915.49 2,168.75 Addition during the year 18,063.86 11,948.99 Transfer during the year 12,912.47 9,202.25 Loss on account of Fire 601.16 - Closing Balance 9,465.72 4,915.49
Capital work-in-progress mainly comprises of Building and Plant & Machinery.The amount of expenditures recognised in the carrying amount of an item of Property, Plant and Equipments in the course of its construction:
Pre-operative expenses pending allocation:Power and Fuel Consumed 199.68 230.38 Salary, Wages, Bonus, Ex-gratia and Provisions 164.49 198.97 Finance Costs including finance cost as per para 6(e) 458.71 94.05
Total Pre-operative expenses 822.88 523.40 Add: Brought forward from Previous Year 184.19 198.47 Less: Capitalised / Charged during the Year 715.22 537.68
Balance included in Capital Work-in-Progress 291.85 184.19
6 Loans(Unsecured, Considered Good)Security Deposits 807.62 492.97
Total 807.62 492.97
7 Other Financial AssetsMargin Money Deposit * 13.78 13.14 Investments in term deposits (with remaining maturity of more than twelve months) 326.02 -
Total 339.80 13.14 * Pledged with the bank for non cash limit
8 Non Current Tax Assets (Net)Advance Income Tax and Tax deducted at source (Net of Provision) 1,216.31 1,367.74
Total 1,216.31 1,367.74 9 Other Non Current Assets
(Unsecured and Considered Good)Capital advances (Unsecured and Considered Good) 538.83 330.77 Capital advances (Unsecured and Considered Doubtful) 36.15 36.15 Less: Allowance for bad and doubtful advances (36.15) (36.15)Balances with Government Authorities 122.04 17.73 Deposits with custom authorities 6.00 55.37 Prepaid Expenses 21.42 40.75 Vat/Sales Tax Receivable 178.99 268.45
Total 867.28 713.07
NOTES TO THE CONSOLIDATED FINANCIAL STATEMENTS(All amounts in Rs. Lakhs, unless otherwise stated)
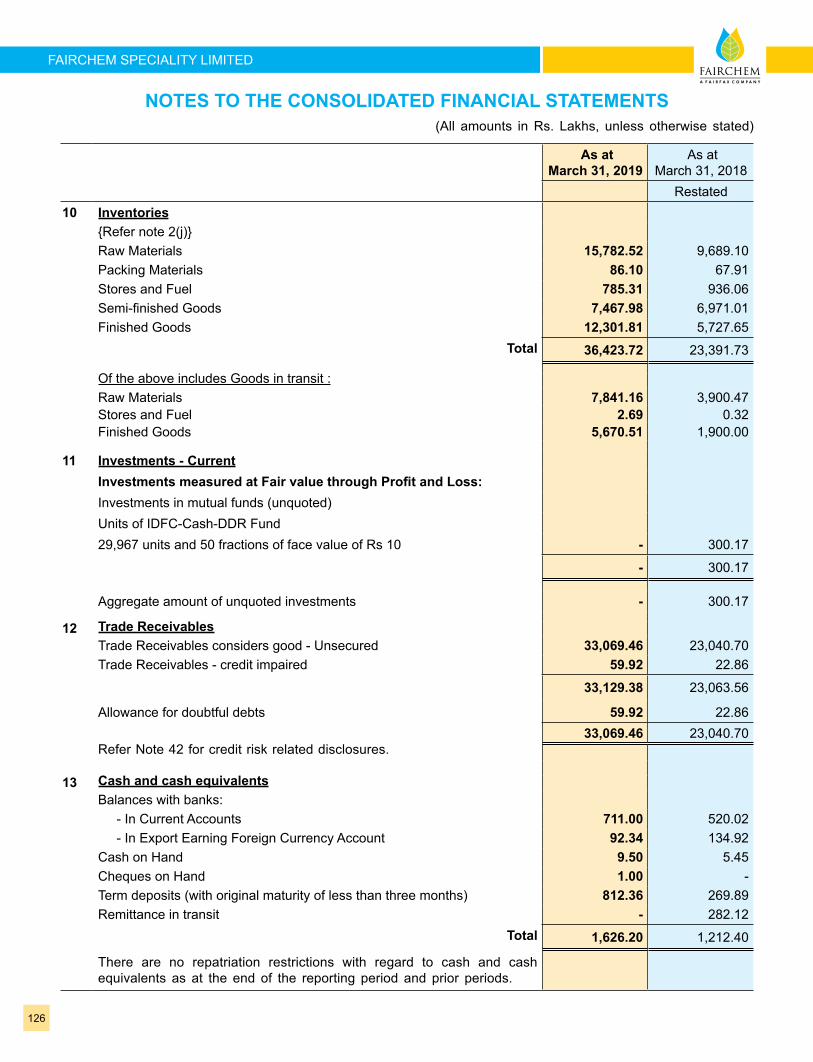
126
FAIRCHEM SPECIALITY LIMITED
As at March 31, 2019
As at March 31, 2018
Restated10 Inventories
{Refer note 2(j)}Raw Materials 15,782.52 9,689.10 Packing Materials 86.10 67.91 Stores and Fuel 785.31 936.06 Semi-finished Goods 7,467.98 6,971.01 Finished Goods 12,301.81 5,727.65
Total 36,423.72 23,391.73
Of the above includes Goods in transit :Raw Materials 7,841.16 3,900.47 Stores and Fuel 2.69 0.32 Finished Goods 5,670.51 1,900.00
11 Investments - CurrentInvestments measured at Fair value through Profit and Loss:Investments in mutual funds (unquoted)Units of IDFC-Cash-DDR Fund29,967 units and 50 fractions of face value of Rs 10 - 300.17
- 300.17
Aggregate amount of unquoted investments - 300.17
12 Trade ReceivablesTrade Receivables considers good - Unsecured 33,069.46 23,040.70 Trade Receivables - credit impaired 59.92 22.86
33,129.38 23,063.56
Allowance for doubtful debts 59.92 22.86 33,069.46 23,040.70
Refer Note 42 for credit risk related disclosures.
13 Cash and cash equivalentsBalances with banks: - In Current Accounts 711.00 520.02 - In Export Earning Foreign Currency Account 92.34 134.92 Cash on Hand 9.50 5.45 Cheques on Hand 1.00 - Term deposits (with original maturity of less than three months) 812.36 269.89 Remittance in transit - 282.12
Total 1,626.20 1,212.40
There are no repatriation restrictions with regard to cash and cash equivalents as at the end of the reporting period and prior periods.
NOTES TO THE CONSOLIDATED FINANCIAL STATEMENTS(All amounts in Rs. Lakhs, unless otherwise stated)
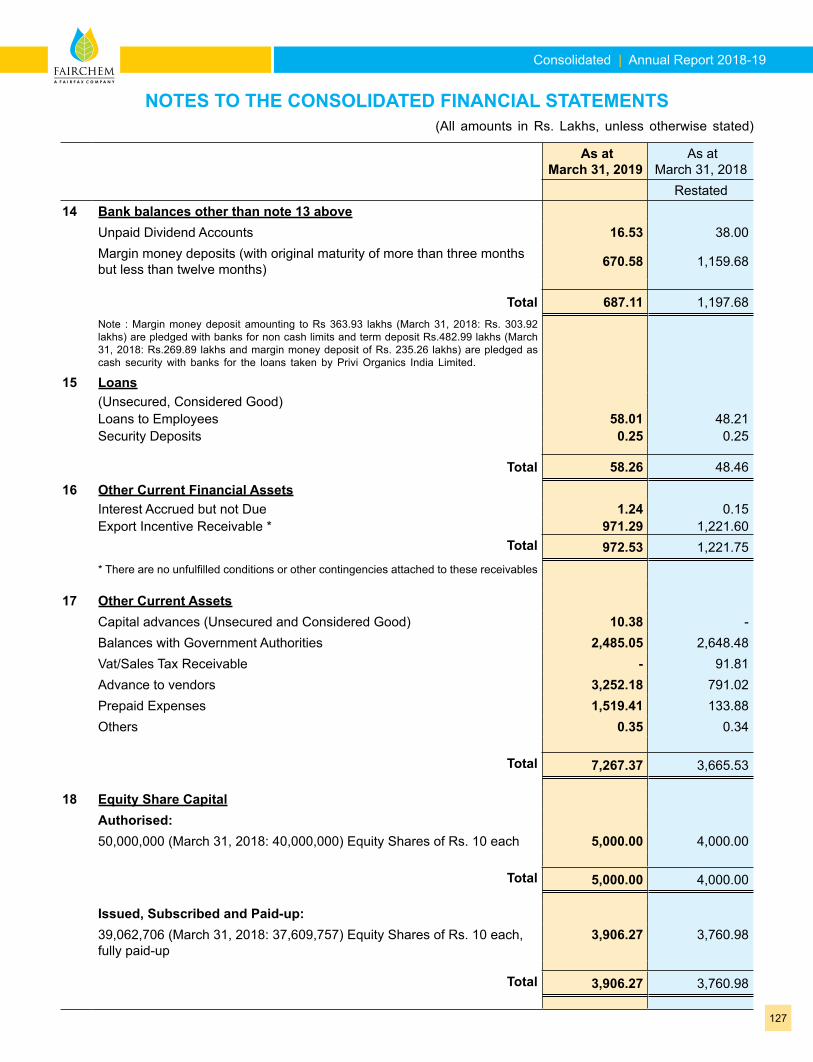
Consolidated | Annual Report 2018-19
127
As at March 31, 2019
As at March 31, 2018
Restated14 Bank balances other than note 13 above
Unpaid Dividend Accounts 16.53 38.00 Margin money deposits (with original maturity of more than three months but less than twelve months) 670.58 1,159.68
Total 687.11 1,197.68 Note : Margin money deposit amounting to Rs 363.93 lakhs (March 31, 2018: Rs. 303.92 lakhs) are pledged with banks for non cash limits and term deposit Rs.482.99 lakhs (March 31, 2018: Rs.269.89 lakhs and margin money deposit of Rs. 235.26 lakhs) are pledged as cash security with banks for the loans taken by Privi Organics India Limited.
15 Loans(Unsecured, Considered Good)Loans to Employees 58.01 48.21 Security Deposits 0.25 0.25
Total 58.26 48.46
16 Other Current Financial AssetsInterest Accrued but not Due 1.24 0.15 Export Incentive Receivable * 971.29 1,221.60
Total 972.53 1,221.75 * There are no unfulfilled conditions or other contingencies attached to these receivables
17 Other Current AssetsCapital advances (Unsecured and Considered Good) 10.38 - Balances with Government Authorities 2,485.05 2,648.48 Vat/Sales Tax Receivable - 91.81 Advance to vendors 3,252.18 791.02 Prepaid Expenses 1,519.41 133.88 Others 0.35 0.34
Total 7,267.37 3,665.53
18 Equity Share CapitalAuthorised:50,000,000 (March 31, 2018: 40,000,000) Equity Shares of Rs. 10 each 5,000.00 4,000.00
Total 5,000.00 4,000.00
Issued, Subscribed and Paid-up:39,062,706 (March 31, 2018: 37,609,757) Equity Shares of Rs. 10 each, fully paid-up
3,906.27 3,760.98
Total 3,906.27 3,760.98
NOTES TO THE CONSOLIDATED FINANCIAL STATEMENTS(All amounts in Rs. Lakhs, unless otherwise stated)
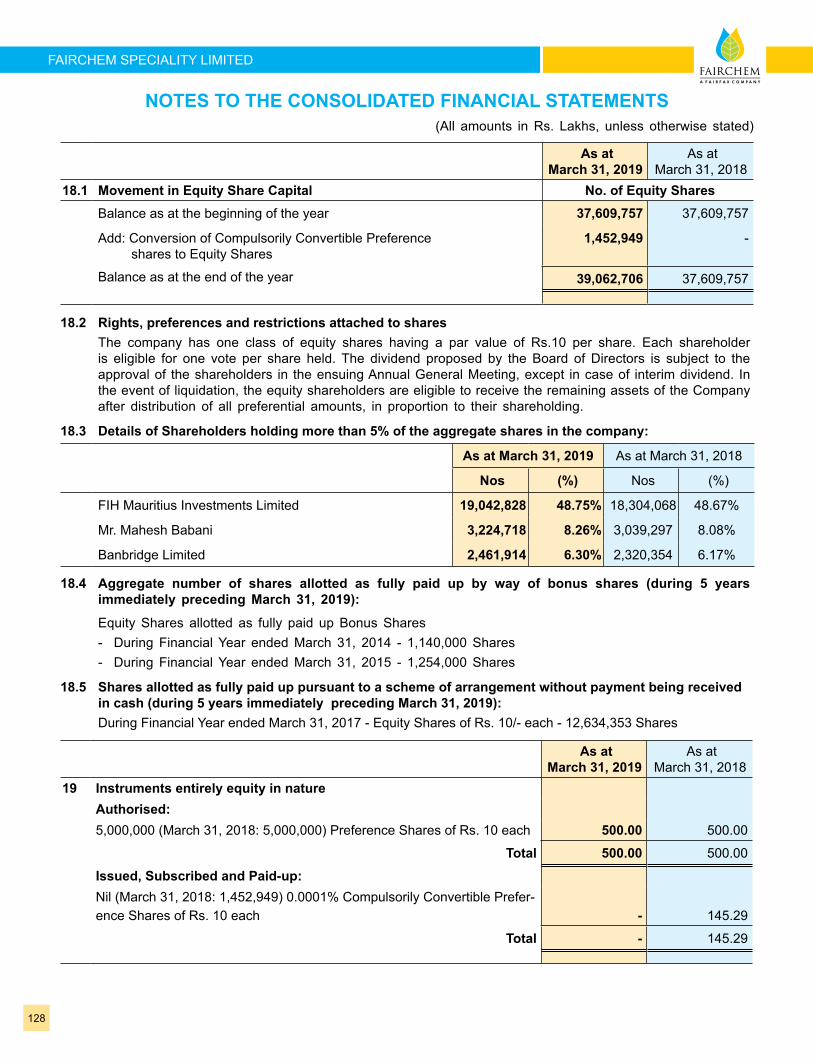
128
FAIRCHEM SPECIALITY LIMITED
As at March 31, 2019
As at March 31, 2018
18.1 Movement in Equity Share Capital No. of Equity Shares Balance as at the beginning of the year 37,609,757 37,609,757
Add: Conversion of Compulsorily Convertible Preference shares to Equity Shares
1,452,949 -
Balance as at the end of the year 39,062,706 37,609,757
18.2 Rights, preferences and restrictions attached to sharesThe company has one class of equity shares having a par value of Rs.10 per share. Each shareholder is eligible for one vote per share held. The dividend proposed by the Board of Directors is subject to the approval of the shareholders in the ensuing Annual General Meeting, except in case of interim dividend. In the event of liquidation, the equity shareholders are eligible to receive the remaining assets of the Company after distribution of all preferential amounts, in proportion to their shareholding.
18.3 Details of Shareholders holding more than 5% of the aggregate shares in the company:
As at March 31, 2019 As at March 31, 2018
Nos (%) Nos (%)
FIH Mauritius Investments Limited 19,042,828 48.75% 18,304,068 48.67%
Mr. Mahesh Babani 3,224,718 8.26% 3,039,297 8.08%
Banbridge Limited 2,461,914 6.30% 2,320,354 6.17%
18.4 Aggregate number of shares allotted as fully paid up by way of bonus shares (during 5 years immediately preceding March 31, 2019):
Equity Shares allotted as fully paid up Bonus Shares- During Financial Year ended March 31, 2014 - 1,140,000 Shares- During Financial Year ended March 31, 2015 - 1,254,000 Shares
18.5 Shares allotted as fully paid up pursuant to a scheme of arrangement without payment being received in cash (during 5 years immediately preceding March 31, 2019):During Financial Year ended March 31, 2017 - Equity Shares of Rs. 10/- each - 12,634,353 Shares
As at March 31, 2019
As at March 31, 2018
19 Instruments entirely equity in natureAuthorised:5,000,000 (March 31, 2018: 5,000,000) Preference Shares of Rs. 10 each 500.00 500.00
Total 500.00 500.00
Issued, Subscribed and Paid-up:Nil (March 31, 2018: 1,452,949) 0.0001% Compulsorily Convertible Prefer-ence Shares of Rs. 10 each - 145.29
Total - 145.29
NOTES TO THE CONSOLIDATED FINANCIAL STATEMENTS(All amounts in Rs. Lakhs, unless otherwise stated)
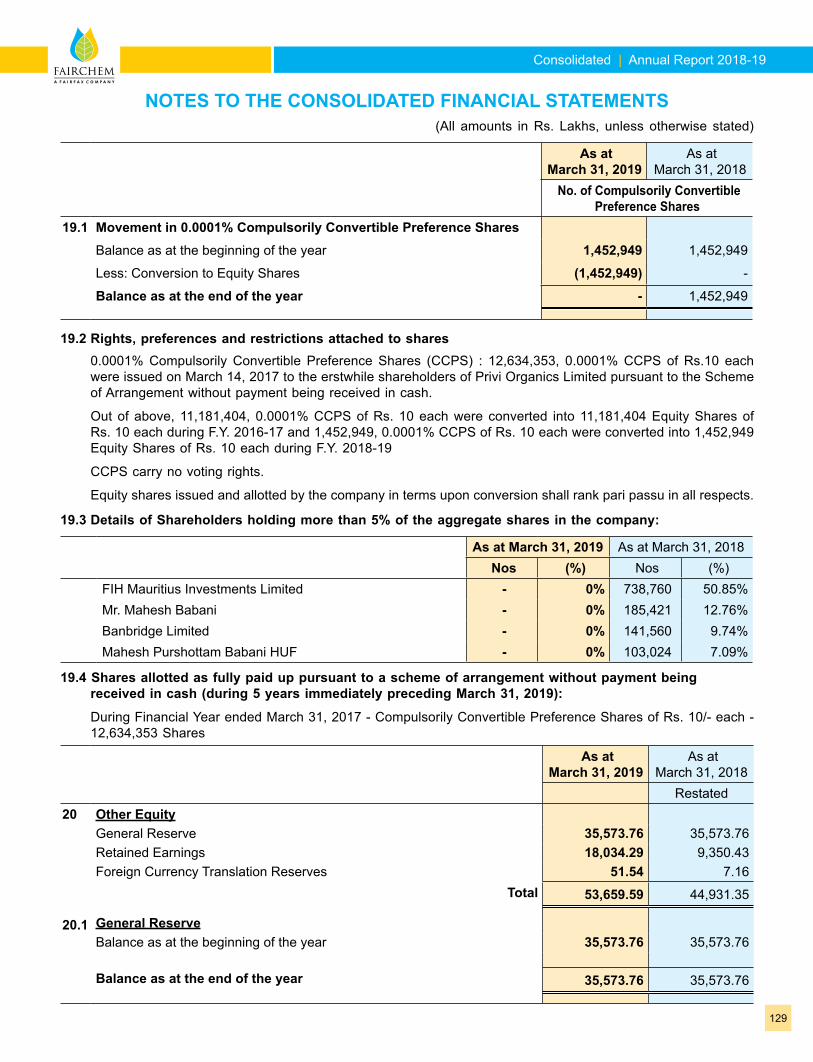
Consolidated | Annual Report 2018-19
129
As at March 31, 2019
As at March 31, 2018
No. of Compulsorily Convertible Preference Shares
19.1 Movement in 0.0001% Compulsorily Convertible Preference SharesBalance as at the beginning of the year 1,452,949 1,452,949
Less: Conversion to Equity Shares (1,452,949) -
Balance as at the end of the year - 1,452,949
19.2 Rights, preferences and restrictions attached to shares 0.0001% Compulsorily Convertible Preference Shares (CCPS) : 12,634,353, 0.0001% CCPS of Rs.10 each
were issued on March 14, 2017 to the erstwhile shareholders of Privi Organics Limited pursuant to the Scheme of Arrangement without payment being received in cash.
Out of above, 11,181,404, 0.0001% CCPS of Rs. 10 each were converted into 11,181,404 Equity Shares of Rs. 10 each during F.Y. 2016-17 and 1,452,949, 0.0001% CCPS of Rs. 10 each were converted into 1,452,949 Equity Shares of Rs. 10 each during F.Y. 2018-19
CCPS carry no voting rights.
Equity shares issued and allotted by the company in terms upon conversion shall rank pari passu in all respects.
19.3 Details of Shareholders holding more than 5% of the aggregate shares in the company:
As at March 31, 2019 As at March 31, 2018 Nos (%) Nos (%)
FIH Mauritius Investments Limited - 0% 738,760 50.85%Mr. Mahesh Babani - 0% 185,421 12.76%Banbridge Limited - 0% 141,560 9.74%Mahesh Purshottam Babani HUF - 0% 103,024 7.09%
19.4 Shares allotted as fully paid up pursuant to a scheme of arrangement without payment being received in cash (during 5 years immediately preceding March 31, 2019):
During Financial Year ended March 31, 2017 - Compulsorily Convertible Preference Shares of Rs. 10/- each - 12,634,353 Shares
As at March 31, 2019
As at March 31, 2018
Restated20 Other Equity
General Reserve 35,573.76 35,573.76 Retained Earnings 18,034.29 9,350.43 Foreign Currency Translation Reserves 51.54 7.16
Total 53,659.59 44,931.35
20.1 General ReserveBalance as at the beginning of the year 35,573.76 35,573.76
Balance as at the end of the year 35,573.76 35,573.76
NOTES TO THE CONSOLIDATED FINANCIAL STATEMENTS(All amounts in Rs. Lakhs, unless otherwise stated)
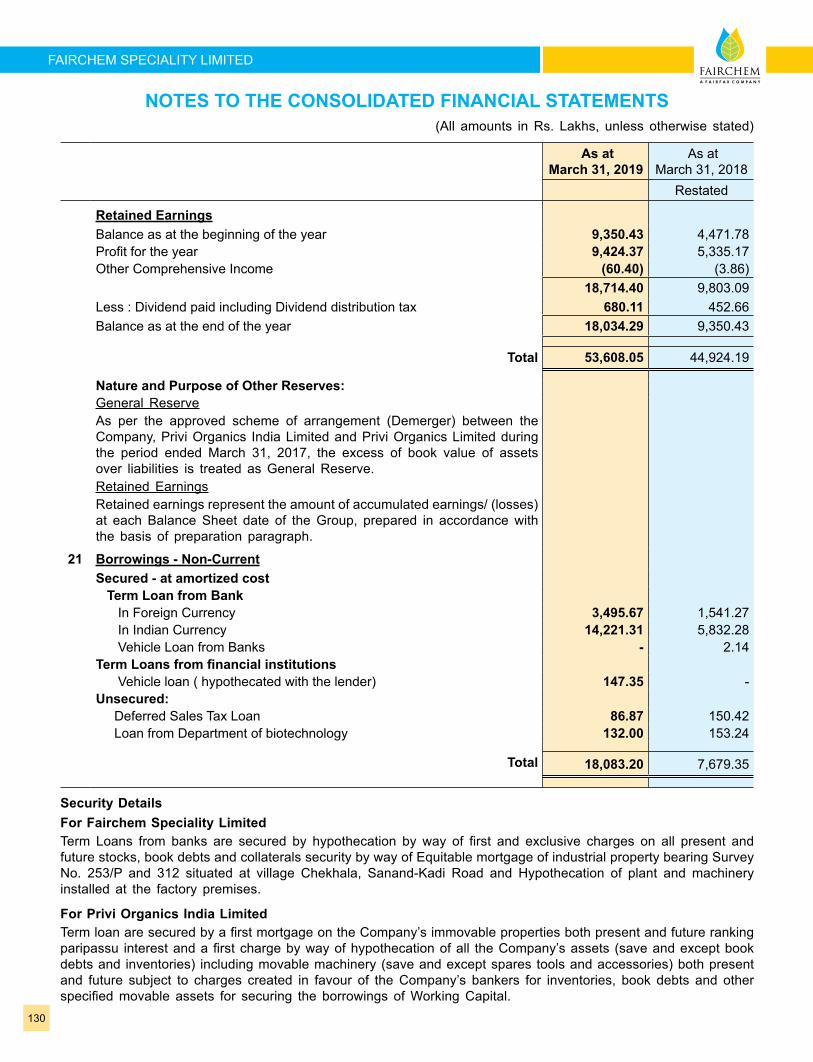
130
FAIRCHEM SPECIALITY LIMITED
As at March 31, 2019
As at March 31, 2018
Restated
Retained EarningsBalance as at the beginning of the year 9,350.43 4,471.78 Profit for the year 9,424.37 5,335.17 Other Comprehensive Income (60.40) (3.86)
18,714.40 9,803.09 Less : Dividend paid including Dividend distribution tax 680.11 452.66 Balance as at the end of the year 18,034.29 9,350.43
Total 53,608.05 44,924.19
Nature and Purpose of Other Reserves:General ReserveAs per the approved scheme of arrangement (Demerger) between the Company, Privi Organics India Limited and Privi Organics Limited during the period ended March 31, 2017, the excess of book value of assets over liabilities is treated as General Reserve.Retained EarningsRetained earnings represent the amount of accumulated earnings/ (losses) at each Balance Sheet date of the Group, prepared in accordance with the basis of preparation paragraph.
21 Borrowings - Non-CurrentSecured - at amortized cost Term Loan from Bank In Foreign Currency 3,495.67 1,541.27 In Indian Currency 14,221.31 5,832.28 Vehicle Loan from Banks - 2.14 Term Loans from financial institutions Vehicle loan ( hypothecated with the lender) 147.35 - Unsecured: Deferred Sales Tax Loan 86.87 150.42 Loan from Department of biotechnology 132.00 153.24
Total 18,083.20 7,679.35
Security DetailsFor Fairchem Speciality LimitedTerm Loans from banks are secured by hypothecation by way of first and exclusive charges on all present and future stocks, book debts and collaterals security by way of Equitable mortgage of industrial property bearing Survey No. 253/P and 312 situated at village Chekhala, Sanand-Kadi Road and Hypothecation of plant and machinery installed at the factory premises.
For Privi Organics India LimitedTerm loan are secured by a first mortgage on the Company’s immovable properties both present and future ranking paripassu interest and a first charge by way of hypothecation of all the Company’s assets (save and except book debts and inventories) including movable machinery (save and except spares tools and accessories) both present and future subject to charges created in favour of the Company’s bankers for inventories, book debts and other specified movable assets for securing the borrowings of Working Capital.
NOTES TO THE CONSOLIDATED FINANCIAL STATEMENTS(All amounts in Rs. Lakhs, unless otherwise stated)
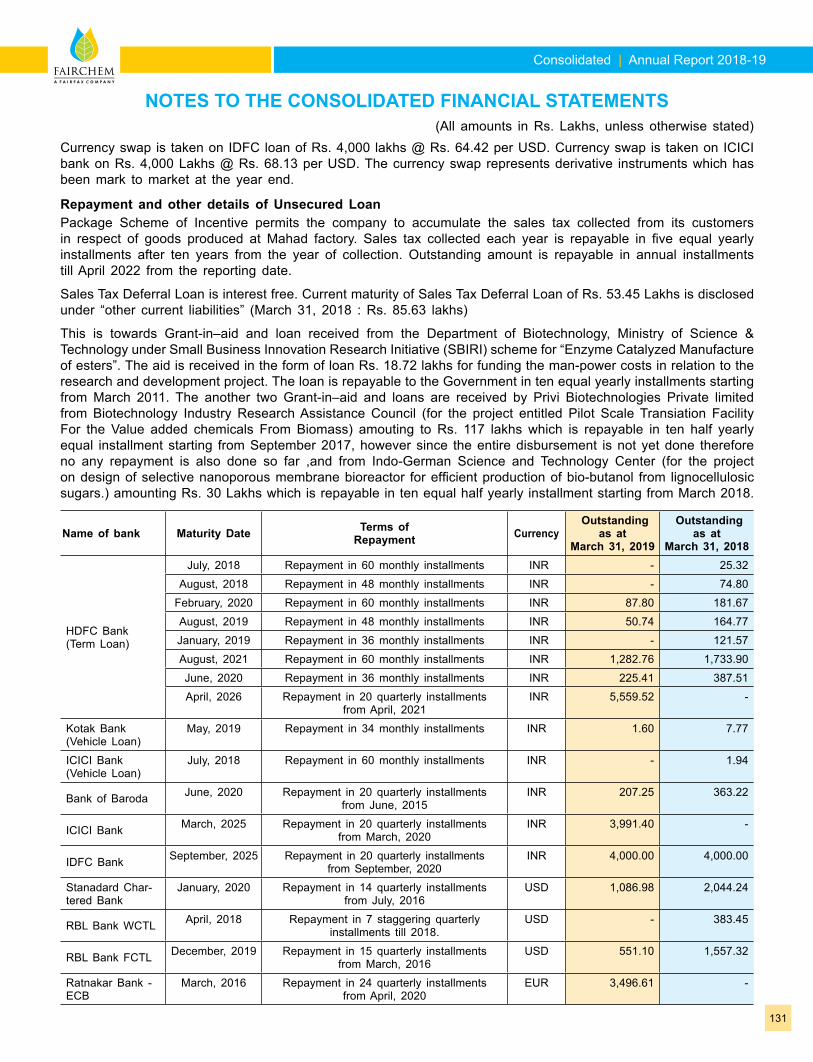
Consolidated | Annual Report 2018-19
131
Currency swap is taken on IDFC loan of Rs. 4,000 lakhs @ Rs. 64.42 per USD. Currency swap is taken on ICICI bank on Rs. 4,000 Lakhs @ Rs. 68.13 per USD. The currency swap represents derivative instruments which has been mark to market at the year end.
Repayment and other details of Unsecured LoanPackage Scheme of Incentive permits the company to accumulate the sales tax collected from its customers in respect of goods produced at Mahad factory. Sales tax collected each year is repayable in five equal yearly installments after ten years from the year of collection. Outstanding amount is repayable in annual installments till April 2022 from the reporting date.
Sales Tax Deferral Loan is interest free. Current maturity of Sales Tax Deferral Loan of Rs. 53.45 Lakhs is disclosed under “other current liabilities” (March 31, 2018 : Rs. 85.63 lakhs)
This is towards Grant-in–aid and loan received from the Department of Biotechnology, Ministry of Science & Technology under Small Business Innovation Research Initiative (SBIRI) scheme for “Enzyme Catalyzed Manufacture of esters”. The aid is received in the form of loan Rs. 18.72 lakhs for funding the man-power costs in relation to the research and development project. The loan is repayable to the Government in ten equal yearly installments starting from March 2011. The another two Grant-in–aid and loans are received by Privi Biotechnologies Private limited from Biotechnology Industry Research Assistance Council (for the project entitled Pilot Scale Transiation Facility For the Value added chemicals From Biomass) amouting to Rs. 117 lakhs which is repayable in ten half yearly equal installment starting from September 2017, however since the entire disbursement is not yet done therefore no any repayment is also done so far ,and from Indo-German Science and Technology Center (for the project on design of selective nanoporous membrane bioreactor for efficient production of bio-butanol from lignocellulosic sugars.) amounting Rs. 30 Lakhs which is repayable in ten equal half yearly installment starting from March 2018.
Name of bank Maturity Date Terms of Repayment Currency
Outstanding as at
March 31, 2019
Outstanding as at
March 31, 2018
HDFC Bank (Term Loan)
July, 2018 Repayment in 60 monthly installments INR - 25.32 August, 2018 Repayment in 48 monthly installments INR - 74.80
February, 2020 Repayment in 60 monthly installments INR 87.80 181.67 August, 2019 Repayment in 48 monthly installments INR 50.74 164.77 January, 2019 Repayment in 36 monthly installments INR - 121.57 August, 2021 Repayment in 60 monthly installments INR 1,282.76 1,733.90 June, 2020 Repayment in 36 monthly installments INR 225.41 387.51 April, 2026 Repayment in 20 quarterly installments
from April, 2021 INR 5,559.52 -
Kotak Bank (Vehicle Loan)
May, 2019 Repayment in 34 monthly installments INR 1.60 7.77
ICICI Bank (Vehicle Loan)
July, 2018 Repayment in 60 monthly installments INR - 1.94
Bank of Baroda June, 2020 Repayment in 20 quarterly installments from June, 2015
INR 207.25 363.22
ICICI Bank March, 2025 Repayment in 20 quarterly installments from March, 2020
INR 3,991.40 -
IDFC Bank September, 2025 Repayment in 20 quarterly installments from September, 2020
INR 4,000.00 4,000.00
Stanadard Char-tered Bank
January, 2020 Repayment in 14 quarterly installments from July, 2016
USD 1,086.98 2,044.24
RBL Bank WCTL April, 2018 Repayment in 7 staggering quarterly installments till 2018.
USD - 383.45
RBL Bank FCTL December, 2019 Repayment in 15 quarterly installments from March, 2016
USD 551.10 1,557.32
Ratnakar Bank - ECB
March, 2016 Repayment in 24 quarterly installments from April, 2020
EUR 3,496.61 -
NOTES TO THE CONSOLIDATED FINANCIAL STATEMENTS(All amounts in Rs. Lakhs, unless otherwise stated)
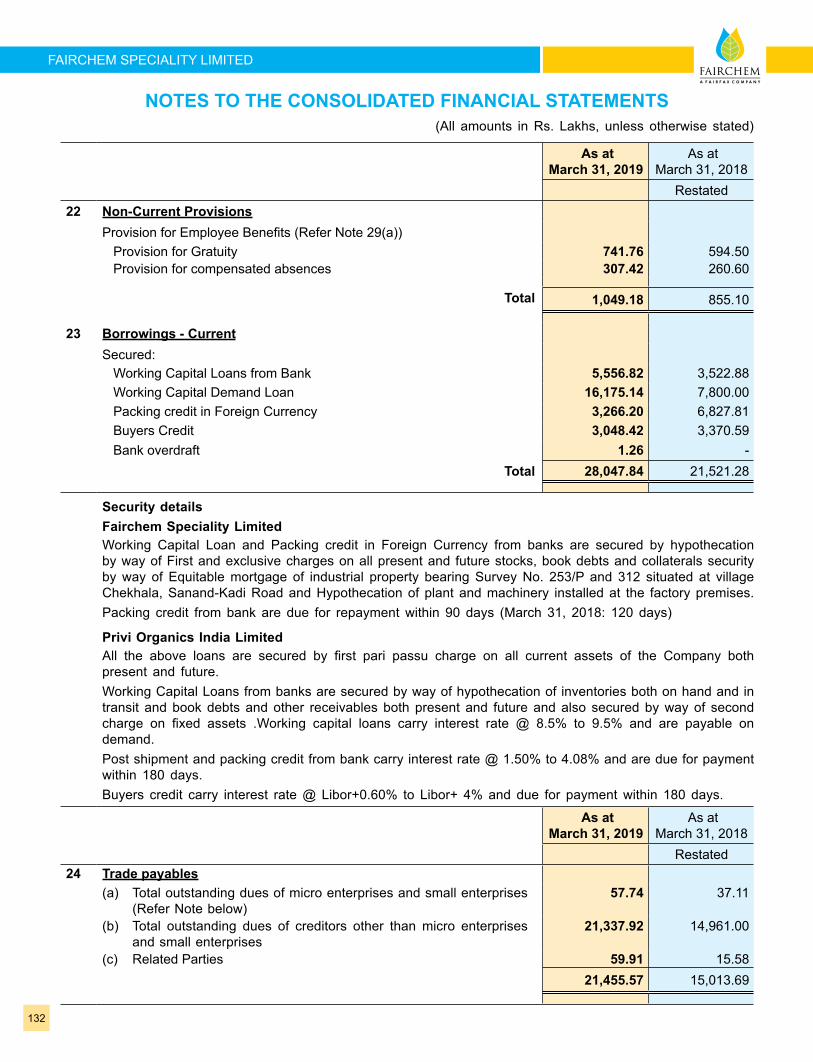
132
FAIRCHEM SPECIALITY LIMITED
As at March 31, 2019
As at March 31, 2018
Restated22 Non-Current Provisions
Provision for Employee Benefits (Refer Note 29(a)) Provision for Gratuity 741.76 594.50 Provision for compensated absences 307.42 260.60
Total 1,049.18 855.10
23 Borrowings - CurrentSecured: Working Capital Loans from Bank 5,556.82 3,522.88 Working Capital Demand Loan 16,175.14 7,800.00 Packing credit in Foreign Currency 3,266.20 6,827.81 Buyers Credit 3,048.42 3,370.59 Bank overdraft 1.26 -
Total 28,047.84 21,521.28
Security details Fairchem Speciality LimitedWorking Capital Loan and Packing credit in Foreign Currency from banks are secured by hypothecation by way of First and exclusive charges on all present and future stocks, book debts and collaterals security by way of Equitable mortgage of industrial property bearing Survey No. 253/P and 312 situated at village Chekhala, Sanand-Kadi Road and Hypothecation of plant and machinery installed at the factory premises. Packing credit from bank are due for repayment within 90 days (March 31, 2018: 120 days)
Privi Organics India LimitedAll the above loans are secured by first pari passu charge on all current assets of the Company both present and future.Working Capital Loans from banks are secured by way of hypothecation of inventories both on hand and in transit and book debts and other receivables both present and future and also secured by way of second charge on fixed assets .Working capital loans carry interest rate @ 8.5% to 9.5% and are payable on demand. Post shipment and packing credit from bank carry interest rate @ 1.50% to 4.08% and are due for payment within 180 days. Buyers credit carry interest rate @ Libor+0.60% to Libor+ 4% and due for payment within 180 days.
As at March 31, 2019
As at March 31, 2018
Restated24 Trade payables
(a) Total outstanding dues of micro enterprises and small enterprises (Refer Note below)
57.74 37.11
(b) Total outstanding dues of creditors other than micro enterprises and small enterprises
21,337.92 14,961.00
(c) Related Parties 59.91 15.58 21,455.57 15,013.69
NOTES TO THE CONSOLIDATED FINANCIAL STATEMENTS(All amounts in Rs. Lakhs, unless otherwise stated)
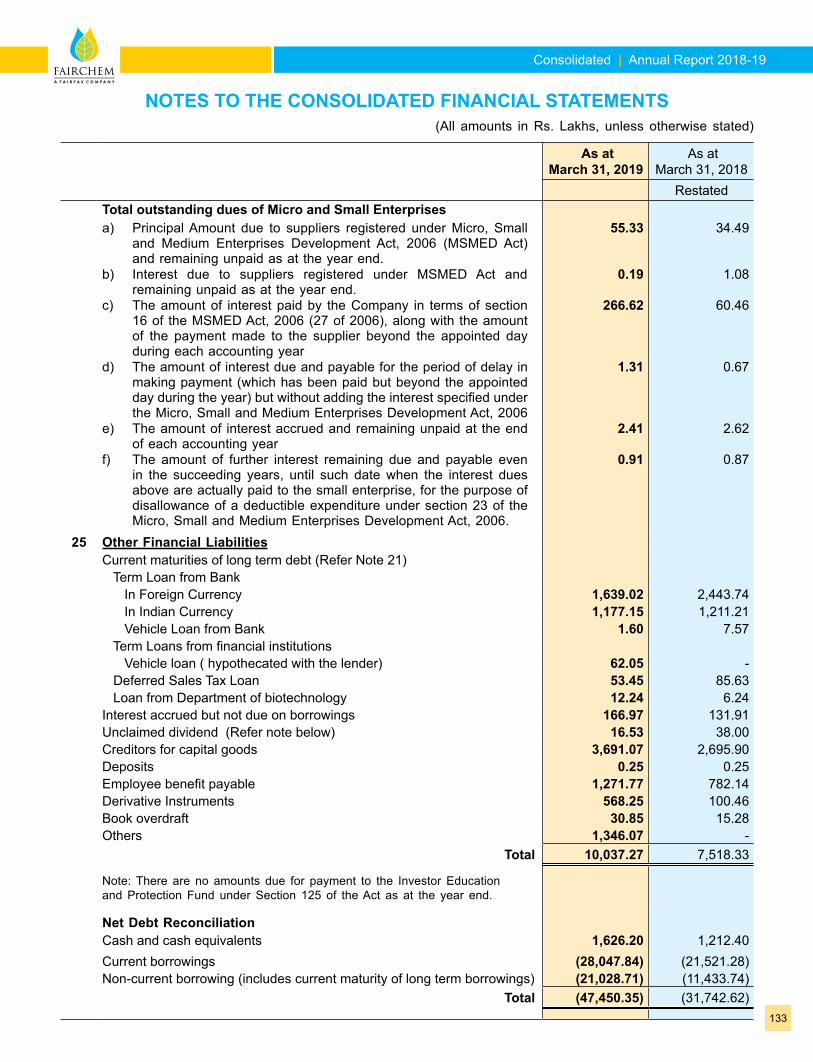
Consolidated | Annual Report 2018-19
133
As at March 31, 2019
As at March 31, 2018
RestatedTotal outstanding dues of Micro and Small Enterprises a) Principal Amount due to suppliers registered under Micro, Small
and Medium Enterprises Development Act, 2006 (MSMED Act) and remaining unpaid as at the year end.
55.33 34.49
b) Interest due to suppliers registered under MSMED Act and remaining unpaid as at the year end.
0.19 1.08
c) The amount of interest paid by the Company in terms of section 16 of the MSMED Act, 2006 (27 of 2006), along with the amount of the payment made to the supplier beyond the appointed day during each accounting year
266.62 60.46
d) The amount of interest due and payable for the period of delay in making payment (which has been paid but beyond the appointed day during the year) but without adding the interest specified under the Micro, Small and Medium Enterprises Development Act, 2006
1.31 0.67
e) The amount of interest accrued and remaining unpaid at the end of each accounting year
2.41 2.62
f) The amount of further interest remaining due and payable even in the succeeding years, until such date when the interest dues above are actually paid to the small enterprise, for the purpose of disallowance of a deductible expenditure under section 23 of the Micro, Small and Medium Enterprises Development Act, 2006.
0.91 0.87
25 Other Financial LiabilitiesCurrent maturities of long term debt (Refer Note 21) Term Loan from Bank In Foreign Currency 1,639.02 2,443.74 In Indian Currency 1,177.15 1,211.21 Vehicle Loan from Bank 1.60 7.57 Term Loans from financial institutions Vehicle loan ( hypothecated with the lender) 62.05 - Deferred Sales Tax Loan 53.45 85.63 Loan from Department of biotechnology 12.24 6.24 Interest accrued but not due on borrowings 166.97 131.91 Unclaimed dividend (Refer note below) 16.53 38.00 Creditors for capital goods 3,691.07 2,695.90 Deposits 0.25 0.25 Employee benefit payable 1,271.77 782.14 Derivative Instruments 568.25 100.46 Book overdraft 30.85 15.28 Others 1,346.07 -
Total 10,037.27 7,518.33
Note: There are no amounts due for payment to the Investor Education and Protection Fund under Section 125 of the Act as at the year end.
Net Debt ReconciliationCash and cash equivalents 1,626.20 1,212.40 Current borrowings (28,047.84) (21,521.28)Non-current borrowing (includes current maturity of long term borrowings) (21,028.71) (11,433.74)
Total (47,450.35) (31,742.62)
NOTES TO THE CONSOLIDATED FINANCIAL STATEMENTS(All amounts in Rs. Lakhs, unless otherwise stated)
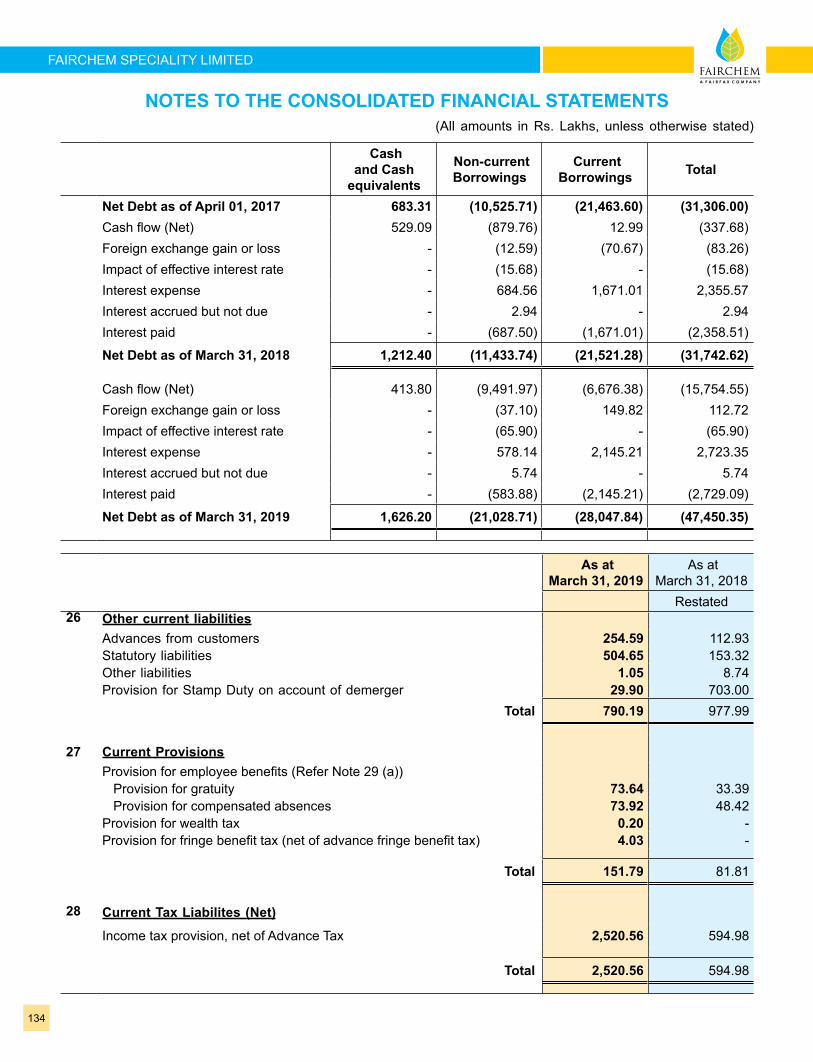
134
FAIRCHEM SPECIALITY LIMITED
Cash and Cash
equivalents
Non-current Borrowings
Current Borrowings Total
Net Debt as of April 01, 2017 683.31 (10,525.71) (21,463.60) (31,306.00)Cash flow (Net) 529.09 (879.76) 12.99 (337.68)Foreign exchange gain or loss - (12.59) (70.67) (83.26)Impact of effective interest rate - (15.68) - (15.68)Interest expense - 684.56 1,671.01 2,355.57 Interest accrued but not due - 2.94 - 2.94 Interest paid - (687.50) (1,671.01) (2,358.51)
Net Debt as of March 31, 2018 1,212.40 (11,433.74) (21,521.28) (31,742.62)
Cash flow (Net) 413.80 (9,491.97) (6,676.38) (15,754.55)Foreign exchange gain or loss - (37.10) 149.82 112.72 Impact of effective interest rate - (65.90) - (65.90)Interest expense - 578.14 2,145.21 2,723.35 Interest accrued but not due - 5.74 - 5.74 Interest paid - (583.88) (2,145.21) (2,729.09)
Net Debt as of March 31, 2019 1,626.20 (21,028.71) (28,047.84) (47,450.35)
As at March 31, 2019
As at March 31, 2018
Restated26 Other current liabilities
Advances from customers 254.59 112.93 Statutory liabilities 504.65 153.32 Other liabilities 1.05 8.74 Provision for Stamp Duty on account of demerger 29.90 703.00
Total 790.19 977.99
27 Current ProvisionsProvision for employee benefits (Refer Note 29 (a)) Provision for gratuity 73.64 33.39 Provision for compensated absences 73.92 48.42 Provision for wealth tax 0.20 - Provision for fringe benefit tax (net of advance fringe benefit tax) 4.03 -
Total 151.79 81.81
28 Current Tax Liabilites (Net)
Income tax provision, net of Advance Tax 2,520.56 594.98
Total 2,520.56 594.98
NOTES TO THE CONSOLIDATED FINANCIAL STATEMENTS(All amounts in Rs. Lakhs, unless otherwise stated)
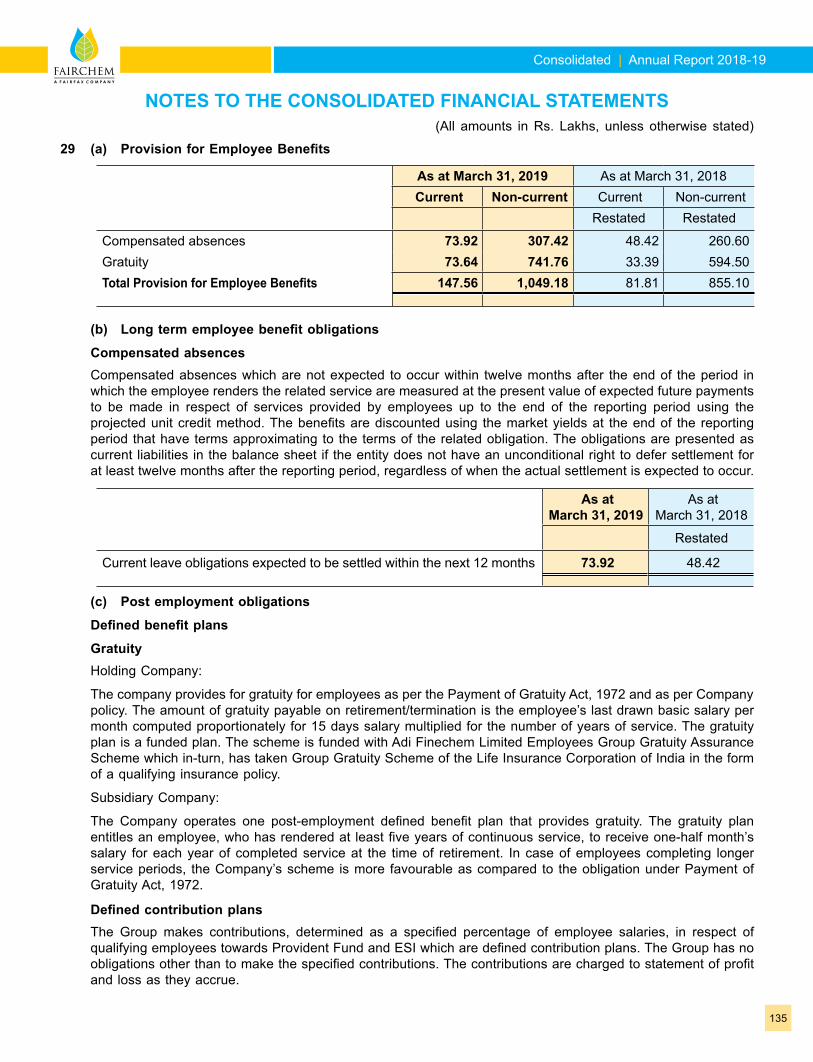
Consolidated | Annual Report 2018-19
135
29 (a) Provision for Employee Benefits
As at March 31, 2019 As at March 31, 2018 Current Non-current Current Non-current
Restated Restated
Compensated absences 73.92 307.42 48.42 260.60 Gratuity 73.64 741.76 33.39 594.50 Total Provision for Employee Benefits 147.56 1,049.18 81.81 855.10
(b) Long term employee benefit obligations
Compensated absences Compensated absences which are not expected to occur within twelve months after the end of the period in
which the employee renders the related service are measured at the present value of expected future payments to be made in respect of services provided by employees up to the end of the reporting period using the projected unit credit method. The benefits are discounted using the market yields at the end of the reporting period that have terms approximating to the terms of the related obligation. The obligations are presented as current liabilities in the balance sheet if the entity does not have an unconditional right to defer settlement for at least twelve months after the reporting period, regardless of when the actual settlement is expected to occur.
As at March 31, 2019
As at March 31, 2018
Restated
Current leave obligations expected to be settled within the next 12 months 73.92 48.42
(c) Post employment obligations
Defined benefit plans
Gratuity Holding Company:
The company provides for gratuity for employees as per the Payment of Gratuity Act, 1972 and as per Company policy. The amount of gratuity payable on retirement/termination is the employee’s last drawn basic salary per month computed proportionately for 15 days salary multiplied for the number of years of service. The gratuity plan is a funded plan. The scheme is funded with Adi Finechem Limited Employees Group Gratuity Assurance Scheme which in-turn, has taken Group Gratuity Scheme of the Life Insurance Corporation of India in the form of a qualifying insurance policy.
Subsidiary Company:
The Company operates one post-employment defined benefit plan that provides gratuity. The gratuity plan entitles an employee, who has rendered at least five years of continuous service, to receive one-half month’s salary for each year of completed service at the time of retirement. In case of employees completing longer service periods, the Company’s scheme is more favourable as compared to the obligation under Payment of Gratuity Act, 1972.
Defined contribution plans The Group makes contributions, determined as a specified percentage of employee salaries, in respect of
qualifying employees towards Provident Fund and ESI which are defined contribution plans. The Group has no obligations other than to make the specified contributions. The contributions are charged to statement of profit and loss as they accrue.
NOTES TO THE CONSOLIDATED FINANCIAL STATEMENTS(All amounts in Rs. Lakhs, unless otherwise stated)
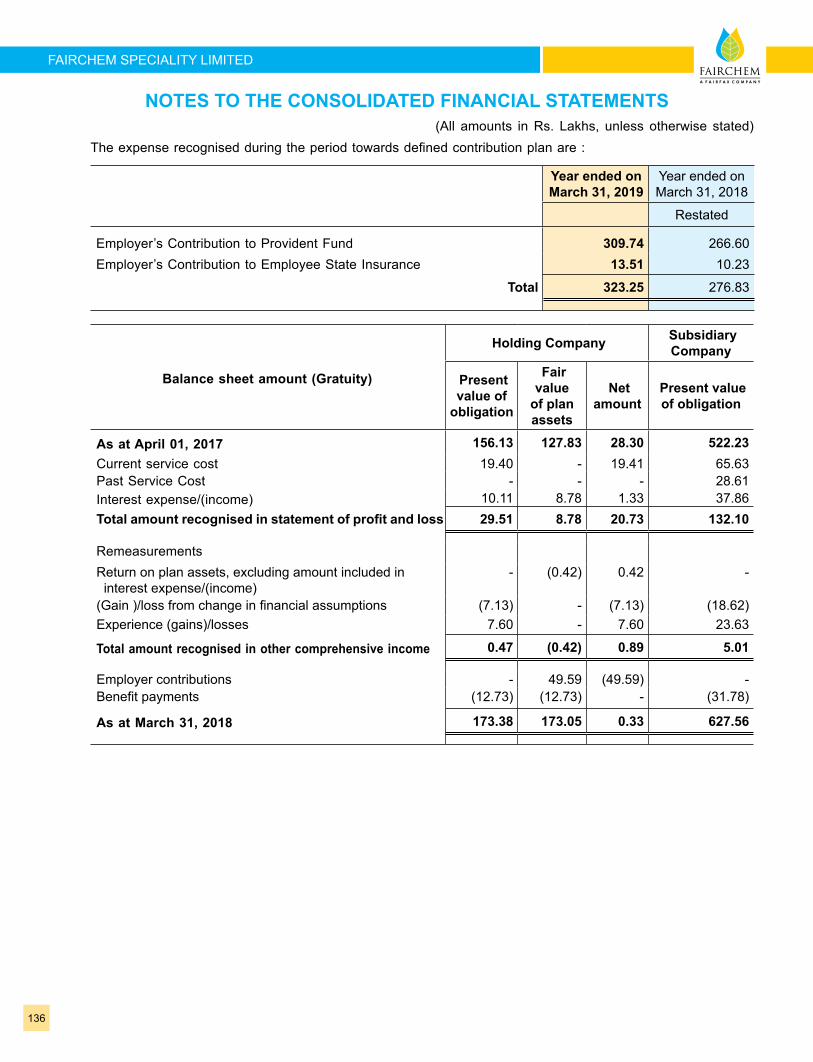
136
FAIRCHEM SPECIALITY LIMITED
The expense recognised during the period towards defined contribution plan are :
Year ended on March 31, 2019
Year ended on March 31, 2018
Restated
Employer’s Contribution to Provident Fund 309.74 266.60 Employer’s Contribution to Employee State Insurance 13.51 10.23
Total 323.25 276.83
Balance sheet amount (Gratuity)
Holding Company Subsidiary Company
Present value of
obligation
Fair value
of plan assets
Net amount
Present value of obligation
As at April 01, 2017 156.13 127.83 28.30 522.23 Current service cost 19.40 - 19.41 65.63 Past Service Cost - - - 28.61 Interest expense/(income) 10.11 8.78 1.33 37.86 Total amount recognised in statement of profit and loss 29.51 8.78 20.73 132.10
RemeasurementsReturn on plan assets, excluding amount included in interest expense/(income)
- (0.42) 0.42 -
(Gain )/loss from change in financial assumptions (7.13) - (7.13) (18.62)Experience (gains)/losses 7.60 - 7.60 23.63
Total amount recognised in other comprehensive income 0.47 (0.42) 0.89 5.01
Employer contributions - 49.59 (49.59) - Benefit payments (12.73) (12.73) - (31.78)
As at March 31, 2018 173.38 173.05 0.33 627.56
NOTES TO THE CONSOLIDATED FINANCIAL STATEMENTS(All amounts in Rs. Lakhs, unless otherwise stated)
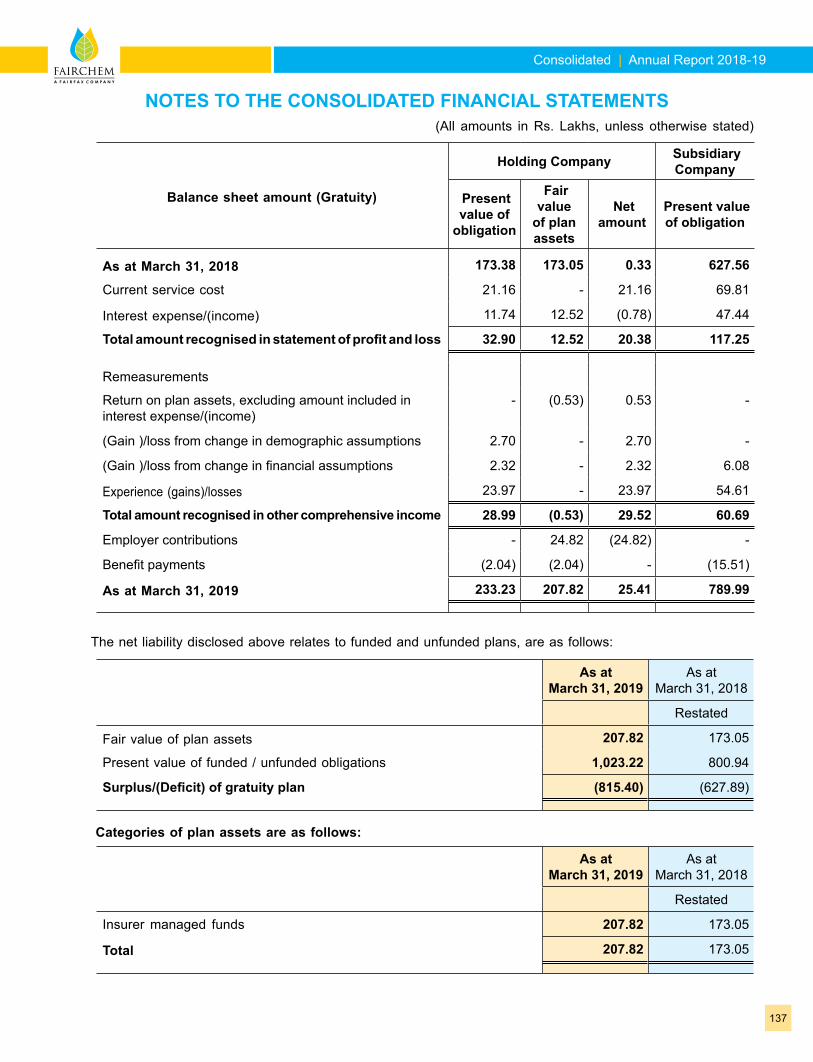
Consolidated | Annual Report 2018-19
137
Balance sheet amount (Gratuity)
Holding Company Subsidiary Company
Present value of
obligation
Fair value
of plan assets
Net amount
Present value of obligation
As at March 31, 2018 173.38 173.05 0.33 627.56
Current service cost 21.16 - 21.16 69.81
Interest expense/(income) 11.74 12.52 (0.78) 47.44
Total amount recognised in statement of profit and loss 32.90 12.52 20.38 117.25
Remeasurements
Return on plan assets, excluding amount included in interest expense/(income)
- (0.53) 0.53 -
(Gain )/loss from change in demographic assumptions 2.70 - 2.70 -
(Gain )/loss from change in financial assumptions 2.32 - 2.32 6.08
Experience (gains)/losses 23.97 - 23.97 54.61
Total amount recognised in other comprehensive income 28.99 (0.53) 29.52 60.69
Employer contributions - 24.82 (24.82) -
Benefit payments (2.04) (2.04) - (15.51)
As at March 31, 2019 233.23 207.82 25.41 789.99
The net liability disclosed above relates to funded and unfunded plans, are as follows:
As at March 31, 2019
As at March 31, 2018
Restated
Fair value of plan assets 207.82 173.05
Present value of funded / unfunded obligations 1,023.22 800.94
Surplus/(Deficit) of gratuity plan (815.40) (627.89)
Categories of plan assets are as follows:
As at March 31, 2019
As at March 31, 2018
Restated
Insurer managed funds 207.82 173.05
Total 207.82 173.05
NOTES TO THE CONSOLIDATED FINANCIAL STATEMENTS(All amounts in Rs. Lakhs, unless otherwise stated)
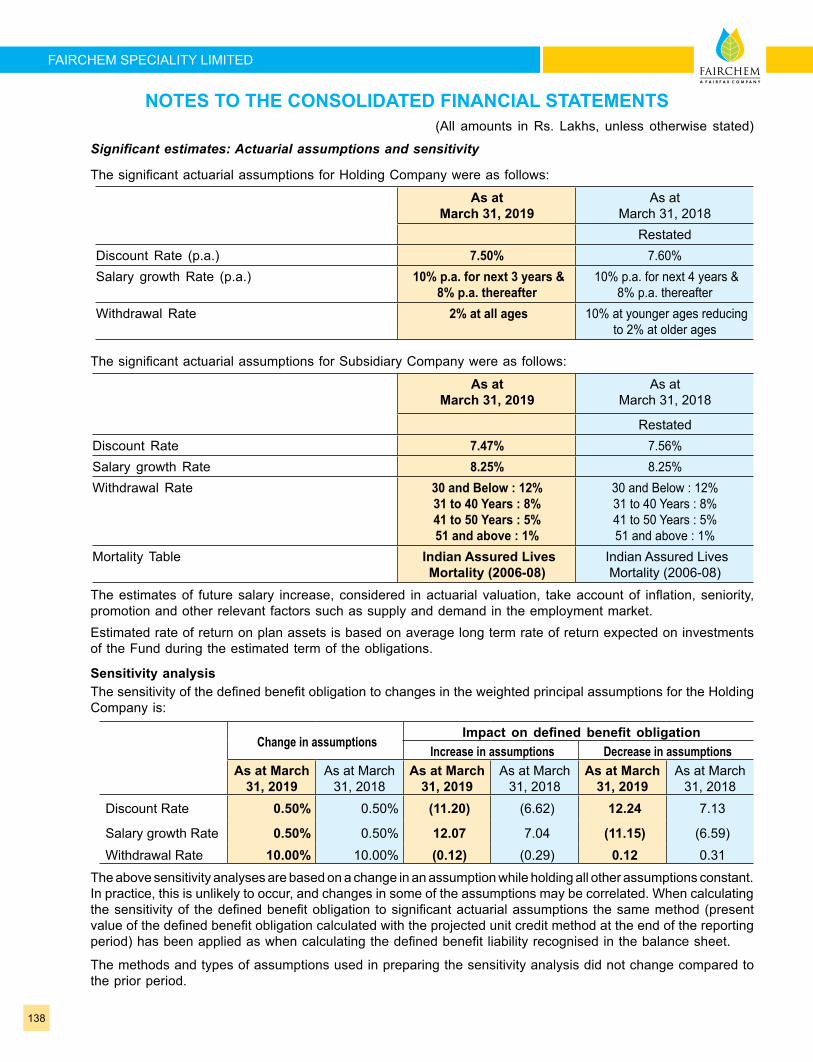
138
FAIRCHEM SPECIALITY LIMITED
Significantestimates:Actuarialassumptionsandsensitivity
The significant actuarial assumptions for Holding Company were as follows:
As at March 31, 2019
As at March 31, 2018
RestatedDiscount Rate (p.a.) 7.50% 7.60%Salary growth Rate (p.a.) 10% p.a. for next 3 years &
8% p.a. thereafter 10% p.a. for next 4 years &
8% p.a. thereafter Withdrawal Rate 2% at all ages 10% at younger ages reducing
to 2% at older ages
The significant actuarial assumptions for Subsidiary Company were as follows:
As at March 31, 2019
As at March 31, 2018
RestatedDiscount Rate 7.47% 7.56%Salary growth Rate 8.25% 8.25%Withdrawal Rate 30 and Below : 12%
31 to 40 Years : 8% 41 to 50 Years : 5% 51 and above : 1%
30 and Below : 12% 31 to 40 Years : 8% 41 to 50 Years : 5% 51 and above : 1%
Mortality Table Indian Assured Lives Mortality (2006-08)
Indian Assured Lives Mortality (2006-08)
The estimates of future salary increase, considered in actuarial valuation, take account of inflation, seniority, promotion and other relevant factors such as supply and demand in the employment market.
Estimated rate of return on plan assets is based on average long term rate of return expected on investments of the Fund during the estimated term of the obligations.
Sensitivity analysis The sensitivity of the defined benefit obligation to changes in the weighted principal assumptions for the Holding
Company is:
Change in assumptions Impact on defined benefit obligation
Increase in assumptions Decrease in assumptions As at March
31, 2019As at March
31, 2018As at March
31, 2019As at March
31, 2018As at March
31, 2019As at March
31, 2018Discount Rate 0.50% 0.50% (11.20) (6.62) 12.24 7.13
Salary growth Rate 0.50% 0.50% 12.07 7.04 (11.15) (6.59)Withdrawal Rate 10.00% 10.00% (0.12) (0.29) 0.12 0.31
The above sensitivity analyses are based on a change in an assumption while holding all other assumptions constant. In practice, this is unlikely to occur, and changes in some of the assumptions may be correlated. When calculating the sensitivity of the defined benefit obligation to significant actuarial assumptions the same method (present value of the defined benefit obligation calculated with the projected unit credit method at the end of the reporting period) has been applied as when calculating the defined benefit liability recognised in the balance sheet.
The methods and types of assumptions used in preparing the sensitivity analysis did not change compared to the prior period.
NOTES TO THE CONSOLIDATED FINANCIAL STATEMENTS(All amounts in Rs. Lakhs, unless otherwise stated)
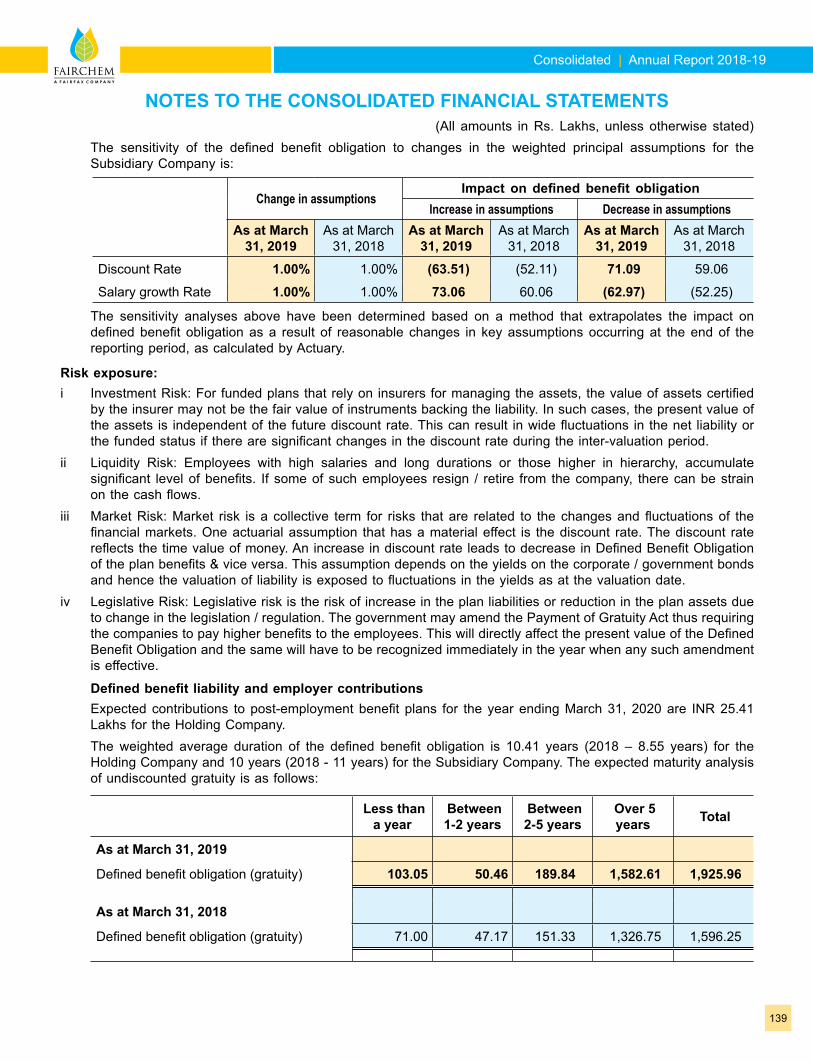
Consolidated | Annual Report 2018-19
139
The sensitivity of the defined benefit obligation to changes in the weighted principal assumptions for the Subsidiary Company is:
Change in assumptions Impact on defined benefit obligation
Increase in assumptions Decrease in assumptions As at March
31, 2019As at March
31, 2018As at March
31, 2019As at March
31, 2018As at March
31, 2019As at March
31, 2018
Discount Rate 1.00% 1.00% (63.51) (52.11) 71.09 59.06
Salary growth Rate 1.00% 1.00% 73.06 60.06 (62.97) (52.25)
The sensitivity analyses above have been determined based on a method that extrapolates the impact on defined benefit obligation as a result of reasonable changes in key assumptions occurring at the end of the reporting period, as calculated by Actuary.
Risk exposure:i Investment Risk: For funded plans that rely on insurers for managing the assets, the value of assets certified
by the insurer may not be the fair value of instruments backing the liability. In such cases, the present value of the assets is independent of the future discount rate. This can result in wide fluctuations in the net liability or the funded status if there are significant changes in the discount rate during the inter-valuation period.
ii Liquidity Risk: Employees with high salaries and long durations or those higher in hierarchy, accumulate significant level of benefits. If some of such employees resign / retire from the company, there can be strain on the cash flows.
iii Market Risk: Market risk is a collective term for risks that are related to the changes and fluctuations of the financial markets. One actuarial assumption that has a material effect is the discount rate. The discount rate reflects the time value of money. An increase in discount rate leads to decrease in Defined Benefit Obligation of the plan benefits & vice versa. This assumption depends on the yields on the corporate / government bonds and hence the valuation of liability is exposed to fluctuations in the yields as at the valuation date.
iv Legislative Risk: Legislative risk is the risk of increase in the plan liabilities or reduction in the plan assets due to change in the legislation / regulation. The government may amend the Payment of Gratuity Act thus requiring the companies to pay higher benefits to the employees. This will directly affect the present value of the Defined Benefit Obligation and the same will have to be recognized immediately in the year when any such amendment is effective.
Defined benefit liability and employer contributions Expected contributions to post-employment benefit plans for the year ending March 31, 2020 are INR 25.41
Lakhs for the Holding Company. The weighted average duration of the defined benefit obligation is 10.41 years (2018 – 8.55 years) for the
Holding Company and 10 years (2018 - 11 years) for the Subsidiary Company. The expected maturity analysis of undiscounted gratuity is as follows:
Less than a year
Between 1-2 years
Between 2-5 years
Over 5 years Total
As at March 31, 2019
Defined benefit obligation (gratuity) 103.05 50.46 189.84 1,582.61 1,925.96
As at March 31, 2018
Defined benefit obligation (gratuity) 71.00 47.17 151.33 1,326.75 1,596.25
NOTES TO THE CONSOLIDATED FINANCIAL STATEMENTS(All amounts in Rs. Lakhs, unless otherwise stated)
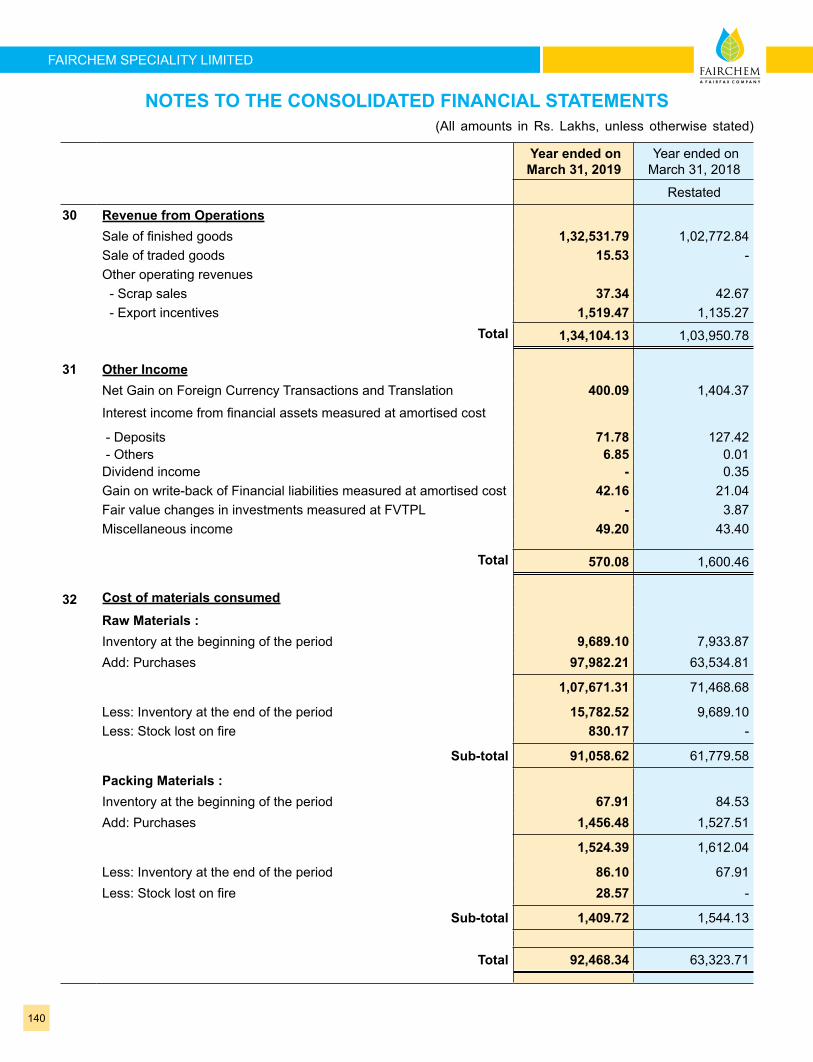
140
FAIRCHEM SPECIALITY LIMITED
Year ended on March 31, 2019
Year ended on March 31, 2018
Restated
30 Revenue from OperationsSale of finished goods 1,32,531.79 1,02,772.84 Sale of traded goods 15.53 - Other operating revenues - Scrap sales 37.34 42.67 - Export incentives 1,519.47 1,135.27
Total 1,34,104.13 1,03,950.78
31 Other IncomeNet Gain on Foreign Currency Transactions and Translation 400.09 1,404.37
Interest income from financial assets measured at amortised cost
- Deposits 71.78 127.42 - Others 6.85 0.01 Dividend income - 0.35 Gain on write-back of Financial liabilities measured at amortised cost 42.16 21.04 Fair value changes in investments measured at FVTPL - 3.87 Miscellaneous income 49.20 43.40
Total 570.08 1,600.46
32 Cost of materials consumedRaw Materials :Inventory at the beginning of the period 9,689.10 7,933.87 Add: Purchases 97,982.21 63,534.81
1,07,671.31 71,468.68
Less: Inventory at the end of the period 15,782.52 9,689.10 Less: Stock lost on fire 830.17 -
Sub-total 91,058.62 61,779.58
Packing Materials :Inventory at the beginning of the period 67.91 84.53 Add: Purchases 1,456.48 1,527.51
1,524.39 1,612.04
Less: Inventory at the end of the period 86.10 67.91 Less: Stock lost on fire 28.57 -
Sub-total 1,409.72 1,544.13
Total 92,468.34 63,323.71
NOTES TO THE CONSOLIDATED FINANCIAL STATEMENTS(All amounts in Rs. Lakhs, unless otherwise stated)
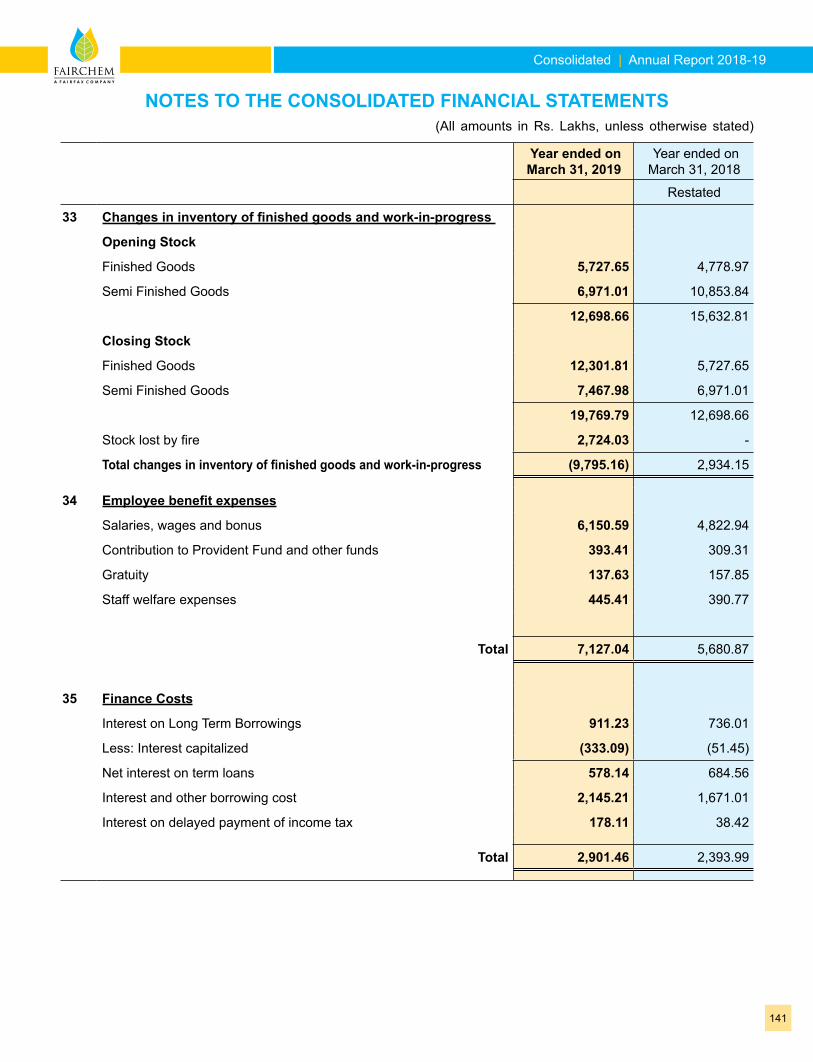
Consolidated | Annual Report 2018-19
141
Year ended on March 31, 2019
Year ended on March 31, 2018
Restated
33 Changes in inventory of finished goods and work-in-progress
Opening Stock
Finished Goods 5,727.65 4,778.97
Semi Finished Goods 6,971.01 10,853.84
12,698.66 15,632.81
Closing Stock
Finished Goods 12,301.81 5,727.65
Semi Finished Goods 7,467.98 6,971.01
19,769.79 12,698.66
Stock lost by fire 2,724.03 -
Total changes in inventory of finished goods and work-in-progress (9,795.16) 2,934.15
34 Employee benefit expenses
Salaries, wages and bonus 6,150.59 4,822.94
Contribution to Provident Fund and other funds 393.41 309.31
Gratuity 137.63 157.85
Staff welfare expenses 445.41 390.77
Total 7,127.04 5,680.87
35 Finance Costs
Interest on Long Term Borrowings 911.23 736.01
Less: Interest capitalized (333.09) (51.45)
Net interest on term loans 578.14 684.56
Interest and other borrowing cost 2,145.21 1,671.01
Interest on delayed payment of income tax 178.11 38.42
Total 2,901.46 2,393.99
NOTES TO THE CONSOLIDATED FINANCIAL STATEMENTS(All amounts in Rs. Lakhs, unless otherwise stated)
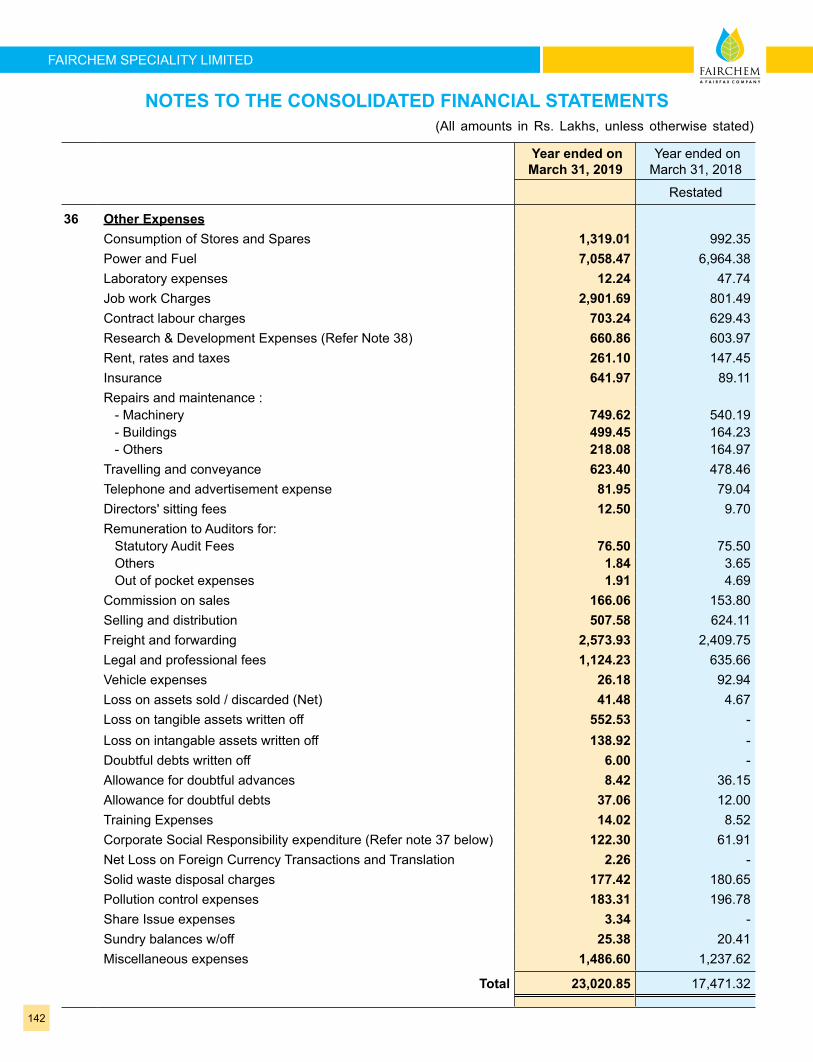
142
FAIRCHEM SPECIALITY LIMITED
Year ended on March 31, 2019
Year ended on March 31, 2018
Restated
36 Other ExpensesConsumption of Stores and Spares 1,319.01 992.35 Power and Fuel 7,058.47 6,964.38 Laboratory expenses 12.24 47.74 Job work Charges 2,901.69 801.49 Contract labour charges 703.24 629.43 Research & Development Expenses (Refer Note 38) 660.86 603.97 Rent, rates and taxes 261.10 147.45 Insurance 641.97 89.11 Repairs and maintenance : - Machinery 749.62 540.19 - Buildings 499.45 164.23 - Others 218.08 164.97 Travelling and conveyance 623.40 478.46 Telephone and advertisement expense 81.95 79.04 Directors' sitting fees 12.50 9.70 Remuneration to Auditors for: Statutory Audit Fees 76.50 75.50 Others 1.84 3.65 Out of pocket expenses 1.91 4.69 Commission on sales 166.06 153.80 Selling and distribution 507.58 624.11 Freight and forwarding 2,573.93 2,409.75 Legal and professional fees 1,124.23 635.66 Vehicle expenses 26.18 92.94 Loss on assets sold / discarded (Net) 41.48 4.67 Loss on tangible assets written off 552.53 - Loss on intangable assets written off 138.92 - Doubtful debts written off 6.00 - Allowance for doubtful advances 8.42 36.15 Allowance for doubtful debts 37.06 12.00 Training Expenses 14.02 8.52 Corporate Social Responsibility expenditure (Refer note 37 below) 122.30 61.91 Net Loss on Foreign Currency Transactions and Translation 2.26 - Solid waste disposal charges 177.42 180.65 Pollution control expenses 183.31 196.78 Share Issue expenses 3.34 - Sundry balances w/off 25.38 20.41 Miscellaneous expenses 1,486.60 1,237.62
Total 23,020.85 17,471.32
NOTES TO THE CONSOLIDATED FINANCIAL STATEMENTS(All amounts in Rs. Lakhs, unless otherwise stated)
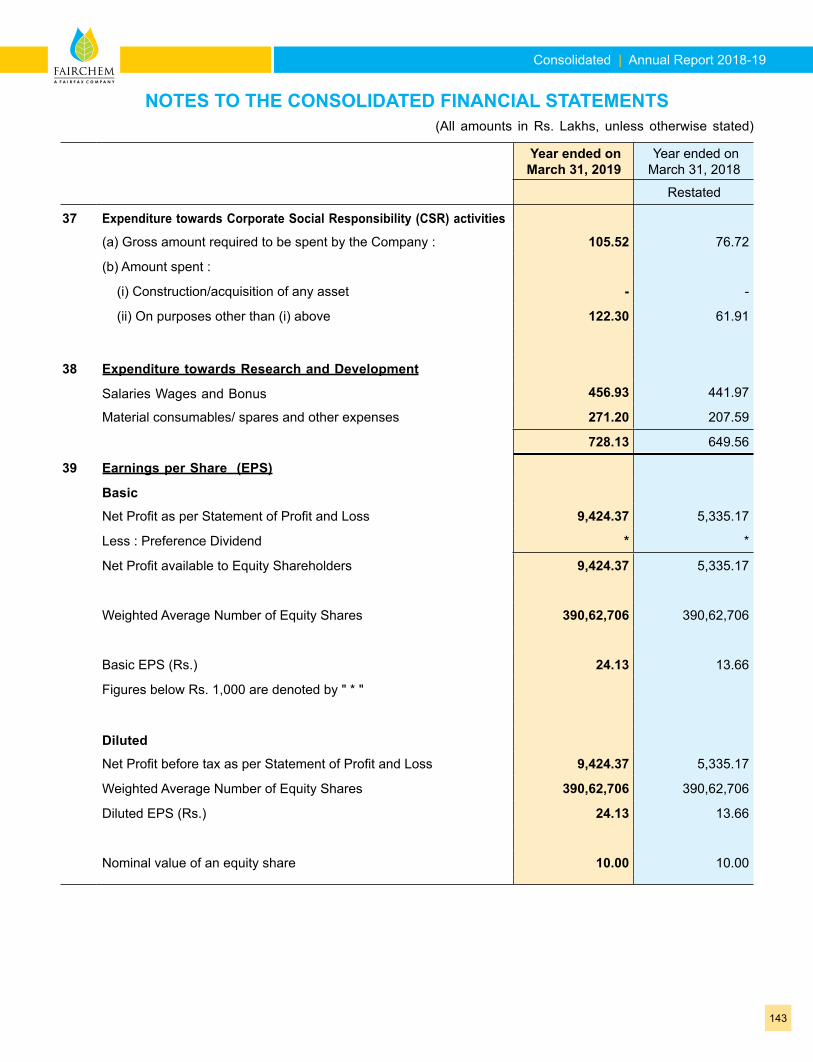
Consolidated | Annual Report 2018-19
143
Year ended on March 31, 2019
Year ended on March 31, 2018
Restated
37 Expenditure towards Corporate Social Responsibility (CSR) activities
(a) Gross amount required to be spent by the Company : 105.52 76.72
(b) Amount spent :
(i) Construction/acquisition of any asset - -
(ii) On purposes other than (i) above 122.30 61.91
38 Expenditure towards Research and Development
Salaries Wages and Bonus 456.93 441.97
Material consumables/ spares and other expenses 271.20 207.59
728.13 649.56
39 Earnings per Share (EPS)
Basic
Net Profit as per Statement of Profit and Loss 9,424.37 5,335.17
Less : Preference Dividend * *
Net Profit available to Equity Shareholders 9,424.37 5,335.17
Weighted Average Number of Equity Shares 390,62,706 390,62,706
Basic EPS (Rs.) 24.13 13.66
Figures below Rs. 1,000 are denoted by " * "
Diluted
Net Profit before tax as per Statement of Profit and Loss 9,424.37 5,335.17
Weighted Average Number of Equity Shares 390,62,706 390,62,706
Diluted EPS (Rs.) 24.13 13.66
Nominal value of an equity share 10.00 10.00
NOTES TO THE CONSOLIDATED FINANCIAL STATEMENTS(All amounts in Rs. Lakhs, unless otherwise stated)
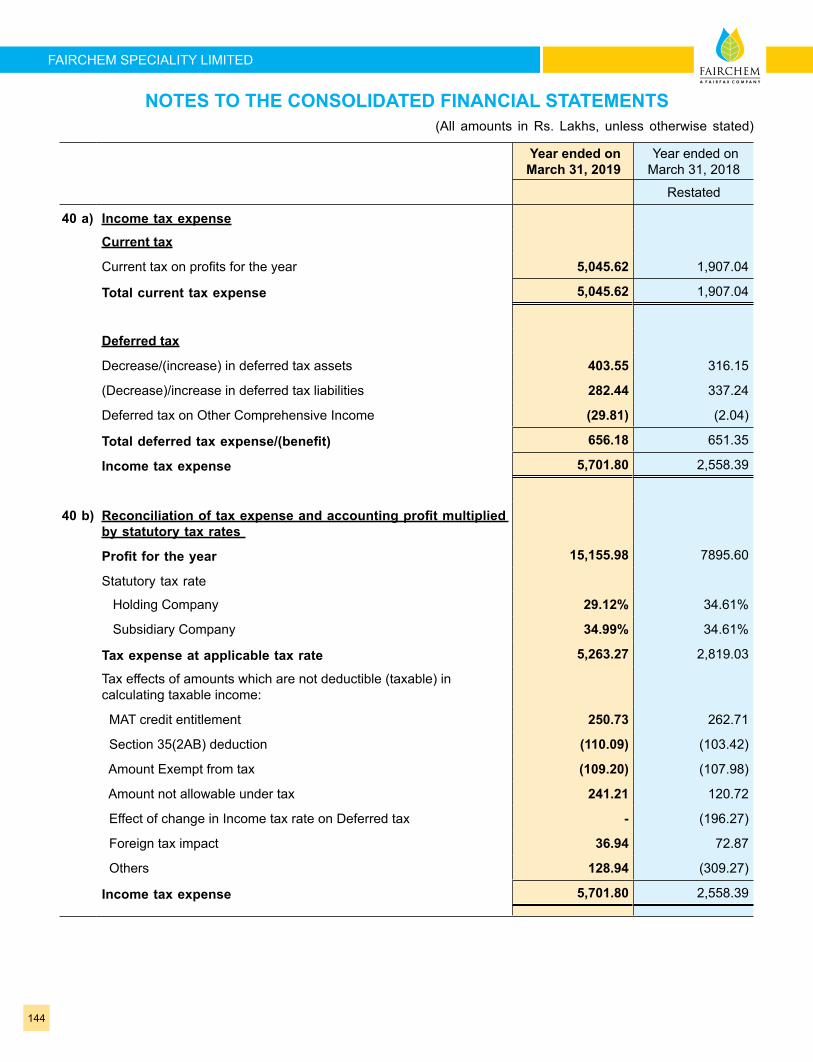
144
FAIRCHEM SPECIALITY LIMITED
Year ended on March 31, 2019
Year ended on March 31, 2018
Restated
40 a) Income tax expense
Current tax
Current tax on profits for the year 5,045.62 1,907.04
Total current tax expense 5,045.62 1,907.04
Deferred tax
Decrease/(increase) in deferred tax assets 403.55 316.15
(Decrease)/increase in deferred tax liabilities 282.44 337.24
Deferred tax on Other Comprehensive Income (29.81) (2.04)
Total deferred tax expense/(benefit) 656.18 651.35
Income tax expense 5,701.80 2,558.39
40 b) Reconciliation of tax expense and accounting profit multiplied by statutory tax rates
Profit for the year 15,155.98 7895.60
Statutory tax rate
Holding Company 29.12% 34.61%
Subsidiary Company 34.99% 34.61%
Tax expense at applicable tax rate 5,263.27 2,819.03
Tax effects of amounts which are not deductible (taxable) in calculating taxable income:
MAT credit entitlement 250.73 262.71
Section 35(2AB) deduction (110.09) (103.42)
Amount Exempt from tax (109.20) (107.98)
Amount not allowable under tax 241.21 120.72
Effect of change in Income tax rate on Deferred tax - (196.27)
Foreign tax impact 36.94 72.87
Others 128.94 (309.27)
Income tax expense 5,701.80 2,558.39
NOTES TO THE CONSOLIDATED FINANCIAL STATEMENTS(All amounts in Rs. Lakhs, unless otherwise stated)
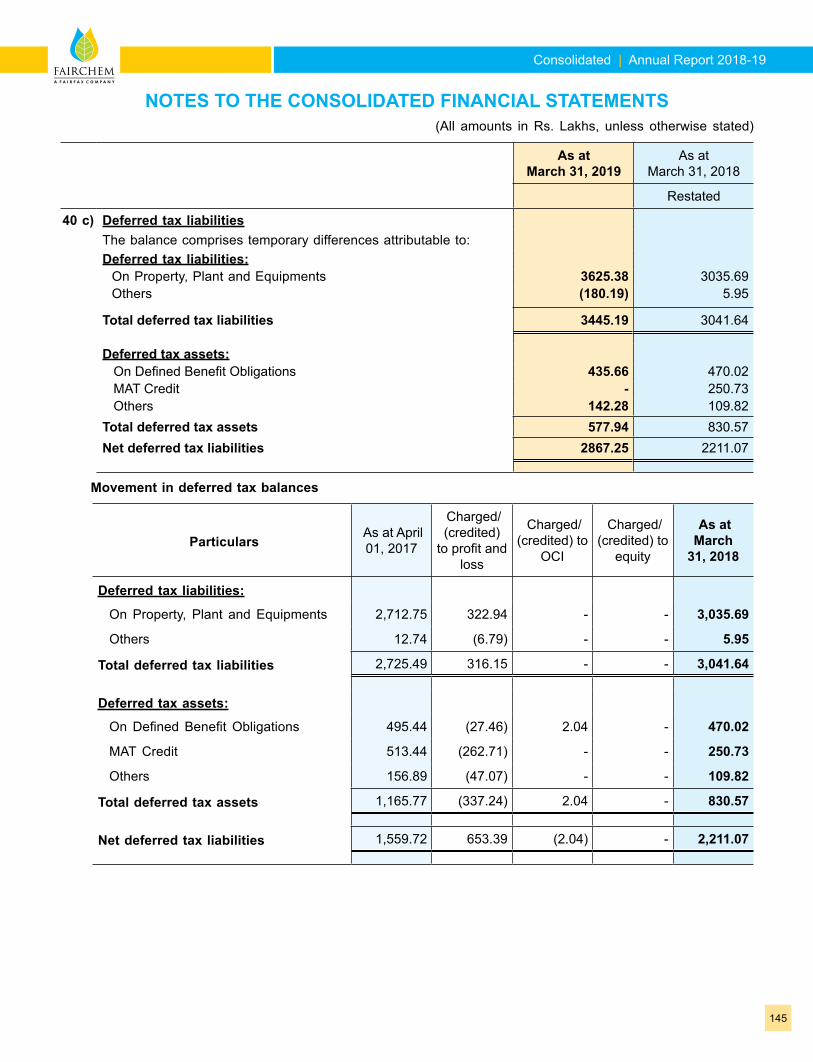
Consolidated | Annual Report 2018-19
145
As at March 31, 2019
As at March 31, 2018
Restated
40 c) Deferred tax liabilitiesThe balance comprises temporary differences attributable to:Deferred tax liabilities: On Property, Plant and Equipments 3625.38 3035.69 Others (180.19) 5.95
Total deferred tax liabilities 3445.19 3041.64
Deferred tax assets: On Defined Benefit Obligations 435.66 470.02 MAT Credit - 250.73 Others 142.28 109.82Total deferred tax assets 577.94 830.57Net deferred tax liabilities 2867.25 2211.07
Movement in deferred tax balances
Particulars As at April 01, 2017
Charged/ (credited)
to profit and loss
Charged/ (credited) to
OCI
Charged/ (credited) to
equity
As at March
31, 2018
Deferred tax liabilities:
On Property, Plant and Equipments 2,712.75 322.94 - - 3,035.69
Others 12.74 (6.79) - - 5.95
Total deferred tax liabilities 2,725.49 316.15 - - 3,041.64
Deferred tax assets:
On Defined Benefit Obligations 495.44 (27.46) 2.04 - 470.02
MAT Credit 513.44 (262.71) - - 250.73
Others 156.89 (47.07) - - 109.82
Total deferred tax assets 1,165.77 (337.24) 2.04 - 830.57
Net deferred tax liabilities 1,559.72 653.39 (2.04) - 2,211.07
NOTES TO THE CONSOLIDATED FINANCIAL STATEMENTS(All amounts in Rs. Lakhs, unless otherwise stated)
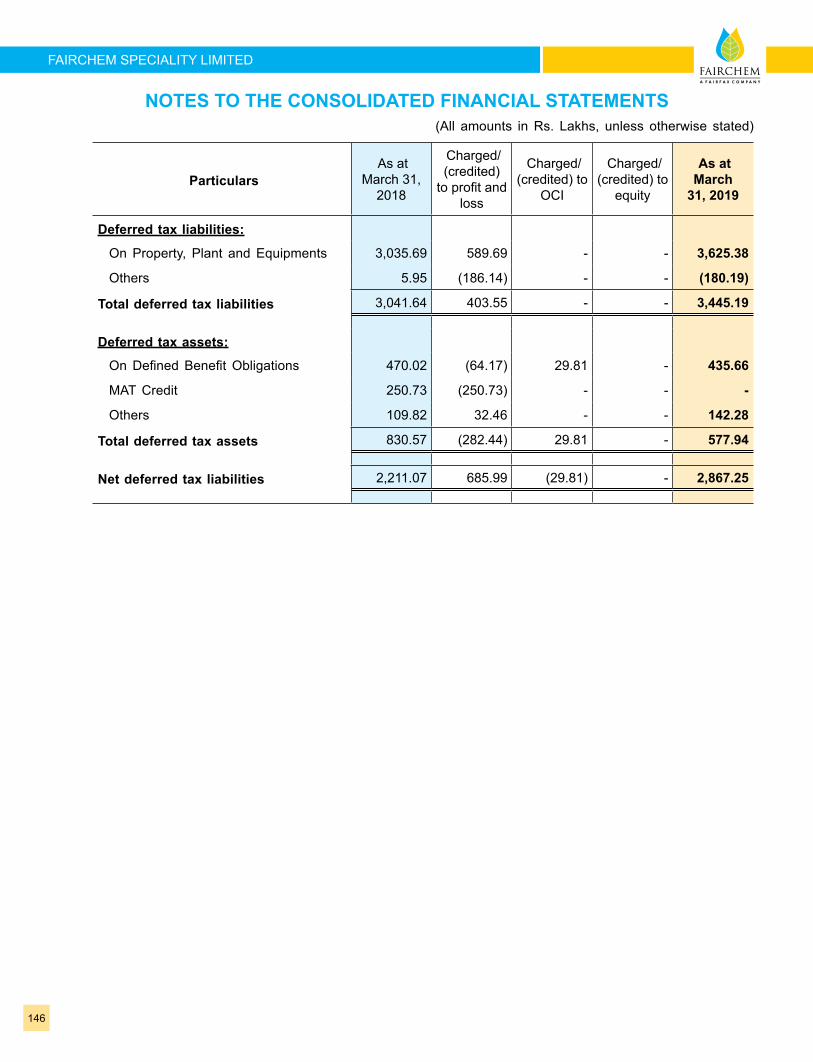
146
FAIRCHEM SPECIALITY LIMITED
NOTES TO THE CONSOLIDATED FINANCIAL STATEMENTS(All amounts in Rs. Lakhs, unless otherwise stated)
Particulars As at
March 31, 2018
Charged/ (credited)
to profit and loss
Charged/ (credited) to
OCI
Charged/ (credited) to
equity
As at March
31, 2019
Deferred tax liabilities:
On Property, Plant and Equipments 3,035.69 589.69 - - 3,625.38
Others 5.95 (186.14) - - (180.19)
Total deferred tax liabilities 3,041.64 403.55 - - 3,445.19
Deferred tax assets:
On Defined Benefit Obligations 470.02 (64.17) 29.81 - 435.66
MAT Credit 250.73 (250.73) - - -
Others 109.82 32.46 - - 142.28
Total deferred tax assets 830.57 (282.44) 29.81 - 577.94
Net deferred tax liabilities 2,211.07 685.99 (29.81) - 2,867.25
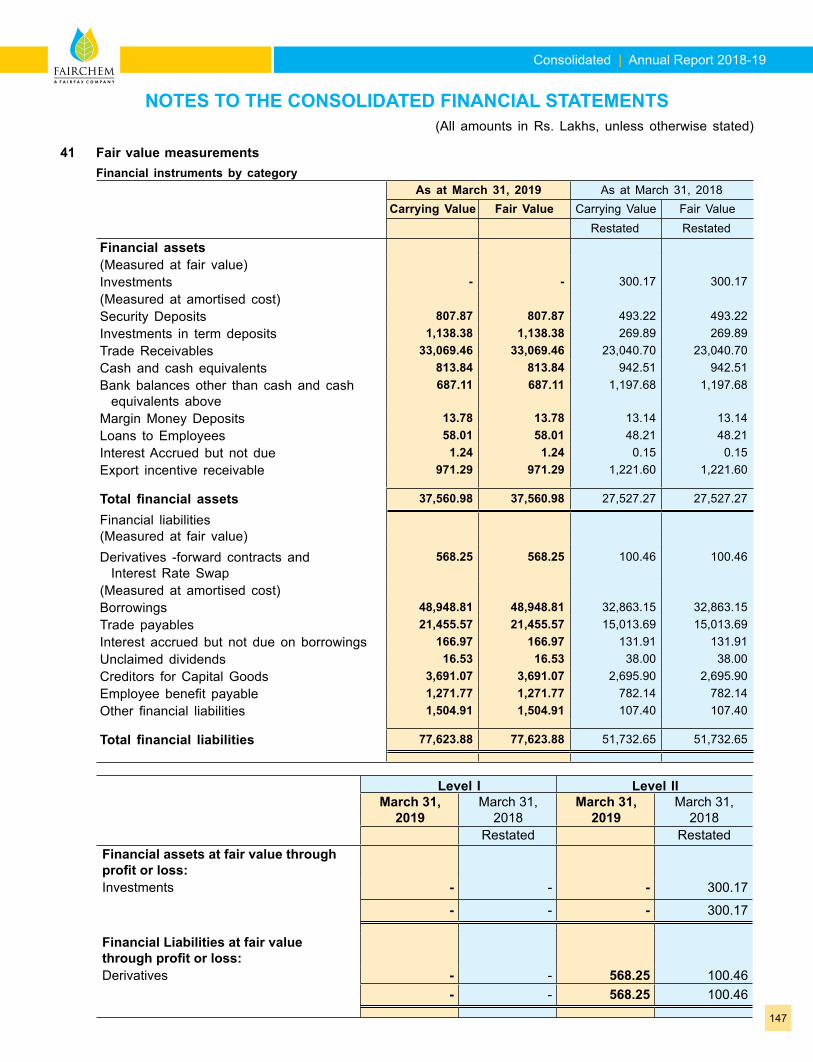
Consolidated | Annual Report 2018-19
147
41 Fair value measurementsFinancial instruments by category
As at March 31, 2019 As at March 31, 2018Carrying Value Fair Value Carrying Value Fair Value
Restated Restated Financial assets(Measured at fair value)Investments - - 300.17 300.17 (Measured at amortised cost)Security Deposits 807.87 807.87 493.22 493.22 Investments in term deposits 1,138.38 1,138.38 269.89 269.89 Trade Receivables 33,069.46 33,069.46 23,040.70 23,040.70 Cash and cash equivalents 813.84 813.84 942.51 942.51 Bank balances other than cash and cash equivalents above
687.11 687.11 1,197.68 1,197.68
Margin Money Deposits 13.78 13.78 13.14 13.14 Loans to Employees 58.01 58.01 48.21 48.21 Interest Accrued but not due 1.24 1.24 0.15 0.15 Export incentive receivable 971.29 971.29 1,221.60 1,221.60
Total financial assets 37,560.98 37,560.98 27,527.27 27,527.27
Financial liabilities(Measured at fair value)Derivatives -forward contracts and Interest Rate Swap
568.25 568.25 100.46 100.46
(Measured at amortised cost)Borrowings 48,948.81 48,948.81 32,863.15 32,863.15 Trade payables 21,455.57 21,455.57 15,013.69 15,013.69 Interest accrued but not due on borrowings 166.97 166.97 131.91 131.91 Unclaimed dividends 16.53 16.53 38.00 38.00 Creditors for Capital Goods 3,691.07 3,691.07 2,695.90 2,695.90 Employee benefit payable 1,271.77 1,271.77 782.14 782.14 Other financial liabilities 1,504.91 1,504.91 107.40 107.40
Total financial liabilities 77,623.88 77,623.88 51,732.65 51,732.65
Level I Level IIMarch 31,
2019March 31,
2018March 31,
2019March 31,
2018Restated Restated
Financial assets at fair value through profit or loss:Investments - - - 300.17
- - - 300.17
Financial Liabilities at fair value through profit or loss:Derivatives - - 568.25 100.46
- - 568.25 100.46
NOTES TO THE CONSOLIDATED FINANCIAL STATEMENTS(All amounts in Rs. Lakhs, unless otherwise stated)
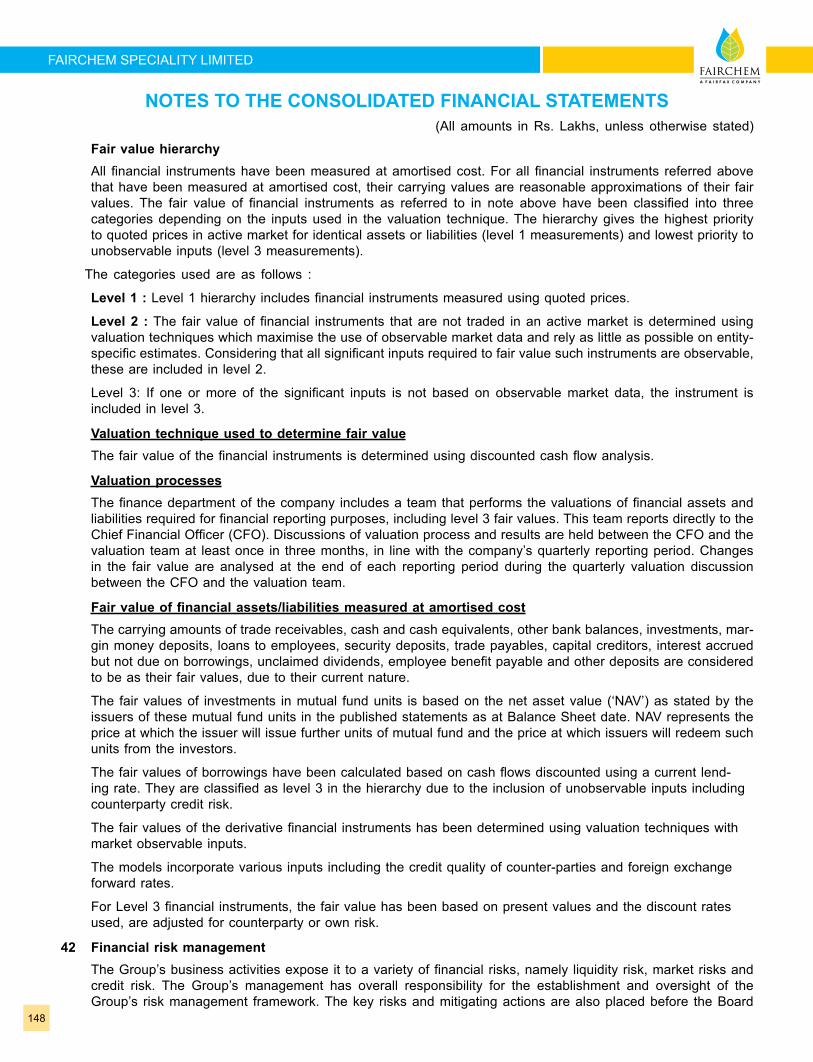
148
FAIRCHEM SPECIALITY LIMITED
Fair value hierarchy All financial instruments have been measured at amortised cost. For all financial instruments referred above
that have been measured at amortised cost, their carrying values are reasonable approximations of their fair values. The fair value of financial instruments as referred to in note above have been classified into three categories depending on the inputs used in the valuation technique. The hierarchy gives the highest priority to quoted prices in active market for identical assets or liabilities (level 1 measurements) and lowest priority to unobservable inputs (level 3 measurements).
The categories used are as follows :
Level 1 : Level 1 hierarchy includes financial instruments measured using quoted prices.
Level 2 : The fair value of financial instruments that are not traded in an active market is determined using valuation techniques which maximise the use of observable market data and rely as little as possible on entity-specific estimates. Considering that all significant inputs required to fair value such instruments are observable, these are included in level 2.
Level 3: If one or more of the significant inputs is not based on observable market data, the instrument is included in level 3.
Valuation technique used to determine fair value The fair value of the financial instruments is determined using discounted cash flow analysis.
Valuation processes The finance department of the company includes a team that performs the valuations of financial assets and
liabilities required for financial reporting purposes, including level 3 fair values. This team reports directly to the Chief Financial Officer (CFO). Discussions of valuation process and results are held between the CFO and the valuation team at least once in three months, in line with the company’s quarterly reporting period. Changes in the fair value are analysed at the end of each reporting period during the quarterly valuation discussion between the CFO and the valuation team.
Fair value of financial assets/liabilities measured at amortised cost
The carrying amounts of trade receivables, cash and cash equivalents, other bank balances, investments, mar-gin money deposits, loans to employees, security deposits, trade payables, capital creditors, interest accrued but not due on borrowings, unclaimed dividends, employee benefit payable and other deposits are considered to be as their fair values, due to their current nature.
The fair values of investments in mutual fund units is based on the net asset value (‘NAV’) as stated by the issuers of these mutual fund units in the published statements as at Balance Sheet date. NAV represents the price at which the issuer will issue further units of mutual fund and the price at which issuers will redeem such units from the investors.
The fair values of borrowings have been calculated based on cash flows discounted using a current lend-ing rate. They are classified as level 3 in the hierarchy due to the inclusion of unobservable inputs including counterparty credit risk.
The fair values of the derivative financial instruments has been determined using valuation techniques with market observable inputs.
The models incorporate various inputs including the credit quality of counter-parties and foreign exchange forward rates.
For Level 3 financial instruments, the fair value has been based on present values and the discount rates used, are adjusted for counterparty or own risk.
42 Financial risk management The Group’s business activities expose it to a variety of financial risks, namely liquidity risk, market risks and
credit risk. The Group’s management has overall responsibility for the establishment and oversight of the Group’s risk management framework. The key risks and mitigating actions are also placed before the Board
NOTES TO THE CONSOLIDATED FINANCIAL STATEMENTS(All amounts in Rs. Lakhs, unless otherwise stated)
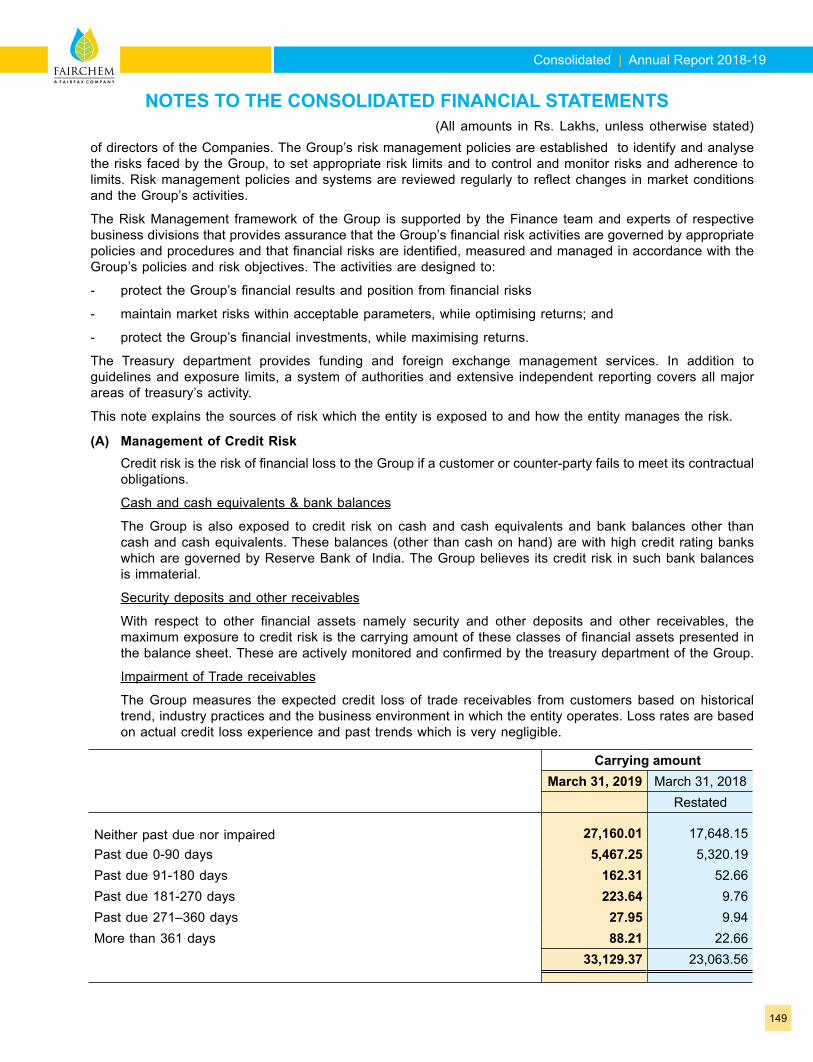
Consolidated | Annual Report 2018-19
149
NOTES TO THE CONSOLIDATED FINANCIAL STATEMENTS(All amounts in Rs. Lakhs, unless otherwise stated)
of directors of the Companies. The Group’s risk management policies are established to identify and analyse the risks faced by the Group, to set appropriate risk limits and to control and monitor risks and adherence to limits. Risk management policies and systems are reviewed regularly to reflect changes in market conditions and the Group’s activities.
The Risk Management framework of the Group is supported by the Finance team and experts of respective business divisions that provides assurance that the Group’s financial risk activities are governed by appropriate policies and procedures and that financial risks are identified, measured and managed in accordance with the Group’s policies and risk objectives. The activities are designed to:
- protect the Group’s financial results and position from financial risks
- maintain market risks within acceptable parameters, while optimising returns; and
- protect the Group’s financial investments, while maximising returns.
The Treasury department provides funding and foreign exchange management services. In addition to guidelines and exposure limits, a system of authorities and extensive independent reporting covers all major areas of treasury’s activity.
This note explains the sources of risk which the entity is exposed to and how the entity manages the risk.
(A) Management of Credit Risk Credit risk is the risk of financial loss to the Group if a customer or counter-party fails to meet its contractual
obligations.
Cash and cash equivalents & bank balances
The Group is also exposed to credit risk on cash and cash equivalents and bank balances other than cash and cash equivalents. These balances (other than cash on hand) are with high credit rating banks which are governed by Reserve Bank of India. The Group believes its credit risk in such bank balances is immaterial.
Security deposits and other receivables
With respect to other financial assets namely security and other deposits and other receivables, the maximum exposure to credit risk is the carrying amount of these classes of financial assets presented in the balance sheet. These are actively monitored and confirmed by the treasury department of the Group.
Impairment of Trade receivables
The Group measures the expected credit loss of trade receivables from customers based on historical trend, industry practices and the business environment in which the entity operates. Loss rates are based on actual credit loss experience and past trends which is very negligible.
Carrying amountMarch 31, 2019 March 31, 2018
Restated
Neither past due nor impaired 27,160.01 17,648.15 Past due 0-90 days 5,467.25 5,320.19 Past due 91-180 days 162.31 52.66 Past due 181-270 days 223.64 9.76 Past due 271–360 days 27.95 9.94 More than 361 days 88.21 22.66
33,129.37 23,063.56
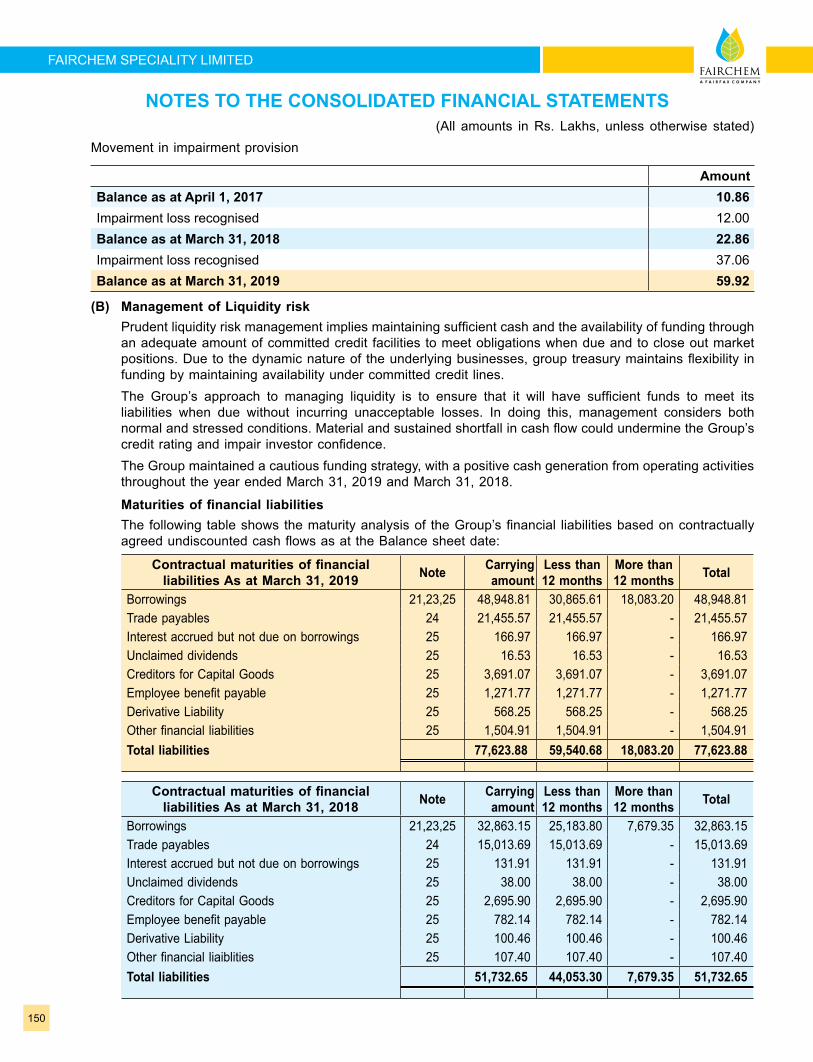
150
FAIRCHEM SPECIALITY LIMITED
Movement in impairment provision
AmountBalance as at April 1, 2017 10.86 Impairment loss recognised 12.00 Balance as at March 31, 2018 22.86 Impairment loss recognised 37.06 Balance as at March 31, 2019 59.92
(B) Management of Liquidity risk Prudent liquidity risk management implies maintaining sufficient cash and the availability of funding through
an adequate amount of committed credit facilities to meet obligations when due and to close out market positions. Due to the dynamic nature of the underlying businesses, group treasury maintains flexibility in funding by maintaining availability under committed credit lines.
The Group’s approach to managing liquidity is to ensure that it will have sufficient funds to meet its liabilities when due without incurring unacceptable losses. In doing this, management considers both normal and stressed conditions. Material and sustained shortfall in cash flow could undermine the Group’s credit rating and impair investor confidence.
The Group maintained a cautious funding strategy, with a positive cash generation from operating activities throughout the year ended March 31, 2019 and March 31, 2018.
Maturities of financial liabilities The following table shows the maturity analysis of the Group’s financial liabilities based on contractually
agreed undiscounted cash flows as at the Balance sheet date:
Contractual maturities of financial liabilities As at March 31, 2019 Note Carrying
amountLess than 12 months
More than 12 months Total
Borrowings 21,23,25 48,948.81 30,865.61 18,083.20 48,948.81 Trade payables 24 21,455.57 21,455.57 - 21,455.57 Interest accrued but not due on borrowings 25 166.97 166.97 - 166.97 Unclaimed dividends 25 16.53 16.53 - 16.53 Creditors for Capital Goods 25 3,691.07 3,691.07 - 3,691.07 Employee benefit payable 25 1,271.77 1,271.77 - 1,271.77 Derivative Liability 25 568.25 568.25 - 568.25 Other financial liabilities 25 1,504.91 1,504.91 - 1,504.91 Total liabilities 77,623.88 59,540.68 18,083.20 77,623.88
Contractual maturities of financial liabilities As at March 31, 2018 Note Carrying
amountLess than 12 months
More than 12 months Total
Borrowings 21,23,25 32,863.15 25,183.80 7,679.35 32,863.15 Trade payables 24 15,013.69 15,013.69 - 15,013.69 Interest accrued but not due on borrowings 25 131.91 131.91 - 131.91 Unclaimed dividends 25 38.00 38.00 - 38.00 Creditors for Capital Goods 25 2,695.90 2,695.90 - 2,695.90 Employee benefit payable 25 782.14 782.14 - 782.14 Derivative Liability 25 100.46 100.46 - 100.46 Other financial liaiblities 25 107.40 107.40 - 107.40 Total liabilities 51,732.65 44,053.30 7,679.35 51,732.65
NOTES TO THE CONSOLIDATED FINANCIAL STATEMENTS(All amounts in Rs. Lakhs, unless otherwise stated)
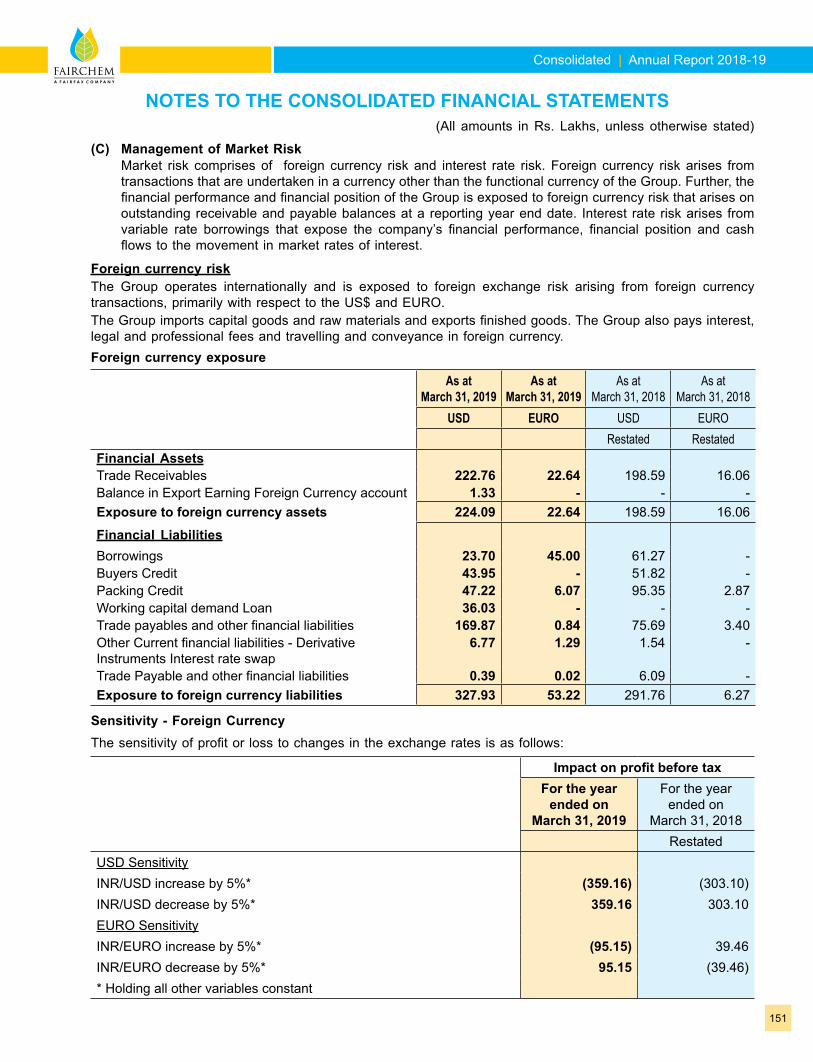
Consolidated | Annual Report 2018-19
151
(C) Management of Market Risk Market risk comprises of foreign currency risk and interest rate risk. Foreign currency risk arises from
transactions that are undertaken in a currency other than the functional currency of the Group. Further, the financial performance and financial position of the Group is exposed to foreign currency risk that arises on outstanding receivable and payable balances at a reporting year end date. Interest rate risk arises from variable rate borrowings that expose the company’s financial performance, financial position and cash flows to the movement in market rates of interest.
Foreign currency risk The Group operates internationally and is exposed to foreign exchange risk arising from foreign currency
transactions, primarily with respect to the US$ and EURO. The Group imports capital goods and raw materials and exports finished goods. The Group also pays interest,
legal and professional fees and travelling and conveyance in foreign currency. Foreign currency exposure
As at March 31, 2019
As at March 31, 2019
As at March 31, 2018
As at March 31, 2018
USD EURO USD EURORestated Restated
Financial AssetsTrade Receivables 222.76 22.64 198.59 16.06 Balance in Export Earning Foreign Currency account 1.33 - - - Exposure to foreign currency assets 224.09 22.64 198.59 16.06
Financial LiabilitiesBorrowings 23.70 45.00 61.27 - Buyers Credit 43.95 - 51.82 - Packing Credit 47.22 6.07 95.35 2.87 Working capital demand Loan 36.03 - - - Trade payables and other financial liabilities 169.87 0.84 75.69 3.40 Other Current financial liabilities - Derivative Instruments Interest rate swap
6.77 1.29 1.54 -
Trade Payable and other financial liabilities 0.39 0.02 6.09 - Exposure to foreign currency liabilities 327.93 53.22 291.76 6.27
Sensitivity - Foreign Currency The sensitivity of profit or loss to changes in the exchange rates is as follows:
Impact on profit before taxFor the year
ended on March 31, 2019
For the year ended on
March 31, 2018Restated
USD SensitivityINR/USD increase by 5%* (359.16) (303.10)INR/USD decrease by 5%* 359.16 303.10 EURO SensitivityINR/EURO increase by 5%* (95.15) 39.46 INR/EURO decrease by 5%* 95.15 (39.46)* Holding all other variables constant
NOTES TO THE CONSOLIDATED FINANCIAL STATEMENTS(All amounts in Rs. Lakhs, unless otherwise stated)
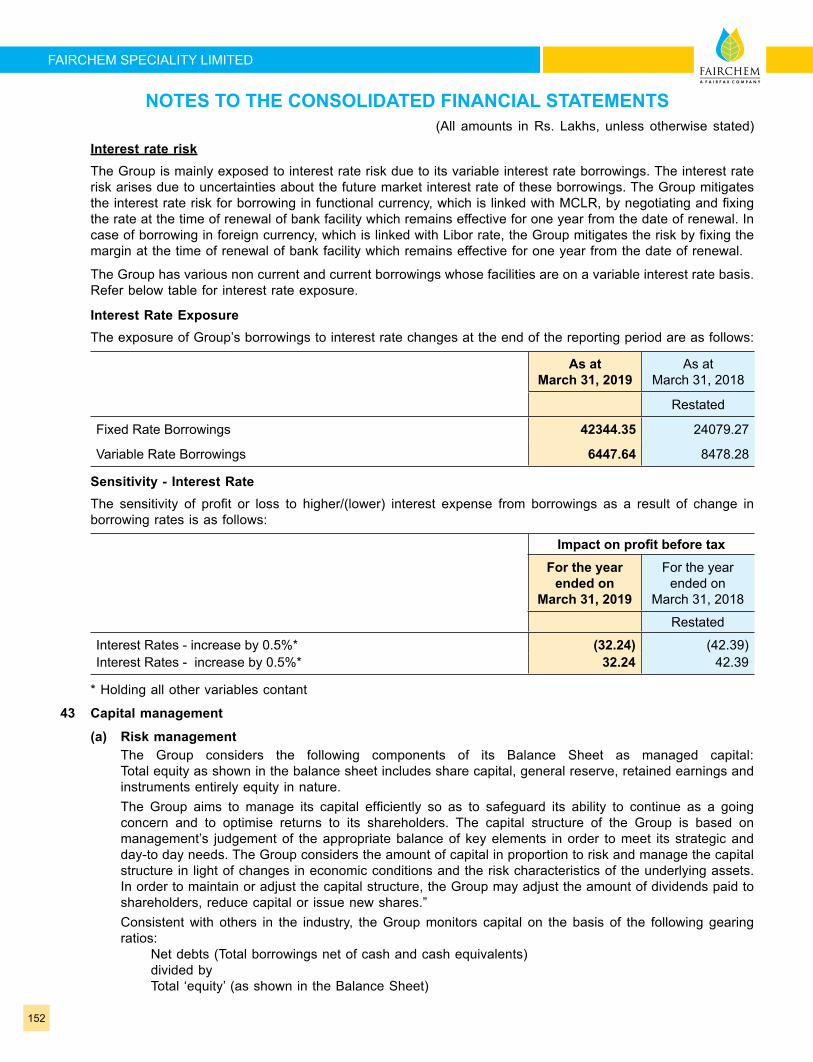
152
FAIRCHEM SPECIALITY LIMITED
Interest rate risk The Group is mainly exposed to interest rate risk due to its variable interest rate borrowings. The interest rate
risk arises due to uncertainties about the future market interest rate of these borrowings. The Group mitigates the interest rate risk for borrowing in functional currency, which is linked with MCLR, by negotiating and fixing the rate at the time of renewal of bank facility which remains effective for one year from the date of renewal. In case of borrowing in foreign currency, which is linked with Libor rate, the Group mitigates the risk by fixing the margin at the time of renewal of bank facility which remains effective for one year from the date of renewal.
The Group has various non current and current borrowings whose facilities are on a variable interest rate basis. Refer below table for interest rate exposure.
Interest Rate Exposure The exposure of Group’s borrowings to interest rate changes at the end of the reporting period are as follows:
As at March 31, 2019
As at March 31, 2018
Restated
Fixed Rate Borrowings 42344.35 24079.27
Variable Rate Borrowings 6447.64 8478.28
Sensitivity - Interest Rate The sensitivity of profit or loss to higher/(lower) interest expense from borrowings as a result of change in
borrowing rates is as follows:
Impact on profit before taxFor the year
ended on March 31, 2019
For the year ended on
March 31, 2018
Restated
Interest Rates - increase by 0.5%* (32.24) (42.39)Interest Rates - increase by 0.5%* 32.24 42.39
* Holding all other variables contant
43 Capital management
(a) Risk management The Group considers the following components of its Balance Sheet as managed capital:
Total equity as shown in the balance sheet includes share capital, general reserve, retained earnings and instruments entirely equity in nature.
The Group aims to manage its capital efficiently so as to safeguard its ability to continue as a going concern and to optimise returns to its shareholders. The capital structure of the Group is based on management’s judgement of the appropriate balance of key elements in order to meet its strategic and day-to day needs. The Group considers the amount of capital in proportion to risk and manage the capital structure in light of changes in economic conditions and the risk characteristics of the underlying assets. In order to maintain or adjust the capital structure, the Group may adjust the amount of dividends paid to shareholders, reduce capital or issue new shares.”
Consistent with others in the industry, the Group monitors capital on the basis of the following gearing ratios:
Net debts (Total borrowings net of cash and cash equivalents) divided by Total ‘equity’ (as shown in the Balance Sheet)
NOTES TO THE CONSOLIDATED FINANCIAL STATEMENTS(All amounts in Rs. Lakhs, unless otherwise stated)
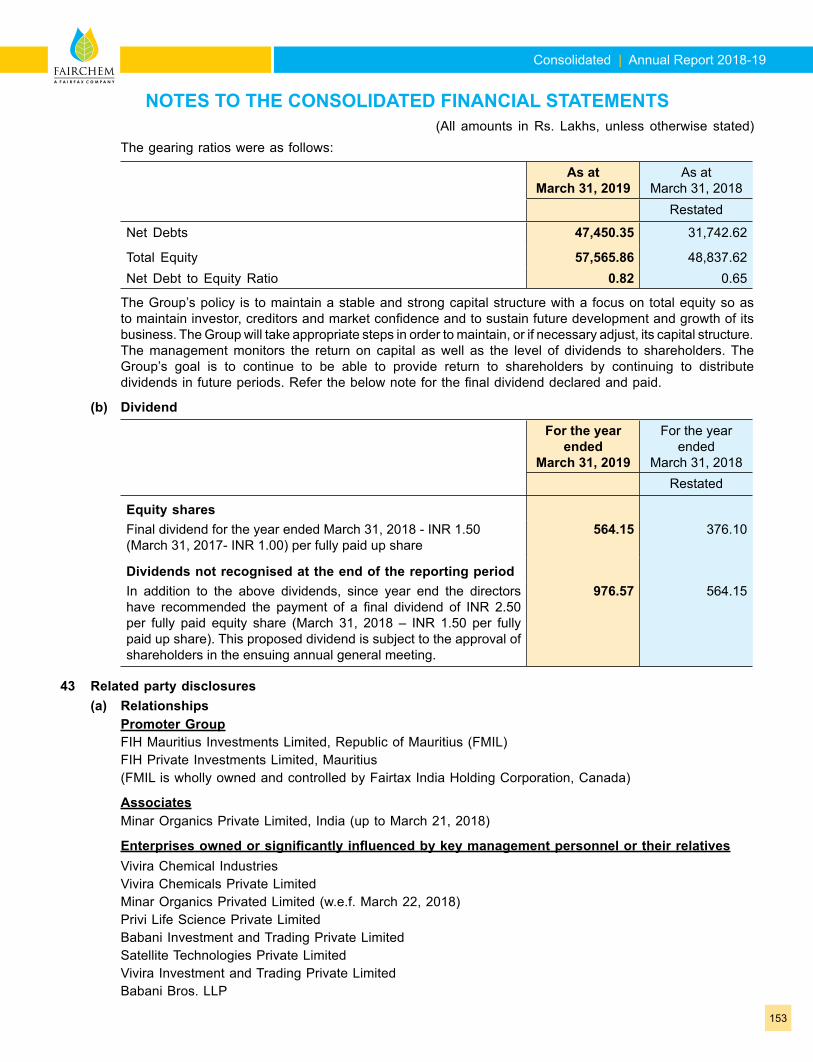
Consolidated | Annual Report 2018-19
153
The gearing ratios were as follows:
As at March 31, 2019
As at March 31, 2018
Restated
Net Debts 47,450.35 31,742.62
Total Equity 57,565.86 48,837.62 Net Debt to Equity Ratio 0.82 0.65
The Group’s policy is to maintain a stable and strong capital structure with a focus on total equity so as to maintain investor, creditors and market confidence and to sustain future development and growth of its business. The Group will take appropriate steps in order to maintain, or if necessary adjust, its capital structure. The management monitors the return on capital as well as the level of dividends to shareholders. The Group’s goal is to continue to be able to provide return to shareholders by continuing to distribute dividends in future periods. Refer the below note for the final dividend declared and paid.
(b) Dividend
For the year ended
March 31, 2019
For the year ended
March 31, 2018Restated
Equity sharesFinal dividend for the year ended March 31, 2018 - INR 1.50 (March 31, 2017- INR 1.00) per fully paid up share
564.15 376.10
Dividends not recognised at the end of the reporting periodIn addition to the above dividends, since year end the directors have recommended the payment of a final dividend of INR 2.50 per fully paid equity share (March 31, 2018 – INR 1.50 per fully paid up share). This proposed dividend is subject to the approval of shareholders in the ensuing annual general meeting.
976.57 564.15
43 Related party disclosures (a) Relationships Promoter Group FIH Mauritius Investments Limited, Republic of Mauritius (FMIL) FIH Private Investments Limited, Mauritius (FMIL is wholly owned and controlled by Fairtax India Holding Corporation, Canada)
Associates Minar Organics Private Limited, India (up to March 21, 2018)
Enterprises owned or significantly influenced by key management personnel or their relatives Vivira Chemical Industries Vivira Chemicals Private Limited Minar Organics Privated Limited (w.e.f. March 22, 2018) Privi Life Science Private Limited Babani Investment and Trading Private Limited Satellite Technologies Private Limited Vivira Investment and Trading Private Limited Babani Bros. LLP
NOTES TO THE CONSOLIDATED FINANCIAL STATEMENTS(All amounts in Rs. Lakhs, unless otherwise stated)
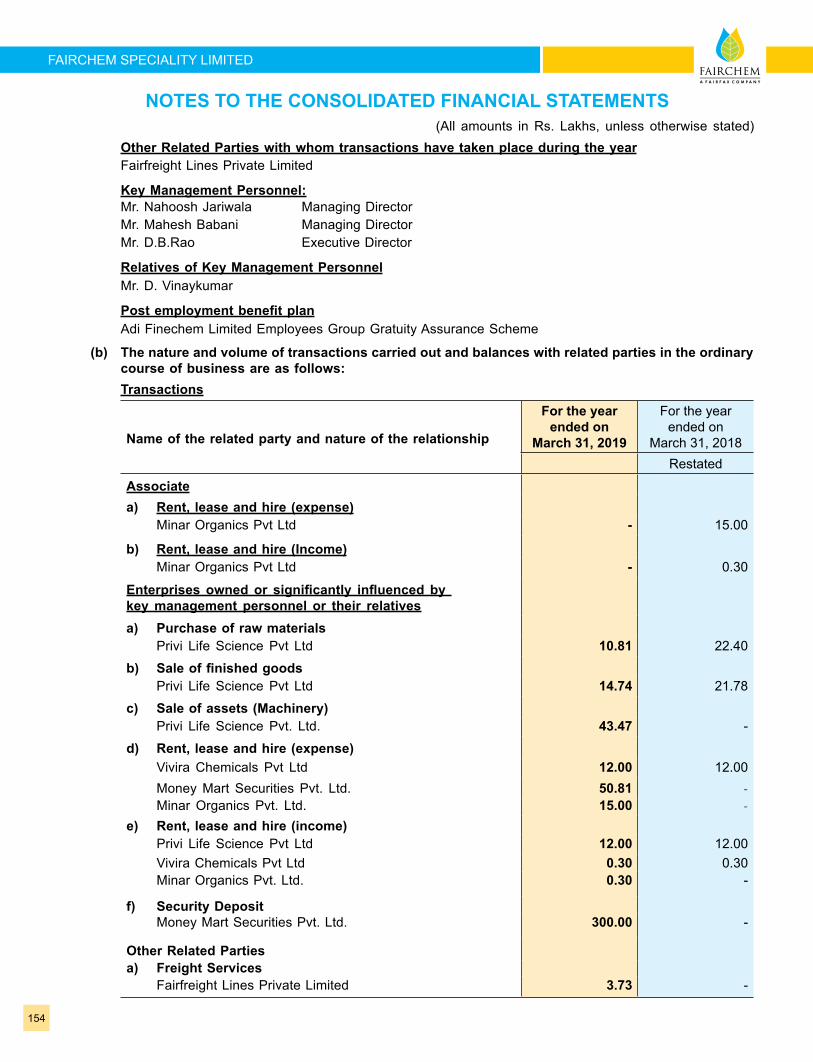
154
FAIRCHEM SPECIALITY LIMITED
Other Related Parties with whom transactions have taken place during the year Fairfreight Lines Private Limited
Key Management Personnel: Mr. Nahoosh Jariwala Managing Director Mr. Mahesh Babani Managing Director Mr. D.B.Rao Executive Director
Relatives of Key Management Personnel Mr. D. Vinaykumar
Post employment benefit plan Adi Finechem Limited Employees Group Gratuity Assurance Scheme
(b) The nature and volume of transactions carried out and balances with related parties in the ordinary course of business are as follows:
Transactions
Name of the related party and nature of the relationship
For the year ended on
March 31, 2019
For the year ended on
March 31, 2018Restated
Associatea) Rent, lease and hire (expense) Minar Organics Pvt Ltd - 15.00
b) Rent, lease and hire (Income) Minar Organics Pvt Ltd - 0.30
Enterprises owned or significantly influenced by key management personnel or their relativesa) Purchase of raw materials Privi Life Science Pvt Ltd 10.81 22.40
b) Sale of finished goods Privi Life Science Pvt Ltd 14.74 21.78
c) Sale of assets (Machinery) Privi Life Science Pvt. Ltd. 43.47 -
d) Rent, lease and hire (expense) Vivira Chemicals Pvt Ltd 12.00 12.00
Money Mart Securities Pvt. Ltd. 50.81 - Minar Organics Pvt. Ltd. 15.00 -e) Rent, lease and hire (income) Privi Life Science Pvt Ltd 12.00 12.00 Vivira Chemicals Pvt Ltd 0.30 0.30 Minar Organics Pvt. Ltd. 0.30 -
f) Security Deposit Money Mart Securities Pvt. Ltd. 300.00 -
Other Related Partiesa) Freight Services Fairfreight Lines Private Limited 3.73 -
NOTES TO THE CONSOLIDATED FINANCIAL STATEMENTS(All amounts in Rs. Lakhs, unless otherwise stated)
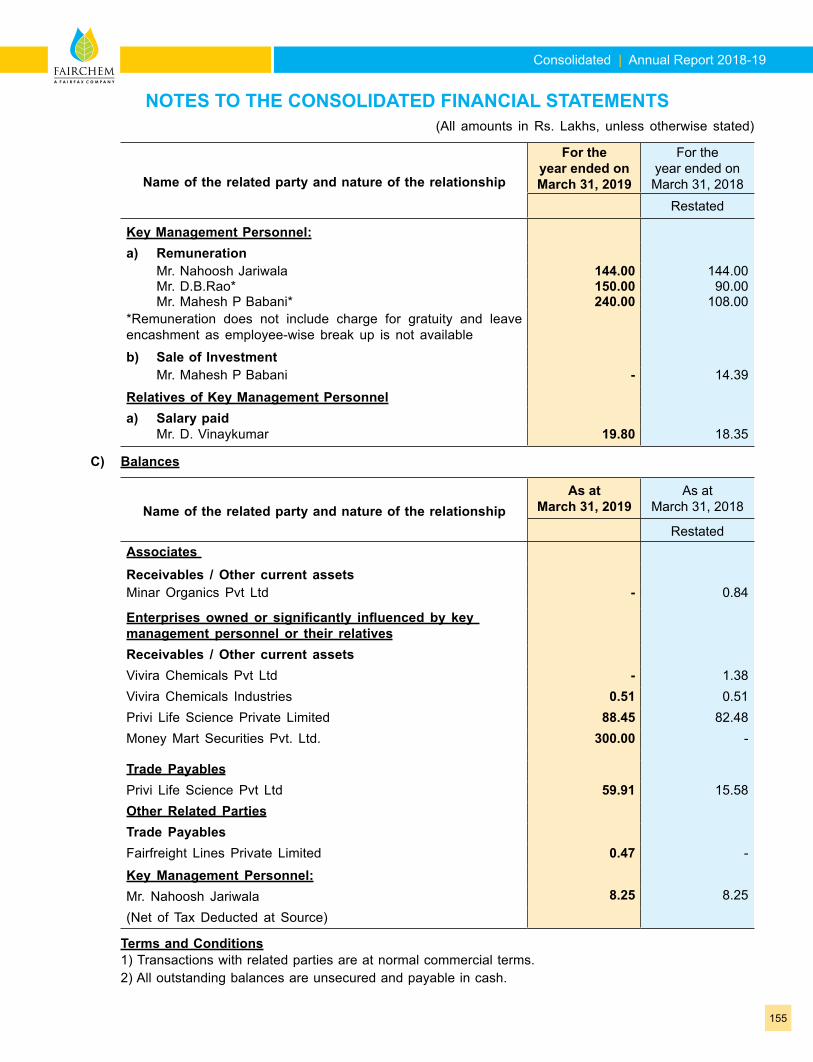
Consolidated | Annual Report 2018-19
155
Name of the related party and nature of the relationship
For the year ended on March 31, 2019
For the year ended on March 31, 2018
Restated
Key Management Personnel:a) Remuneration Mr. Nahoosh Jariwala 144.00 144.00 Mr. D.B.Rao* 150.00 90.00 Mr. Mahesh P Babani* 240.00 108.00*Remuneration does not include charge for gratuity and leave encashment as employee-wise break up is not available
b) Sale of Investment Mr. Mahesh P Babani - 14.39
Relatives of Key Management Personnela) Salary paid Mr. D. Vinaykumar 19.80 18.35
C) Balances
Name of the related party and nature of the relationshipAs at
March 31, 2019As at
March 31, 2018
RestatedAssociates Receivables / Other current assetsMinar Organics Pvt Ltd - 0.84
Enterprises owned or significantly influenced by key management personnel or their relativesReceivables / Other current assetsVivira Chemicals Pvt Ltd - 1.38Vivira Chemicals Industries 0.51 0.51Privi Life Science Private Limited 88.45 82.48Money Mart Securities Pvt. Ltd. 300.00 -
Trade PayablesPrivi Life Science Pvt Ltd 59.91 15.58Other Related PartiesTrade PayablesFairfreight Lines Private Limited 0.47 -
Key Management Personnel:Mr. Nahoosh Jariwala 8.25 8.25
(Net of Tax Deducted at Source)
Terms and Conditions 1) Transactions with related parties are at normal commercial terms. 2) All outstanding balances are unsecured and payable in cash.
NOTES TO THE CONSOLIDATED FINANCIAL STATEMENTS(All amounts in Rs. Lakhs, unless otherwise stated)
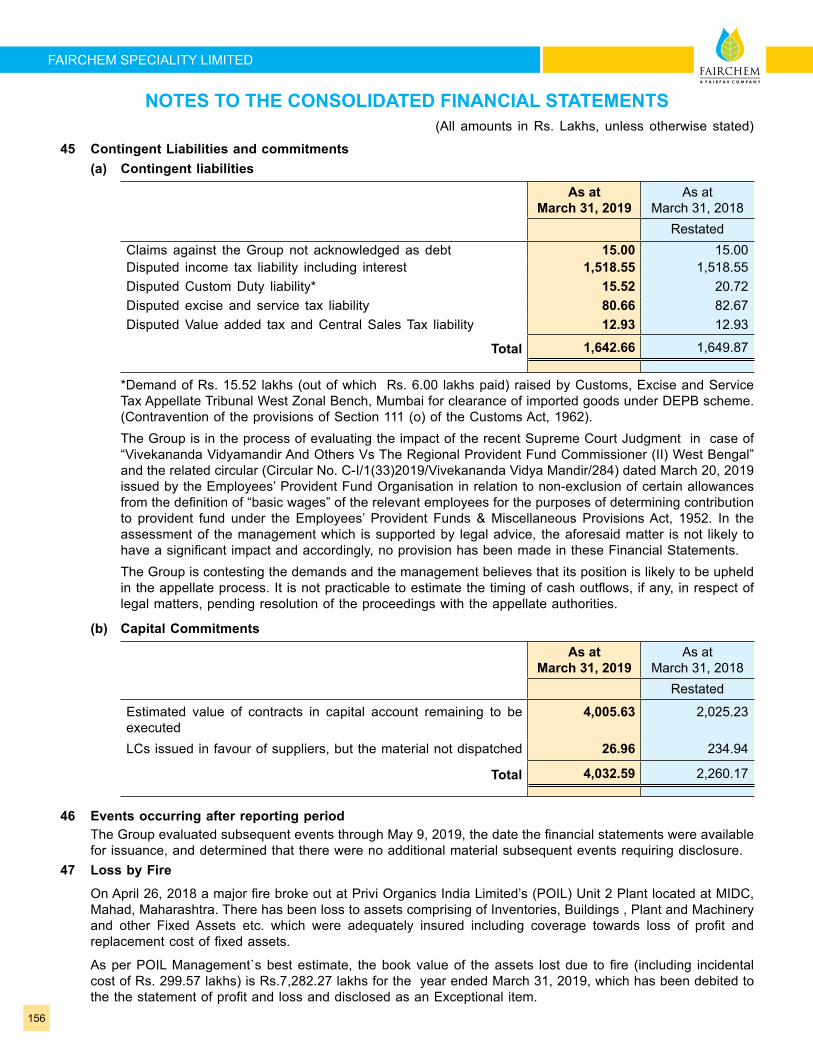
156
FAIRCHEM SPECIALITY LIMITED
45 Contingent Liabilities and commitments (a) Contingent liabilities
As at March 31, 2019
As at March 31, 2018
RestatedClaims against the Group not acknowledged as debt 15.00 15.00 Disputed income tax liability including interest 1,518.55 1,518.55 Disputed Custom Duty liability* 15.52 20.72 Disputed excise and service tax liability 80.66 82.67 Disputed Value added tax and Central Sales Tax liability 12.93 12.93
Total 1,642.66 1,649.87
*Demand of Rs. 15.52 lakhs (out of which Rs. 6.00 lakhs paid) raised by Customs, Excise and Service Tax Appellate Tribunal West Zonal Bench, Mumbai for clearance of imported goods under DEPB scheme. (Contravention of the provisions of Section 111 (o) of the Customs Act, 1962).
The Group is in the process of evaluating the impact of the recent Supreme Court Judgment in case of “Vivekananda Vidyamandir And Others Vs The Regional Provident Fund Commissioner (II) West Bengal” and the related circular (Circular No. C-I/1(33)2019/Vivekananda Vidya Mandir/284) dated March 20, 2019 issued by the Employees’ Provident Fund Organisation in relation to non-exclusion of certain allowances from the definition of “basic wages” of the relevant employees for the purposes of determining contribution to provident fund under the Employees’ Provident Funds & Miscellaneous Provisions Act, 1952. In the assessment of the management which is supported by legal advice, the aforesaid matter is not likely to have a significant impact and accordingly, no provision has been made in these Financial Statements.
The Group is contesting the demands and the management believes that its position is likely to be upheld in the appellate process. It is not practicable to estimate the timing of cash outflows, if any, in respect of legal matters, pending resolution of the proceedings with the appellate authorities.
(b) Capital Commitments
As at March 31, 2019
As at March 31, 2018
Restated
Estimated value of contracts in capital account remaining to be executed
4,005.63 2,025.23
LCs issued in favour of suppliers, but the material not dispatched 26.96 234.94
Total 4,032.59 2,260.17
46 Events occurring after reporting period The Group evaluated subsequent events through May 9, 2019, the date the financial statements were available
for issuance, and determined that there were no additional material subsequent events requiring disclosure.47 Loss by Fire
On April 26, 2018 a major fire broke out at Privi Organics India Limited’s (POIL) Unit 2 Plant located at MIDC, Mahad, Maharashtra. There has been loss to assets comprising of Inventories, Buildings , Plant and Machinery and other Fixed Assets etc. which were adequately insured including coverage towards loss of profit and replacement cost of fixed assets.
As per POIL Management`s best estimate, the book value of the assets lost due to fire (including incidental cost of Rs. 299.57 lakhs) is Rs.7,282.27 lakhs for the year ended March 31, 2019, which has been debited to the the statement of profit and loss and disclosed as an Exceptional item.
NOTES TO THE CONSOLIDATED FINANCIAL STATEMENTS(All amounts in Rs. Lakhs, unless otherwise stated)
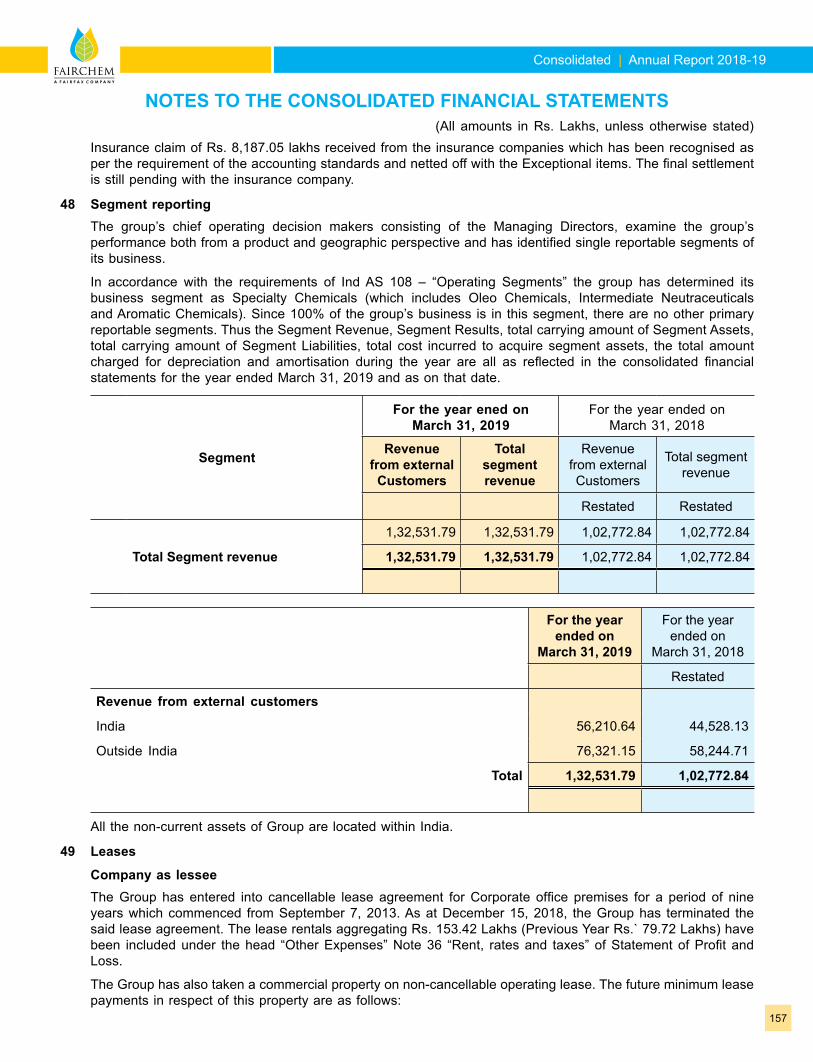
Consolidated | Annual Report 2018-19
157
Insurance claim of Rs. 8,187.05 lakhs received from the insurance companies which has been recognised as per the requirement of the accounting standards and netted off with the Exceptional items. The final settlement is still pending with the insurance company.
48 Segment reporting The group’s chief operating decision makers consisting of the Managing Directors, examine the group’s
performance both from a product and geographic perspective and has identified single reportable segments of its business.
In accordance with the requirements of Ind AS 108 – “Operating Segments” the group has determined its business segment as Specialty Chemicals (which includes Oleo Chemicals, Intermediate Neutraceuticals and Aromatic Chemicals). Since 100% of the group’s business is in this segment, there are no other primary reportable segments. Thus the Segment Revenue, Segment Results, total carrying amount of Segment Assets, total carrying amount of Segment Liabilities, total cost incurred to acquire segment assets, the total amount charged for depreciation and amortisation during the year are all as reflected in the consolidated financial statements for the year ended March 31, 2019 and as on that date.
Segment
For the year ened on March 31, 2019
For the year ended on March 31, 2018
Revenue from external Customers
Total segment revenue
Revenue from external Customers
Total segment revenue
Restated Restated
1,32,531.79 1,32,531.79 1,02,772.84 1,02,772.84
Total Segment revenue 1,32,531.79 1,32,531.79 1,02,772.84 1,02,772.84
For the year ended on
March 31, 2019
For the year ended on
March 31, 2018
Restated
Revenue from external customers
India 56,210.64 44,528.13
Outside India 76,321.15 58,244.71
Total 1,32,531.79 1,02,772.84
All the non-current assets of Group are located within India.
49 Leases
Company as lessee The Group has entered into cancellable lease agreement for Corporate office premises for a period of nine
years which commenced from September 7, 2013. As at December 15, 2018, the Group has terminated the said lease agreement. The lease rentals aggregating Rs. 153.42 Lakhs (Previous Year Rs.` 79.72 Lakhs) have been included under the head “Other Expenses” Note 36 “Rent, rates and taxes” of Statement of Profit and Loss.
The Group has also taken a commercial property on non-cancellable operating lease. The future minimum lease payments in respect of this property are as follows:
NOTES TO THE CONSOLIDATED FINANCIAL STATEMENTS(All amounts in Rs. Lakhs, unless otherwise stated)
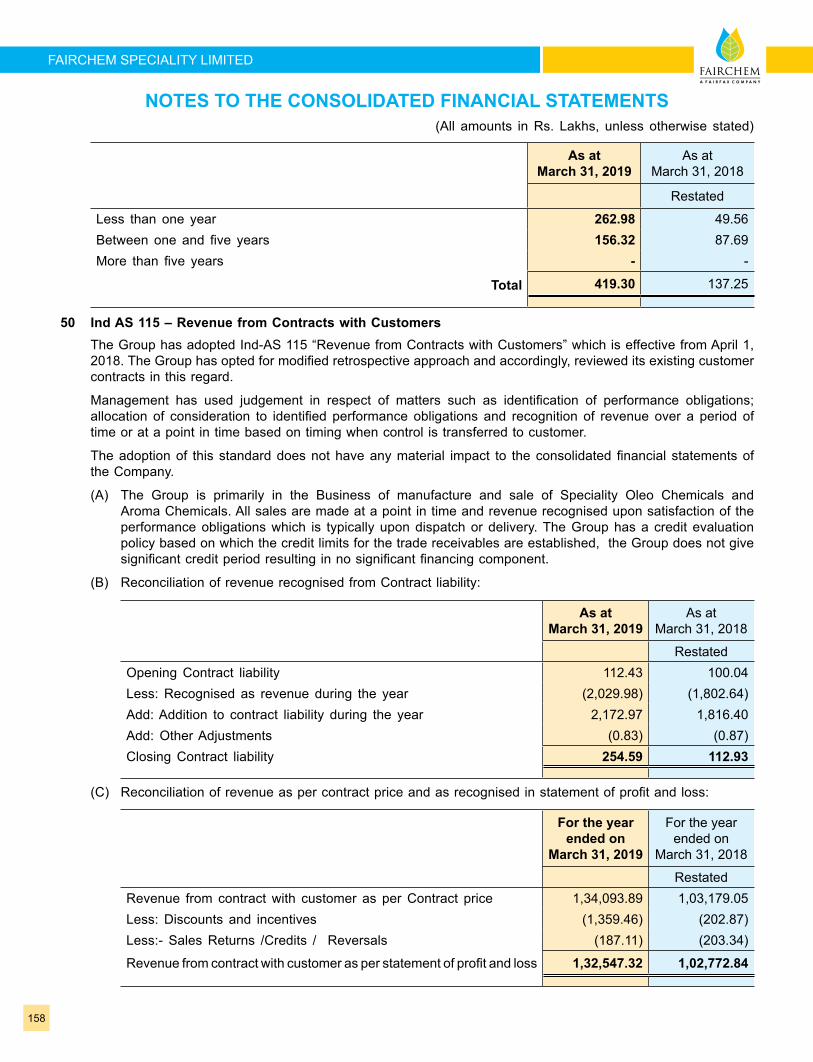
158
FAIRCHEM SPECIALITY LIMITED
As at March 31, 2019
As at March 31, 2018
Restated
Less than one year 262.98 49.56 Between one and five years 156.32 87.69 More than five years - -
Total 419.30 137.25
50 Ind AS 115 – Revenue from Contracts with Customers The Group has adopted Ind-AS 115 “Revenue from Contracts with Customers” which is effective from April 1,
2018. The Group has opted for modified retrospective approach and accordingly, reviewed its existing customer contracts in this regard.
Management has used judgement in respect of matters such as identification of performance obligations; allocation of consideration to identified performance obligations and recognition of revenue over a period of time or at a point in time based on timing when control is transferred to customer.
The adoption of this standard does not have any material impact to the consolidated financial statements of the Company.
(A) The Group is primarily in the Business of manufacture and sale of Speciality Oleo Chemicals and Aroma Chemicals. All sales are made at a point in time and revenue recognised upon satisfaction of the performance obligations which is typically upon dispatch or delivery. The Group has a credit evaluation policy based on which the credit limits for the trade receivables are established, the Group does not give significant credit period resulting in no significant financing component.
(B) Reconciliation of revenue recognised from Contract liability:
As at March 31, 2019
As at March 31, 2018
RestatedOpening Contract liability 112.43 100.04 Less: Recognised as revenue during the year (2,029.98) (1,802.64)Add: Addition to contract liability during the year 2,172.97 1,816.40 Add: Other Adjustments (0.83) (0.87)Closing Contract liability 254.59 112.93
(C) Reconciliation of revenue as per contract price and as recognised in statement of profit and loss:
For the year ended on
March 31, 2019
For the year ended on
March 31, 2018
RestatedRevenue from contract with customer as per Contract price 1,34,093.89 1,03,179.05 Less: Discounts and incentives (1,359.46) (202.87)Less:- Sales Returns /Credits / Reversals (187.11) (203.34)
Revenue from contract with customer as per statement of profit and loss 1,32,547.32 1,02,772.84
NOTES TO THE CONSOLIDATED FINANCIAL STATEMENTS(All amounts in Rs. Lakhs, unless otherwise stated)
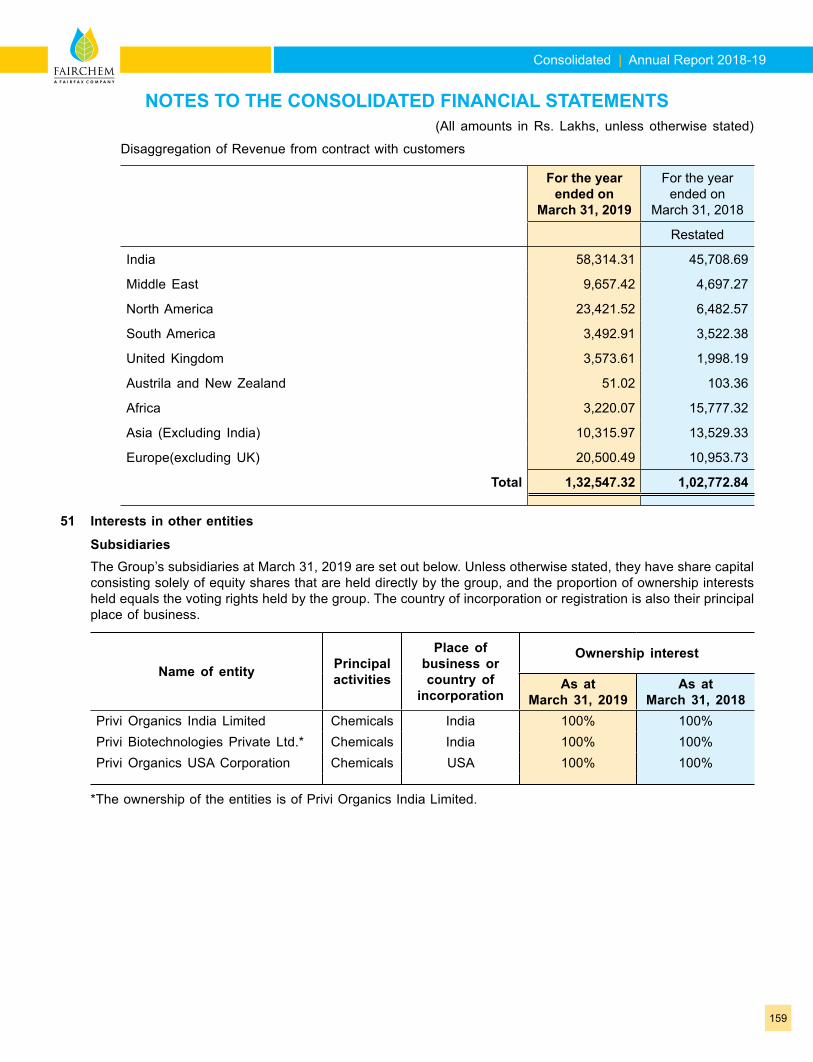
Consolidated | Annual Report 2018-19
159
Disaggregation of Revenue from contract with customers
For the year ended on
March 31, 2019
For the year ended on
March 31, 2018
Restated
India 58,314.31 45,708.69
Middle East 9,657.42 4,697.27
North America 23,421.52 6,482.57
South America 3,492.91 3,522.38
United Kingdom 3,573.61 1,998.19
Austrila and New Zealand 51.02 103.36
Africa 3,220.07 15,777.32
Asia (Excluding India) 10,315.97 13,529.33
Europe(excluding UK) 20,500.49 10,953.73
Total 1,32,547.32 1,02,772.84
51 Interests in other entities
Subsidiaries The Group’s subsidiaries at March 31, 2019 are set out below. Unless otherwise stated, they have share capital
consisting solely of equity shares that are held directly by the group, and the proportion of ownership interests held equals the voting rights held by the group. The country of incorporation or registration is also their principal place of business.
Name of entity Principalactivities
Place ofbusiness or country of
incorporation
Ownership interest
As at March 31, 2019
As at March 31, 2018
Privi Organics India Limited Chemicals India 100% 100%Privi Biotechnologies Private Ltd.* Chemicals India 100% 100%Privi Organics USA Corporation Chemicals USA 100% 100%
*The ownership of the entities is of Privi Organics India Limited.
NOTES TO THE CONSOLIDATED FINANCIAL STATEMENTS(All amounts in Rs. Lakhs, unless otherwise stated)
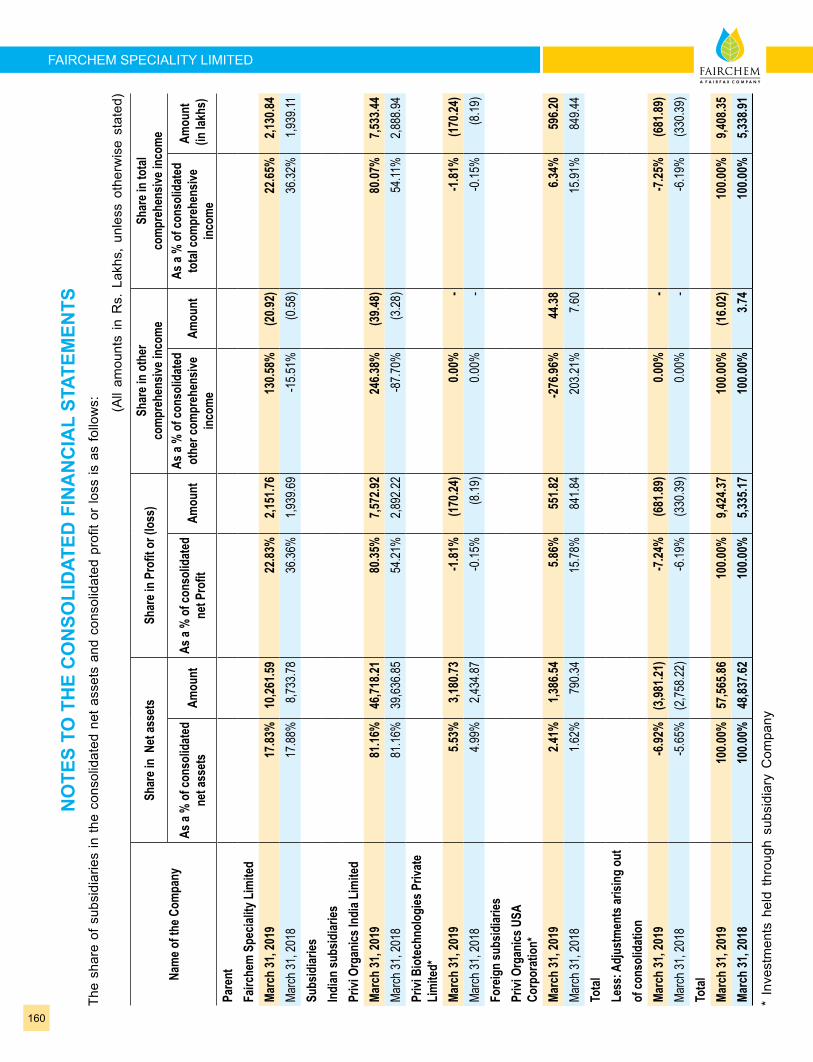
160
FAIRCHEM SPECIALITY LIMITED
Nam
e of t
he C
ompa
ny
Shar
e in
Net
asse
tsSh
are i
n Pr
ofit o
r (lo
ss)
Shar
e in
othe
r co
mpr
ehen
sive i
ncom
eSh
are i
n to
tal
com
preh
ensiv
e inc
ome
As a
% o
f con
solid
ated
ne
t ass
ets
Amou
ntAs
a %
of c
onso
lidat
ed
net P
rofit
Amou
ntAs
a %
of c
onso
lidat
ed
othe
r com
preh
ensiv
e in
com
eAm
ount
As a
% o
f con
solid
ated
to
tal c
ompr
ehen
sive
inco
me
Amou
nt (i
n lak
hs)
Pare
ntFa
irche
m S
pecia
lity L
imite
dMa
rch
31, 2
019
17.83
% 10
,261.5
9 22
.83%
2,15
1.76
130.5
8% (2
0.92)
22.65
% 2,
130.8
4 M
arch
31,
201
817
.88%
8,7
33.7
8 36
.36%
1,9
39.6
9 -1
5.51
% (0
.58)
36.3
2% 1
,939
.11
Subs
idiar
iesIn
dian
subs
idiar
iesPr
ivi O
rgan
ics In
dia L
imite
dMa
rch
31, 2
019
81.16
% 46
,718.2
1 80
.35%
7,57
2.92
246.3
8% (3
9.48)
80.07
% 7,
533.4
4 M
arch
31,
201
881
.16%
39,
636.
85
54.2
1% 2
,892
.22
-87.
70%
(3.2
8)54
.11%
2,8
88.9
4 Pr
ivi B
iote
chno
logi
es P
rivat
e Li
mite
d*Ma
rch
31, 2
019
5.53%
3,18
0.73
-1.81
% (1
70.24
)0.0
0% -
-1.81
% (1
70.24
)M
arch
31,
201
84.
99%
2,4
34.8
7 -0
.15%
(8.1
9)0.
00%
- -0
.15%
(8.1
9)Fo
reig
n su
bsid
iaries
Privi
Org
anics
USA
Co
rpor
atio
n*Ma
rch
31, 2
019
2.41%
1,38
6.54
5.86%
551.8
2 -2
76.96
% 44
.38
6.34%
596.2
0 M
arch
31,
201
81.
62%
790
.34
15.7
8% 8
41.8
4 20
3.21
% 7
.60
15.9
1% 8
49.4
4 To
tal
Less
: Adj
ustm
ents
arisi
ng o
utof
cons
olid
atio
nMa
rch
31, 2
019
-6.92
% (3
,981.2
1)-7
.24%
(681
.89)
0.00%
- -7
.25%
(681
.89)
Mar
ch 3
1, 2
018
-5.6
5% (2
,758
.22)
-6.1
9% (3
30.3
9)0.
00%
- -6
.19%
(330
.39)
Tota
lMa
rch
31, 2
019
100.0
0% 57
,565.8
6 10
0.00%
9,42
4.37
100.0
0% (1
6.02)
100.0
0% 9,
408.3
5 Ma
rch
31, 2
018
100.0
0% 48
,837.6
2 10
0.00%
5,33
5.17
100.0
0% 3.
74
100.0
0% 5,
338.9
1
* In
vest
men
ts h
eld
thro
ugh
subs
idia
ry C
ompa
ny
NO
TES
TO T
HE
CO
NSO
LID
ATED
FIN
AN
CIA
L ST
ATEM
ENTS
The
shar
e of
sub
sidi
arie
s in
the
cons
olid
ated
net
ass
ets
and
cons
olid
ated
pro
fit o
r lo
ss is
as
follo
ws: (A
ll am
ount
s in
Rs.
Lak
hs,
unle
ss o
ther
wis
e st
ated
)
Consolidated | Annual Report 2018-19
161
52 Transfer Pricing Transactions with related parties are governed by transfer pricing regulations of the Indian Income-tax Act,
1961. The Subsidiary Company’s international and domestic transactions with related parties are at arm’s length as per the independent accountants report for the year ended March 31, 2018. The Subsidiary’s management believes that the Company’s international and domestic transactions with related parties post March 2018 continue to be at arm’s length and that the transfer pricing legislation will not have any impact on the financial statements, particularly on the amount of tax expense and that of provision for taxation.
The accompanying notes are an integral part of the consolidated financial statements.
As per our report of even date attachedFor Price Waterhouse & Co Chartered Accountants LLP For and on behalf of the BoardChartered AccountantsFirm Registration No.: 304026E/ E-300009
Priyanshu Gundana Nahoosh Jariwala Mahesh BabaniPartner Managing Director Managing DirectorMembership No. 109553 DIN: 00012412 DIN: 00051162
Rajen N. Jhaveri Chief Financial Officer & Company Secretary
Place : Mumbai Place : MumbaiDate : May 09, 2019 Date : May 09, 2019
NOTES TO THE CONSOLIDATED FINANCIAL STATEMENTS(All amounts in Rs. Lakhs, unless otherwise stated)
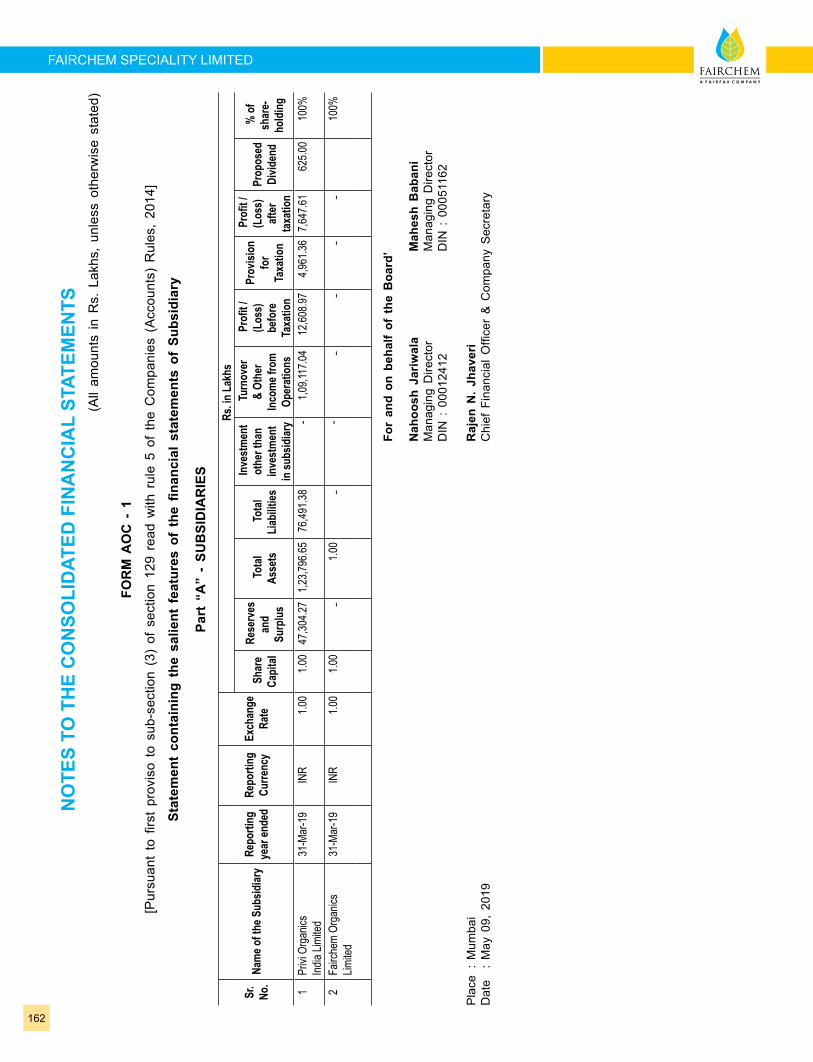
162
FAIRCHEM SPECIALITY LIMITED
FOR
M A
OC
- 1
[Pur
suan
t to
firs
t pr
ovis
o to
sub
-sec
tion
(3)
of s
ectio
n 12
9 re
ad w
ith r
ule
5 of
the
Com
pani
es (
Acc
ount
s) R
ules
, 20
14]
Stat
emen
t co
ntai
ning
the
sal
ient
fea
ture
s of
the
fina
ncia
l st
atem
ents
of
Subs
idia
ry
Part
“A
” -
SUB
SID
IAR
IES
Sr.
No.
Nam
e of t
he S
ubsid
iary
Repo
rting
ye
ar en
ded
Repo
rting
Cu
rrenc
yEx
chan
ge
Rate
Rs. in
Lak
hs
Sha
re
Capi
tal
Res
erve
s an
d Su
rplu
s
Tota
l As
sets
To
tal
Liab
ilities
Inve
stm
ent
othe
r tha
n in
vest
men
t in
subs
idiar
y
Turn
over
&
Othe
r In
com
e fro
m
Oper
atio
ns
Pro
fit /
(Los
s)
befo
re
Taxa
tion
Prov
ision
fo
r Ta
xatio
n
Pro
fit /
(Los
s)
afte
r ta
xatio
n
Prop
osed
Di
viden
d
% o
f sh
are-
hold
ing
1Pr
ivi O
rgan
ics
India
Lim
ited
31-M
ar-1
9IN
R
1.0
0
1.0
0 47
,304
.27
1,23
,796
.65
76,4
91.3
8-
1,09
,117.
0412
,608
.97
4,96
1.36
7,64
7.61
625.
0010
0%
2Fa
irche
m O
rgan
ics
Limite
d31
-Mar
-19
INR
1
.00
1
.00
-
1.0
0-
--
--
-10
0%
Fo
r an
d on
beh
alf
of t
he B
oard
’
N
ahoo
sh J
ariw
ala
Mah
esh
Bab
ani
M
anag
ing
Dire
ctor
M
anag
ing
Dire
ctor
D
IN :
000
1241
2 D
IN :
000
5116
2
Pla
ce :
Mum
bai
Raj
en N
. Jh
aver
iD
ate
: M
ay 0
9, 2
019
Chi
ef F
inan
cial
Offi
cer
& C
ompa
ny S
ecre
tary
NO
TES
TO T
HE
CO
NSO
LID
ATED
FIN
AN
CIA
L ST
ATEM
ENTS
(All
amou
nts
in R
s. L
akhs
, un
less
oth
erw
ise
stat
ed)

Consolidated | Annual Report 2018-19
163
This page is intentionally kept blank.
FOR
M A
OC
- 1
[Pur
suan
t to
firs
t pr
ovis
o to
sub
-sec
tion
(3)
of s
ectio
n 12
9 re
ad w
ith r
ule
5 of
the
Com
pani
es (
Acc
ount
s) R
ules
, 20
14]
Stat
emen
t co
ntai
ning
the
sal
ient
fea
ture
s of
the
fina
ncia
l st
atem
ents
of
Subs
idia
ry
Part
“A
” -
SUB
SID
IAR
IES
Sr.
No.
Nam
e of t
he S
ubsid
iary
Repo
rting
ye
ar en
ded
Repo
rting
Cu
rrenc
yEx
chan
ge
Rate
Rs. in
Lak
hs
Sha
re
Capi
tal
Res
erve
s an
d Su
rplu
s
Tota
l As
sets
To
tal
Liab
ilities
Inve
stm
ent
othe
r tha
n in
vest
men
t in
subs
idiar
y
Turn
over
&
Othe
r In
com
e fro
m
Oper
atio
ns
Pro
fit /
(Los
s)
befo
re
Taxa
tion
Prov
ision
fo
r Ta
xatio
n
Pro
fit /
(Los
s)
afte
r ta
xatio
n
Prop
osed
Di
viden
d
% o
f sh
are-
hold
ing
1Pr
ivi O
rgan
ics
India
Lim
ited
31-M
ar-1
9IN
R
1.0
0
1.0
0 47
,304
.27
1,23
,796
.65
76,4
91.3
8-
1,09
,117.
0412
,608
.97
4,96
1.36
7,64
7.61
625.
0010
0%
2Fa
irche
m O
rgan
ics
Limite
d31
-Mar
-19
INR
1
.00
1
.00
-
1.0
0-
--
--
-10
0%
Fo
r an
d on
beh
alf
of t
he B
oard
’
N
ahoo
sh J
ariw
ala
Mah
esh
Bab
ani
M
anag
ing
Dire
ctor
M
anag
ing
Dire
ctor
D
IN :
000
1241
2 D
IN :
000
5116
2
Pla
ce :
Mum
bai
Raj
en N
. Jh
aver
iD
ate
: M
ay 0
9, 2
019
Chi
ef F
inan
cial
Offi
cer
& C
ompa
ny S
ecre
tary

164
FAIRCHEM SPECIALITY LIMITED
This page is intentionally kept blank.